
| 2024-03-31 | 2023-12-31 | 2023-09-30 | 2023-06-30 | 2023-03-31 | 2022-12-31 | 2022-09-30 | 2022-06-30 | 2022-03-31 | 2021-12-31 | 2021-09-30 | 2021-06-30 | 2021-03-31 | 2020-12-31 | 2020-09-30 | 2020-06-30 | 2020-03-31 | 2019-12-31 | 2019-09-30 | 2019-06-30 | 2019-03-31 | 2018-12-31 | 2018-09-30 | 2018-06-30 | 2018-03-31 | ||
|---|---|---|---|---|---|---|---|---|---|---|---|---|---|---|---|---|---|---|---|---|---|---|---|---|---|---|
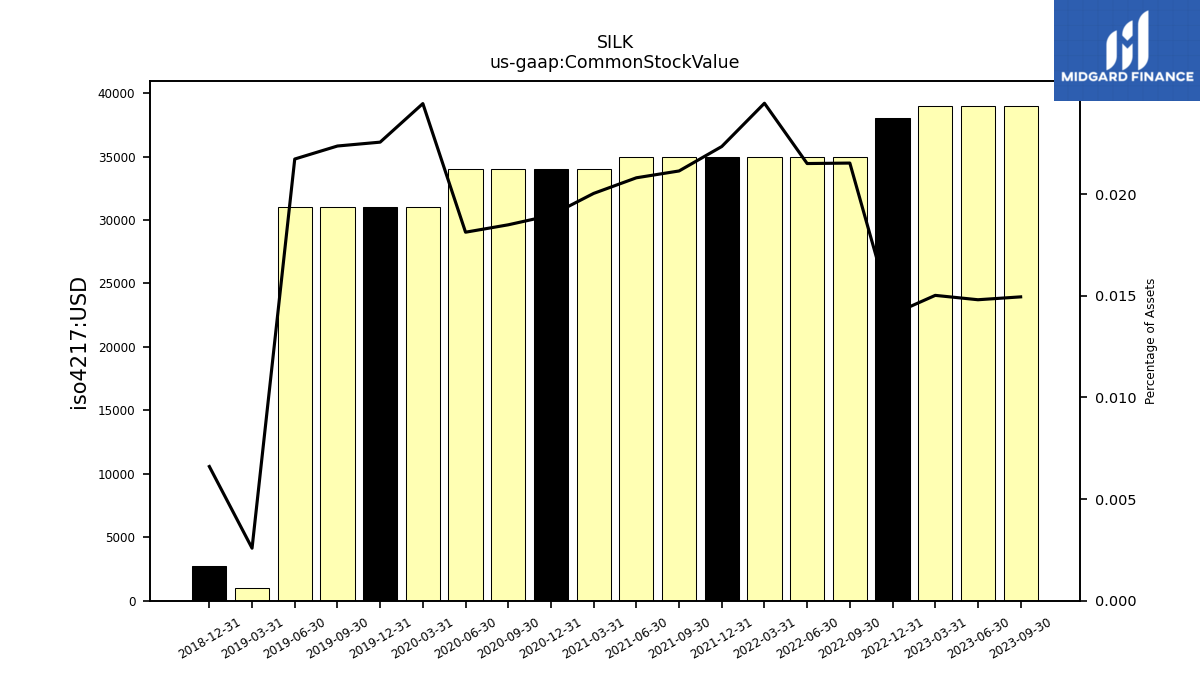
| Common Stock Value | 0.04 | 0.04 | 0.04 | 0.04 | 0.04 | 0.04 | 0.04 | 0.04 | 0.04 | 0.04 | 0.04 | 0.04 | 0.03 | 0.03 | 0.03 | 0.03 | 0.03 | 0.03 | 0.03 | 0.03 | 0.00 | 0.00 | NA | NA | NA | |
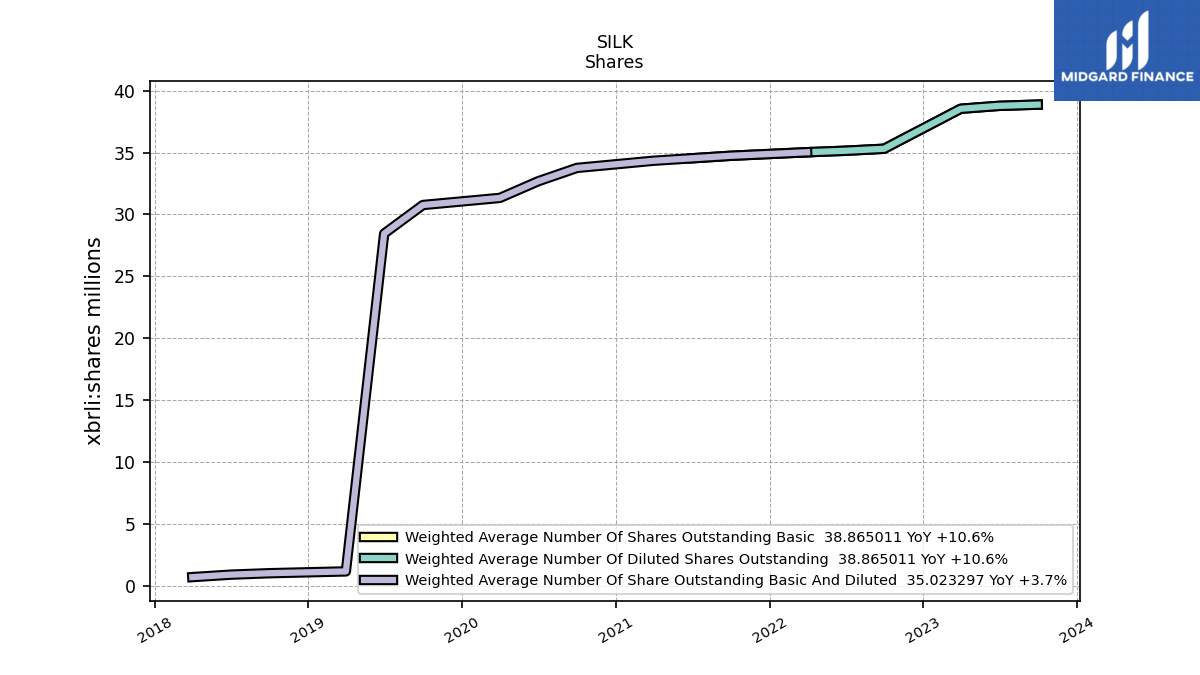
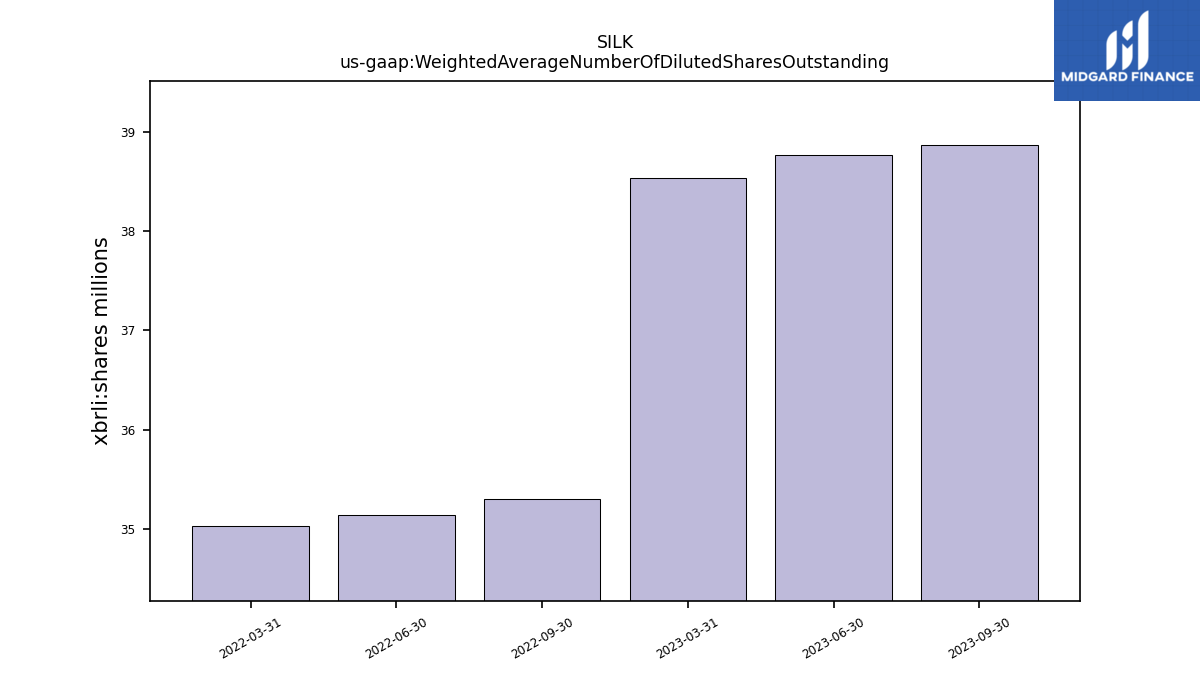
| Weighted Average Number Of Diluted Shares Outstanding | 39.26 | NA | 38.87 | 38.77 | 38.53 | NA | 35.30 | 35.14 | 35.02 | NA | NA | NA | NA | NA | NA | NA | NA | NA | NA | NA | NA | NA | NA | NA | NA | |
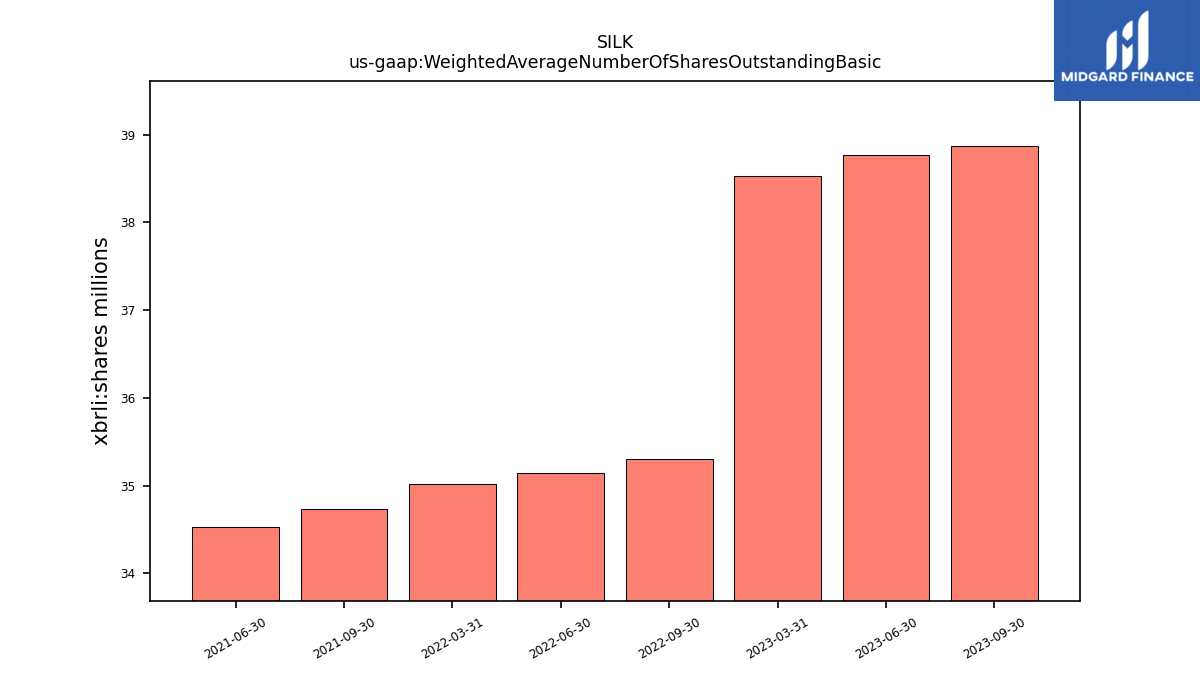
| Weighted Average Number Of Shares Outstanding Basic | 39.26 | NA | 38.87 | 38.77 | 38.53 | NA | 35.30 | 35.14 | 35.02 | NA | 34.74 | 34.53 | NA | NA | NA | NA | NA | NA | NA | NA | NA | NA | NA | NA | NA | |
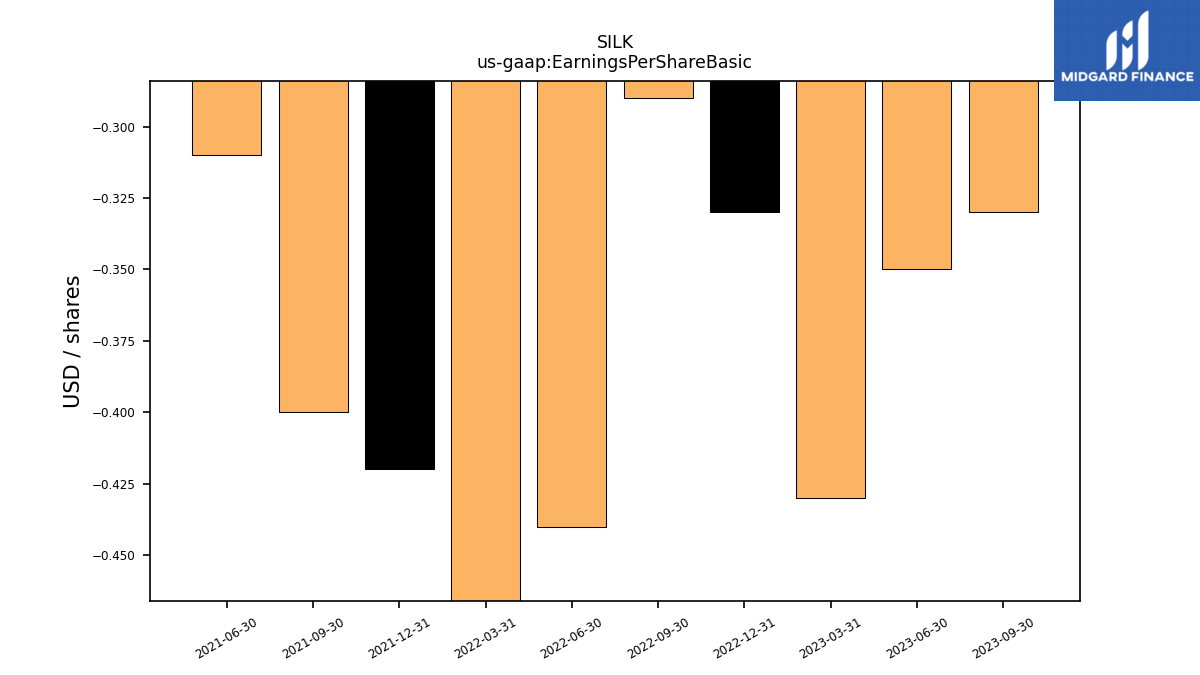
| Earnings Per Share Basic | -0.36 | -0.34 | -0.33 | -0.35 | -0.43 | -0.33 | -0.29 | -0.44 | -0.48 | -0.42 | -0.40 | -0.31 | NA | NA | NA | NA | NA | NA | NA | NA | NA | NA | NA | NA | NA | |
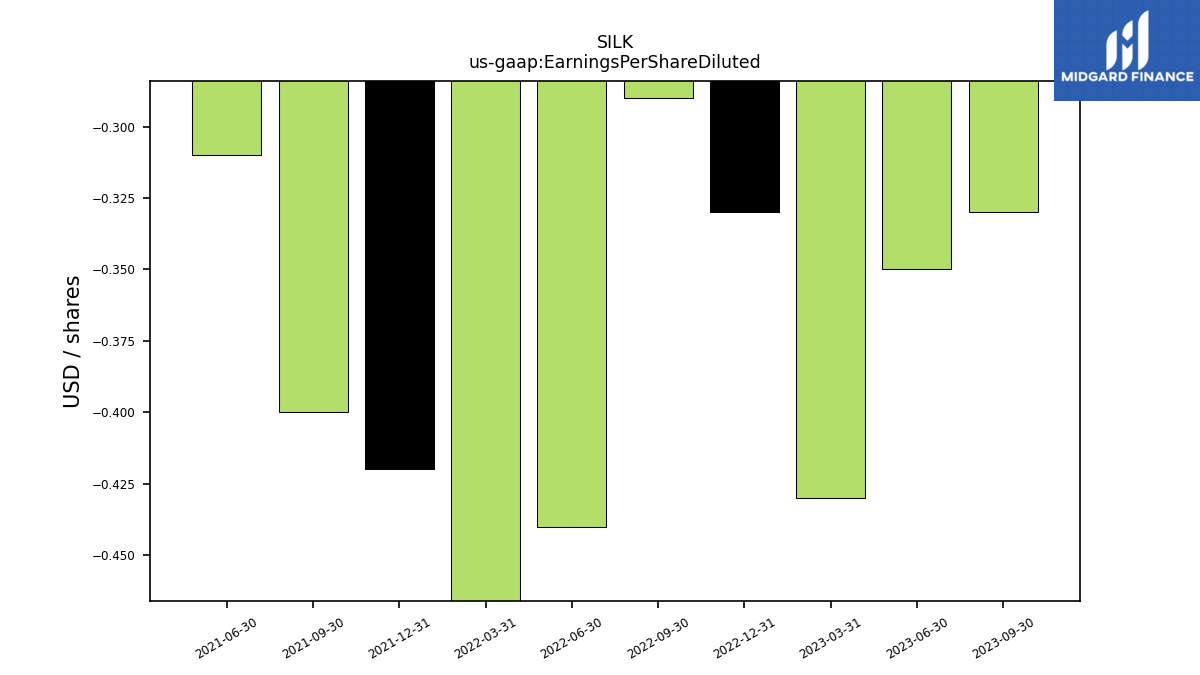
| Earnings Per Share Diluted | -0.36 | -0.34 | -0.33 | -0.35 | -0.43 | -0.33 | -0.29 | -0.44 | -0.48 | -0.42 | -0.40 | -0.31 | NA | NA | NA | NA | NA | NA | NA | NA | NA | NA | NA | NA | NA |
| 2024-03-31 | 2023-12-31 | 2023-09-30 | 2023-06-30 | 2023-03-31 | 2022-12-31 | 2022-09-30 | 2022-06-30 | 2022-03-31 | 2021-12-31 | 2021-09-30 | 2021-06-30 | 2021-03-31 | 2020-12-31 | 2020-09-30 | 2020-06-30 | 2020-03-31 | 2019-12-31 | 2019-09-30 | 2019-06-30 | 2019-03-31 | 2018-12-31 | 2018-09-30 | 2018-06-30 | 2018-03-31 | ||
|---|---|---|---|---|---|---|---|---|---|---|---|---|---|---|---|---|---|---|---|---|---|---|---|---|---|---|
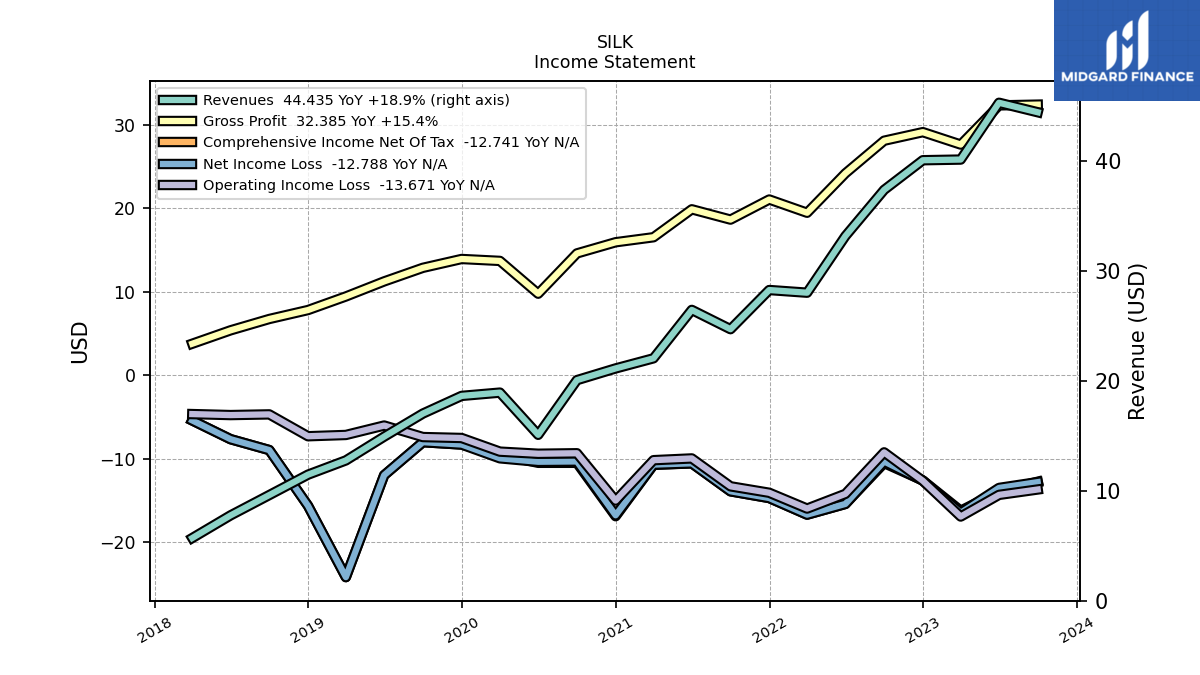
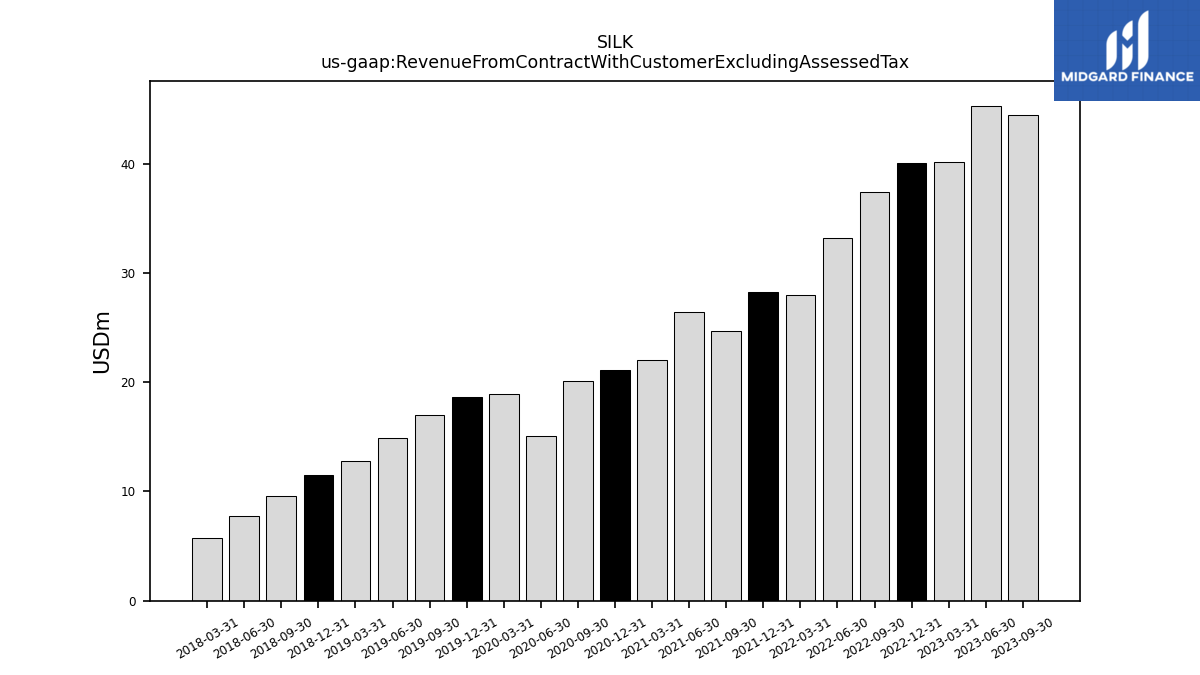
| Revenue From Contract With Customer Excluding Assessed Tax | 48.48 | 47.27 | 44.44 | 45.30 | 40.13 | 40.07 | 37.37 | 33.17 | 28.02 | 28.27 | 24.70 | 26.46 | 22.05 | 21.13 | 20.07 | 15.09 | 18.93 | 18.63 | 17.03 | 14.93 | 12.77 | 11.47 | 9.61 | 7.77 | 5.71 | |
| Revenues | 48.48 | 47.27 | 44.44 | 45.30 | 40.13 | 40.07 | 37.37 | 33.17 | 28.02 | 28.27 | 24.70 | 26.46 | 22.05 | 21.13 | 20.07 | 15.09 | 18.93 | 18.63 | 17.03 | 14.93 | 12.77 | 11.47 | 9.61 | 7.77 | 5.71 | |
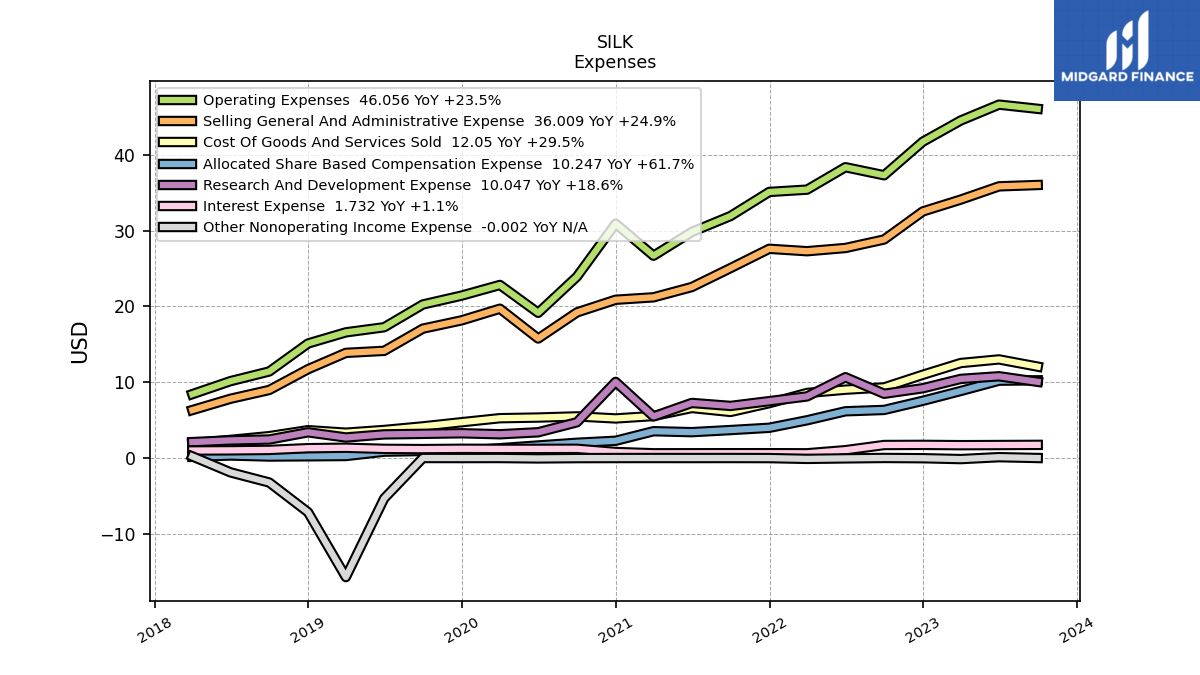
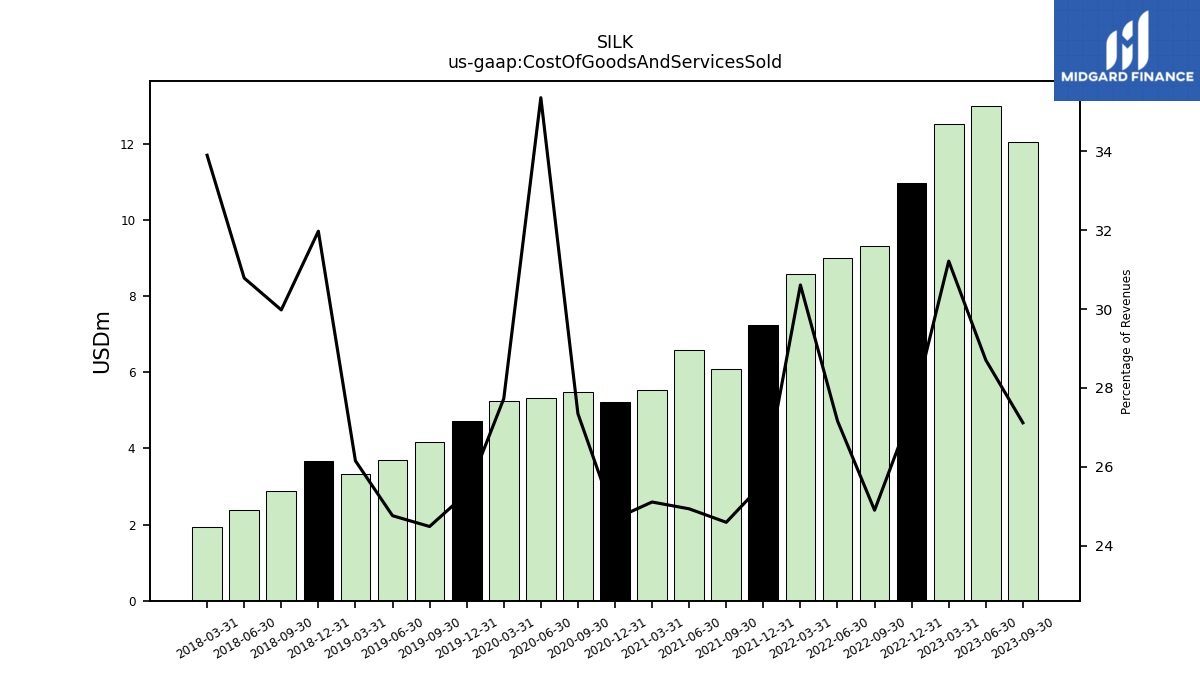
| Cost Of Goods And Services Sold | 11.98 | 12.47 | 12.05 | 13.00 | 12.53 | 10.98 | 9.31 | 9.01 | 8.58 | 7.23 | 6.08 | 6.60 | 5.54 | 5.22 | 5.49 | 5.34 | 5.25 | 4.72 | 4.17 | 3.70 | 3.34 | 3.67 | 2.88 | 2.39 | 1.93 | |
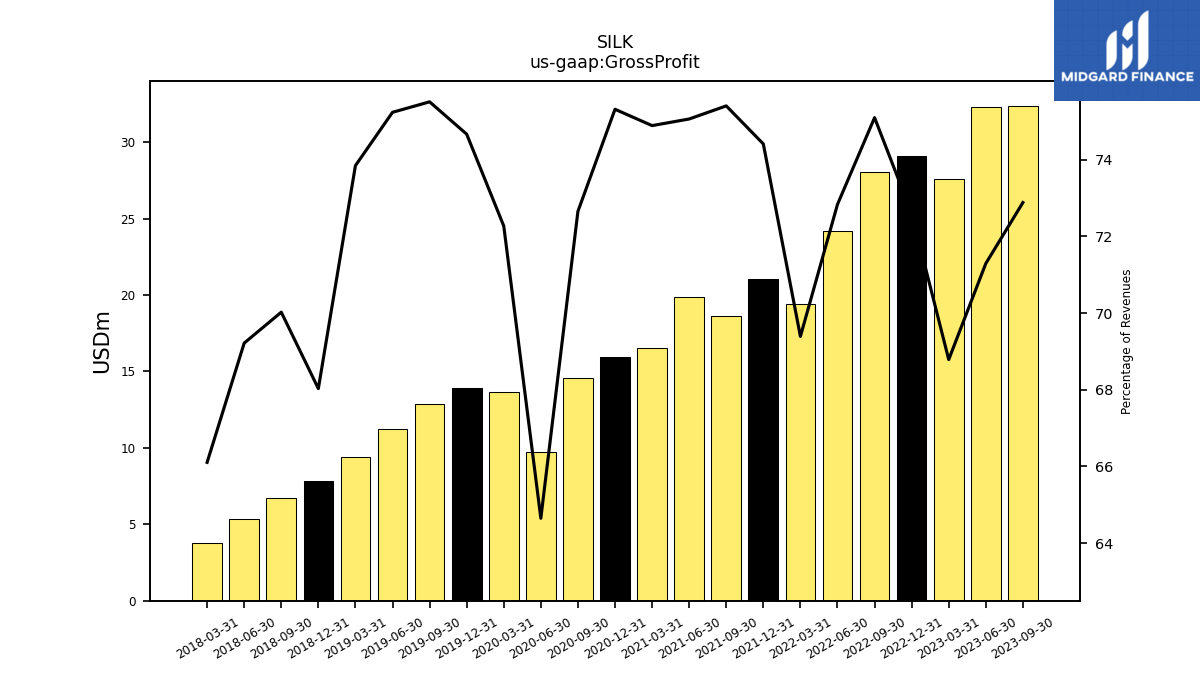
| Gross Profit | 36.50 | 34.80 | 32.38 | 32.29 | 27.61 | 29.09 | 28.07 | 24.16 | 19.44 | 21.03 | 18.62 | 19.86 | 16.52 | 15.92 | 14.58 | 9.76 | 13.68 | 13.91 | 12.86 | 11.23 | 9.43 | 7.80 | 6.73 | 5.38 | 3.77 | |
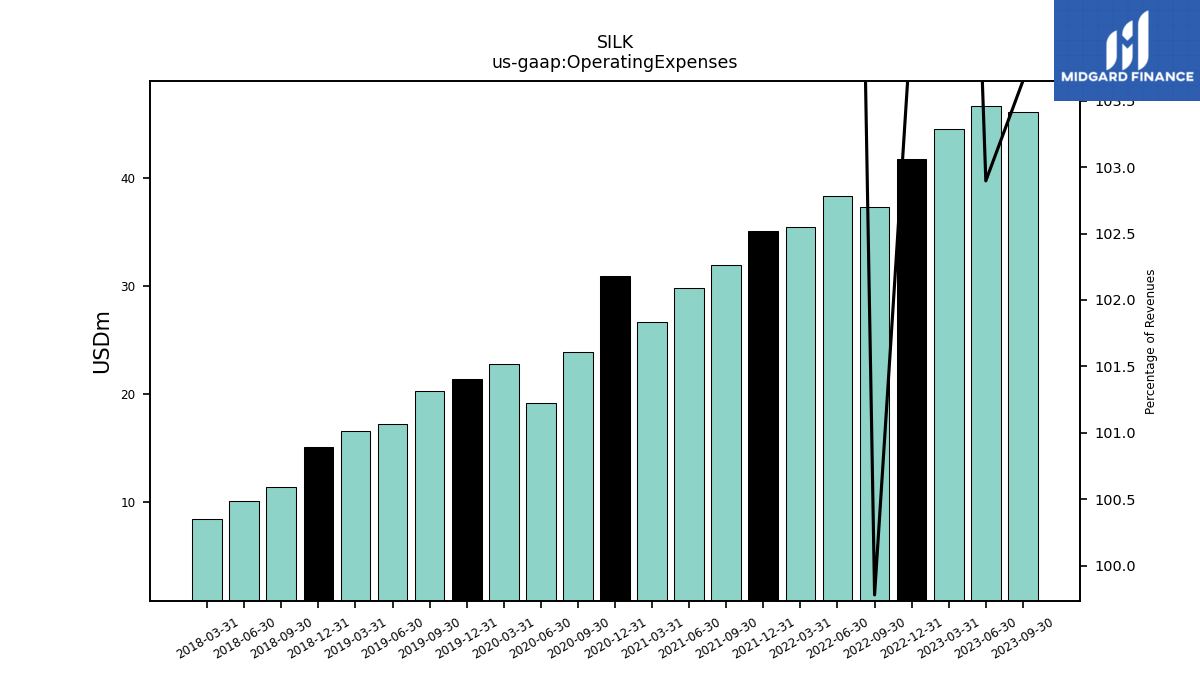
| Operating Expenses | 51.44 | 49.17 | 46.06 | 46.61 | 44.52 | 41.72 | 37.29 | 38.35 | 35.40 | 35.09 | 31.92 | 29.81 | 26.68 | 30.91 | 23.91 | 19.15 | 22.82 | 21.42 | 20.25 | 17.25 | 16.57 | 15.10 | 11.41 | 10.14 | 8.42 | |
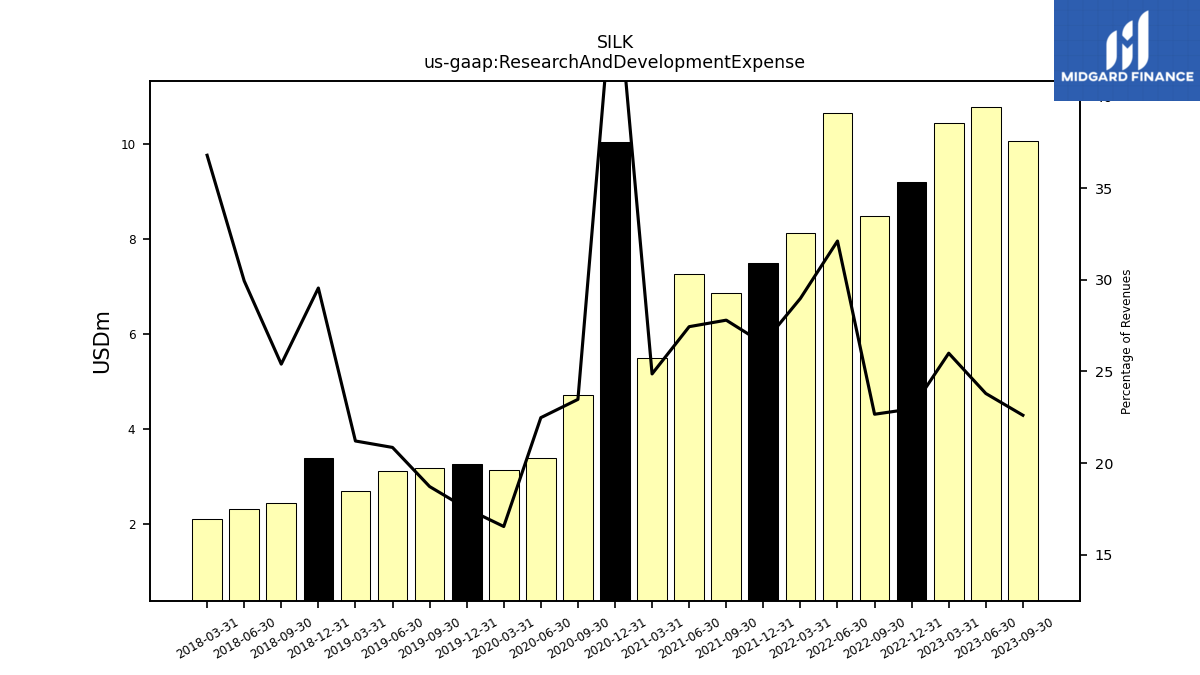
| Research And Development Expense | 10.66 | 10.06 | 10.05 | 10.78 | 10.43 | 9.20 | 8.47 | 10.65 | 8.12 | 7.50 | 6.87 | 7.26 | 5.48 | 10.04 | 4.71 | 3.39 | 3.13 | 3.26 | 3.19 | 3.11 | 2.71 | 3.39 | 2.44 | 2.33 | 2.10 | |
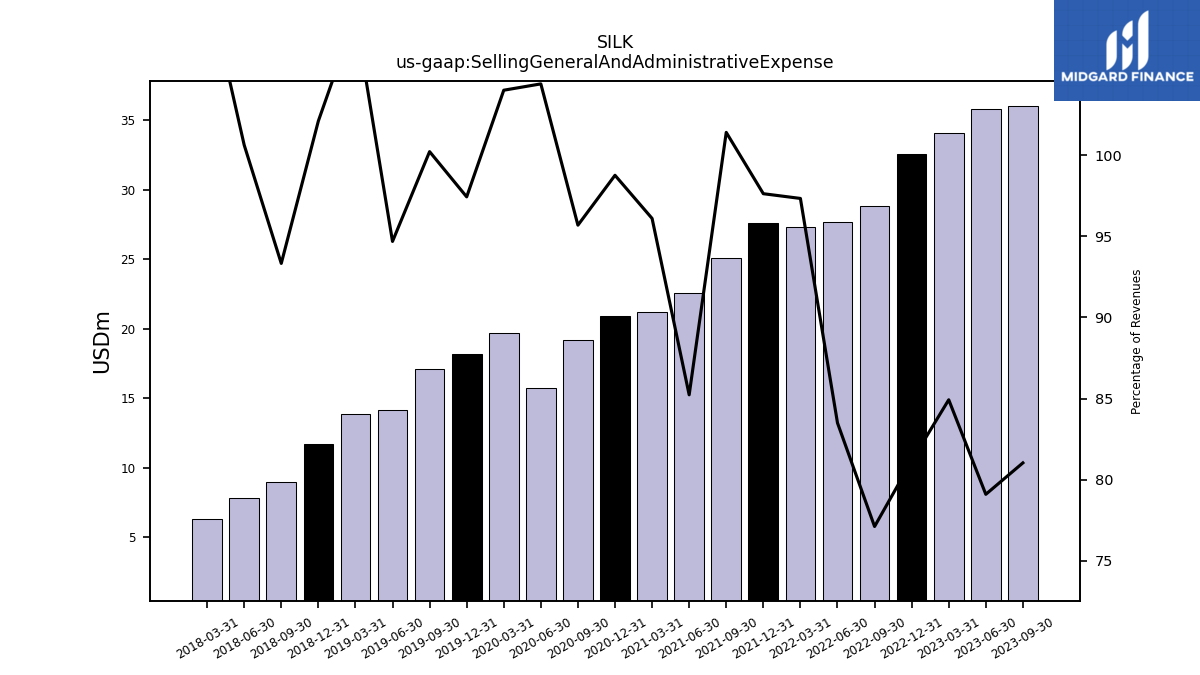
| Selling General And Administrative Expense | 40.77 | 39.11 | 36.01 | 35.83 | 34.08 | 32.52 | 28.82 | 27.70 | 27.27 | 27.59 | 25.05 | 22.55 | 21.19 | 20.87 | 19.20 | 15.76 | 19.69 | 18.16 | 17.06 | 14.13 | 13.87 | 11.71 | 8.97 | 7.82 | 6.32 | |
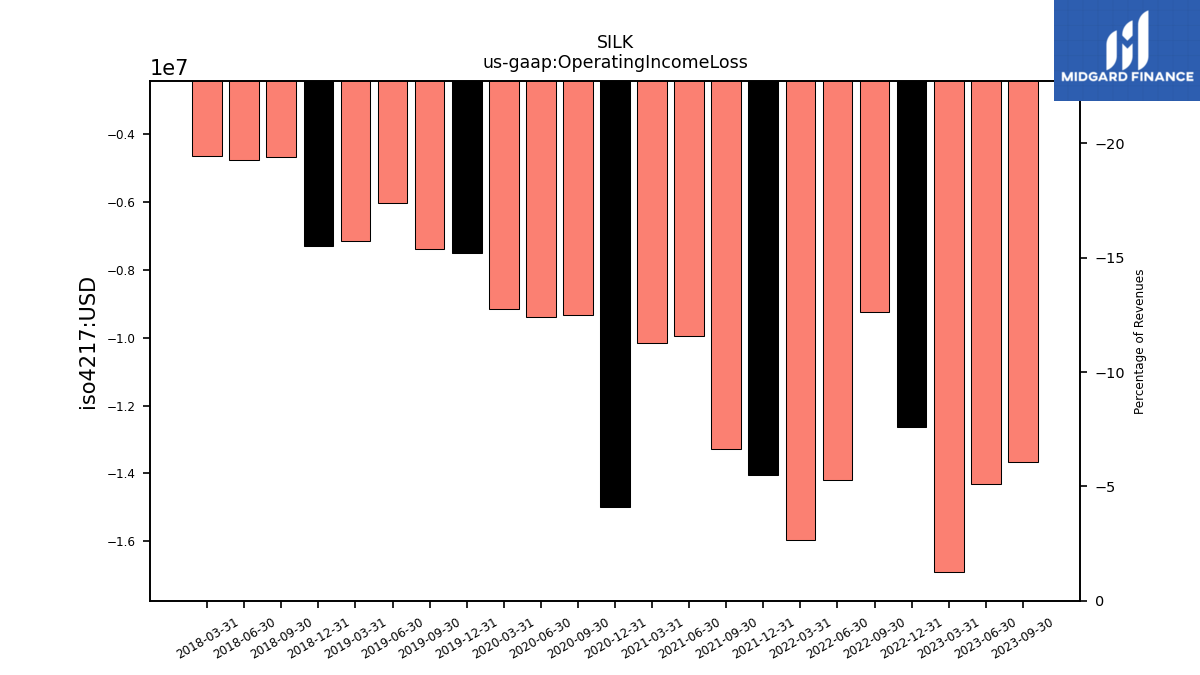
| Operating Income Loss | -14.93 | -14.37 | -13.67 | -14.32 | -16.91 | -12.63 | -9.23 | -14.19 | -15.95 | -14.06 | -13.29 | -9.95 | -10.16 | -14.99 | -9.33 | -9.39 | -9.14 | -7.51 | -7.39 | -6.02 | -7.15 | -7.30 | -4.68 | -4.77 | -4.65 | |
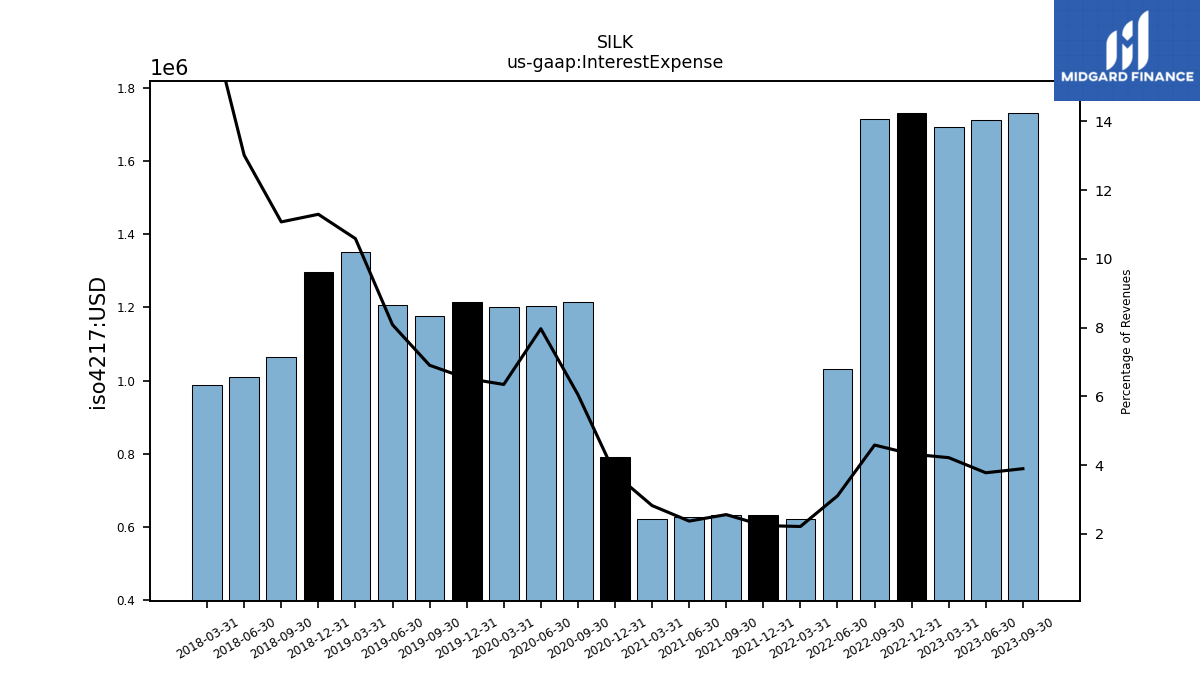
| Interest Expense | 1.72 | 1.73 | 1.73 | 1.71 | 1.69 | 1.73 | 1.71 | 1.03 | 0.62 | 0.63 | 0.63 | 0.63 | 0.62 | 0.79 | 1.22 | 1.20 | 1.20 | 1.22 | 1.18 | 1.21 | 1.35 | 1.30 | 1.06 | 1.01 | 0.99 | |
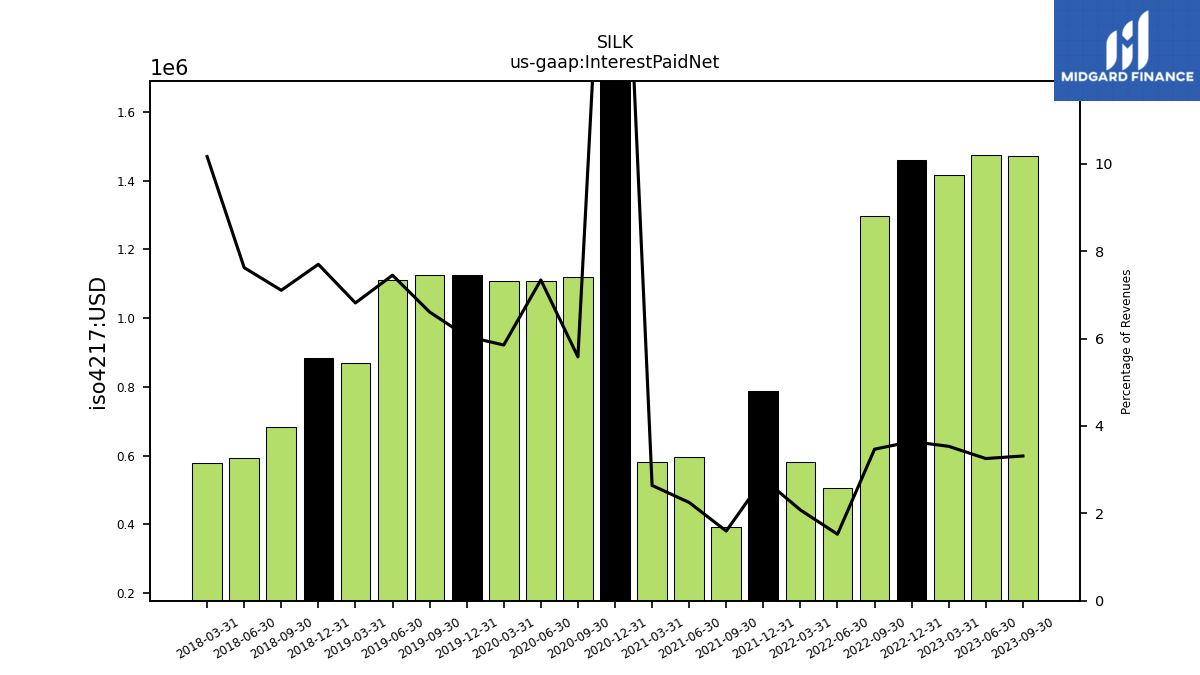
| Interest Paid Net | 1.44 | 1.46 | 1.47 | 1.47 | 1.42 | 1.46 | 1.30 | 0.51 | 0.58 | 0.79 | 0.39 | 0.59 | 0.58 | 4.58 | 1.12 | 1.11 | 1.11 | 1.13 | 1.12 | 1.11 | 0.87 | 0.88 | 0.68 | 0.59 | 0.58 | |
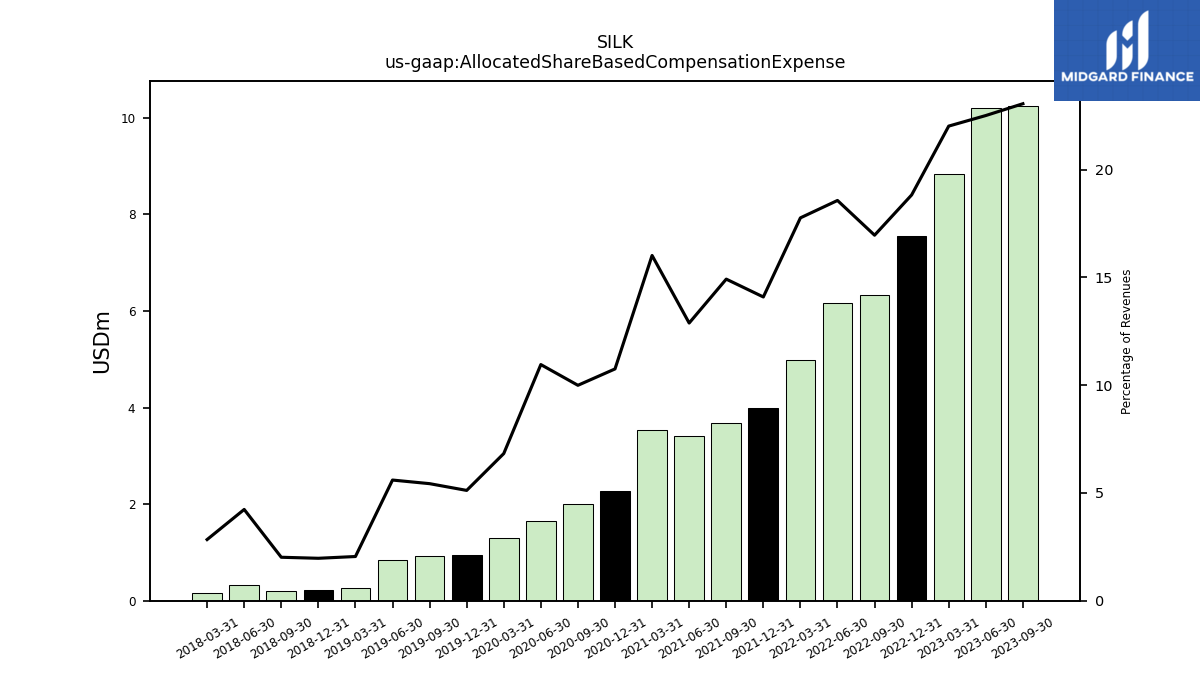
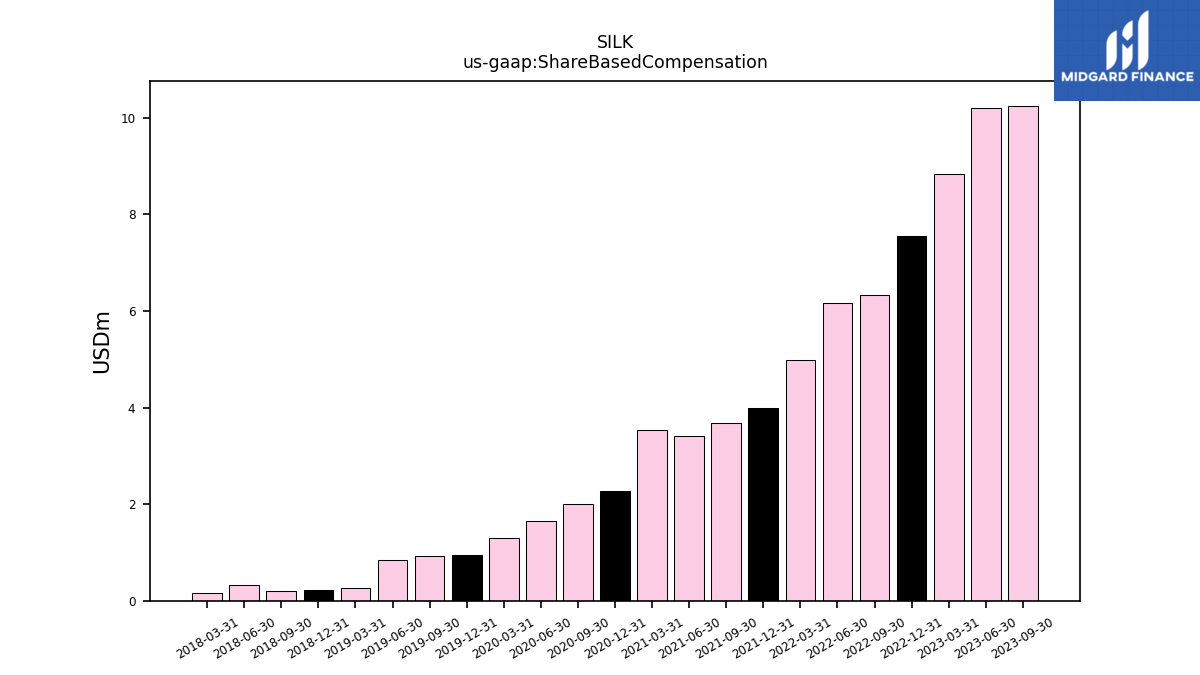
| Allocated Share Based Compensation Expense | 10.36 | 9.61 | 10.25 | 10.20 | 8.84 | 7.54 | 6.34 | 6.16 | 4.98 | 3.98 | 3.69 | 3.41 | 3.53 | 2.27 | 2.01 | 1.65 | 1.29 | 0.95 | 0.93 | 0.84 | 0.26 | 0.23 | 0.19 | 0.33 | 0.16 | |
| Profit Loss | -14.14 | -13.01 | -12.79 | -13.48 | -16.46 | -12.61 | -10.32 | -15.40 | -16.68 | -14.69 | -13.88 | -10.54 | -10.69 | -16.76 | -10.31 | -10.35 | -9.94 | -8.29 | -8.01 | -11.96 | -24.16 | -15.62 | -8.95 | -7.65 | -5.41 | |
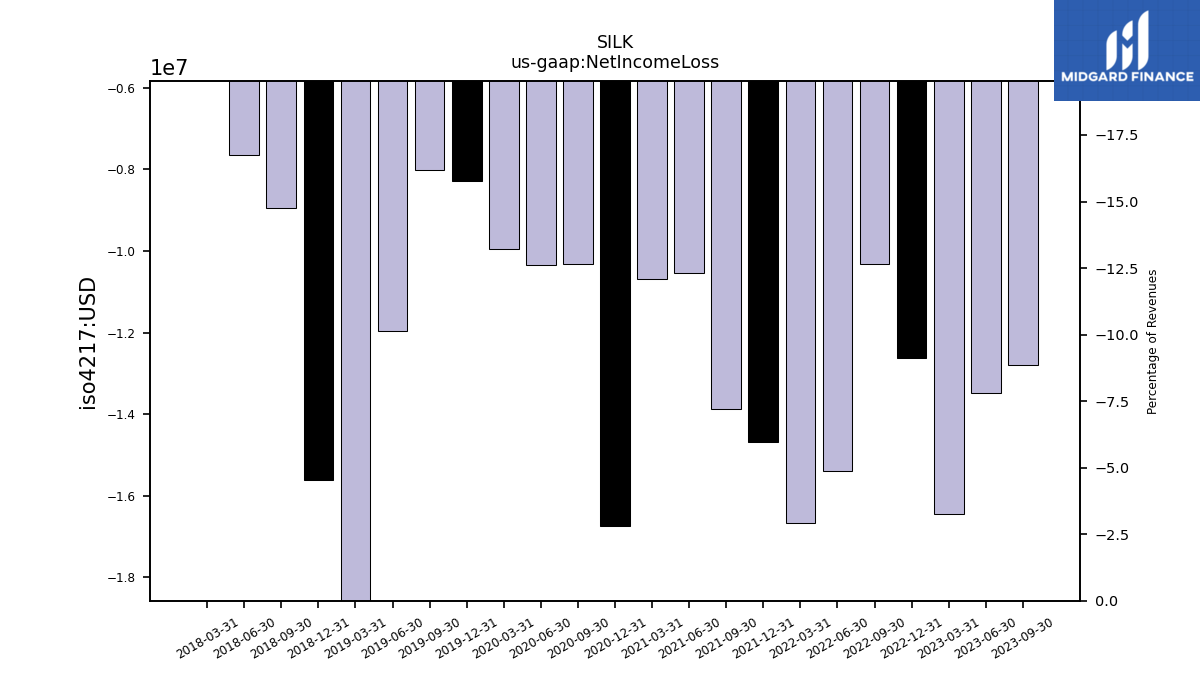
| Net Income Loss | -14.14 | -13.01 | -12.79 | -13.48 | -16.46 | -12.61 | -10.32 | -15.40 | -16.68 | -14.69 | -13.88 | -10.54 | -10.69 | -16.76 | -10.31 | -10.35 | -9.94 | -8.29 | -8.01 | -11.96 | -24.16 | -15.62 | -8.95 | -7.65 | -5.41 | |
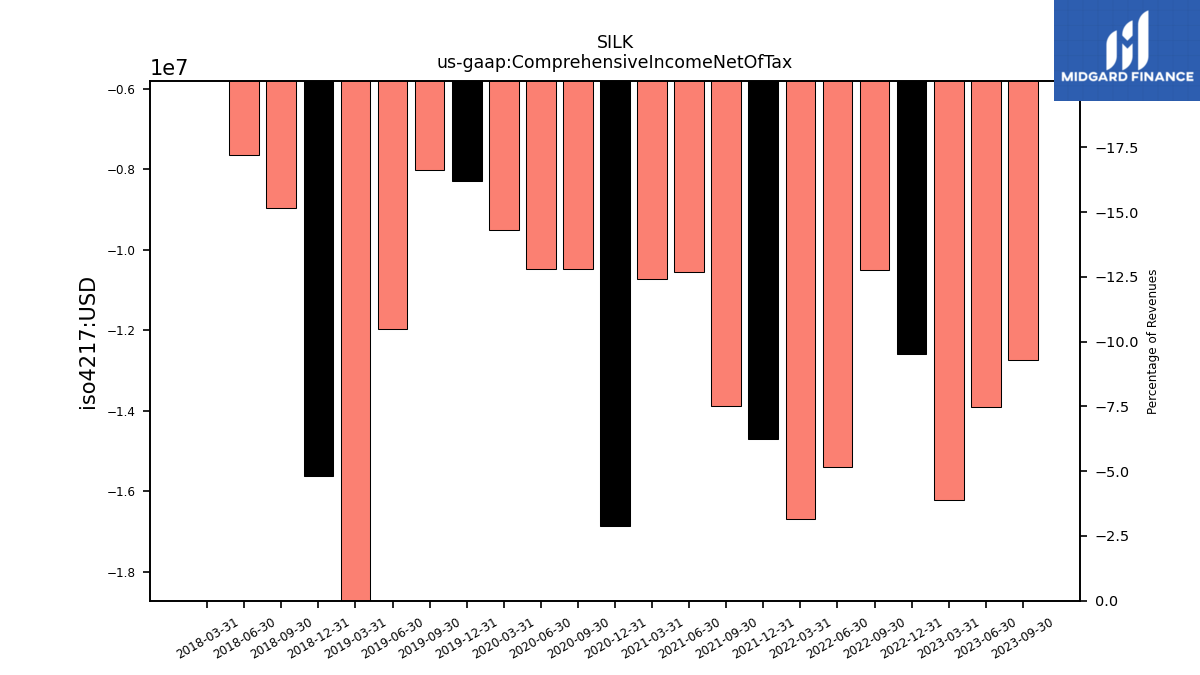
| Comprehensive Income Net Of Tax | -14.22 | -12.65 | -12.74 | -13.90 | -16.21 | -12.59 | -10.51 | -15.40 | -16.68 | -14.69 | -13.89 | -10.54 | -10.73 | -16.87 | -10.48 | -10.48 | -9.50 | -8.29 | -8.01 | -11.96 | -24.16 | -15.62 | -8.95 | -7.65 | -5.41 |
| 2024-03-31 | 2023-12-31 | 2023-09-30 | 2023-06-30 | 2023-03-31 | 2022-12-31 | 2022-09-30 | 2022-06-30 | 2022-03-31 | 2021-12-31 | 2021-09-30 | 2021-06-30 | 2021-03-31 | 2020-12-31 | 2020-09-30 | 2020-06-30 | 2020-03-31 | 2019-12-31 | 2019-09-30 | 2019-06-30 | 2019-03-31 | 2018-12-31 | 2018-09-30 | 2018-06-30 | 2018-03-31 | ||
|---|---|---|---|---|---|---|---|---|---|---|---|---|---|---|---|---|---|---|---|---|---|---|---|---|---|---|
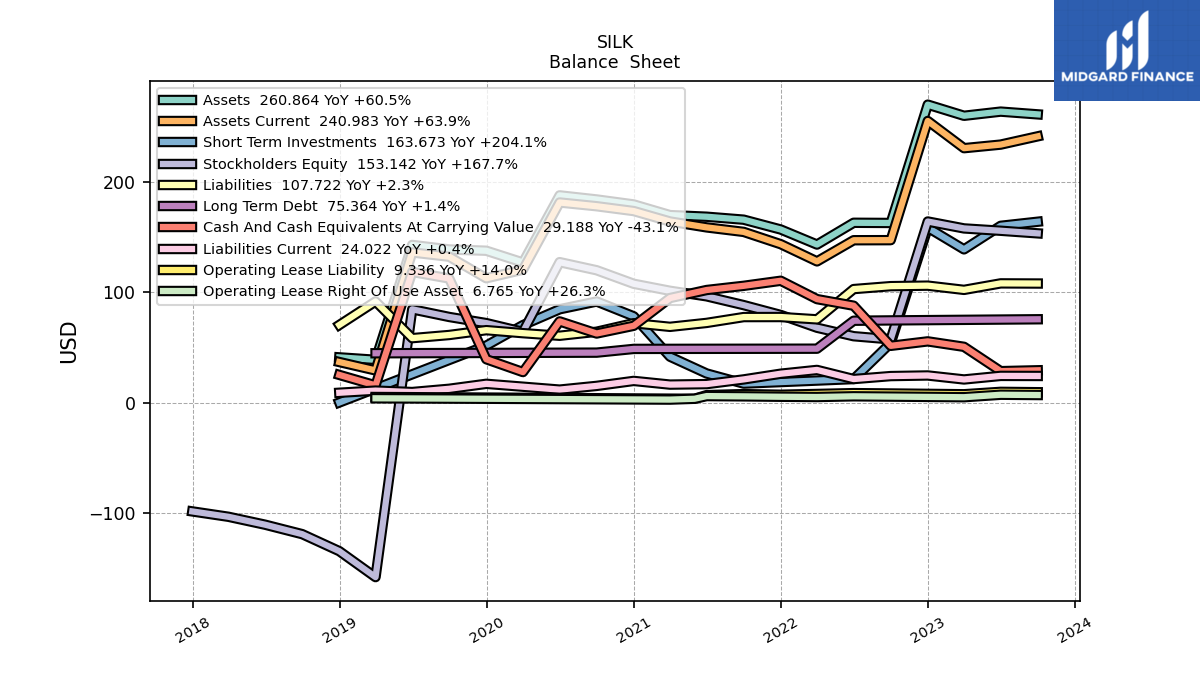
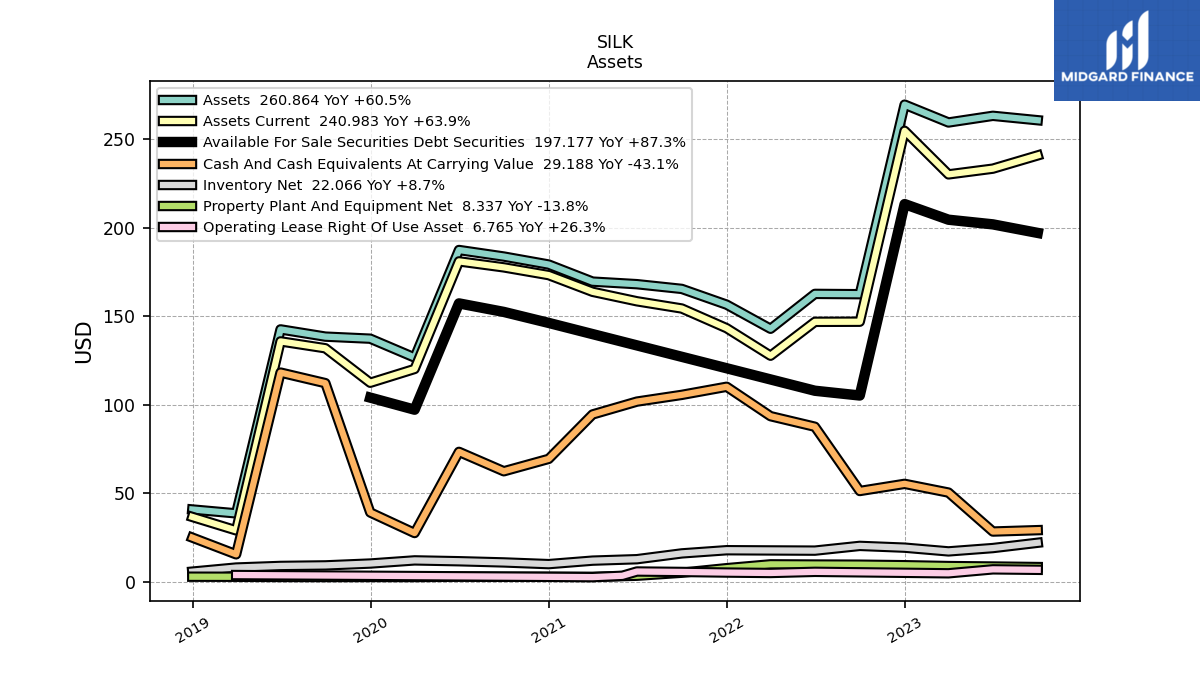
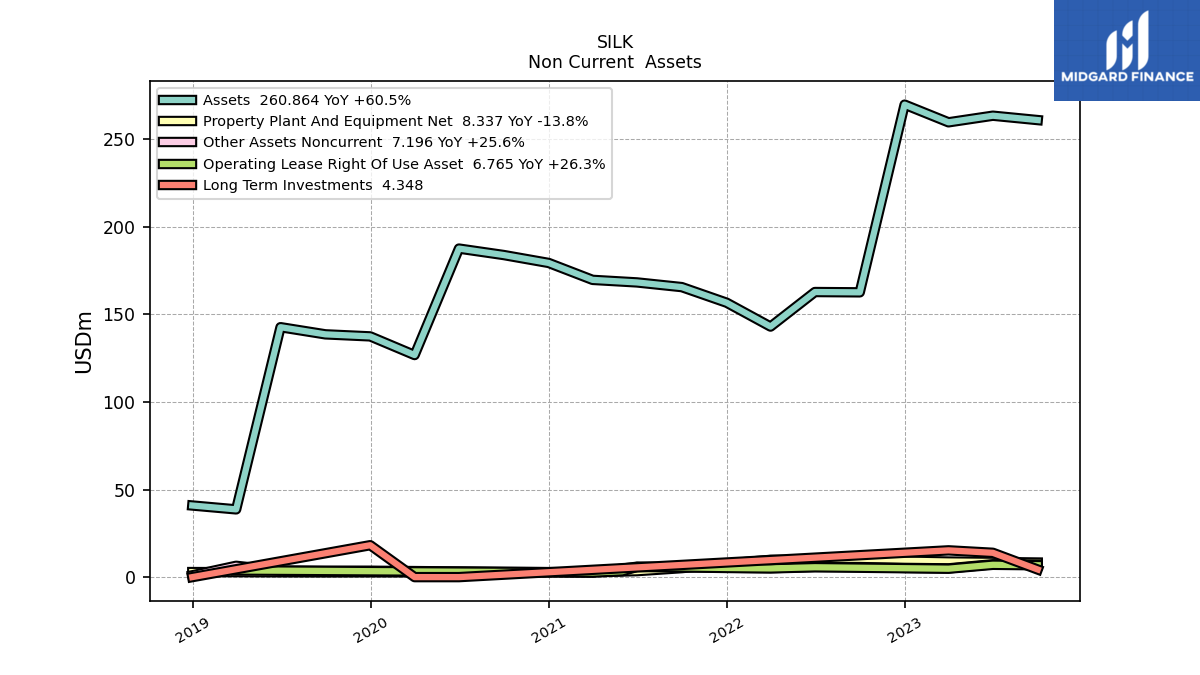
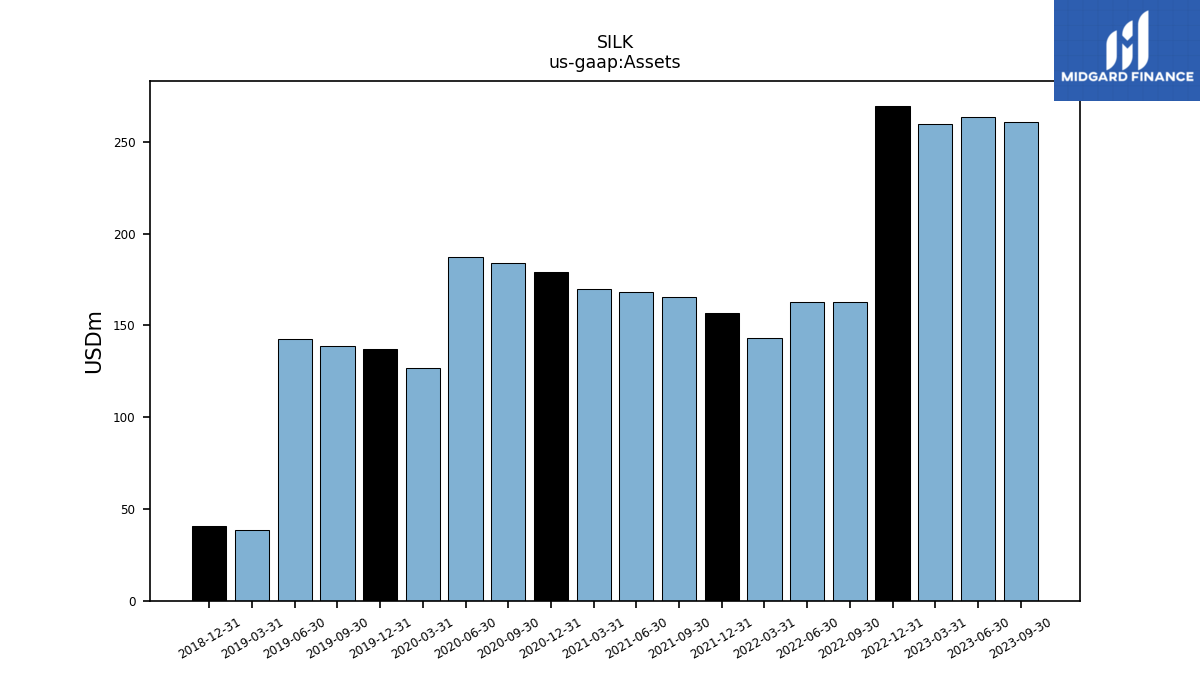
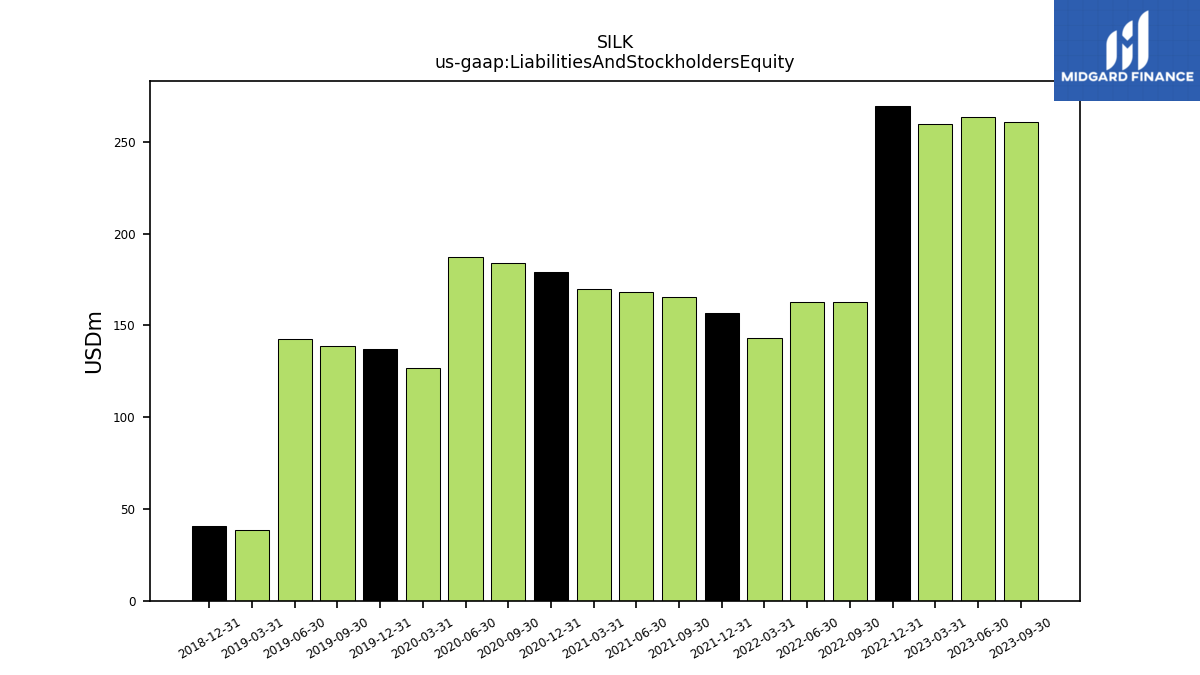
| Assets | 252.31 | 265.31 | 260.86 | 263.36 | 259.59 | 269.69 | 162.54 | 162.72 | 143.00 | 156.62 | 165.53 | 168.21 | 169.66 | 179.31 | 183.83 | 187.52 | 126.75 | 137.40 | 138.57 | 142.65 | 38.67 | 40.88 | NA | NA | NA | |
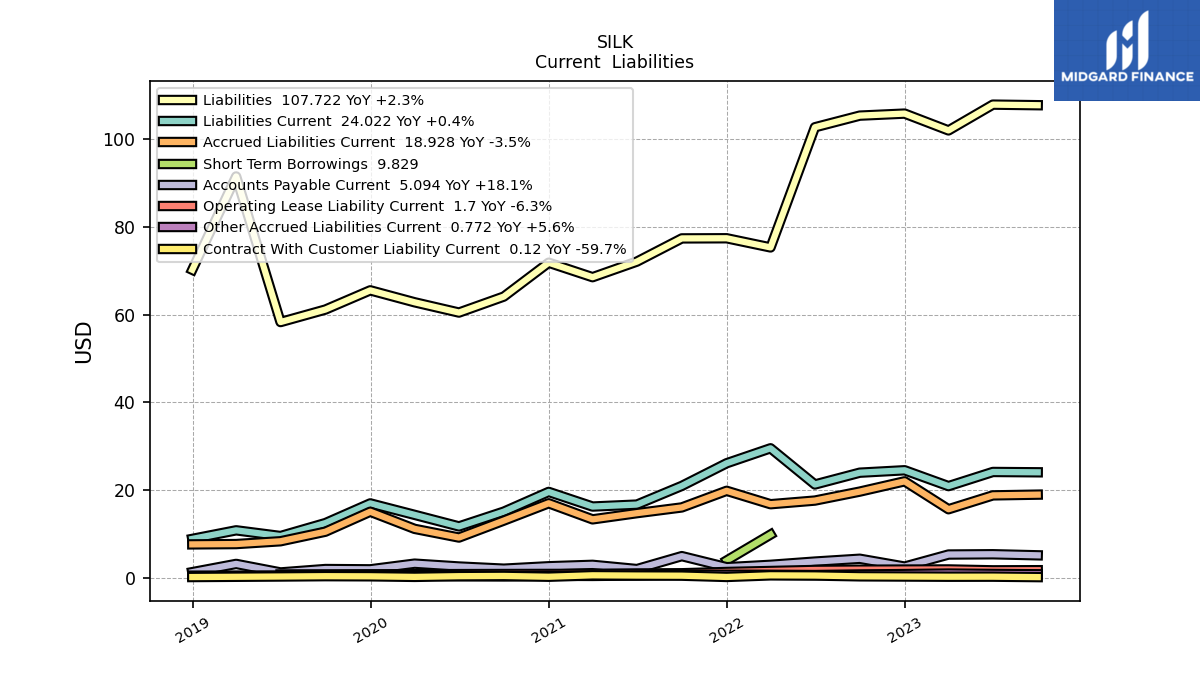
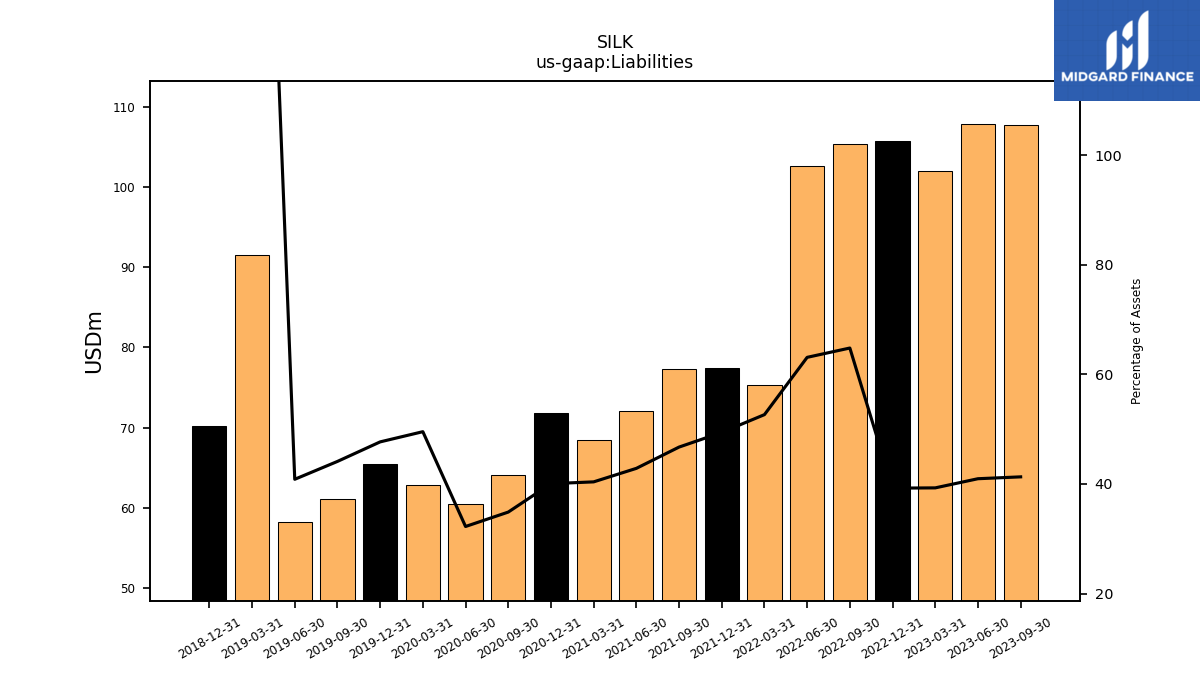
| Liabilities | 105.03 | 114.16 | 107.72 | 107.86 | 101.97 | 105.81 | 105.35 | 102.69 | 75.29 | 77.39 | 77.35 | 72.07 | 68.51 | 71.81 | 64.09 | 60.44 | 62.79 | 65.51 | 61.13 | 58.27 | 91.48 | 70.20 | NA | NA | NA | |
| Liabilities And Stockholders Equity | 252.31 | 265.31 | 260.86 | 263.36 | 259.59 | 269.69 | 162.54 | 162.72 | 143.00 | 156.62 | 165.53 | 168.21 | 169.66 | 179.31 | 183.83 | 187.52 | 126.75 | 137.40 | 138.57 | 142.65 | 38.67 | 40.88 | NA | NA | NA | |
| Stockholders Equity | 147.28 | 151.15 | 153.14 | 155.50 | 157.61 | 163.88 | 57.20 | 60.03 | 67.71 | 79.24 | 88.18 | 96.14 | 101.15 | 107.50 | 119.74 | 127.08 | 63.96 | 71.89 | 77.44 | 84.38 | -158.07 | -134.55 | -119.17 | -110.63 | -103.45 |
| 2024-03-31 | 2023-12-31 | 2023-09-30 | 2023-06-30 | 2023-03-31 | 2022-12-31 | 2022-09-30 | 2022-06-30 | 2022-03-31 | 2021-12-31 | 2021-09-30 | 2021-06-30 | 2021-03-31 | 2020-12-31 | 2020-09-30 | 2020-06-30 | 2020-03-31 | 2019-12-31 | 2019-09-30 | 2019-06-30 | 2019-03-31 | 2018-12-31 | 2018-09-30 | 2018-06-30 | 2018-03-31 | ||
|---|---|---|---|---|---|---|---|---|---|---|---|---|---|---|---|---|---|---|---|---|---|---|---|---|---|---|
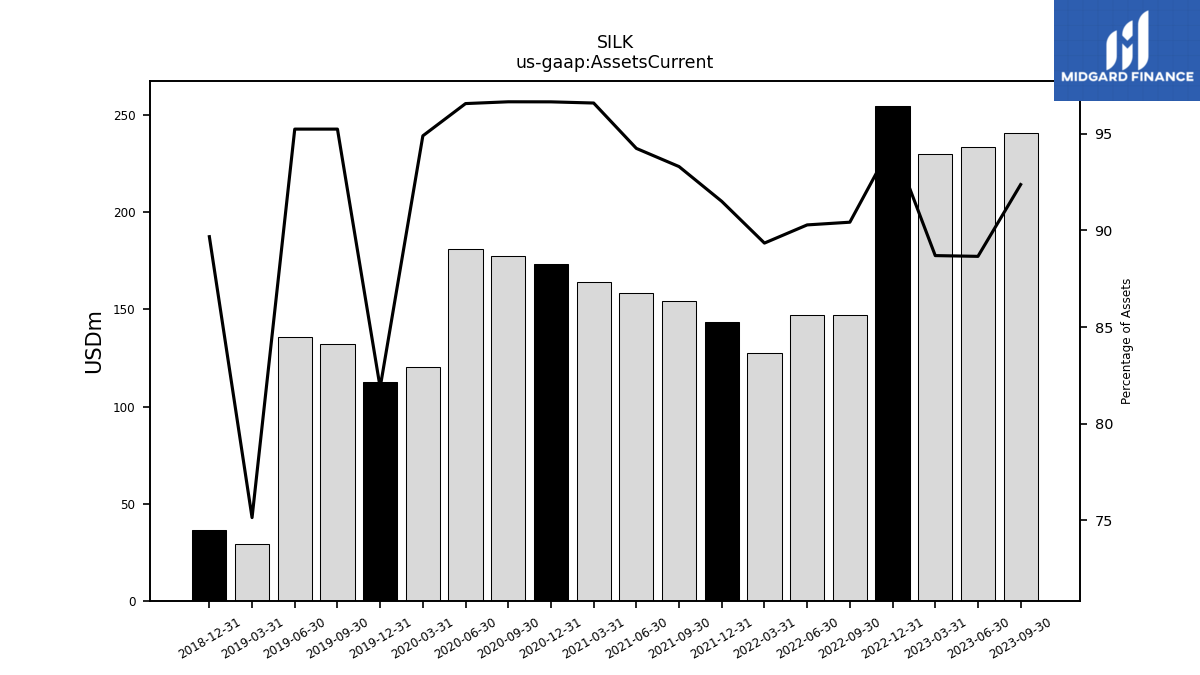
| Assets Current | 235.69 | 240.84 | 240.98 | 233.50 | 230.25 | 254.90 | 146.99 | 146.92 | 127.77 | 143.33 | 154.46 | 158.54 | 163.90 | 173.33 | 177.70 | 181.09 | 120.28 | 112.49 | 131.99 | 135.88 | 29.05 | 36.66 | NA | NA | NA | |
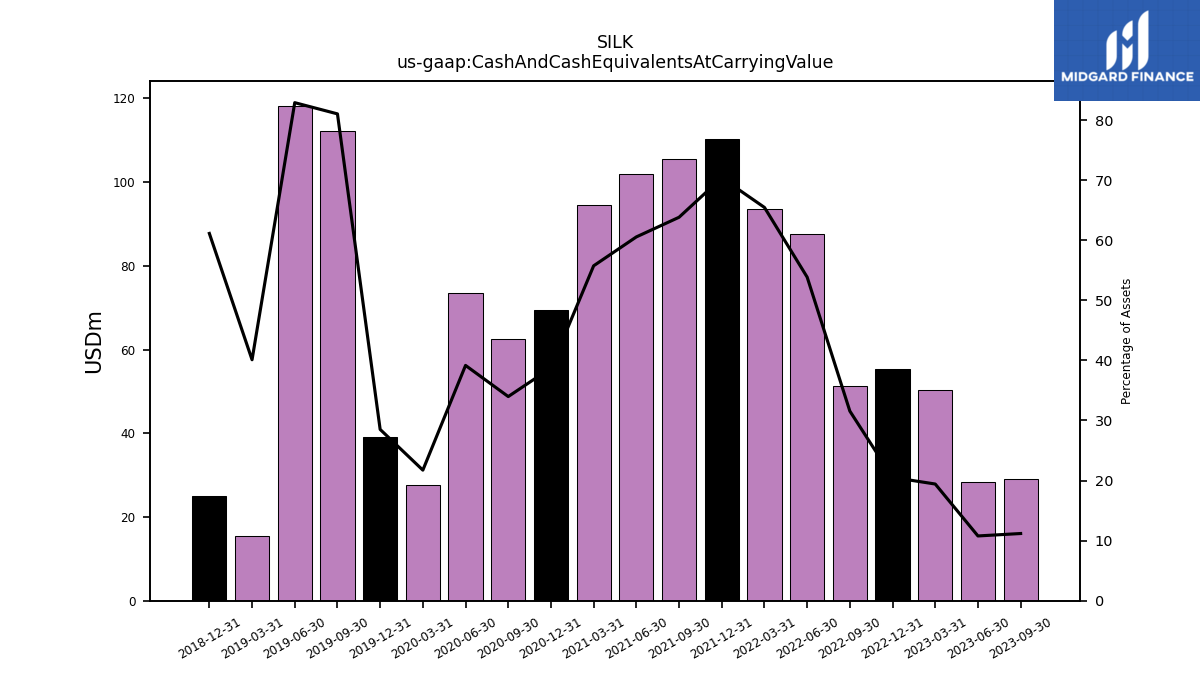
| Cash And Cash Equivalents At Carrying Value | 22.63 | 20.21 | 29.19 | 28.40 | 50.43 | 55.36 | 51.31 | 87.64 | 93.60 | 110.23 | 105.64 | 101.85 | 94.58 | 69.47 | 62.47 | 73.44 | 27.55 | 39.18 | 112.28 | 118.25 | 15.51 | 24.99 | NA | NA | NA | |
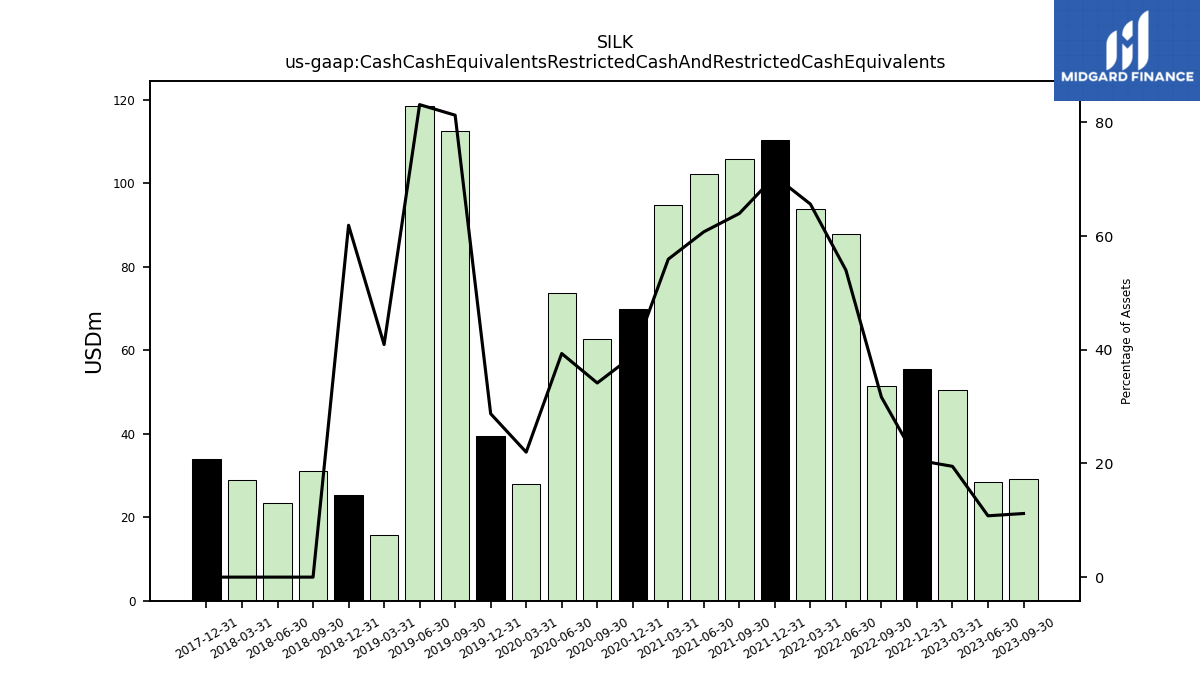
| Cash Cash Equivalents Restricted Cash And Restricted Cash Equivalents | 22.63 | 20.21 | 29.19 | 28.40 | 50.58 | 55.51 | 51.46 | 87.87 | 93.83 | 110.46 | 105.87 | 102.16 | 94.89 | 69.78 | 62.78 | 73.75 | 27.86 | 39.49 | 112.59 | 118.56 | 15.82 | 25.30 | 31.02 | 23.33 | 29.02 | |
| Short Term Investments | 151.83 | 161.26 | 163.67 | 159.96 | 138.64 | 158.32 | 53.83 | 21.23 | NA | NA | 17.13 | 26.29 | 41.50 | 78.02 | 91.44 | 84.42 | 70.07 | 51.51 | NA | NA | NA | 0.00 | NA | NA | NA | |
| Accounts Receivable Net Current | 27.20 | 23.57 | 21.78 | 21.52 | 19.96 | 18.01 | 17.02 | 15.78 | 13.88 | 11.83 | 10.98 | 11.75 | 11.11 | 9.07 | 9.40 | 7.75 | 8.67 | 8.60 | 6.93 | 5.42 | 4.10 | 4.52 | NA | NA | NA | |
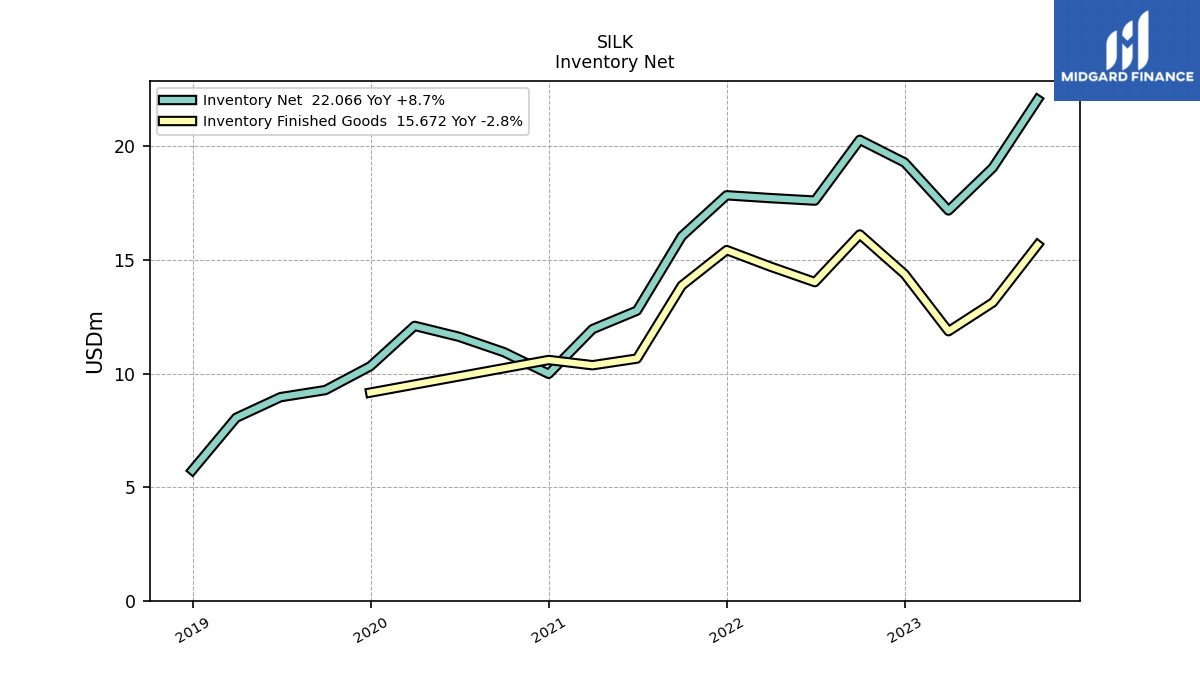
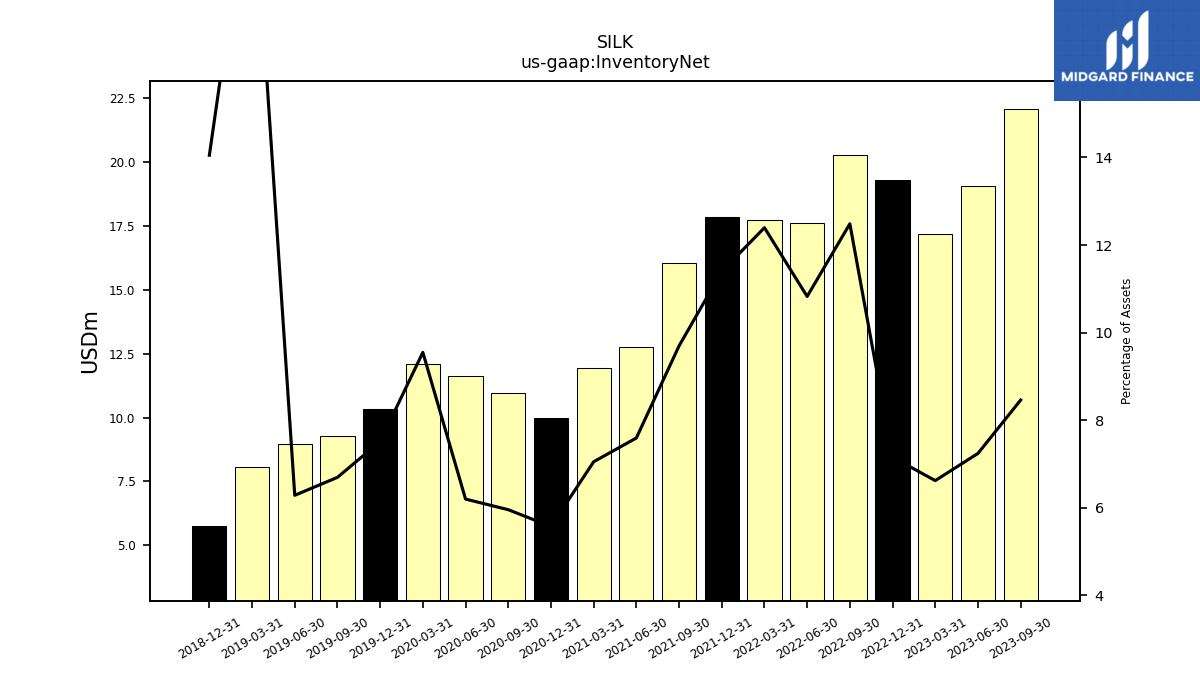
| Inventory Net | 30.49 | 29.88 | 22.07 | 19.07 | 17.18 | 19.29 | 20.29 | 17.62 | 17.73 | 17.85 | 16.05 | 12.77 | 11.96 | 9.99 | 10.95 | 11.62 | 12.10 | 10.32 | 9.28 | 8.96 | 8.06 | 5.74 | NA | NA | NA | |
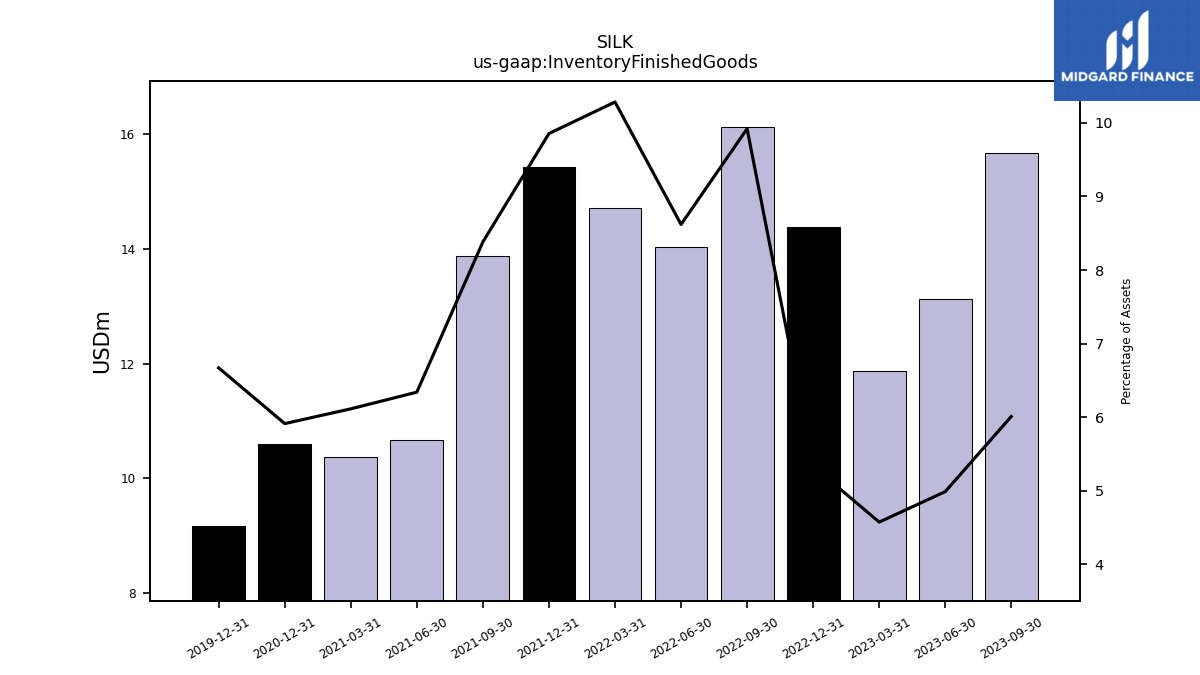
| Inventory Finished Goods | 24.49 | 23.36 | 15.67 | 13.13 | 11.87 | 14.38 | 16.13 | 14.03 | 14.71 | 15.44 | 13.88 | 10.66 | 10.37 | 10.60 | NA | NA | NA | 9.16 | NA | NA | NA | NA | NA | NA | NA | |
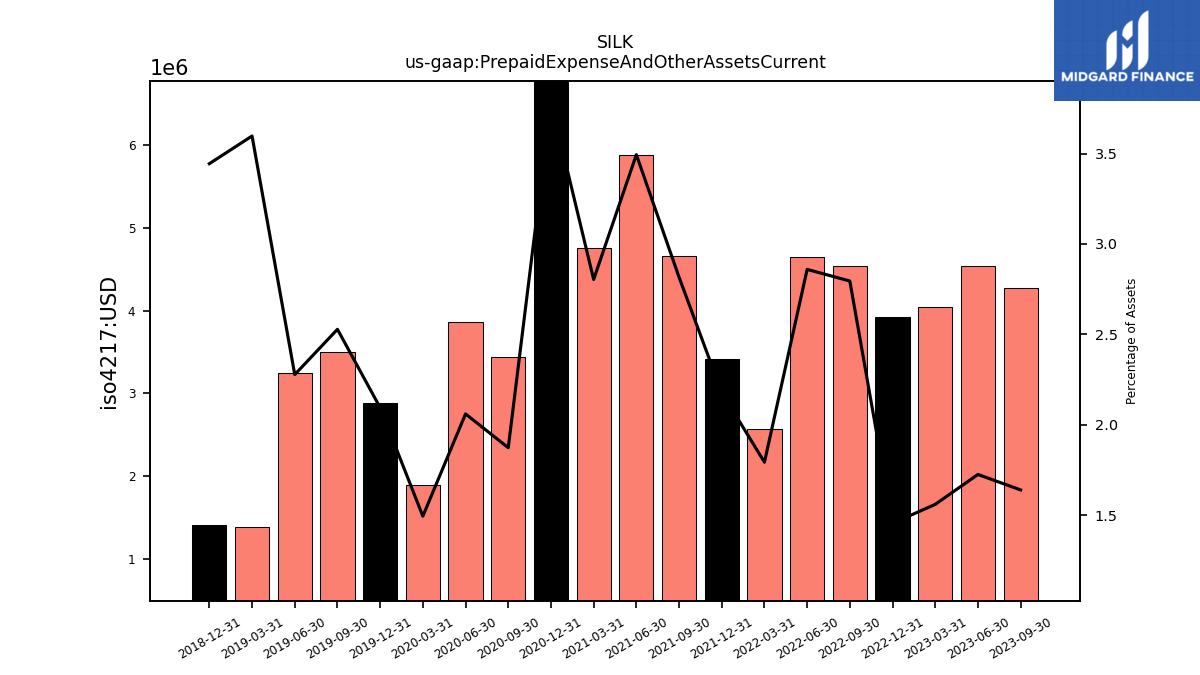
| Prepaid Expense And Other Assets Current | 3.54 | 5.91 | 4.28 | 4.54 | 4.05 | 3.92 | 4.54 | 4.65 | 2.56 | 3.41 | 4.66 | 5.88 | 4.76 | 6.79 | 3.44 | 3.86 | 1.89 | 2.88 | 3.50 | 3.25 | 1.39 | 1.41 | NA | NA | NA | |
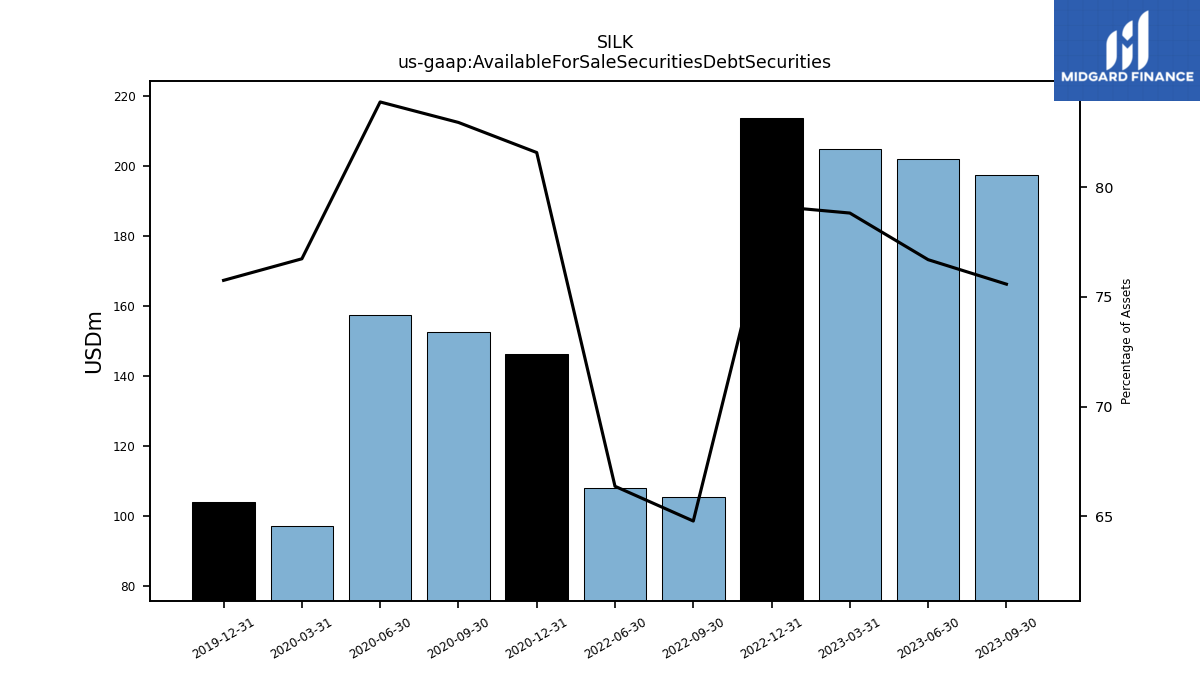
| Available For Sale Securities Debt Securities | 176.22 | 190.20 | 197.18 | 202.01 | 204.64 | 213.47 | 105.28 | 107.98 | NA | NA | NA | NA | NA | 146.31 | 152.52 | 157.34 | 97.27 | 104.09 | NA | NA | NA | NA | NA | NA | NA |
| 2024-03-31 | 2023-12-31 | 2023-09-30 | 2023-06-30 | 2023-03-31 | 2022-12-31 | 2022-09-30 | 2022-06-30 | 2022-03-31 | 2021-12-31 | 2021-09-30 | 2021-06-30 | 2021-03-31 | 2020-12-31 | 2020-09-30 | 2020-06-30 | 2020-03-31 | 2019-12-31 | 2019-09-30 | 2019-06-30 | 2019-03-31 | 2018-12-31 | 2018-09-30 | 2018-06-30 | 2018-03-31 | ||
|---|---|---|---|---|---|---|---|---|---|---|---|---|---|---|---|---|---|---|---|---|---|---|---|---|---|---|
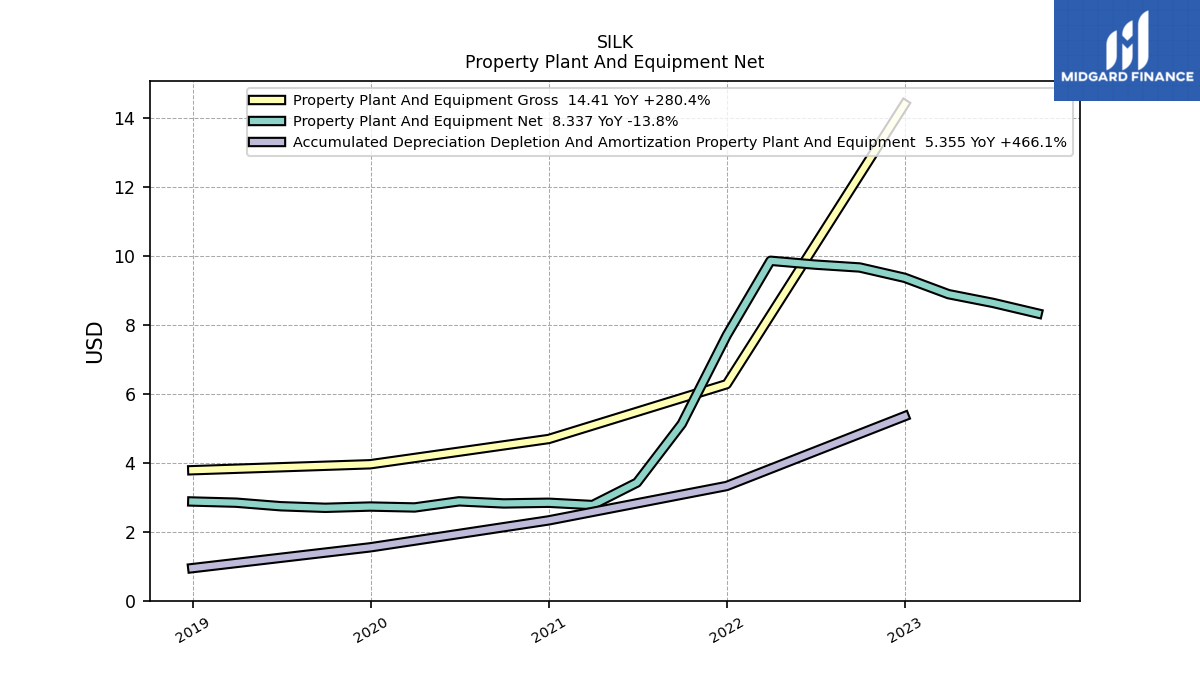
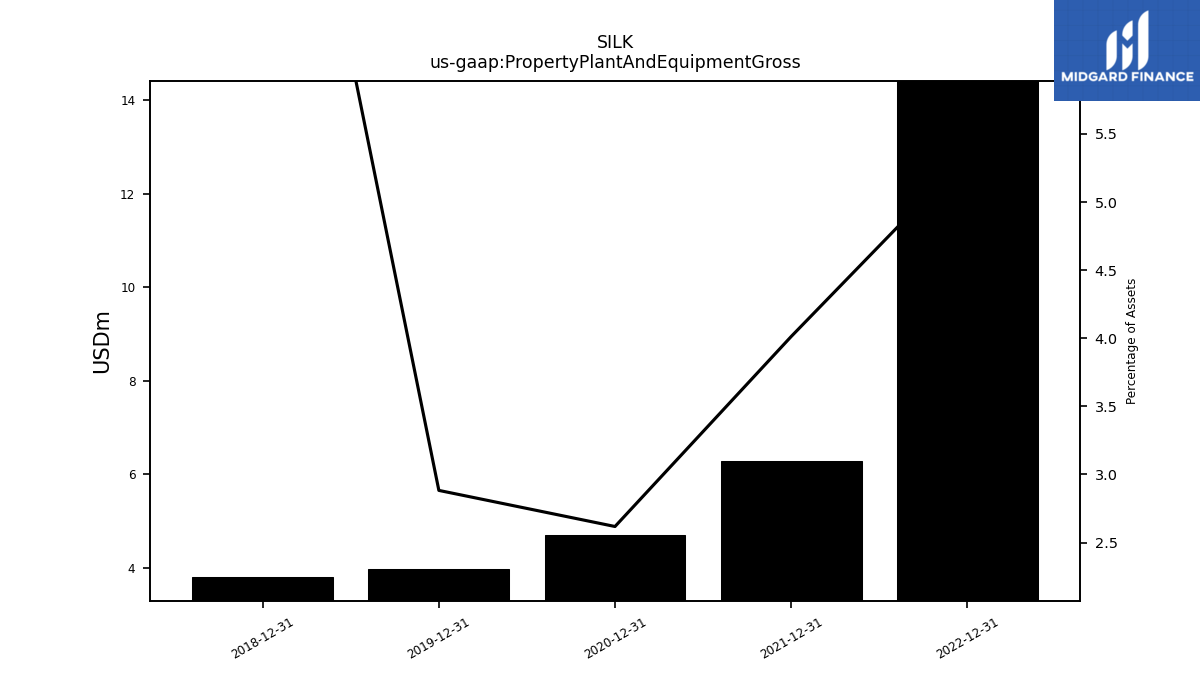
| Property Plant And Equipment Gross | NA | 15.69 | NA | NA | NA | 14.41 | NA | NA | NA | 6.28 | NA | NA | NA | 4.69 | NA | NA | NA | 3.96 | NA | NA | NA | 3.79 | NA | NA | NA | |
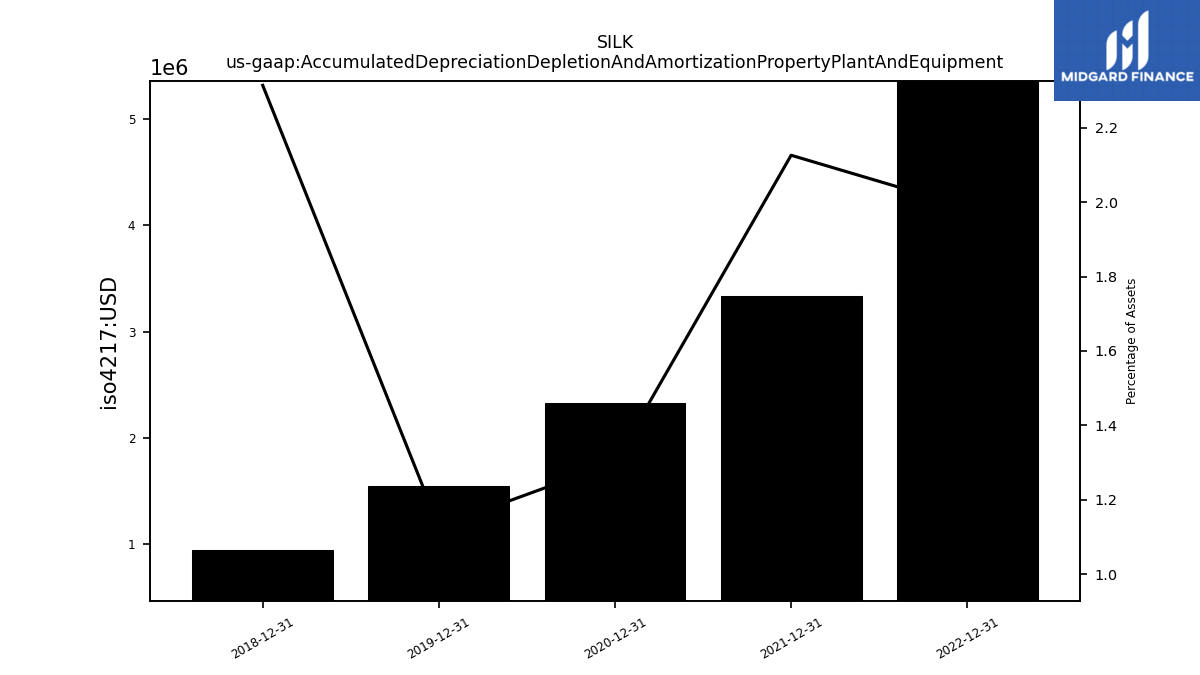
| Accumulated Depreciation Depletion And Amortization Property Plant And Equipment | NA | 7.91 | NA | NA | NA | 5.36 | NA | NA | NA | 3.33 | NA | NA | NA | 2.33 | NA | NA | NA | 1.55 | NA | NA | NA | 0.95 | NA | NA | NA | |
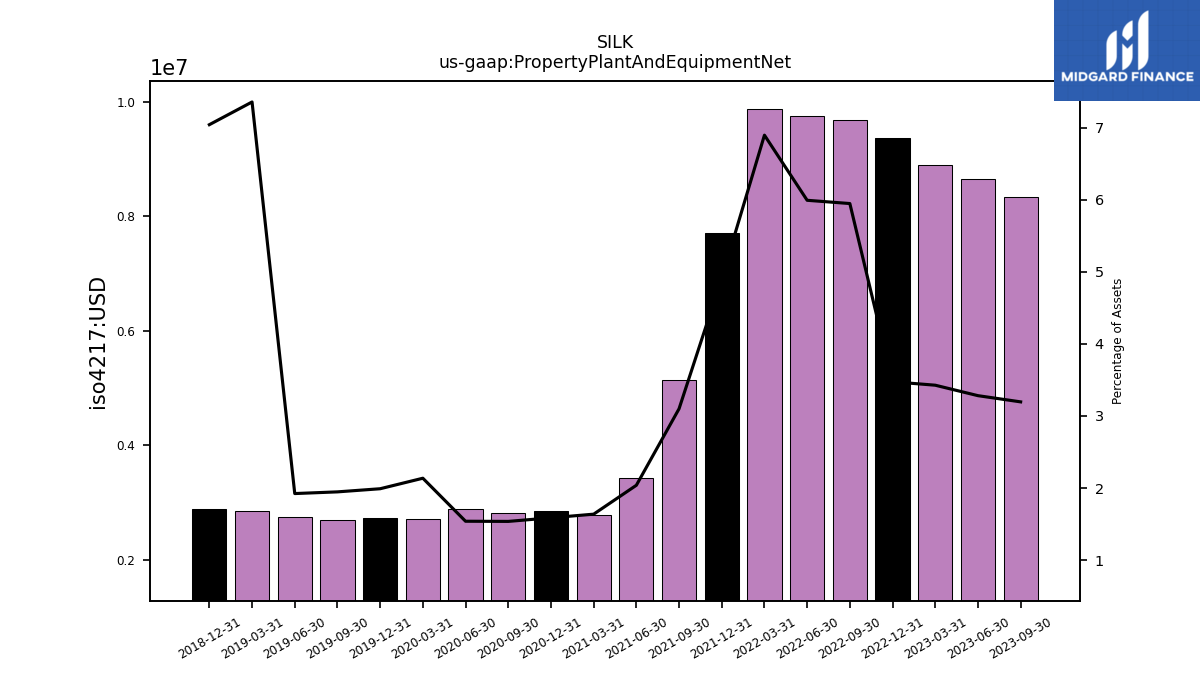
| Property Plant And Equipment Net | 8.09 | 8.11 | 8.34 | 8.64 | 8.90 | 9.37 | 9.67 | 9.76 | 9.87 | 7.70 | 5.13 | 3.43 | 2.78 | 2.84 | 2.82 | 2.88 | 2.71 | 2.73 | 2.70 | 2.74 | 2.85 | 2.88 | NA | NA | NA | |
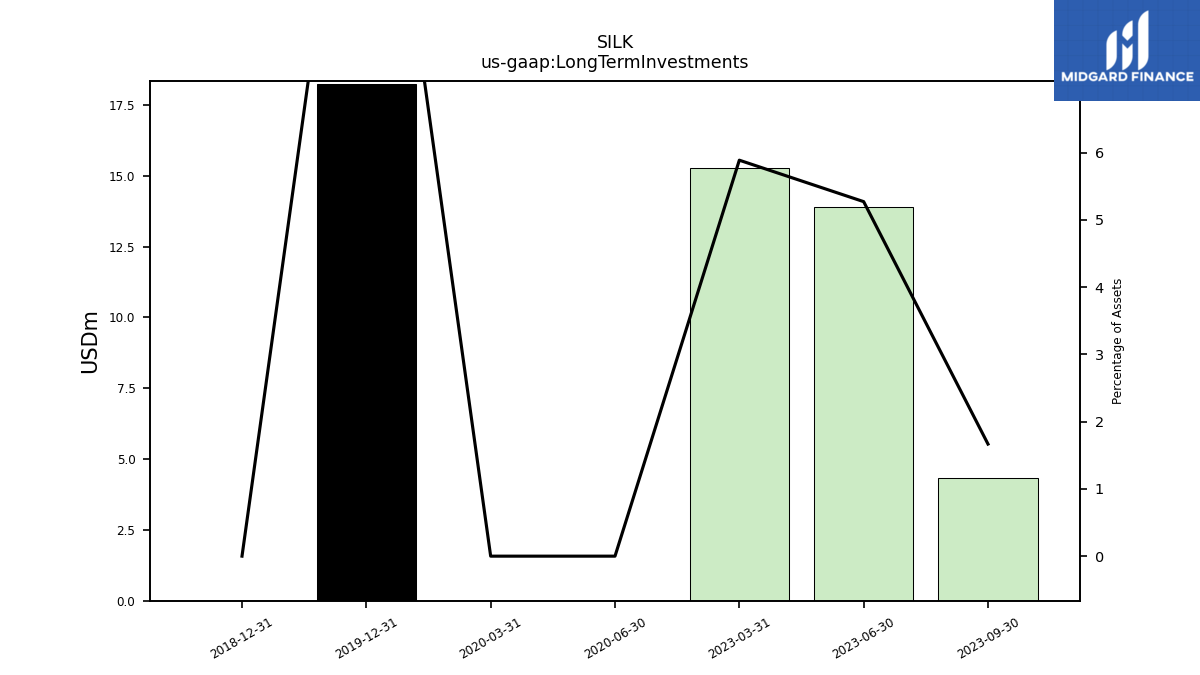
| Long Term Investments | 2.03 | 9.46 | 4.35 | 13.88 | 15.29 | NA | NA | NA | NA | NA | NA | NA | NA | NA | NA | 0.00 | 0.00 | 18.22 | NA | NA | NA | 0.00 | NA | NA | NA | |
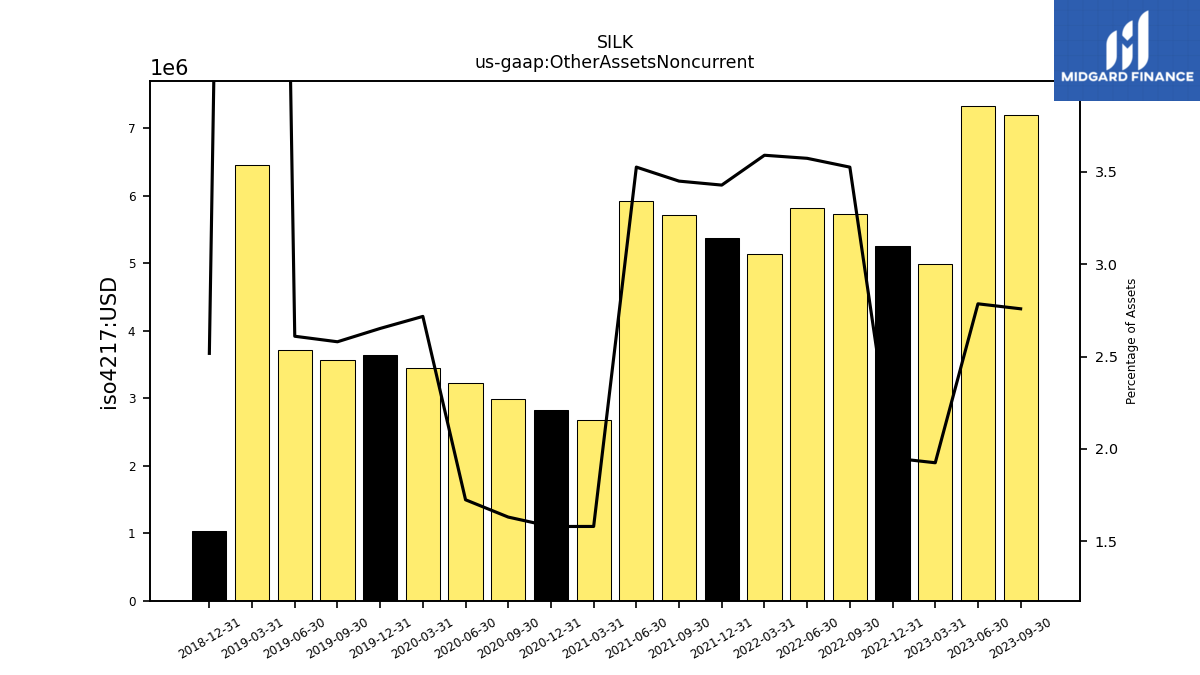
| Other Assets Noncurrent | 6.51 | 6.90 | 7.20 | 7.34 | 5.00 | 5.26 | 5.73 | 5.82 | 5.13 | 5.37 | 5.71 | 5.93 | 2.68 | 2.83 | 3.00 | 3.23 | 3.44 | 3.64 | 3.58 | 3.72 | 6.46 | 1.03 | NA | NA | NA | |
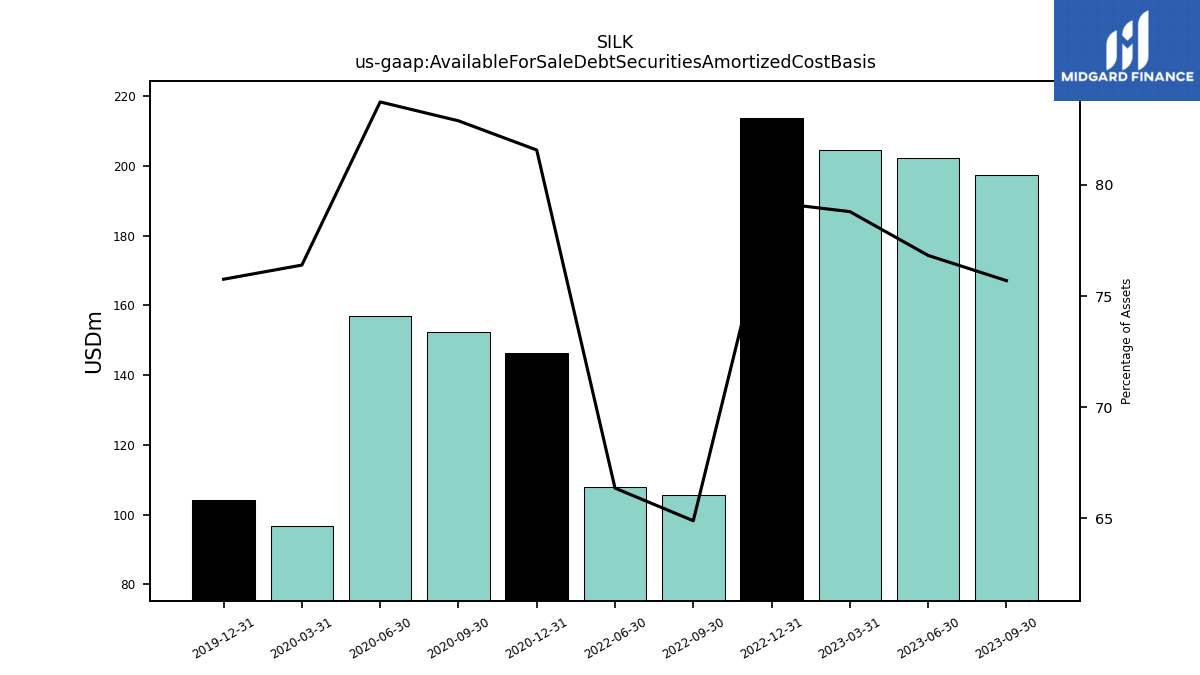
| Available For Sale Debt Securities Amortized Cost Basis | 176.23 | 190.13 | 197.46 | 202.34 | 204.56 | 213.64 | 105.47 | 107.98 | NA | NA | NA | NA | NA | 146.27 | 152.37 | 157.02 | 96.83 | 104.09 | NA | NA | NA | NA | NA | NA | NA |
| 2024-03-31 | 2023-12-31 | 2023-09-30 | 2023-06-30 | 2023-03-31 | 2022-12-31 | 2022-09-30 | 2022-06-30 | 2022-03-31 | 2021-12-31 | 2021-09-30 | 2021-06-30 | 2021-03-31 | 2020-12-31 | 2020-09-30 | 2020-06-30 | 2020-03-31 | 2019-12-31 | 2019-09-30 | 2019-06-30 | 2019-03-31 | 2018-12-31 | 2018-09-30 | 2018-06-30 | 2018-03-31 | ||
|---|---|---|---|---|---|---|---|---|---|---|---|---|---|---|---|---|---|---|---|---|---|---|---|---|---|---|
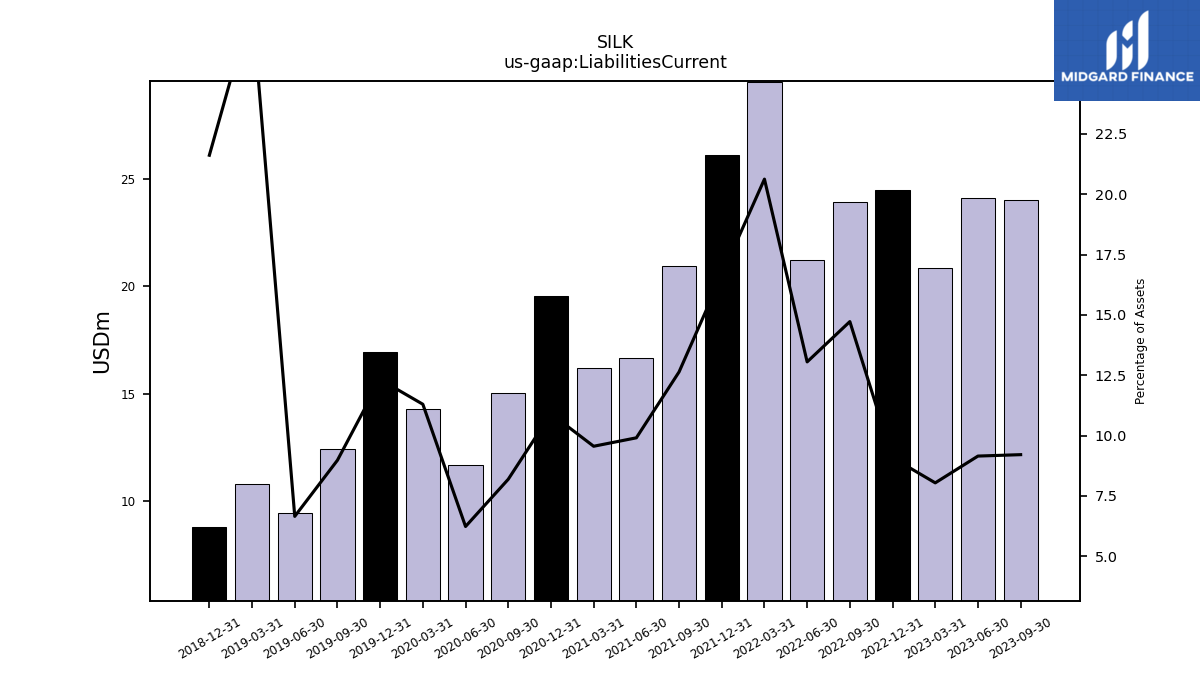
| Liabilities Current | 21.34 | 30.28 | 24.02 | 24.10 | 20.87 | 24.49 | 23.93 | 21.24 | 29.50 | 26.09 | 20.92 | 16.66 | 16.21 | 19.55 | 15.05 | 11.68 | 14.32 | 16.93 | 12.44 | 9.49 | 10.79 | 8.84 | NA | NA | NA | |
| Accounts Payable Current | 2.97 | 5.68 | 5.09 | 5.34 | 5.27 | 2.52 | 4.31 | 3.67 | 2.93 | 2.38 | 4.91 | 1.96 | 2.92 | 2.60 | 2.05 | 2.54 | 3.19 | 1.90 | 1.97 | 1.19 | 3.13 | 1.25 | NA | NA | NA | |
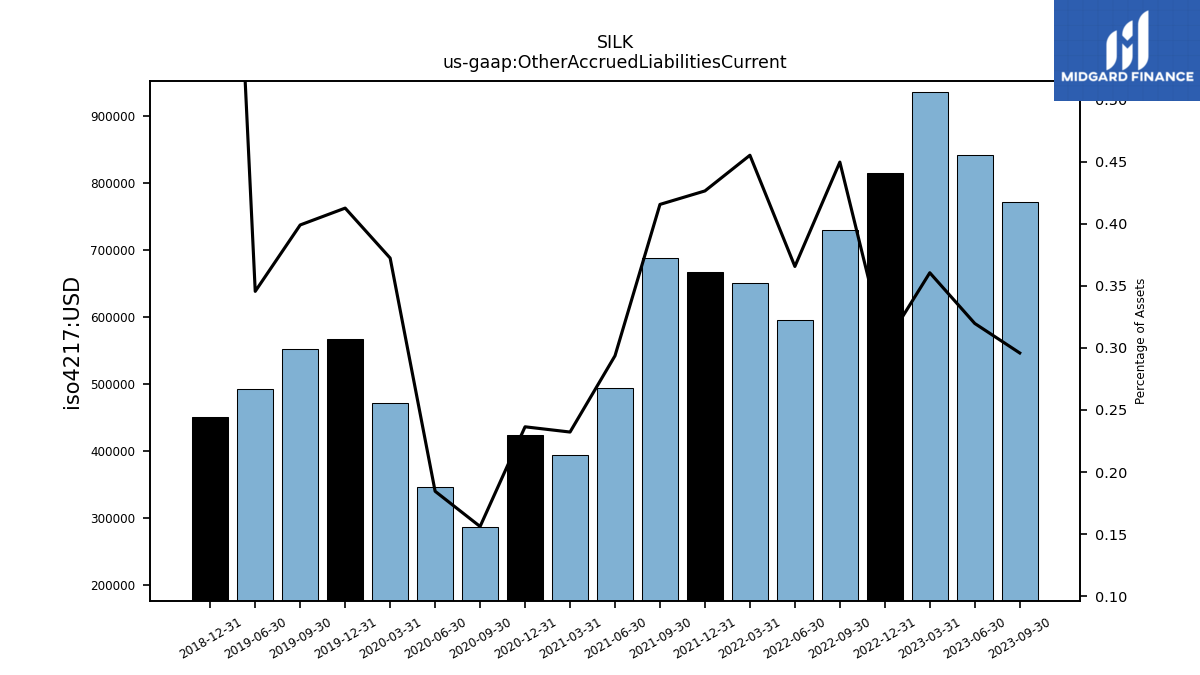
| Other Accrued Liabilities Current | 0.69 | 2.29 | 0.77 | 0.84 | 0.94 | 0.81 | 0.73 | 0.59 | 0.65 | 0.67 | 0.69 | 0.49 | 0.39 | 0.42 | 0.29 | 0.35 | 0.47 | 0.57 | 0.55 | 0.49 | NA | 0.45 | NA | NA | NA | |
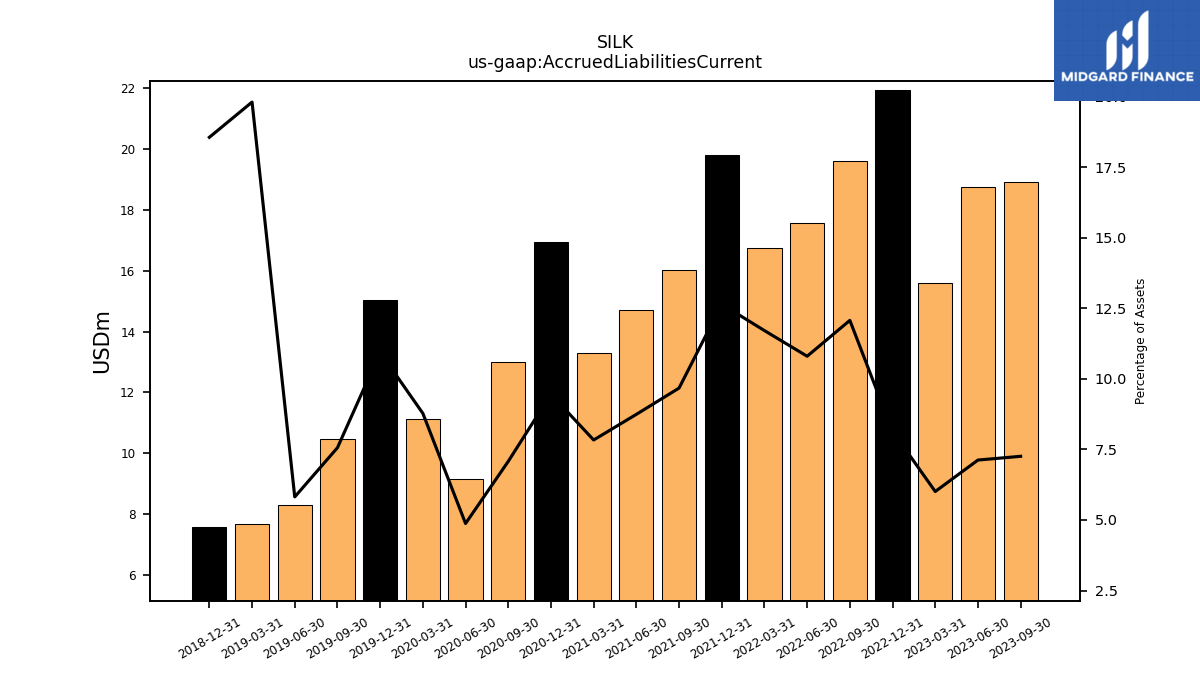
| Accrued Liabilities Current | 18.37 | 24.61 | 18.93 | 18.76 | 15.60 | 21.96 | 19.62 | 17.57 | 16.74 | 19.80 | 16.01 | 14.71 | 13.29 | 16.96 | 13.01 | 9.14 | 11.12 | 15.03 | 10.48 | 8.30 | 7.66 | 7.59 | NA | NA | NA | |
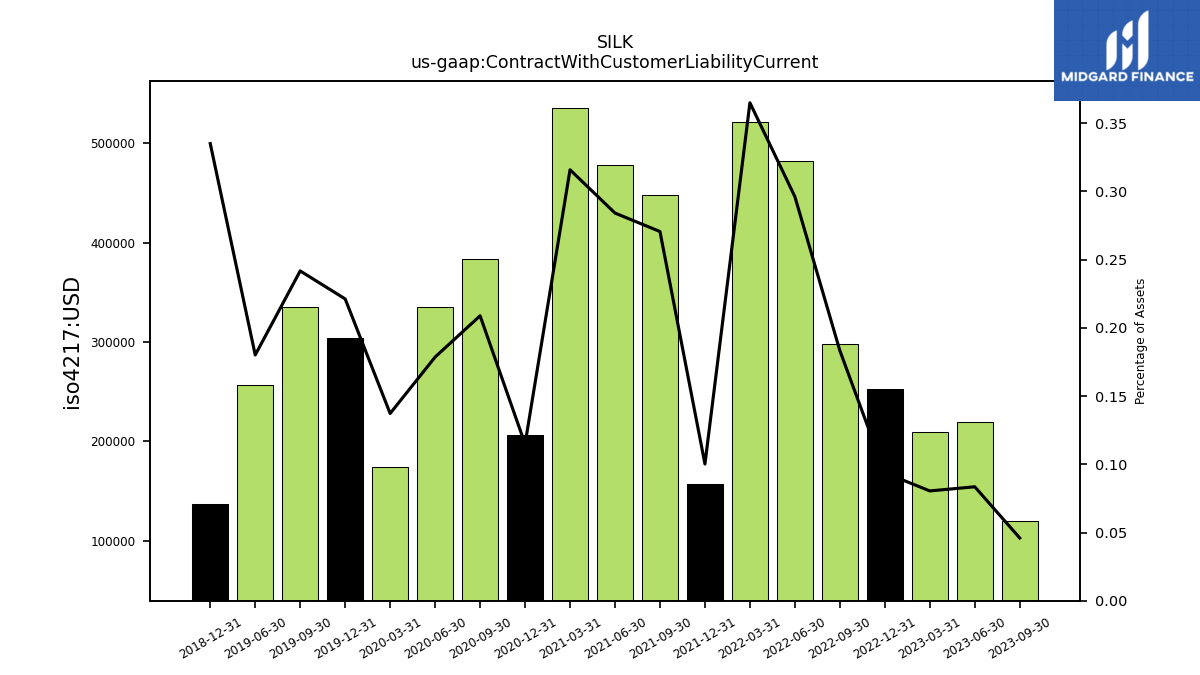
| Contract With Customer Liability Current | 0.32 | 0.26 | 0.12 | 0.22 | 0.21 | 0.25 | 0.30 | 0.48 | 0.52 | 0.16 | 0.45 | 0.48 | 0.54 | 0.21 | 0.38 | 0.34 | 0.17 | 0.30 | 0.34 | 0.26 | NA | 0.14 | NA | NA | NA |
| 2024-03-31 | 2023-12-31 | 2023-09-30 | 2023-06-30 | 2023-03-31 | 2022-12-31 | 2022-09-30 | 2022-06-30 | 2022-03-31 | 2021-12-31 | 2021-09-30 | 2021-06-30 | 2021-03-31 | 2020-12-31 | 2020-09-30 | 2020-06-30 | 2020-03-31 | 2019-12-31 | 2019-09-30 | 2019-06-30 | 2019-03-31 | 2018-12-31 | 2018-09-30 | 2018-06-30 | 2018-03-31 | ||
|---|---|---|---|---|---|---|---|---|---|---|---|---|---|---|---|---|---|---|---|---|---|---|---|---|---|---|
| Long Term Debt | 75.89 | 75.63 | 75.36 | 75.10 | 74.85 | 74.60 | 74.34 | 74.03 | 48.73 | 48.69 | 48.65 | 48.61 | 48.57 | 48.53 | 45.16 | NA | NA | NA | 44.78 | 44.69 | 44.60 | NA | NA | NA | NA | |
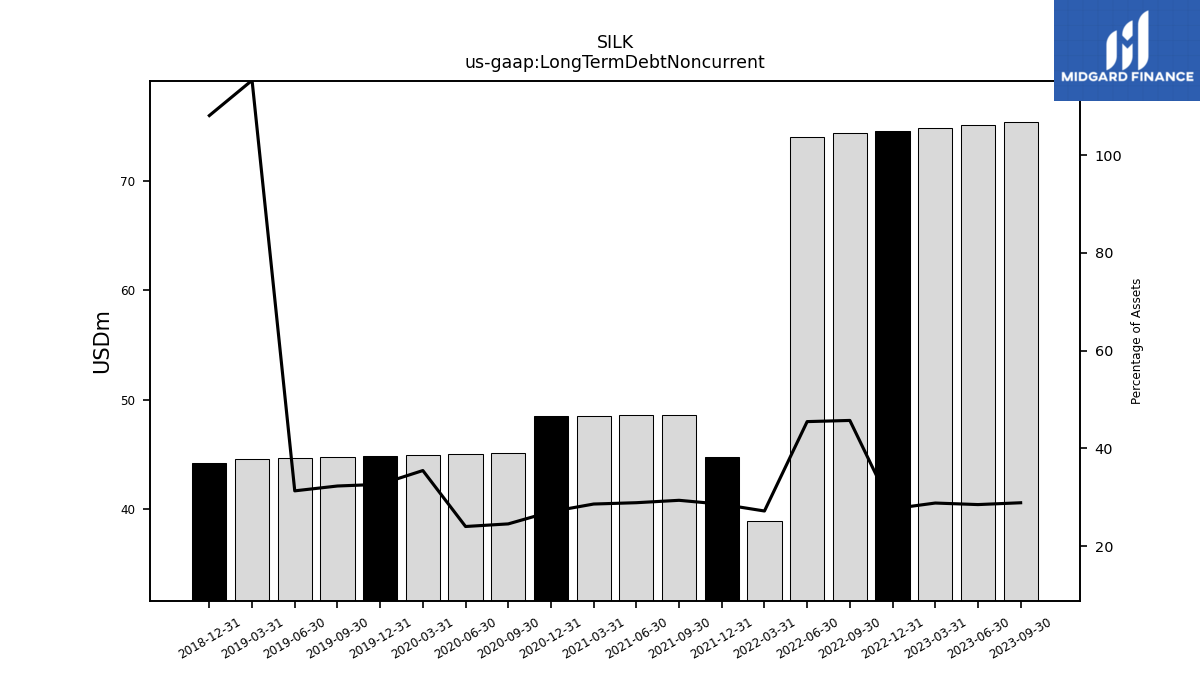
| Long Term Debt Noncurrent | 75.89 | 75.63 | 75.36 | 75.10 | 74.85 | 74.60 | 74.34 | 74.03 | 38.90 | 44.79 | 48.65 | 48.61 | 48.57 | 48.53 | 45.16 | 45.07 | 44.97 | 44.88 | 44.78 | 44.69 | 44.60 | 44.20 | NA | NA | NA | |
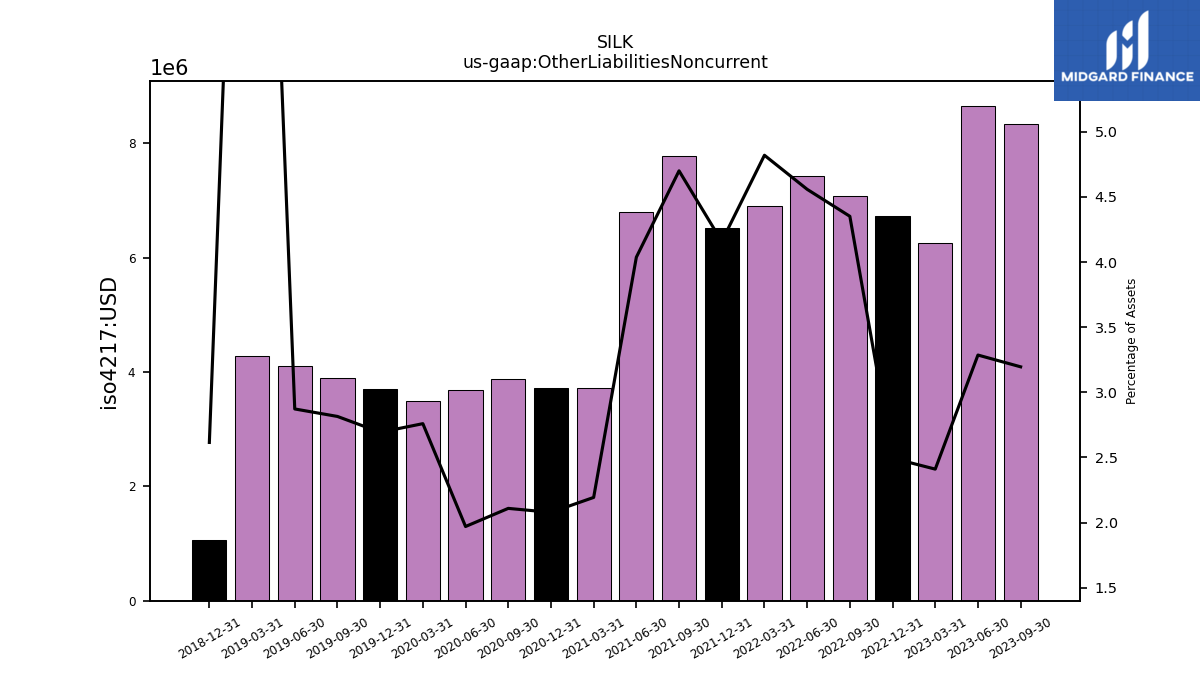
| Other Liabilities Noncurrent | 7.81 | 8.25 | 8.34 | 8.65 | 6.26 | 6.73 | 7.07 | 7.42 | 6.89 | 6.51 | 7.78 | 6.79 | 3.72 | 3.73 | 3.88 | 3.69 | 3.50 | 3.70 | 3.90 | 4.10 | 4.29 | 1.07 | NA | NA | NA | |
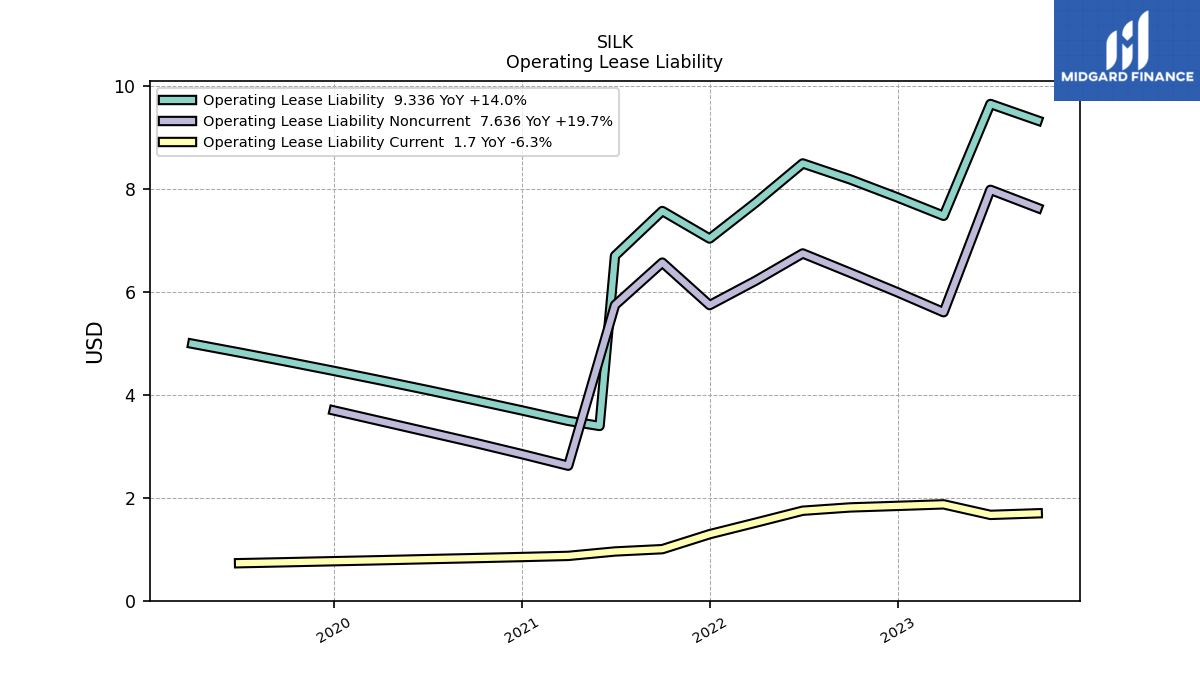
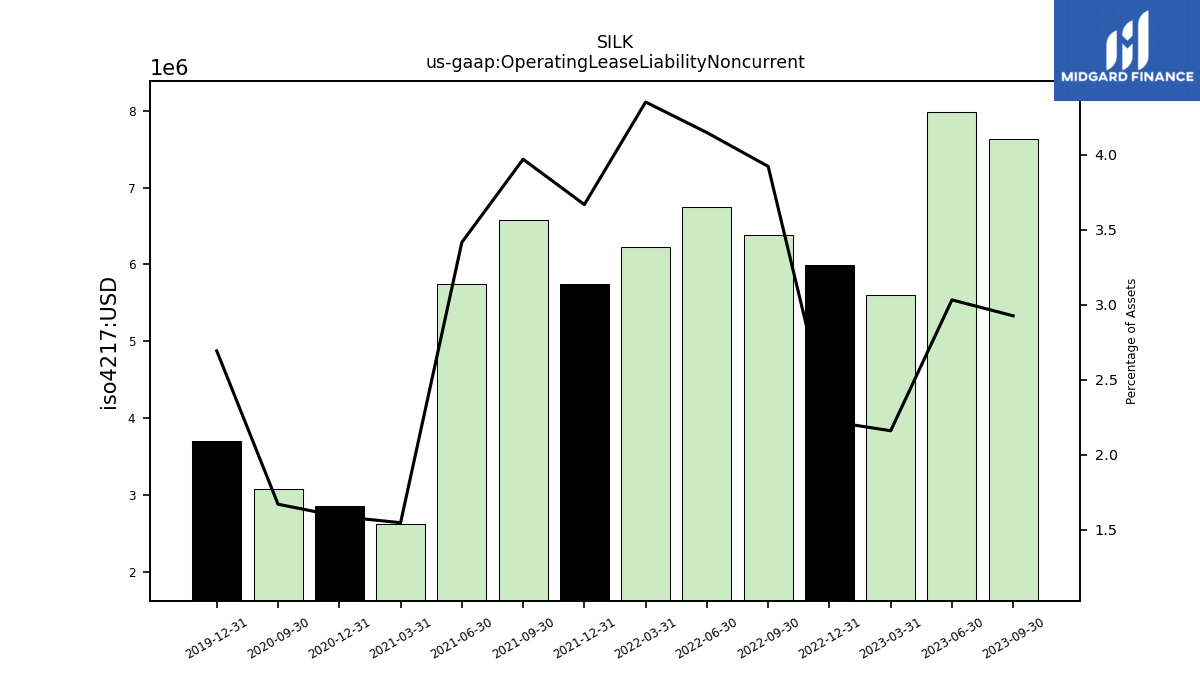
| Operating Lease Liability Noncurrent | 6.97 | 7.30 | 7.64 | 7.99 | 5.61 | 6.00 | 6.38 | 6.75 | 6.22 | 5.75 | 6.57 | 5.75 | 2.62 | 2.85 | 3.07 | NA | NA | 3.70 | NA | NA | NA | NA | NA | NA | NA |
| 2024-03-31 | 2023-12-31 | 2023-09-30 | 2023-06-30 | 2023-03-31 | 2022-12-31 | 2022-09-30 | 2022-06-30 | 2022-03-31 | 2021-12-31 | 2021-09-30 | 2021-06-30 | 2021-03-31 | 2020-12-31 | 2020-09-30 | 2020-06-30 | 2020-03-31 | 2019-12-31 | 2019-09-30 | 2019-06-30 | 2019-03-31 | 2018-12-31 | 2018-09-30 | 2018-06-30 | 2018-03-31 | ||
|---|---|---|---|---|---|---|---|---|---|---|---|---|---|---|---|---|---|---|---|---|---|---|---|---|---|---|
| Stockholders Equity | 147.28 | 151.15 | 153.14 | 155.50 | 157.61 | 163.88 | 57.20 | 60.03 | 67.71 | 79.24 | 88.18 | 96.14 | 101.15 | 107.50 | 119.74 | 127.08 | 63.96 | 71.89 | 77.44 | 84.38 | -158.07 | -134.55 | -119.17 | -110.63 | -103.45 | |
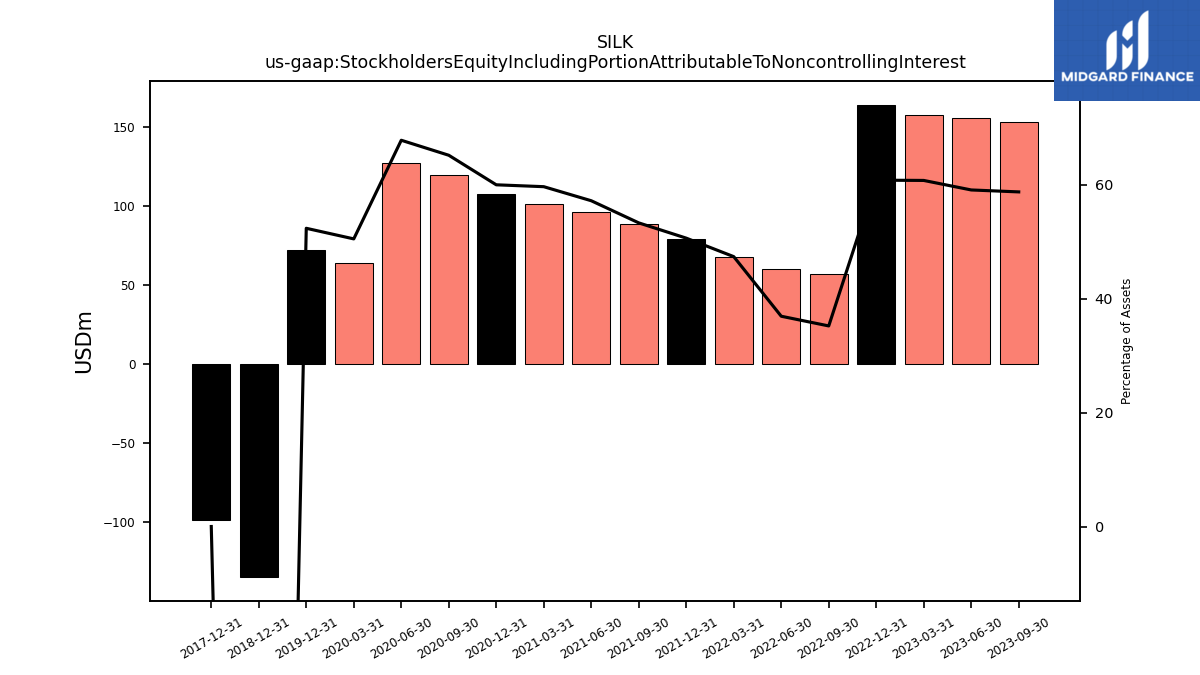
| Stockholders Equity Including Portion Attributable To Noncontrolling Interest | 147.28 | 151.15 | 153.14 | 155.50 | 157.61 | 163.88 | 57.20 | 60.03 | 67.71 | 79.24 | 88.18 | 96.14 | 101.15 | 107.50 | 119.74 | 127.08 | 63.96 | 71.89 | NA | NA | NA | -134.55 | NA | NA | NA | |
| Common Stock Value | 0.04 | 0.04 | 0.04 | 0.04 | 0.04 | 0.04 | 0.04 | 0.04 | 0.04 | 0.04 | 0.04 | 0.04 | 0.03 | 0.03 | 0.03 | 0.03 | 0.03 | 0.03 | 0.03 | 0.03 | 0.00 | 0.00 | NA | NA | NA | |
| Additional Paid In Capital | 560.85 | 550.50 | 539.83 | 529.45 | 517.66 | 507.71 | 388.45 | 380.77 | 373.05 | 367.91 | 362.15 | 356.22 | 350.70 | 346.32 | 341.69 | 338.55 | 264.95 | 263.38 | 260.65 | 259.57 | 5.19 | 4.56 | NA | NA | NA | |
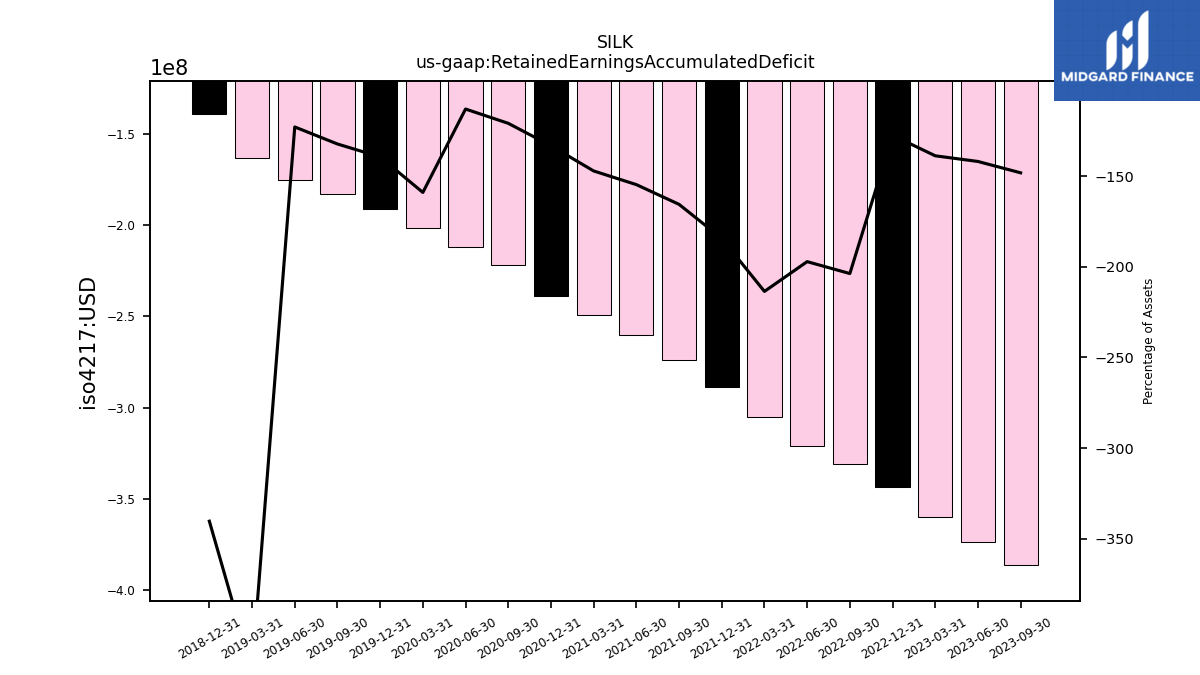
| Retained Earnings Accumulated Deficit | -413.59 | -399.45 | -386.44 | -373.66 | -360.17 | -343.71 | -331.10 | -320.78 | -305.38 | -288.70 | -274.01 | -260.12 | -249.59 | -238.89 | -222.13 | -211.82 | -201.47 | -191.53 | -183.24 | -175.23 | -163.27 | -139.11 | NA | NA | NA | |
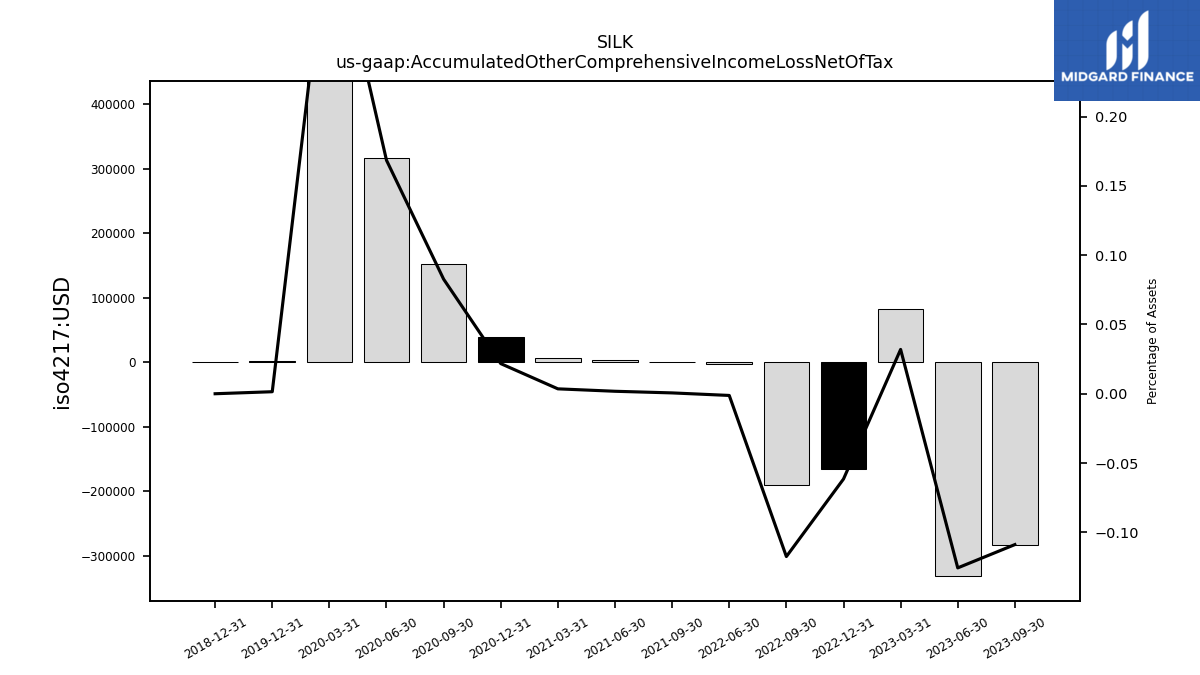
| Accumulated Other Comprehensive Income Loss Net Of Tax | -0.02 | 0.07 | -0.28 | -0.33 | 0.08 | -0.17 | -0.19 | -0.00 | NA | NA | 0.00 | 0.00 | 0.01 | 0.04 | 0.15 | 0.32 | 0.44 | 0.00 | NA | NA | NA | 0.00 | NA | NA | NA |
| 2024-03-31 | 2023-12-31 | 2023-09-30 | 2023-06-30 | 2023-03-31 | 2022-12-31 | 2022-09-30 | 2022-06-30 | 2022-03-31 | 2021-12-31 | 2021-09-30 | 2021-06-30 | 2021-03-31 | 2020-12-31 | 2020-09-30 | 2020-06-30 | 2020-03-31 | 2019-12-31 | 2019-09-30 | 2019-06-30 | 2019-03-31 | 2018-12-31 | 2018-09-30 | 2018-06-30 | 2018-03-31 | ||
|---|---|---|---|---|---|---|---|---|---|---|---|---|---|---|---|---|---|---|---|---|---|---|---|---|---|---|
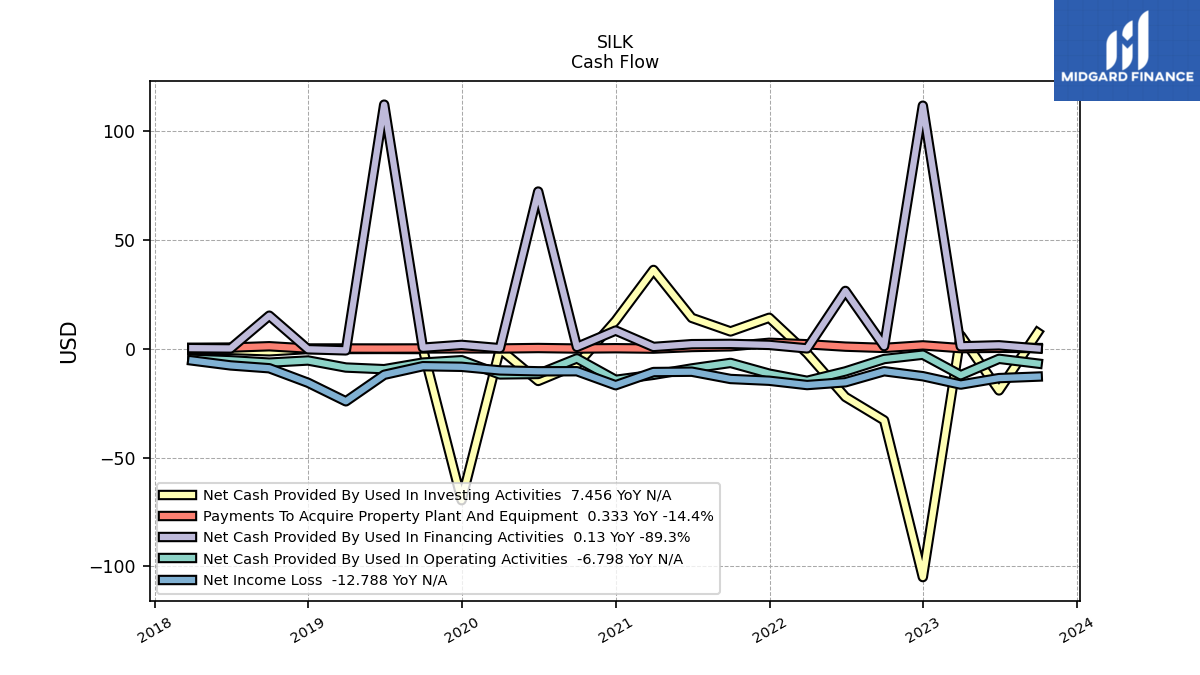
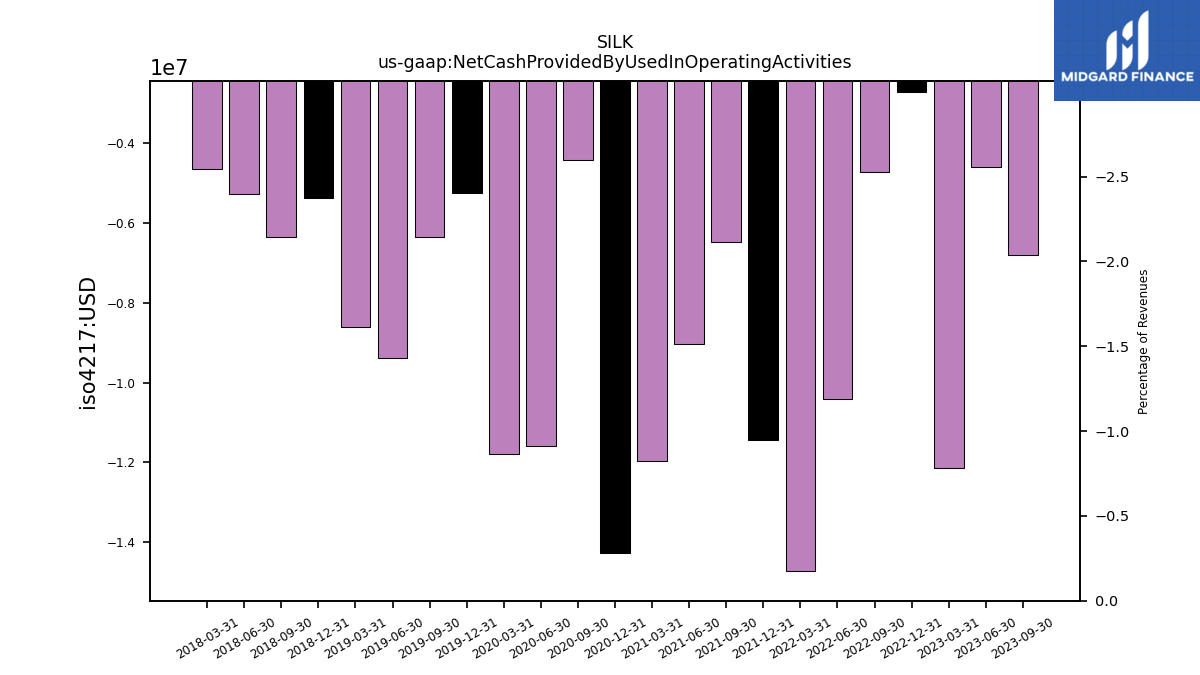
| Net Cash Provided By Used In Operating Activities | -15.32 | -8.45 | -6.80 | -4.62 | -12.15 | -2.72 | -4.73 | -10.41 | -14.72 | -11.43 | -6.50 | -9.04 | -11.97 | -14.27 | -4.42 | -11.58 | -11.79 | -5.26 | -6.35 | -9.38 | -8.62 | -5.39 | -6.37 | -5.29 | -4.65 | |
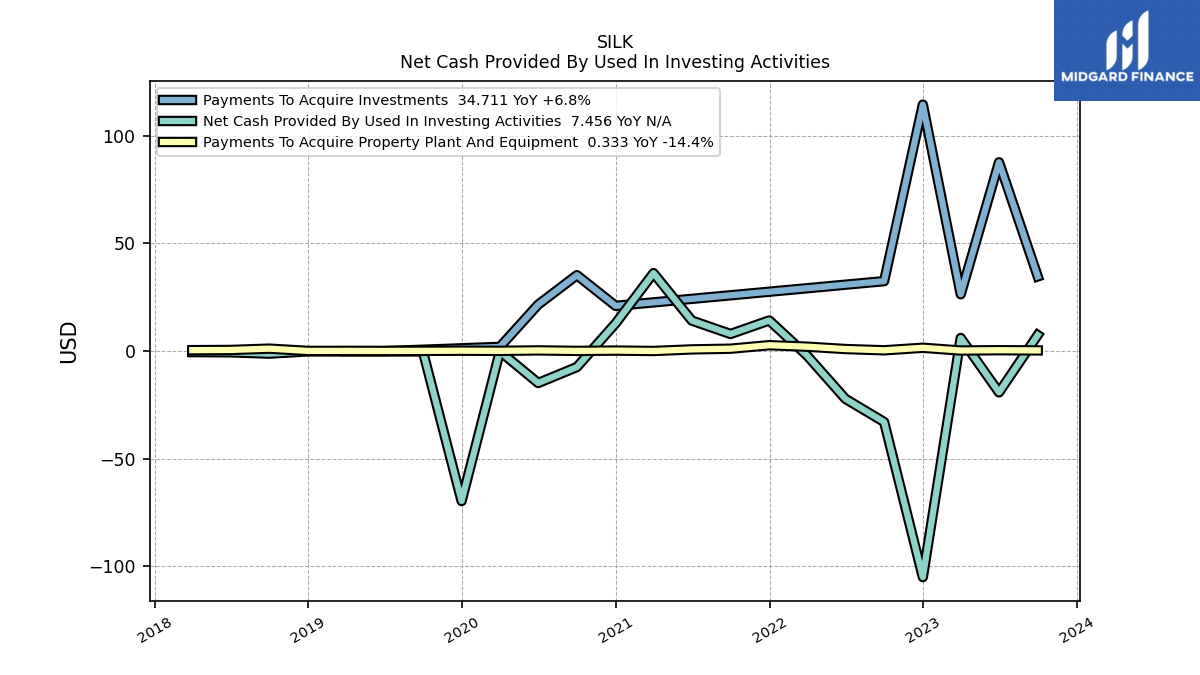
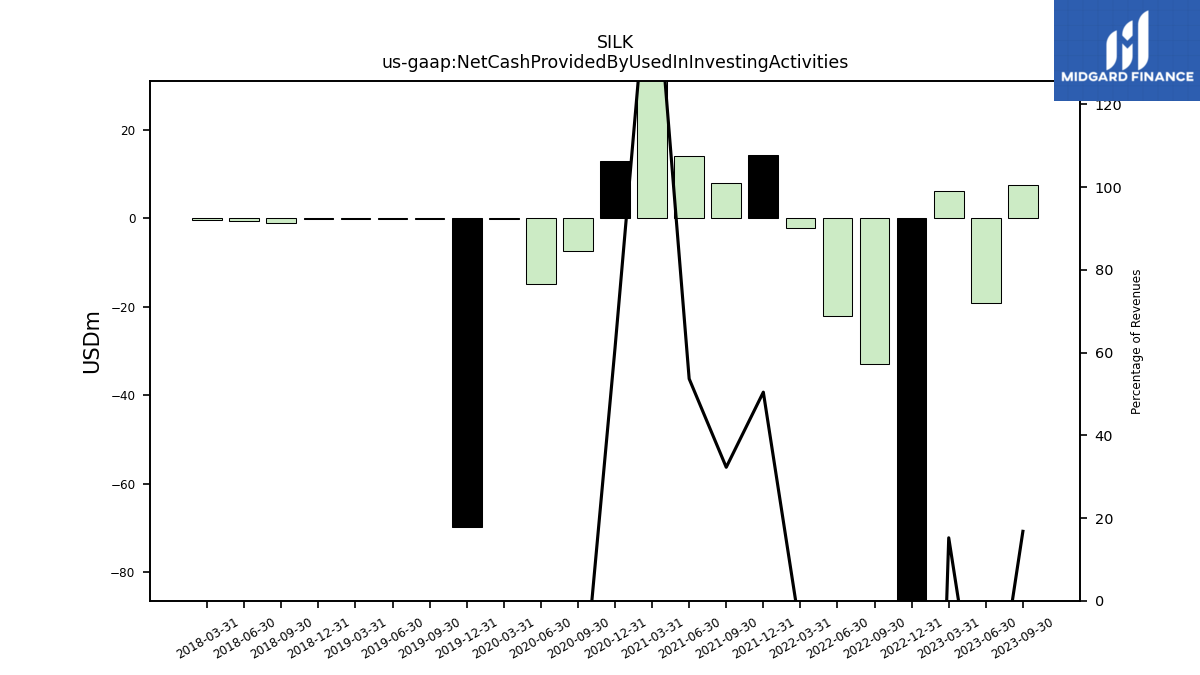
| Net Cash Provided By Used In Investing Activities | 17.74 | -1.58 | 7.46 | -19.16 | 6.11 | -104.95 | -32.90 | -22.15 | -2.07 | 14.25 | 7.97 | 14.19 | 36.23 | 12.90 | -7.39 | -14.80 | -0.11 | -69.62 | -0.13 | -0.09 | -0.12 | -0.10 | -1.16 | -0.55 | -0.46 | |
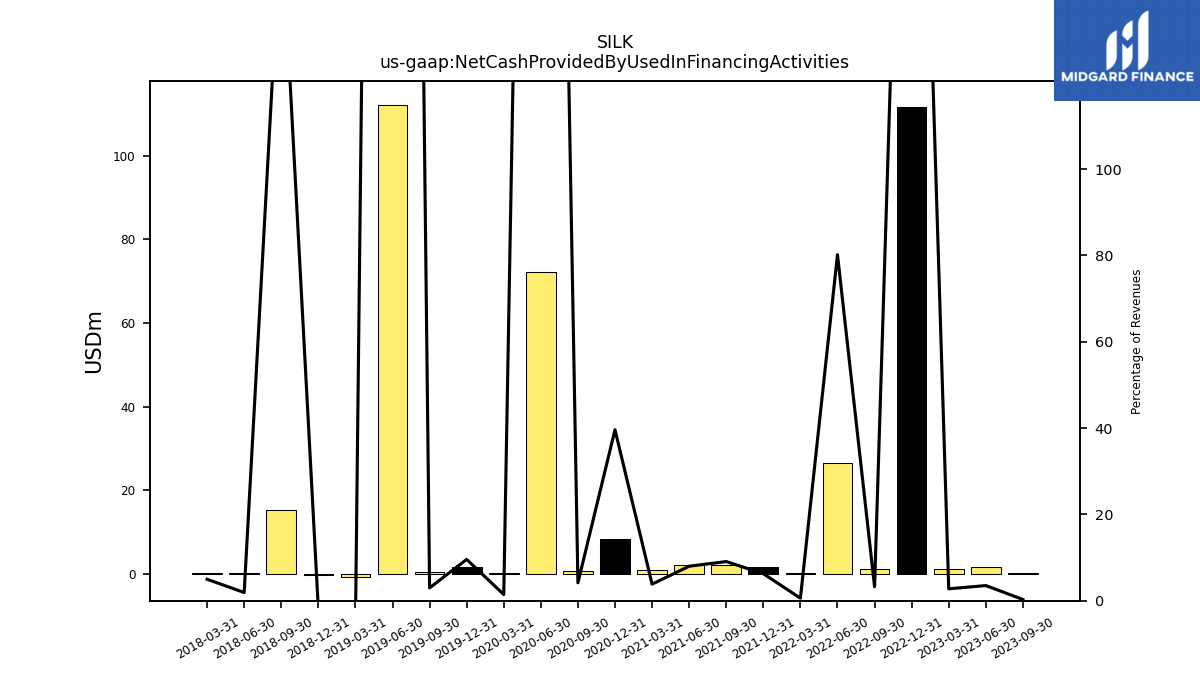
| Net Cash Provided By Used In Financing Activities | NA | 1.05 | 0.13 | 1.59 | 1.11 | 111.73 | 1.21 | 26.59 | 0.17 | 1.77 | 2.24 | 2.12 | 0.85 | 8.37 | 0.83 | 72.27 | 0.27 | 1.78 | 0.51 | 112.21 | -0.74 | -0.23 | 15.22 | 0.15 | 0.28 |
| 2024-03-31 | 2023-12-31 | 2023-09-30 | 2023-06-30 | 2023-03-31 | 2022-12-31 | 2022-09-30 | 2022-06-30 | 2022-03-31 | 2021-12-31 | 2021-09-30 | 2021-06-30 | 2021-03-31 | 2020-12-31 | 2020-09-30 | 2020-06-30 | 2020-03-31 | 2019-12-31 | 2019-09-30 | 2019-06-30 | 2019-03-31 | 2018-12-31 | 2018-09-30 | 2018-06-30 | 2018-03-31 | ||
|---|---|---|---|---|---|---|---|---|---|---|---|---|---|---|---|---|---|---|---|---|---|---|---|---|---|---|
| Net Cash Provided By Used In Operating Activities | -15.32 | -8.45 | -6.80 | -4.62 | -12.15 | -2.72 | -4.73 | -10.41 | -14.72 | -11.43 | -6.50 | -9.04 | -11.97 | -14.27 | -4.42 | -11.58 | -11.79 | -5.26 | -6.35 | -9.38 | -8.62 | -5.39 | -6.37 | -5.29 | -4.65 | |
| Net Income Loss | -14.14 | -13.01 | -12.79 | -13.48 | -16.46 | -12.61 | -10.32 | -15.40 | -16.68 | -14.69 | -13.88 | -10.54 | -10.69 | -16.76 | -10.31 | -10.35 | -9.94 | -8.29 | -8.01 | -11.96 | -24.16 | -15.62 | -8.95 | -7.65 | -5.41 | |
| Profit Loss | -14.14 | -13.01 | -12.79 | -13.48 | -16.46 | -12.61 | -10.32 | -15.40 | -16.68 | -14.69 | -13.88 | -10.54 | -10.69 | -16.76 | -10.31 | -10.35 | -9.94 | -8.29 | -8.01 | -11.96 | -24.16 | -15.62 | -8.95 | -7.65 | -5.41 | |
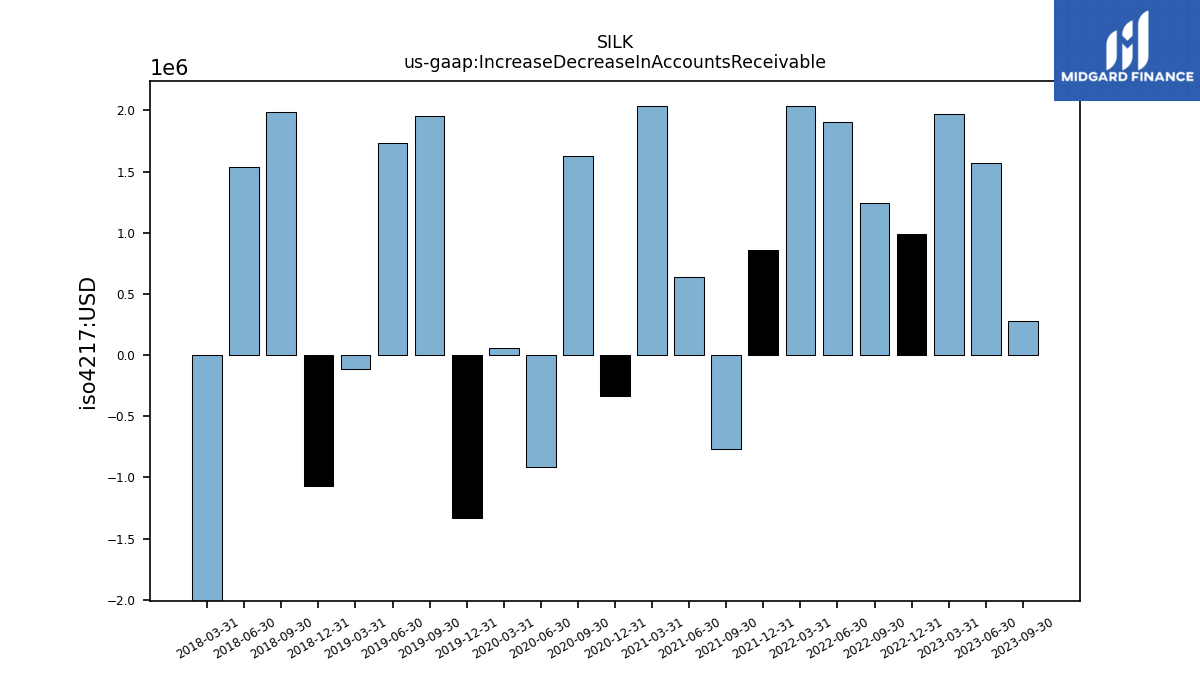
| Increase Decrease In Accounts Receivable | 3.63 | 1.79 | 0.28 | 1.57 | 1.97 | 0.99 | 1.24 | 1.91 | 2.04 | 0.86 | -0.77 | 0.64 | 2.04 | -0.33 | 1.63 | -0.92 | 0.06 | -1.33 | 1.95 | 1.73 | -0.11 | -1.07 | 1.99 | 1.54 | -2.01 | |
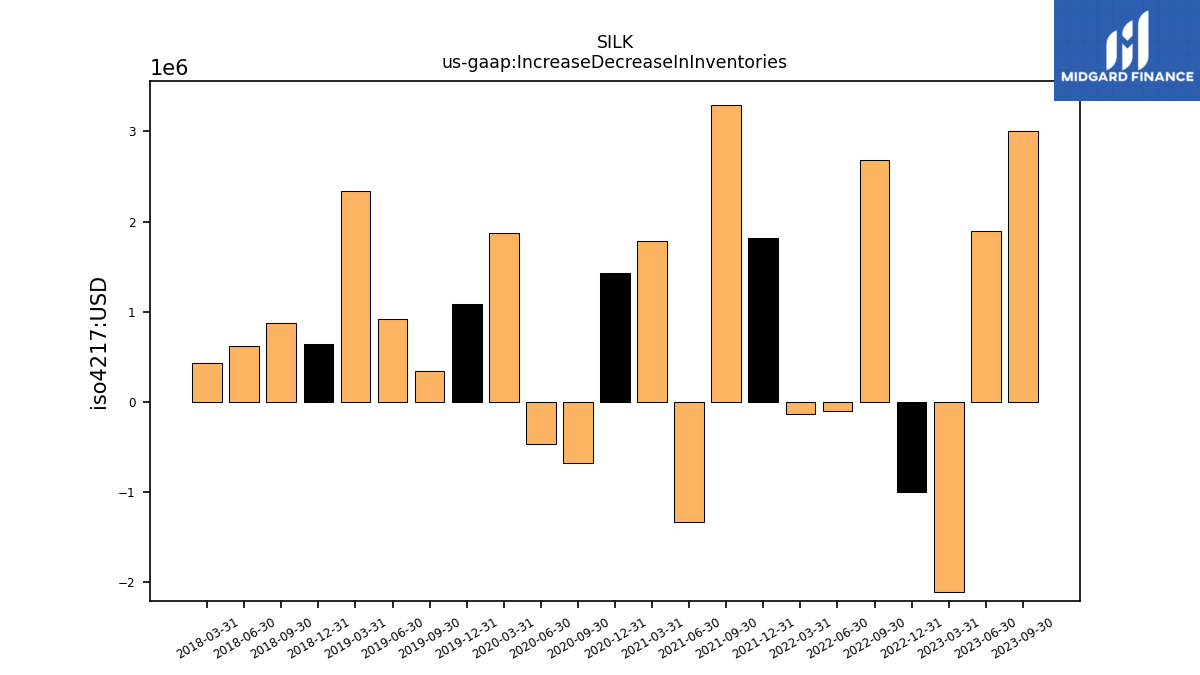
| Increase Decrease In Inventories | 0.79 | 7.99 | 3.01 | 1.90 | -2.11 | -1.00 | 2.69 | -0.10 | -0.13 | 1.82 | 3.29 | -1.33 | 1.79 | 1.43 | -0.67 | -0.47 | 1.87 | 1.09 | 0.35 | 0.92 | 2.34 | 0.64 | 0.87 | 0.62 | 0.43 | |
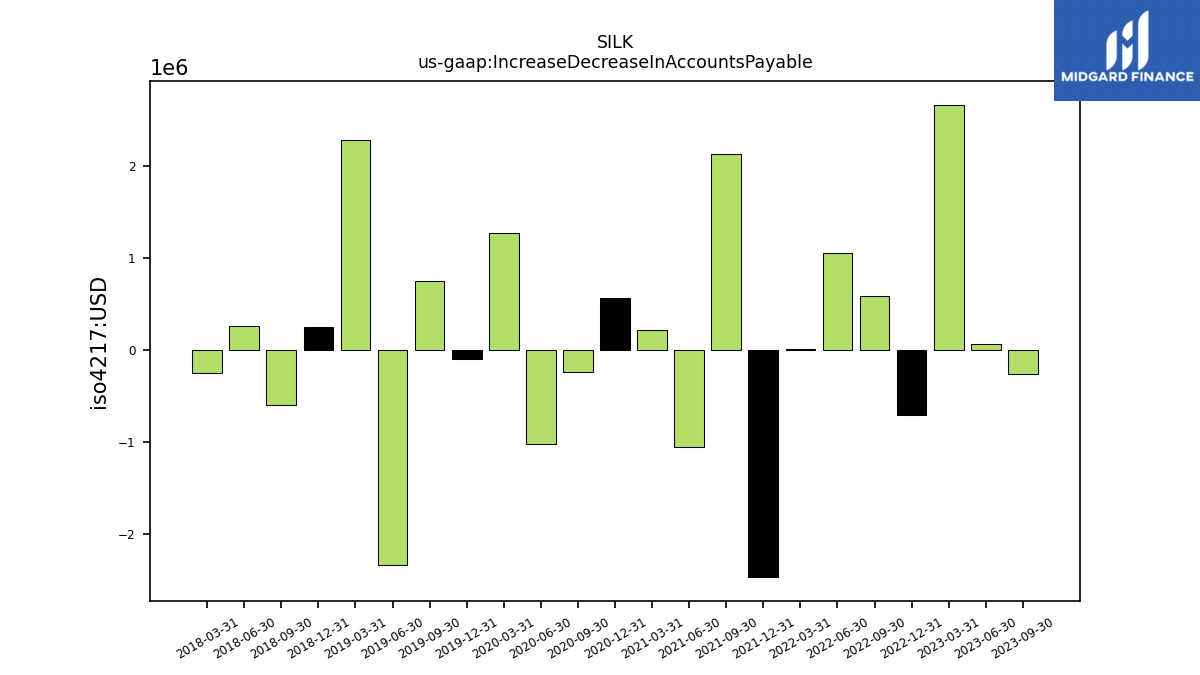
| Increase Decrease In Accounts Payable | -2.94 | 0.59 | -0.26 | 0.07 | 2.67 | -0.70 | 0.59 | 1.06 | 0.02 | -2.46 | 2.14 | -1.05 | 0.22 | 0.56 | -0.23 | -1.01 | 1.27 | -0.10 | 0.76 | -2.33 | 2.29 | 0.26 | -0.59 | 0.27 | -0.24 | |
| Share Based Compensation | 10.36 | 9.61 | 10.25 | 10.20 | 8.84 | 7.54 | 6.34 | 6.16 | 4.98 | 3.98 | 3.69 | 3.41 | 3.53 | 2.27 | 2.01 | 1.65 | 1.29 | 0.95 | 0.92 | 0.84 | 0.26 | 0.23 | 0.19 | 0.33 | 0.16 |
| 2024-03-31 | 2023-12-31 | 2023-09-30 | 2023-06-30 | 2023-03-31 | 2022-12-31 | 2022-09-30 | 2022-06-30 | 2022-03-31 | 2021-12-31 | 2021-09-30 | 2021-06-30 | 2021-03-31 | 2020-12-31 | 2020-09-30 | 2020-06-30 | 2020-03-31 | 2019-12-31 | 2019-09-30 | 2019-06-30 | 2019-03-31 | 2018-12-31 | 2018-09-30 | 2018-06-30 | 2018-03-31 | ||
|---|---|---|---|---|---|---|---|---|---|---|---|---|---|---|---|---|---|---|---|---|---|---|---|---|---|---|
| Net Cash Provided By Used In Investing Activities | 17.74 | -1.58 | 7.46 | -19.16 | 6.11 | -104.95 | -32.90 | -22.15 | -2.07 | 14.25 | 7.97 | 14.19 | 36.23 | 12.90 | -7.39 | -14.80 | -0.11 | -69.62 | -0.13 | -0.09 | -0.12 | -0.10 | -1.16 | -0.55 | -0.46 | |
| Payments To Acquire Property Plant And Equipment | 0.39 | 0.45 | 0.33 | 0.43 | 0.29 | 1.57 | 0.39 | 0.98 | 2.07 | 2.75 | 1.13 | 0.81 | 0.07 | 0.26 | 0.11 | 0.34 | 0.13 | 0.20 | 0.13 | 0.09 | 0.12 | 0.11 | 1.16 | 0.55 | 0.46 | |
| Payments To Acquire Investments | 43.87 | 26.13 | 34.71 | 87.72 | 26.41 | 114.48 | 32.51 | NA | NA | NA | NA | NA | NA | 21.02 | 35.28 | 21.63 | 1.97 | NA | NA | 0.00 | 0.00 | NA | NA | NA | NA |
| 2024-03-31 | 2023-12-31 | 2023-09-30 | 2023-06-30 | 2023-03-31 | 2022-12-31 | 2022-09-30 | 2022-06-30 | 2022-03-31 | 2021-12-31 | 2021-09-30 | 2021-06-30 | 2021-03-31 | 2020-12-31 | 2020-09-30 | 2020-06-30 | 2020-03-31 | 2019-12-31 | 2019-09-30 | 2019-06-30 | 2019-03-31 | 2018-12-31 | 2018-09-30 | 2018-06-30 | 2018-03-31 | ||
|---|---|---|---|---|---|---|---|---|---|---|---|---|---|---|---|---|---|---|---|---|---|---|---|---|---|---|
| Net Cash Provided By Used In Financing Activities | NA | 1.05 | 0.13 | 1.59 | 1.11 | 111.73 | 1.21 | 26.59 | 0.17 | 1.77 | 2.24 | 2.12 | 0.85 | 8.37 | 0.83 | 72.27 | 0.27 | 1.78 | 0.51 | 112.21 | -0.74 | -0.23 | 15.22 | 0.15 | 0.28 |
| 2024-03-31 | 2023-12-31 | 2023-09-30 | 2023-06-30 | 2023-03-31 | 2022-12-31 | 2022-09-30 | 2022-06-30 | 2022-03-31 | 2021-12-31 | 2021-09-30 | 2021-06-30 | 2021-03-31 | 2020-12-31 | 2020-09-30 | 2020-06-30 | 2020-03-31 | 2019-12-31 | 2019-09-30 | 2019-06-30 | 2019-03-31 | 2018-12-31 | 2018-09-30 | 2018-06-30 | 2018-03-31 | ||
|---|---|---|---|---|---|---|---|---|---|---|---|---|---|---|---|---|---|---|---|---|---|---|---|---|---|---|
| Revenues | 48.48 | 47.27 | 44.44 | 45.30 | 40.13 | 40.07 | 37.37 | 33.17 | 28.02 | 28.27 | 24.70 | 26.46 | 22.05 | 21.13 | 20.07 | 15.09 | 18.93 | 18.63 | 17.03 | 14.93 | 12.77 | 11.47 | 9.61 | 7.77 | 5.71 | |
| Revenue From Contract With Customer Excluding Assessed Tax | 48.48 | 47.27 | 44.44 | 45.30 | 40.13 | 40.07 | 37.37 | 33.17 | 28.02 | 28.27 | 24.70 | 26.46 | 22.05 | 21.13 | 20.07 | 15.09 | 18.93 | 18.63 | 17.03 | 14.93 | 12.77 | 11.47 | 9.61 | 7.77 | 5.71 |


