
| 2024-03-31 | 2023-12-31 | 2023-09-30 | 2023-06-30 | 2023-03-31 | 2022-12-31 | 2022-09-30 | 2022-06-30 | 2022-03-31 | 2021-12-31 | 2021-09-30 | 2021-06-30 | 2021-03-31 | 2020-12-31 | 2020-09-30 | 2020-06-30 | 2020-03-31 | 2019-12-31 | 2019-09-30 | 2019-06-30 | 2019-03-31 | 2018-12-31 | 2018-09-30 | 2018-06-30 | 2018-03-31 | 2017-12-31 | 2017-09-30 | 2017-06-30 | 2017-03-31 | 2016-12-31 | 2016-09-30 | 2016-06-30 | 2016-03-31 | 2015-12-31 | 2015-09-30 | 2015-06-30 | 2015-03-31 | 2014-12-31 | 2014-09-30 | 2014-06-30 | 2014-03-31 | 2013-12-31 | 2013-09-30 | 2013-06-30 | 2013-03-31 | 2012-12-31 | 2012-09-30 | 2012-06-30 | 2012-03-31 | 2011-12-31 | 2011-09-30 | 2011-06-30 | 2011-03-31 | 2010-12-31 | 2010-09-30 | 2010-06-30 | 2010-03-31 | ||
|---|---|---|---|---|---|---|---|---|---|---|---|---|---|---|---|---|---|---|---|---|---|---|---|---|---|---|---|---|---|---|---|---|---|---|---|---|---|---|---|---|---|---|---|---|---|---|---|---|---|---|---|---|---|---|---|---|---|---|
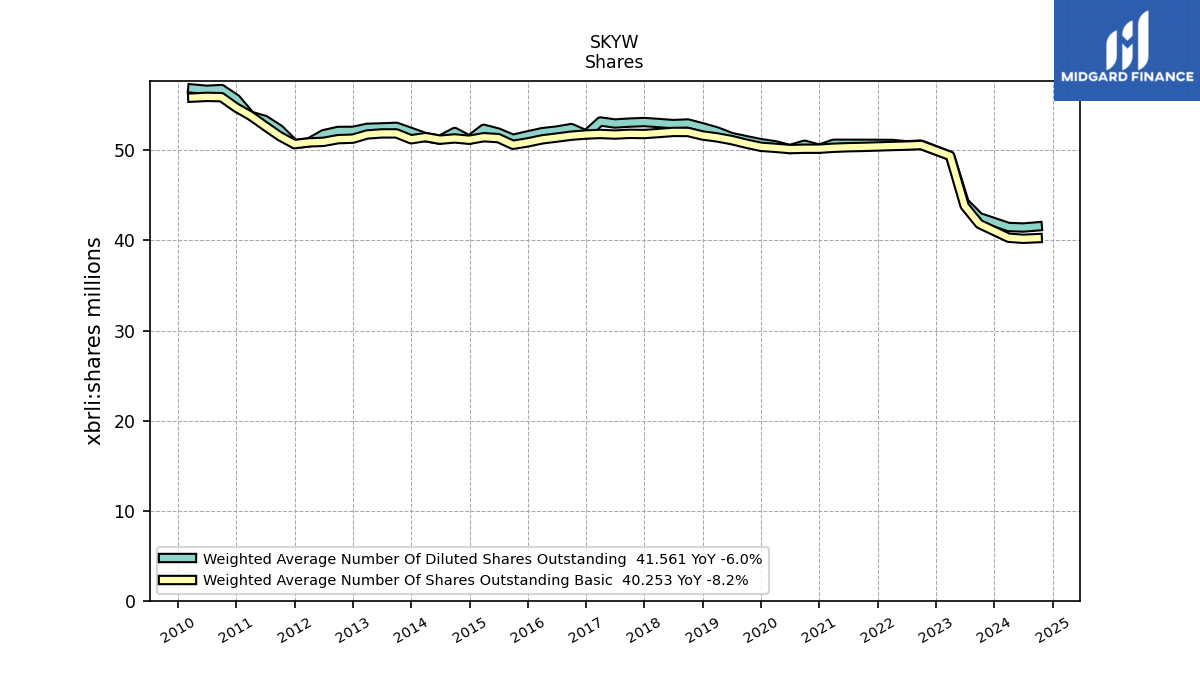
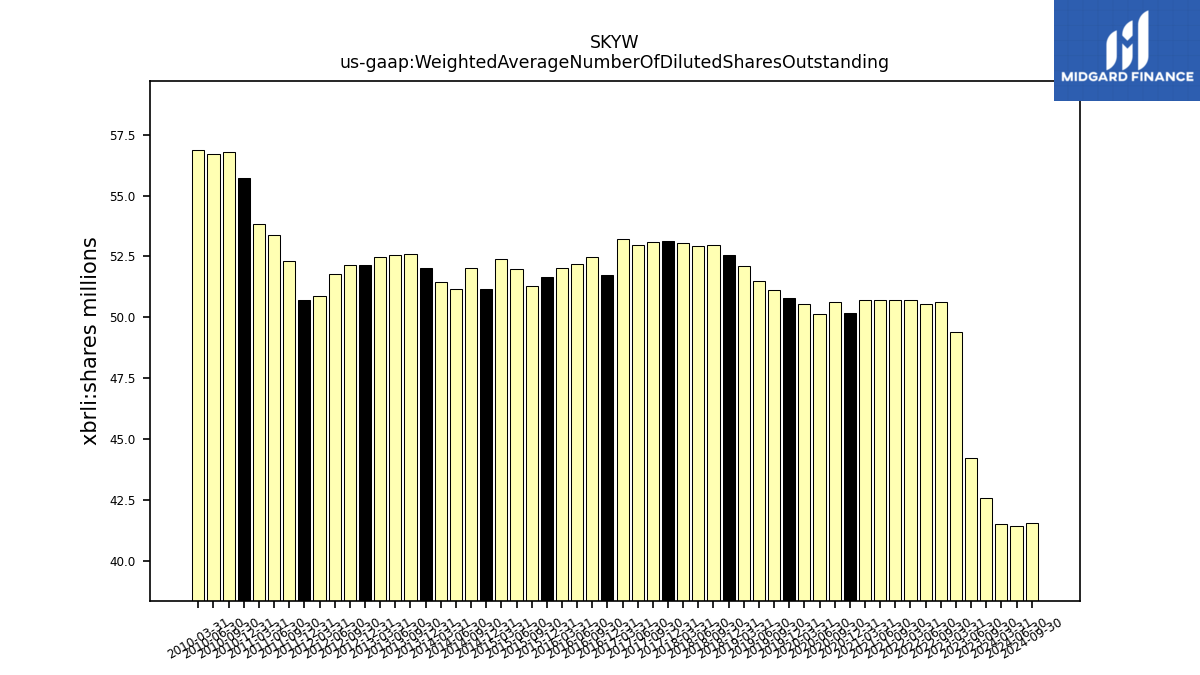
| Weighted Average Number Of Diluted Shares Outstanding | 41.49 | NA | 42.58 | 44.22 | 49.39 | NA | 50.64 | 50.57 | 50.71 | NA | 50.73 | 50.73 | 50.73 | 50.18 | 50.62 | 50.14 | 50.56 | 50.80 | 51.13 | 51.48 | 52.10 | 52.56 | 52.98 | 52.91 | 53.03 | 53.14 | 53.08 | 52.98 | 53.20 | 51.76 | 52.47 | 52.19 | 52.01 | 51.66 | 51.28 | 51.97 | 52.39 | 51.17 | 52.04 | 51.18 | 51.47 | 52.03 | 52.61 | 52.55 | 52.50 | 52.16 | 52.15 | 51.79 | 50.88 | 50.69 | 52.31 | 53.37 | 53.84 | 55.72 | 56.80 | 56.72 | 56.86 | |
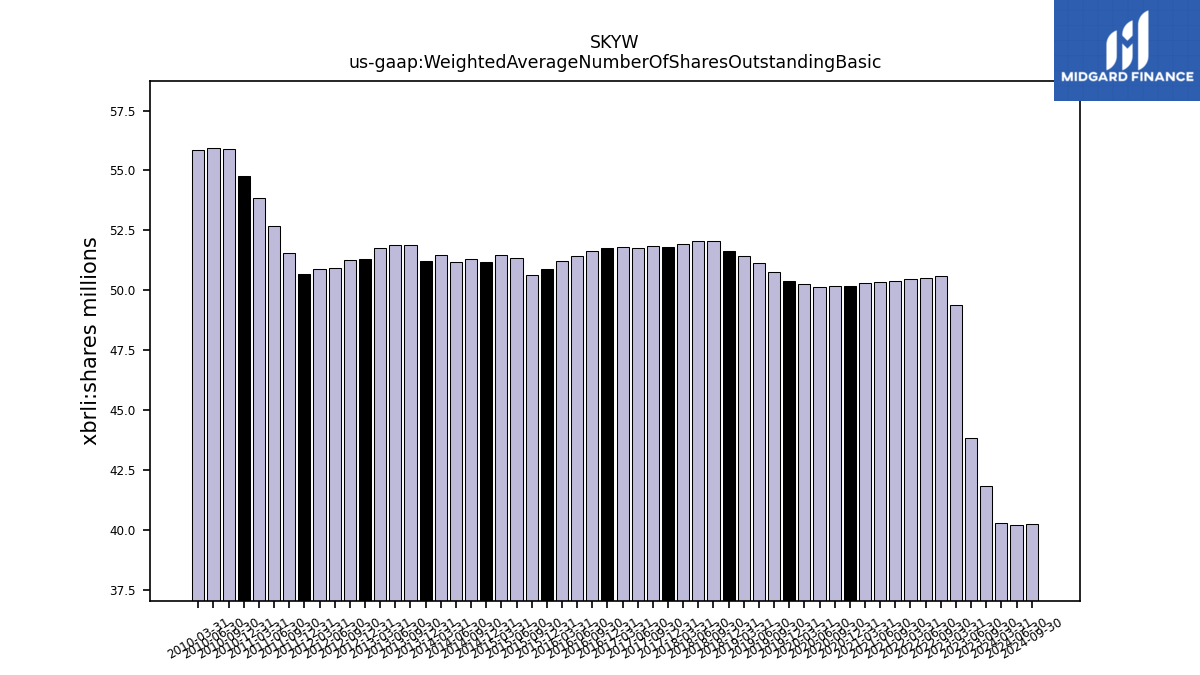
| Weighted Average Number Of Shares Outstanding Basic | 40.30 | NA | 41.83 | 43.84 | 49.39 | NA | 50.59 | 50.52 | 50.48 | NA | 50.38 | 50.35 | 50.29 | 50.18 | 50.18 | 50.14 | 50.28 | 50.40 | 50.75 | 51.15 | 51.44 | 51.65 | 52.04 | 52.05 | 51.92 | 51.81 | 51.83 | 51.75 | 51.82 | 51.76 | 51.63 | 51.42 | 51.22 | 50.88 | 50.62 | 51.36 | 51.46 | 51.17 | 51.32 | 51.18 | 51.47 | 51.23 | 51.88 | 51.88 | 51.76 | 51.30 | 51.24 | 50.94 | 50.88 | 50.69 | 51.57 | 52.70 | 53.84 | 54.75 | 55.90 | 55.94 | 55.85 | |
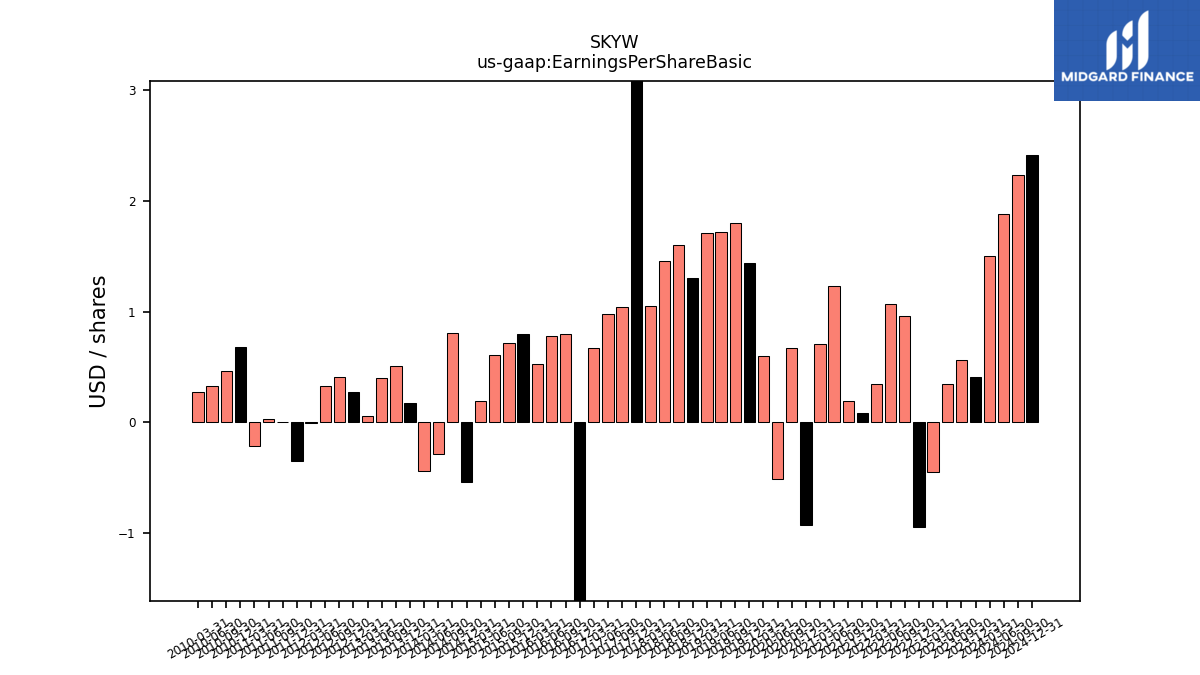
| Earnings Per Share Basic | 1.50 | 0.41 | 0.56 | 0.35 | -0.45 | -0.94 | 0.96 | 1.07 | 0.35 | 0.08 | 0.19 | 1.23 | 0.71 | -0.93 | 0.67 | -0.51 | 0.60 | 1.44 | 1.80 | 1.72 | 1.71 | 1.30 | 1.60 | 1.46 | 1.05 | 5.60 | 1.04 | 0.98 | 0.67 | -5.22 | 0.80 | 0.78 | 0.53 | 0.80 | 0.72 | 0.61 | 0.19 | -0.54 | 0.81 | -0.29 | -0.44 | 0.17 | 0.51 | 0.40 | 0.06 | 0.27 | 0.41 | 0.33 | -0.01 | -0.35 | 0.00 | 0.03 | -0.21 | 0.68 | 0.46 | 0.33 | 0.27 | |
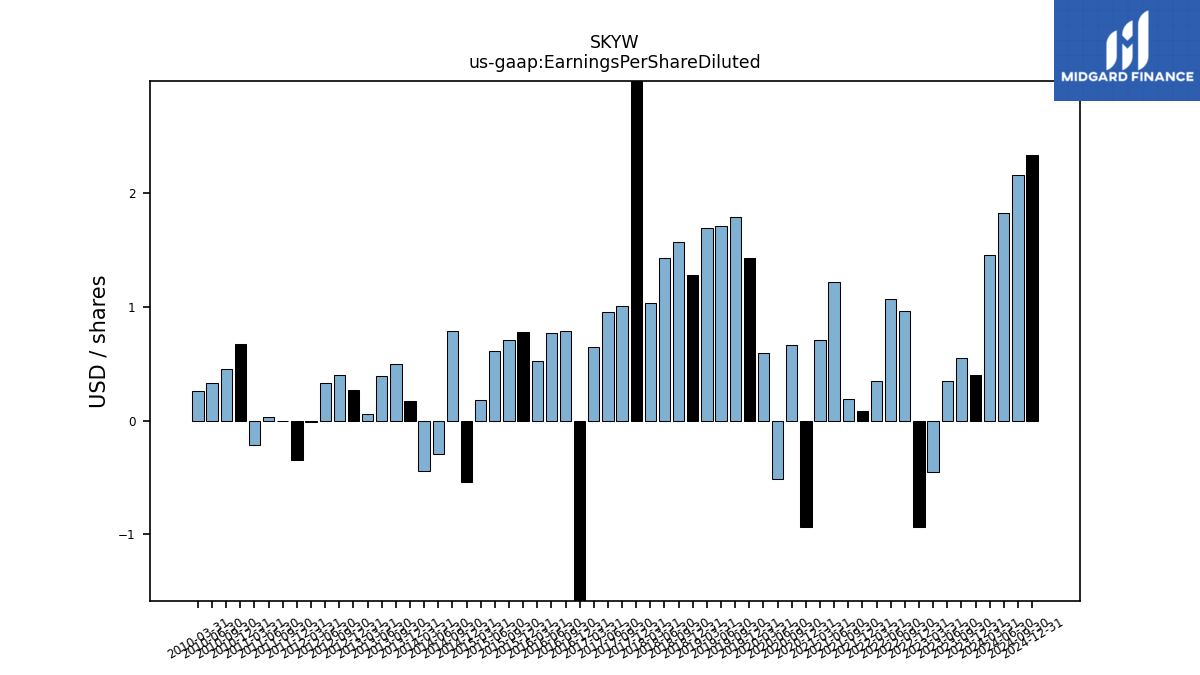
| Earnings Per Share Diluted | 1.45 | 0.40 | 0.55 | 0.35 | -0.45 | -0.93 | 0.96 | 1.07 | 0.35 | 0.08 | 0.19 | 1.22 | 0.71 | -0.93 | 0.66 | -0.51 | 0.59 | 1.43 | 1.79 | 1.71 | 1.69 | 1.28 | 1.57 | 1.43 | 1.03 | 5.46 | 1.01 | 0.95 | 0.65 | -5.22 | 0.79 | 0.77 | 0.52 | 0.78 | 0.71 | 0.61 | 0.18 | -0.54 | 0.79 | -0.29 | -0.44 | 0.17 | 0.50 | 0.39 | 0.06 | 0.27 | 0.40 | 0.33 | -0.01 | -0.35 | 0.00 | 0.03 | -0.21 | 0.67 | 0.45 | 0.33 | 0.26 |
| 2024-03-31 | 2023-12-31 | 2023-09-30 | 2023-06-30 | 2023-03-31 | 2022-12-31 | 2022-09-30 | 2022-06-30 | 2022-03-31 | 2021-12-31 | 2021-09-30 | 2021-06-30 | 2021-03-31 | 2020-12-31 | 2020-09-30 | 2020-06-30 | 2020-03-31 | 2019-12-31 | 2019-09-30 | 2019-06-30 | 2019-03-31 | 2018-12-31 | 2018-09-30 | 2018-06-30 | 2018-03-31 | 2017-12-31 | 2017-09-30 | 2017-06-30 | 2017-03-31 | 2016-12-31 | 2016-09-30 | 2016-06-30 | 2016-03-31 | 2015-12-31 | 2015-09-30 | 2015-06-30 | 2015-03-31 | 2014-12-31 | 2014-09-30 | 2014-06-30 | 2014-03-31 | 2013-12-31 | 2013-09-30 | 2013-06-30 | 2013-03-31 | 2012-12-31 | 2012-09-30 | 2012-06-30 | 2012-03-31 | 2011-12-31 | 2011-09-30 | 2011-06-30 | 2011-03-31 | 2010-12-31 | 2010-09-30 | 2010-06-30 | 2010-03-31 | ||
|---|---|---|---|---|---|---|---|---|---|---|---|---|---|---|---|---|---|---|---|---|---|---|---|---|---|---|---|---|---|---|---|---|---|---|---|---|---|---|---|---|---|---|---|---|---|---|---|---|---|---|---|---|---|---|---|---|---|---|
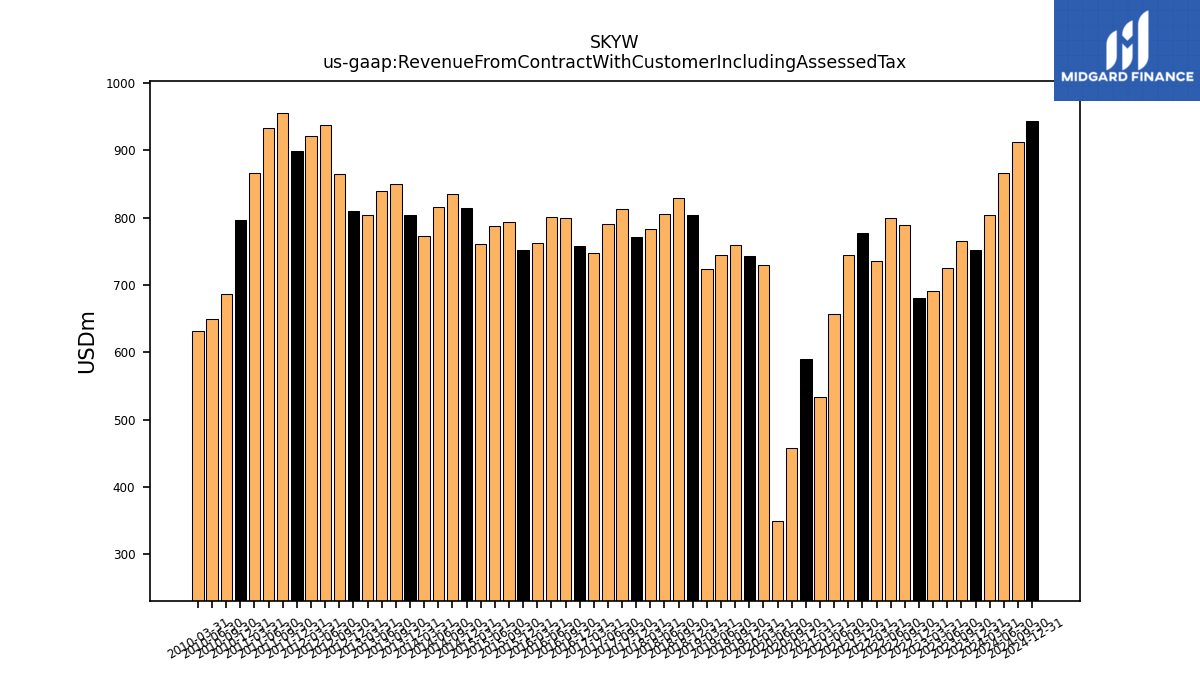
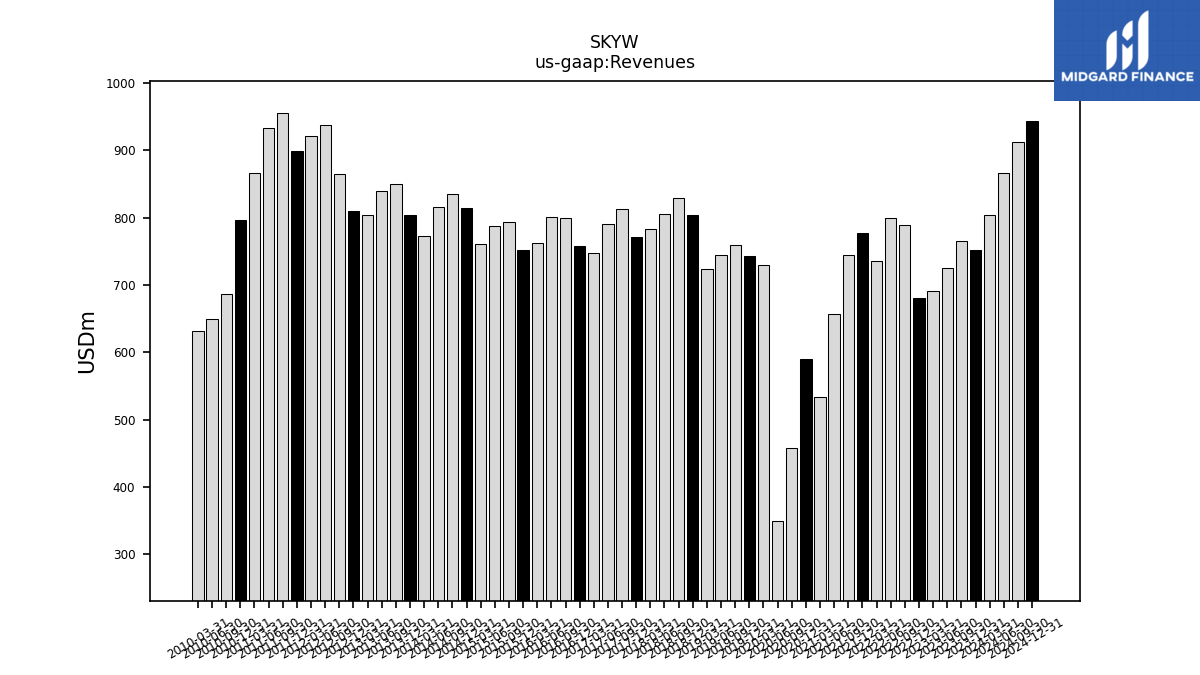
| Revenue From Contract With Customer Including Assessed Tax | 803.61 | 751.79 | 766.17 | 725.64 | 691.83 | 681.25 | 789.44 | 799.09 | 735.15 | 777.16 | 744.78 | 656.99 | 534.55 | 589.64 | 457.49 | 350.04 | 729.94 | 743.59 | 760.29 | 744.38 | 723.69 | 803.49 | 829.27 | 805.51 | 783.40 | 771.24 | 812.67 | 791.51 | 747.17 | 758.02 | 799.78 | 801.34 | 762.08 | 752.74 | 794.00 | 788.42 | 760.40 | 813.85 | 834.63 | 816.57 | 772.39 | 804.37 | 850.74 | 839.13 | 803.49 | 810.73 | 865.26 | 937.21 | 921.17 | 899.85 | 955.42 | 933.70 | 865.95 | 796.28 | 686.86 | 649.76 | 632.24 | |
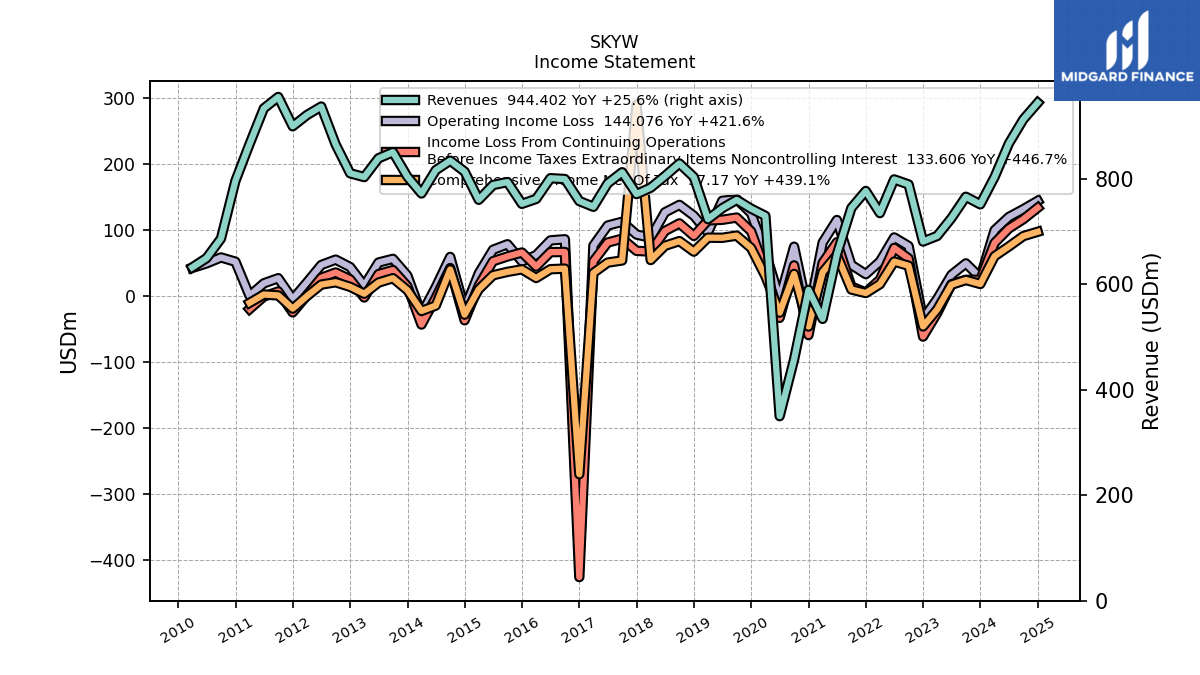
| Revenues | 803.61 | 751.79 | 766.17 | 725.64 | 691.83 | 681.25 | 789.44 | 799.09 | 735.15 | 777.16 | 744.78 | 656.99 | 534.55 | 589.64 | 457.49 | 350.04 | 729.94 | 743.59 | 760.29 | 744.38 | 723.69 | 803.49 | 829.27 | 805.51 | 783.40 | 771.24 | 812.67 | 791.51 | 747.17 | 758.02 | 799.78 | 801.34 | 762.08 | 752.74 | 794.00 | 788.42 | 760.40 | 813.85 | 834.63 | 816.57 | 772.39 | 804.37 | 850.74 | 839.13 | 803.49 | 810.73 | 865.26 | 937.21 | 921.17 | 899.85 | 955.42 | 933.70 | 865.95 | 796.28 | 686.86 | 649.76 | 632.24 | |
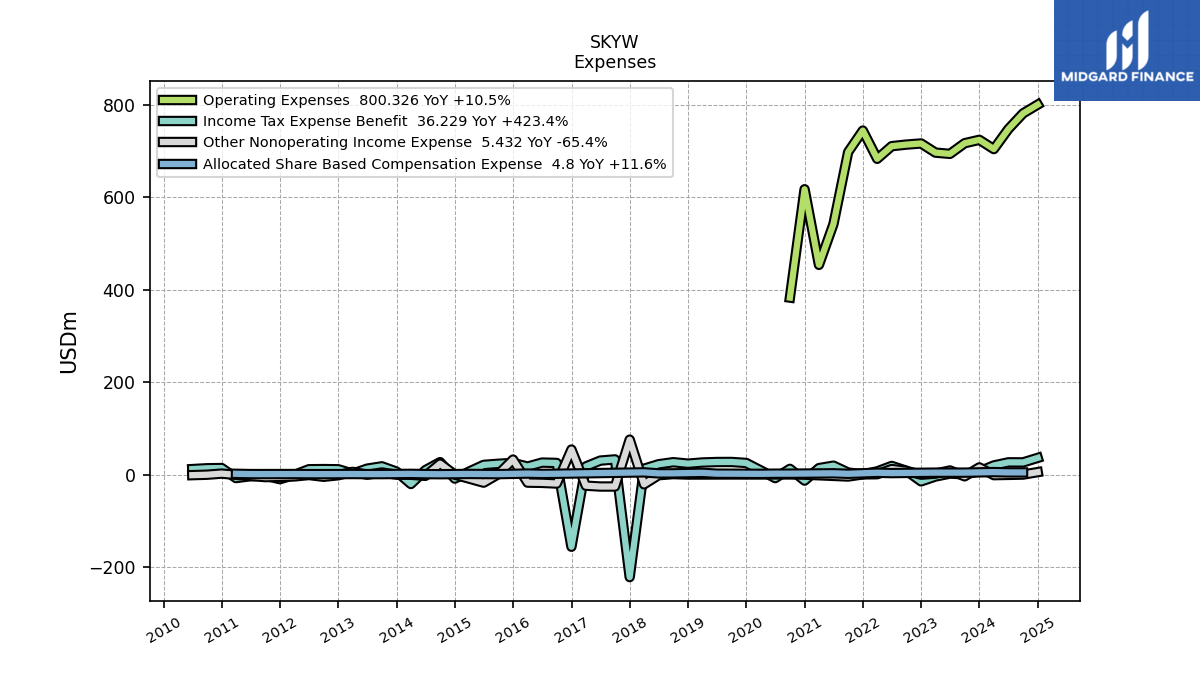
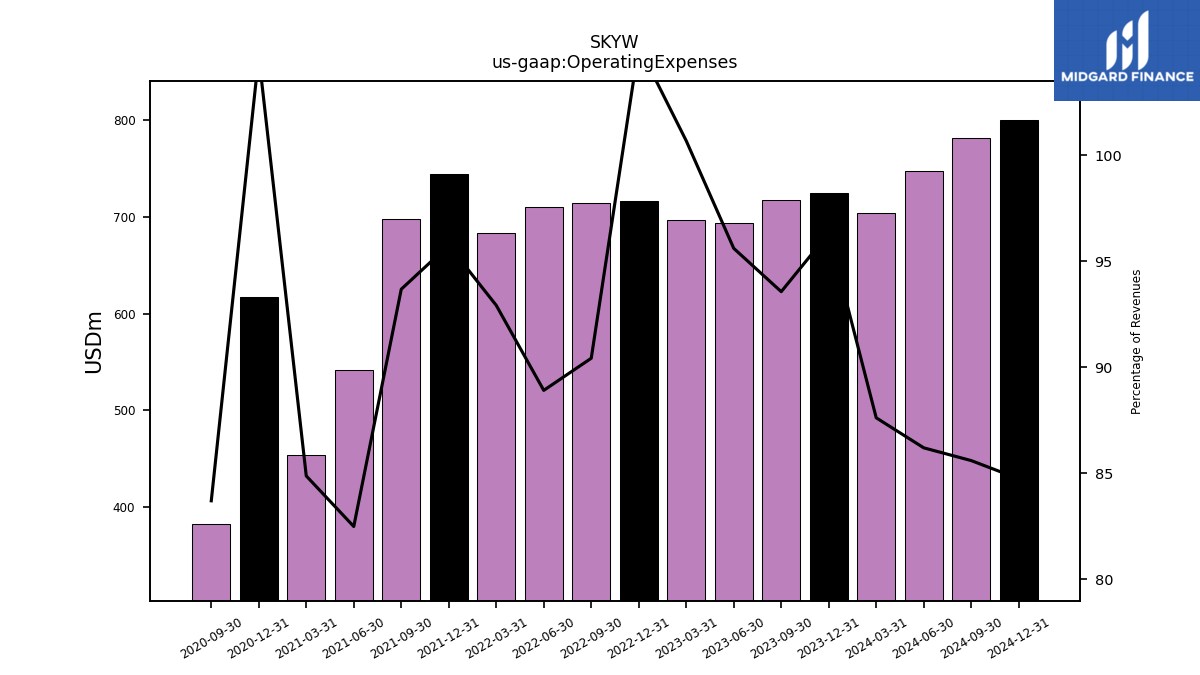
| Operating Expenses | 704.11 | 724.16 | 716.88 | 693.78 | 696.53 | 716.31 | 713.87 | 710.48 | 683.10 | 744.21 | 697.73 | 541.97 | 453.71 | 617.31 | 382.94 | NA | NA | NA | NA | NA | NA | NA | NA | NA | NA | NA | NA | NA | NA | NA | NA | NA | NA | NA | NA | NA | NA | NA | NA | NA | NA | NA | NA | NA | NA | NA | NA | NA | NA | NA | NA | NA | NA | NA | NA | NA | NA | |
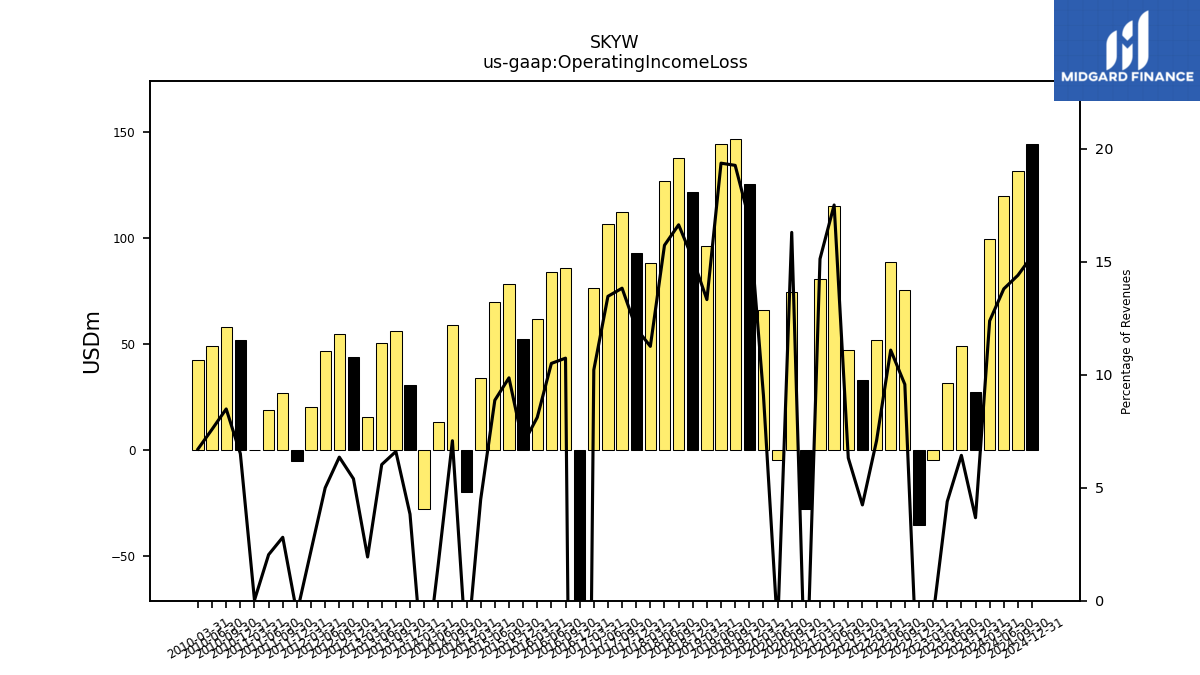
| Operating Income Loss | 99.51 | 27.62 | 49.29 | 31.86 | -4.70 | -35.06 | 75.58 | 88.60 | 52.05 | 32.95 | 47.05 | 115.02 | 80.84 | -27.67 | 74.55 | -4.40 | 66.32 | 125.31 | 146.44 | 144.09 | 96.42 | 121.50 | 137.93 | 126.68 | 88.17 | 92.94 | 112.37 | 106.60 | 76.30 | -404.46 | 85.83 | 84.14 | 61.81 | 52.21 | 78.30 | 69.93 | 34.08 | -19.70 | 59.08 | 13.24 | -27.77 | 30.82 | 56.17 | 50.55 | 15.56 | 43.75 | 54.97 | 46.81 | 20.46 | -4.99 | 26.83 | 19.04 | 0.23 | 51.84 | 58.28 | 49.29 | 42.42 | |
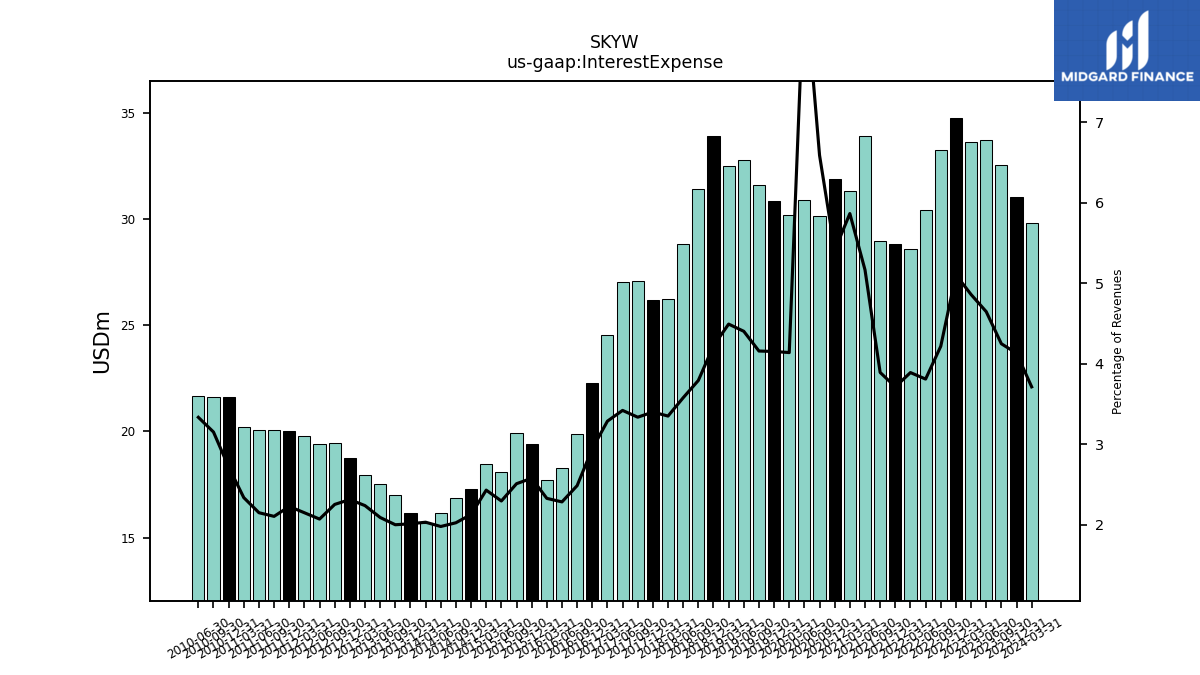
| Interest Expense | 29.83 | 31.05 | 32.54 | 33.72 | 33.62 | 34.77 | 33.28 | 30.43 | 28.59 | 28.85 | 28.98 | 33.94 | 31.35 | 31.89 | 30.15 | 30.93 | 30.20 | 30.87 | 31.61 | 32.77 | 32.51 | 33.92 | 31.44 | 28.81 | 26.23 | 26.21 | 27.10 | 27.06 | 24.55 | 22.30 | 19.86 | 18.29 | 17.73 | 19.39 | 19.91 | 18.08 | 18.46 | 17.30 | 16.88 | 16.14 | 15.68 | 16.17 | 17.00 | 17.53 | 17.96 | 18.74 | 19.47 | 19.39 | 19.78 | 20.02 | 20.09 | 20.05 | 20.22 | 21.63 | 21.64 | 21.66 | NA | |
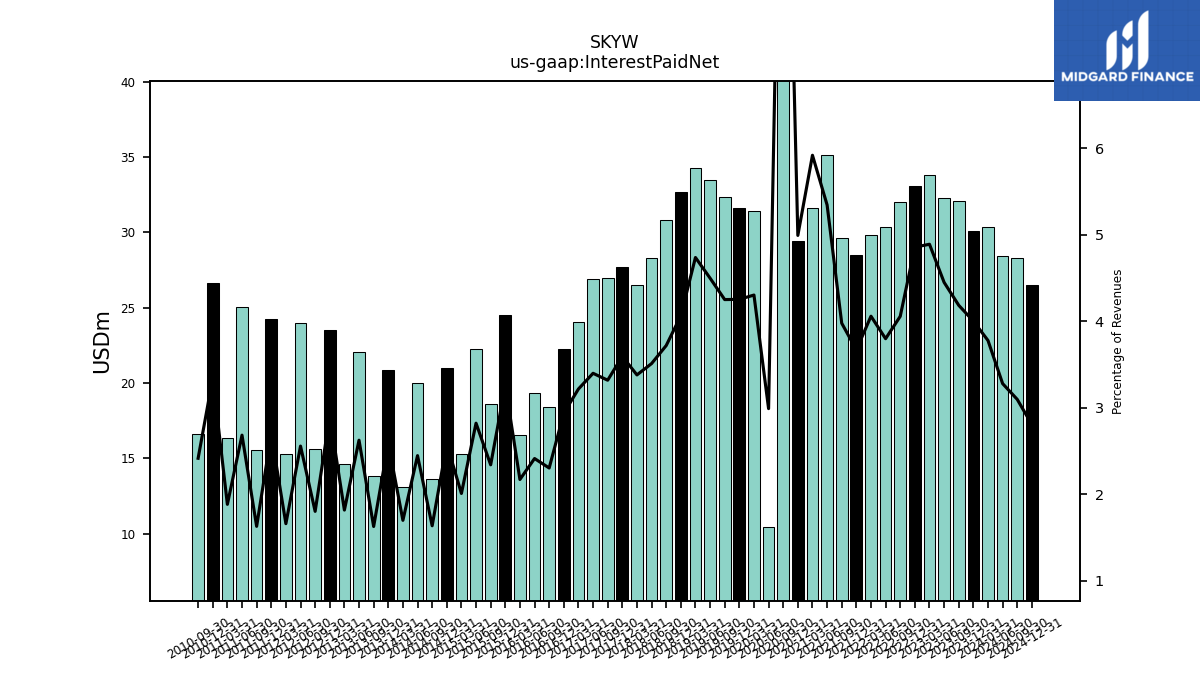
| Interest Paid Net | 30.36 | 30.09 | 32.06 | 32.29 | 33.84 | 33.09 | 32.03 | 30.36 | 29.84 | 28.52 | 29.63 | 35.12 | 31.65 | 29.44 | 54.12 | 10.47 | 31.41 | 31.63 | 32.32 | 33.49 | 34.29 | 32.66 | 30.85 | 28.28 | 26.48 | 27.72 | 26.97 | 26.90 | 24.04 | 22.27 | 18.43 | 19.34 | 16.55 | 24.54 | 18.59 | 22.25 | 15.28 | 21.01 | 13.65 | 19.98 | 13.12 | 20.84 | 13.85 | 22.03 | 14.60 | 23.55 | 15.60 | 23.97 | 15.29 | 24.25 | 15.57 | 25.06 | 16.31 | 26.64 | 16.60 | NA | NA | |
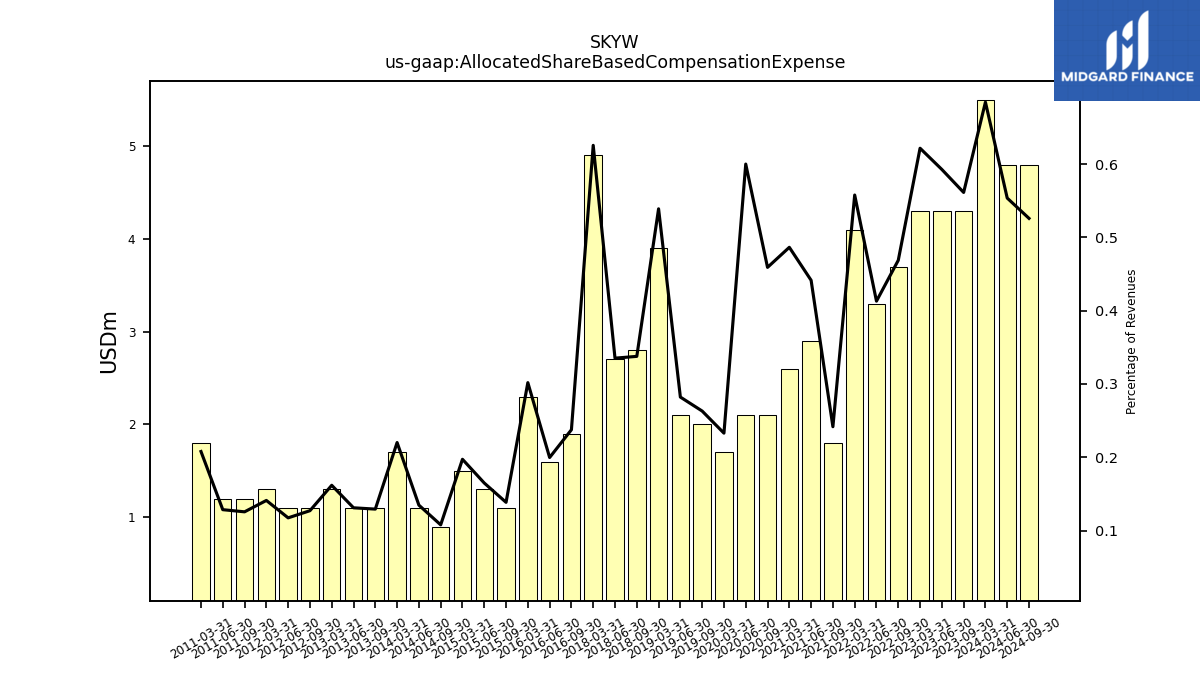
| Allocated Share Based Compensation Expense | 5.50 | NA | 4.30 | 4.30 | 4.30 | NA | 3.70 | 3.30 | 4.10 | NA | 1.80 | 2.90 | 2.60 | NA | 2.10 | 2.10 | 1.70 | NA | 2.00 | 2.10 | 3.90 | NA | 2.80 | 2.70 | 4.90 | NA | NA | NA | NA | NA | 1.90 | 1.60 | 2.30 | NA | 1.10 | 1.30 | 1.50 | NA | 0.90 | 1.10 | 1.70 | NA | 1.10 | 1.10 | 1.30 | NA | 1.10 | 1.10 | 1.30 | NA | 1.20 | 1.20 | 1.80 | NA | NA | NA | NA | |
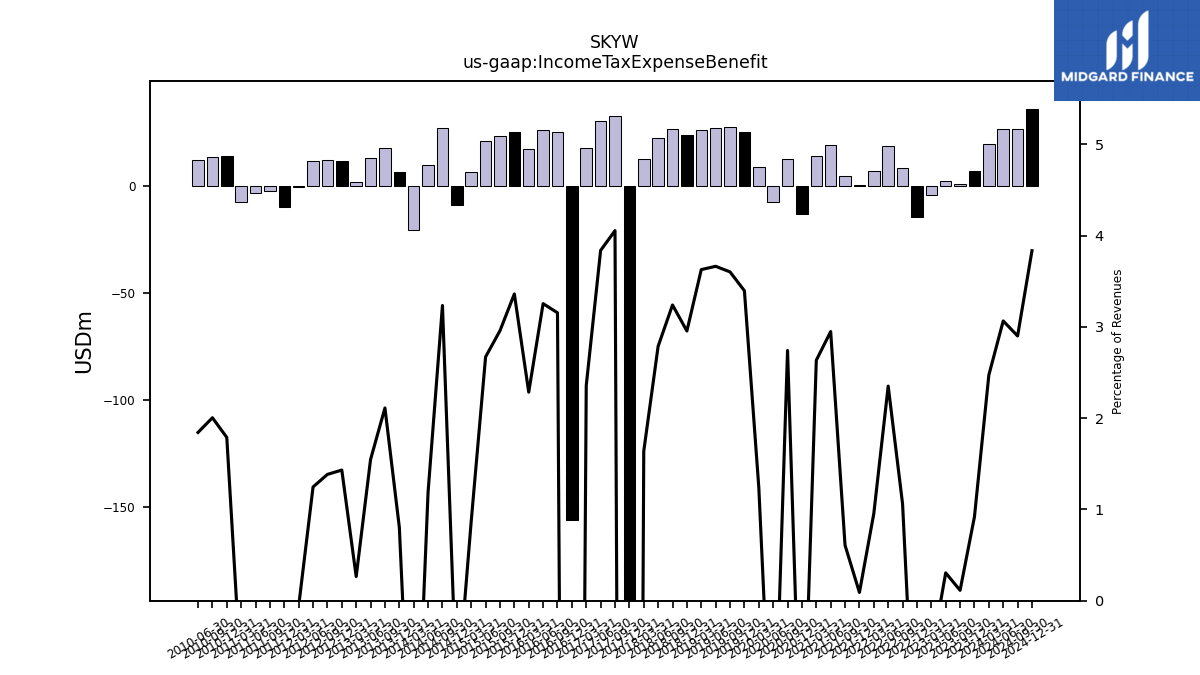
| Income Tax Expense Benefit | 19.88 | 6.92 | 0.87 | 2.22 | -4.05 | -14.57 | 8.38 | 18.80 | 7.03 | 0.71 | 4.53 | 19.38 | 14.09 | -12.93 | 12.55 | -7.53 | 9.09 | 25.26 | 27.40 | 27.28 | 26.26 | 23.75 | 26.88 | 22.47 | 12.84 | -221.69 | 32.96 | 30.39 | 17.62 | -155.98 | 25.24 | 26.09 | 17.42 | 25.31 | 23.50 | 21.07 | 6.63 | -8.64 | 27.01 | 9.74 | -20.29 | 6.48 | 17.97 | 12.99 | 2.13 | 11.61 | 11.98 | 11.69 | -0.54 | -9.81 | -2.22 | -3.34 | -7.47 | 14.26 | 13.78 | 11.98 | NA | |
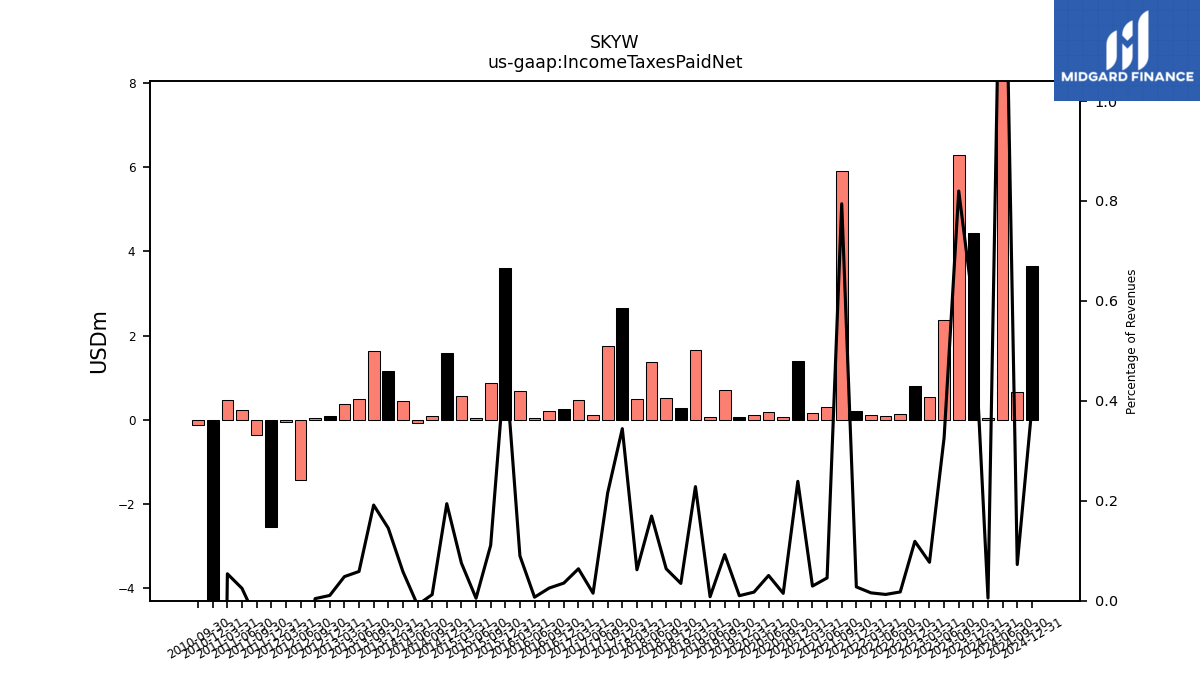
| Income Taxes Paid Net | 0.04 | 4.43 | 6.28 | 2.37 | 0.53 | 0.81 | 0.14 | 0.10 | 0.12 | 0.21 | 5.92 | 0.30 | 0.16 | 1.41 | 0.07 | 0.18 | 0.13 | 0.07 | 0.70 | 0.06 | 1.65 | 0.28 | 0.53 | 1.37 | 0.49 | 2.66 | 1.76 | 0.12 | 0.48 | 0.27 | 0.20 | 0.06 | 0.68 | 3.61 | 0.88 | 0.04 | 0.57 | 1.58 | 0.10 | -0.07 | 0.45 | 1.17 | 1.63 | 0.49 | 0.39 | 0.09 | 0.04 | -1.42 | -0.05 | -2.53 | -0.37 | 0.23 | 0.47 | -17.28 | -0.11 | NA | NA | |
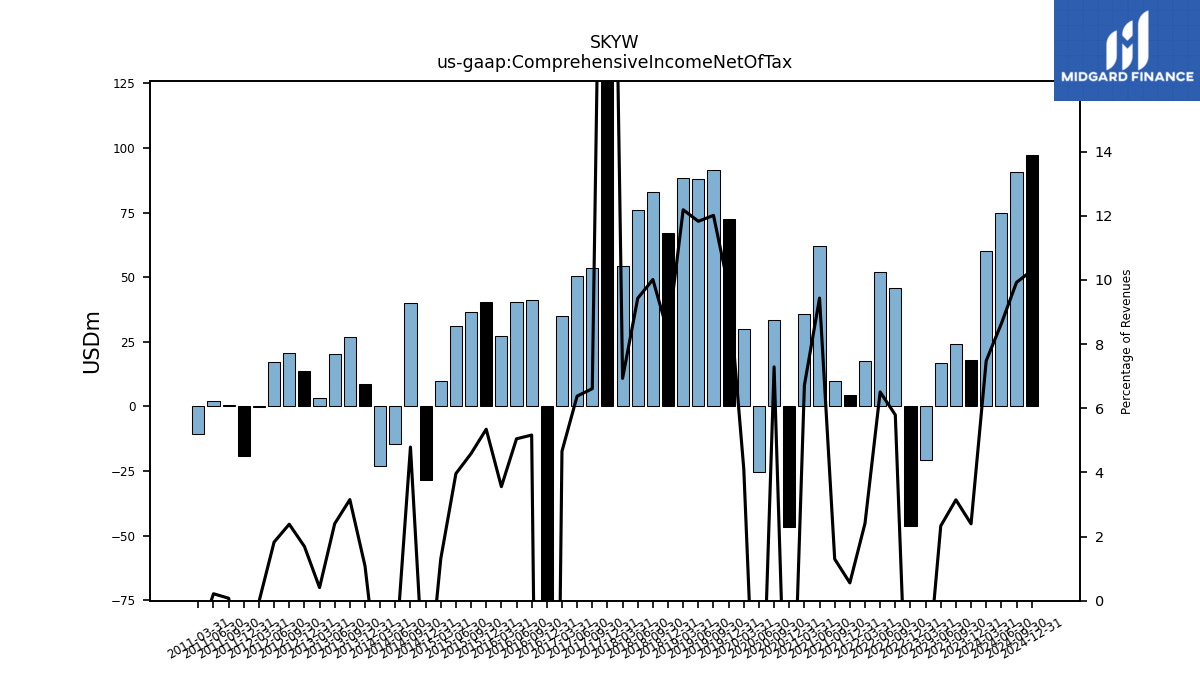
| Comprehensive Income Net Of Tax | 60.12 | 18.02 | 24.10 | 16.93 | -20.59 | -46.34 | 45.75 | 52.01 | 17.73 | 4.33 | 9.68 | 61.99 | 35.90 | -46.45 | 33.35 | -25.41 | 29.99 | 72.53 | 91.34 | 88.05 | 88.21 | 67.09 | 83.04 | 75.94 | 54.31 | 289.88 | 53.73 | 50.49 | 34.83 | -270.27 | 41.31 | 40.46 | 27.11 | 40.24 | 36.43 | 31.25 | 9.92 | -28.43 | 39.99 | -14.70 | -22.86 | 8.73 | 26.82 | 20.16 | 3.30 | 13.74 | 20.65 | 17.14 | -0.30 | -19.29 | 0.75 | 2.04 | -10.59 | NA | NA | NA | NA | |
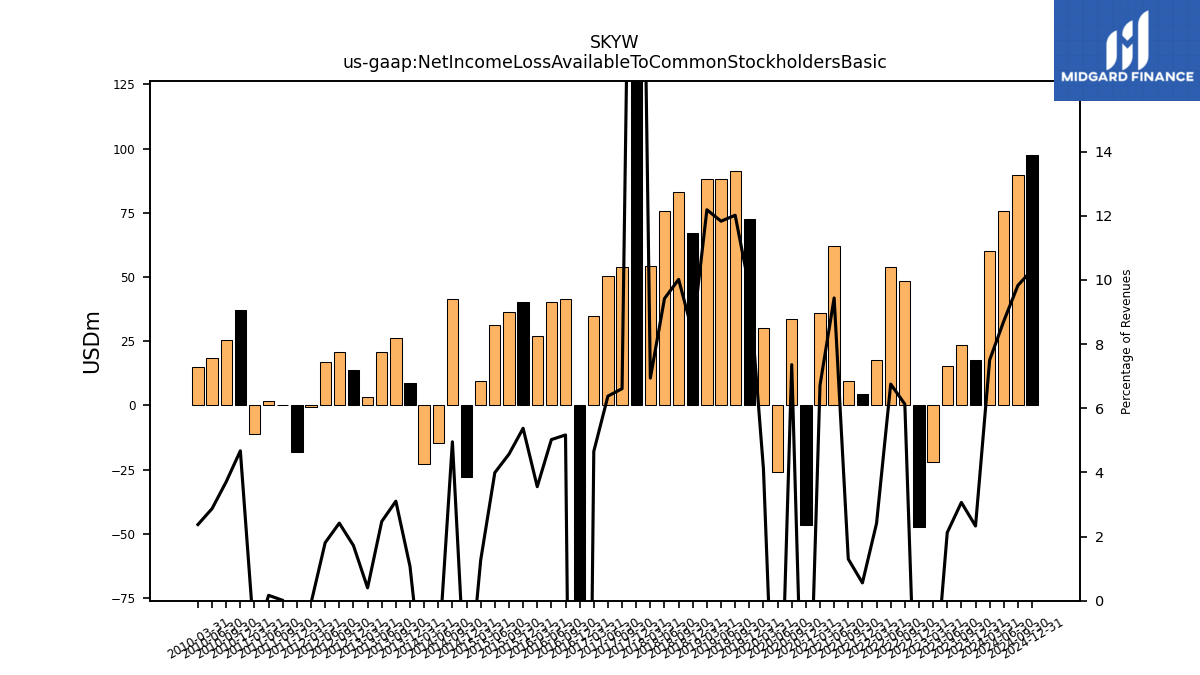
| Net Income Loss Available To Common Stockholders Basic | 60.30 | 17.52 | 23.48 | 15.42 | -22.07 | -47.10 | 48.37 | 53.95 | 17.73 | 4.33 | 9.68 | 61.99 | 35.90 | -46.45 | 33.66 | -25.71 | 29.99 | 72.53 | 91.34 | 88.05 | 88.18 | 67.11 | 83.05 | 75.86 | 54.36 | 289.93 | 53.72 | 50.48 | 34.79 | -270.24 | 41.32 | 40.24 | 27.09 | 40.45 | 36.27 | 31.48 | 9.62 | -27.87 | 41.34 | -14.74 | -22.89 | 8.61 | 26.39 | 20.72 | 3.23 | 13.95 | 20.93 | 16.96 | -0.68 | -17.97 | 0.12 | 1.58 | -11.06 | 37.21 | 25.47 | 18.66 | 15.01 |
| 2024-03-31 | 2023-12-31 | 2023-09-30 | 2023-06-30 | 2023-03-31 | 2022-12-31 | 2022-09-30 | 2022-06-30 | 2022-03-31 | 2021-12-31 | 2021-09-30 | 2021-06-30 | 2021-03-31 | 2020-12-31 | 2020-09-30 | 2020-06-30 | 2020-03-31 | 2019-12-31 | 2019-09-30 | 2019-06-30 | 2019-03-31 | 2018-12-31 | 2018-09-30 | 2018-06-30 | 2018-03-31 | 2017-12-31 | 2017-09-30 | 2017-06-30 | 2017-03-31 | 2016-12-31 | 2016-09-30 | 2016-06-30 | 2016-03-31 | 2015-12-31 | 2015-09-30 | 2015-06-30 | 2015-03-31 | 2014-12-31 | 2014-09-30 | 2014-06-30 | 2014-03-31 | 2013-12-31 | 2013-09-30 | 2013-06-30 | 2013-03-31 | 2012-12-31 | 2012-09-30 | 2012-06-30 | 2012-03-31 | 2011-12-31 | 2011-09-30 | 2011-06-30 | 2011-03-31 | 2010-12-31 | 2010-09-30 | 2010-06-30 | 2010-03-31 | ||
|---|---|---|---|---|---|---|---|---|---|---|---|---|---|---|---|---|---|---|---|---|---|---|---|---|---|---|---|---|---|---|---|---|---|---|---|---|---|---|---|---|---|---|---|---|---|---|---|---|---|---|---|---|---|---|---|---|---|---|
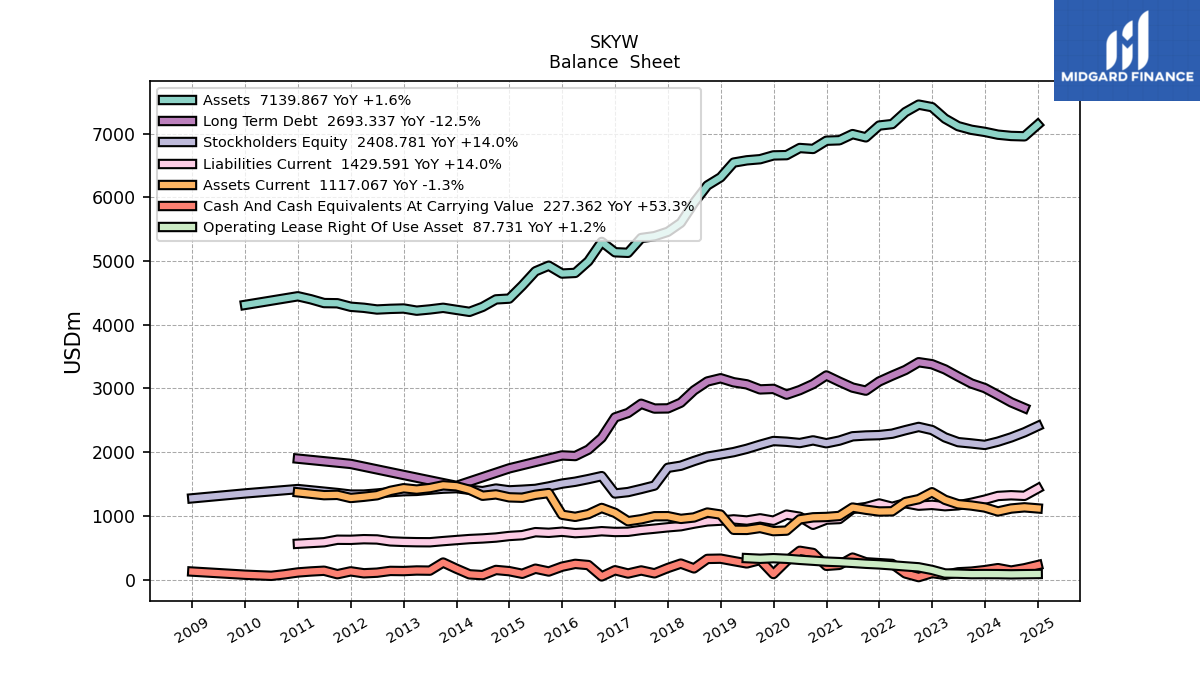
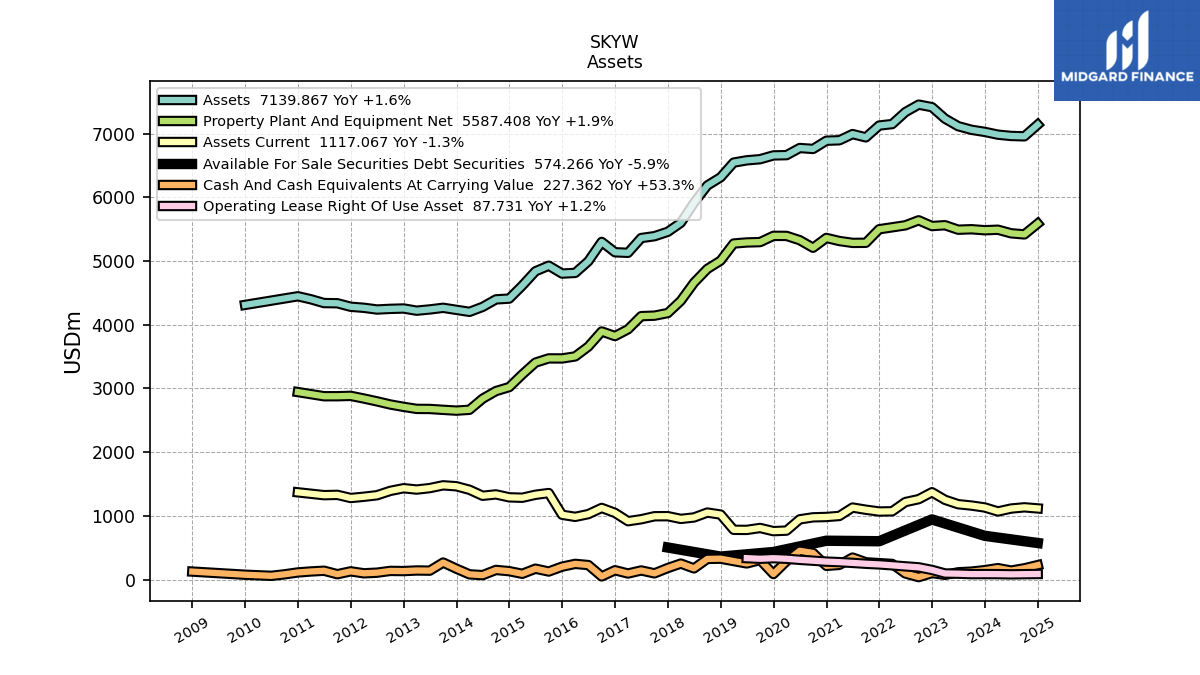
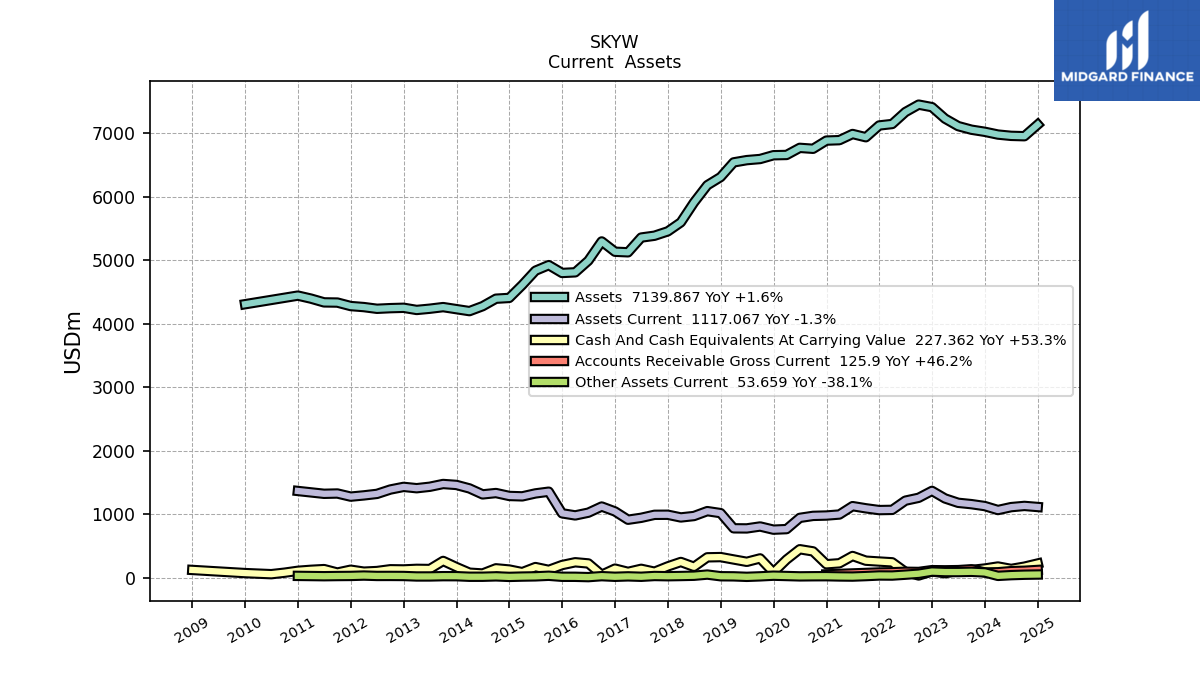
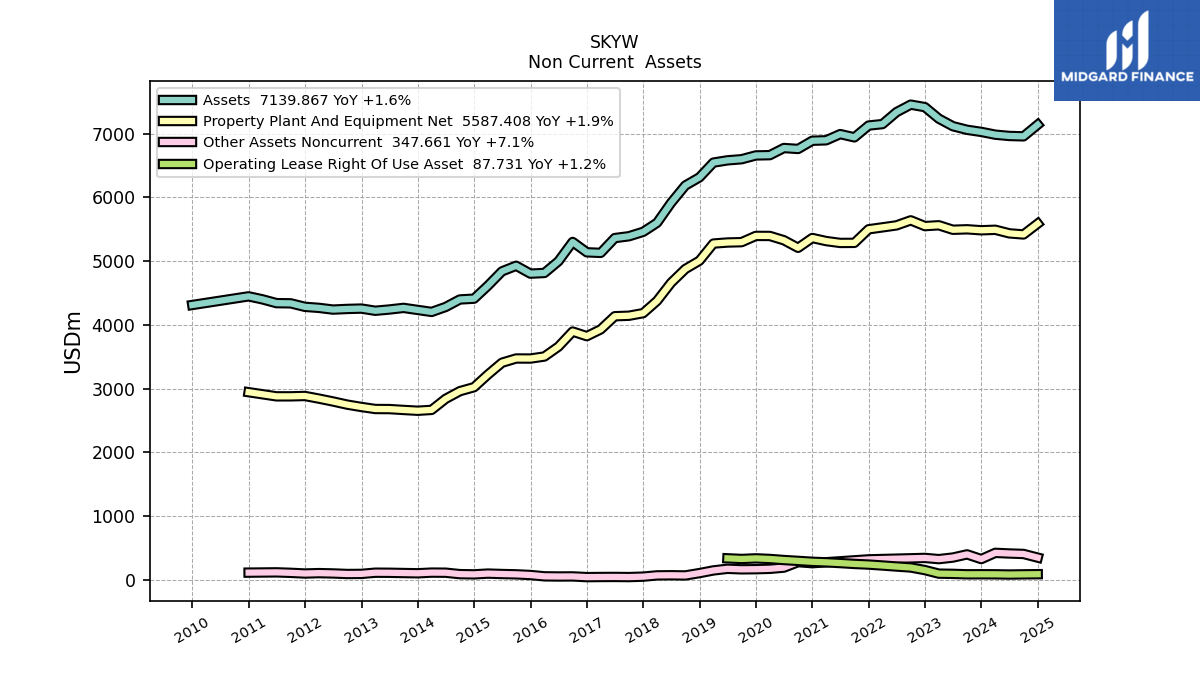
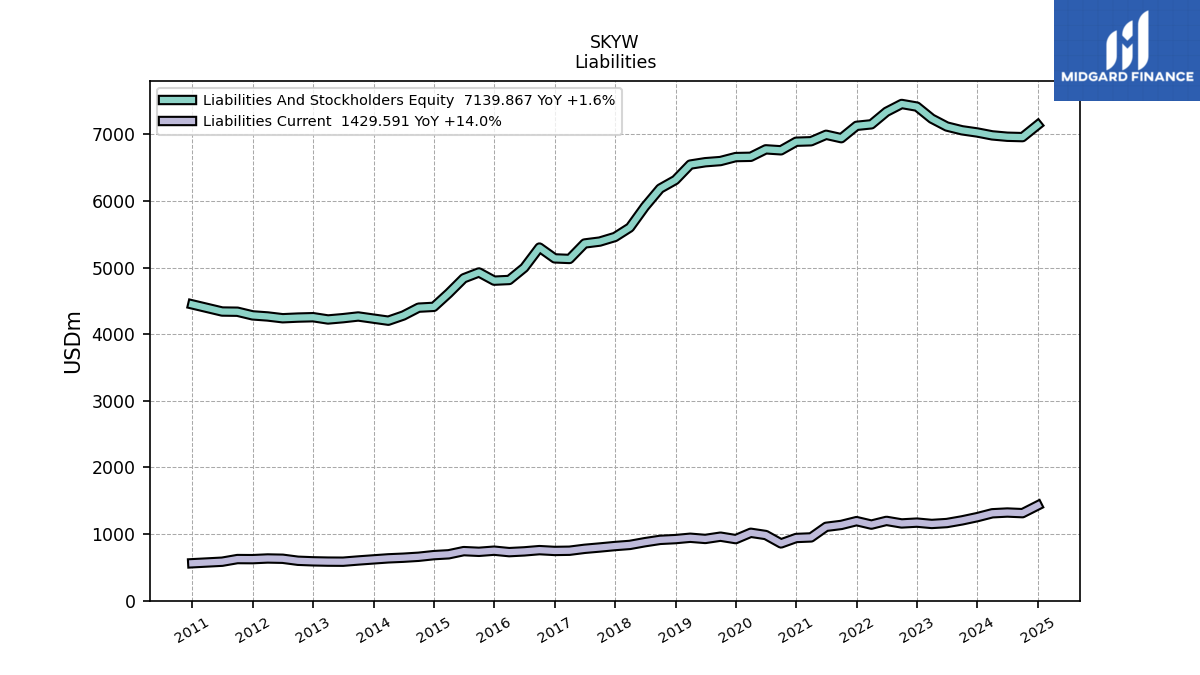
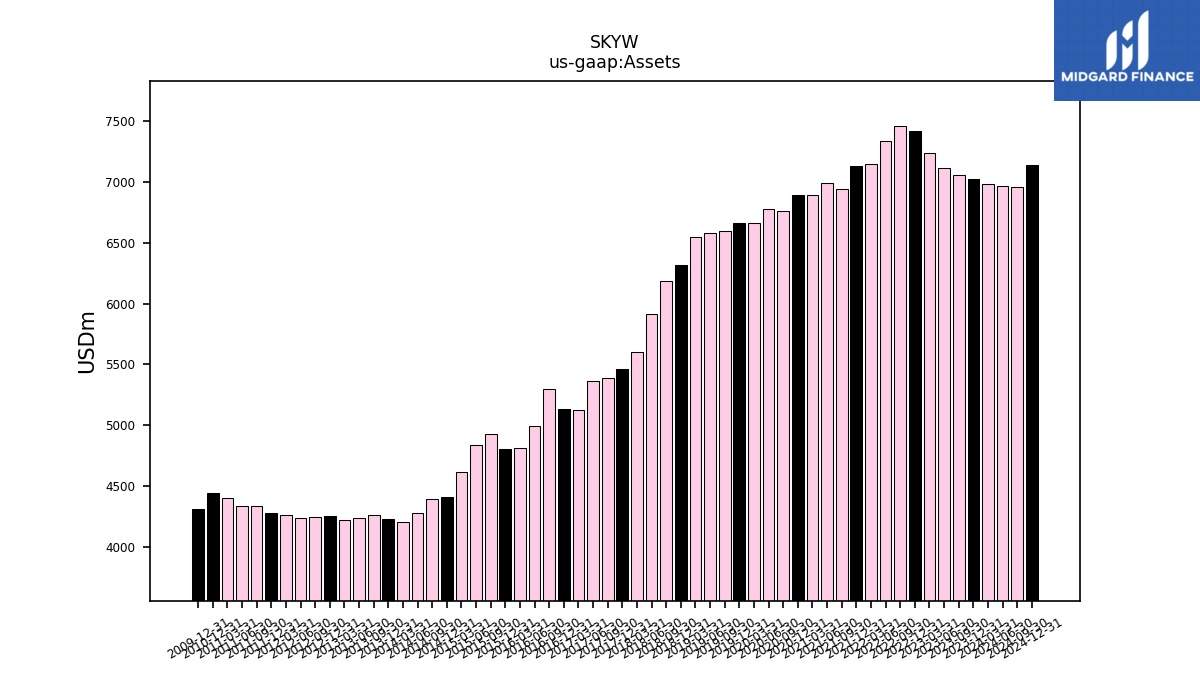
| Assets | 6982.74 | 7026.29 | 7059.12 | 7115.77 | 7233.76 | 7414.55 | 7454.20 | 7336.65 | 7148.96 | 7125.95 | 6940.50 | 6991.76 | 6894.69 | 6887.62 | 6758.59 | 6773.38 | 6661.41 | 6657.13 | 6597.66 | 6580.02 | 6544.53 | 6313.21 | 6184.86 | 5913.09 | 5600.19 | 5458.28 | 5389.45 | 5360.61 | 5128.36 | 5137.25 | 5299.76 | 4996.89 | 4813.06 | 4802.89 | 4926.44 | 4838.55 | 4613.51 | 4409.93 | 4397.63 | 4279.84 | 4202.03 | 4233.22 | 4265.39 | 4240.07 | 4220.39 | 4254.64 | 4248.85 | 4238.81 | 4265.66 | 4281.91 | 4336.81 | 4339.74 | 4399.32 | 4446.51 | NA | NA | NA | |
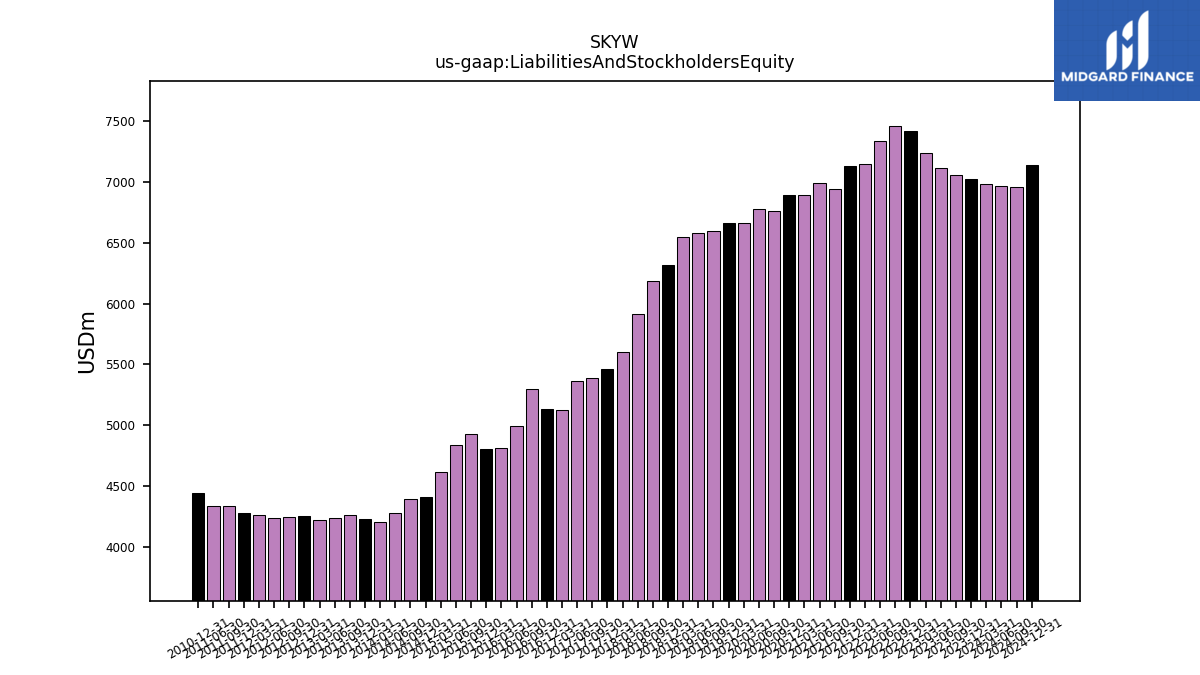
| Liabilities And Stockholders Equity | 6982.74 | 7026.29 | 7059.12 | 7115.77 | 7233.76 | 7414.55 | 7454.20 | 7336.65 | 7148.96 | 7125.95 | 6940.50 | 6991.76 | 6894.69 | 6887.62 | 6758.59 | 6773.38 | 6661.41 | 6657.13 | 6597.66 | 6580.02 | 6544.53 | 6313.21 | 6184.86 | 5913.09 | 5600.19 | 5458.28 | 5389.45 | 5360.61 | 5128.36 | 5137.25 | 5299.76 | 4996.89 | 4813.06 | 4802.89 | 4926.44 | 4838.55 | 4613.51 | 4409.93 | 4397.63 | 4279.84 | 4202.03 | 4233.22 | 4265.39 | 4240.07 | 4220.39 | 4254.64 | 4248.85 | 4238.81 | 4265.66 | 4281.91 | 4336.81 | 4339.74 | NA | 4446.51 | NA | NA | NA | |
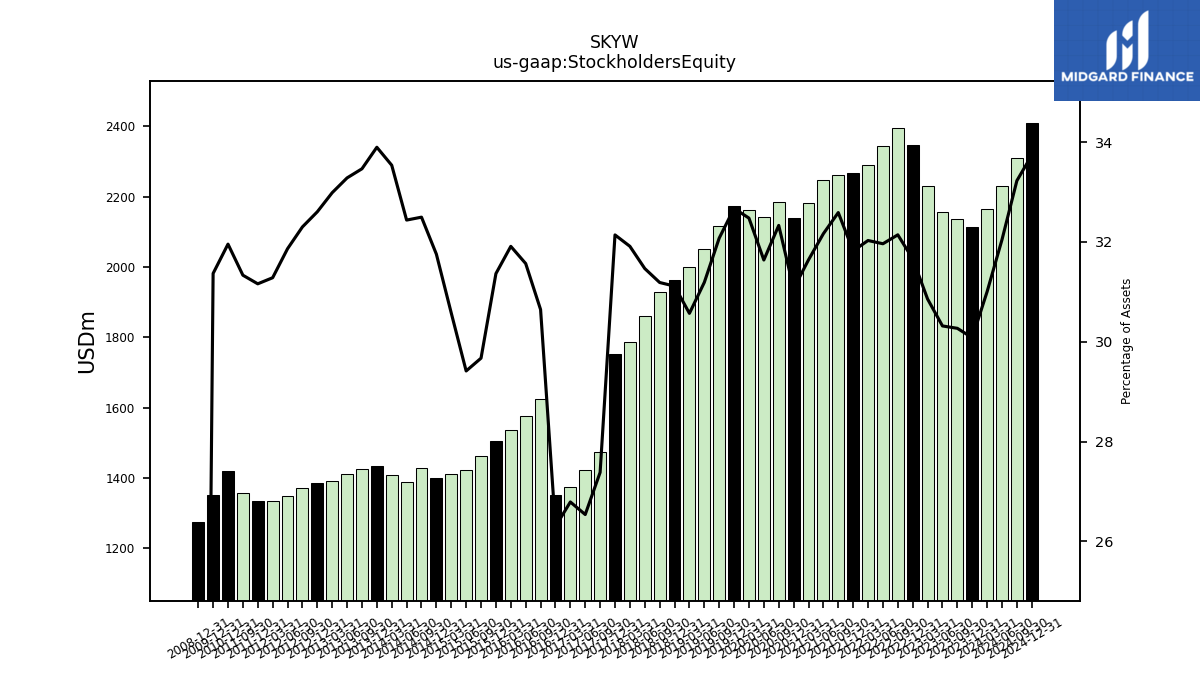
| Stockholders Equity | 2164.90 | 2113.50 | 2136.70 | 2157.24 | 2232.06 | 2347.63 | 2395.95 | 2345.03 | 2289.72 | 2267.51 | 2261.81 | 2248.91 | 2181.52 | 2139.55 | 2185.10 | 2142.96 | 2163.44 | 2175.01 | 2116.26 | 2052.24 | 2000.57 | 1964.28 | 1928.87 | 1860.65 | 1787.14 | 1754.32 | 1475.71 | 1422.54 | 1373.82 | 1350.94 | 1624.11 | 1577.35 | 1535.90 | 1506.43 | 1461.70 | 1423.21 | 1410.55 | 1400.35 | 1429.07 | 1388.29 | 1409.22 | 1434.94 | 1427.45 | 1411.22 | 1392.16 | 1387.17 | 1372.41 | 1350.63 | 1334.41 | 1334.26 | 1358.86 | NA | NA | 1420.92 | NA | NA | NA |
| 2024-03-31 | 2023-12-31 | 2023-09-30 | 2023-06-30 | 2023-03-31 | 2022-12-31 | 2022-09-30 | 2022-06-30 | 2022-03-31 | 2021-12-31 | 2021-09-30 | 2021-06-30 | 2021-03-31 | 2020-12-31 | 2020-09-30 | 2020-06-30 | 2020-03-31 | 2019-12-31 | 2019-09-30 | 2019-06-30 | 2019-03-31 | 2018-12-31 | 2018-09-30 | 2018-06-30 | 2018-03-31 | 2017-12-31 | 2017-09-30 | 2017-06-30 | 2017-03-31 | 2016-12-31 | 2016-09-30 | 2016-06-30 | 2016-03-31 | 2015-12-31 | 2015-09-30 | 2015-06-30 | 2015-03-31 | 2014-12-31 | 2014-09-30 | 2014-06-30 | 2014-03-31 | 2013-12-31 | 2013-09-30 | 2013-06-30 | 2013-03-31 | 2012-12-31 | 2012-09-30 | 2012-06-30 | 2012-03-31 | 2011-12-31 | 2011-09-30 | 2011-06-30 | 2011-03-31 | 2010-12-31 | 2010-09-30 | 2010-06-30 | 2010-03-31 | ||
|---|---|---|---|---|---|---|---|---|---|---|---|---|---|---|---|---|---|---|---|---|---|---|---|---|---|---|---|---|---|---|---|---|---|---|---|---|---|---|---|---|---|---|---|---|---|---|---|---|---|---|---|---|---|---|---|---|---|---|
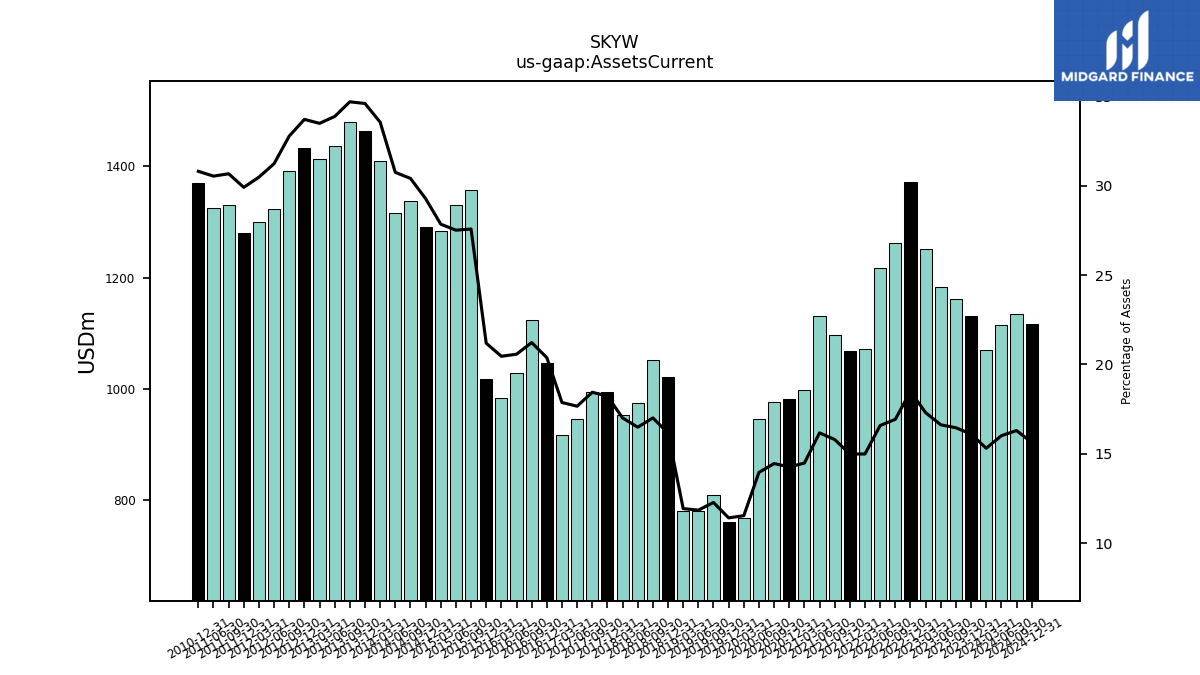
| Assets Current | 1069.36 | 1131.90 | 1162.00 | 1183.13 | 1251.97 | 1371.28 | 1262.19 | 1216.88 | 1071.97 | 1068.59 | 1096.67 | 1130.83 | 998.78 | 982.80 | 977.28 | 945.85 | 768.97 | 760.35 | 810.39 | 779.93 | 781.39 | 1020.79 | 1052.07 | 975.23 | 952.62 | 995.13 | 994.13 | 947.01 | 916.59 | 1047.08 | 1124.84 | 1028.02 | 984.69 | 1017.57 | 1358.38 | 1331.09 | 1284.67 | 1291.00 | 1337.09 | 1315.72 | 1409.77 | 1464.44 | 1479.60 | 1436.09 | 1413.12 | 1434.04 | 1392.44 | 1323.76 | 1300.01 | 1280.46 | 1329.84 | 1325.00 | NA | 1369.57 | NA | NA | NA | |
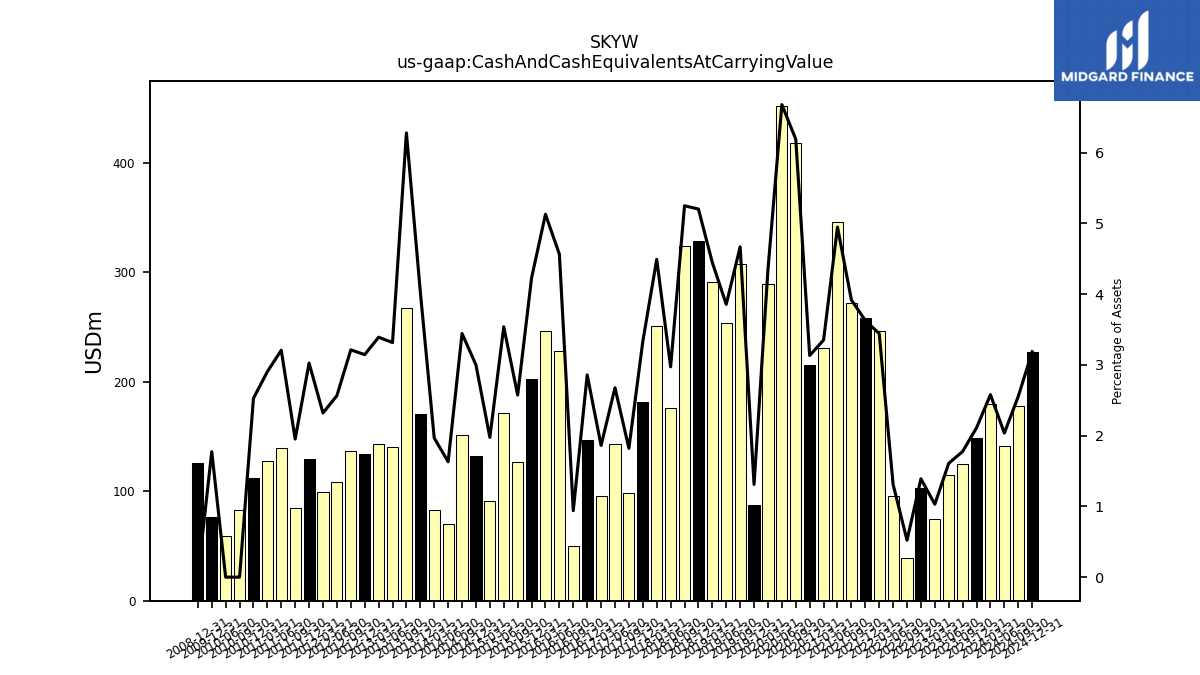
| Cash And Cash Equivalents At Carrying Value | 179.98 | 148.28 | 125.33 | 114.43 | 74.52 | 102.98 | 38.85 | 96.07 | 246.00 | 258.42 | 271.83 | 345.85 | 231.00 | 215.72 | 418.23 | 452.25 | 289.54 | 87.21 | 307.91 | 253.66 | 290.88 | 328.38 | 324.56 | 175.73 | 251.45 | 181.79 | 98.08 | 143.45 | 95.44 | 146.77 | 49.77 | 227.98 | 246.76 | 203.03 | 126.74 | 171.16 | 91.11 | 132.28 | 151.39 | 69.79 | 82.60 | 170.64 | 267.75 | 140.55 | 143.07 | 133.77 | 136.46 | 108.71 | 98.95 | 129.53 | 84.60 | 139.13 | 127.74 | 112.34 | 82.77 | 59.18 | NA | |
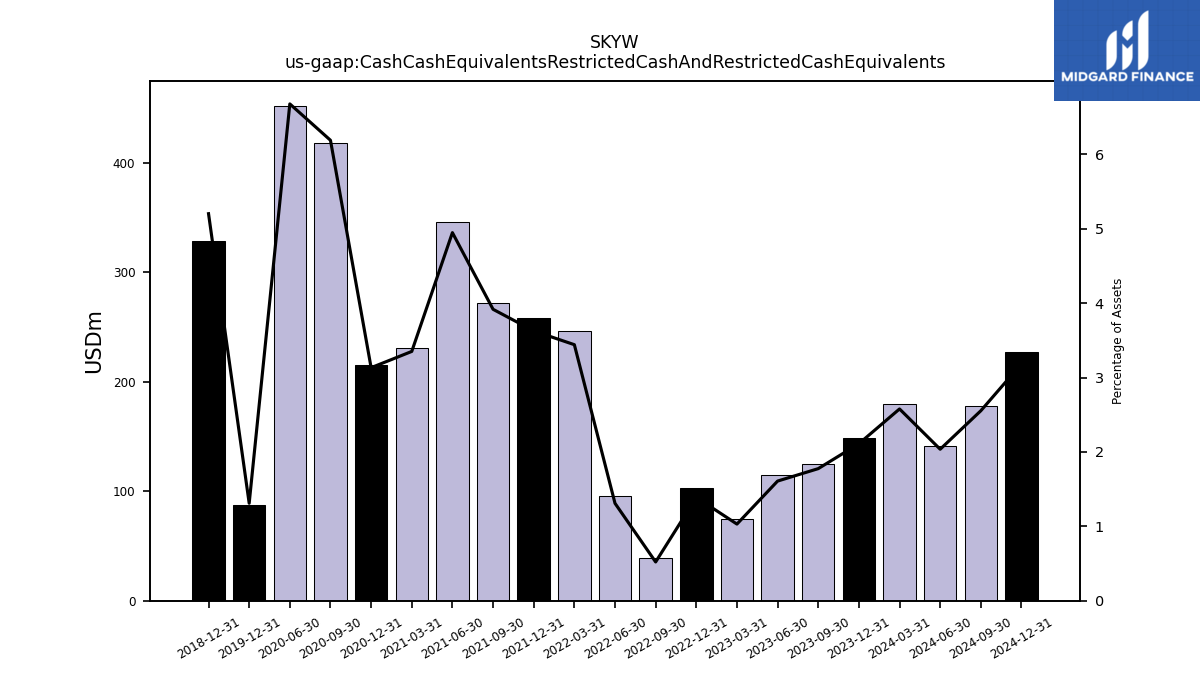
| Cash Cash Equivalents Restricted Cash And Restricted Cash Equivalents | 179.98 | 148.28 | 125.33 | 114.43 | 74.52 | 102.98 | 38.85 | 96.07 | 246.00 | 258.42 | 271.83 | 345.85 | 231.00 | 215.72 | 418.23 | 452.25 | NA | 87.21 | NA | NA | NA | 328.38 | NA | NA | NA | NA | NA | NA | NA | NA | NA | NA | NA | NA | NA | NA | NA | NA | NA | NA | NA | NA | NA | NA | NA | NA | NA | NA | NA | NA | NA | NA | NA | NA | NA | NA | NA | |
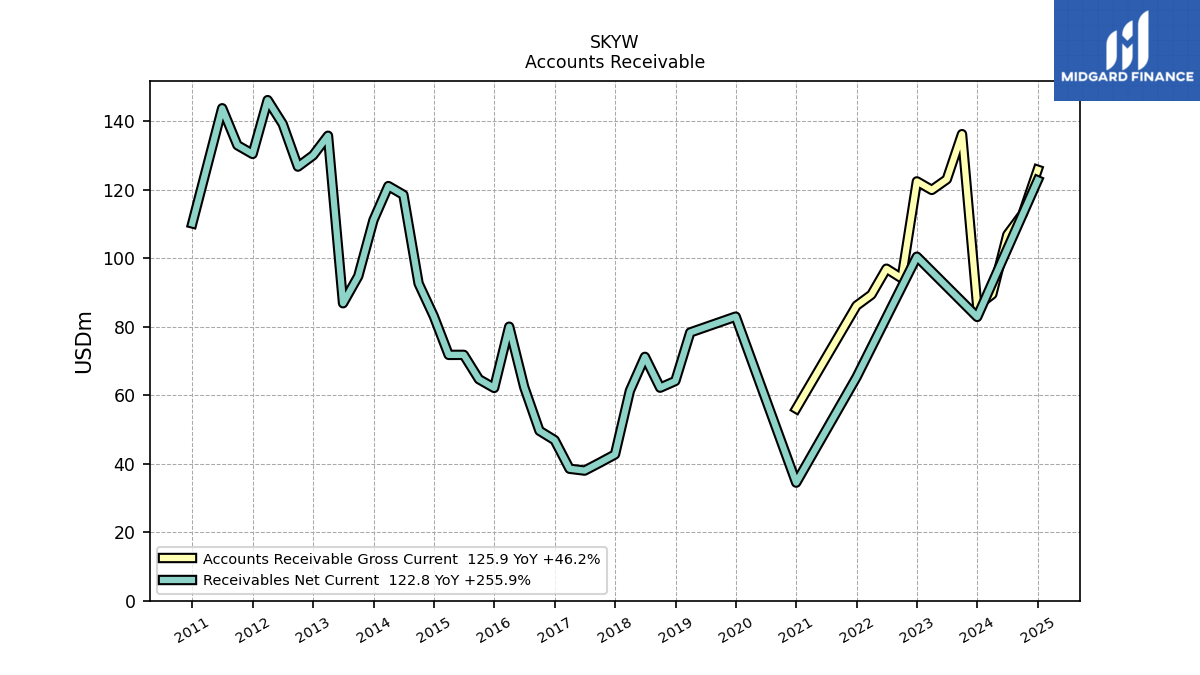
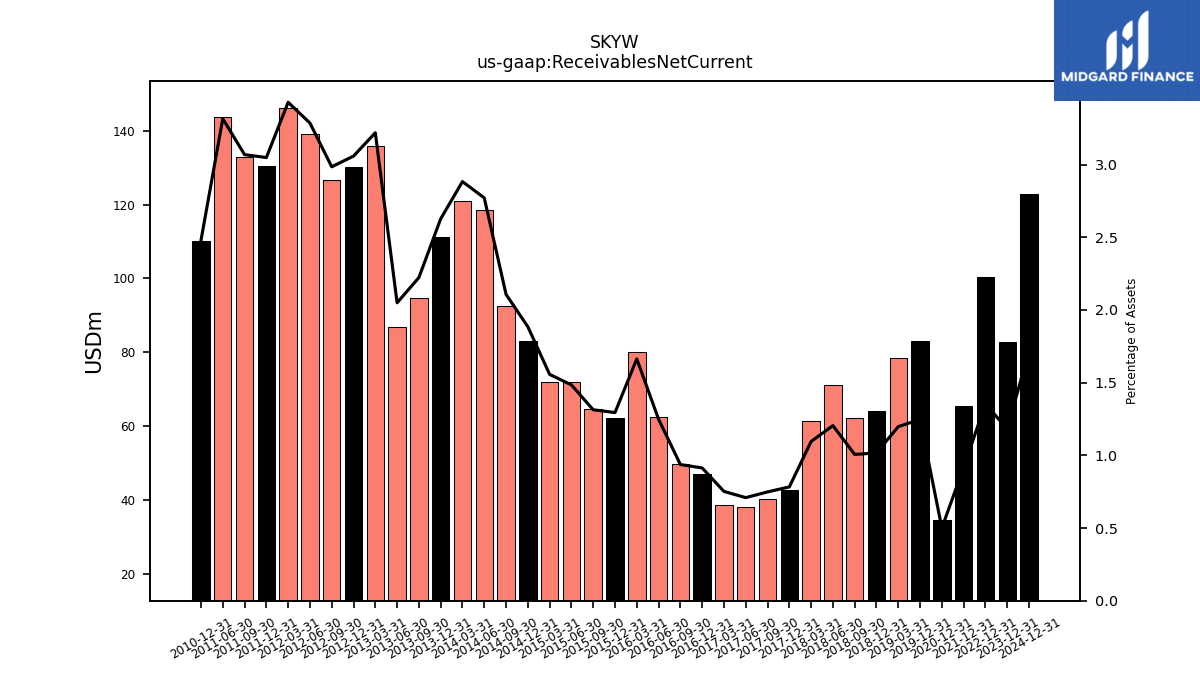
| Receivables Net Current | NA | 82.90 | NA | NA | NA | 100.50 | NA | NA | NA | 65.30 | NA | NA | NA | 34.50 | NA | NA | NA | 83.00 | NA | NA | 78.37 | 64.19 | 62.23 | 71.24 | 61.33 | 42.73 | 40.34 | 38.02 | 38.56 | 46.92 | 49.65 | 62.38 | 80.05 | 62.16 | 64.70 | 71.83 | 71.82 | 83.10 | 92.66 | 118.58 | 121.13 | 111.19 | 94.81 | 86.89 | 135.83 | 130.10 | 126.81 | 139.26 | 146.23 | 130.51 | 133.06 | 143.86 | NA | 110.21 | NA | NA | NA | |
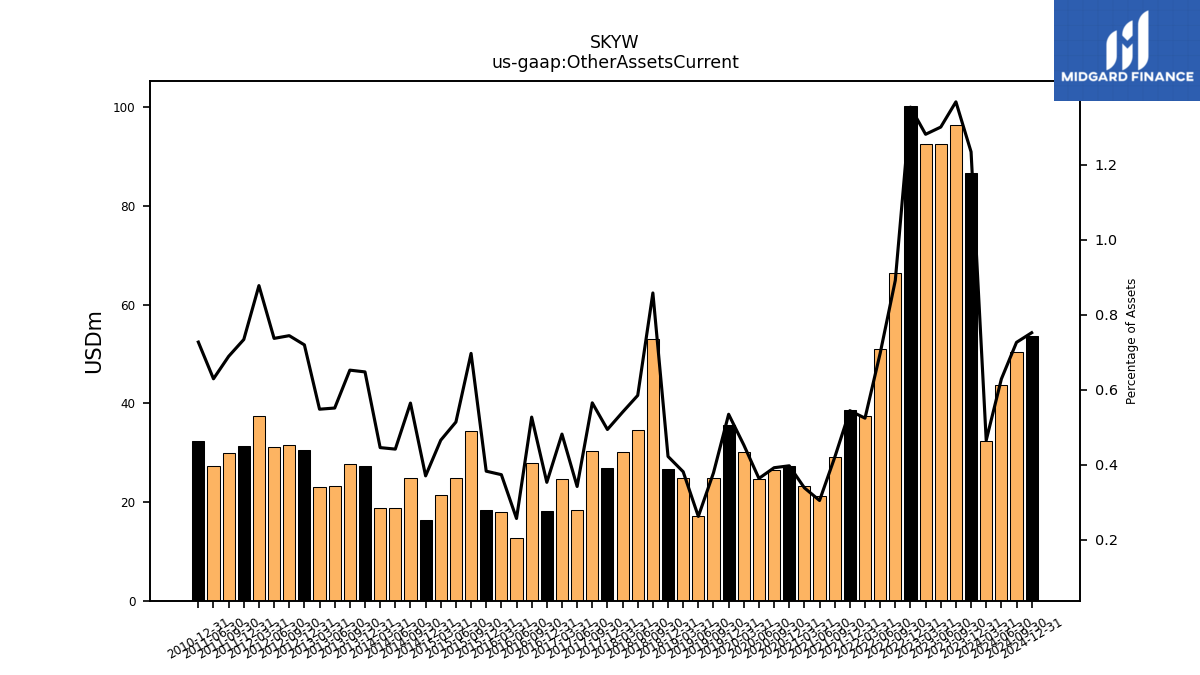
| Other Assets Current | 32.45 | 86.70 | 96.52 | 92.51 | 92.65 | 100.33 | 66.43 | 51.10 | 37.44 | 38.74 | 29.08 | 21.26 | 23.29 | 27.32 | 26.46 | 24.58 | 30.13 | 35.55 | 24.93 | 17.22 | 24.92 | 26.61 | 53.04 | 34.55 | 30.23 | 26.94 | 30.42 | 18.30 | 24.68 | 18.11 | 27.90 | 12.80 | 17.95 | 18.36 | 34.31 | 24.84 | 21.45 | 16.31 | 24.80 | 18.88 | 18.71 | 27.39 | 27.80 | 23.35 | 23.11 | 30.60 | 31.60 | 31.22 | 37.42 | 31.41 | 29.86 | 27.28 | NA | 32.31 | NA | NA | NA | |
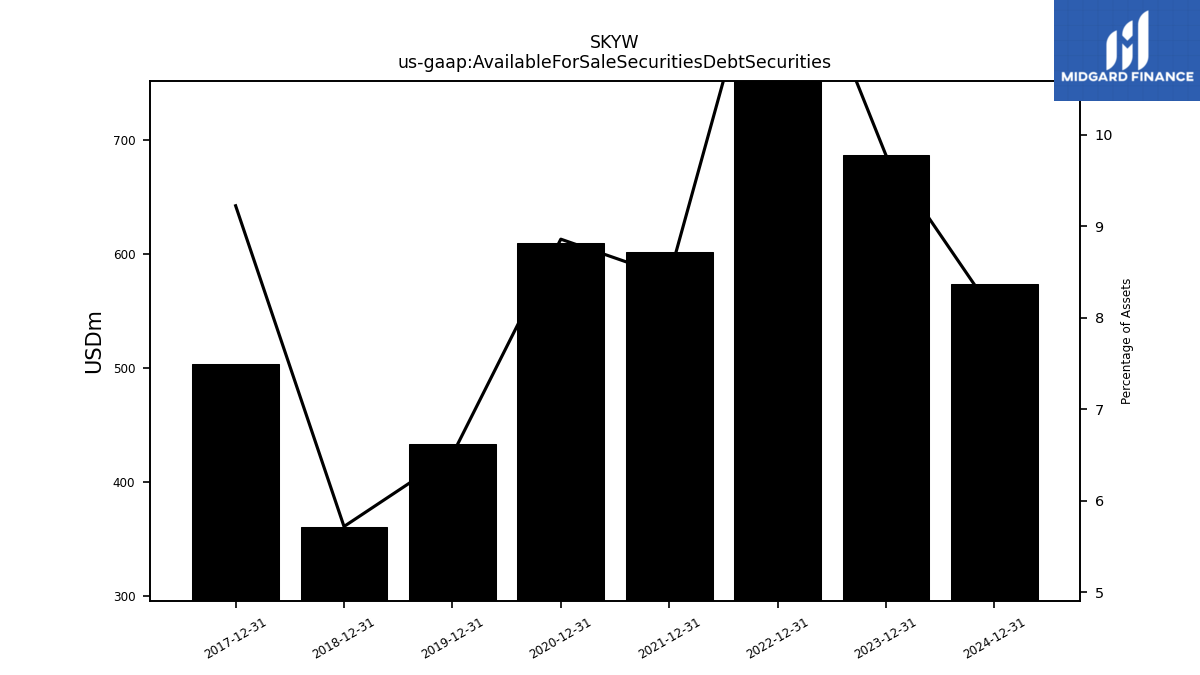
| Available For Sale Securities Debt Securities | NA | 686.95 | NA | NA | NA | 944.23 | NA | NA | NA | 601.99 | NA | NA | NA | 610.18 | NA | NA | NA | 432.97 | NA | NA | NA | 360.94 | NA | NA | NA | 503.50 | NA | NA | NA | NA | NA | NA | NA | NA | NA | NA | NA | NA | NA | NA | NA | NA | NA | NA | NA | NA | NA | NA | NA | NA | NA | NA | NA | NA | NA | NA | NA |
| 2024-03-31 | 2023-12-31 | 2023-09-30 | 2023-06-30 | 2023-03-31 | 2022-12-31 | 2022-09-30 | 2022-06-30 | 2022-03-31 | 2021-12-31 | 2021-09-30 | 2021-06-30 | 2021-03-31 | 2020-12-31 | 2020-09-30 | 2020-06-30 | 2020-03-31 | 2019-12-31 | 2019-09-30 | 2019-06-30 | 2019-03-31 | 2018-12-31 | 2018-09-30 | 2018-06-30 | 2018-03-31 | 2017-12-31 | 2017-09-30 | 2017-06-30 | 2017-03-31 | 2016-12-31 | 2016-09-30 | 2016-06-30 | 2016-03-31 | 2015-12-31 | 2015-09-30 | 2015-06-30 | 2015-03-31 | 2014-12-31 | 2014-09-30 | 2014-06-30 | 2014-03-31 | 2013-12-31 | 2013-09-30 | 2013-06-30 | 2013-03-31 | 2012-12-31 | 2012-09-30 | 2012-06-30 | 2012-03-31 | 2011-12-31 | 2011-09-30 | 2011-06-30 | 2011-03-31 | 2010-12-31 | 2010-09-30 | 2010-06-30 | 2010-03-31 | ||
|---|---|---|---|---|---|---|---|---|---|---|---|---|---|---|---|---|---|---|---|---|---|---|---|---|---|---|---|---|---|---|---|---|---|---|---|---|---|---|---|---|---|---|---|---|---|---|---|---|---|---|---|---|---|---|---|---|---|---|
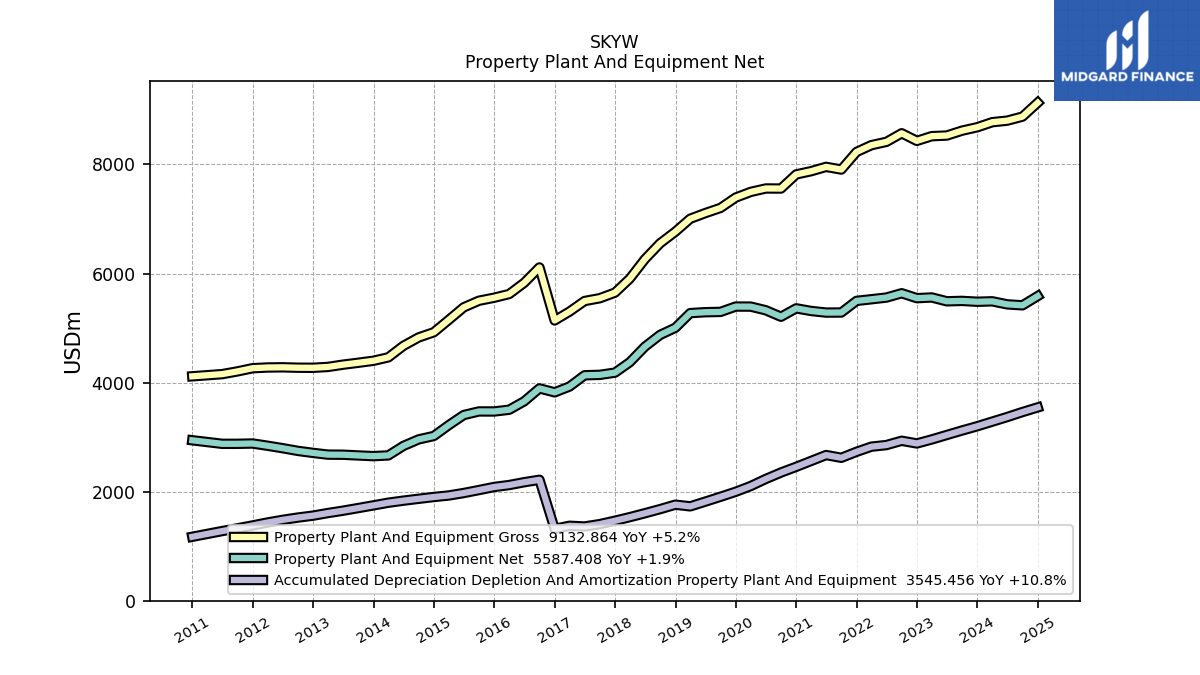
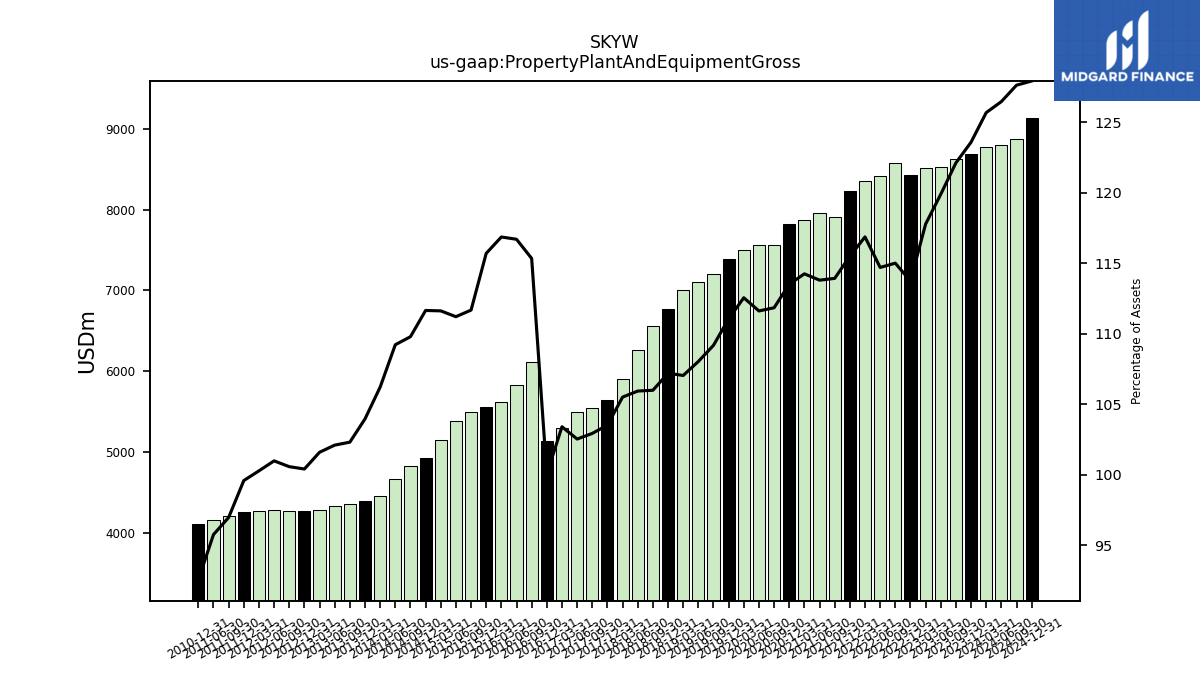
| Property Plant And Equipment Gross | 8775.43 | 8682.79 | 8619.97 | 8530.67 | 8519.25 | 8432.56 | 8572.43 | 8414.94 | 8354.42 | 8229.66 | 7906.87 | 7956.27 | 7876.78 | 7818.04 | 7558.80 | 7559.97 | 7497.32 | 7393.06 | 7203.04 | 7108.38 | 7005.25 | 6767.47 | 6555.38 | 6264.02 | 5908.55 | 5650.48 | 5547.47 | 5496.35 | 5302.97 | 5140.01 | 6112.50 | 5831.09 | 5624.35 | 5556.73 | 5501.54 | 5380.79 | 5149.51 | 4923.56 | 4828.01 | 4674.36 | 4463.17 | 4400.85 | 4364.02 | 4329.18 | 4287.72 | 4272.01 | 4273.30 | 4280.61 | 4277.52 | 4264.32 | 4205.52 | 4155.78 | NA | 4115.61 | NA | NA | NA | |
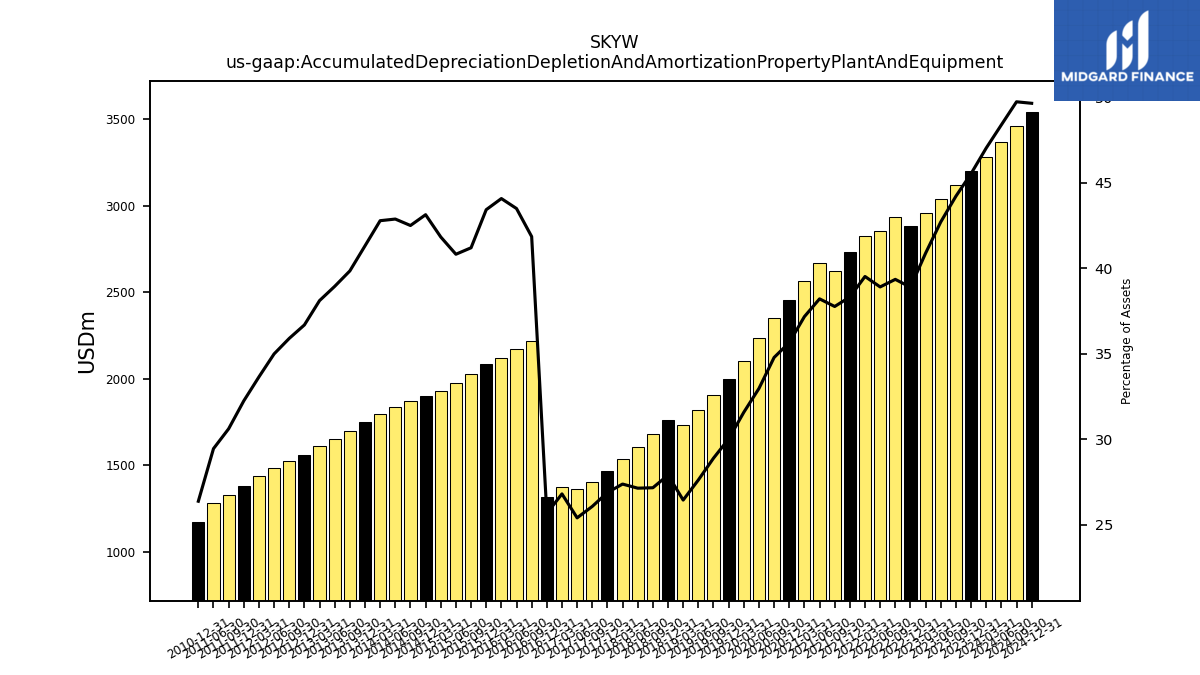
| Accumulated Depreciation Depletion And Amortization Property Plant And Equipment | 3284.61 | 3199.82 | 3121.55 | 3039.53 | 2957.80 | 2884.08 | 2933.66 | 2854.97 | 2825.60 | 2731.06 | 2621.41 | 2671.94 | 2563.12 | 2455.99 | 2351.05 | 2233.28 | 2103.59 | 1998.38 | 1906.35 | 1817.33 | 1730.68 | 1761.73 | 1680.12 | 1604.81 | 1533.35 | 1467.47 | 1405.21 | 1361.84 | 1374.67 | 1318.31 | 2218.39 | 2173.64 | 2121.77 | 2085.98 | 2029.91 | 1975.39 | 1930.11 | 1902.38 | 1869.30 | 1835.39 | 1797.99 | 1749.06 | 1699.77 | 1651.38 | 1608.54 | 1561.02 | 1525.44 | 1483.38 | 1435.40 | 1380.85 | 1327.67 | 1278.12 | NA | 1172.80 | NA | NA | NA | |
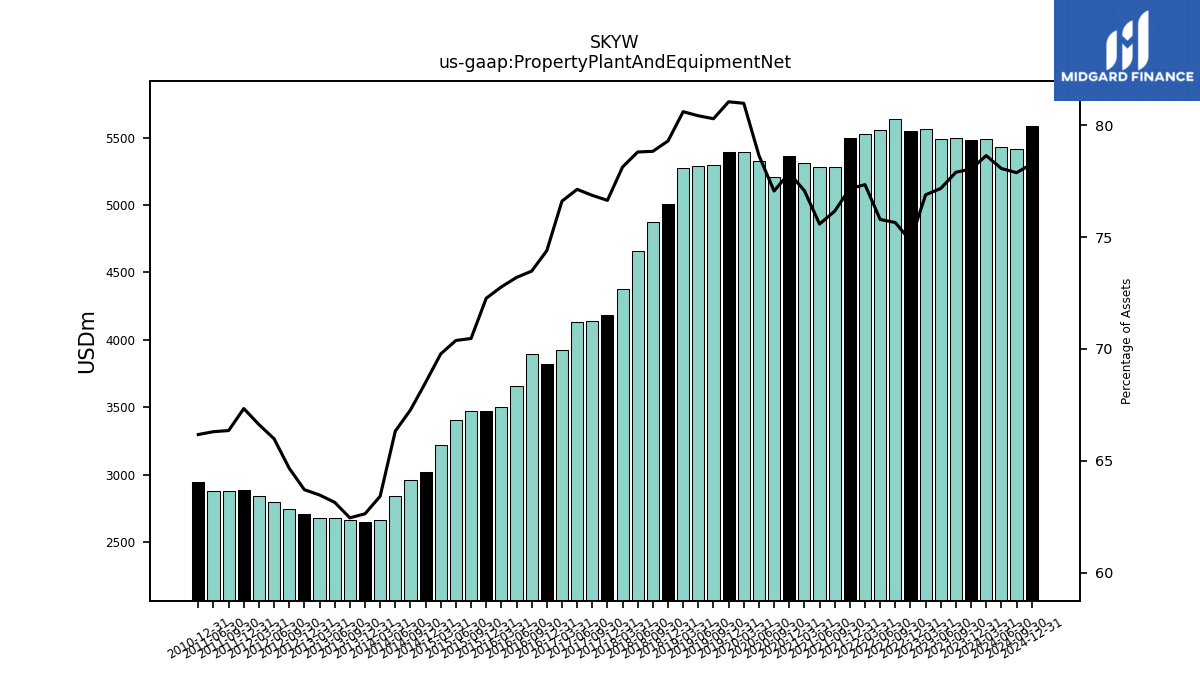
| Property Plant And Equipment Net | 5490.82 | 5482.97 | 5498.43 | 5491.14 | 5561.46 | 5548.48 | 5638.77 | 5559.98 | 5528.82 | 5498.60 | 5285.46 | 5284.33 | 5313.66 | 5362.05 | 5207.75 | 5326.70 | 5393.74 | 5394.68 | 5296.70 | 5291.05 | 5274.57 | 5005.74 | 4875.27 | 4659.20 | 4375.20 | 4183.00 | 4142.26 | 4134.52 | 3928.30 | 3821.70 | 3894.11 | 3657.45 | 3502.57 | 3470.75 | 3471.63 | 3405.40 | 3219.40 | 3021.19 | 2958.70 | 2838.97 | 2665.19 | 2651.79 | 2664.25 | 2677.80 | 2679.18 | 2711.00 | 2747.87 | 2797.24 | 2842.12 | 2883.47 | 2877.85 | 2877.66 | NA | 2942.82 | NA | NA | NA | |
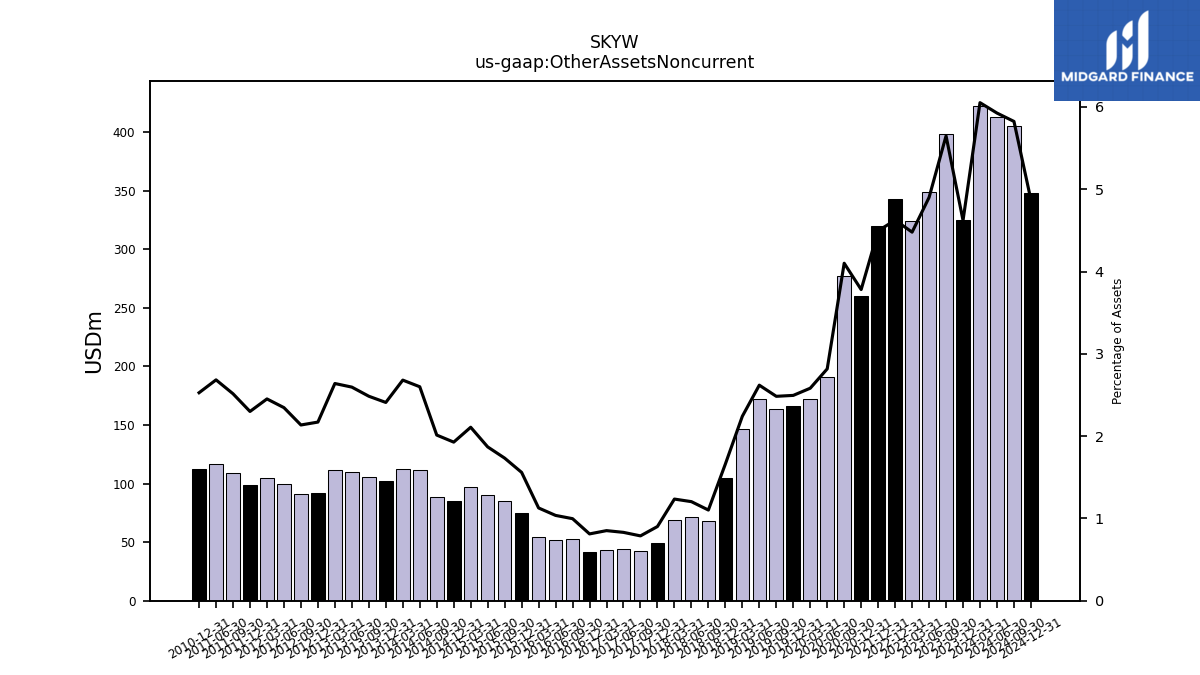
| Other Assets Noncurrent | 422.56 | 324.70 | 398.70 | 348.69 | 323.96 | 342.86 | NA | NA | NA | 320.24 | NA | NA | NA | 260.41 | 277.13 | 190.82 | 172.01 | 166.09 | 163.87 | 172.34 | 146.67 | 104.84 | 68.16 | 71.19 | 69.18 | 49.22 | 42.47 | 44.54 | 43.69 | 41.72 | 52.85 | 51.81 | 54.26 | 74.89 | 85.37 | 90.44 | 97.25 | 84.99 | 88.52 | 111.27 | 112.64 | 101.99 | 105.98 | 110.05 | 111.39 | 92.35 | 90.73 | 99.45 | 104.59 | 98.47 | 109.06 | 116.46 | NA | 112.38 | NA | NA | NA | |
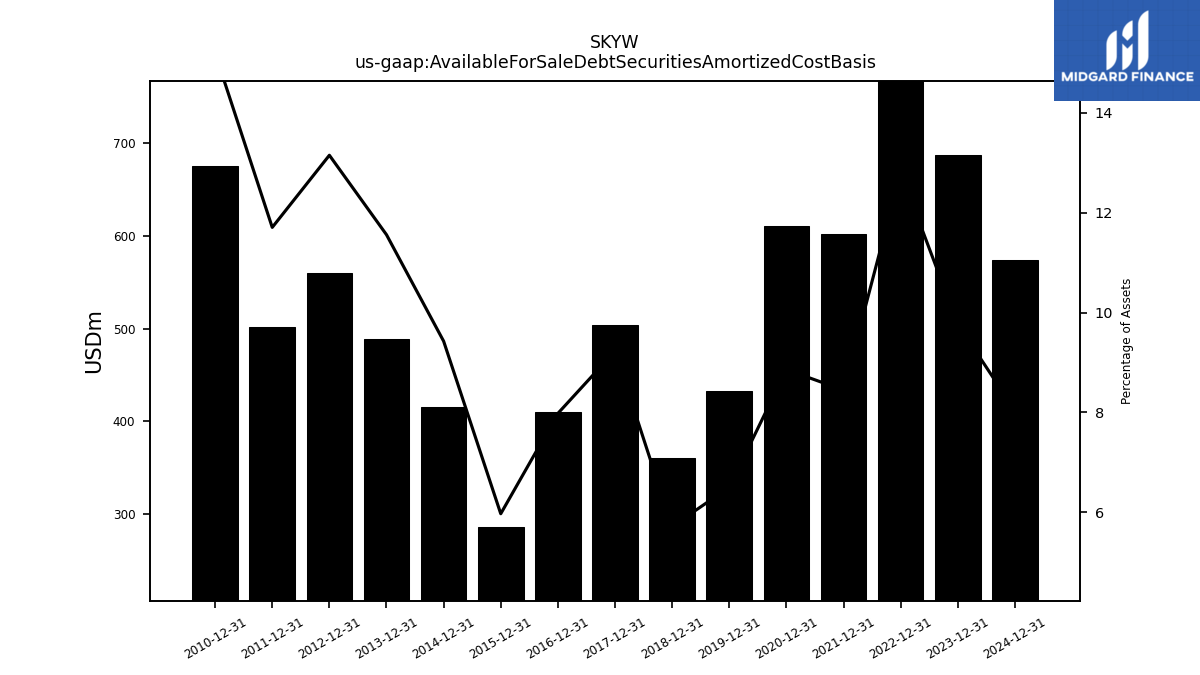
| Available For Sale Debt Securities Amortized Cost Basis | NA | 686.52 | NA | NA | NA | 949.26 | NA | NA | NA | 601.99 | NA | NA | NA | 610.18 | NA | NA | NA | 432.97 | NA | NA | NA | 360.99 | NA | NA | NA | 503.73 | NA | NA | NA | 410.01 | NA | NA | NA | 286.89 | NA | NA | NA | 415.73 | NA | NA | NA | 489.25 | NA | NA | NA | 559.41 | NA | NA | NA | 501.18 | NA | NA | NA | 675.48 | NA | NA | NA |
| 2024-03-31 | 2023-12-31 | 2023-09-30 | 2023-06-30 | 2023-03-31 | 2022-12-31 | 2022-09-30 | 2022-06-30 | 2022-03-31 | 2021-12-31 | 2021-09-30 | 2021-06-30 | 2021-03-31 | 2020-12-31 | 2020-09-30 | 2020-06-30 | 2020-03-31 | 2019-12-31 | 2019-09-30 | 2019-06-30 | 2019-03-31 | 2018-12-31 | 2018-09-30 | 2018-06-30 | 2018-03-31 | 2017-12-31 | 2017-09-30 | 2017-06-30 | 2017-03-31 | 2016-12-31 | 2016-09-30 | 2016-06-30 | 2016-03-31 | 2015-12-31 | 2015-09-30 | 2015-06-30 | 2015-03-31 | 2014-12-31 | 2014-09-30 | 2014-06-30 | 2014-03-31 | 2013-12-31 | 2013-09-30 | 2013-06-30 | 2013-03-31 | 2012-12-31 | 2012-09-30 | 2012-06-30 | 2012-03-31 | 2011-12-31 | 2011-09-30 | 2011-06-30 | 2011-03-31 | 2010-12-31 | 2010-09-30 | 2010-06-30 | 2010-03-31 | ||
|---|---|---|---|---|---|---|---|---|---|---|---|---|---|---|---|---|---|---|---|---|---|---|---|---|---|---|---|---|---|---|---|---|---|---|---|---|---|---|---|---|---|---|---|---|---|---|---|---|---|---|---|---|---|---|---|---|---|---|
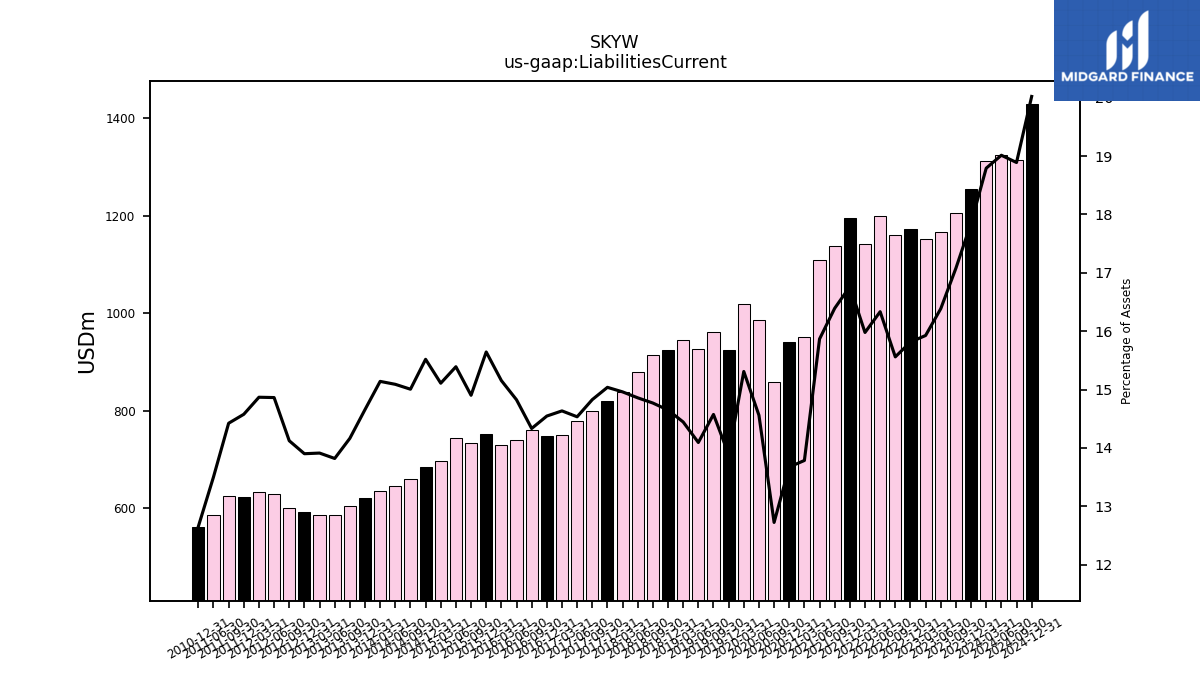
| Liabilities Current | 1312.30 | 1254.29 | 1205.67 | 1165.99 | 1152.10 | 1172.54 | 1159.89 | 1198.41 | 1142.29 | 1194.62 | 1137.76 | 1109.36 | 950.44 | 941.72 | 859.90 | 986.19 | 1019.84 | 924.68 | 961.54 | 927.33 | 945.33 | 924.83 | 913.45 | 878.60 | 837.82 | 820.83 | 799.13 | 779.09 | 750.51 | 747.26 | 759.62 | 740.79 | 729.38 | 751.39 | 734.13 | 744.72 | 697.07 | 684.36 | 659.91 | 645.83 | 636.19 | 620.46 | 604.16 | 585.95 | 587.13 | 591.42 | 600.07 | 630.02 | 634.24 | 624.15 | 625.50 | 585.95 | NA | 562.64 | NA | NA | NA | |
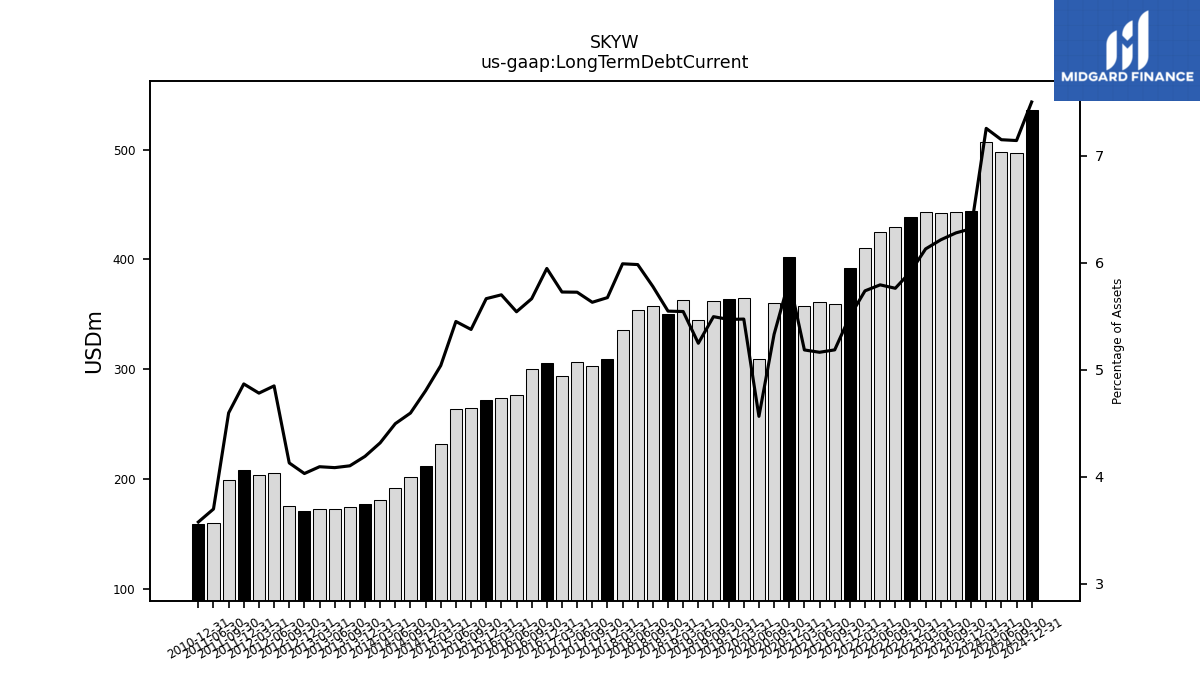
| Long Term Debt Current | 506.60 | 443.87 | 443.19 | 442.15 | 443.33 | 438.50 | 429.43 | 425.00 | 410.12 | 391.80 | 359.89 | 360.97 | 357.46 | 402.16 | 360.29 | 309.16 | 364.58 | 364.13 | 362.58 | 345.25 | 362.80 | 350.21 | 357.33 | 353.74 | 335.43 | 309.68 | 303.42 | 306.85 | 293.64 | 305.46 | 300.14 | 276.90 | 274.32 | 272.03 | 264.85 | 263.73 | 232.46 | 211.82 | 202.07 | 192.41 | 181.38 | 177.39 | 174.96 | 173.20 | 172.76 | 171.45 | 175.42 | 205.52 | 203.94 | 208.40 | 199.34 | 160.49 | NA | 159.04 | NA | NA | NA | |
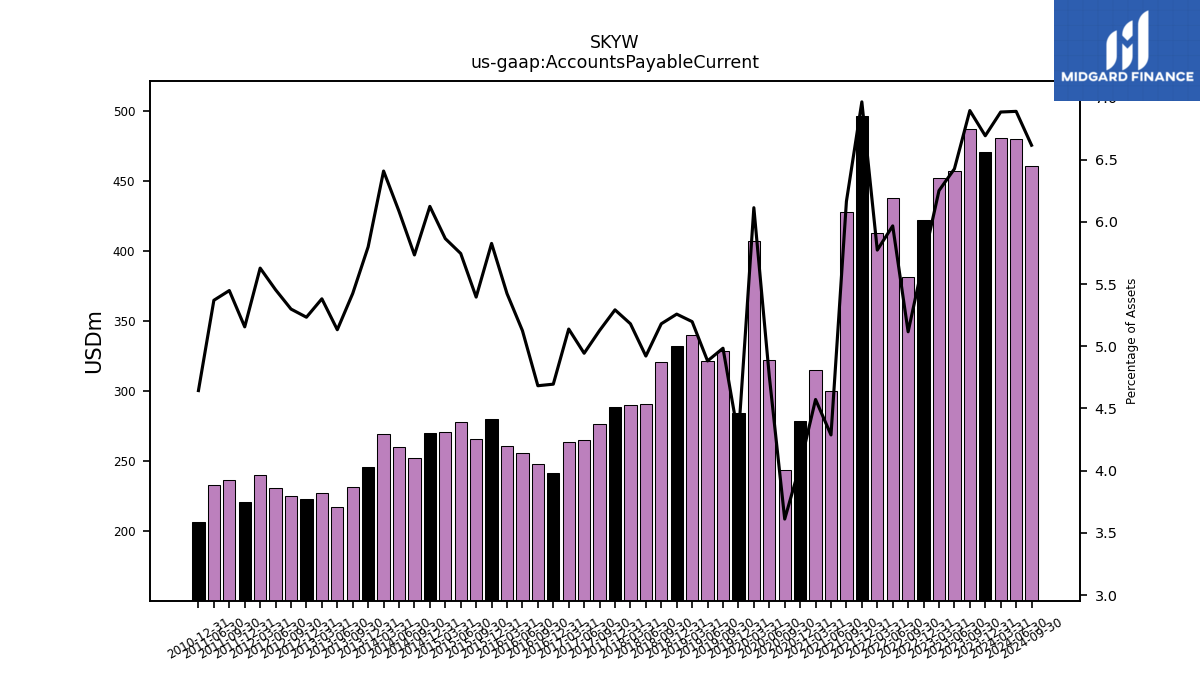
| Accounts Payable Current | 480.65 | 470.25 | 486.73 | 457.31 | 452.21 | 422.00 | 381.40 | 437.84 | 412.76 | 496.33 | 427.90 | 299.76 | 315.24 | 278.68 | 244.05 | 322.46 | 407.29 | 284.47 | 328.85 | 321.25 | 340.19 | 331.98 | 320.43 | 291.01 | 290.14 | 288.90 | 276.31 | 265.03 | 263.53 | 241.22 | 248.18 | 256.13 | 261.04 | 279.86 | 265.81 | 278.02 | 270.62 | 270.10 | 252.18 | 260.44 | 269.31 | 245.52 | 231.38 | 217.65 | 227.13 | 222.67 | 225.15 | 231.20 | 240.10 | 220.78 | 236.27 | 233.04 | NA | 206.49 | NA | NA | NA | |
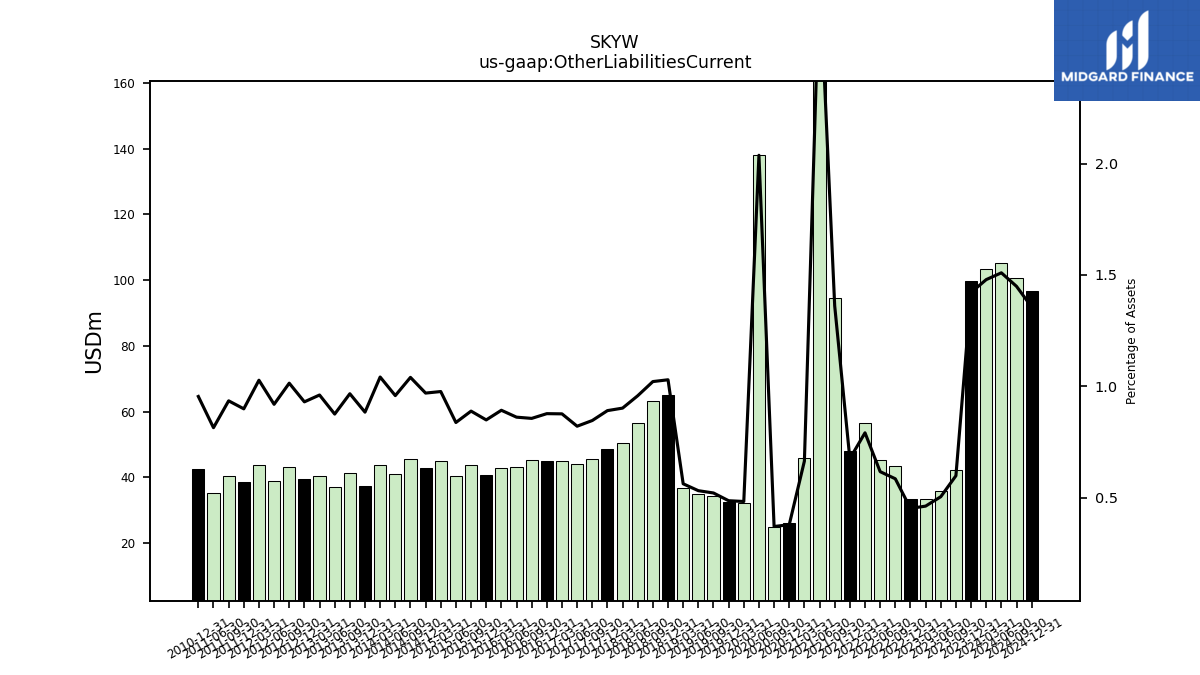
| Other Liabilities Current | 103.29 | 99.88 | 42.28 | 35.92 | 33.47 | 33.55 | 43.63 | 45.30 | 56.60 | 48.15 | 94.50 | 200.00 | 45.83 | 26.12 | 25.09 | 138.00 | 32.20 | 32.41 | 34.42 | 35.00 | 36.84 | 65.01 | 63.19 | 56.65 | 50.54 | 48.65 | 45.64 | 44.02 | 44.96 | 45.09 | 45.39 | 43.07 | 42.97 | 40.80 | 43.80 | 40.54 | 45.07 | 42.77 | 45.76 | 41.03 | 43.79 | 37.44 | 41.25 | 37.13 | 40.57 | 39.59 | 43.10 | 38.98 | 43.84 | 38.51 | 40.56 | 35.35 | NA | 42.46 | NA | NA | NA | |
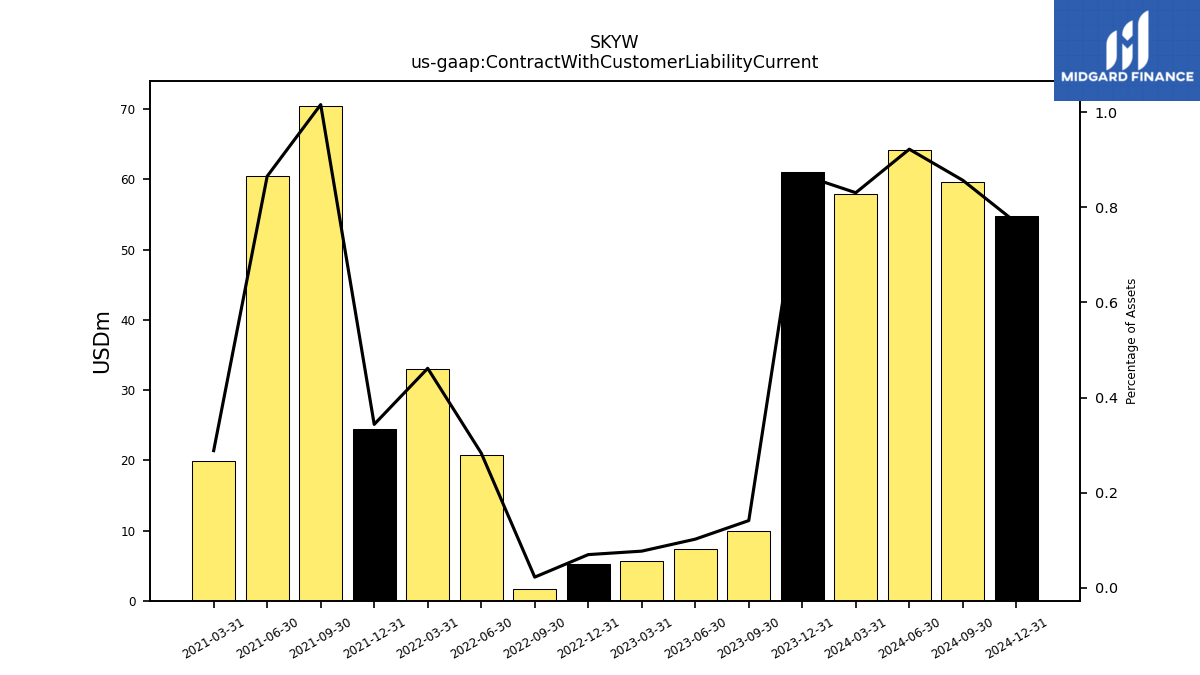
| Contract With Customer Liability Current | 58.00 | 61.00 | 10.00 | 7.30 | 5.60 | 5.20 | 1.70 | 20.80 | 33.00 | 24.50 | 70.50 | 60.50 | 19.90 | NA | NA | NA | NA | NA | NA | NA | NA | NA | NA | NA | NA | NA | NA | NA | NA | NA | NA | NA | NA | NA | NA | NA | NA | NA | NA | NA | NA | NA | NA | NA | NA | NA | NA | NA | NA | NA | NA | NA | NA | NA | NA | NA | NA |
| 2024-03-31 | 2023-12-31 | 2023-09-30 | 2023-06-30 | 2023-03-31 | 2022-12-31 | 2022-09-30 | 2022-06-30 | 2022-03-31 | 2021-12-31 | 2021-09-30 | 2021-06-30 | 2021-03-31 | 2020-12-31 | 2020-09-30 | 2020-06-30 | 2020-03-31 | 2019-12-31 | 2019-09-30 | 2019-06-30 | 2019-03-31 | 2018-12-31 | 2018-09-30 | 2018-06-30 | 2018-03-31 | 2017-12-31 | 2017-09-30 | 2017-06-30 | 2017-03-31 | 2016-12-31 | 2016-09-30 | 2016-06-30 | 2016-03-31 | 2015-12-31 | 2015-09-30 | 2015-06-30 | 2015-03-31 | 2014-12-31 | 2014-09-30 | 2014-06-30 | 2014-03-31 | 2013-12-31 | 2013-09-30 | 2013-06-30 | 2013-03-31 | 2012-12-31 | 2012-09-30 | 2012-06-30 | 2012-03-31 | 2011-12-31 | 2011-09-30 | 2011-06-30 | 2011-03-31 | 2010-12-31 | 2010-09-30 | 2010-06-30 | 2010-03-31 | ||
|---|---|---|---|---|---|---|---|---|---|---|---|---|---|---|---|---|---|---|---|---|---|---|---|---|---|---|---|---|---|---|---|---|---|---|---|---|---|---|---|---|---|---|---|---|---|---|---|---|---|---|---|---|---|---|---|---|---|---|
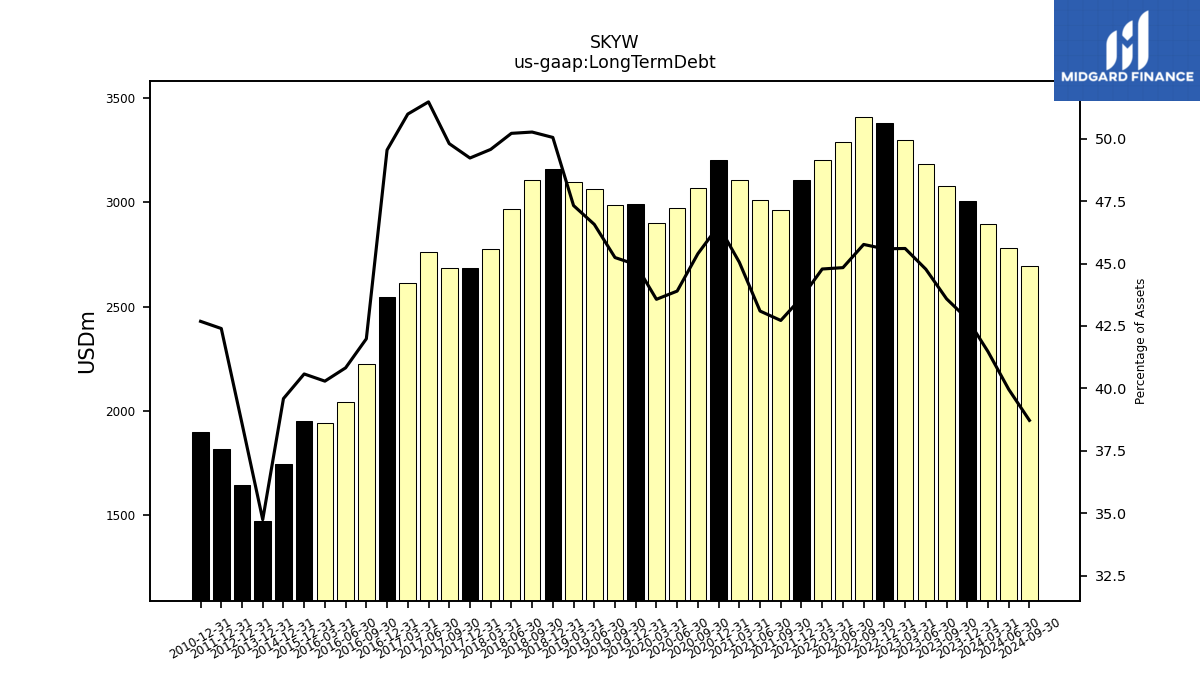
| Long Term Debt | 2895.83 | 3006.05 | 3076.89 | 3185.96 | 3298.85 | 3380.27 | 3411.46 | 3289.48 | 3201.40 | 3109.22 | 2964.95 | 3013.23 | 3106.18 | 3203.70 | 3068.06 | 2973.28 | 2902.19 | 2993.11 | 2984.82 | 3064.29 | 3097.11 | 3159.97 | 3109.05 | 2969.38 | 2776.20 | 2687.02 | 2684.22 | 2759.51 | 2614.91 | 2545.51 | 2225.13 | 2039.82 | 1939.09 | 1948.80 | NA | NA | NA | 1745.81 | NA | NA | NA | 1470.57 | NA | NA | NA | 1642.02 | NA | NA | NA | 1815.39 | NA | NA | NA | 1897.97 | NA | NA | NA | |
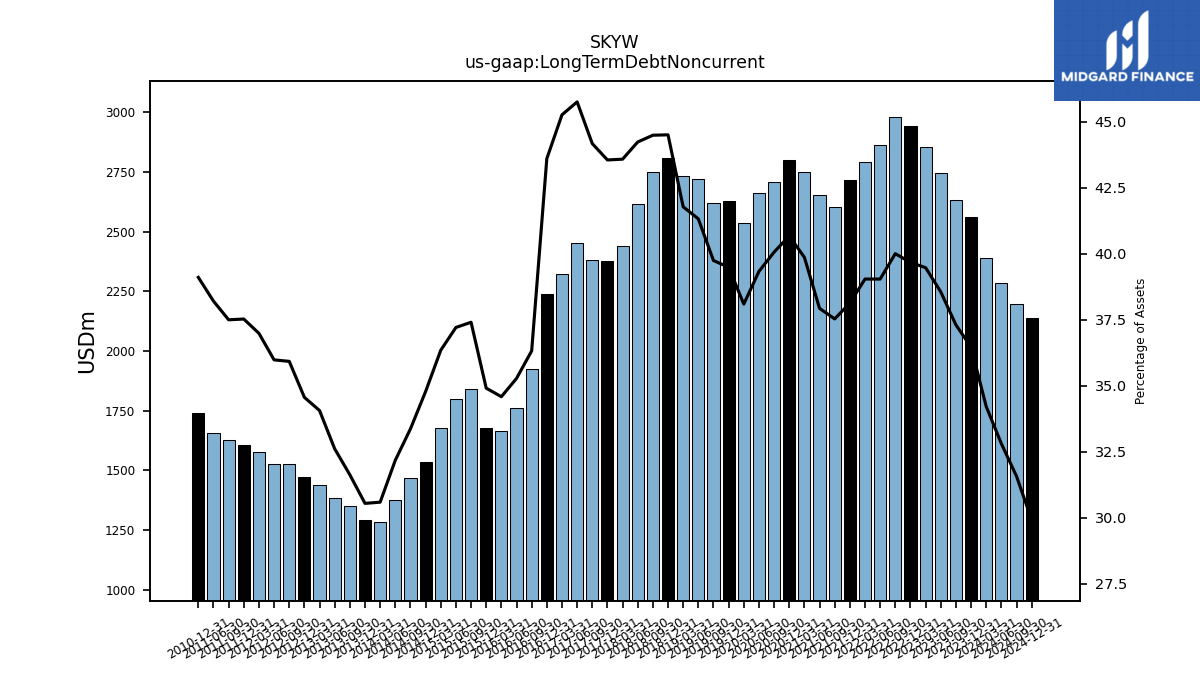
| Long Term Debt Noncurrent | 2389.23 | 2562.18 | 2633.71 | 2743.80 | 2855.52 | 2941.77 | 2982.03 | 2864.48 | 2791.27 | 2717.42 | 2605.06 | 2652.26 | 2748.72 | 2801.54 | 2707.77 | 2664.12 | 2537.61 | 2628.99 | 2622.24 | 2719.04 | 2734.32 | 2809.77 | 2751.72 | 2615.64 | 2440.77 | 2377.35 | 2380.79 | 2452.66 | 2321.27 | 2240.05 | 1924.99 | 1762.92 | 1664.77 | 1676.78 | 1842.86 | 1800.45 | 1676.91 | 1533.99 | 1467.51 | 1377.31 | 1285.54 | 1293.18 | 1349.21 | 1382.85 | 1437.63 | 1470.57 | 1526.46 | 1525.27 | 1577.77 | 1606.99 | 1626.33 | 1658.12 | NA | 1738.94 | NA | NA | NA | |
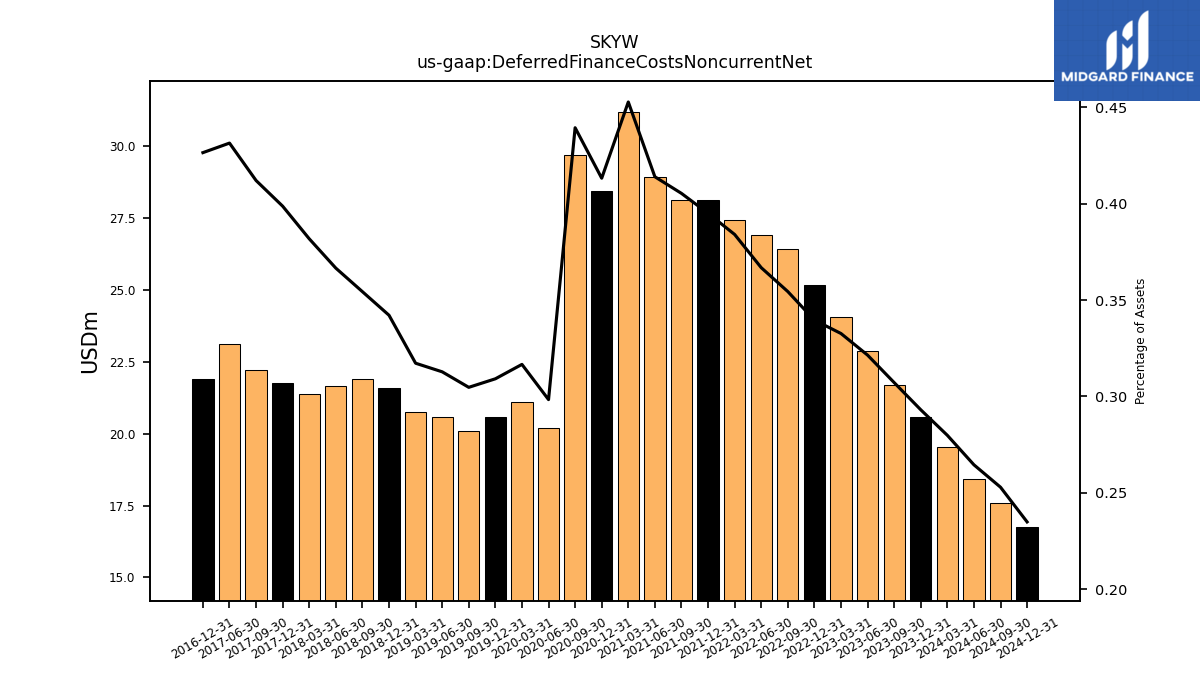
| Deferred Finance Costs Noncurrent Net | 19.54 | 20.59 | 21.68 | 22.87 | 24.06 | 25.18 | 26.42 | 26.91 | 27.45 | 28.15 | 28.13 | 28.94 | 31.21 | 28.46 | 29.70 | 20.21 | 21.09 | 20.58 | 20.10 | 20.58 | 20.76 | 21.60 | 21.91 | 21.67 | 21.38 | 21.76 | 22.20 | 23.13 | NA | 21.91 | NA | NA | NA | NA | NA | NA | NA | NA | NA | NA | NA | NA | NA | NA | NA | NA | NA | NA | NA | NA | NA | NA | NA | NA | NA | NA | NA | |
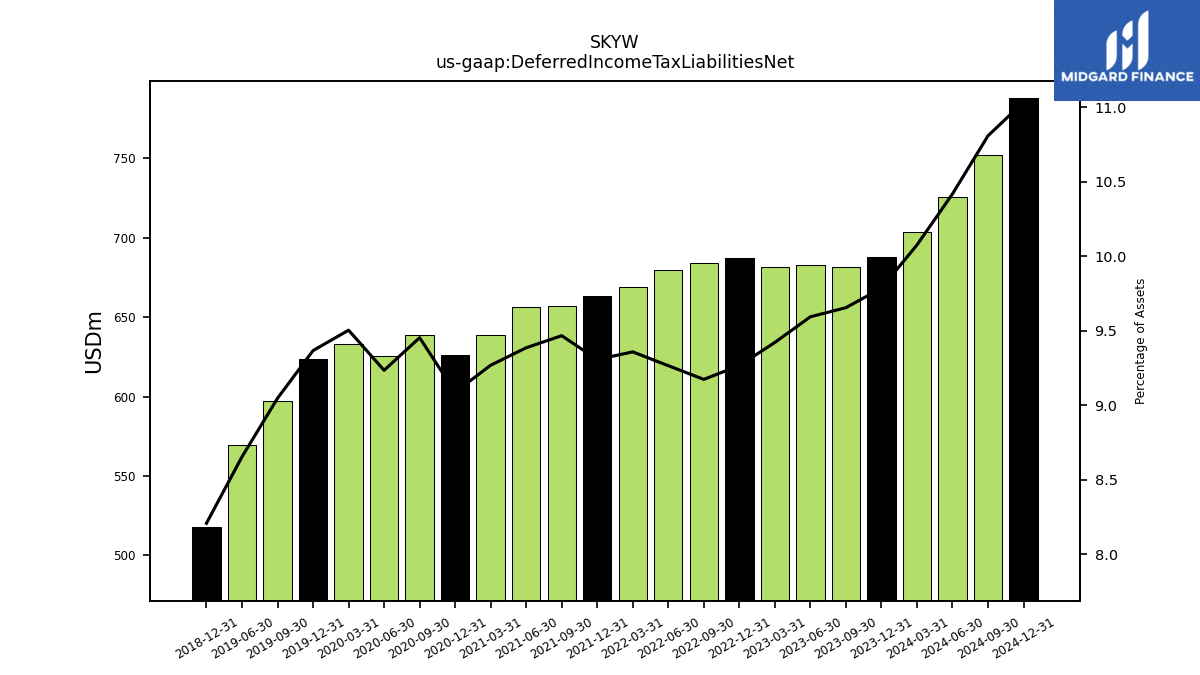
| Deferred Income Tax Liabilities Net | 703.60 | 687.60 | 681.58 | 682.69 | 681.55 | 687.06 | 683.83 | 679.79 | 669.03 | 663.24 | 657.07 | 656.26 | 639.05 | 625.93 | 638.94 | 625.50 | 633.11 | 623.58 | 596.90 | 569.44 | NA | 518.16 | NA | NA | NA | NA | NA | NA | NA | NA | NA | NA | NA | NA | NA | NA | NA | NA | NA | NA | NA | NA | NA | NA | NA | NA | NA | NA | NA | NA | NA | NA | NA | NA | NA | NA | NA | |
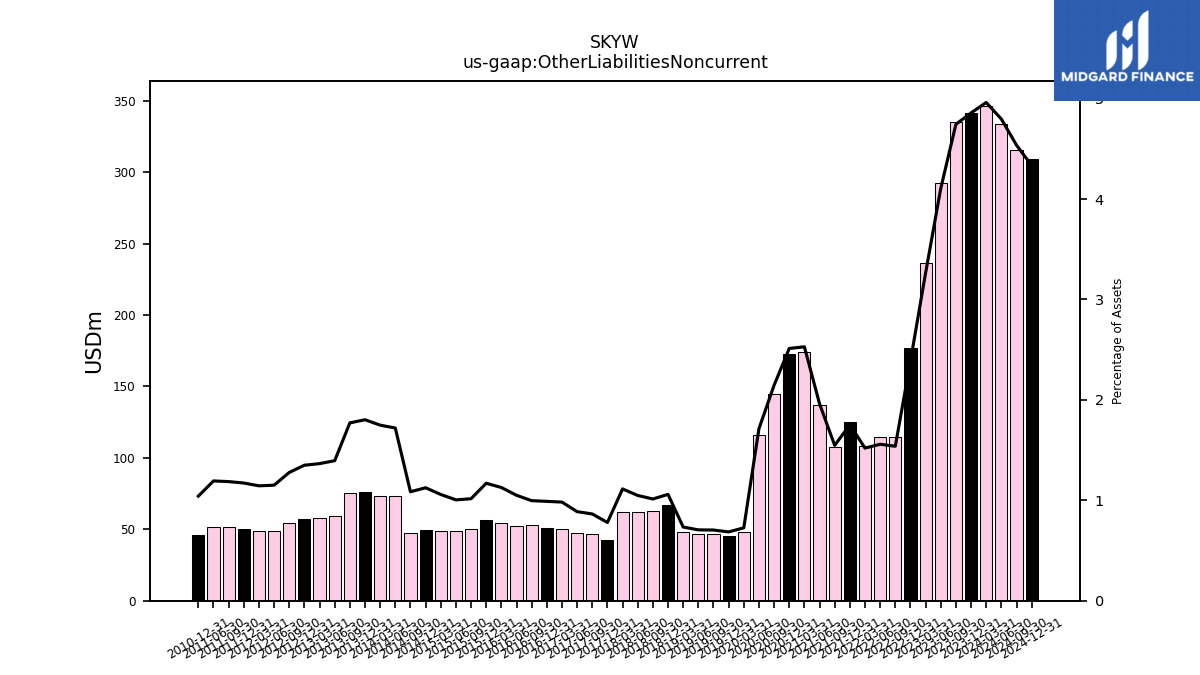
| Other Liabilities Noncurrent | 346.48 | 341.32 | 334.95 | 292.15 | 236.11 | 176.93 | 114.68 | 114.33 | 108.66 | 124.88 | 107.37 | 137.12 | 174.37 | 173.04 | 145.04 | 116.04 | 48.37 | 45.63 | 46.47 | 46.45 | 48.04 | 66.87 | 62.68 | 62.00 | 62.36 | 42.54 | 46.57 | 47.56 | 50.39 | 50.84 | 52.82 | 52.47 | 54.28 | 56.19 | 50.05 | 48.60 | 48.83 | 49.62 | 47.73 | 73.61 | 73.47 | 76.31 | 75.54 | 59.13 | 57.63 | 57.42 | 54.28 | 48.77 | 48.82 | 50.19 | 51.46 | 51.77 | NA | 46.33 | NA | NA | NA | |
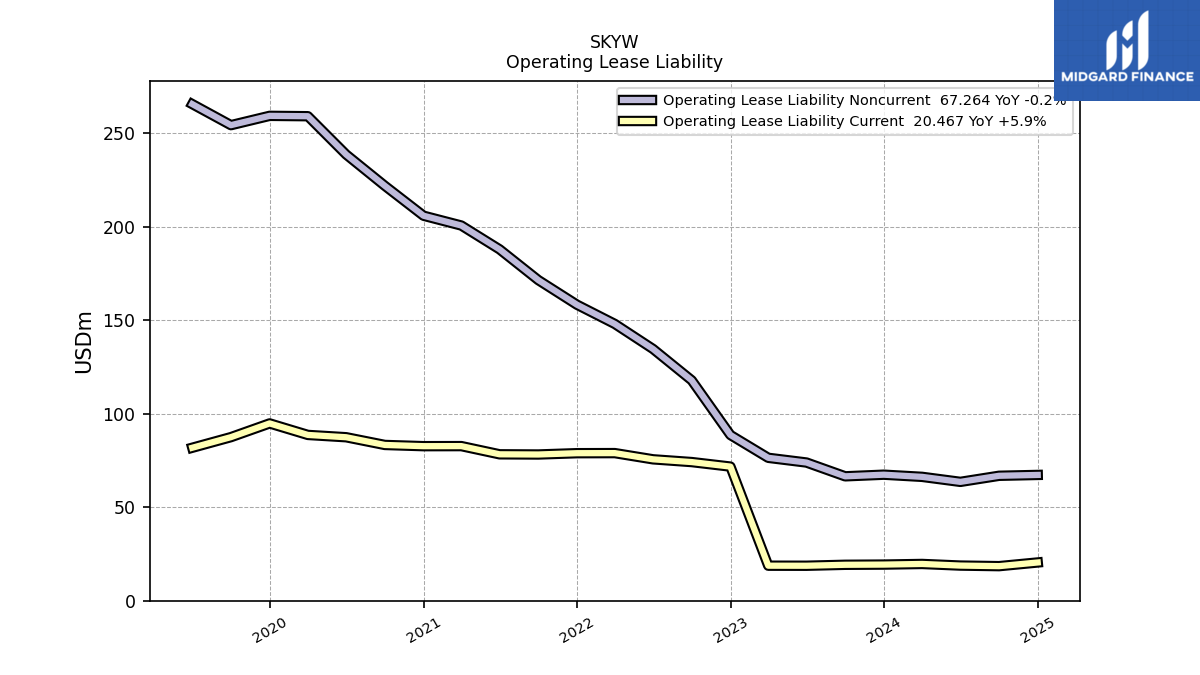
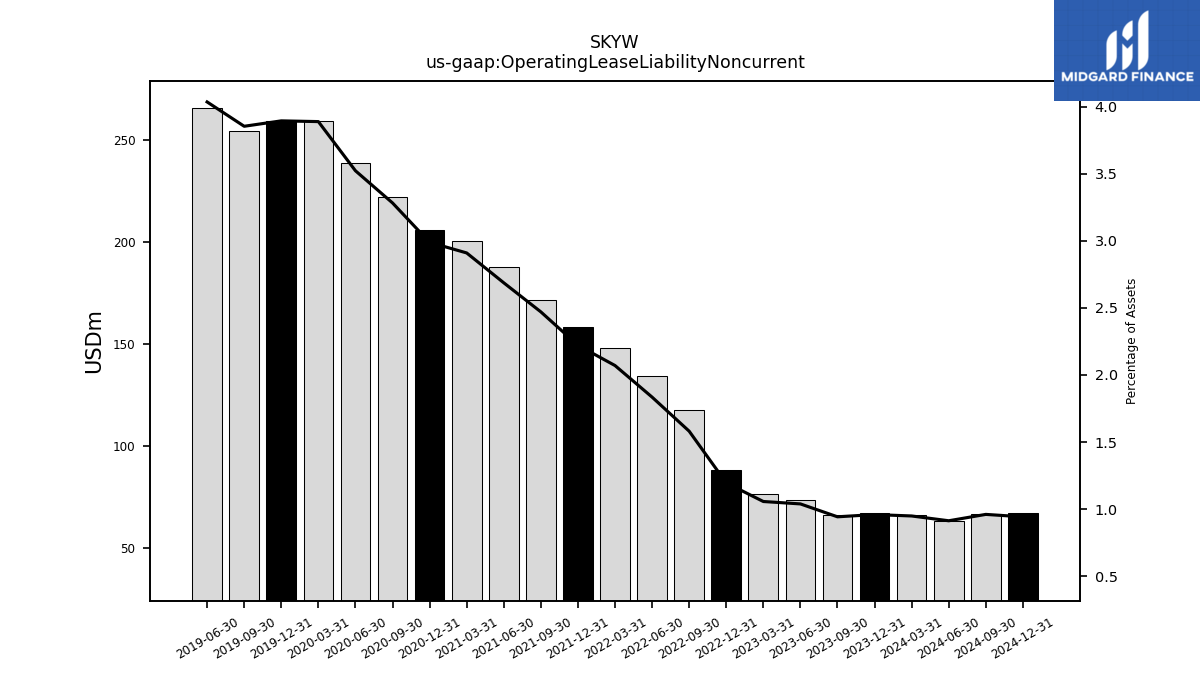
| Operating Lease Liability Noncurrent | 66.24 | 67.39 | 66.52 | 73.89 | 76.42 | 88.62 | 117.82 | 134.60 | 147.99 | 158.27 | 171.44 | 187.86 | 200.60 | 205.84 | 221.84 | 238.57 | 259.04 | 259.24 | 254.26 | 265.52 | NA | NA | NA | NA | NA | NA | NA | NA | NA | NA | NA | NA | NA | NA | NA | NA | NA | NA | NA | NA | NA | NA | NA | NA | NA | NA | NA | NA | NA | NA | NA | NA | NA | NA | NA | NA | NA |
| 2024-03-31 | 2023-12-31 | 2023-09-30 | 2023-06-30 | 2023-03-31 | 2022-12-31 | 2022-09-30 | 2022-06-30 | 2022-03-31 | 2021-12-31 | 2021-09-30 | 2021-06-30 | 2021-03-31 | 2020-12-31 | 2020-09-30 | 2020-06-30 | 2020-03-31 | 2019-12-31 | 2019-09-30 | 2019-06-30 | 2019-03-31 | 2018-12-31 | 2018-09-30 | 2018-06-30 | 2018-03-31 | 2017-12-31 | 2017-09-30 | 2017-06-30 | 2017-03-31 | 2016-12-31 | 2016-09-30 | 2016-06-30 | 2016-03-31 | 2015-12-31 | 2015-09-30 | 2015-06-30 | 2015-03-31 | 2014-12-31 | 2014-09-30 | 2014-06-30 | 2014-03-31 | 2013-12-31 | 2013-09-30 | 2013-06-30 | 2013-03-31 | 2012-12-31 | 2012-09-30 | 2012-06-30 | 2012-03-31 | 2011-12-31 | 2011-09-30 | 2011-06-30 | 2011-03-31 | 2010-12-31 | 2010-09-30 | 2010-06-30 | 2010-03-31 | ||
|---|---|---|---|---|---|---|---|---|---|---|---|---|---|---|---|---|---|---|---|---|---|---|---|---|---|---|---|---|---|---|---|---|---|---|---|---|---|---|---|---|---|---|---|---|---|---|---|---|---|---|---|---|---|---|---|---|---|---|
| Stockholders Equity | 2164.90 | 2113.50 | 2136.70 | 2157.24 | 2232.06 | 2347.63 | 2395.95 | 2345.03 | 2289.72 | 2267.51 | 2261.81 | 2248.91 | 2181.52 | 2139.55 | 2185.10 | 2142.96 | 2163.44 | 2175.01 | 2116.26 | 2052.24 | 2000.57 | 1964.28 | 1928.87 | 1860.65 | 1787.14 | 1754.32 | 1475.71 | 1422.54 | 1373.82 | 1350.94 | 1624.11 | 1577.35 | 1535.90 | 1506.43 | 1461.70 | 1423.21 | 1410.55 | 1400.35 | 1429.07 | 1388.29 | 1409.22 | 1434.94 | 1427.45 | 1411.22 | 1392.16 | 1387.17 | 1372.41 | 1350.63 | 1334.41 | 1334.26 | 1358.86 | NA | NA | 1420.92 | NA | NA | NA | |
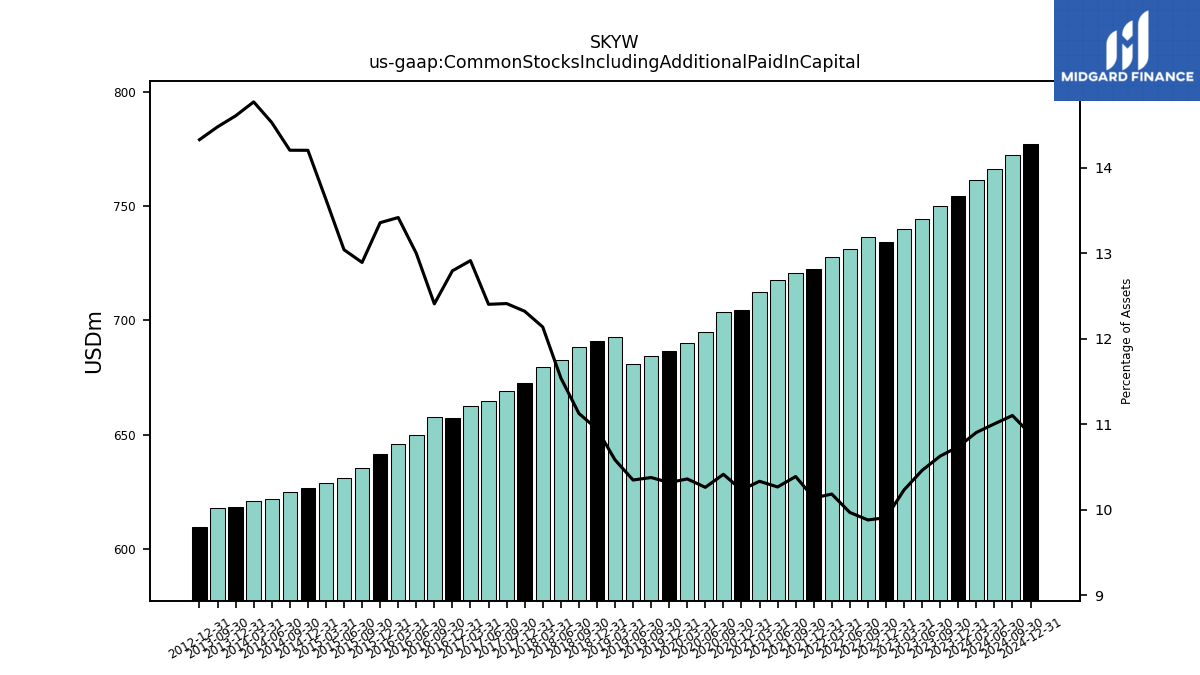
| Common Stocks Including Additional Paid In Capital | 761.32 | 754.36 | 750.13 | 744.28 | 740.03 | 734.43 | 736.41 | 731.21 | 727.90 | 722.31 | 720.93 | 717.71 | 712.32 | 704.67 | 703.78 | 695.00 | 690.07 | 686.81 | 684.54 | 680.80 | 692.59 | 690.91 | 688.17 | 682.54 | 679.77 | 672.59 | 668.97 | 664.92 | 662.34 | 657.35 | 657.66 | 649.62 | 645.91 | 641.64 | 635.22 | 631.08 | 628.88 | 626.52 | 624.81 | 621.96 | 620.80 | 618.51 | 617.70 | NA | NA | 609.76 | NA | NA | NA | NA | NA | NA | NA | NA | NA | NA | NA | |
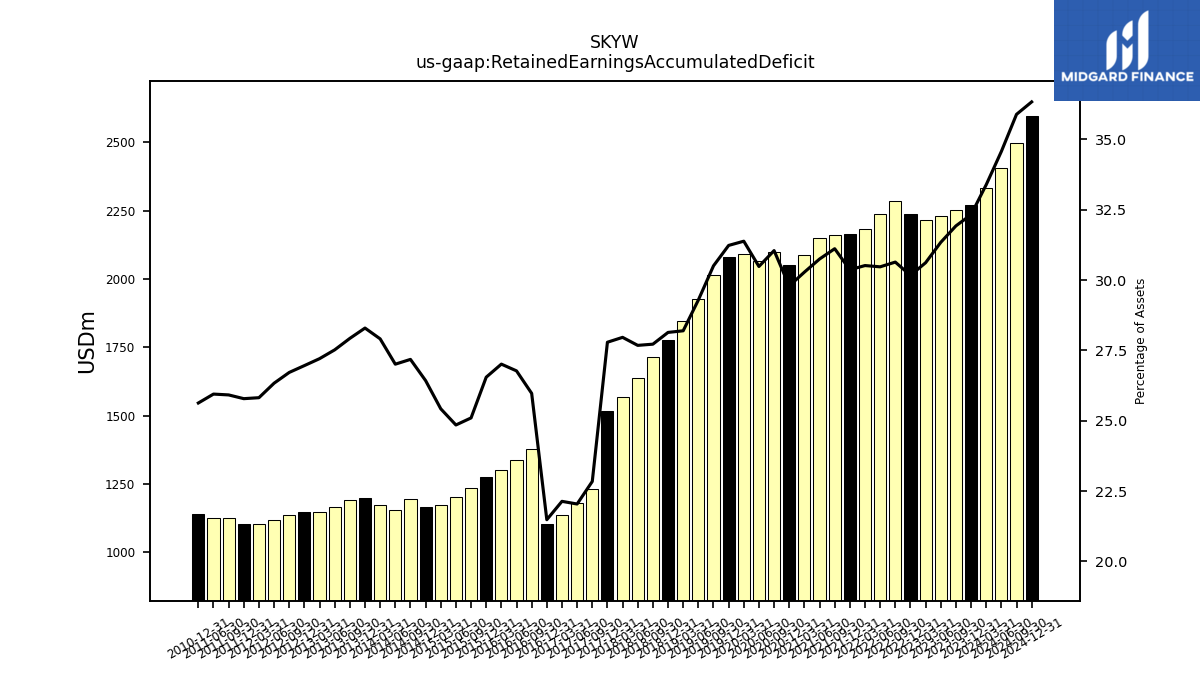
| Retained Earnings Accumulated Deficit | 2331.51 | 2271.21 | 2253.70 | 2230.22 | 2214.80 | 2236.87 | 2283.97 | 2235.60 | 2181.65 | 2163.92 | 2159.58 | 2149.90 | 2087.91 | 2052.01 | 2098.46 | 2064.79 | 2090.51 | 2079.18 | 2012.69 | 1927.41 | 1845.47 | 1776.59 | 1714.62 | 1636.77 | 1566.11 | 1516.96 | 1231.17 | 1181.60 | 1135.27 | 1103.75 | 1376.59 | 1337.85 | 1300.18 | 1275.14 | 1236.63 | 1202.44 | 1173.03 | 1165.48 | 1195.35 | 1156.07 | 1172.87 | 1197.82 | 1191.27 | 1166.92 | 1148.28 | 1147.12 | 1135.23 | 1116.35 | 1101.42 | 1104.14 | 1124.07 | 1126.11 | NA | 1139.74 | NA | NA | NA | |
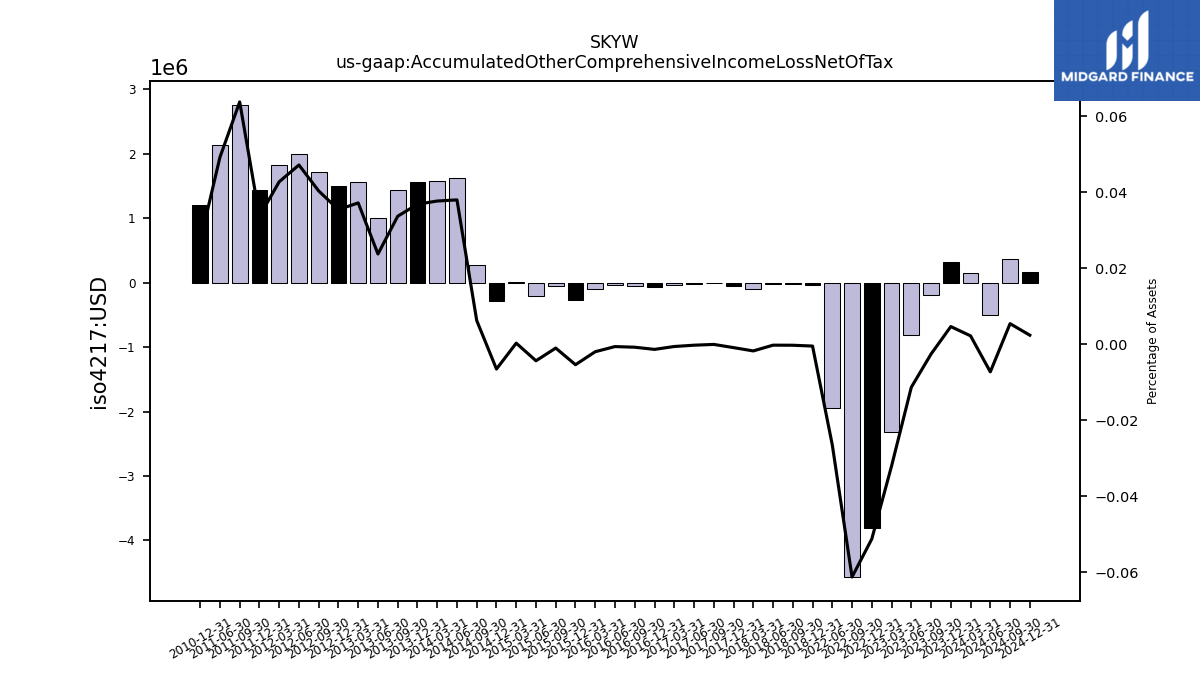
| Accumulated Other Comprehensive Income Loss Net Of Tax | 0.15 | 0.33 | -0.18 | -0.81 | -2.32 | -3.80 | -4.57 | -1.95 | NA | NA | NA | NA | NA | NA | NA | NA | NA | NA | NA | NA | NA | -0.03 | -0.02 | -0.02 | -0.10 | -0.05 | -0.00 | -0.01 | -0.03 | -0.07 | -0.04 | -0.03 | -0.10 | -0.26 | -0.05 | -0.21 | 0.01 | -0.29 | 0.27 | 1.62 | 1.58 | 1.56 | 1.44 | 1.01 | 1.57 | 1.51 | 1.71 | 2.00 | 1.82 | 1.44 | 2.77 | 2.13 | NA | 1.20 | NA | NA | NA |
| 2024-03-31 | 2023-12-31 | 2023-09-30 | 2023-06-30 | 2023-03-31 | 2022-12-31 | 2022-09-30 | 2022-06-30 | 2022-03-31 | 2021-12-31 | 2021-09-30 | 2021-06-30 | 2021-03-31 | 2020-12-31 | 2020-09-30 | 2020-06-30 | 2020-03-31 | 2019-12-31 | 2019-09-30 | 2019-06-30 | 2019-03-31 | 2018-12-31 | 2018-09-30 | 2018-06-30 | 2018-03-31 | 2017-12-31 | 2017-09-30 | 2017-06-30 | 2017-03-31 | 2016-12-31 | 2016-09-30 | 2016-06-30 | 2016-03-31 | 2015-12-31 | 2015-09-30 | 2015-06-30 | 2015-03-31 | 2014-12-31 | 2014-09-30 | 2014-06-30 | 2014-03-31 | 2013-12-31 | 2013-09-30 | 2013-06-30 | 2013-03-31 | 2012-12-31 | 2012-09-30 | 2012-06-30 | 2012-03-31 | 2011-12-31 | 2011-09-30 | 2011-06-30 | 2011-03-31 | 2010-12-31 | 2010-09-30 | 2010-06-30 | 2010-03-31 | ||
|---|---|---|---|---|---|---|---|---|---|---|---|---|---|---|---|---|---|---|---|---|---|---|---|---|---|---|---|---|---|---|---|---|---|---|---|---|---|---|---|---|---|---|---|---|---|---|---|---|---|---|---|---|---|---|---|---|---|---|
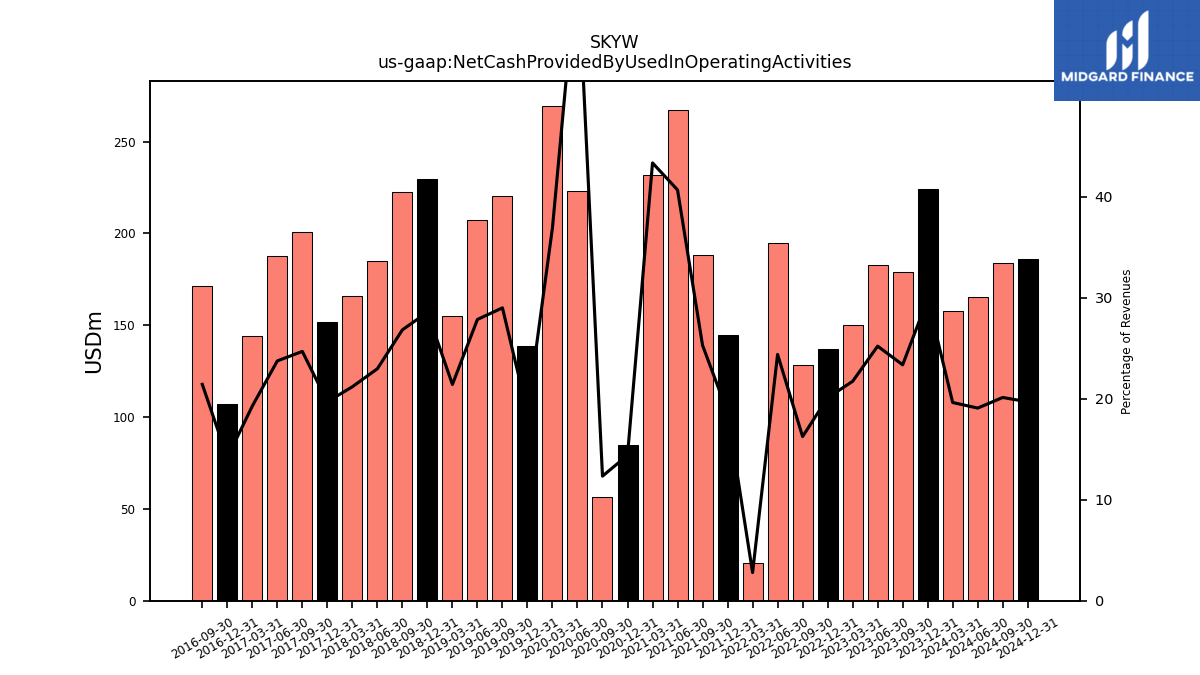
| Net Cash Provided By Used In Operating Activities | 157.65 | 224.43 | 178.88 | 182.82 | 150.20 | 136.84 | 128.26 | 194.77 | 20.51 | 144.87 | 188.27 | 267.10 | 231.59 | 84.86 | 56.42 | 222.80 | 269.48 | 138.56 | 220.34 | 207.21 | 154.91 | 229.41 | 222.31 | 184.93 | 165.90 | 151.84 | 200.51 | 187.84 | 143.94 | 107.35 | 171.28 | NA | NA | NA | NA | NA | NA | NA | NA | NA | NA | NA | NA | NA | NA | NA | NA | NA | NA | NA | NA | NA | NA | NA | NA | NA | NA | |
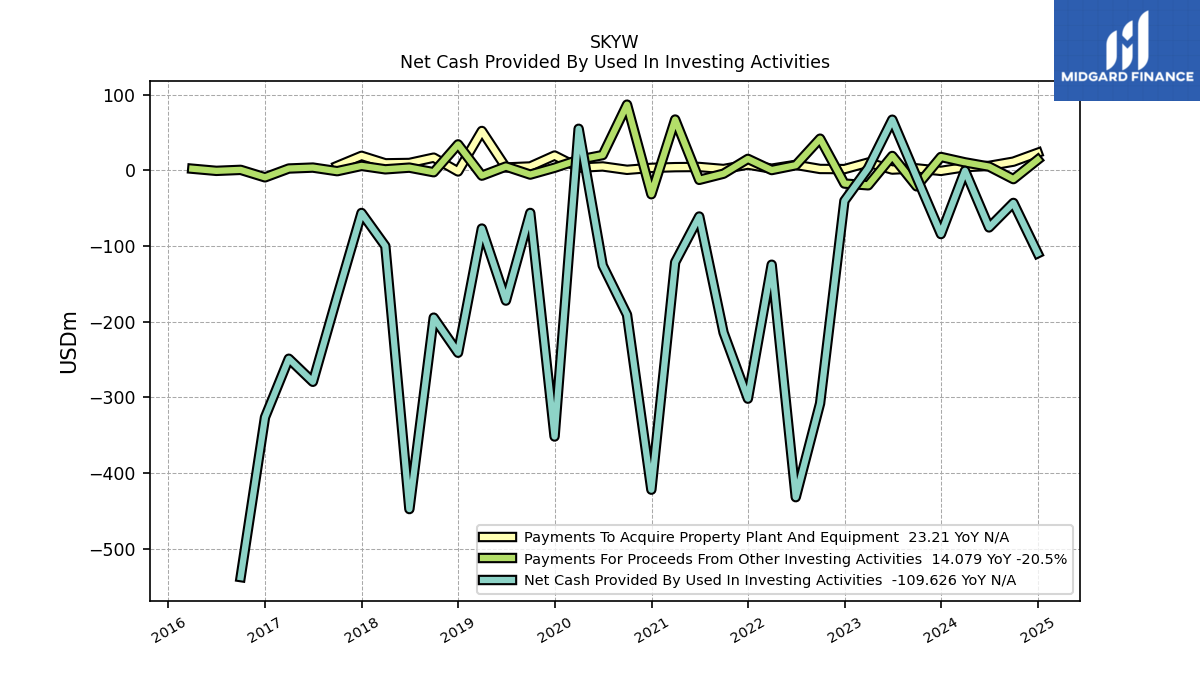
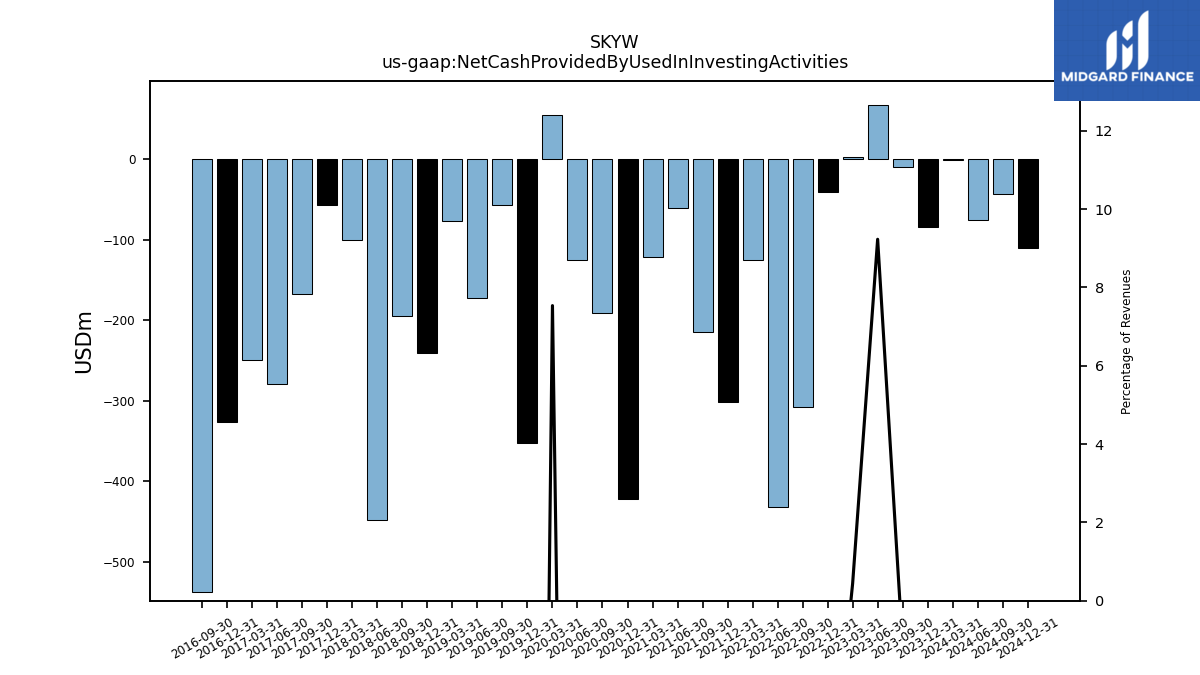
| Net Cash Provided By Used In Investing Activities | -0.55 | -84.23 | -8.99 | 66.96 | 3.03 | -40.33 | -307.98 | -431.92 | -124.67 | -301.74 | -214.40 | -60.97 | -121.41 | -422.02 | -190.82 | -125.61 | 54.99 | -351.74 | -56.24 | -172.14 | -76.91 | -241.05 | -194.62 | -447.66 | -100.07 | -56.28 | -166.71 | -279.43 | -248.91 | -326.35 | -537.54 | NA | NA | NA | NA | NA | NA | NA | NA | NA | NA | NA | NA | NA | NA | NA | NA | NA | NA | NA | NA | NA | NA | NA | NA | NA | NA | |
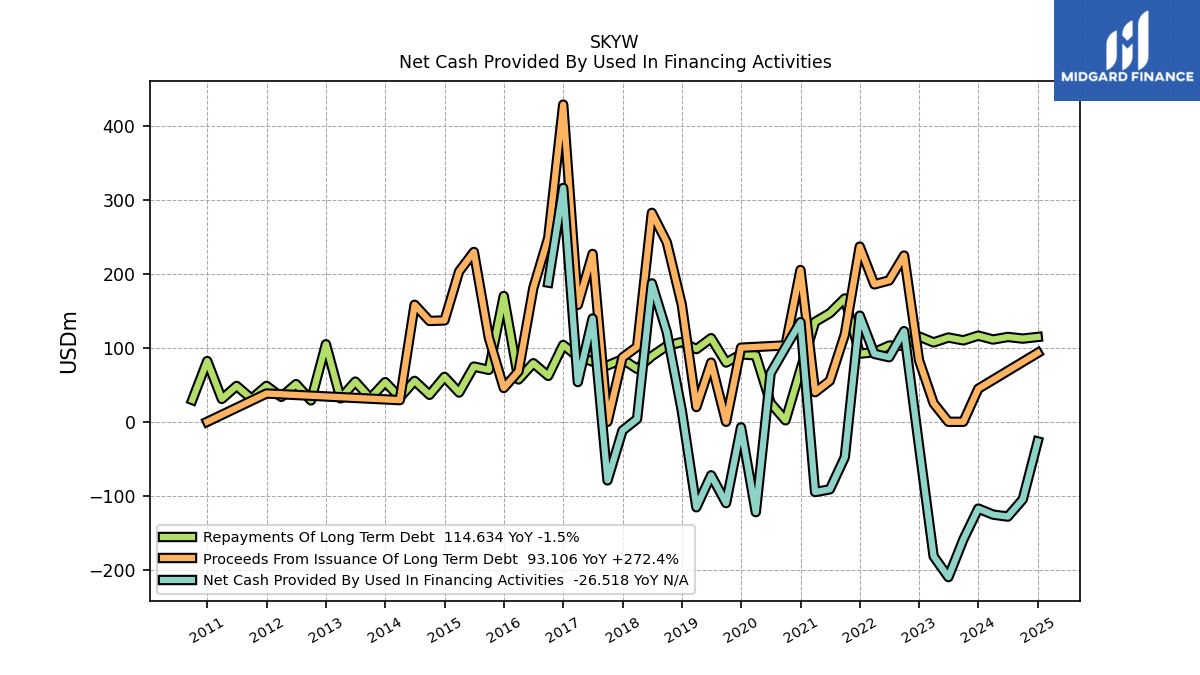
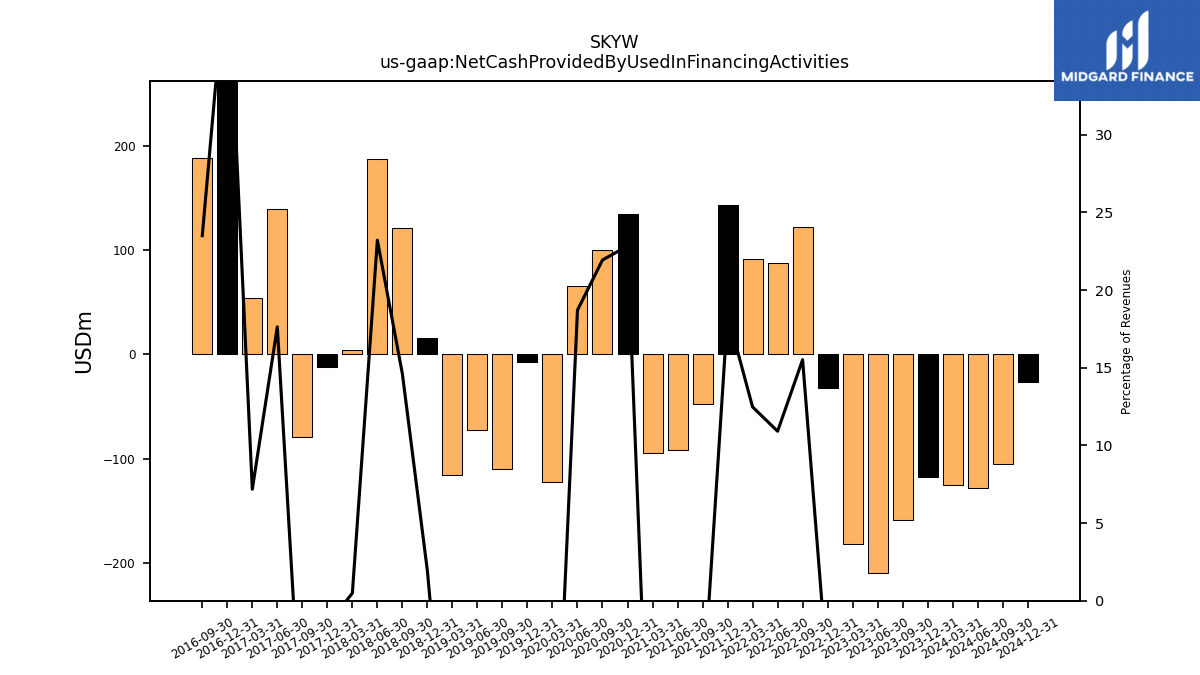
| Net Cash Provided By Used In Financing Activities | -125.39 | -117.25 | -159.00 | -209.87 | -181.69 | -32.38 | 122.50 | 87.22 | 91.74 | 143.46 | -47.89 | -91.27 | -94.90 | 134.66 | 100.39 | 65.51 | -122.13 | -7.53 | -109.85 | -72.29 | -115.51 | 15.46 | 121.15 | 187.01 | 3.83 | -11.85 | -79.16 | 139.59 | 53.65 | 316.00 | 188.04 | NA | NA | NA | NA | NA | NA | NA | NA | NA | NA | NA | NA | NA | NA | NA | NA | NA | NA | NA | NA | NA | NA | NA | NA | NA | NA |
| 2024-03-31 | 2023-12-31 | 2023-09-30 | 2023-06-30 | 2023-03-31 | 2022-12-31 | 2022-09-30 | 2022-06-30 | 2022-03-31 | 2021-12-31 | 2021-09-30 | 2021-06-30 | 2021-03-31 | 2020-12-31 | 2020-09-30 | 2020-06-30 | 2020-03-31 | 2019-12-31 | 2019-09-30 | 2019-06-30 | 2019-03-31 | 2018-12-31 | 2018-09-30 | 2018-06-30 | 2018-03-31 | 2017-12-31 | 2017-09-30 | 2017-06-30 | 2017-03-31 | 2016-12-31 | 2016-09-30 | 2016-06-30 | 2016-03-31 | 2015-12-31 | 2015-09-30 | 2015-06-30 | 2015-03-31 | 2014-12-31 | 2014-09-30 | 2014-06-30 | 2014-03-31 | 2013-12-31 | 2013-09-30 | 2013-06-30 | 2013-03-31 | 2012-12-31 | 2012-09-30 | 2012-06-30 | 2012-03-31 | 2011-12-31 | 2011-09-30 | 2011-06-30 | 2011-03-31 | 2010-12-31 | 2010-09-30 | 2010-06-30 | 2010-03-31 | ||
|---|---|---|---|---|---|---|---|---|---|---|---|---|---|---|---|---|---|---|---|---|---|---|---|---|---|---|---|---|---|---|---|---|---|---|---|---|---|---|---|---|---|---|---|---|---|---|---|---|---|---|---|---|---|---|---|---|---|---|
| Net Cash Provided By Used In Operating Activities | 157.65 | 224.43 | 178.88 | 182.82 | 150.20 | 136.84 | 128.26 | 194.77 | 20.51 | 144.87 | 188.27 | 267.10 | 231.59 | 84.86 | 56.42 | 222.80 | 269.48 | 138.56 | 220.34 | 207.21 | 154.91 | 229.41 | 222.31 | 184.93 | 165.90 | 151.84 | 200.51 | 187.84 | 143.94 | 107.35 | 171.28 | NA | NA | NA | NA | NA | NA | NA | NA | NA | NA | NA | NA | NA | NA | NA | NA | NA | NA | NA | NA | NA | NA | NA | NA | NA | NA | |
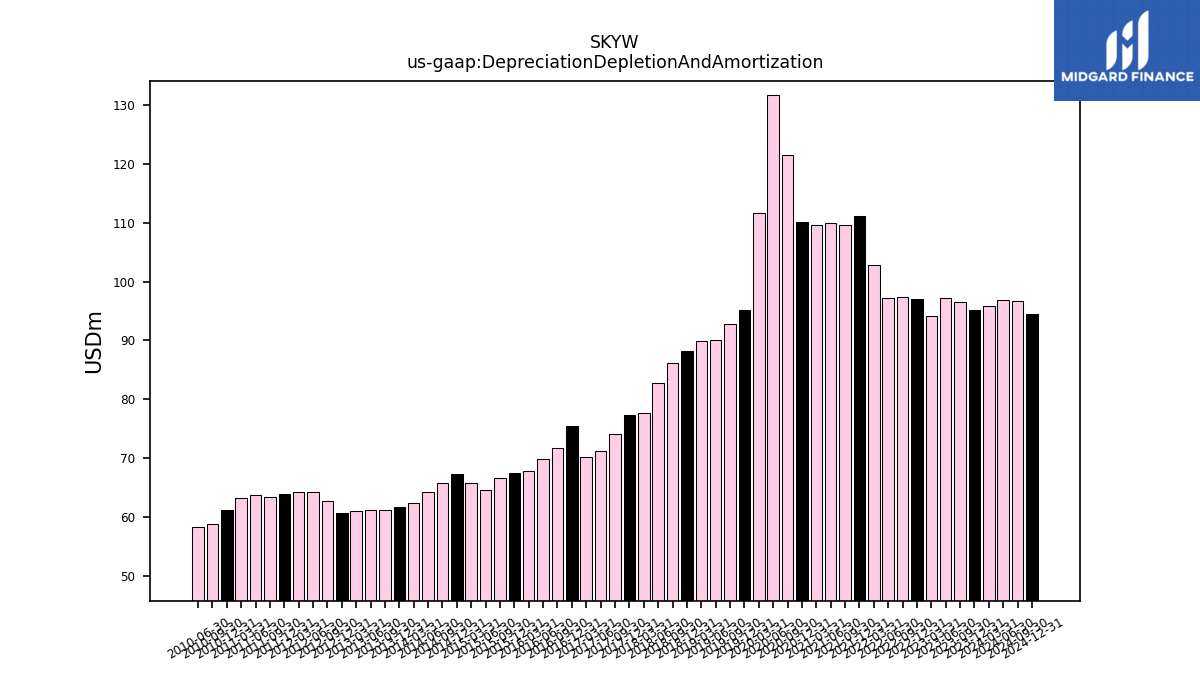
| Depreciation Depletion And Amortization | 95.87 | 95.24 | 96.56 | 97.17 | 94.15 | 97.12 | 97.43 | 97.25 | 102.75 | 111.11 | 109.60 | 109.89 | 109.60 | 110.15 | 121.47 | 131.64 | 111.71 | 95.17 | 92.80 | 90.15 | 89.99 | 88.20 | 86.09 | 82.71 | 77.58 | 77.35 | 74.09 | 71.21 | 70.11 | 75.54 | 71.74 | 69.89 | 67.80 | 67.55 | 66.60 | 64.66 | 65.69 | 67.25 | 65.82 | 64.25 | 62.32 | 61.70 | 61.13 | 61.17 | 61.00 | 60.76 | 62.70 | 64.18 | 64.31 | 63.90 | 63.39 | 63.70 | 63.19 | 61.20 | 58.77 | 58.38 | NA |
| 2024-03-31 | 2023-12-31 | 2023-09-30 | 2023-06-30 | 2023-03-31 | 2022-12-31 | 2022-09-30 | 2022-06-30 | 2022-03-31 | 2021-12-31 | 2021-09-30 | 2021-06-30 | 2021-03-31 | 2020-12-31 | 2020-09-30 | 2020-06-30 | 2020-03-31 | 2019-12-31 | 2019-09-30 | 2019-06-30 | 2019-03-31 | 2018-12-31 | 2018-09-30 | 2018-06-30 | 2018-03-31 | 2017-12-31 | 2017-09-30 | 2017-06-30 | 2017-03-31 | 2016-12-31 | 2016-09-30 | 2016-06-30 | 2016-03-31 | 2015-12-31 | 2015-09-30 | 2015-06-30 | 2015-03-31 | 2014-12-31 | 2014-09-30 | 2014-06-30 | 2014-03-31 | 2013-12-31 | 2013-09-30 | 2013-06-30 | 2013-03-31 | 2012-12-31 | 2012-09-30 | 2012-06-30 | 2012-03-31 | 2011-12-31 | 2011-09-30 | 2011-06-30 | 2011-03-31 | 2010-12-31 | 2010-09-30 | 2010-06-30 | 2010-03-31 | ||
|---|---|---|---|---|---|---|---|---|---|---|---|---|---|---|---|---|---|---|---|---|---|---|---|---|---|---|---|---|---|---|---|---|---|---|---|---|---|---|---|---|---|---|---|---|---|---|---|---|---|---|---|---|---|---|---|---|---|---|
| Net Cash Provided By Used In Investing Activities | -0.55 | -84.23 | -8.99 | 66.96 | 3.03 | -40.33 | -307.98 | -431.92 | -124.67 | -301.74 | -214.40 | -60.97 | -121.41 | -422.02 | -190.82 | -125.61 | 54.99 | -351.74 | -56.24 | -172.14 | -76.91 | -241.05 | -194.62 | -447.66 | -100.07 | -56.28 | -166.71 | -279.43 | -248.91 | -326.35 | -537.54 | NA | NA | NA | NA | NA | NA | NA | NA | NA | NA | NA | NA | NA | NA | NA | NA | NA | NA | NA | NA | NA | NA | NA | NA | NA | NA | |
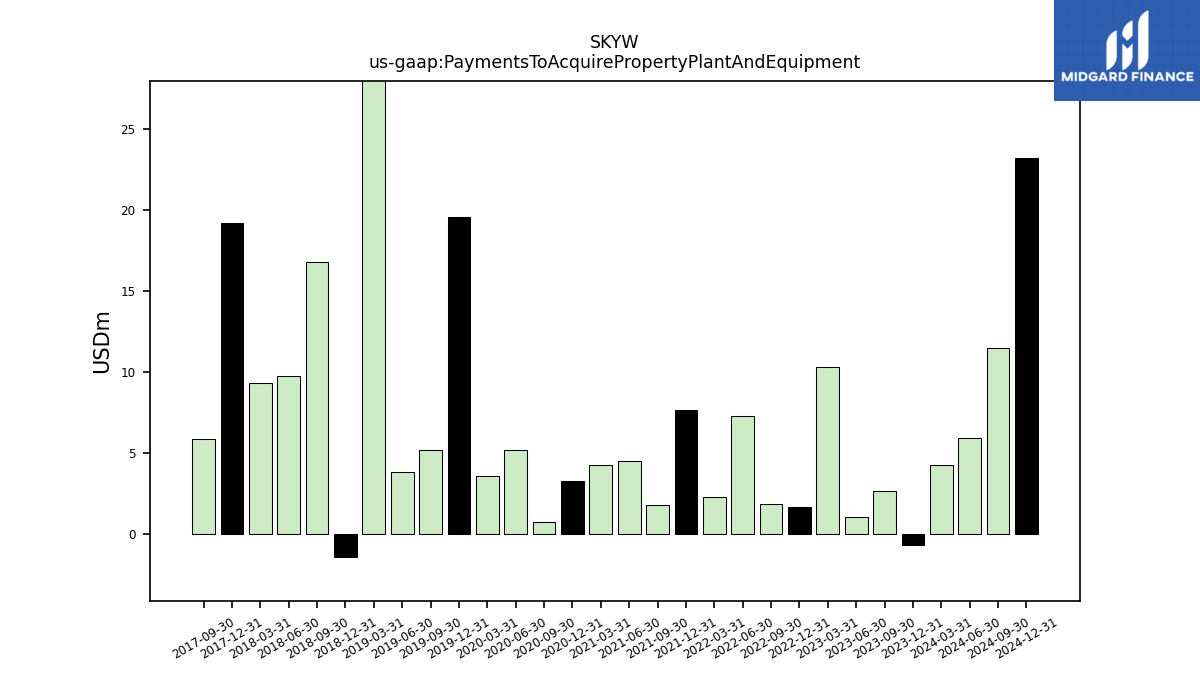
| Payments To Acquire Property Plant And Equipment | 4.25 | -0.72 | 2.64 | 1.02 | 10.32 | 1.67 | 1.84 | 7.29 | 2.24 | 7.65 | 1.77 | 4.48 | 4.22 | 3.28 | 0.70 | 5.15 | 3.54 | 19.57 | 5.16 | 3.79 | 52.08 | -1.47 | 16.80 | 9.77 | 9.30 | 19.19 | 5.86 | NA | NA | NA | NA | NA | NA | NA | NA | NA | NA | NA | NA | NA | NA | NA | NA | NA | NA | NA | NA | NA | NA | NA | NA | NA | NA | NA | NA | NA | NA | |
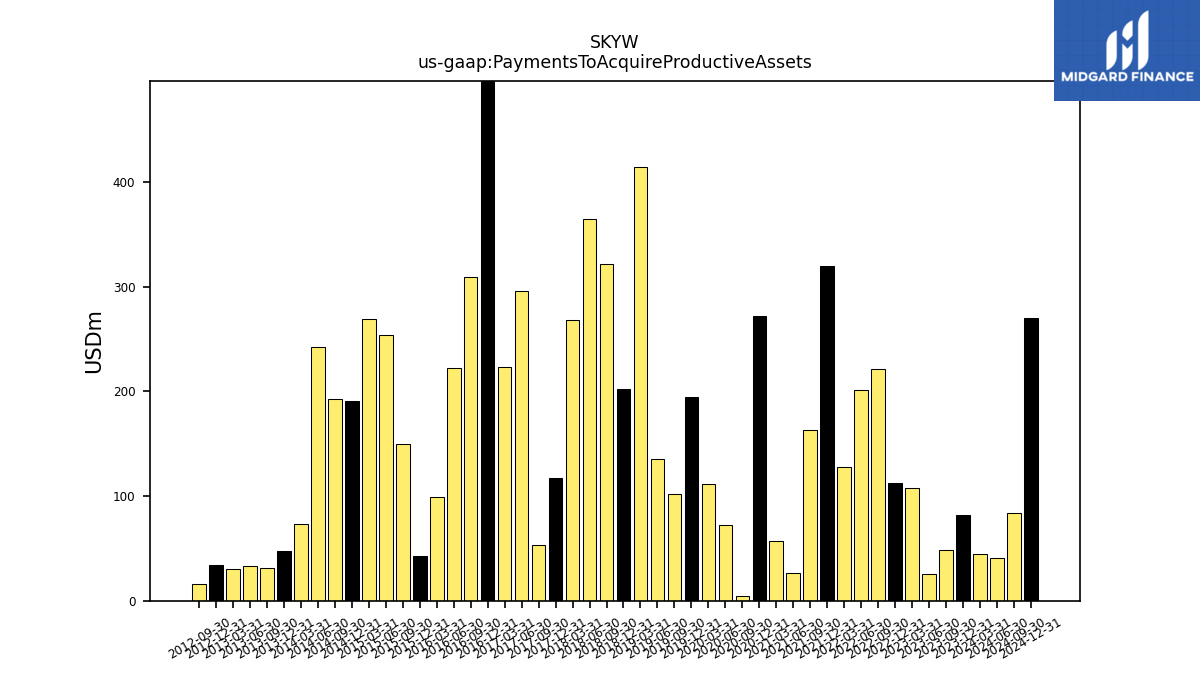
| Payments To Acquire Productive Assets | 44.35 | 81.72 | 48.25 | 26.02 | 107.92 | 112.47 | 221.09 | 201.18 | 127.58 | 319.79 | 163.30 | 26.44 | 57.51 | 272.16 | 4.94 | 72.26 | 111.12 | 194.24 | 101.99 | 135.66 | 414.58 | 202.21 | 321.57 | 364.72 | 267.79 | 117.00 | 53.50 | 295.80 | 223.10 | 527.94 | 309.10 | 222.67 | 99.29 | 42.52 | 149.50 | 253.80 | 269.14 | 190.56 | 192.83 | 242.36 | 73.52 | 47.46 | 30.87 | 33.42 | 30.29 | 33.77 | 16.18 | NA | NA | NA | NA | NA | NA | NA | NA | NA | NA |
| 2024-03-31 | 2023-12-31 | 2023-09-30 | 2023-06-30 | 2023-03-31 | 2022-12-31 | 2022-09-30 | 2022-06-30 | 2022-03-31 | 2021-12-31 | 2021-09-30 | 2021-06-30 | 2021-03-31 | 2020-12-31 | 2020-09-30 | 2020-06-30 | 2020-03-31 | 2019-12-31 | 2019-09-30 | 2019-06-30 | 2019-03-31 | 2018-12-31 | 2018-09-30 | 2018-06-30 | 2018-03-31 | 2017-12-31 | 2017-09-30 | 2017-06-30 | 2017-03-31 | 2016-12-31 | 2016-09-30 | 2016-06-30 | 2016-03-31 | 2015-12-31 | 2015-09-30 | 2015-06-30 | 2015-03-31 | 2014-12-31 | 2014-09-30 | 2014-06-30 | 2014-03-31 | 2013-12-31 | 2013-09-30 | 2013-06-30 | 2013-03-31 | 2012-12-31 | 2012-09-30 | 2012-06-30 | 2012-03-31 | 2011-12-31 | 2011-09-30 | 2011-06-30 | 2011-03-31 | 2010-12-31 | 2010-09-30 | 2010-06-30 | 2010-03-31 | ||
|---|---|---|---|---|---|---|---|---|---|---|---|---|---|---|---|---|---|---|---|---|---|---|---|---|---|---|---|---|---|---|---|---|---|---|---|---|---|---|---|---|---|---|---|---|---|---|---|---|---|---|---|---|---|---|---|---|---|---|
| Net Cash Provided By Used In Financing Activities | -125.39 | -117.25 | -159.00 | -209.87 | -181.69 | -32.38 | 122.50 | 87.22 | 91.74 | 143.46 | -47.89 | -91.27 | -94.90 | 134.66 | 100.39 | 65.51 | -122.13 | -7.53 | -109.85 | -72.29 | -115.51 | 15.46 | 121.15 | 187.01 | 3.83 | -11.85 | -79.16 | 139.59 | 53.65 | 316.00 | 188.04 | NA | NA | NA | NA | NA | NA | NA | NA | NA | NA | NA | NA | NA | NA | NA | NA | NA | NA | NA | NA | NA | NA | NA | NA | NA | NA | |
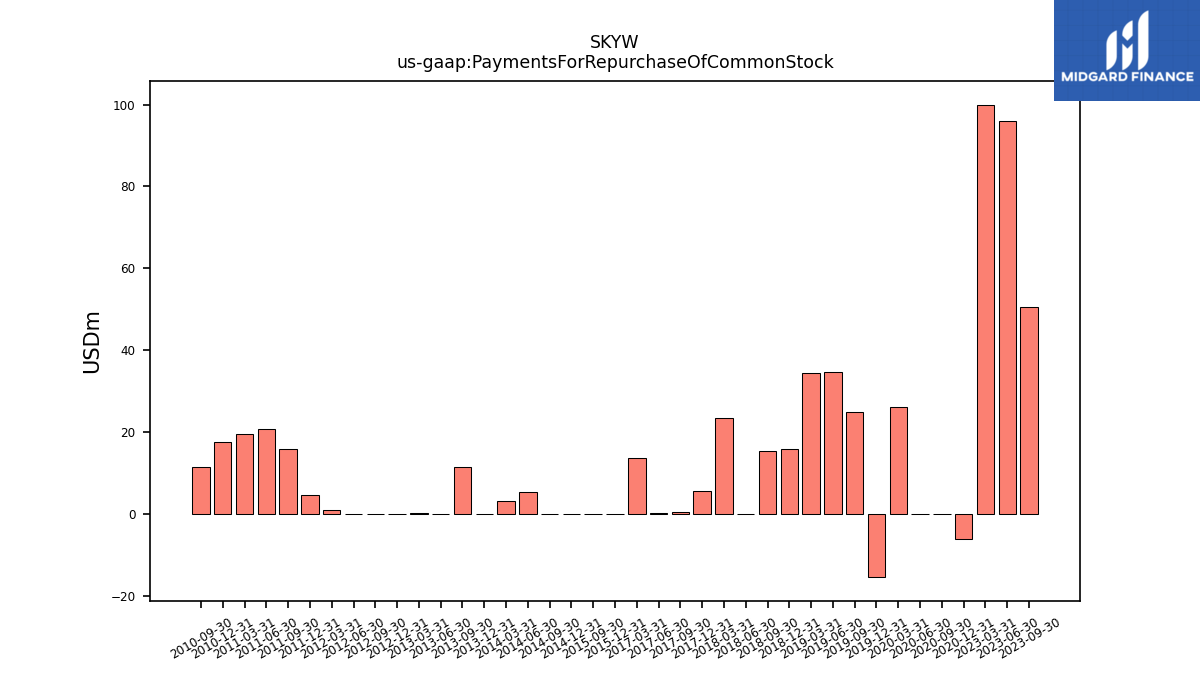
| Payments For Repurchase Of Common Stock | 8.75 | NA | 50.50 | 96.00 | 100.00 | NA | NA | NA | NA | NA | NA | NA | NA | -6.17 | 0.00 | 0.00 | 26.16 | -15.46 | 25.00 | 34.62 | 34.31 | 15.73 | 15.25 | 0.00 | 23.47 | 5.68 | 0.46 | 0.20 | 13.67 | NA | NA | NA | NA | 0.00 | 0.00 | NA | NA | 0.00 | 0.00 | 5.34 | 3.08 | 0.00 | 11.54 | 0.00 | 0.20 | 0.00 | 0.01 | 0.00 | 0.90 | 4.51 | 15.91 | 20.68 | 19.58 | 17.49 | 11.34 | NA | NA |
| 2024-03-31 | 2023-12-31 | 2023-09-30 | 2023-06-30 | 2023-03-31 | 2022-12-31 | 2022-09-30 | 2022-06-30 | 2022-03-31 | 2021-12-31 | 2021-09-30 | 2021-06-30 | 2021-03-31 | 2020-12-31 | 2020-09-30 | 2020-06-30 | 2020-03-31 | 2019-12-31 | 2019-09-30 | 2019-06-30 | 2019-03-31 | 2018-12-31 | 2018-09-30 | 2018-06-30 | 2018-03-31 | 2017-12-31 | 2017-09-30 | 2017-06-30 | 2017-03-31 | 2016-12-31 | 2016-09-30 | 2016-06-30 | 2016-03-31 | 2015-12-31 | 2015-09-30 | 2015-06-30 | 2015-03-31 | 2014-12-31 | 2014-09-30 | 2014-06-30 | 2014-03-31 | 2013-12-31 | 2013-09-30 | 2013-06-30 | 2013-03-31 | 2012-12-31 | 2012-09-30 | 2012-06-30 | 2012-03-31 | 2011-12-31 | 2011-09-30 | 2011-06-30 | 2011-03-31 | 2010-12-31 | 2010-09-30 | 2010-06-30 | 2010-03-31 | ||
|---|---|---|---|---|---|---|---|---|---|---|---|---|---|---|---|---|---|---|---|---|---|---|---|---|---|---|---|---|---|---|---|---|---|---|---|---|---|---|---|---|---|---|---|---|---|---|---|---|---|---|---|---|---|---|---|---|---|---|
| Revenues | 803.61 | 751.79 | 766.17 | 725.64 | 691.83 | 681.25 | 789.44 | 799.09 | 735.15 | 777.16 | 744.78 | 656.99 | 534.55 | 589.64 | 457.49 | 350.04 | 729.94 | 743.59 | 760.29 | 744.38 | 723.69 | 803.49 | 829.27 | 805.51 | 783.40 | 771.24 | 812.67 | 791.51 | 747.17 | 758.02 | 799.78 | 801.34 | 762.08 | 752.74 | 794.00 | 788.42 | 760.40 | 813.85 | 834.63 | 816.57 | 772.39 | 804.37 | 850.74 | 839.13 | 803.49 | 810.73 | 865.26 | 937.21 | 921.17 | 899.85 | 955.42 | 933.70 | 865.95 | 796.28 | 686.86 | 649.76 | 632.24 | |
| Revenue From Contract With Customer Including Assessed Tax | 803.61 | 751.79 | 766.17 | 725.64 | 691.83 | 681.25 | 789.44 | 799.09 | 735.15 | 777.16 | 744.78 | 656.99 | 534.55 | 589.64 | 457.49 | 350.04 | 729.94 | 743.59 | 760.29 | 744.38 | 723.69 | 803.49 | 829.27 | 805.51 | 783.40 | 771.24 | 812.67 | 791.51 | 747.17 | 758.02 | 799.78 | 801.34 | 762.08 | 752.74 | 794.00 | 788.42 | 760.40 | 813.85 | 834.63 | 816.57 | 772.39 | 804.37 | 850.74 | 839.13 | 803.49 | 810.73 | 865.26 | 937.21 | 921.17 | 899.85 | 955.42 | 933.70 | 865.95 | 796.28 | 686.86 | 649.76 | 632.24 | |
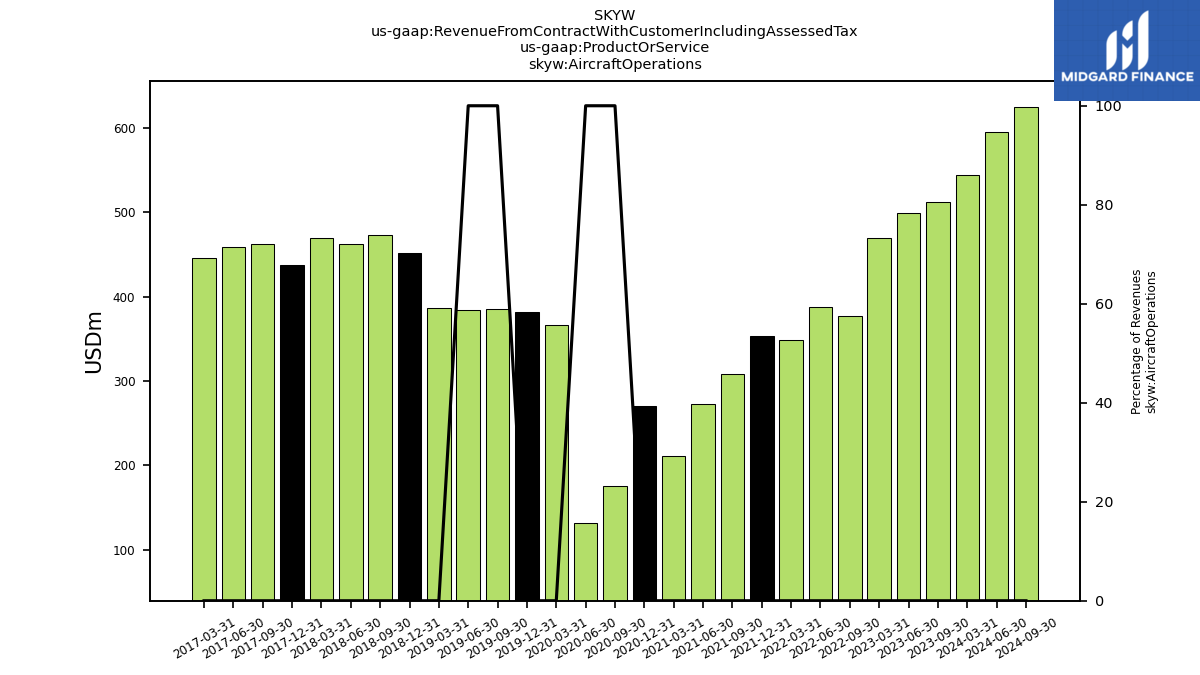
| Aircraft Operations | 544.16 | NA | 511.93 | 499.14 | 468.92 | NA | 376.60 | 387.46 | 348.47 | 353.87 | 308.27 | 273.18 | 211.05 | 270.79 | 175.75 | 132.06 | 366.41 | 382.25 | 385.54 | 383.73 | 386.55 | 451.45 | 472.95 | 462.82 | 469.02 | 437.61 | 462.83 | 459.35 | 445.72 | NA | NA | NA | NA | NA | NA | NA | NA | NA | NA | NA | NA | NA | NA | NA | NA | NA | NA | NA | NA | NA | NA | NA | NA | NA | NA | NA | NA | |
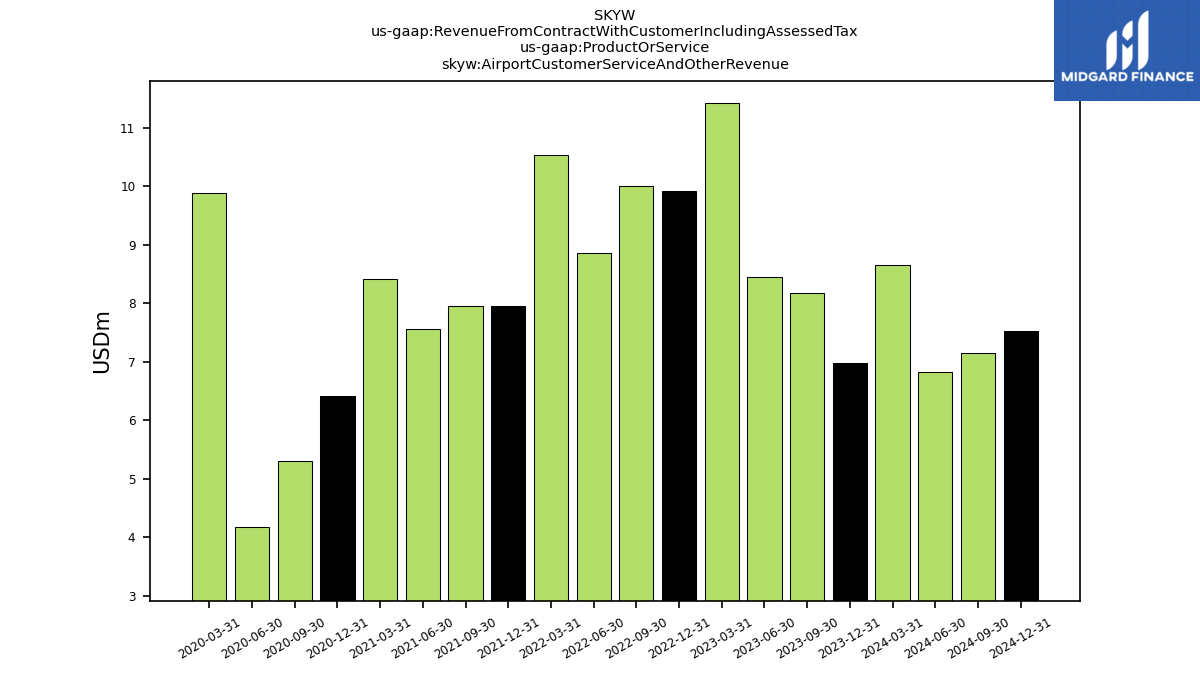
| Airport Customer Service And Other Revenue | 8.66 | 6.99 | 8.18 | 8.46 | 11.43 | 9.93 | 10.00 | 8.86 | 10.53 | 7.95 | 7.95 | 7.57 | 8.41 | 6.41 | 5.31 | 4.18 | 9.90 | NA | NA | NA | NA | NA | NA | NA | NA | NA | NA | NA | NA | NA | NA | NA | NA | NA | NA | NA | NA | NA | NA | NA | NA | NA | NA | NA | NA | NA | NA | NA | NA | NA | NA | NA | NA | NA | NA | NA | NA | |
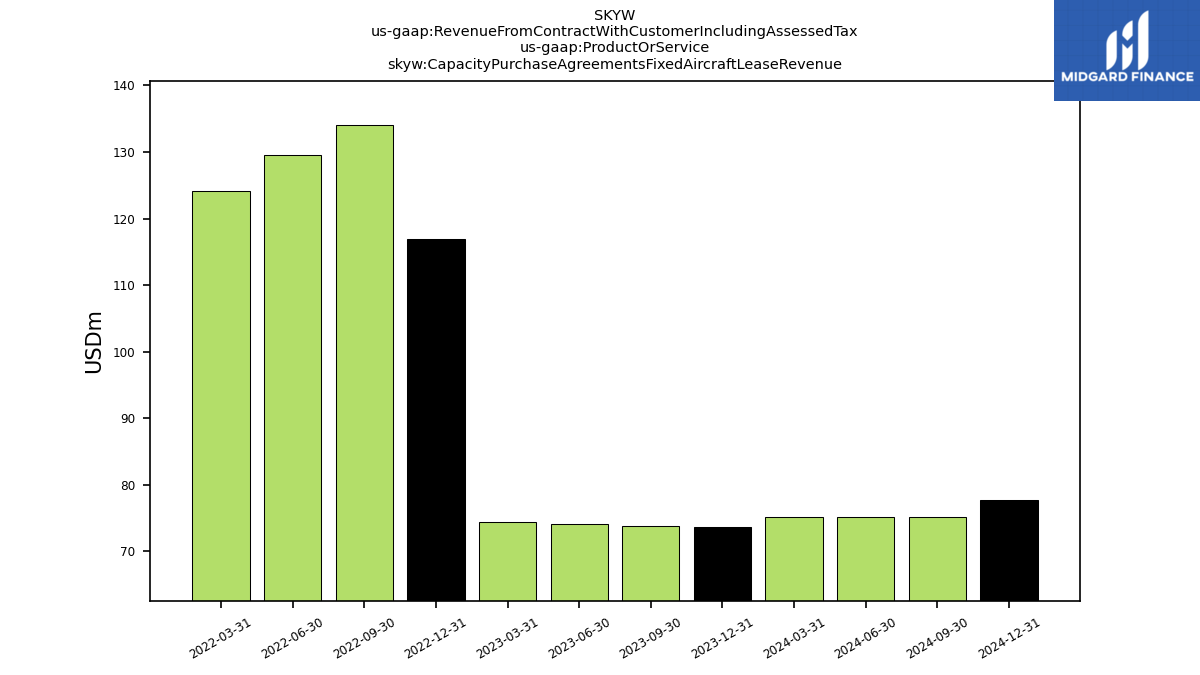
| Capacity Purchase Agreements Fixed Aircraft Lease Revenue | 75.16 | 73.73 | 73.79 | 74.04 | 74.48 | 116.95 | 133.99 | 129.50 | 124.08 | NA | NA | NA | NA | NA | NA | NA | NA | NA | NA | NA | NA | NA | NA | NA | NA | NA | NA | NA | NA | NA | NA | NA | NA | NA | NA | NA | NA | NA | NA | NA | NA | NA | NA | NA | NA | NA | NA | NA | NA | NA | NA | NA | NA | NA | NA | NA | NA | |
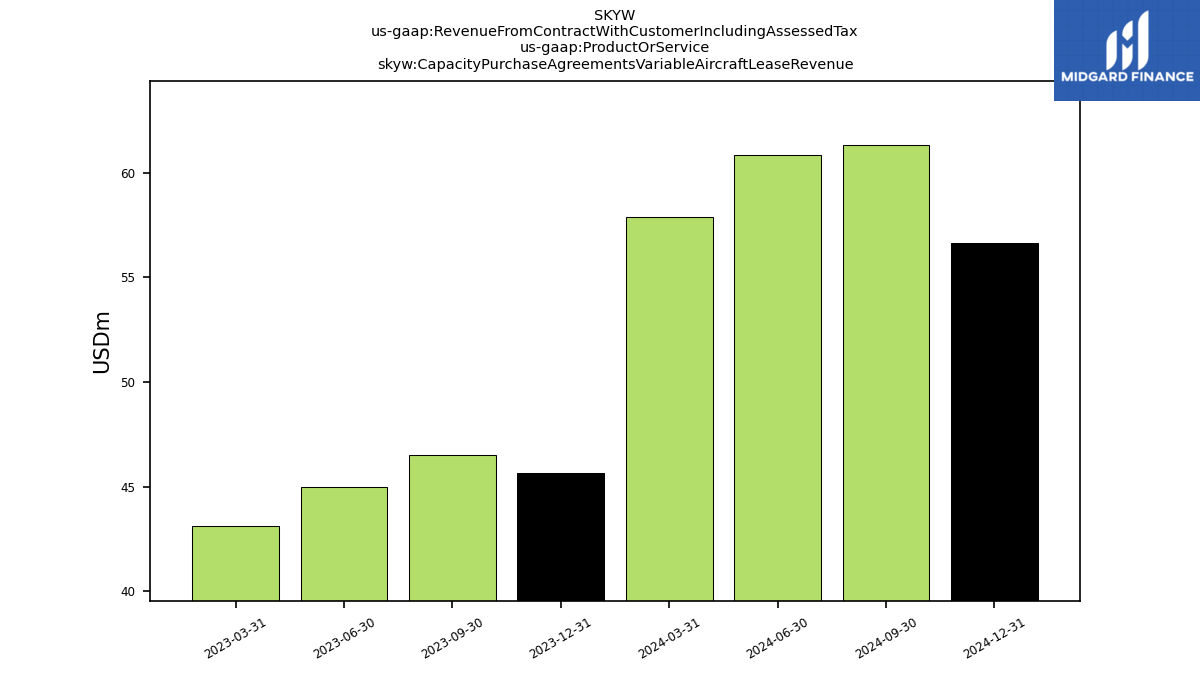
| Capacity Purchase Agreements Variable Aircraft Lease Revenue | 57.89 | 45.63 | 46.49 | 44.98 | 43.10 | NA | NA | NA | NA | NA | NA | NA | NA | NA | NA | NA | NA | NA | NA | NA | NA | NA | NA | NA | NA | NA | NA | NA | NA | NA | NA | NA | NA | NA | NA | NA | NA | NA | NA | NA | NA | NA | NA | NA | NA | NA | NA | NA | NA | NA | NA | NA | NA | NA | NA | NA | NA | |
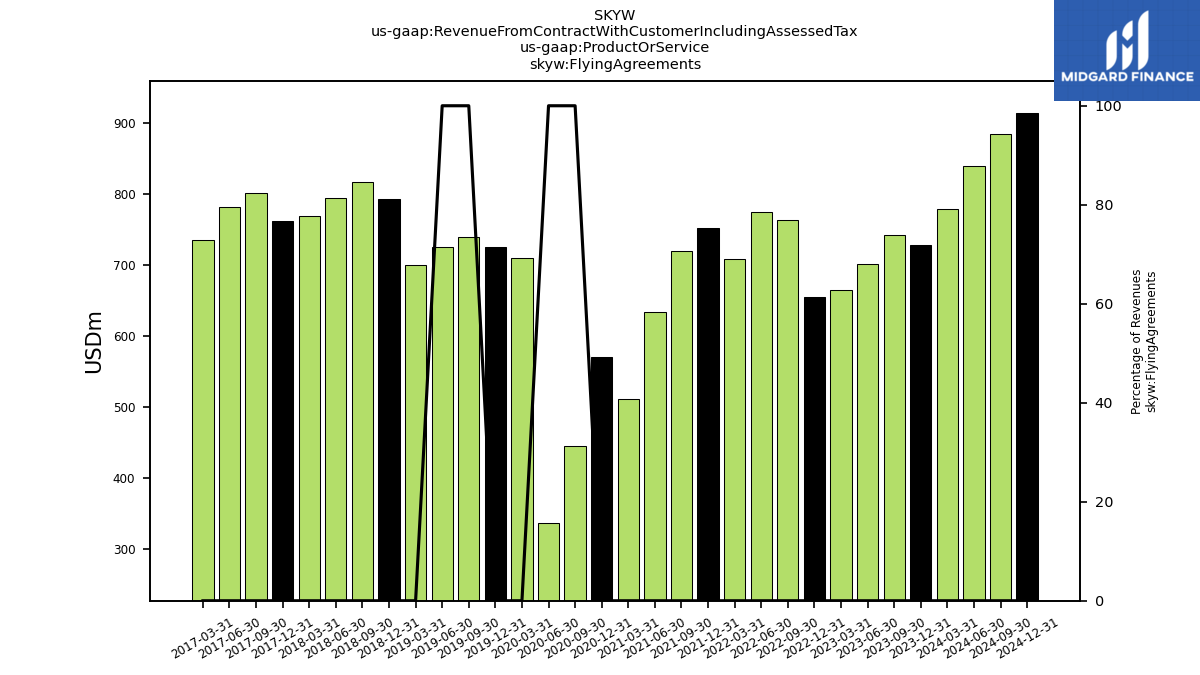
| Flying Agreements | 778.29 | 728.27 | 741.90 | 700.39 | 663.84 | 654.49 | 763.51 | 773.77 | 708.06 | 751.83 | 719.08 | 632.97 | 511.19 | 569.89 | 445.05 | 336.37 | 709.49 | 725.09 | 738.84 | 725.34 | 700.00 | 791.86 | 816.06 | 793.64 | 767.96 | 761.08 | 800.97 | 781.72 | 734.53 | NA | NA | NA | NA | NA | NA | NA | NA | NA | NA | NA | NA | NA | NA | NA | NA | NA | NA | NA | NA | NA | NA | NA | NA | NA | NA | NA | NA | |
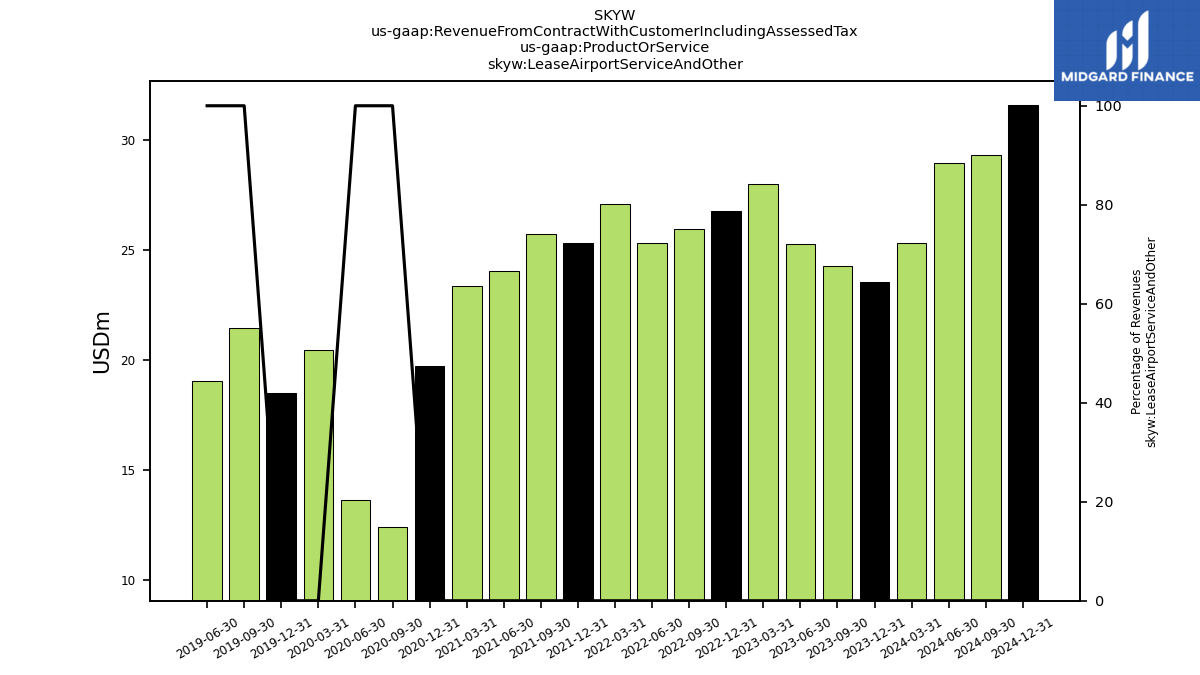
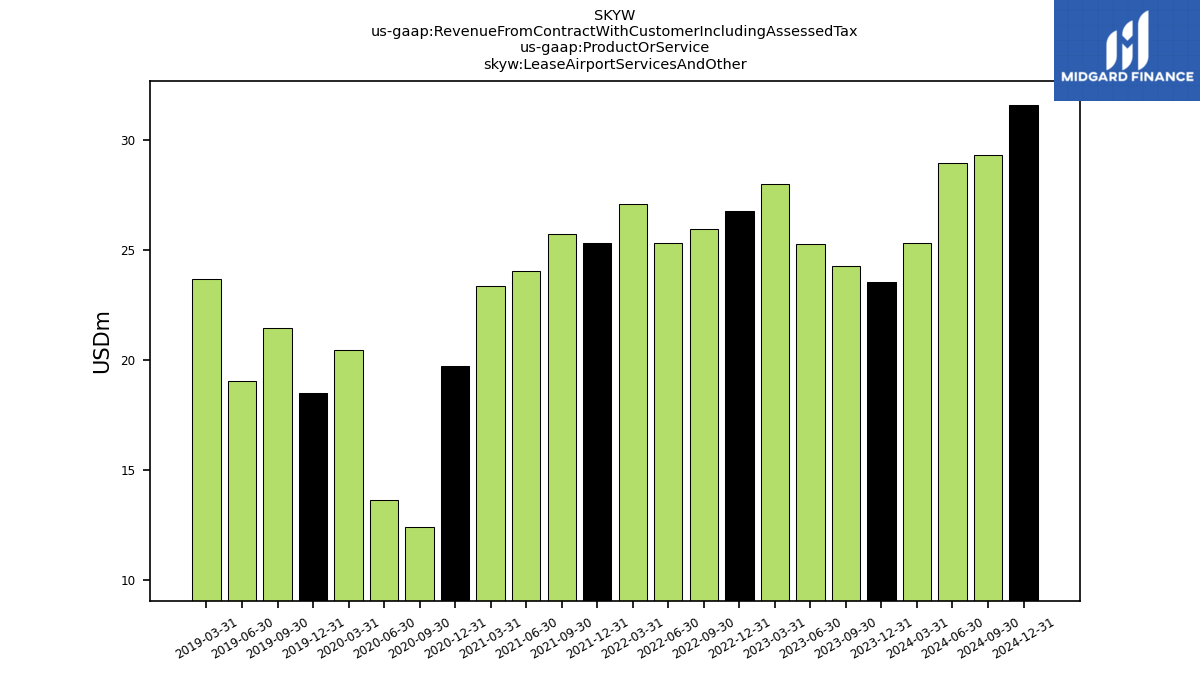
| Lease Airport Service And Other | 25.32 | 23.52 | 24.27 | 25.25 | 27.99 | 26.76 | 25.93 | 25.31 | 27.09 | 25.33 | 25.70 | 24.02 | 23.36 | 19.75 | 12.45 | 13.67 | 20.44 | 18.50 | 21.46 | 19.05 | NA | NA | NA | NA | NA | NA | NA | NA | NA | NA | NA | NA | NA | NA | NA | NA | NA | NA | NA | NA | NA | NA | NA | NA | NA | NA | NA | NA | NA | NA | NA | NA | NA | NA | NA | NA | NA | |
| Lease Airport Services And Other | 25.32 | 23.52 | 24.27 | 25.25 | 27.99 | 26.76 | 25.93 | 25.31 | 27.09 | 25.33 | 25.70 | 24.02 | 23.36 | 19.75 | 12.45 | 13.67 | 20.44 | 18.50 | 21.46 | 19.05 | 23.69 | NA | NA | NA | NA | NA | NA | NA | NA | NA | NA | NA | NA | NA | NA | NA | NA | NA | NA | NA | NA | NA | NA | NA | NA | NA | NA | NA | NA | NA | NA | NA | NA | NA | NA | NA | NA | |
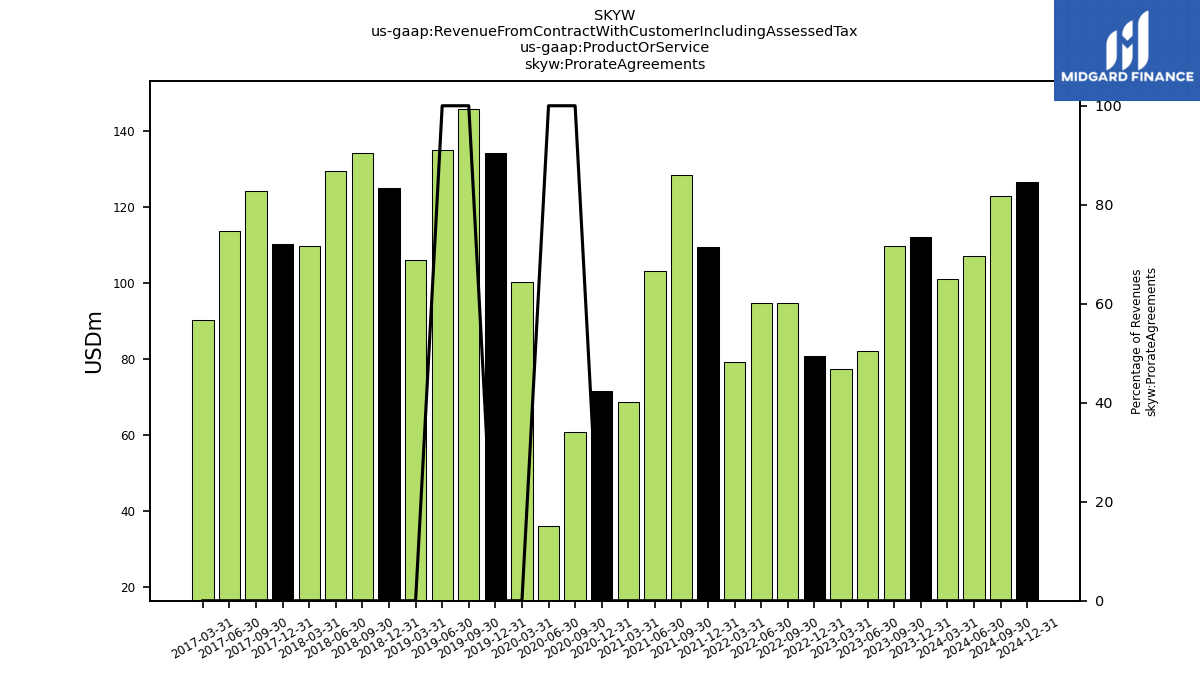
| Prorate Agreements | 101.08 | 112.15 | 109.68 | 82.23 | 77.34 | 80.69 | 94.74 | 94.73 | 79.17 | 109.49 | 128.31 | 103.23 | 68.65 | 71.52 | 60.78 | 36.21 | 100.35 | 134.12 | 145.83 | 134.93 | 106.08 | 125.08 | 134.29 | 129.51 | 109.87 | 110.20 | 124.17 | 113.70 | 90.35 | NA | NA | NA | NA | NA | NA | NA | NA | NA | NA | NA | NA | NA | NA | NA | NA | NA | NA | NA | NA | NA | NA | NA | NA | NA | NA | NA | NA | |
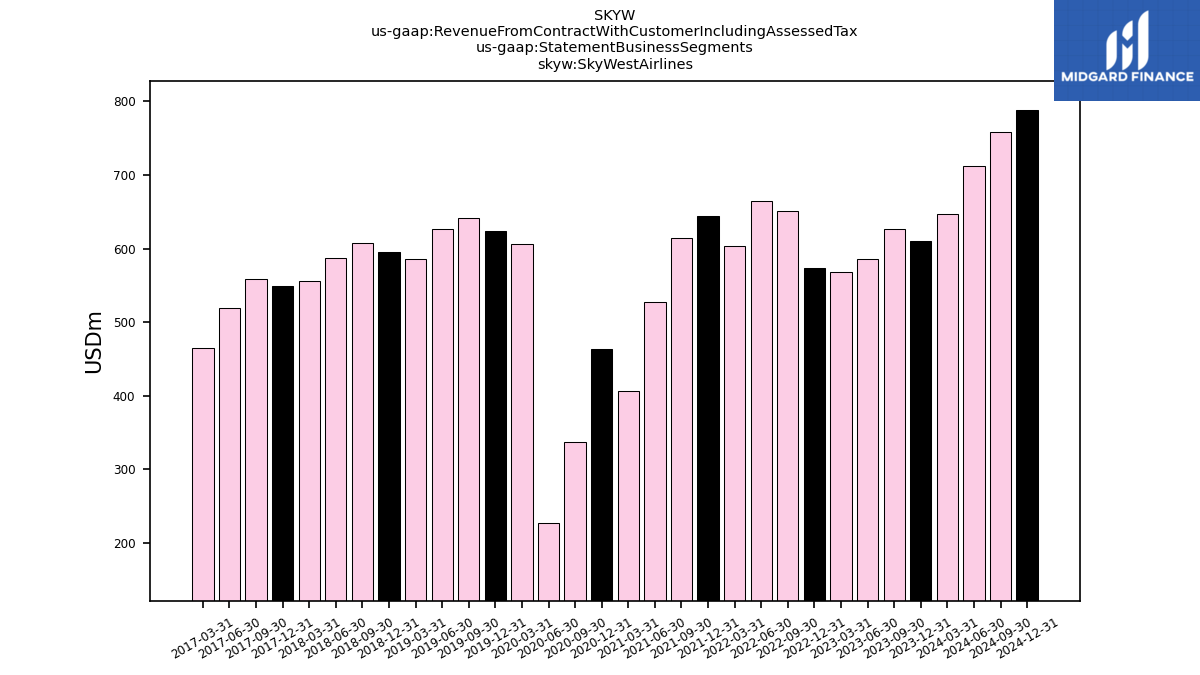
| Sky West Airlines | 646.81 | 610.75 | 626.78 | 586.48 | 568.17 | 573.57 | 651.49 | 664.20 | 603.05 | 644.01 | 614.38 | 527.60 | 406.45 | 464.14 | 337.98 | 227.81 | 606.84 | 623.88 | 641.95 | 627.09 | 585.77 | 595.42 | 607.05 | 587.48 | 556.29 | 548.75 | 558.99 | 519.71 | 464.92 | NA | NA | NA | NA | NA | NA | NA | NA | NA | NA | NA | NA | NA | NA | NA | NA | NA | NA | NA | NA | NA | NA | NA | NA | NA | NA | NA | NA | |
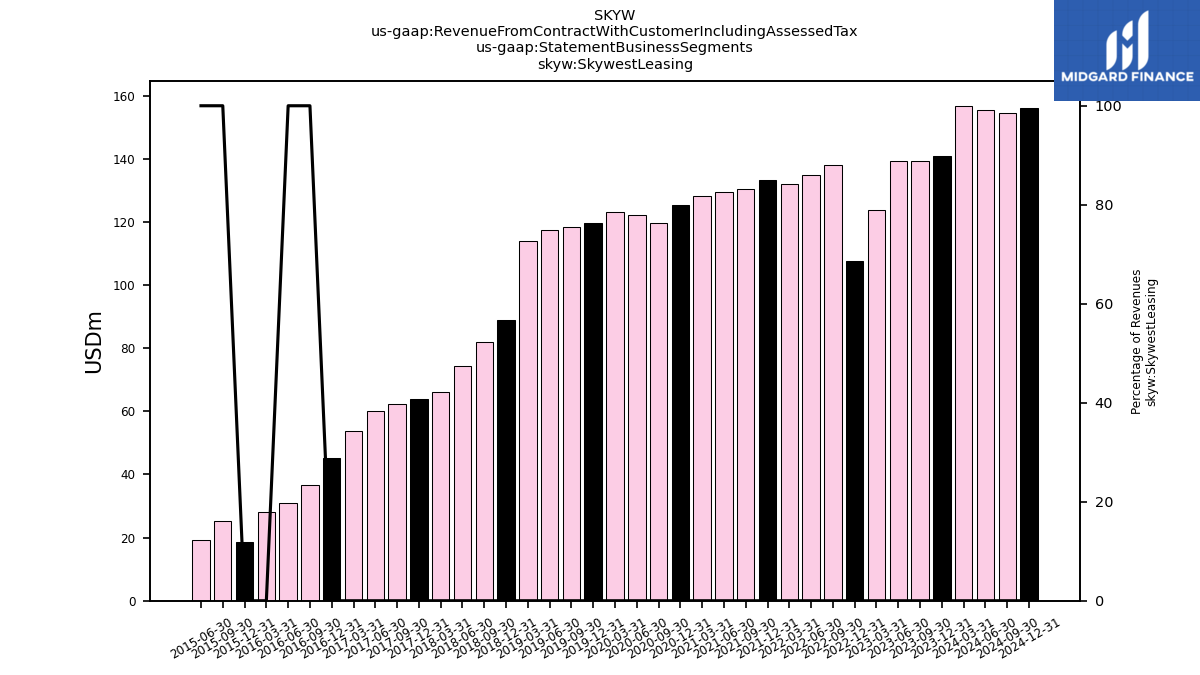
| Skywest Leasing | 156.81 | 141.04 | 139.39 | 139.17 | 123.66 | 107.67 | 137.95 | 134.88 | 132.10 | 133.15 | 130.41 | 129.40 | 128.10 | 125.50 | 119.52 | 122.23 | 123.09 | 119.71 | 118.35 | 117.30 | 113.88 | 88.81 | 82.07 | 74.33 | 66.03 | 63.84 | 62.31 | 59.98 | 53.80 | 45.22 | 36.81 | 30.99 | 27.97 | 18.59 | 25.22 | 19.34 | NA | NA | NA | NA | NA | NA | NA | NA | NA | NA | NA | NA | NA | NA | NA | NA | NA | NA | NA | NA | NA |