
| 2024-03-31 | 2023-12-31 | 2023-09-30 | 2023-06-30 | 2023-03-31 | 2022-12-31 | 2022-09-30 | 2022-06-30 | 2022-03-31 | 2021-12-31 | 2021-09-30 | 2021-06-30 | 2021-03-31 | 2020-12-31 | 2020-09-30 | 2020-06-30 | 2020-03-31 | 2019-12-31 | 2019-09-30 | 2019-06-30 | 2019-03-31 | 2018-12-31 | 2018-09-30 | 2018-06-30 | 2018-03-31 | 2017-12-31 | 2017-09-30 | 2017-06-30 | 2017-03-31 | 2016-12-31 | 2016-09-30 | 2016-06-30 | 2016-03-31 | 2015-12-31 | ||
|---|---|---|---|---|---|---|---|---|---|---|---|---|---|---|---|---|---|---|---|---|---|---|---|---|---|---|---|---|---|---|---|---|---|---|---|
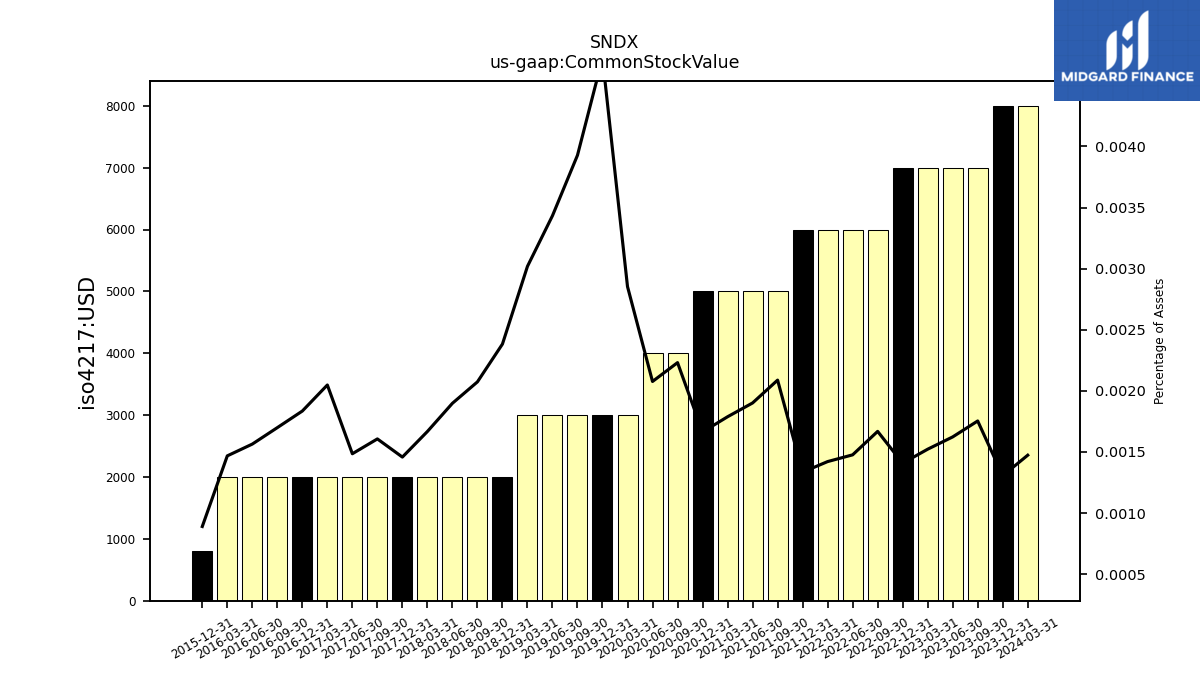
| Common Stock Value | 0.01 | 0.01 | 0.01 | 0.01 | 0.01 | 0.01 | 0.01 | 0.01 | 0.01 | 0.01 | 0.01 | 0.01 | 0.01 | 0.01 | 0.00 | 0.00 | 0.00 | 0.00 | 0.00 | 0.00 | 0.00 | 0.00 | 0.00 | 0.00 | 0.00 | 0.00 | 0.00 | 0.00 | 0.00 | 0.00 | 0.00 | 0.00 | 0.00 | 0.00 | |
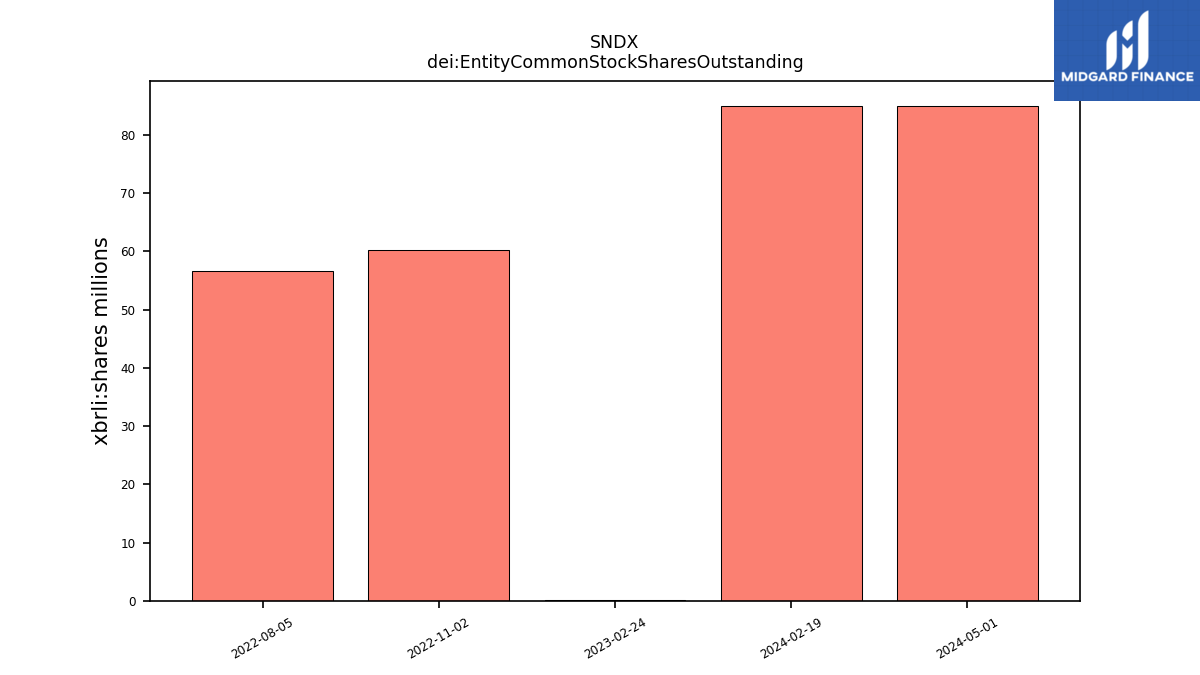
| dei: Entity Common Stock Shares Outstanding | NA | NA | NA | NA | NA | NA | NA | NA | NA | NA | NA | NA | NA | NA | NA | NA | NA | NA | NA | NA | NA | NA | NA | NA | NA | NA | NA | NA | NA | NA | NA | NA | NA | NA | |
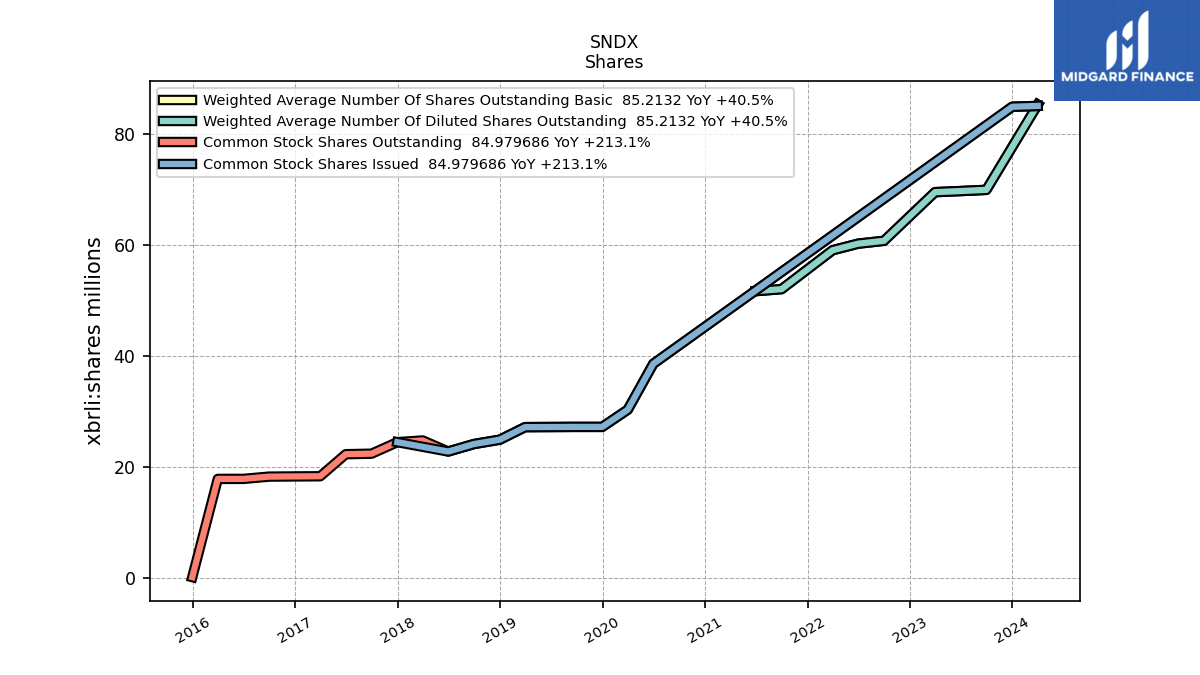
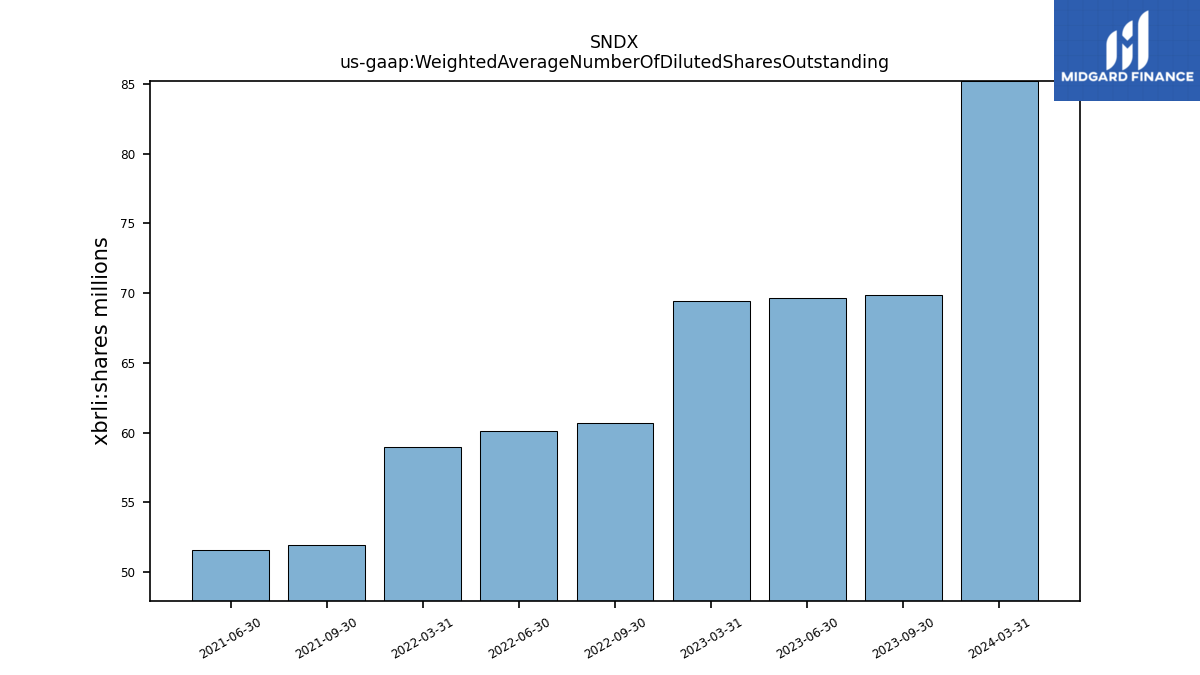
| Weighted Average Number Of Diluted Shares Outstanding | 85.21 | NA | 69.86 | 69.64 | 69.44 | NA | 60.67 | 60.16 | 58.98 | NA | 51.96 | 51.60 | NA | NA | NA | NA | NA | NA | NA | NA | NA | NA | NA | NA | NA | NA | NA | NA | NA | NA | NA | NA | NA | NA | |
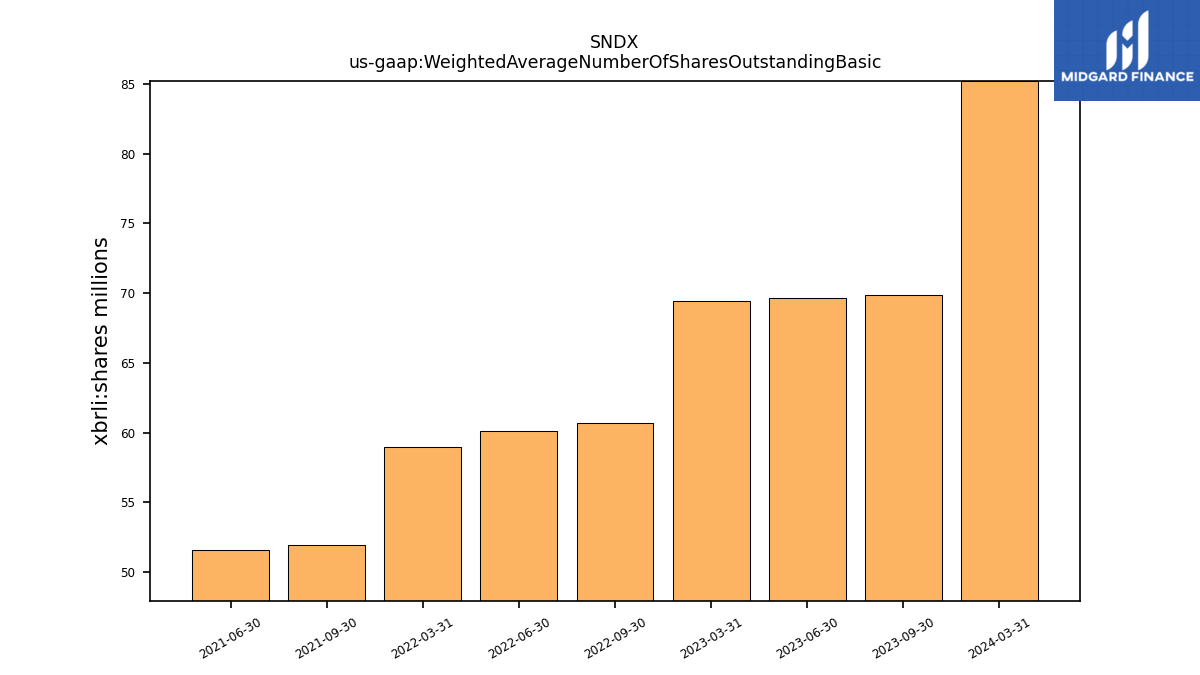
| Weighted Average Number Of Shares Outstanding Basic | 85.21 | NA | 69.86 | 69.64 | 69.44 | NA | 60.67 | 60.16 | 58.98 | NA | 51.96 | 51.60 | NA | NA | NA | NA | NA | NA | NA | NA | NA | NA | NA | NA | NA | NA | NA | NA | NA | NA | NA | NA | NA | NA | |
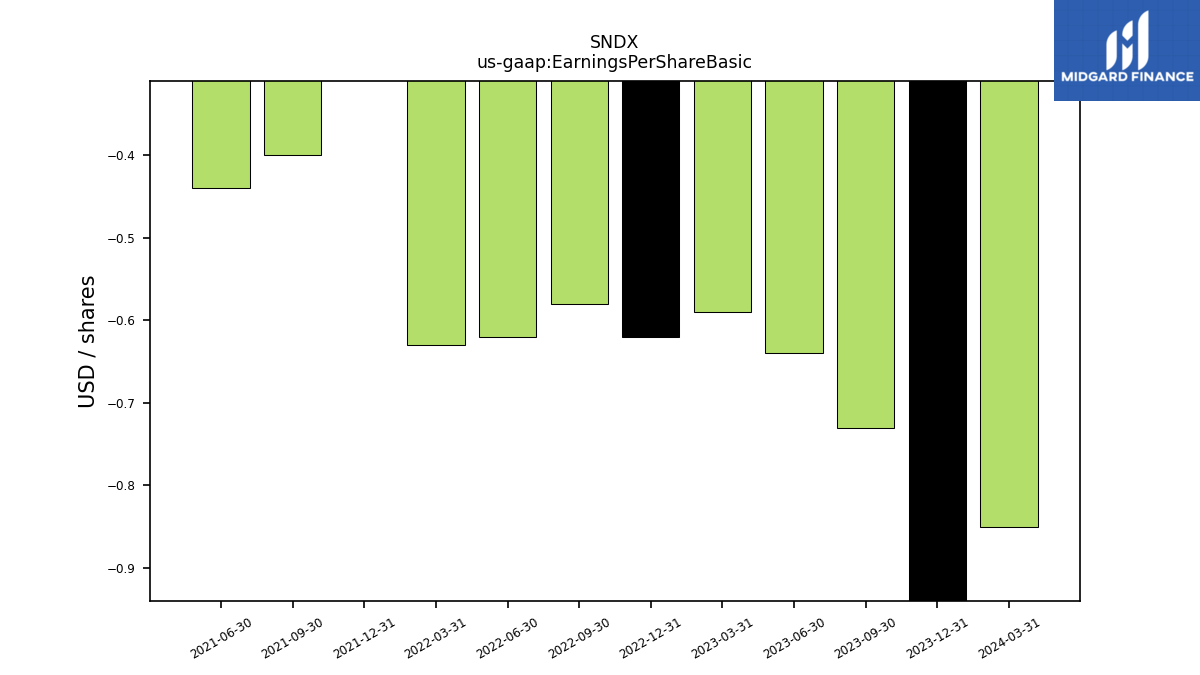
| Earnings Per Share Basic | -0.85 | -1.01 | -0.73 | -0.64 | -0.59 | -0.62 | -0.58 | -0.62 | -0.63 | 1.86 | -0.40 | -0.44 | NA | NA | NA | NA | NA | NA | NA | NA | NA | NA | NA | NA | NA | NA | NA | NA | NA | NA | NA | NA | NA | NA | |
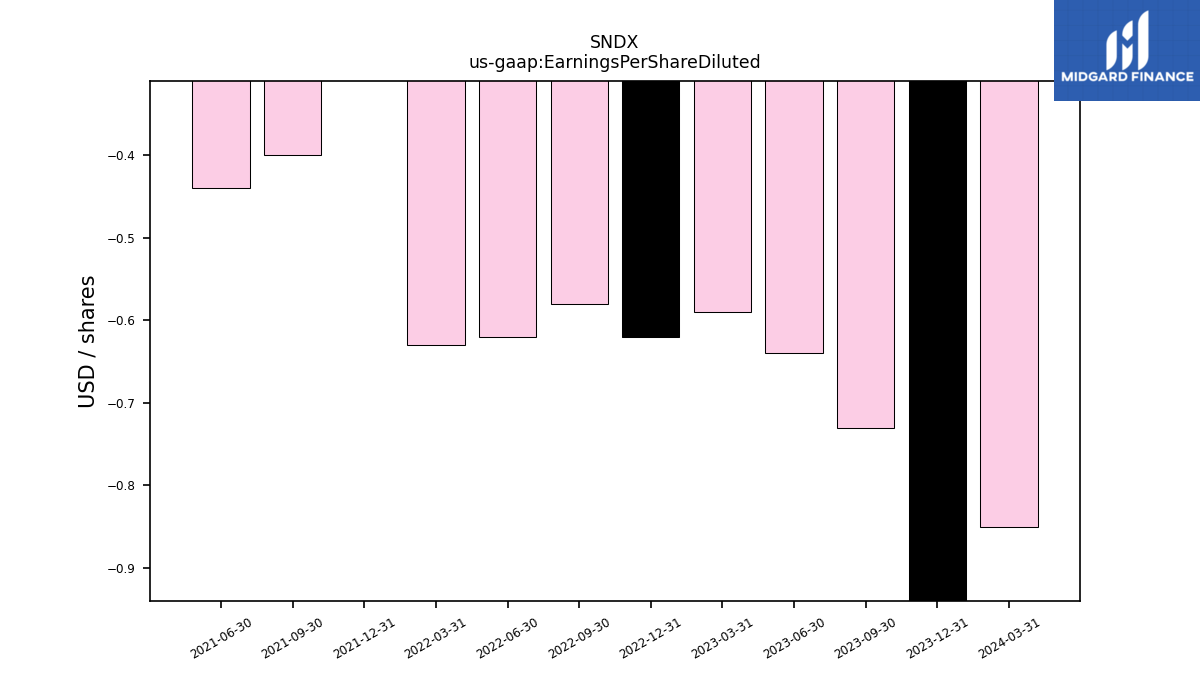
| Earnings Per Share Diluted | -0.85 | -1.01 | -0.73 | -0.64 | -0.59 | -0.62 | -0.58 | -0.62 | -0.63 | 1.84 | -0.40 | -0.44 | NA | NA | NA | NA | NA | NA | NA | NA | NA | NA | NA | NA | NA | NA | NA | NA | NA | NA | NA | NA | NA | NA |
| 2024-03-31 | 2023-12-31 | 2023-09-30 | 2023-06-30 | 2023-03-31 | 2022-12-31 | 2022-09-30 | 2022-06-30 | 2022-03-31 | 2021-12-31 | 2021-09-30 | 2021-06-30 | 2021-03-31 | 2020-12-31 | 2020-09-30 | 2020-06-30 | 2020-03-31 | 2019-12-31 | 2019-09-30 | 2019-06-30 | 2019-03-31 | 2018-12-31 | 2018-09-30 | 2018-06-30 | 2018-03-31 | 2017-12-31 | 2017-09-30 | 2017-06-30 | 2017-03-31 | 2016-12-31 | 2016-09-30 | 2016-06-30 | 2016-03-31 | 2015-12-31 | ||
|---|---|---|---|---|---|---|---|---|---|---|---|---|---|---|---|---|---|---|---|---|---|---|---|---|---|---|---|---|---|---|---|---|---|---|---|
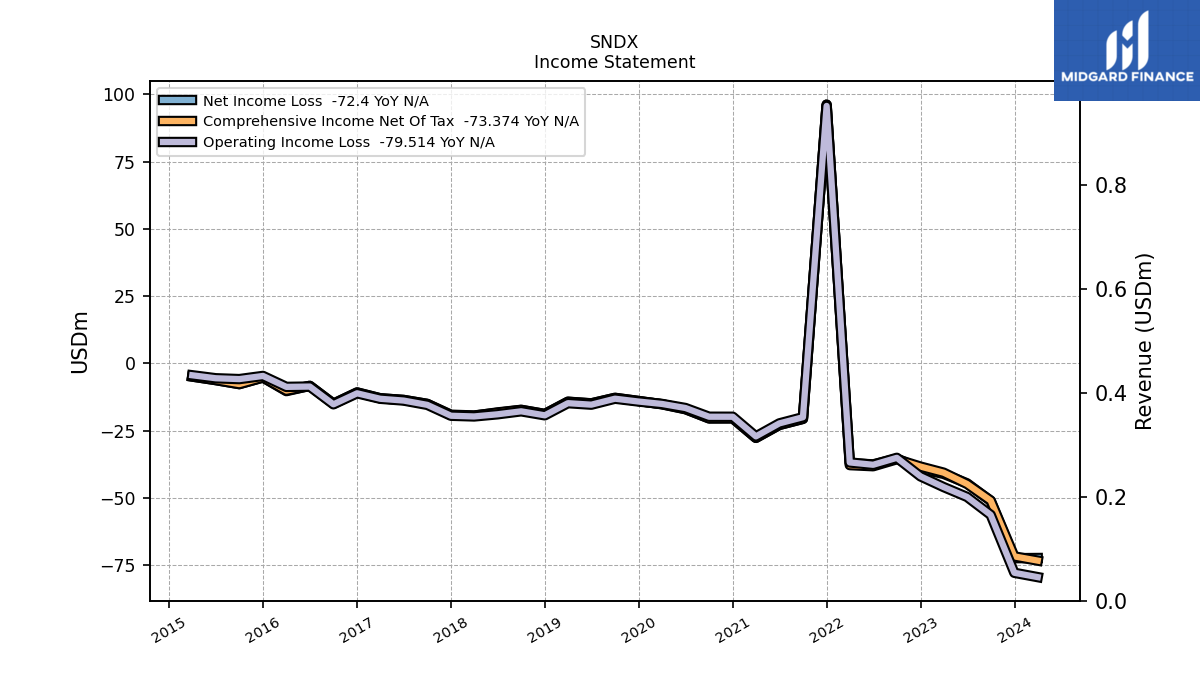
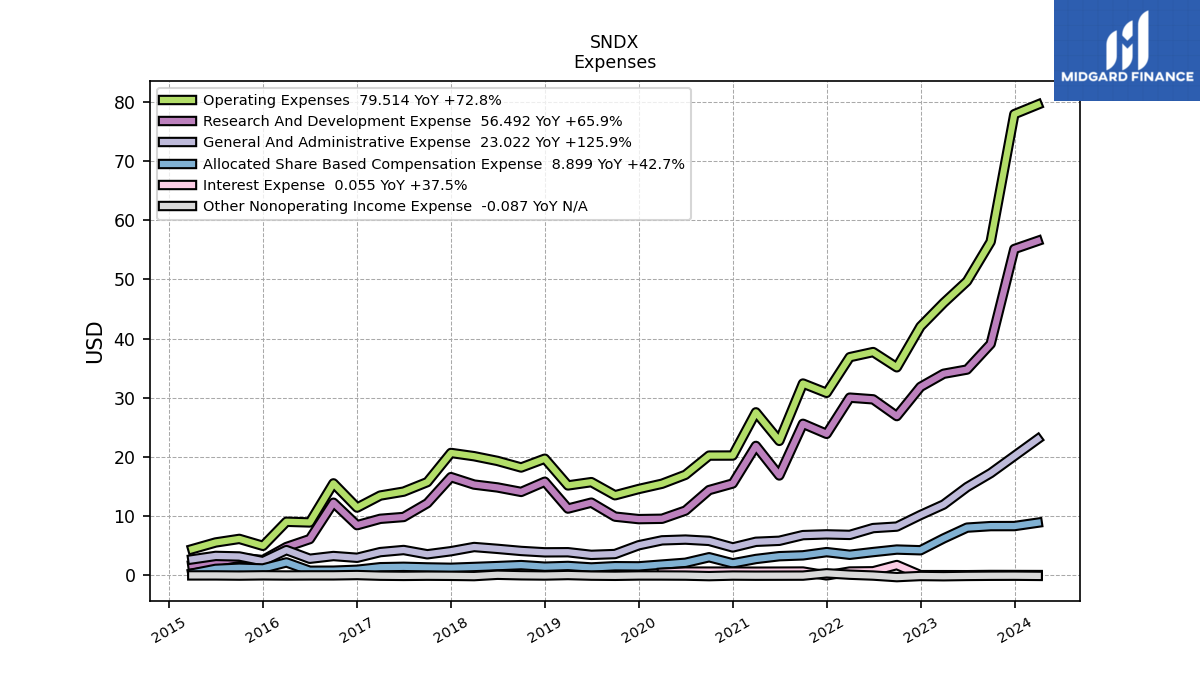
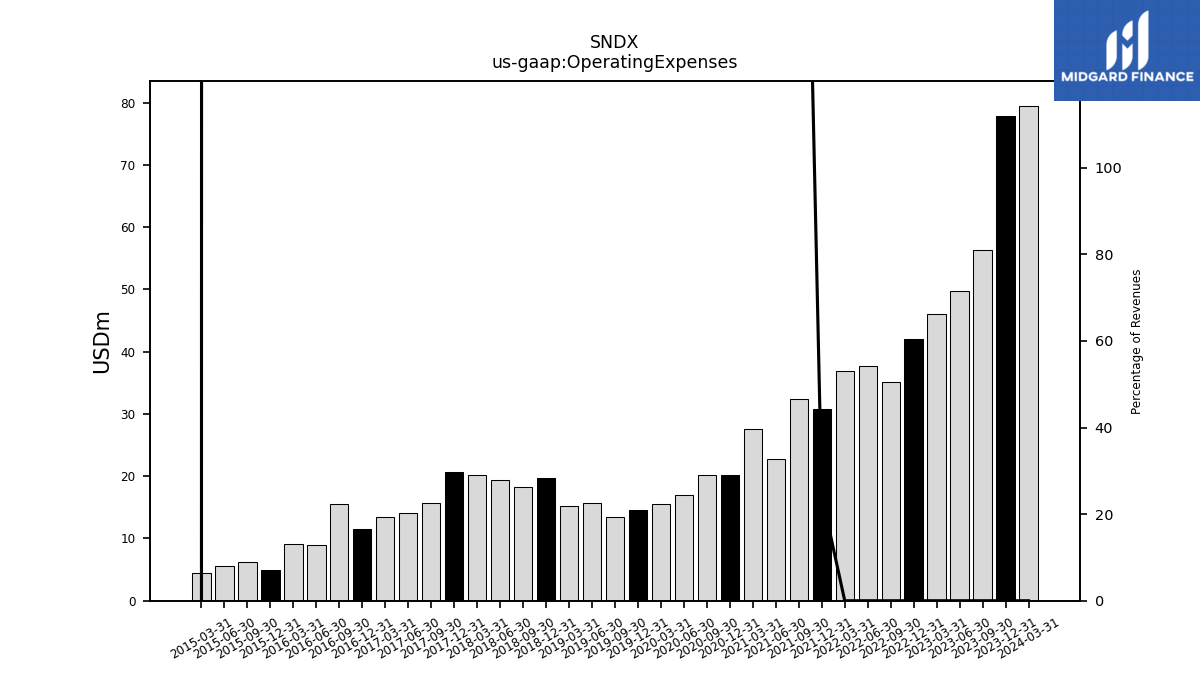
| Operating Expenses | 79.51 | 77.91 | 56.35 | 49.68 | 46.02 | 42.03 | 35.14 | 37.72 | 36.86 | 30.83 | 32.41 | 22.71 | 27.54 | 20.24 | 20.23 | 16.99 | 15.48 | 14.59 | 13.53 | 15.75 | 15.19 | 19.71 | 18.22 | 19.33 | 20.13 | 20.68 | 15.75 | 14.15 | 13.48 | 11.45 | 15.54 | 8.94 | 9.06 | 4.98 | |
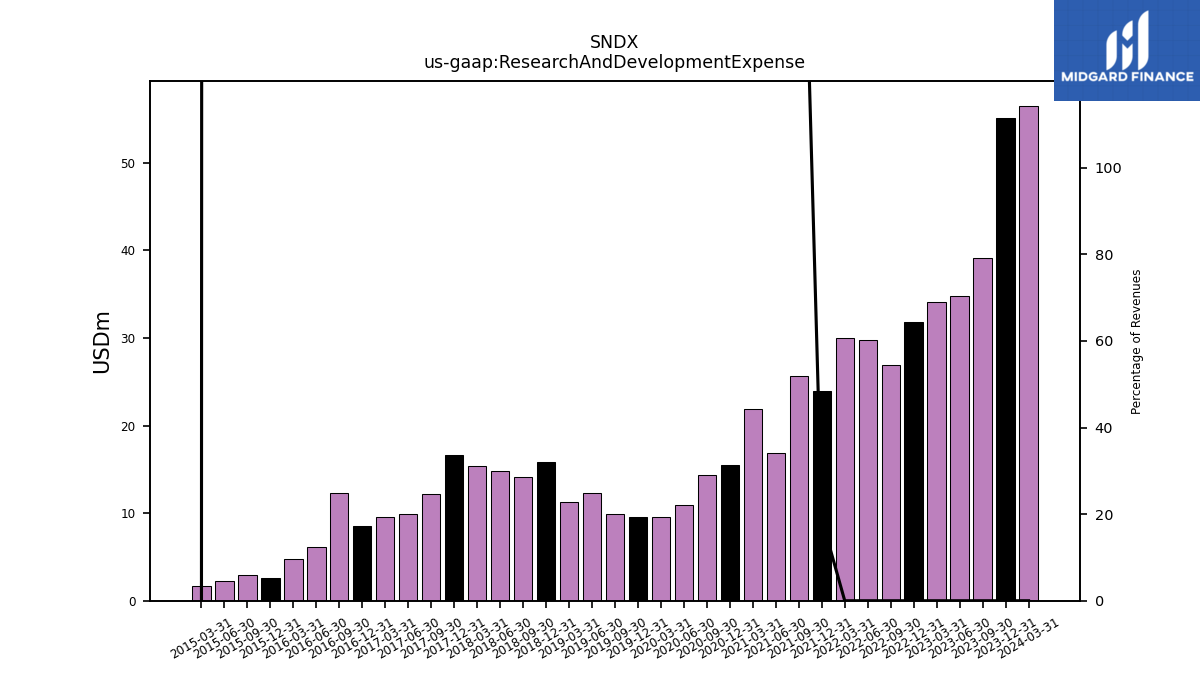
| Research And Development Expense | 56.49 | 55.13 | 39.09 | 34.76 | 34.05 | 31.84 | 26.90 | 29.73 | 30.02 | 23.90 | 25.61 | 16.87 | 21.87 | 15.52 | 14.41 | 10.94 | 9.56 | 9.50 | 9.92 | 12.29 | 11.28 | 15.82 | 14.10 | 14.85 | 15.34 | 16.60 | 12.19 | 9.86 | 9.55 | 8.47 | 12.27 | 6.13 | 4.79 | 2.59 | |
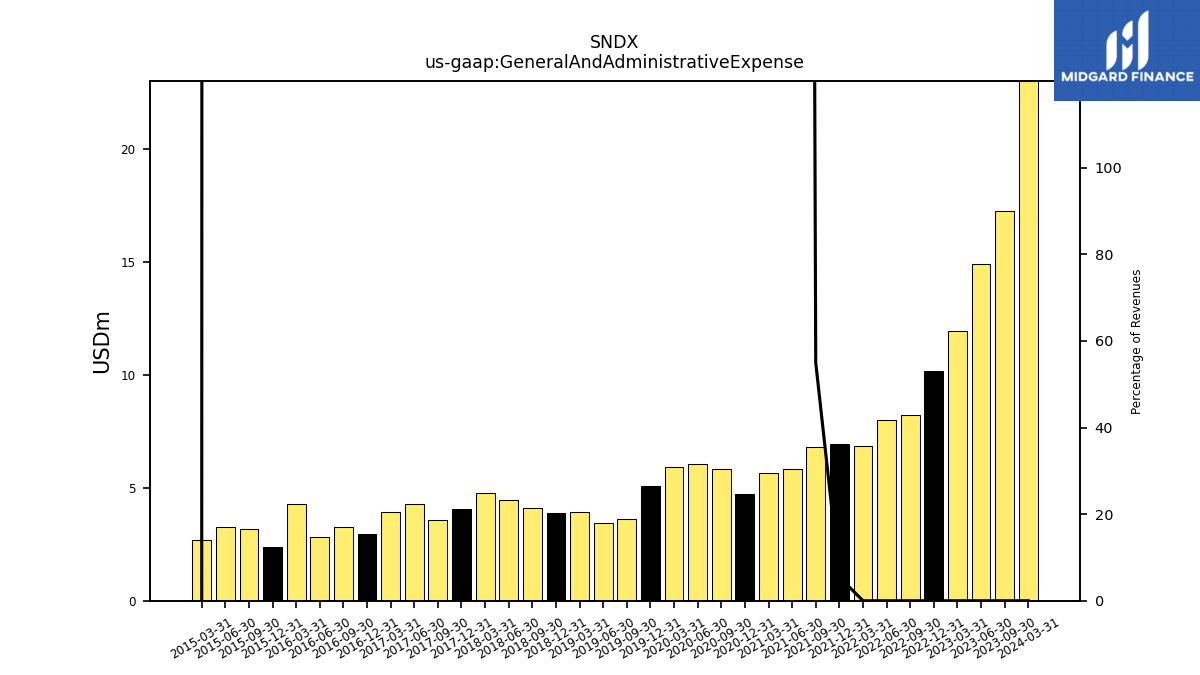
| General And Administrative Expense | 23.02 | NA | 17.27 | 14.91 | 11.96 | 10.19 | 8.24 | 7.99 | 6.84 | 6.93 | 6.80 | 5.84 | 5.67 | 4.72 | 5.82 | 6.05 | 5.92 | 5.08 | 3.60 | 3.46 | 3.91 | 3.89 | 4.12 | 4.48 | 4.79 | 4.08 | 3.56 | 4.29 | 3.93 | 2.97 | 3.27 | 2.81 | 4.27 | 2.40 | |
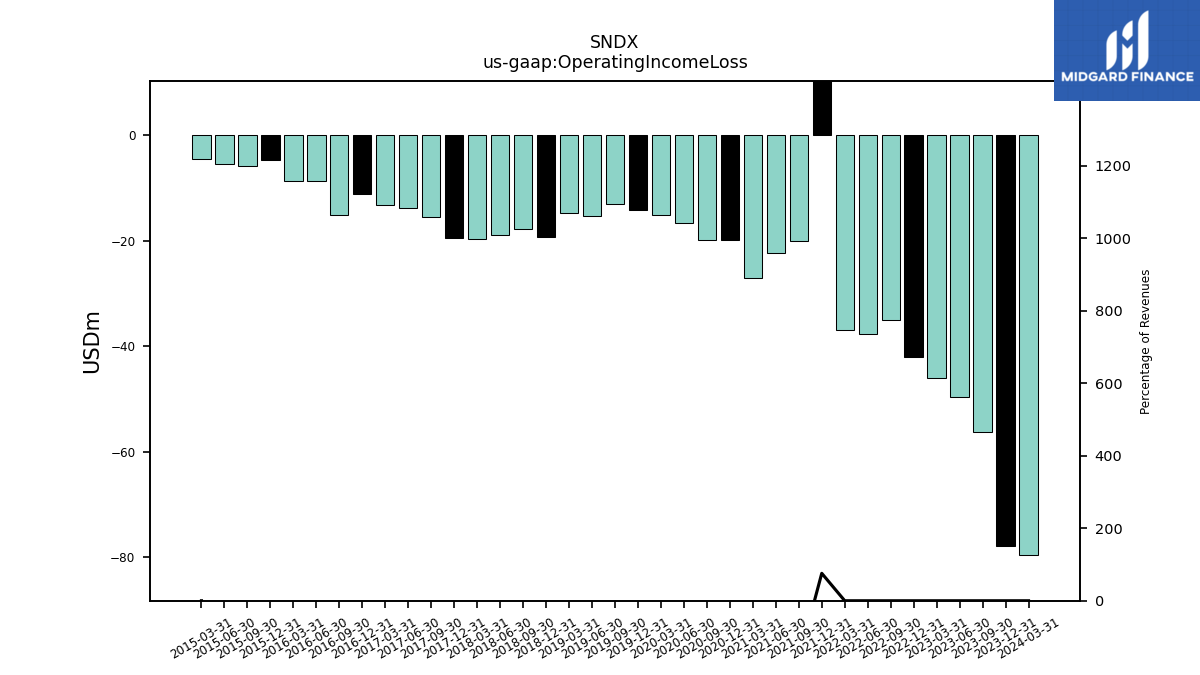
| Operating Income Loss | -79.51 | -77.91 | -56.35 | -49.68 | -46.02 | -42.03 | -35.14 | -37.72 | -36.86 | 95.75 | -20.03 | -22.33 | -27.16 | -19.86 | -19.85 | -16.61 | -15.10 | -14.21 | -13.15 | -15.37 | -14.81 | -19.33 | -17.84 | -18.95 | -19.75 | -19.49 | -15.45 | -13.84 | -13.18 | -11.14 | -15.24 | -8.63 | -8.75 | -4.68 | |
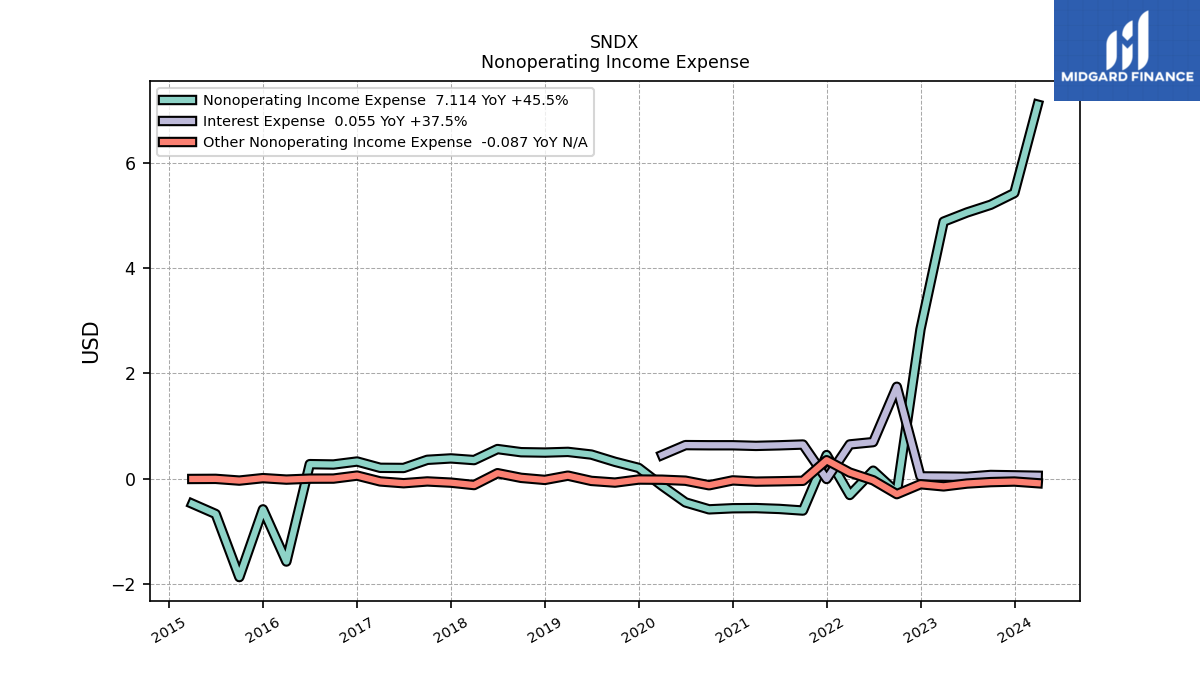
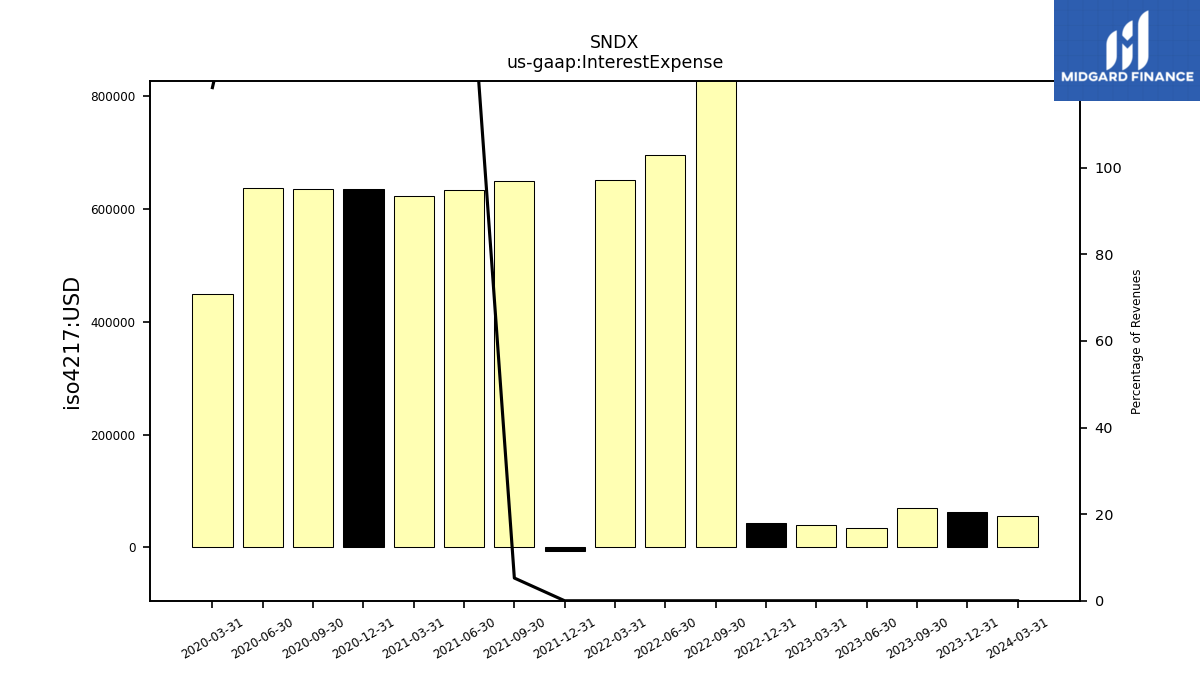
| Interest Expense | 0.06 | 0.06 | 0.07 | 0.04 | 0.04 | 0.04 | 1.75 | 0.69 | 0.65 | -0.01 | 0.65 | 0.63 | 0.62 | 0.64 | 0.64 | 0.64 | 0.45 | NA | NA | NA | NA | NA | NA | NA | NA | NA | NA | NA | NA | NA | NA | NA | NA | NA | |
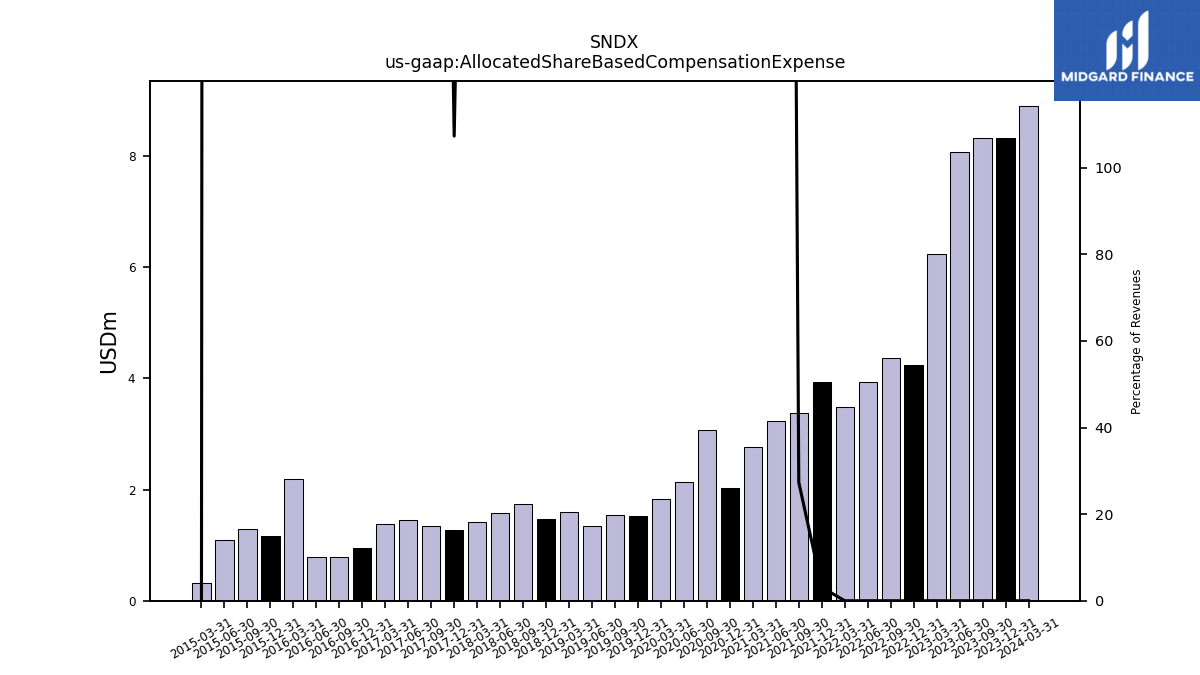
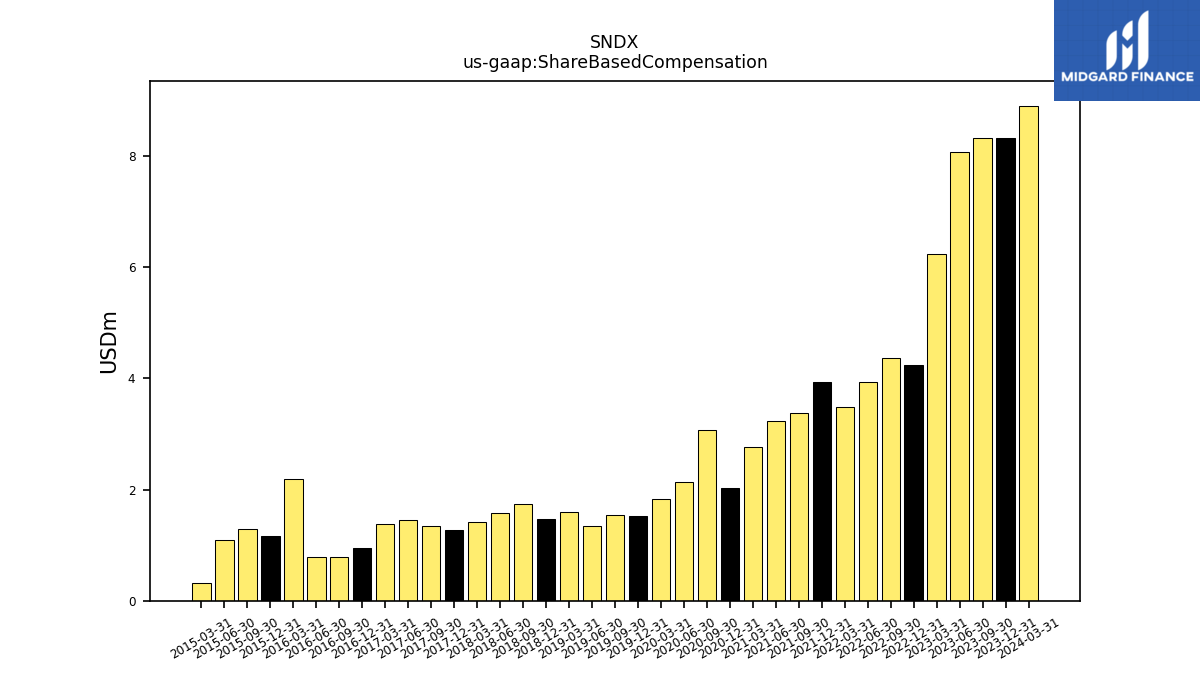
| Allocated Share Based Compensation Expense | 8.90 | 8.33 | 8.32 | 8.06 | 6.24 | 4.24 | 4.36 | 3.94 | 3.48 | 3.93 | 3.38 | 3.24 | 2.77 | 2.04 | 3.06 | 2.13 | 1.83 | 1.52 | 1.55 | 1.34 | 1.59 | 1.47 | 1.74 | 1.57 | 1.42 | 1.28 | 1.35 | 1.45 | 1.38 | 0.95 | 0.79 | 0.78 | 2.19 | 1.17 | |
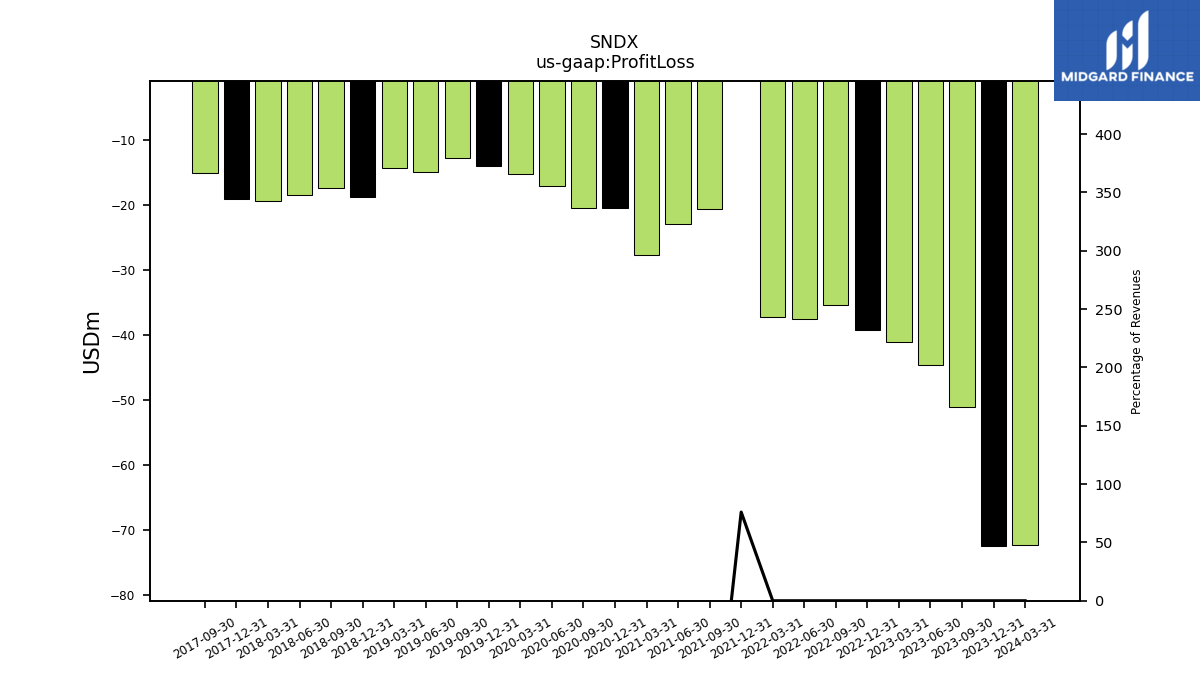
| Profit Loss | -72.40 | -72.47 | -51.15 | -44.62 | -41.13 | -39.19 | -35.40 | -37.57 | -37.17 | 96.20 | -20.64 | -22.91 | -27.72 | -20.42 | -20.44 | -17.06 | -15.24 | -14.00 | -12.83 | -14.92 | -14.30 | -18.84 | -17.34 | -18.39 | -19.40 | -19.10 | -15.09 | NA | NA | NA | NA | NA | NA | NA | |
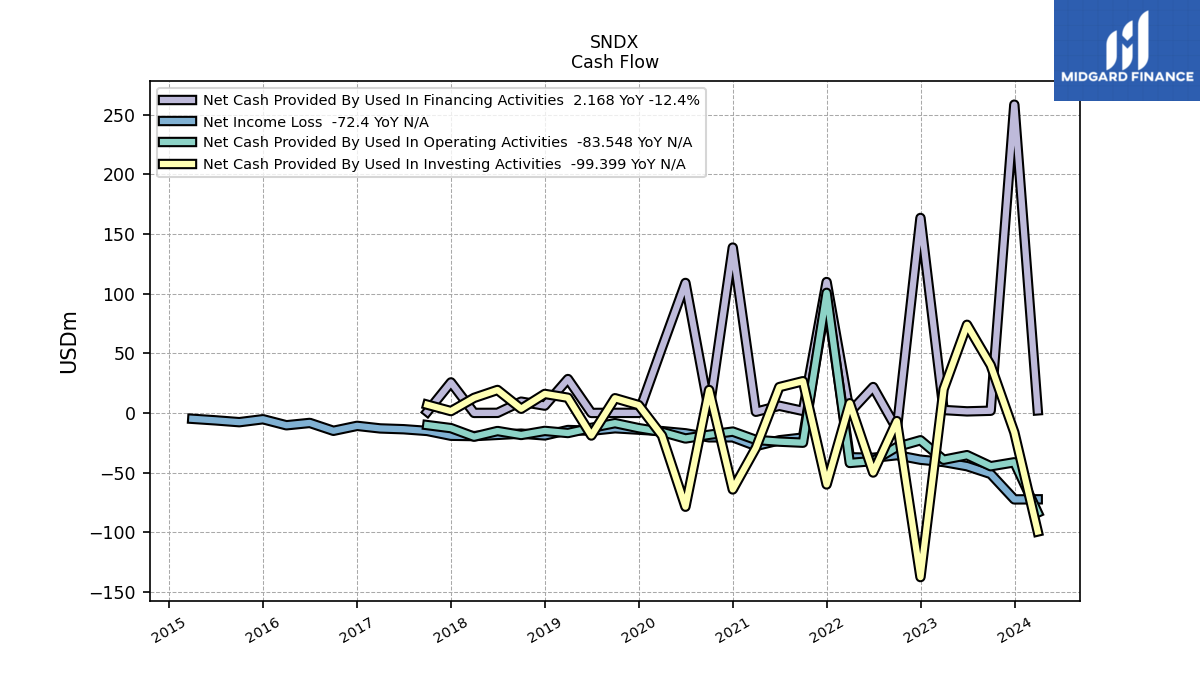
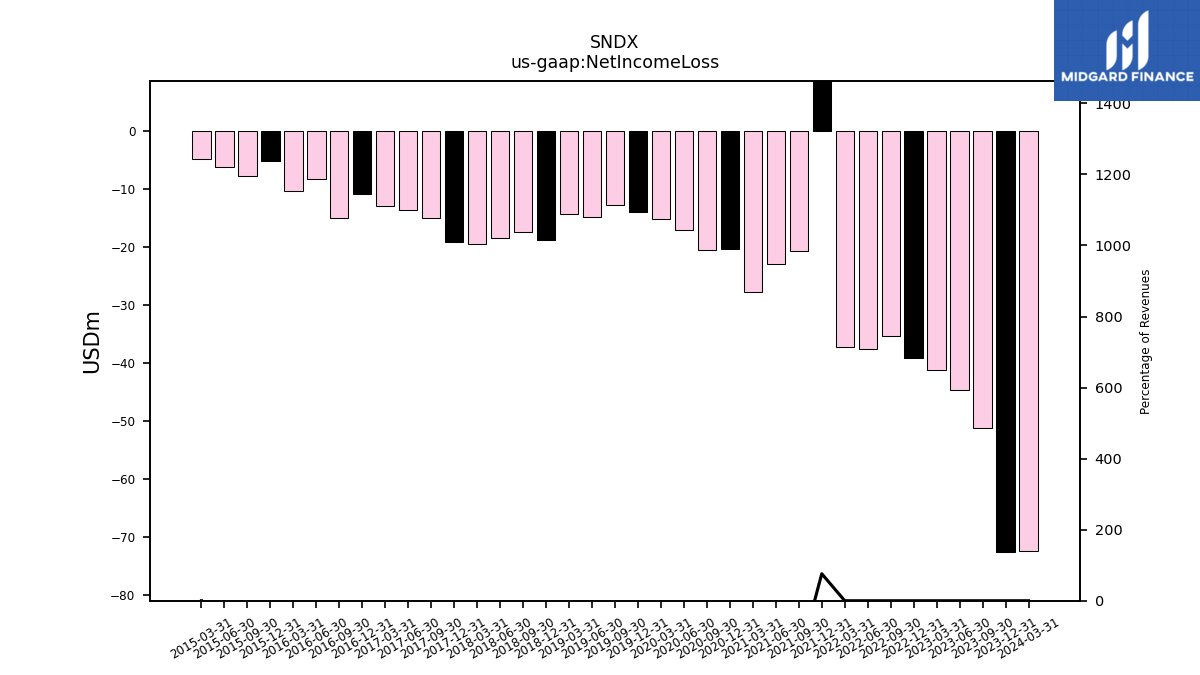
| Net Income Loss | -72.40 | -72.47 | -51.15 | -44.62 | -41.13 | -39.19 | -35.40 | -37.57 | -37.17 | 96.20 | -20.64 | -22.91 | -27.72 | -20.42 | -20.44 | -17.06 | -15.24 | -14.00 | -12.83 | -14.92 | -14.30 | -18.84 | -17.34 | -18.39 | -19.40 | -19.10 | -15.09 | -13.64 | -12.97 | -10.81 | -14.97 | -8.36 | -10.33 | -5.26 | |
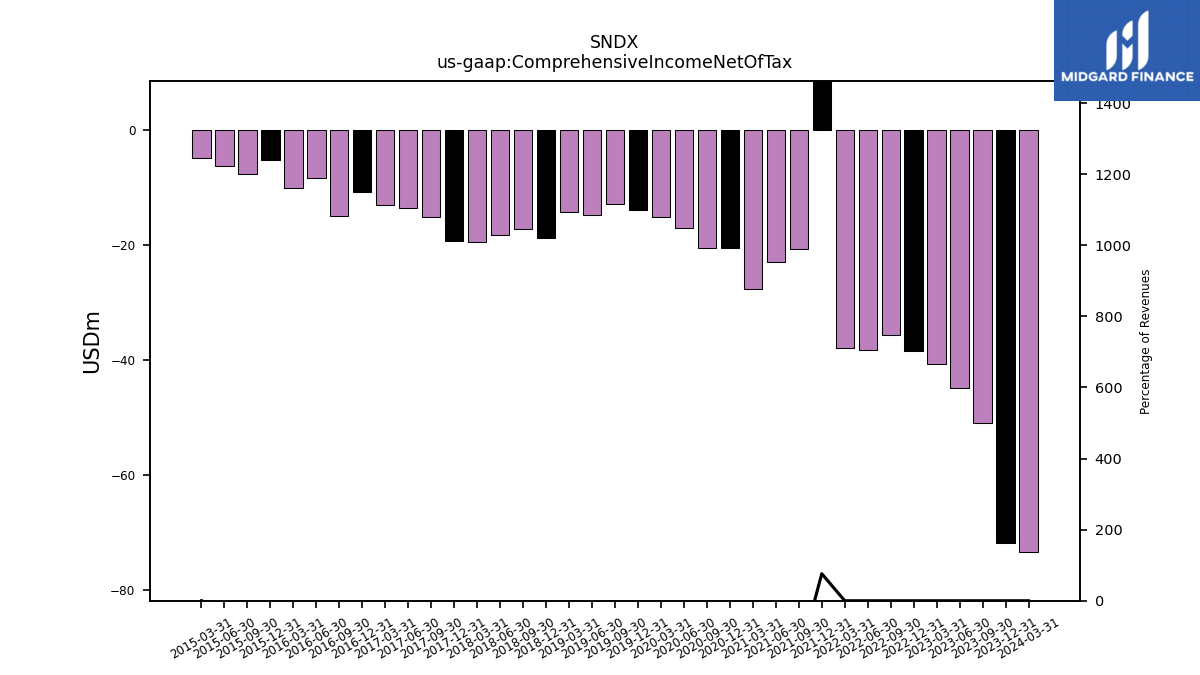
| Comprehensive Income Net Of Tax | -73.37 | -71.80 | -51.03 | -44.85 | -40.66 | -38.40 | -35.67 | -38.27 | -37.85 | 96.23 | -20.64 | -22.90 | -27.71 | -20.48 | -20.50 | -16.99 | -15.19 | -14.03 | -12.86 | -14.87 | -14.27 | -18.83 | -17.28 | -18.26 | -19.47 | -19.27 | -15.10 | -13.60 | -13.03 | -10.86 | -15.06 | -8.39 | -10.13 | -5.25 | |
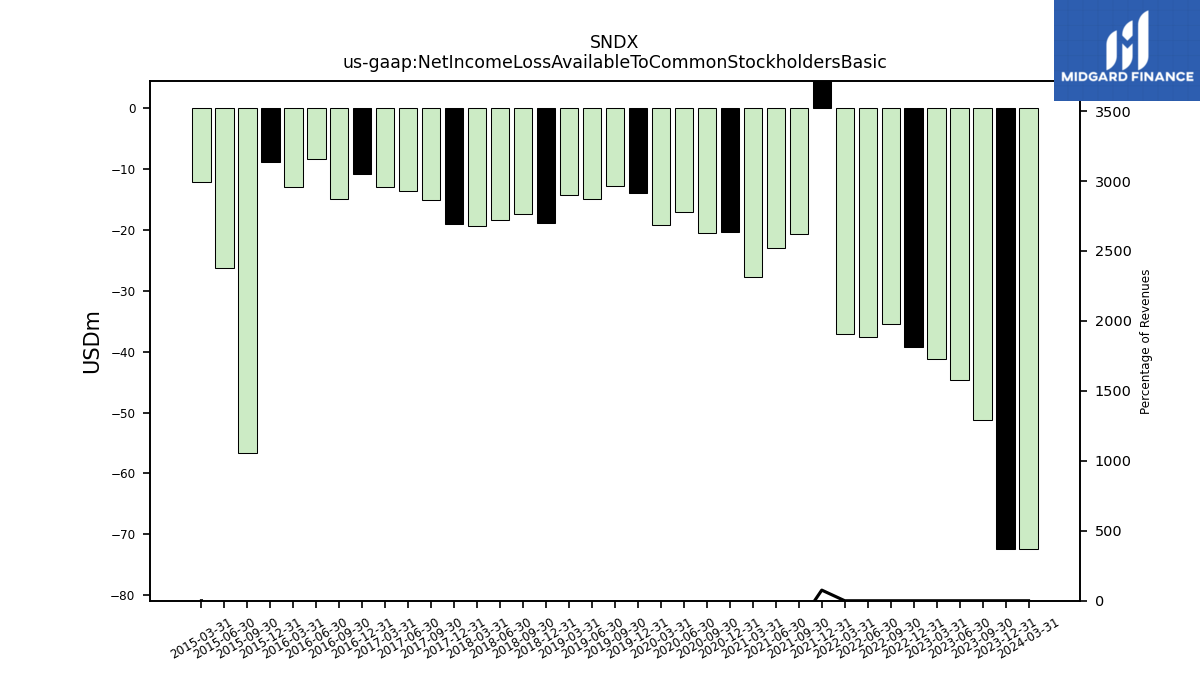
| Net Income Loss Available To Common Stockholders Basic | -72.40 | -72.47 | -51.15 | -44.62 | -41.13 | -39.19 | -35.40 | -37.57 | -37.17 | 96.20 | -20.64 | -22.91 | -27.72 | -20.42 | -20.44 | -17.06 | -19.14 | -14.00 | -12.83 | -14.92 | -14.30 | -18.84 | -17.34 | -18.39 | -19.40 | -19.10 | -15.09 | -13.64 | -12.97 | -10.81 | -14.97 | -8.36 | -12.93 | -8.78 | |
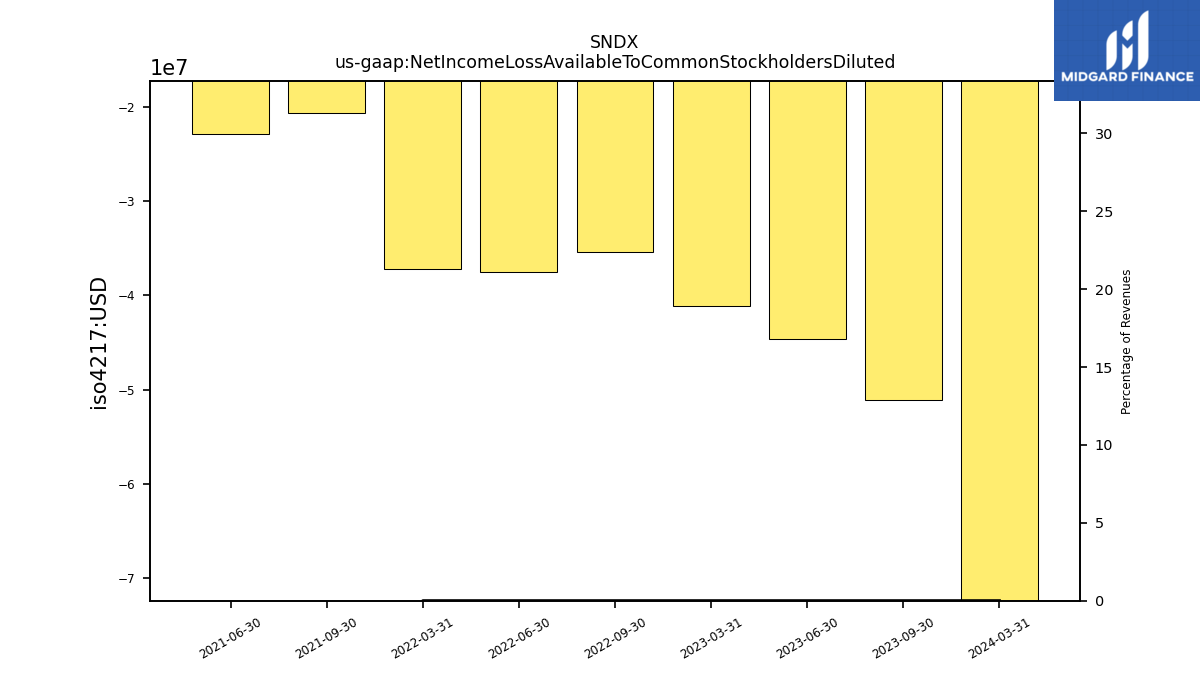
| Net Income Loss Available To Common Stockholders Diluted | -72.40 | NA | -51.15 | -44.62 | -41.13 | NA | -35.40 | -37.57 | -37.17 | NA | -20.64 | -22.91 | NA | NA | NA | NA | NA | NA | NA | NA | NA | NA | NA | NA | NA | NA | NA | NA | NA | NA | NA | NA | NA | NA |
| 2024-03-31 | 2023-12-31 | 2023-09-30 | 2023-06-30 | 2023-03-31 | 2022-12-31 | 2022-09-30 | 2022-06-30 | 2022-03-31 | 2021-12-31 | 2021-09-30 | 2021-06-30 | 2021-03-31 | 2020-12-31 | 2020-09-30 | 2020-06-30 | 2020-03-31 | 2019-12-31 | 2019-09-30 | 2019-06-30 | 2019-03-31 | 2018-12-31 | 2018-09-30 | 2018-06-30 | 2018-03-31 | 2017-12-31 | 2017-09-30 | 2017-06-30 | 2017-03-31 | 2016-12-31 | 2016-09-30 | 2016-06-30 | 2016-03-31 | 2015-12-31 | ||
|---|---|---|---|---|---|---|---|---|---|---|---|---|---|---|---|---|---|---|---|---|---|---|---|---|---|---|---|---|---|---|---|---|---|---|---|
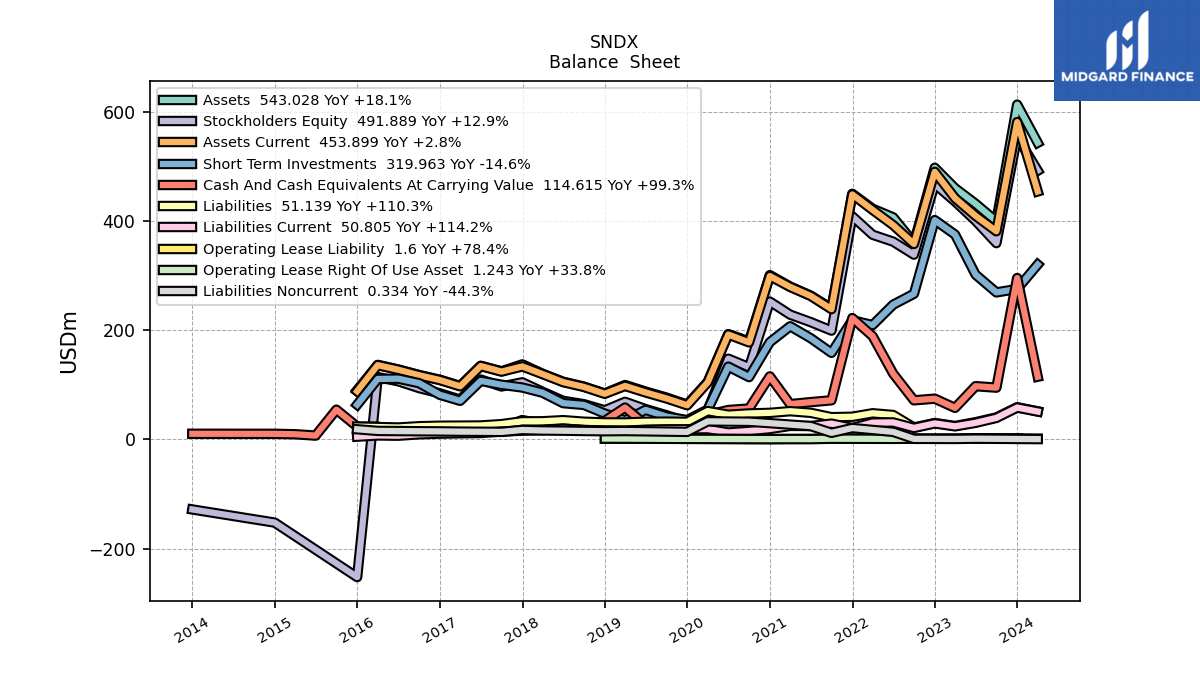
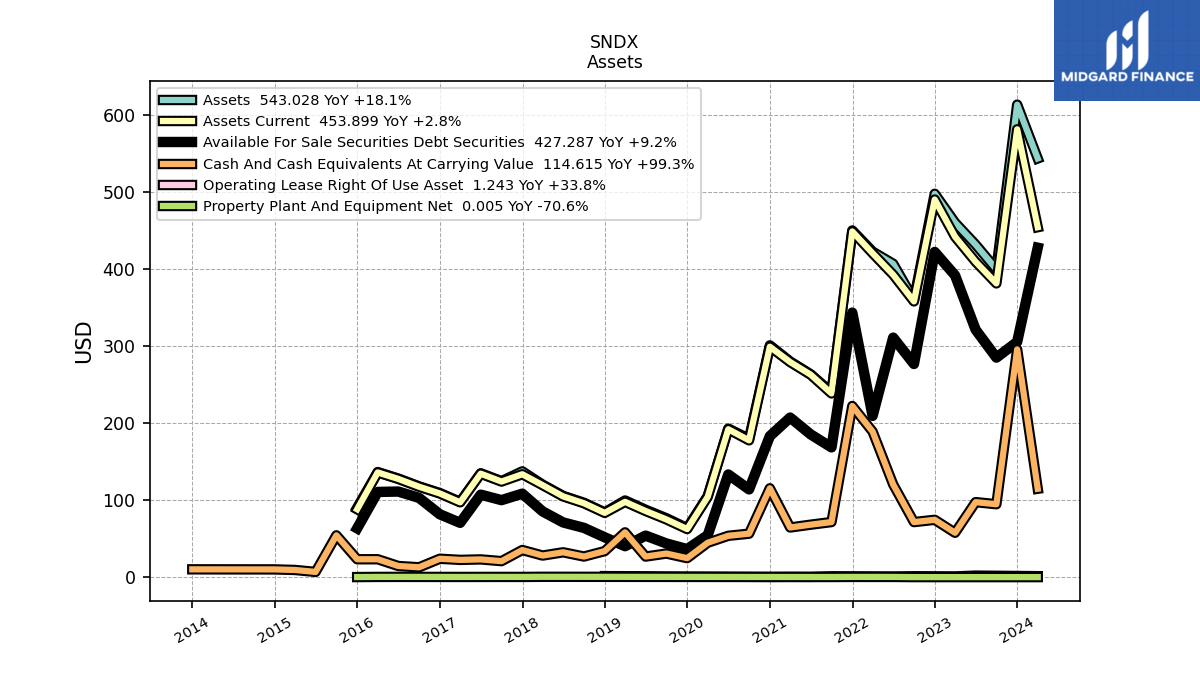
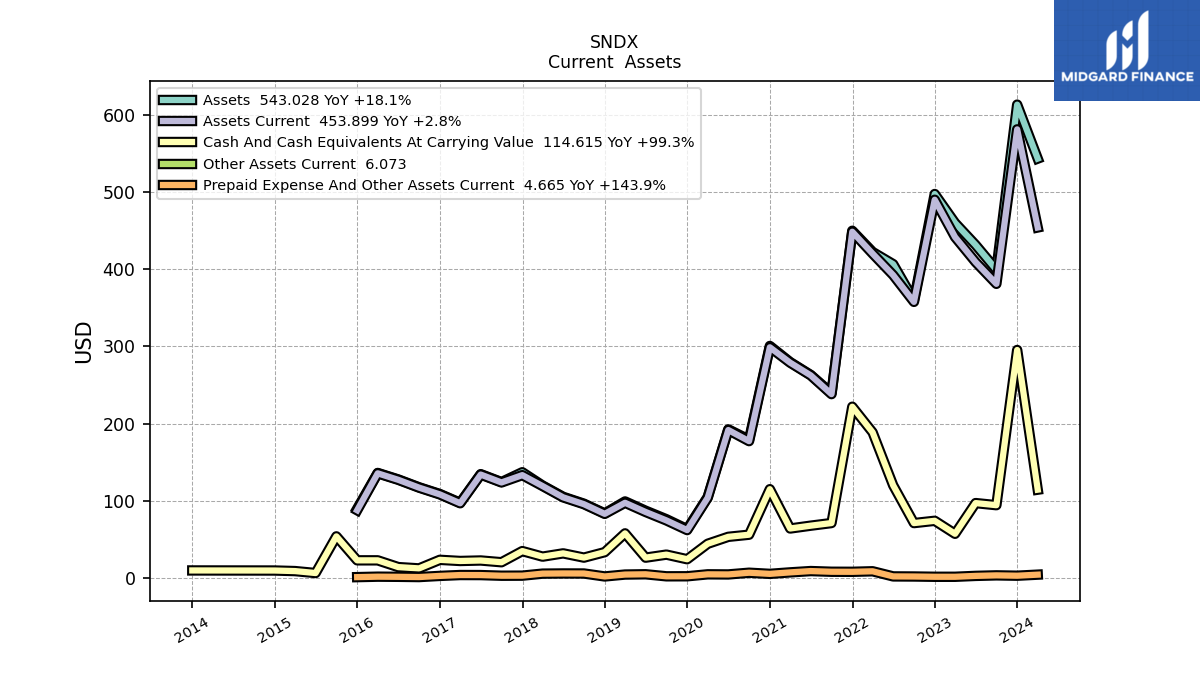
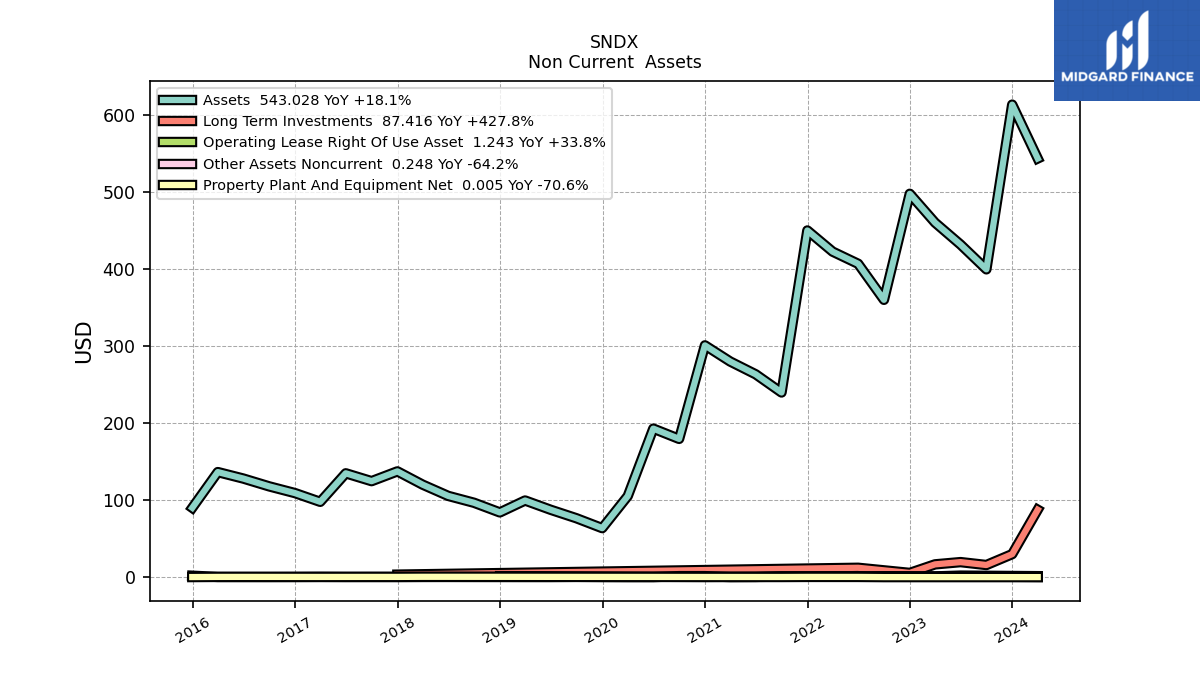
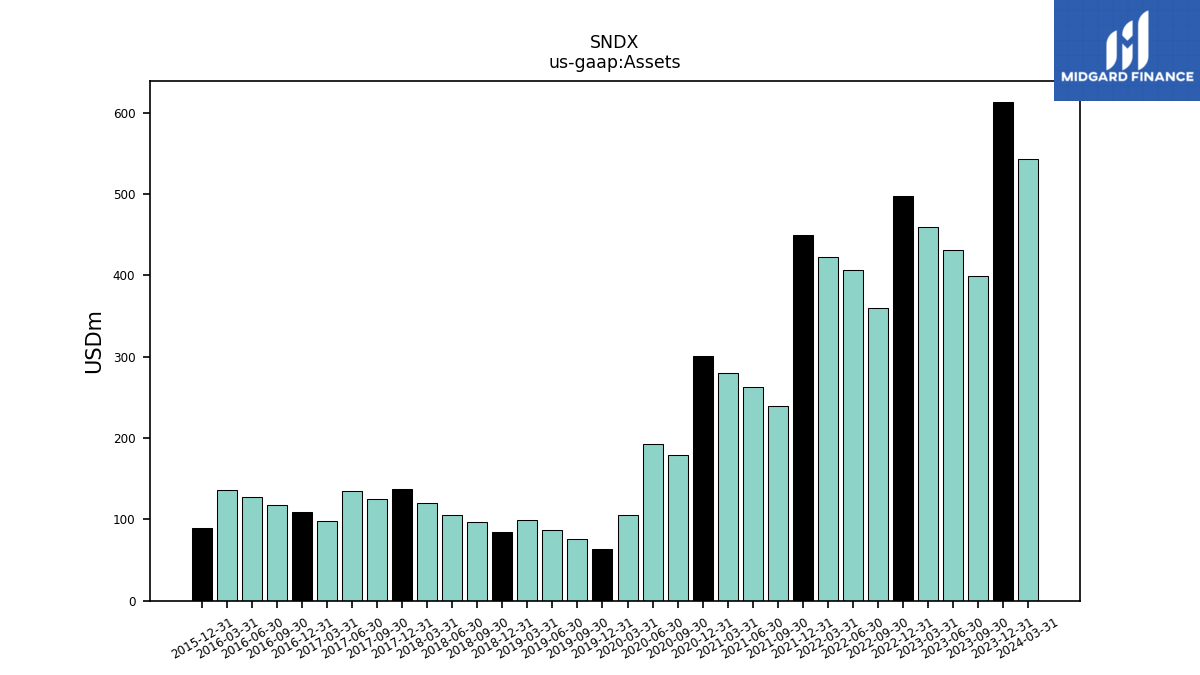
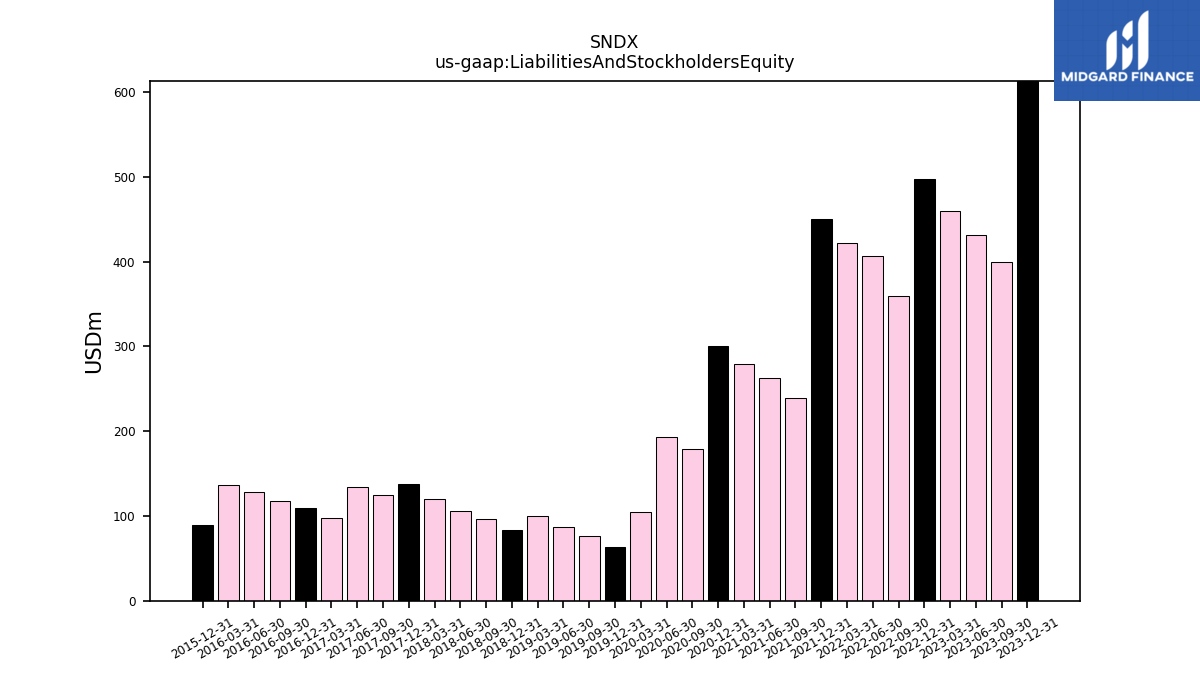
| Assets | 543.03 | 612.88 | 399.22 | 431.34 | 459.83 | 497.24 | 359.69 | 406.44 | 422.22 | 449.66 | 239.50 | 263.06 | 279.67 | 300.61 | 179.31 | 192.63 | 105.16 | 63.52 | 76.38 | 87.39 | 99.39 | 83.94 | 96.47 | 105.37 | 119.96 | 137.19 | 124.49 | 134.67 | 97.67 | 109.01 | 117.73 | 127.86 | 136.26 | 89.90 | |
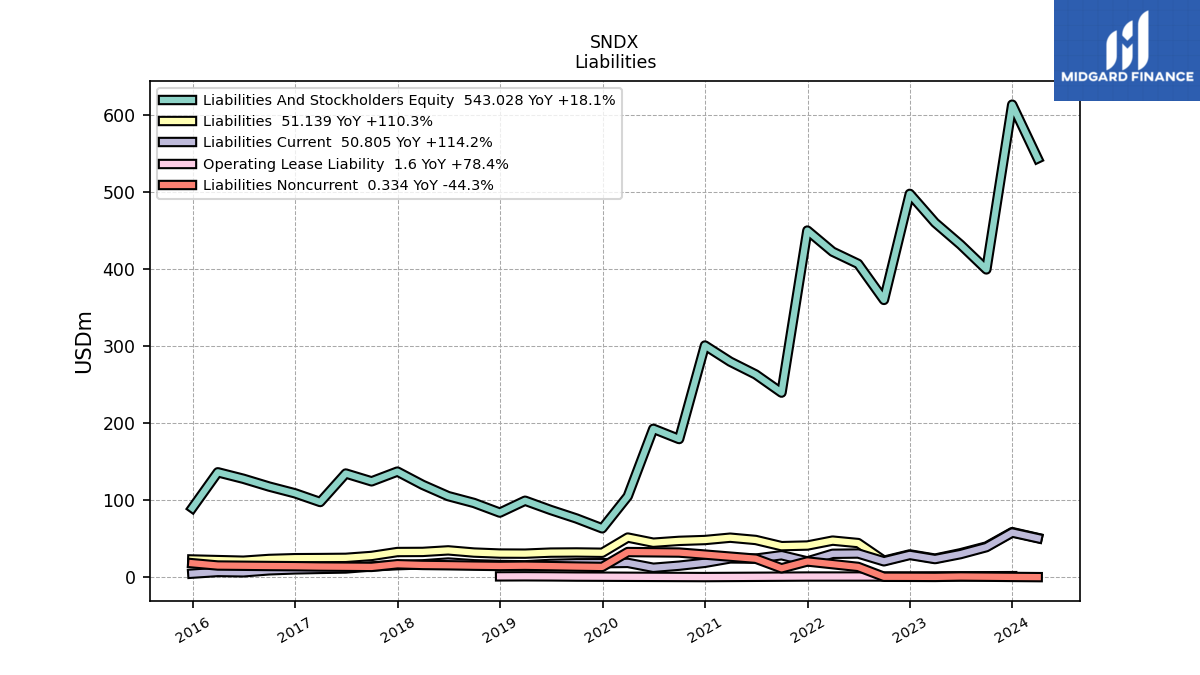
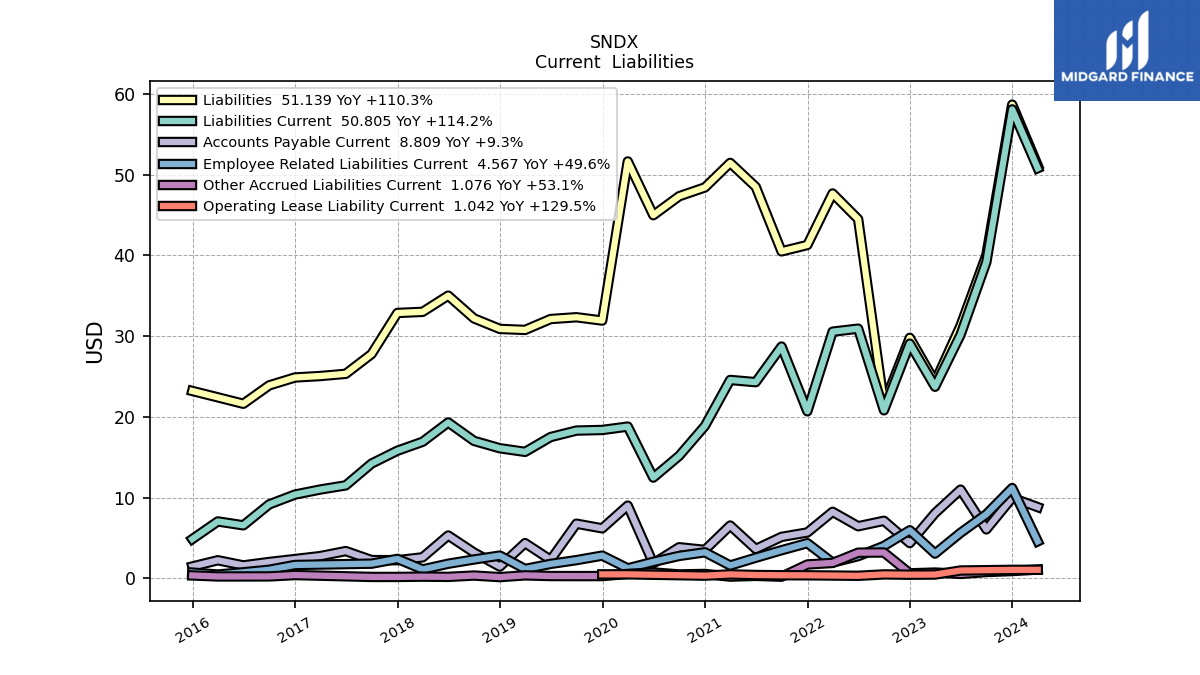
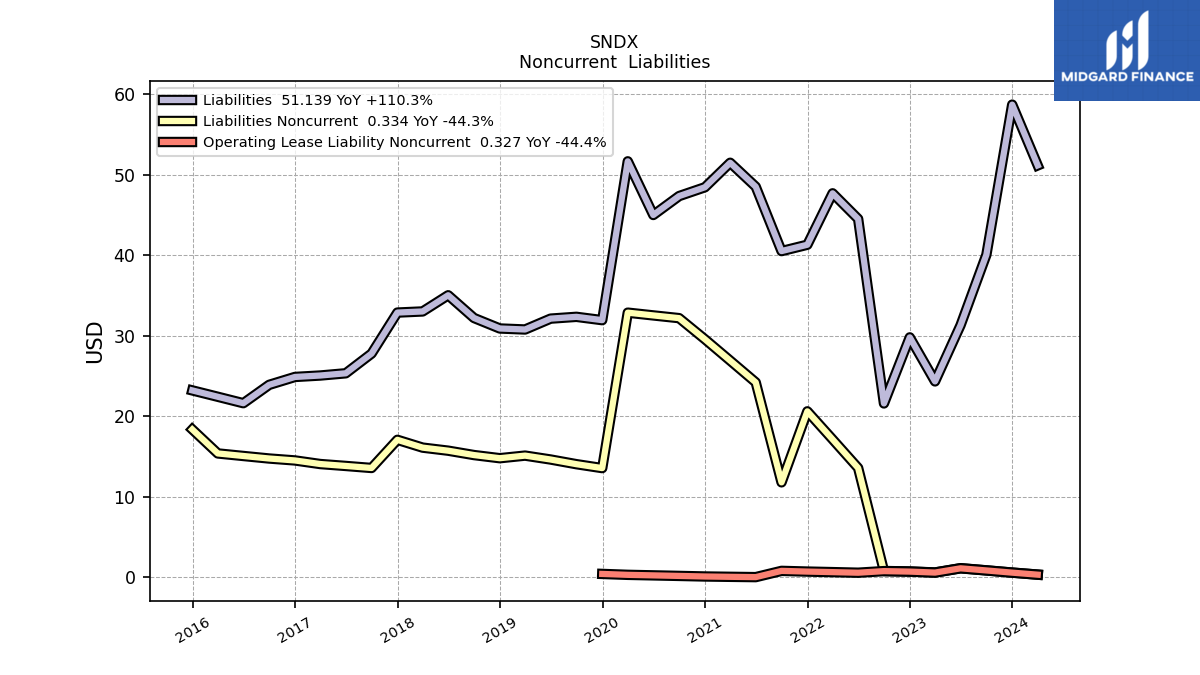
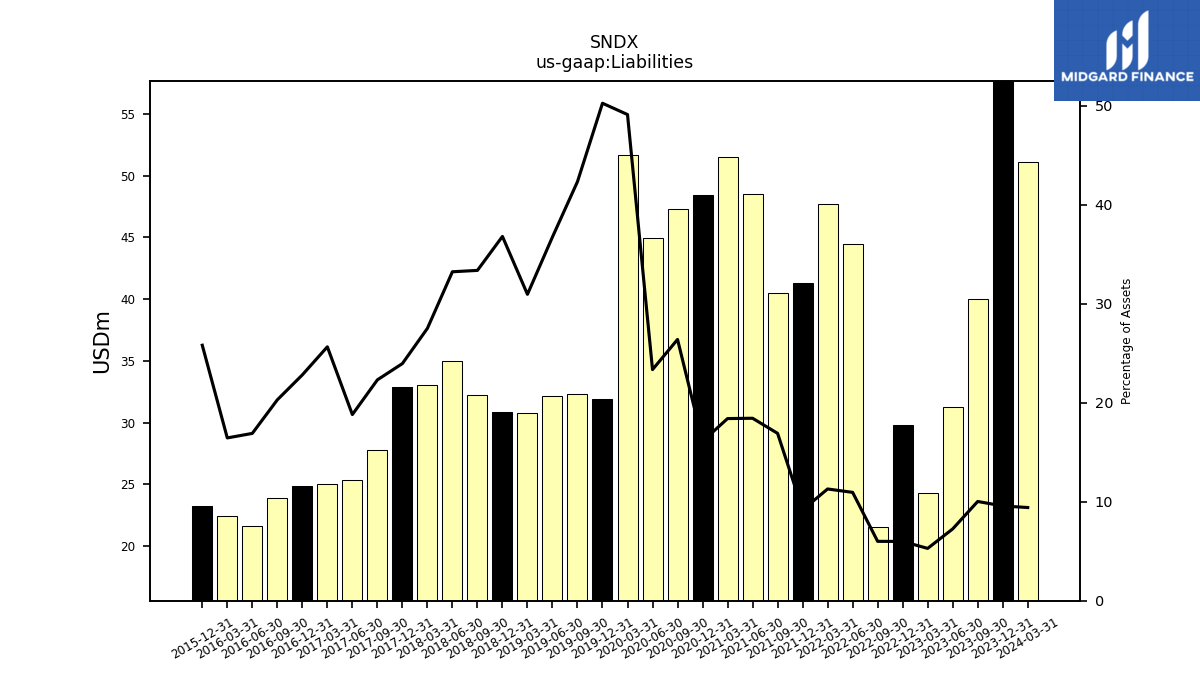
| Liabilities | 51.14 | 58.68 | 40.04 | 31.30 | 24.32 | 29.79 | 21.59 | 44.50 | 47.67 | 41.29 | 40.50 | 48.50 | 51.47 | 48.42 | 47.33 | 44.98 | 51.65 | 31.93 | 32.34 | 32.12 | 30.77 | 30.89 | 32.19 | 35.02 | 33.01 | 32.87 | 27.78 | 25.33 | 25.05 | 24.87 | 23.89 | 21.61 | 22.41 | 23.20 | |
| Liabilities And Stockholders Equity | 543.03 | 612.88 | 399.22 | 431.34 | 459.83 | 497.24 | 359.69 | 406.44 | 422.22 | 449.66 | 239.50 | 263.06 | 279.67 | 300.61 | 179.31 | 192.63 | 105.16 | 63.52 | 76.38 | 87.39 | 99.39 | 83.94 | 96.47 | 105.37 | 119.96 | 137.19 | 124.49 | 134.67 | 97.67 | 109.01 | 117.73 | 127.86 | 136.26 | 89.90 | |
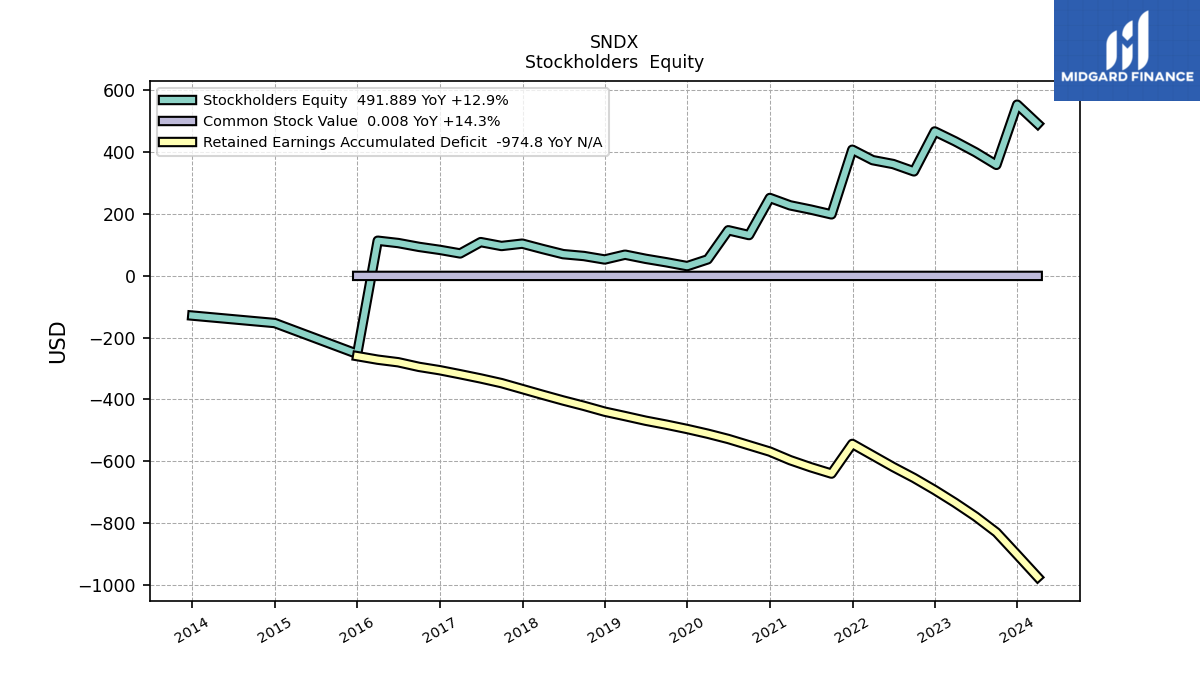
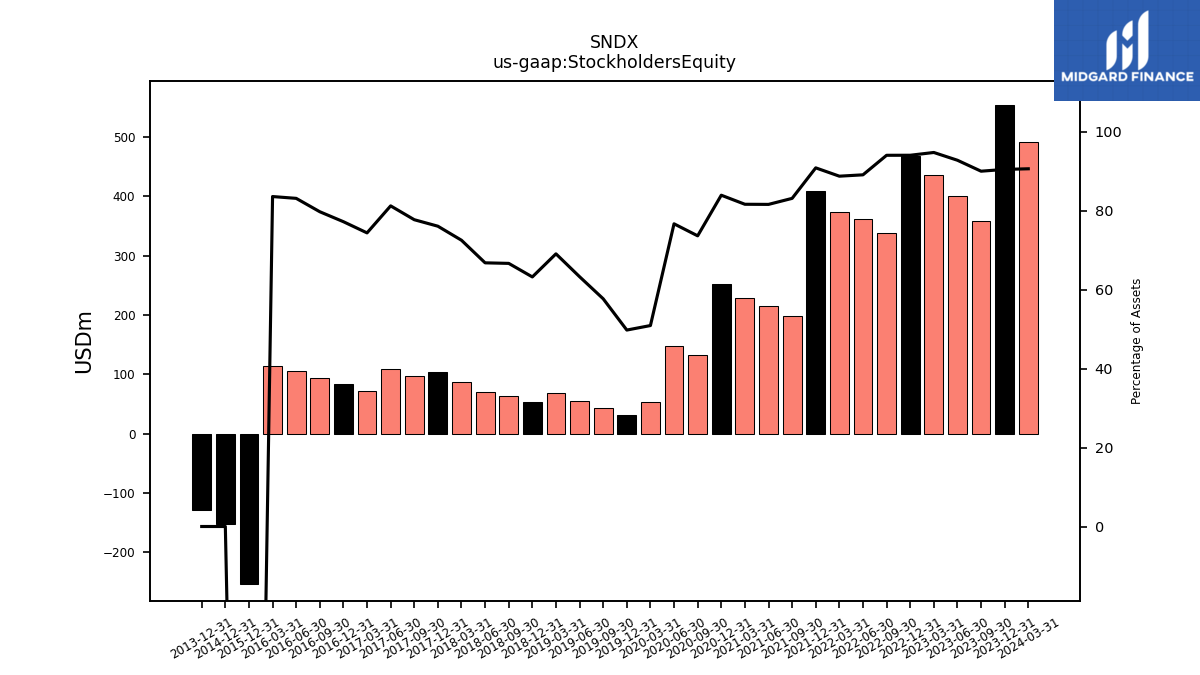
| Stockholders Equity | 491.89 | 554.20 | 359.19 | 400.04 | 435.50 | 467.45 | 338.10 | 361.94 | 374.55 | 408.37 | 199.00 | 214.56 | 228.21 | 252.19 | 131.98 | 147.65 | 53.51 | 31.60 | 44.04 | 55.27 | 68.63 | 53.05 | 64.27 | 70.35 | 86.95 | 104.32 | 96.71 | 109.34 | 72.61 | 84.14 | 93.83 | 106.24 | 113.85 | -252.41 |
| 2024-03-31 | 2023-12-31 | 2023-09-30 | 2023-06-30 | 2023-03-31 | 2022-12-31 | 2022-09-30 | 2022-06-30 | 2022-03-31 | 2021-12-31 | 2021-09-30 | 2021-06-30 | 2021-03-31 | 2020-12-31 | 2020-09-30 | 2020-06-30 | 2020-03-31 | 2019-12-31 | 2019-09-30 | 2019-06-30 | 2019-03-31 | 2018-12-31 | 2018-09-30 | 2018-06-30 | 2018-03-31 | 2017-12-31 | 2017-09-30 | 2017-06-30 | 2017-03-31 | 2016-12-31 | 2016-09-30 | 2016-06-30 | 2016-03-31 | 2015-12-31 | ||
|---|---|---|---|---|---|---|---|---|---|---|---|---|---|---|---|---|---|---|---|---|---|---|---|---|---|---|---|---|---|---|---|---|---|---|---|
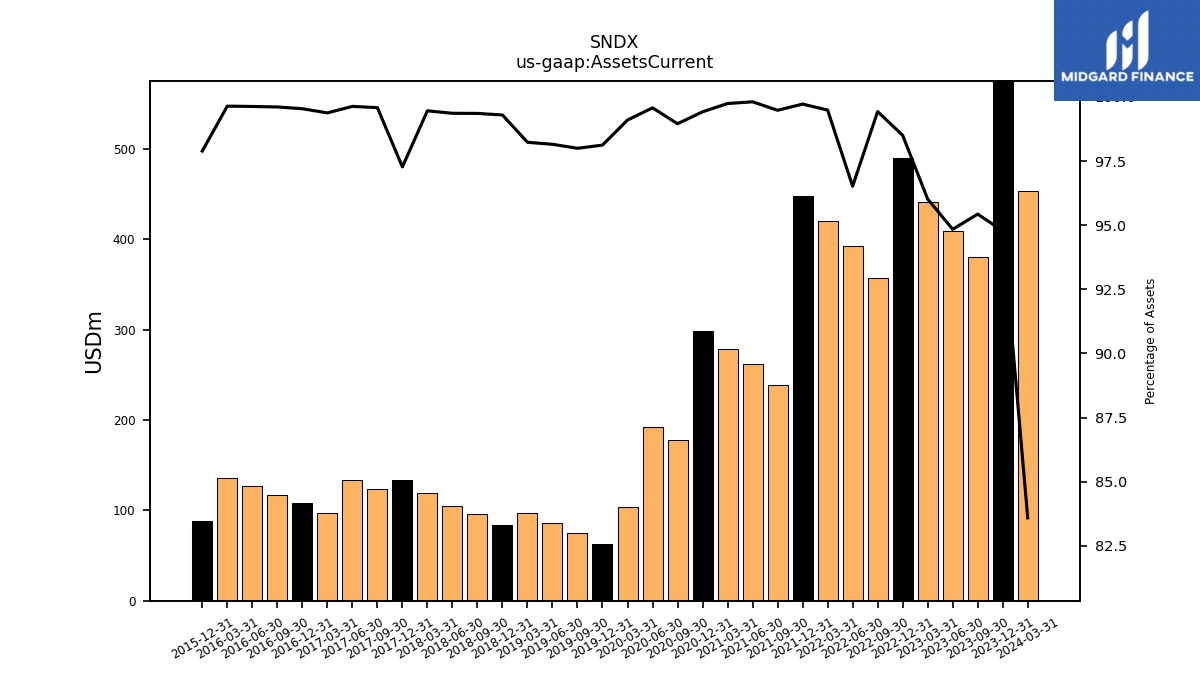
| Assets Current | 453.90 | 580.88 | 380.97 | 409.08 | 441.51 | 489.79 | 357.63 | 392.29 | 420.06 | 448.40 | 238.25 | 262.56 | 278.95 | 298.86 | 177.43 | 191.81 | 104.21 | 62.33 | 74.85 | 85.78 | 97.63 | 83.35 | 95.85 | 104.70 | 119.31 | 133.44 | 123.97 | 134.17 | 97.06 | 108.51 | 117.27 | 127.38 | 135.77 | 88.01 | |
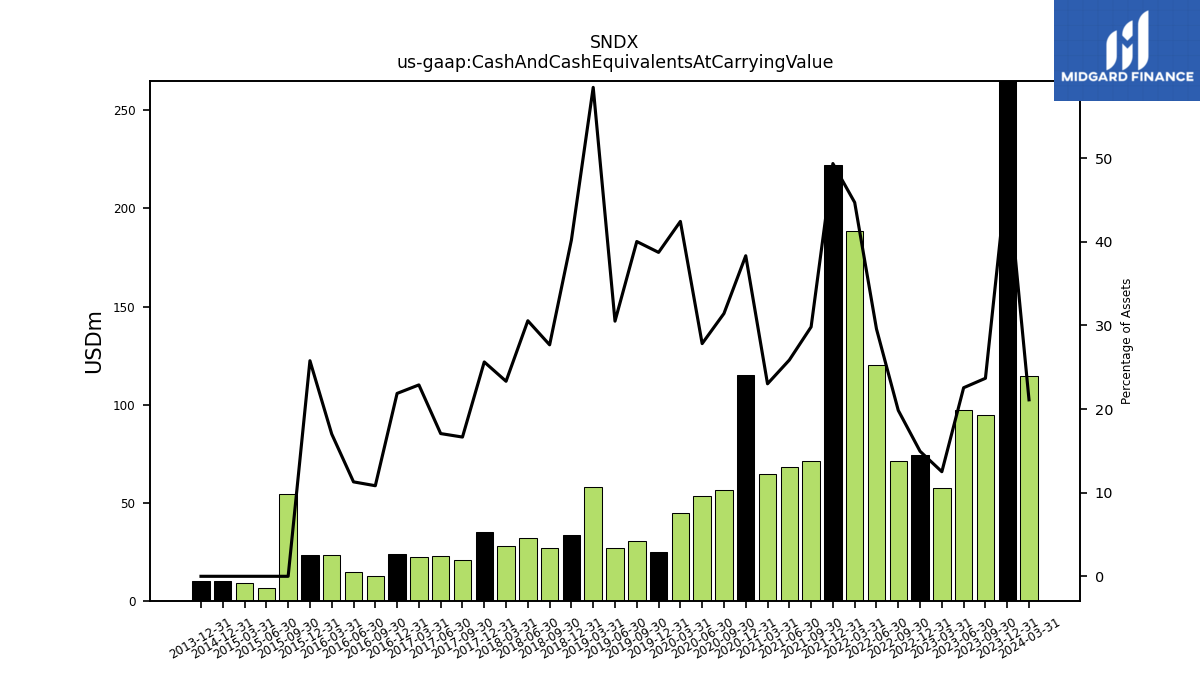
| Cash And Cash Equivalents At Carrying Value | 114.61 | 295.39 | 94.55 | 97.28 | 57.52 | 74.36 | 71.38 | 120.24 | 188.77 | 221.97 | 71.43 | 68.04 | 64.39 | 115.24 | 56.36 | 53.61 | 44.63 | 24.61 | 30.58 | 26.67 | 58.12 | 33.77 | 26.70 | 32.20 | 27.98 | 35.17 | 20.73 | 22.99 | 22.36 | 23.84 | 12.75 | 14.44 | 23.19 | 23.18 | |
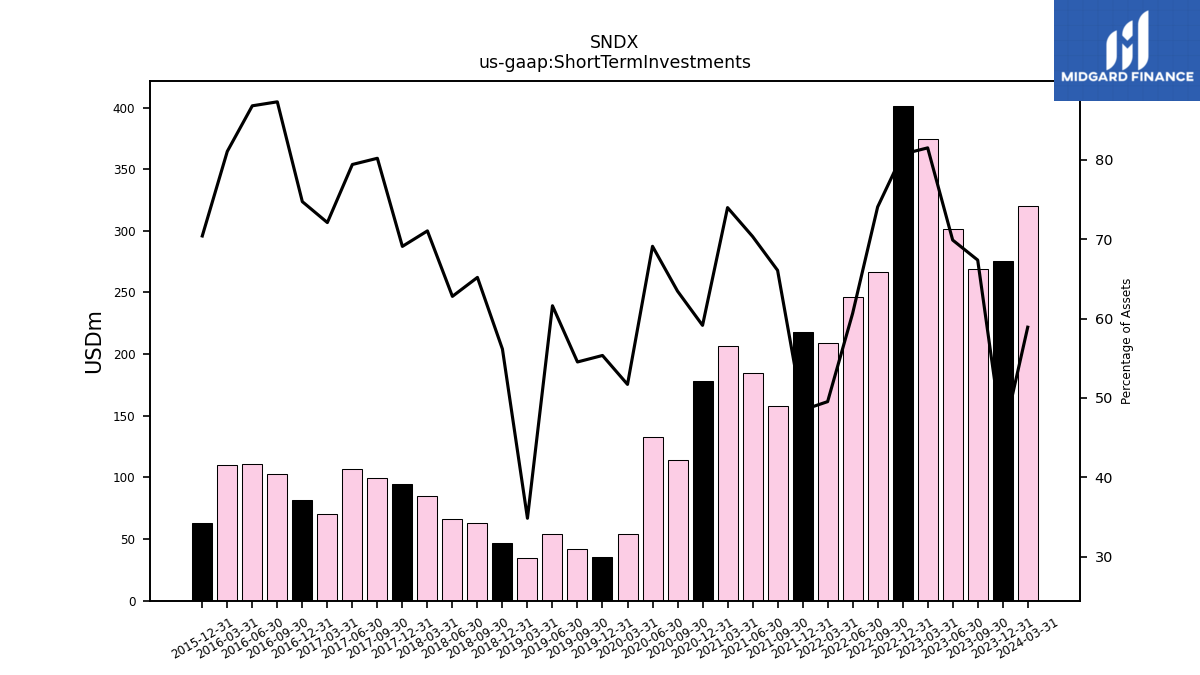
| Short Term Investments | 319.96 | 275.30 | 269.01 | 301.53 | 374.88 | 401.45 | 266.46 | 246.55 | 209.16 | 217.97 | 158.28 | 185.09 | 206.95 | 177.82 | 113.80 | 133.14 | 54.38 | 35.17 | 41.66 | 53.85 | 34.63 | 47.14 | 62.89 | 66.18 | 85.24 | 94.81 | 99.86 | 106.97 | 70.43 | 81.49 | 102.81 | 111.02 | 110.48 | 63.31 | |
| Other Assets Current | 6.07 | NA | NA | NA | NA | NA | NA | NA | NA | NA | NA | NA | NA | NA | NA | NA | NA | NA | NA | NA | NA | NA | NA | NA | NA | NA | NA | NA | NA | NA | NA | NA | NA | NA | |
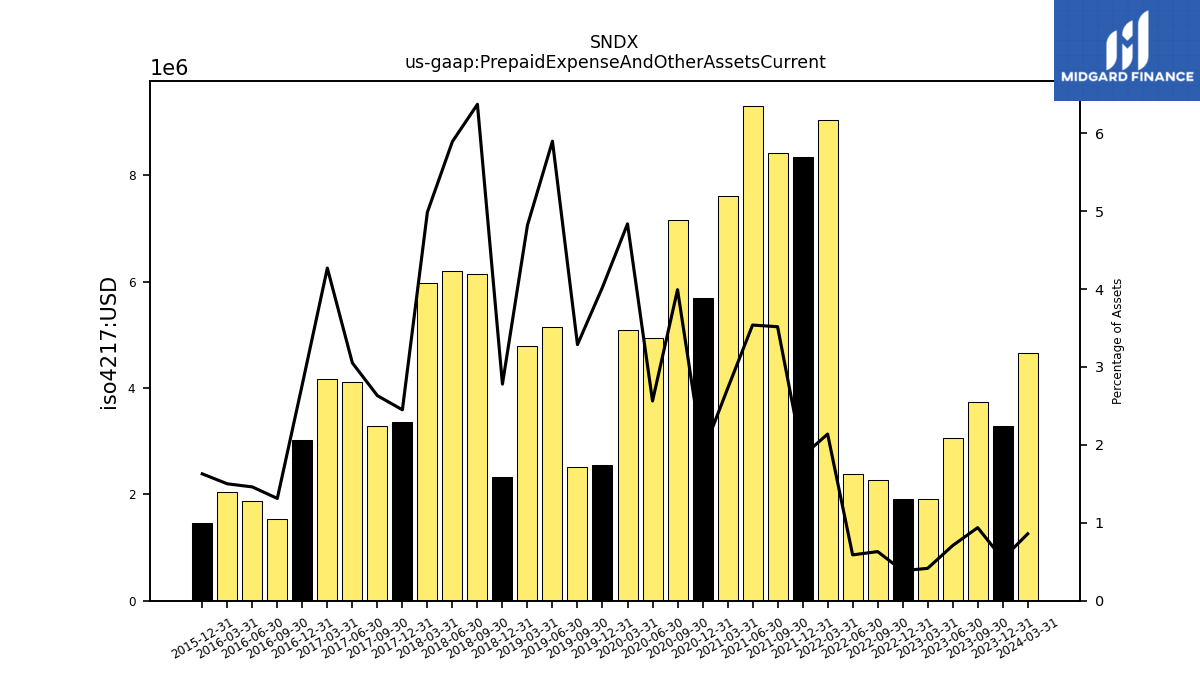
| Prepaid Expense And Other Assets Current | 4.67 | 3.29 | 3.75 | 3.06 | 1.91 | 1.92 | 2.27 | 2.39 | 9.03 | 8.35 | 8.42 | 9.31 | 7.61 | 5.68 | 7.16 | 4.94 | 5.09 | 2.56 | 2.51 | 5.15 | 4.79 | 2.33 | 6.15 | 6.21 | 5.98 | 3.36 | 3.28 | 4.11 | 4.17 | 3.03 | 1.55 | 1.87 | 2.04 | 1.46 | |
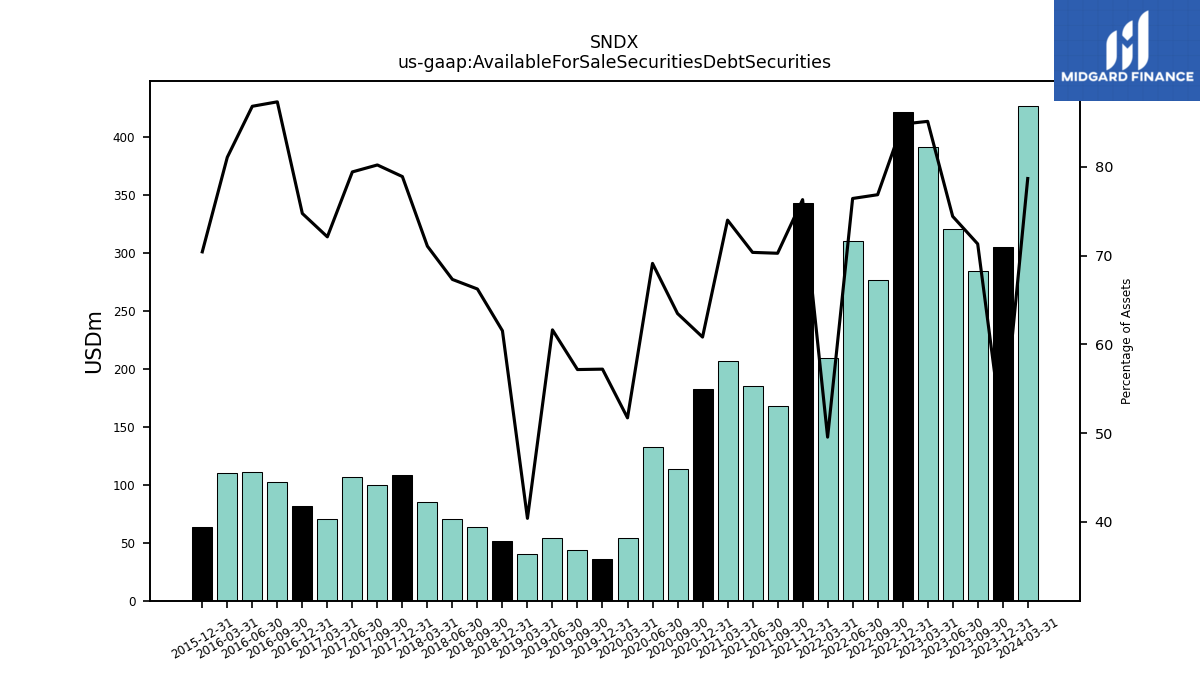
| Available For Sale Securities Debt Securities | 427.29 | 305.13 | 284.71 | 321.01 | 391.44 | 421.77 | 276.46 | 310.67 | 209.16 | 343.12 | 168.28 | 185.09 | 206.95 | 182.82 | 113.80 | 133.14 | 54.38 | 36.34 | 43.66 | 53.85 | 40.14 | 51.64 | 63.89 | 70.93 | 85.24 | 108.25 | 99.86 | 106.97 | 70.43 | 81.49 | 102.81 | 111.02 | 110.48 | 63.31 |
| 2024-03-31 | 2023-12-31 | 2023-09-30 | 2023-06-30 | 2023-03-31 | 2022-12-31 | 2022-09-30 | 2022-06-30 | 2022-03-31 | 2021-12-31 | 2021-09-30 | 2021-06-30 | 2021-03-31 | 2020-12-31 | 2020-09-30 | 2020-06-30 | 2020-03-31 | 2019-12-31 | 2019-09-30 | 2019-06-30 | 2019-03-31 | 2018-12-31 | 2018-09-30 | 2018-06-30 | 2018-03-31 | 2017-12-31 | 2017-09-30 | 2017-06-30 | 2017-03-31 | 2016-12-31 | 2016-09-30 | 2016-06-30 | 2016-03-31 | 2015-12-31 | ||
|---|---|---|---|---|---|---|---|---|---|---|---|---|---|---|---|---|---|---|---|---|---|---|---|---|---|---|---|---|---|---|---|---|---|---|---|
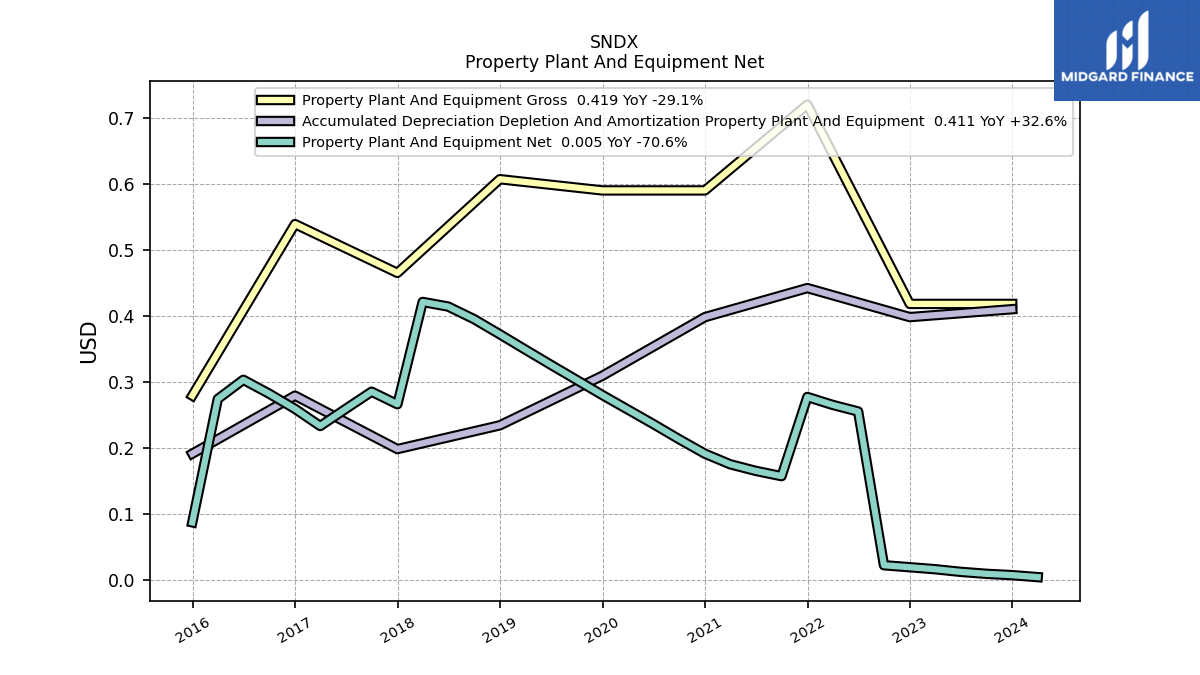
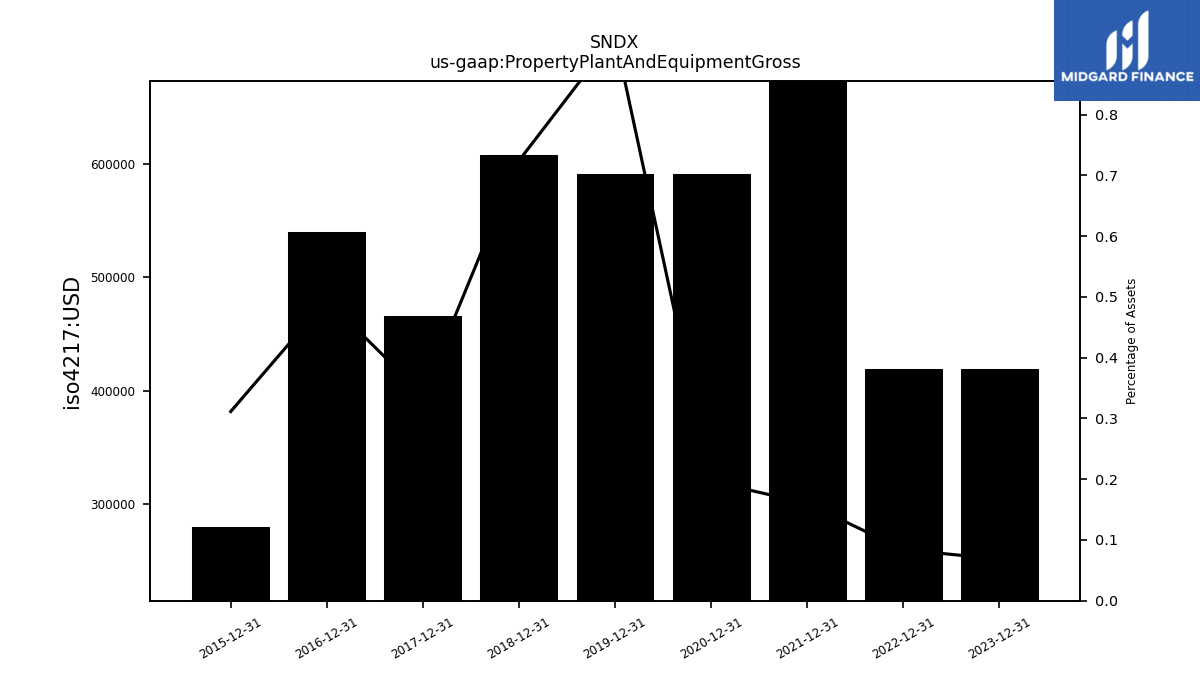
| Property Plant And Equipment Gross | NA | 0.42 | NA | NA | NA | 0.42 | NA | NA | NA | 0.72 | NA | NA | NA | 0.59 | NA | NA | NA | 0.59 | NA | NA | NA | 0.61 | NA | NA | NA | 0.47 | NA | NA | NA | 0.54 | NA | NA | NA | 0.28 | |
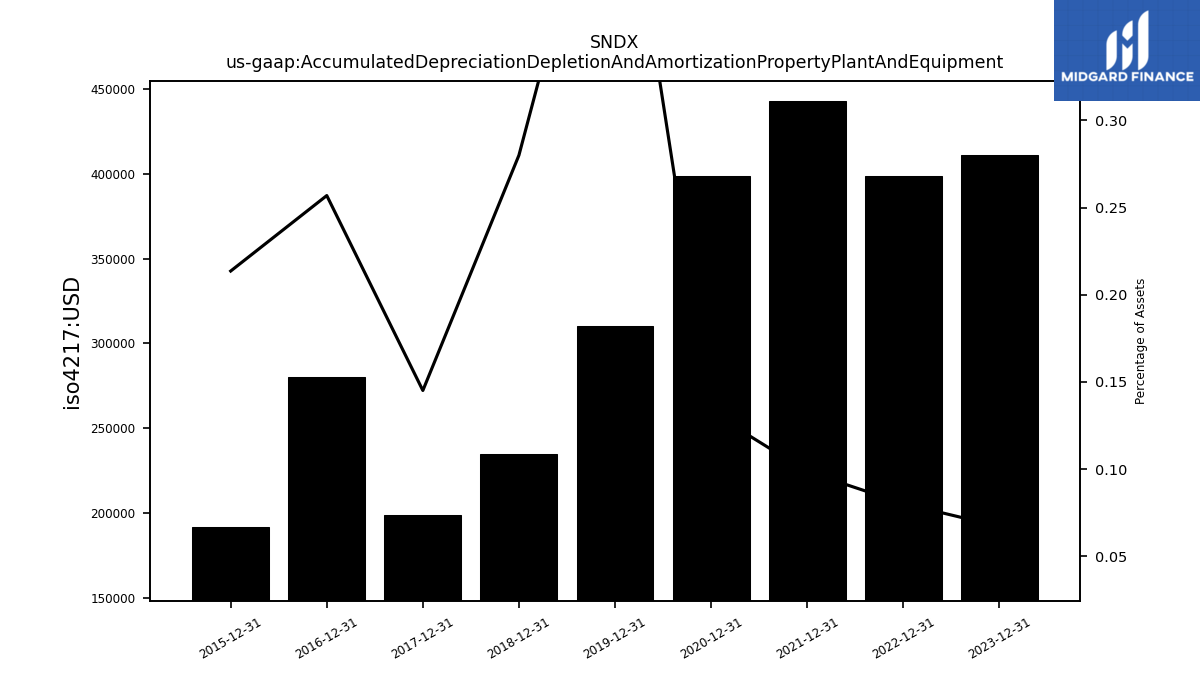
| Accumulated Depreciation Depletion And Amortization Property Plant And Equipment | NA | 0.41 | NA | NA | NA | 0.40 | NA | NA | NA | 0.44 | NA | NA | NA | 0.40 | NA | NA | NA | 0.31 | NA | NA | NA | 0.23 | NA | NA | NA | 0.20 | NA | NA | NA | 0.28 | NA | NA | NA | 0.19 | |
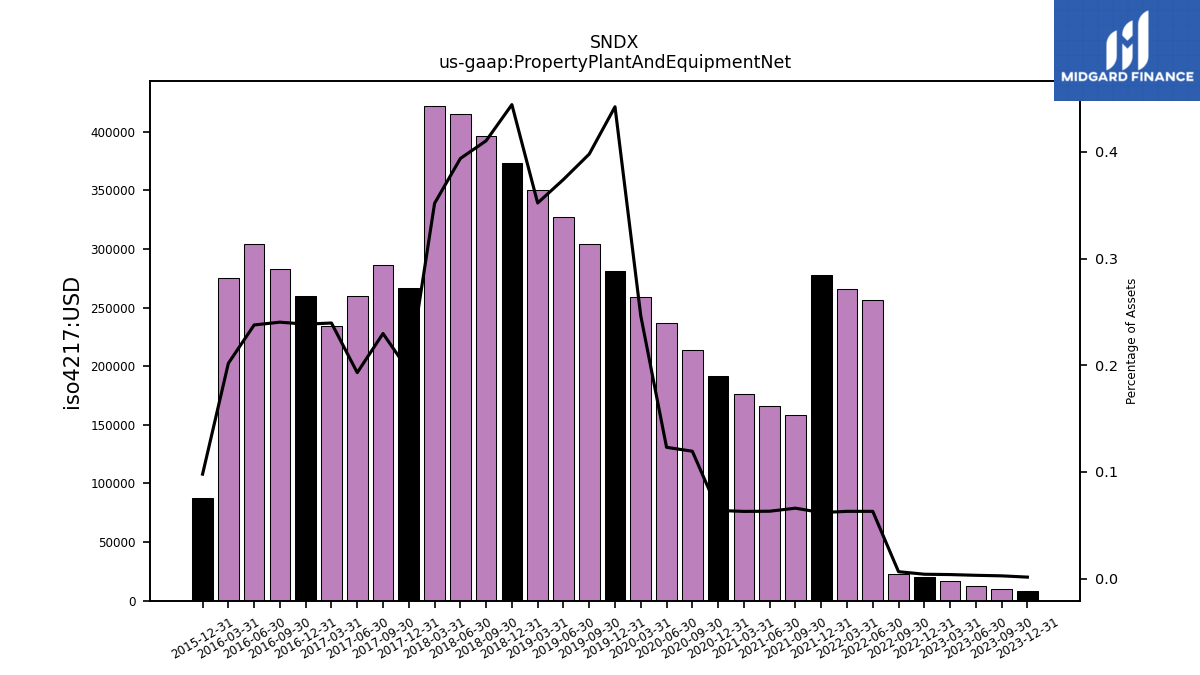
| Property Plant And Equipment Net | 0.01 | 0.01 | 0.01 | 0.01 | 0.02 | 0.02 | 0.02 | 0.26 | 0.27 | 0.28 | 0.16 | 0.17 | 0.18 | 0.19 | 0.21 | 0.24 | 0.26 | 0.28 | 0.30 | 0.33 | 0.35 | 0.37 | 0.40 | 0.41 | 0.42 | 0.27 | 0.29 | 0.26 | 0.23 | 0.26 | 0.28 | 0.30 | 0.28 | 0.09 | |
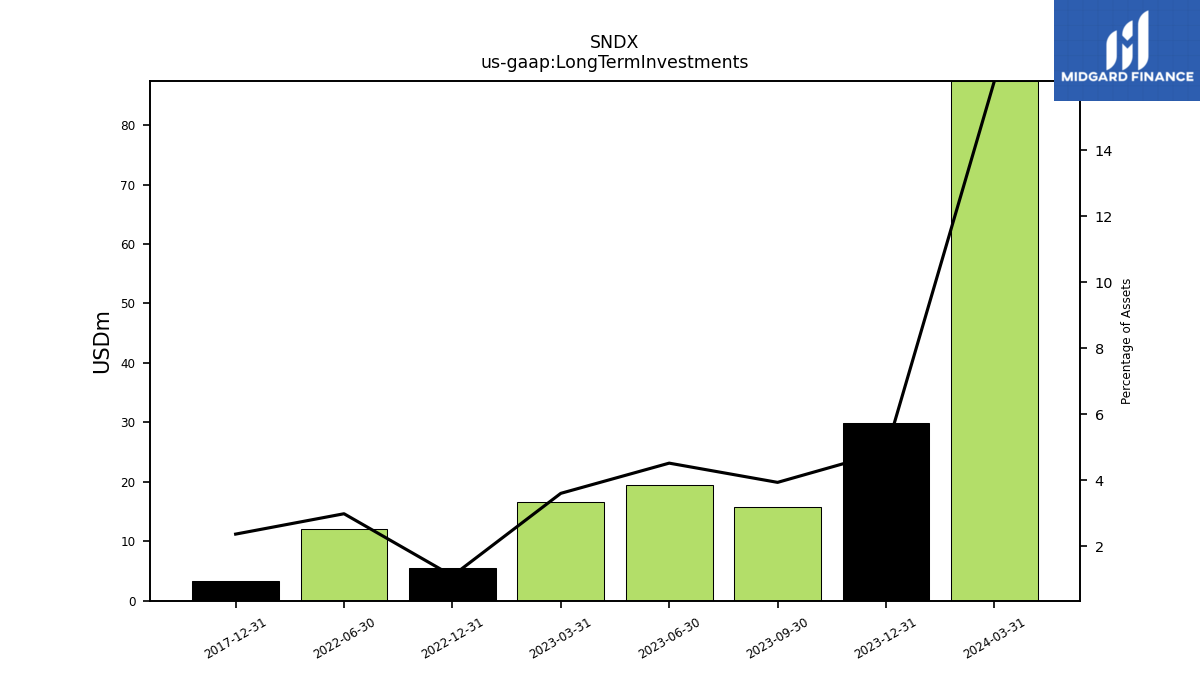
| Long Term Investments | 87.42 | 29.83 | 15.71 | 19.48 | 16.56 | 5.47 | NA | 12.12 | NA | NA | NA | NA | NA | NA | NA | NA | NA | NA | NA | NA | NA | NA | NA | NA | NA | 3.25 | NA | NA | NA | NA | NA | NA | NA | NA | |
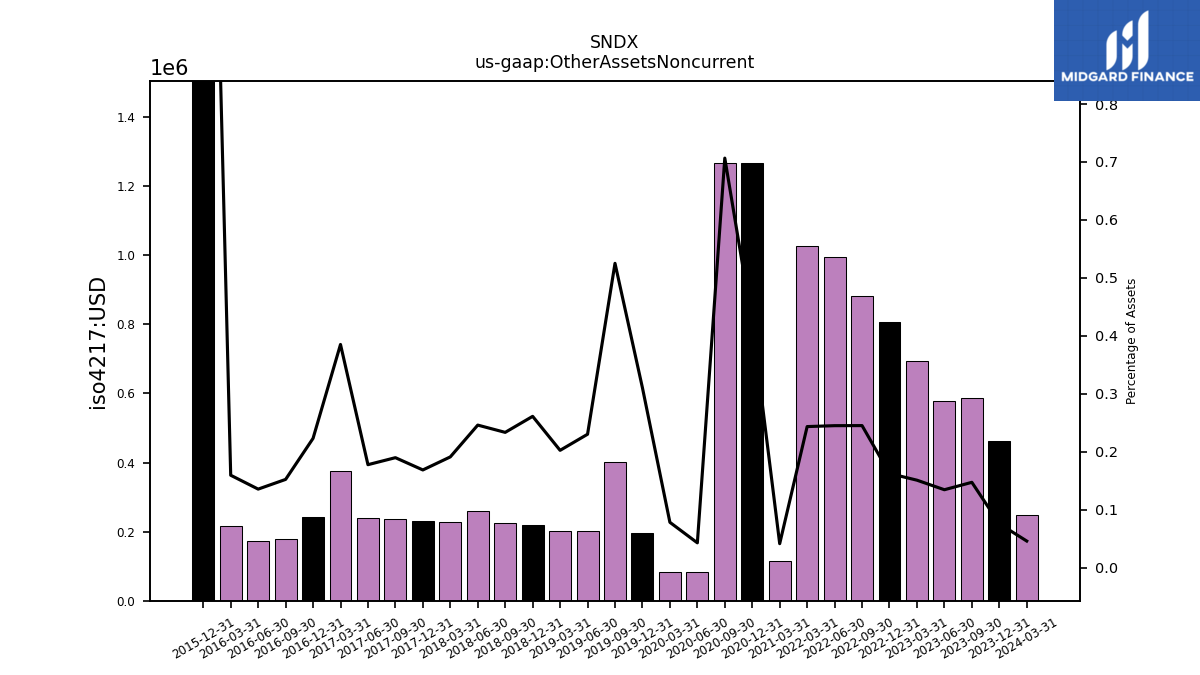
| Other Assets Noncurrent | 0.25 | 0.46 | 0.59 | 0.58 | 0.69 | 0.81 | 0.88 | 0.99 | 1.03 | NA | NA | NA | 0.12 | 1.27 | 1.27 | 0.08 | 0.08 | 0.20 | 0.40 | 0.20 | 0.20 | 0.22 | 0.23 | 0.26 | 0.23 | 0.23 | 0.24 | 0.24 | 0.38 | 0.24 | 0.18 | 0.17 | 0.22 | 1.81 | |
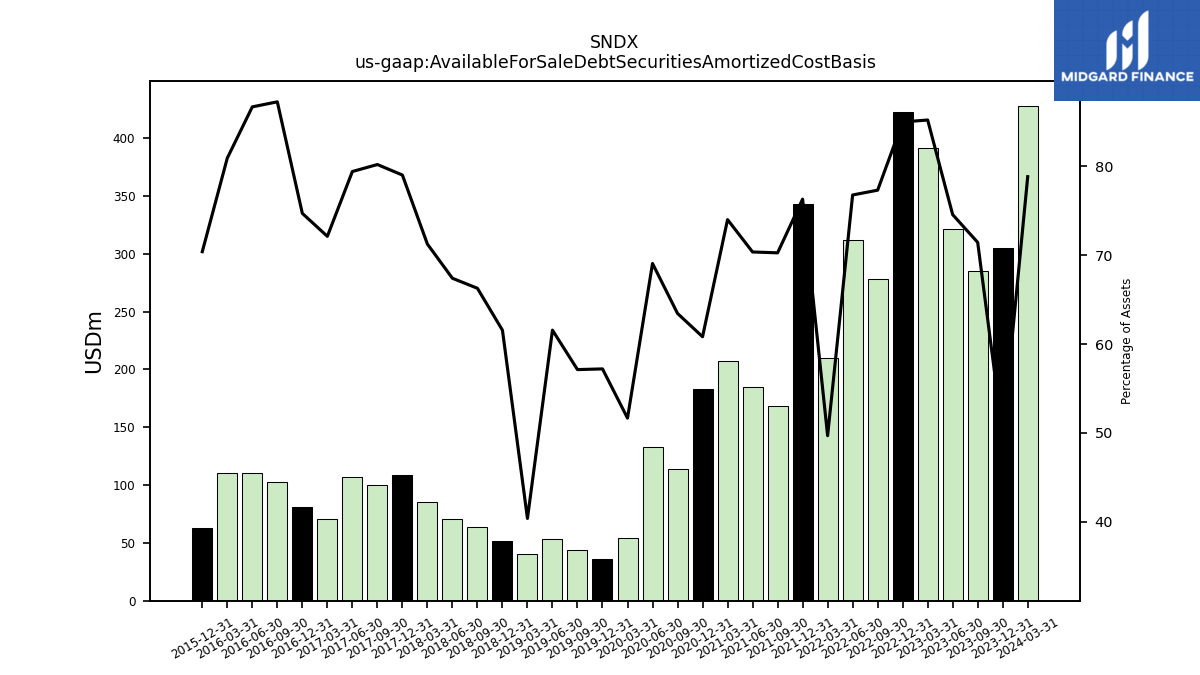
| Available For Sale Debt Securities Amortized Cost Basis | 428.04 | 304.92 | 285.17 | 321.58 | 391.77 | 422.58 | 278.06 | 312.00 | 209.80 | 343.07 | 168.27 | 185.07 | 206.94 | 182.82 | 113.75 | 133.02 | 54.33 | 36.34 | 43.63 | 53.80 | 40.13 | 51.67 | 63.93 | 71.02 | 85.46 | 108.39 | 99.83 | 106.93 | 70.43 | 81.43 | 102.71 | 110.82 | 110.25 | 63.28 |
| 2024-03-31 | 2023-12-31 | 2023-09-30 | 2023-06-30 | 2023-03-31 | 2022-12-31 | 2022-09-30 | 2022-06-30 | 2022-03-31 | 2021-12-31 | 2021-09-30 | 2021-06-30 | 2021-03-31 | 2020-12-31 | 2020-09-30 | 2020-06-30 | 2020-03-31 | 2019-12-31 | 2019-09-30 | 2019-06-30 | 2019-03-31 | 2018-12-31 | 2018-09-30 | 2018-06-30 | 2018-03-31 | 2017-12-31 | 2017-09-30 | 2017-06-30 | 2017-03-31 | 2016-12-31 | 2016-09-30 | 2016-06-30 | 2016-03-31 | 2015-12-31 | ||
|---|---|---|---|---|---|---|---|---|---|---|---|---|---|---|---|---|---|---|---|---|---|---|---|---|---|---|---|---|---|---|---|---|---|---|---|
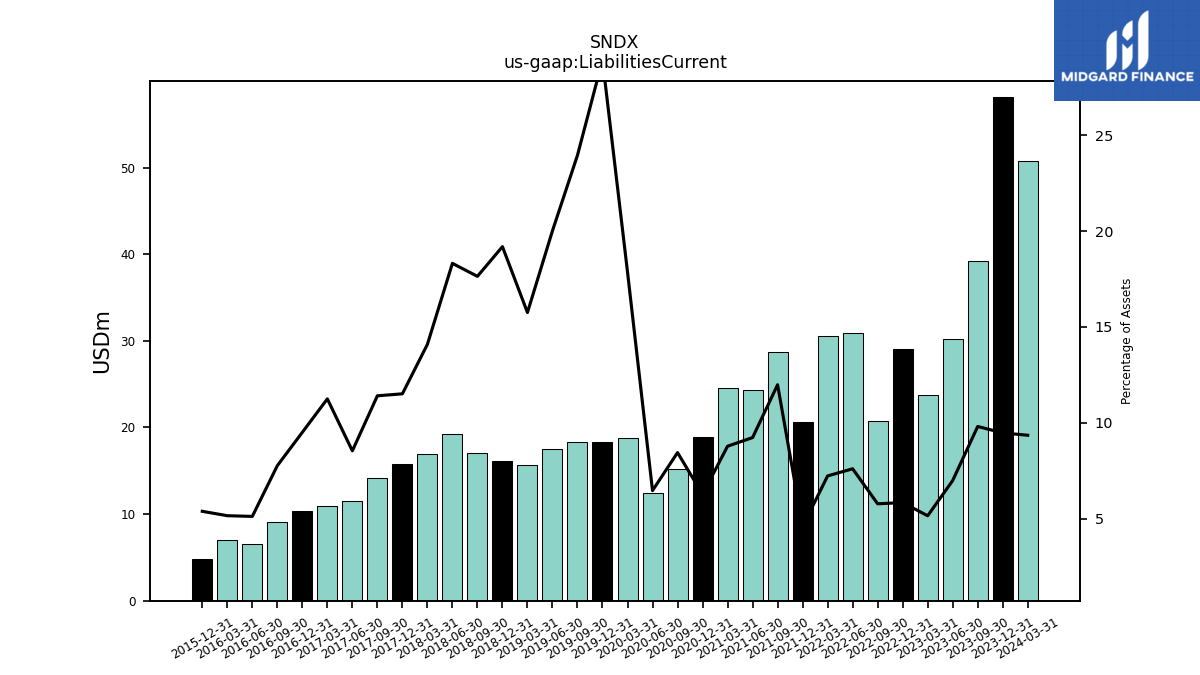
| Liabilities Current | 50.80 | 58.10 | 39.17 | 30.17 | 23.72 | 29.07 | 20.80 | 30.93 | 30.55 | 20.68 | 28.71 | 24.29 | 24.57 | 18.87 | 15.16 | 12.47 | 18.79 | 18.37 | 18.29 | 17.49 | 15.66 | 16.11 | 17.02 | 19.30 | 16.91 | 15.80 | 14.21 | 11.51 | 10.99 | 10.37 | 9.15 | 6.55 | 7.04 | 4.85 | |
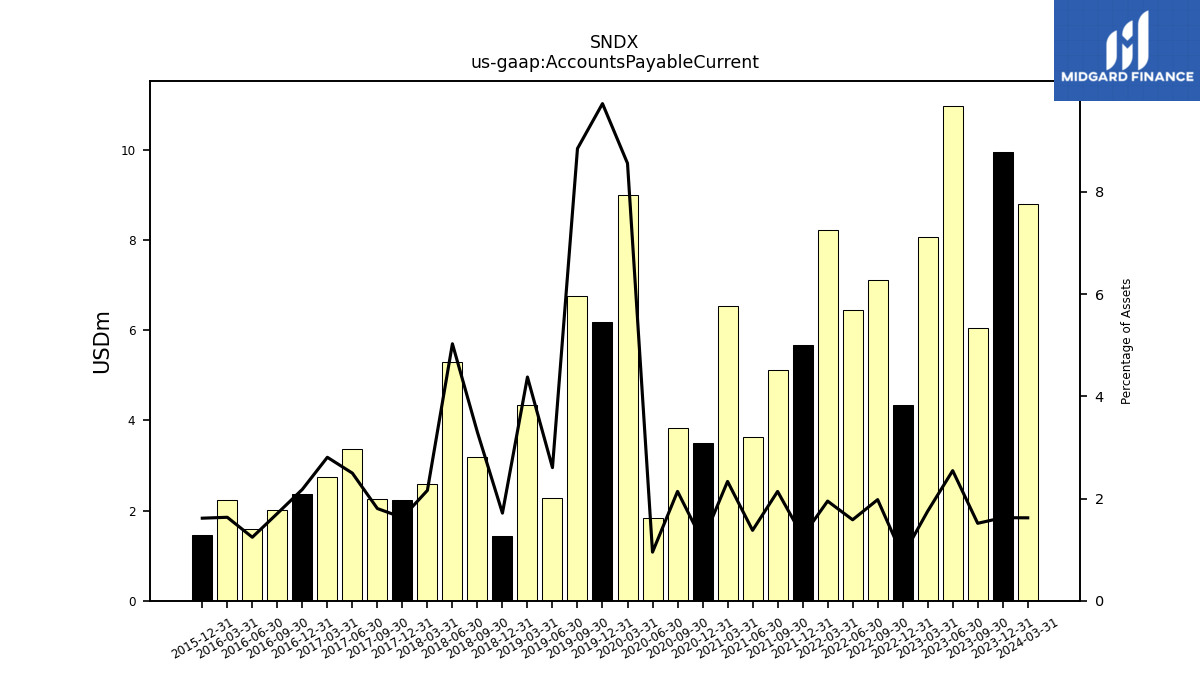
| Accounts Payable Current | 8.81 | 9.96 | 6.05 | 10.98 | 8.06 | 4.35 | 7.12 | 6.44 | 8.23 | 5.67 | 5.12 | 3.62 | 6.53 | 3.51 | 3.84 | 1.83 | 9.00 | 6.18 | 6.76 | 2.28 | 4.35 | 1.44 | 3.18 | 5.30 | 2.59 | 2.23 | 2.25 | 3.36 | 2.74 | 2.38 | 2.01 | 1.59 | 2.23 | 1.45 | |
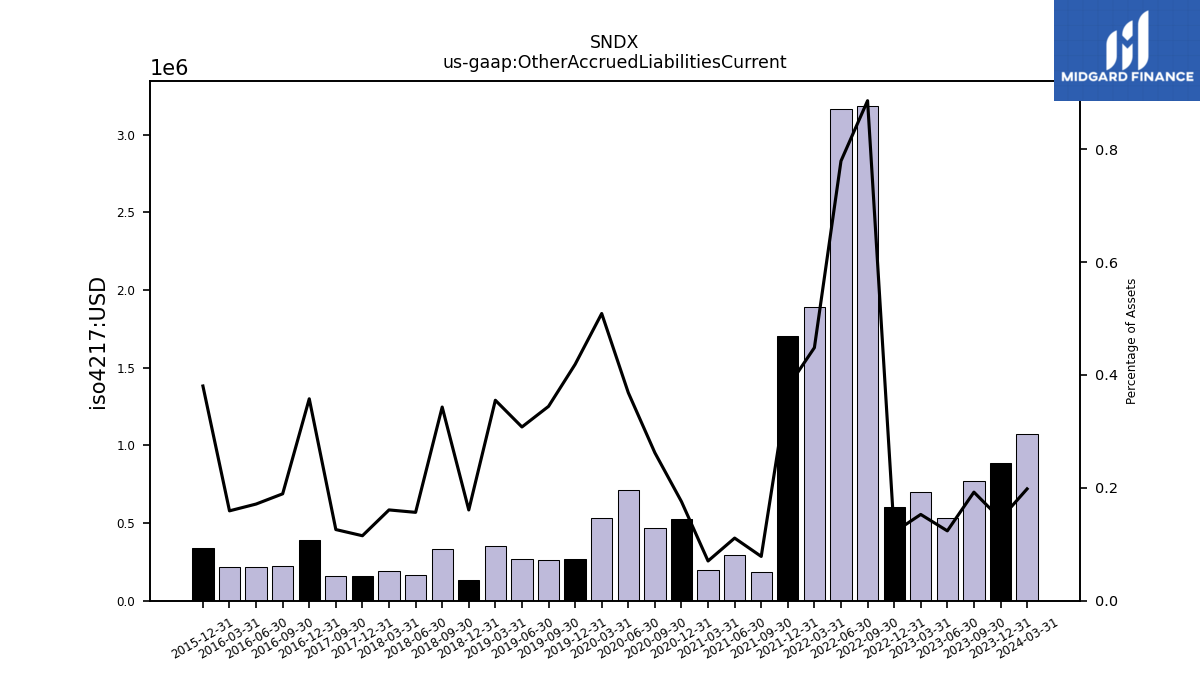
| Other Accrued Liabilities Current | 1.08 | 0.89 | 0.77 | 0.53 | 0.70 | 0.60 | 3.19 | 3.17 | 1.89 | 1.70 | 0.19 | 0.29 | 0.20 | 0.53 | 0.47 | 0.71 | 0.54 | 0.27 | 0.26 | 0.27 | 0.35 | 0.14 | 0.33 | 0.17 | 0.19 | 0.16 | 0.16 | NA | NA | 0.39 | 0.22 | 0.22 | 0.22 | 0.34 |
| 2024-03-31 | 2023-12-31 | 2023-09-30 | 2023-06-30 | 2023-03-31 | 2022-12-31 | 2022-09-30 | 2022-06-30 | 2022-03-31 | 2021-12-31 | 2021-09-30 | 2021-06-30 | 2021-03-31 | 2020-12-31 | 2020-09-30 | 2020-06-30 | 2020-03-31 | 2019-12-31 | 2019-09-30 | 2019-06-30 | 2019-03-31 | 2018-12-31 | 2018-09-30 | 2018-06-30 | 2018-03-31 | 2017-12-31 | 2017-09-30 | 2017-06-30 | 2017-03-31 | 2016-12-31 | 2016-09-30 | 2016-06-30 | 2016-03-31 | 2015-12-31 | ||
|---|---|---|---|---|---|---|---|---|---|---|---|---|---|---|---|---|---|---|---|---|---|---|---|---|---|---|---|---|---|---|---|---|---|---|---|
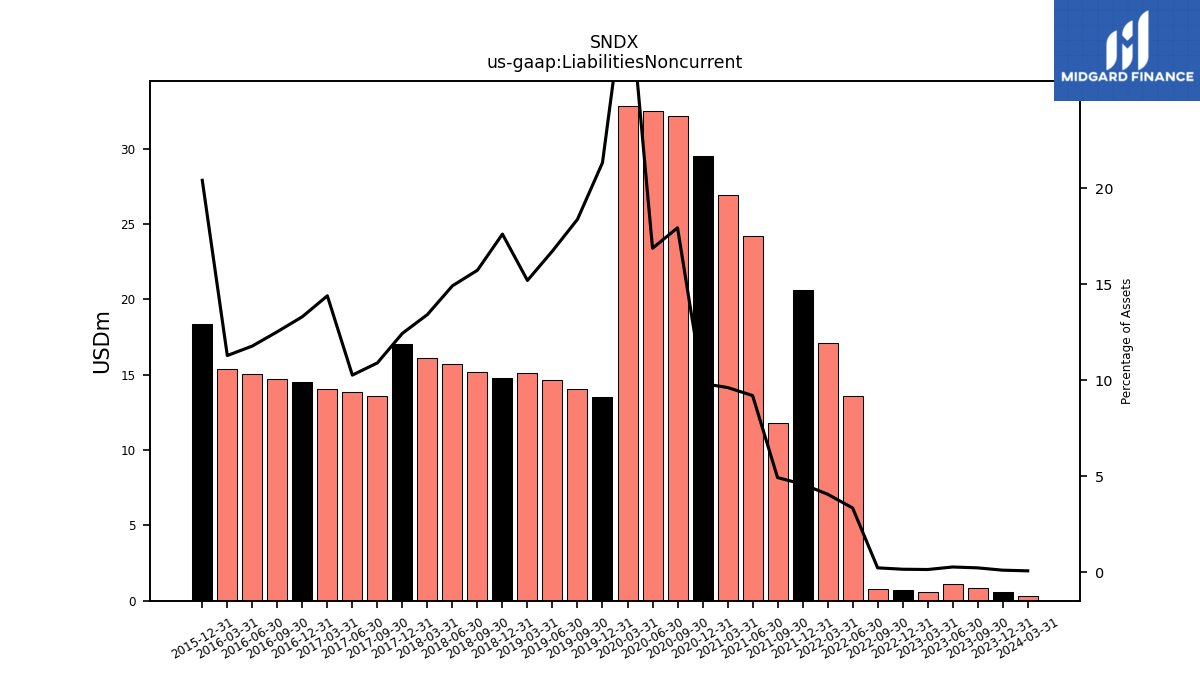
| Liabilities Noncurrent | 0.33 | 0.59 | 0.86 | 1.13 | 0.60 | 0.72 | 0.78 | 13.57 | 17.12 | 20.61 | 11.79 | 24.20 | 26.90 | 29.55 | 32.17 | 32.51 | 32.86 | 13.56 | 14.04 | 14.62 | 15.11 | 14.79 | 15.18 | 15.72 | 16.10 | 17.07 | 13.57 | 13.82 | 14.06 | 14.51 | 14.75 | 15.06 | 15.38 | 18.36 | |
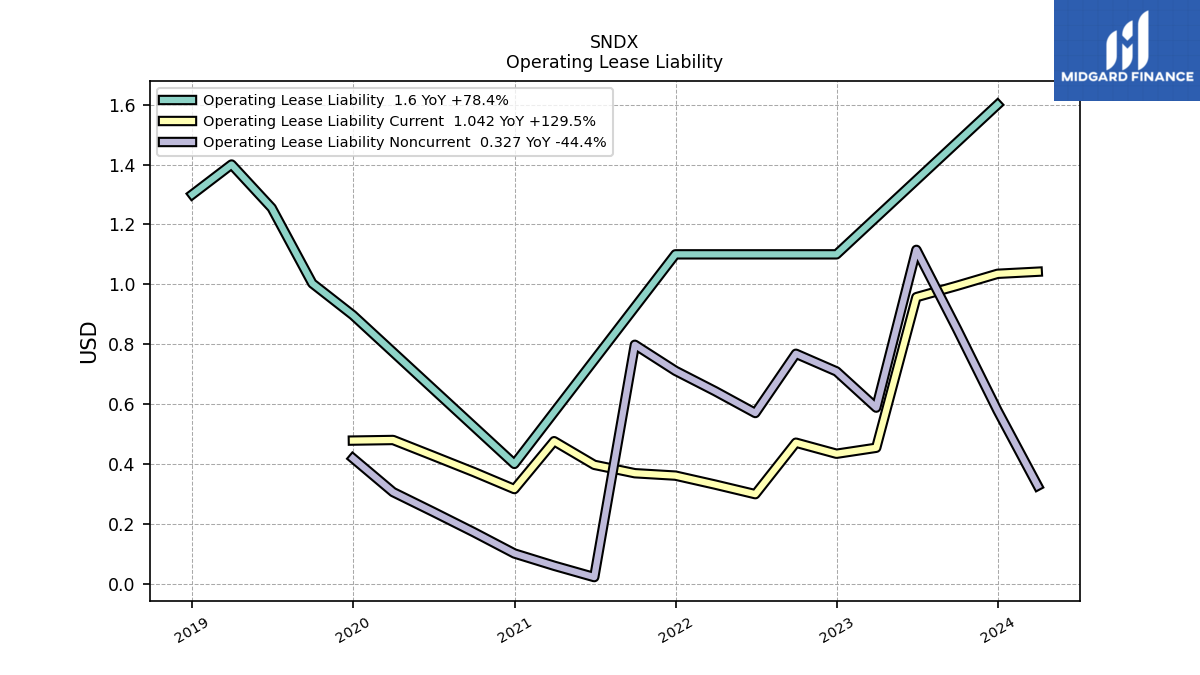
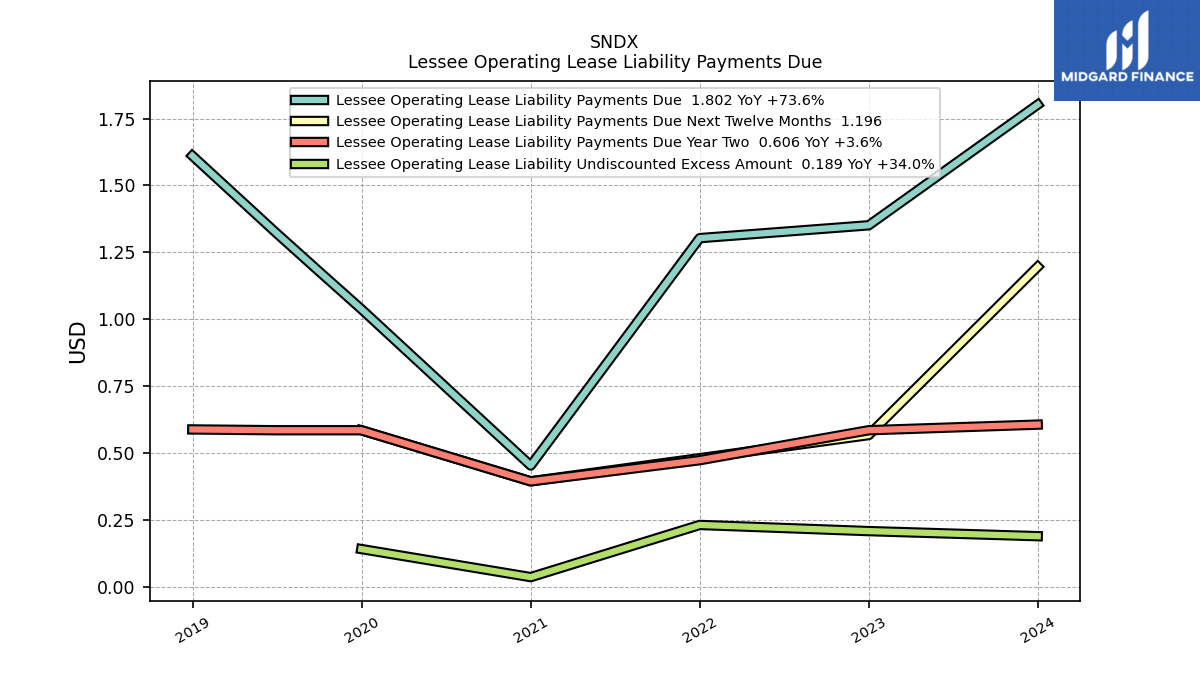
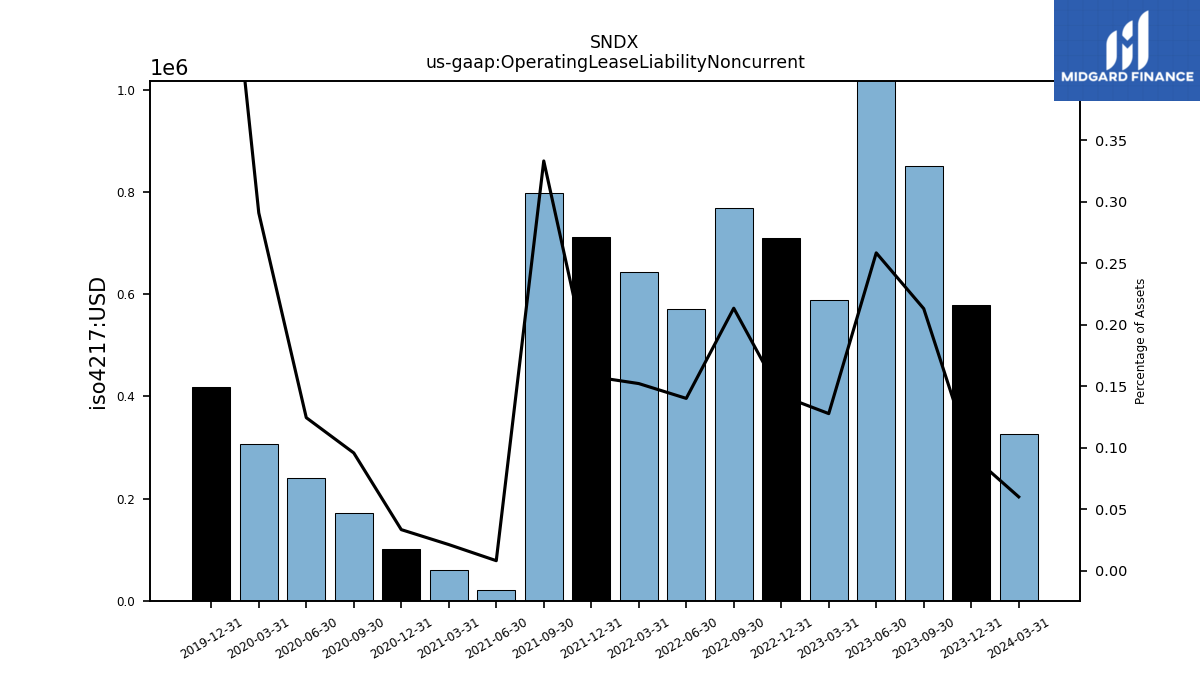
| Operating Lease Liability Noncurrent | 0.33 | 0.58 | 0.85 | 1.11 | 0.59 | 0.71 | 0.77 | 0.57 | 0.64 | 0.71 | 0.80 | 0.02 | 0.06 | 0.10 | 0.17 | 0.24 | 0.31 | 0.42 | NA | NA | NA | NA | NA | NA | NA | NA | NA | NA | NA | NA | NA | NA | NA | NA |
| 2024-03-31 | 2023-12-31 | 2023-09-30 | 2023-06-30 | 2023-03-31 | 2022-12-31 | 2022-09-30 | 2022-06-30 | 2022-03-31 | 2021-12-31 | 2021-09-30 | 2021-06-30 | 2021-03-31 | 2020-12-31 | 2020-09-30 | 2020-06-30 | 2020-03-31 | 2019-12-31 | 2019-09-30 | 2019-06-30 | 2019-03-31 | 2018-12-31 | 2018-09-30 | 2018-06-30 | 2018-03-31 | 2017-12-31 | 2017-09-30 | 2017-06-30 | 2017-03-31 | 2016-12-31 | 2016-09-30 | 2016-06-30 | 2016-03-31 | 2015-12-31 | ||
|---|---|---|---|---|---|---|---|---|---|---|---|---|---|---|---|---|---|---|---|---|---|---|---|---|---|---|---|---|---|---|---|---|---|---|---|
| Stockholders Equity | 491.89 | 554.20 | 359.19 | 400.04 | 435.50 | 467.45 | 338.10 | 361.94 | 374.55 | 408.37 | 199.00 | 214.56 | 228.21 | 252.19 | 131.98 | 147.65 | 53.51 | 31.60 | 44.04 | 55.27 | 68.63 | 53.05 | 64.27 | 70.35 | 86.95 | 104.32 | 96.71 | 109.34 | 72.61 | 84.14 | 93.83 | 106.24 | 113.85 | -252.41 | |
| Common Stock Value | 0.01 | 0.01 | 0.01 | 0.01 | 0.01 | 0.01 | 0.01 | 0.01 | 0.01 | 0.01 | 0.01 | 0.01 | 0.01 | 0.01 | 0.00 | 0.00 | 0.00 | 0.00 | 0.00 | 0.00 | 0.00 | 0.00 | 0.00 | 0.00 | 0.00 | 0.00 | 0.00 | 0.00 | 0.00 | 0.00 | 0.00 | 0.00 | 0.00 | 0.00 | |
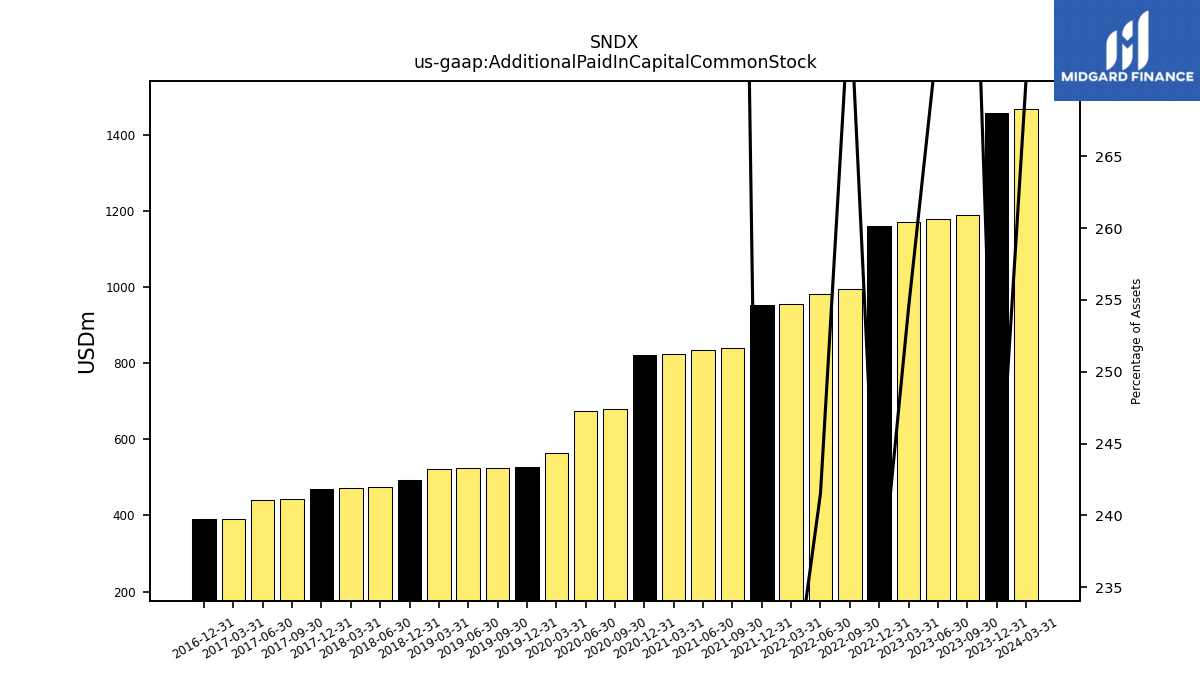
| Additional Paid In Capital Common Stock | 1467.44 | 1456.37 | 1189.56 | 1179.39 | 1170.00 | 1161.29 | 993.55 | 981.71 | 956.05 | 952.02 | 838.89 | 833.80 | 824.54 | 820.82 | 680.12 | 675.29 | 564.16 | 527.07 | 525.49 | 523.86 | 522.34 | 492.49 | NA | 473.69 | 472.03 | 470.57 | 443.69 | 441.22 | 390.89 | 389.37 | NA | NA | NA | NA | |
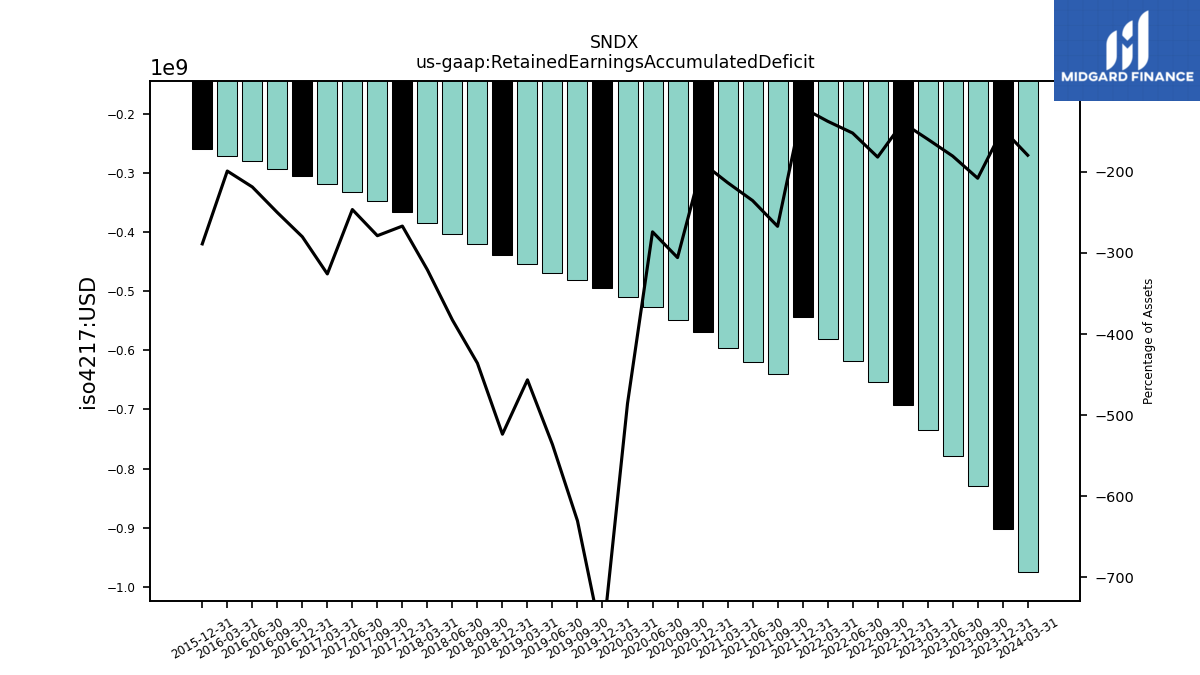
| Retained Earnings Accumulated Deficit | -974.80 | -902.40 | -829.93 | -778.78 | -734.17 | -693.04 | -653.85 | -618.44 | -580.87 | -543.70 | -639.90 | -619.26 | -596.35 | -568.63 | -548.21 | -527.77 | -510.71 | -495.47 | -481.47 | -468.64 | -453.73 | -439.42 | -420.59 | -403.25 | -384.86 | -366.11 | -347.01 | -331.92 | -318.28 | -305.29 | -294.48 | -279.51 | -271.15 | -259.68 | |
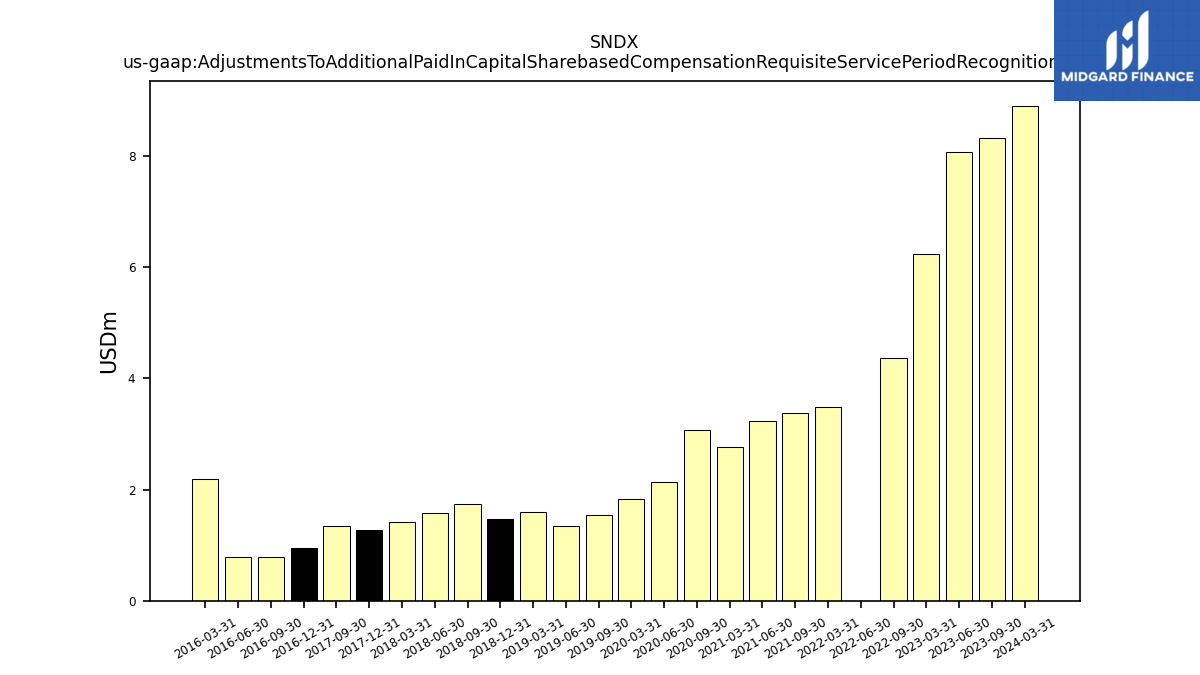
| Adjustments To Additional Paid In Capital Sharebased Compensation Requisite Service Period Recognition Value | 8.90 | NA | 8.32 | 8.06 | 6.24 | NA | 4.36 | 0.00 | 3.48 | NA | 3.38 | 3.24 | 2.77 | NA | 3.06 | 2.13 | 1.83 | NA | 1.55 | 1.34 | 1.59 | 1.47 | 1.74 | 1.57 | 1.42 | 1.28 | 1.34 | NA | NA | 0.95 | 0.79 | 0.78 | 2.19 | NA |
| 2024-03-31 | 2023-12-31 | 2023-09-30 | 2023-06-30 | 2023-03-31 | 2022-12-31 | 2022-09-30 | 2022-06-30 | 2022-03-31 | 2021-12-31 | 2021-09-30 | 2021-06-30 | 2021-03-31 | 2020-12-31 | 2020-09-30 | 2020-06-30 | 2020-03-31 | 2019-12-31 | 2019-09-30 | 2019-06-30 | 2019-03-31 | 2018-12-31 | 2018-09-30 | 2018-06-30 | 2018-03-31 | 2017-12-31 | 2017-09-30 | 2017-06-30 | 2017-03-31 | 2016-12-31 | 2016-09-30 | 2016-06-30 | 2016-03-31 | 2015-12-31 | ||
|---|---|---|---|---|---|---|---|---|---|---|---|---|---|---|---|---|---|---|---|---|---|---|---|---|---|---|---|---|---|---|---|---|---|---|---|
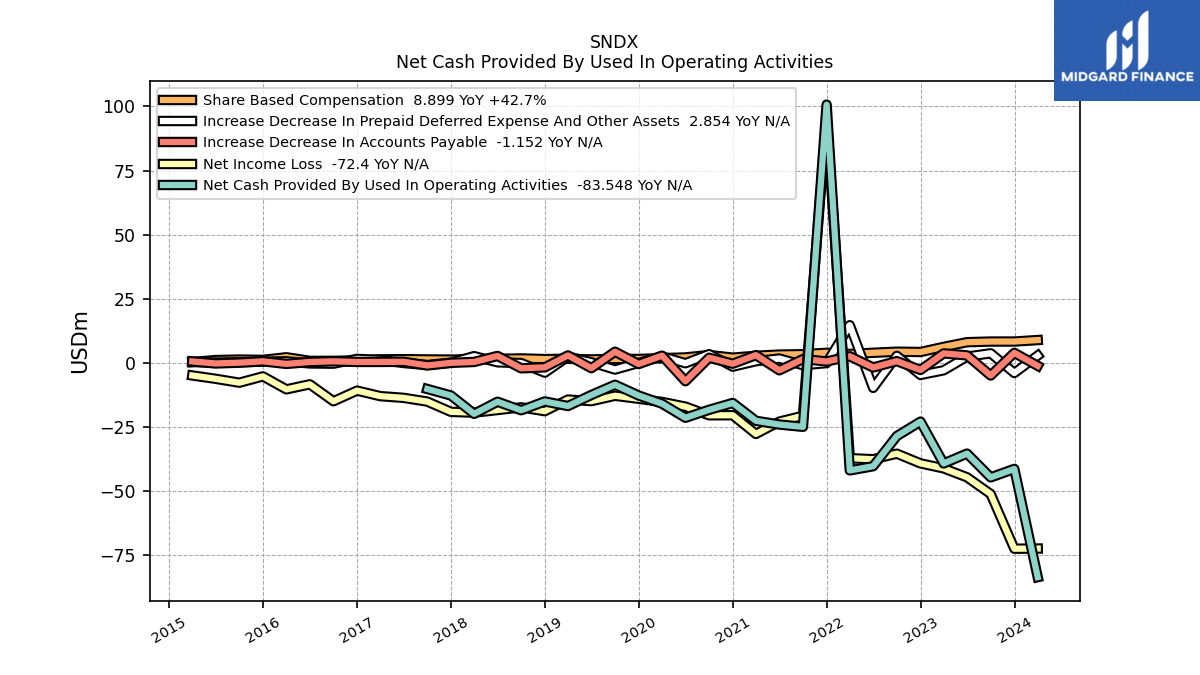
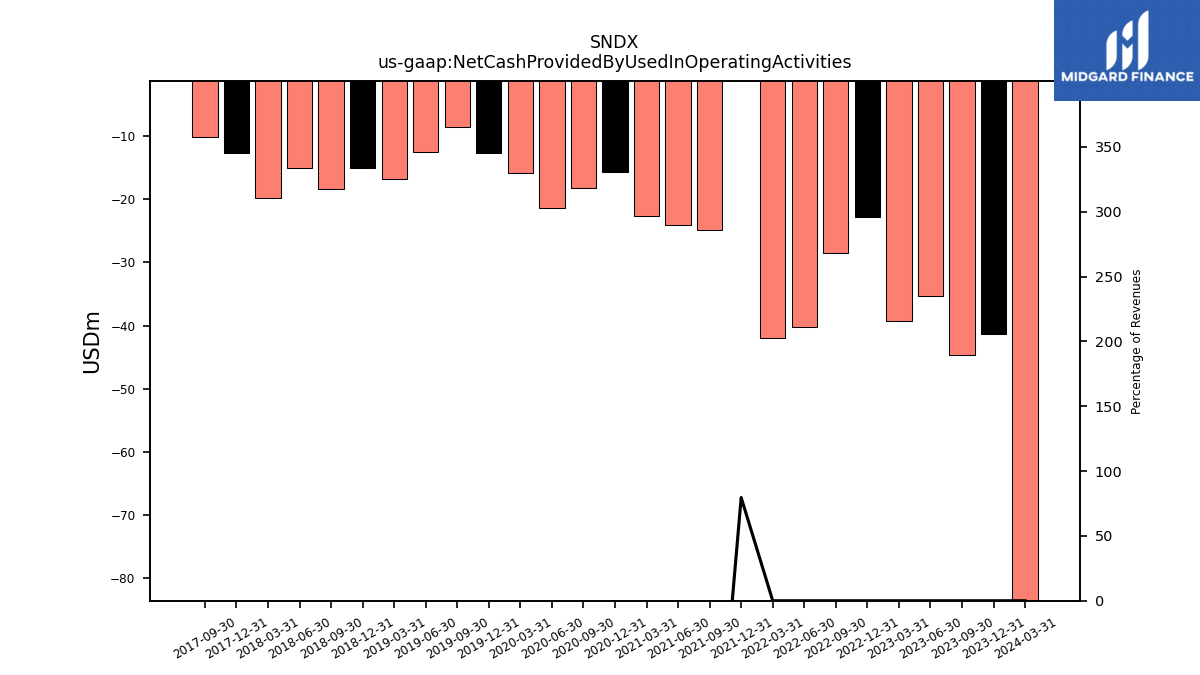
| Net Cash Provided By Used In Operating Activities | -83.55 | -41.35 | -44.65 | -35.37 | -39.23 | -22.89 | -28.54 | -40.31 | -41.93 | 100.71 | -24.94 | -24.05 | -22.59 | -15.63 | -18.30 | -21.41 | -15.93 | -12.73 | -8.53 | -12.53 | -16.83 | -15.04 | -18.47 | -15.15 | -19.87 | -12.72 | -10.18 | NA | NA | NA | NA | NA | NA | NA | |
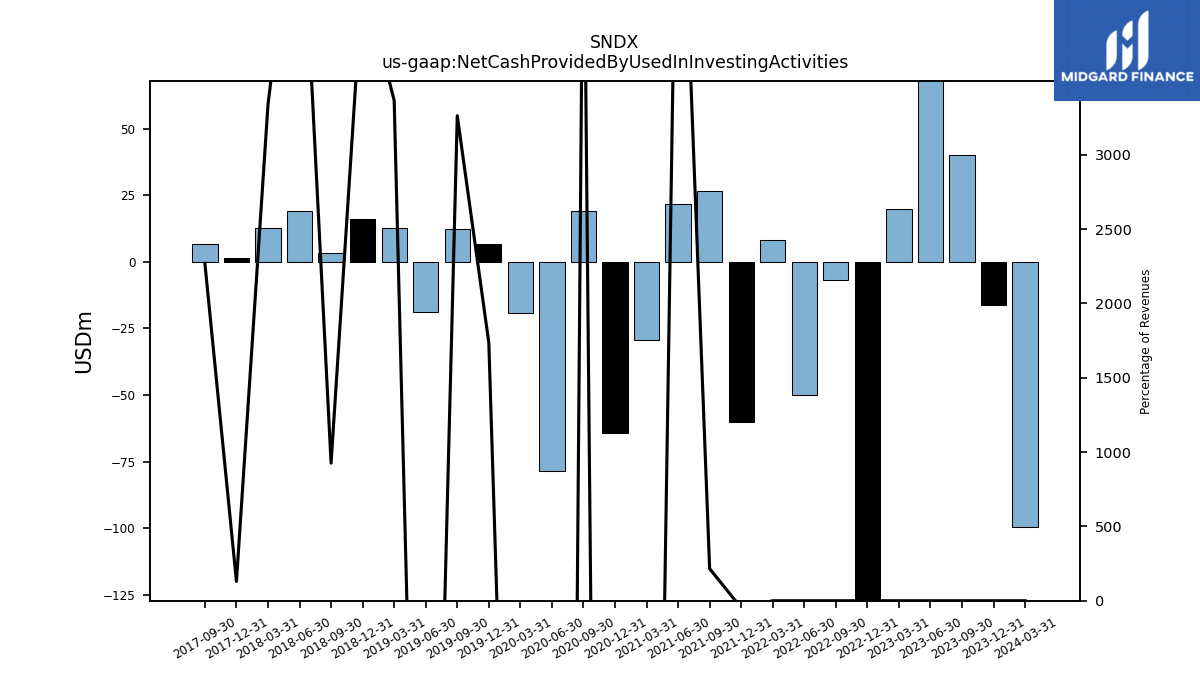
| Net Cash Provided By Used In Investing Activities | -99.40 | -16.29 | 40.08 | 73.91 | 19.91 | -137.63 | -6.79 | -49.95 | 8.18 | -59.96 | 26.63 | 21.68 | -29.23 | -64.14 | 19.27 | -78.61 | -19.05 | 6.60 | 12.36 | -18.93 | 12.75 | 15.96 | 3.51 | 19.28 | 12.64 | 1.55 | 6.92 | NA | NA | NA | NA | NA | NA | NA | |
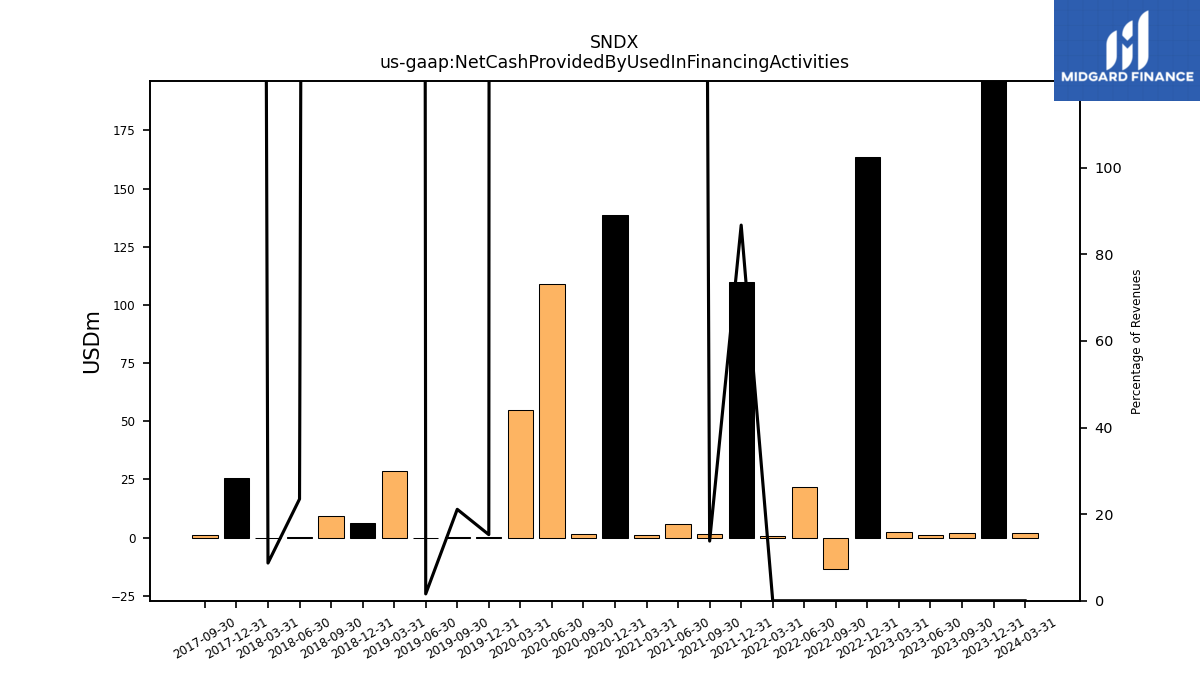
| Net Cash Provided By Used In Financing Activities | 2.17 | 258.48 | 1.85 | 1.32 | 2.47 | 163.50 | -13.53 | 21.72 | 0.56 | 109.78 | 1.71 | 6.02 | 0.96 | 138.66 | 1.77 | 109.00 | 55.00 | 0.06 | 0.08 | 0.01 | 28.43 | 6.14 | 9.46 | 0.09 | 0.03 | 25.61 | 1.00 | NA | NA | NA | NA | NA | NA | NA |
| 2024-03-31 | 2023-12-31 | 2023-09-30 | 2023-06-30 | 2023-03-31 | 2022-12-31 | 2022-09-30 | 2022-06-30 | 2022-03-31 | 2021-12-31 | 2021-09-30 | 2021-06-30 | 2021-03-31 | 2020-12-31 | 2020-09-30 | 2020-06-30 | 2020-03-31 | 2019-12-31 | 2019-09-30 | 2019-06-30 | 2019-03-31 | 2018-12-31 | 2018-09-30 | 2018-06-30 | 2018-03-31 | 2017-12-31 | 2017-09-30 | 2017-06-30 | 2017-03-31 | 2016-12-31 | 2016-09-30 | 2016-06-30 | 2016-03-31 | 2015-12-31 | ||
|---|---|---|---|---|---|---|---|---|---|---|---|---|---|---|---|---|---|---|---|---|---|---|---|---|---|---|---|---|---|---|---|---|---|---|---|
| Net Cash Provided By Used In Operating Activities | -83.55 | -41.35 | -44.65 | -35.37 | -39.23 | -22.89 | -28.54 | -40.31 | -41.93 | 100.71 | -24.94 | -24.05 | -22.59 | -15.63 | -18.30 | -21.41 | -15.93 | -12.73 | -8.53 | -12.53 | -16.83 | -15.04 | -18.47 | -15.15 | -19.87 | -12.72 | -10.18 | NA | NA | NA | NA | NA | NA | NA | |
| Net Income Loss | -72.40 | -72.47 | -51.15 | -44.62 | -41.13 | -39.19 | -35.40 | -37.57 | -37.17 | 96.20 | -20.64 | -22.91 | -27.72 | -20.42 | -20.44 | -17.06 | -15.24 | -14.00 | -12.83 | -14.92 | -14.30 | -18.84 | -17.34 | -18.39 | -19.40 | -19.10 | -15.09 | -13.64 | -12.97 | -10.81 | -14.97 | -8.36 | -10.33 | -5.26 | |
| Profit Loss | -72.40 | -72.47 | -51.15 | -44.62 | -41.13 | -39.19 | -35.40 | -37.57 | -37.17 | 96.20 | -20.64 | -22.91 | -27.72 | -20.42 | -20.44 | -17.06 | -15.24 | -14.00 | -12.83 | -14.92 | -14.30 | -18.84 | -17.34 | -18.39 | -19.40 | -19.10 | -15.09 | NA | NA | NA | NA | NA | NA | NA | |
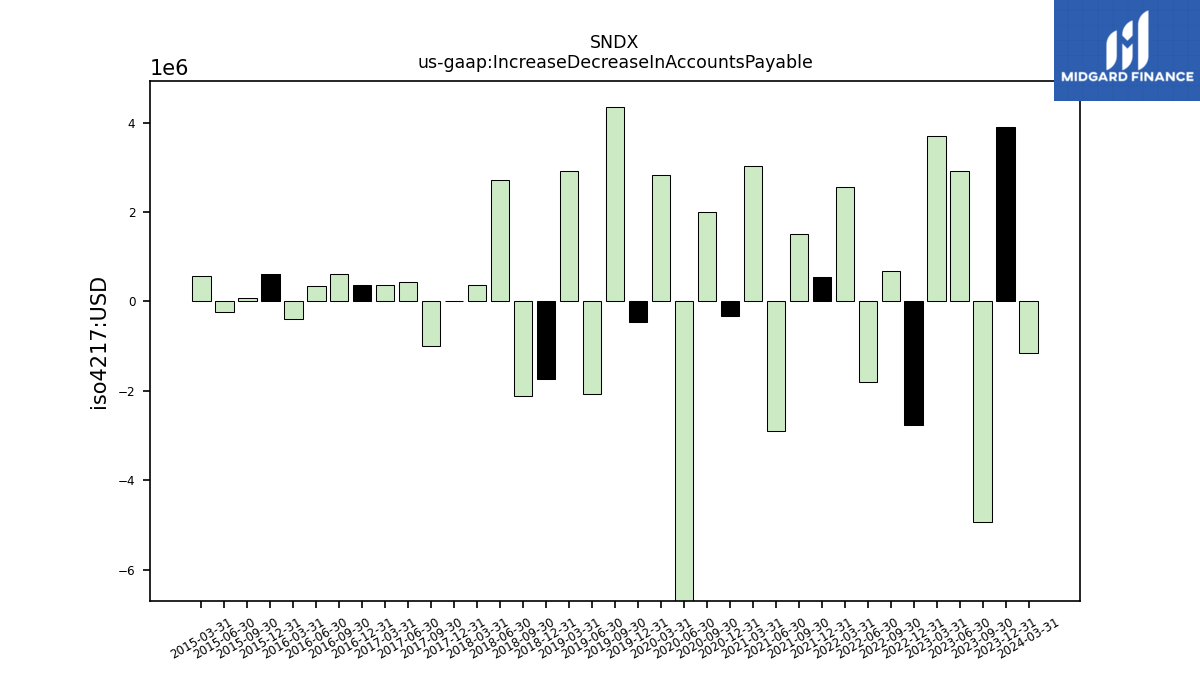
| Increase Decrease In Accounts Payable | -1.15 | 3.91 | -4.93 | 2.92 | 3.71 | -2.76 | 0.68 | -1.79 | 2.56 | 0.55 | 1.50 | -2.90 | 3.02 | -0.33 | 2.00 | -7.17 | 2.82 | -0.45 | 4.36 | -2.07 | 2.91 | -1.74 | -2.12 | 2.71 | 0.36 | 0.01 | -1.01 | 0.43 | 0.37 | 0.36 | 0.61 | 0.35 | -0.40 | 0.61 | |
| Share Based Compensation | 8.90 | 8.33 | 8.32 | 8.06 | 6.24 | 4.24 | 4.36 | 3.94 | 3.48 | 3.93 | 3.38 | 3.24 | 2.77 | 2.04 | 3.06 | 2.13 | 1.83 | 1.52 | 1.55 | 1.34 | 1.59 | 1.47 | 1.74 | 1.57 | 1.42 | 1.28 | 1.34 | 1.45 | 1.38 | 0.95 | 0.79 | 0.78 | 2.19 | 1.17 |
| 2024-03-31 | 2023-12-31 | 2023-09-30 | 2023-06-30 | 2023-03-31 | 2022-12-31 | 2022-09-30 | 2022-06-30 | 2022-03-31 | 2021-12-31 | 2021-09-30 | 2021-06-30 | 2021-03-31 | 2020-12-31 | 2020-09-30 | 2020-06-30 | 2020-03-31 | 2019-12-31 | 2019-09-30 | 2019-06-30 | 2019-03-31 | 2018-12-31 | 2018-09-30 | 2018-06-30 | 2018-03-31 | 2017-12-31 | 2017-09-30 | 2017-06-30 | 2017-03-31 | 2016-12-31 | 2016-09-30 | 2016-06-30 | 2016-03-31 | 2015-12-31 | ||
|---|---|---|---|---|---|---|---|---|---|---|---|---|---|---|---|---|---|---|---|---|---|---|---|---|---|---|---|---|---|---|---|---|---|---|---|
| Net Cash Provided By Used In Investing Activities | -99.40 | -16.29 | 40.08 | 73.91 | 19.91 | -137.63 | -6.79 | -49.95 | 8.18 | -59.96 | 26.63 | 21.68 | -29.23 | -64.14 | 19.27 | -78.61 | -19.05 | 6.60 | 12.36 | -18.93 | 12.75 | 15.96 | 3.51 | 19.28 | 12.64 | 1.55 | 6.92 | NA | NA | NA | NA | NA | NA | NA |
| 2024-03-31 | 2023-12-31 | 2023-09-30 | 2023-06-30 | 2023-03-31 | 2022-12-31 | 2022-09-30 | 2022-06-30 | 2022-03-31 | 2021-12-31 | 2021-09-30 | 2021-06-30 | 2021-03-31 | 2020-12-31 | 2020-09-30 | 2020-06-30 | 2020-03-31 | 2019-12-31 | 2019-09-30 | 2019-06-30 | 2019-03-31 | 2018-12-31 | 2018-09-30 | 2018-06-30 | 2018-03-31 | 2017-12-31 | 2017-09-30 | 2017-06-30 | 2017-03-31 | 2016-12-31 | 2016-09-30 | 2016-06-30 | 2016-03-31 | 2015-12-31 | ||
|---|---|---|---|---|---|---|---|---|---|---|---|---|---|---|---|---|---|---|---|---|---|---|---|---|---|---|---|---|---|---|---|---|---|---|---|
| Net Cash Provided By Used In Financing Activities | 2.17 | 258.48 | 1.85 | 1.32 | 2.47 | 163.50 | -13.53 | 21.72 | 0.56 | 109.78 | 1.71 | 6.02 | 0.96 | 138.66 | 1.77 | 109.00 | 55.00 | 0.06 | 0.08 | 0.01 | 28.43 | 6.14 | 9.46 | 0.09 | 0.03 | 25.61 | 1.00 | NA | NA | NA | NA | NA | NA | NA |