
| 2023-10-31 | 2023-07-31 | 2023-04-30 | 2023-01-31 | 2022-10-31 | 2022-07-31 | 2022-04-30 | 2022-01-31 | 2021-10-31 | 2021-07-31 | 2021-04-30 | 2021-01-31 | 2020-10-31 | 2020-07-31 | 2020-04-30 | 2020-01-31 | 2019-10-31 | ||
|---|---|---|---|---|---|---|---|---|---|---|---|---|---|---|---|---|---|---|
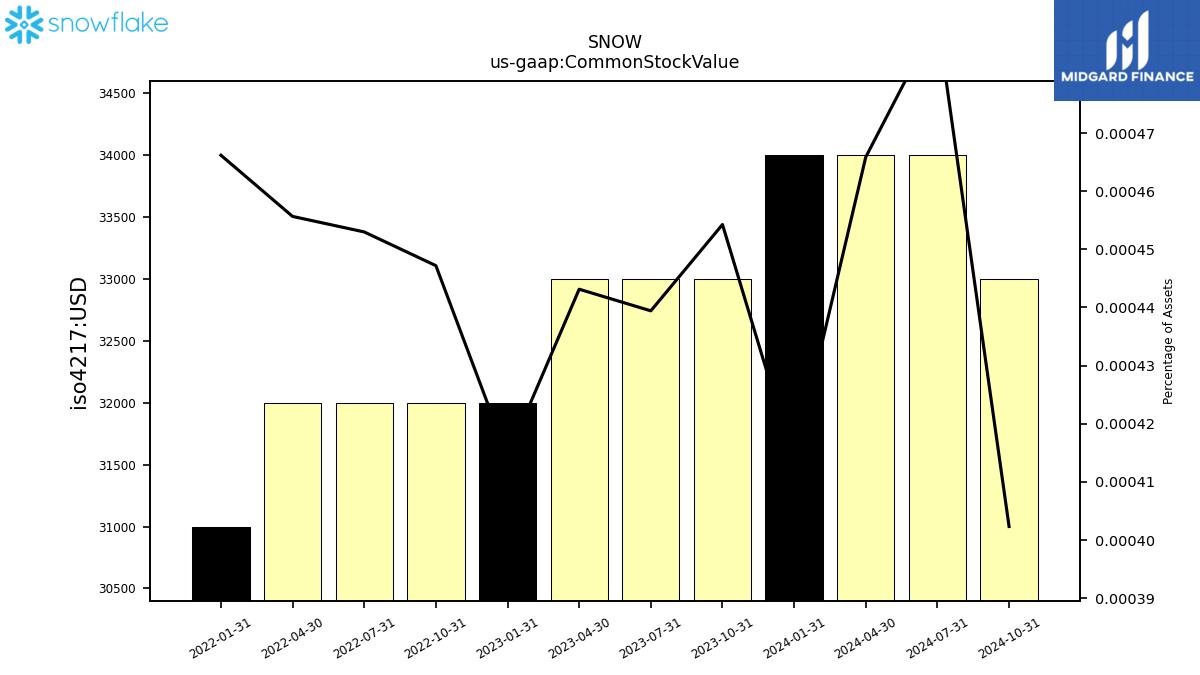
| Common Stock Value | 0.03 | 0.03 | 0.03 | 0.03 | 0.03 | 0.03 | 0.03 | 0.03 | NA | NA | NA | NA | NA | NA | NA | NA | NA | |
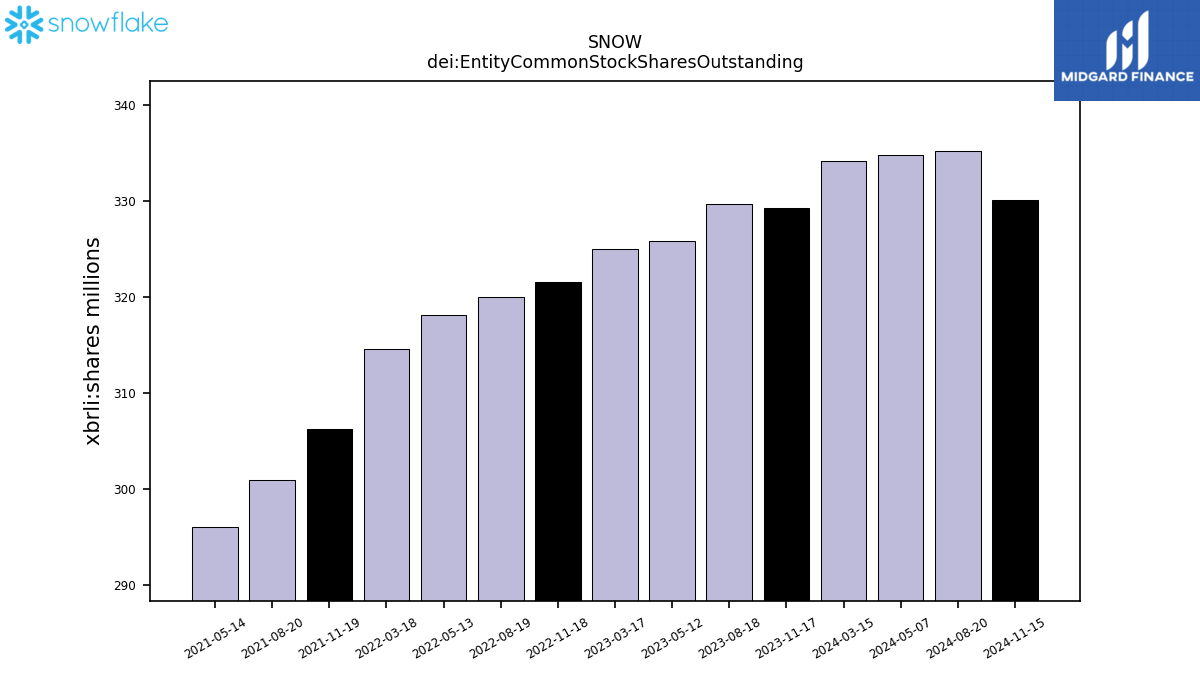
| dei: Entity Common Stock Shares Outstanding | NA | NA | NA | NA | NA | NA | NA | NA | NA | NA | NA | NA | NA | NA | NA | NA | NA | |
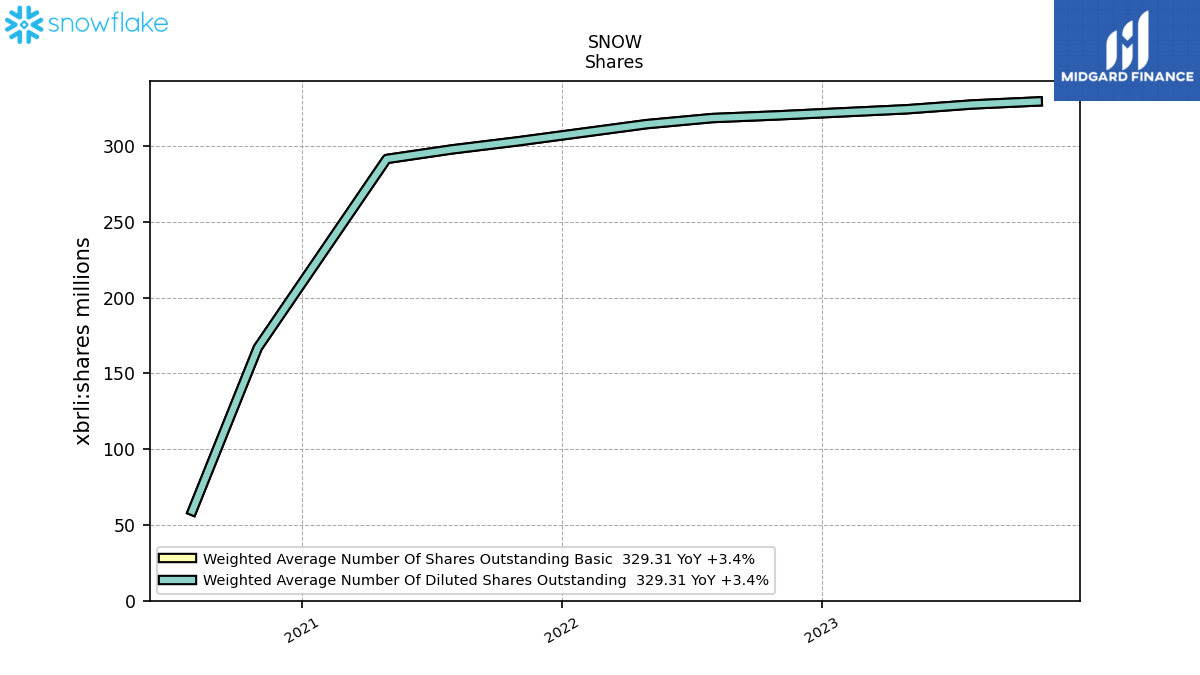
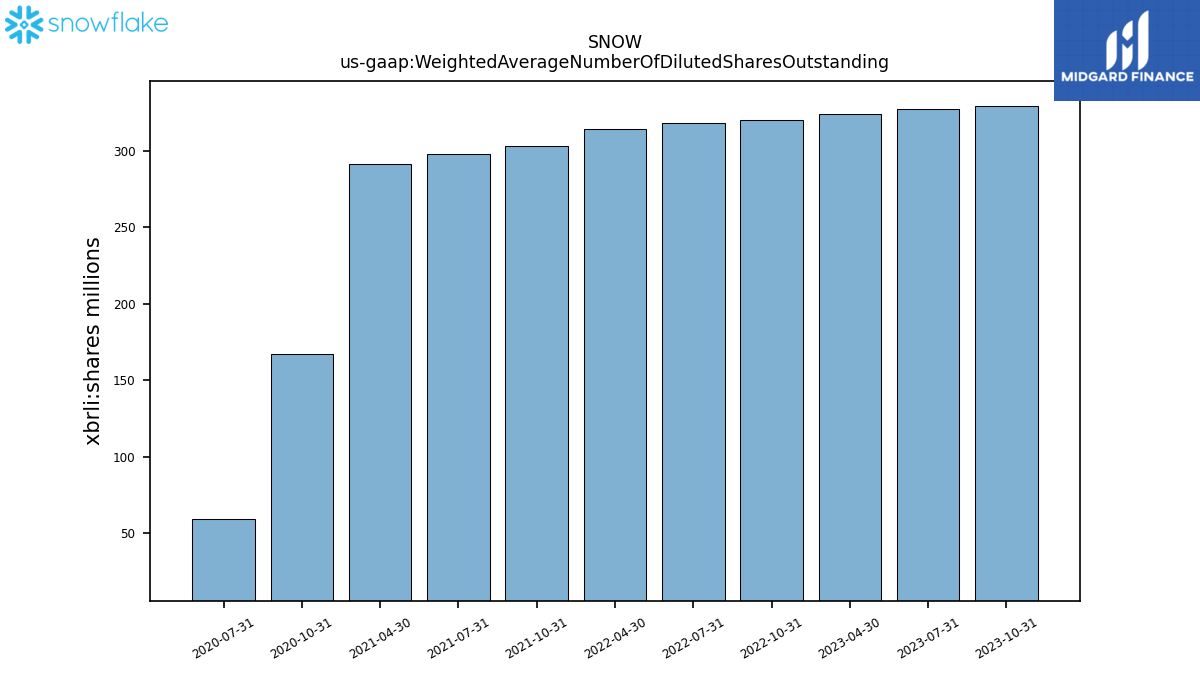
| Weighted Average Number Of Diluted Shares Outstanding | 329.31 | 327.33 | 324.16 | NA | 320.13 | 318.36 | 314.36 | NA | 303.01 | 297.72 | 291.39 | NA | 166.87 | 59.26 | NA | NA | NA | |
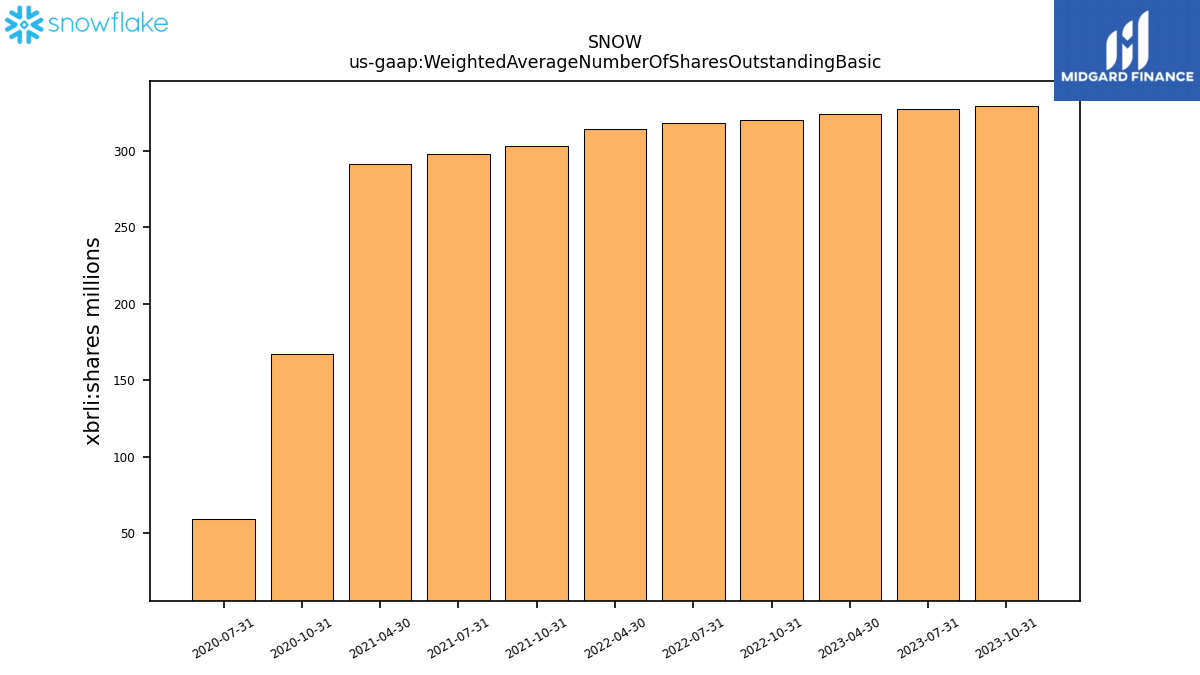
| Weighted Average Number Of Shares Outstanding Basic | 329.31 | 327.33 | 324.16 | NA | 320.13 | 318.36 | 314.36 | NA | 303.01 | 297.72 | 291.39 | NA | 166.87 | 59.26 | NA | NA | NA | |
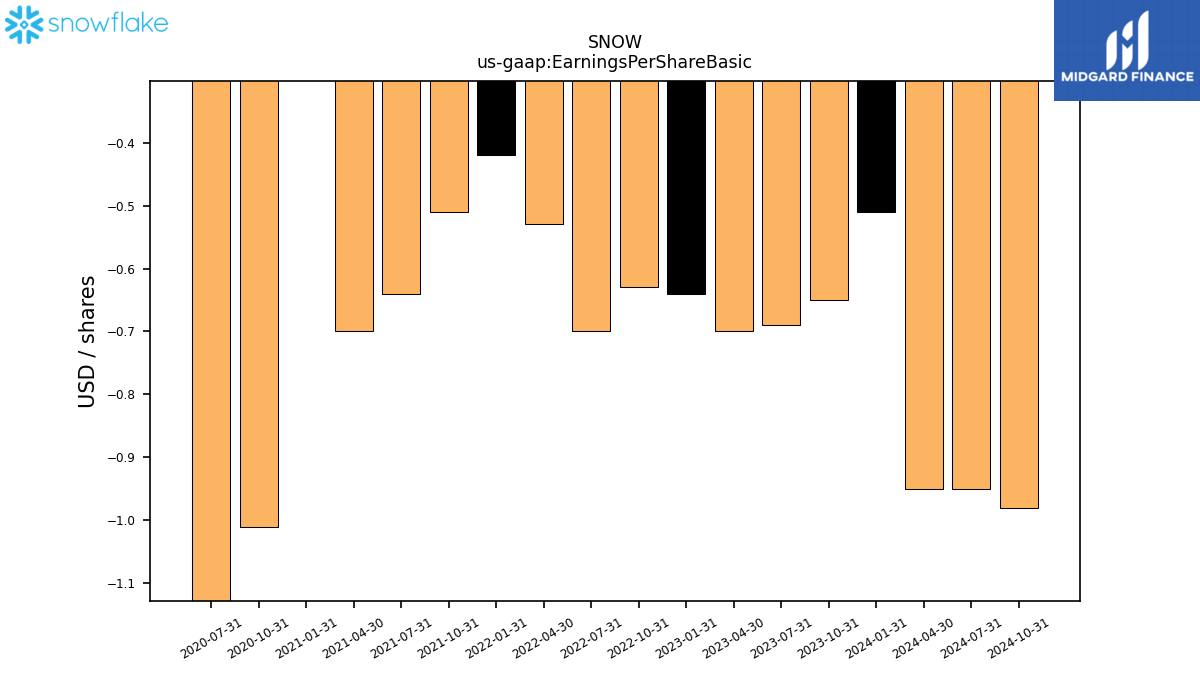
| Earnings Per Share Basic | -0.65 | -0.69 | -0.70 | -0.64 | -0.63 | -0.70 | -0.53 | -0.42 | -0.51 | -0.64 | -0.70 | -0.18 | -1.01 | -1.31 | NA | NA | NA | |
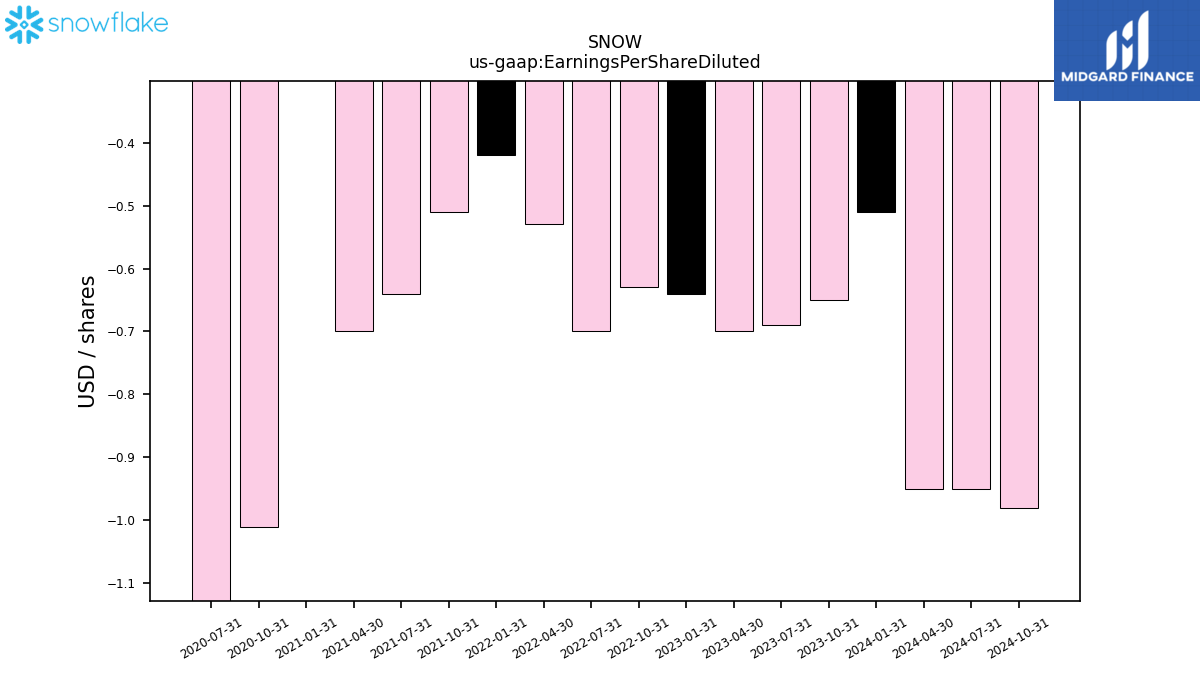
| Earnings Per Share Diluted | -0.65 | -0.69 | -0.70 | -0.64 | -0.63 | -0.70 | -0.53 | -0.42 | -0.51 | -0.64 | -0.70 | -0.18 | -1.01 | -1.31 | NA | NA | NA |
| 2023-10-31 | 2023-07-31 | 2023-04-30 | 2023-01-31 | 2022-10-31 | 2022-07-31 | 2022-04-30 | 2022-01-31 | 2021-10-31 | 2021-07-31 | 2021-04-30 | 2021-01-31 | 2020-10-31 | 2020-07-31 | 2020-04-30 | 2020-01-31 | 2019-10-31 | ||
|---|---|---|---|---|---|---|---|---|---|---|---|---|---|---|---|---|---|---|
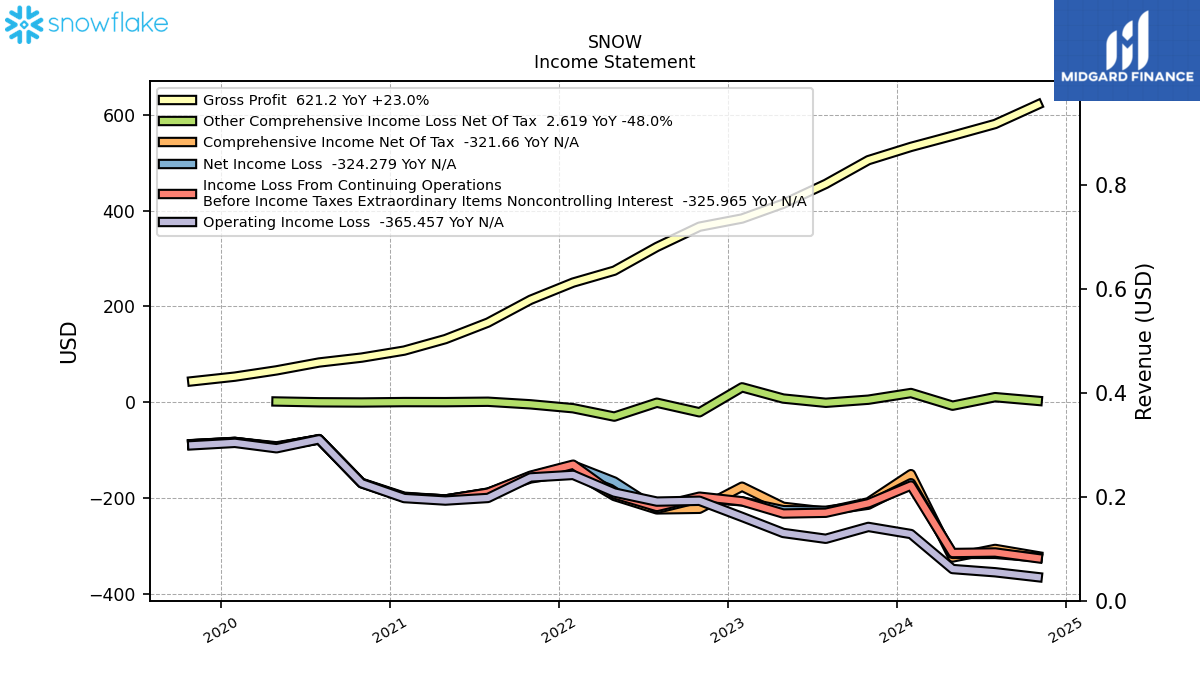
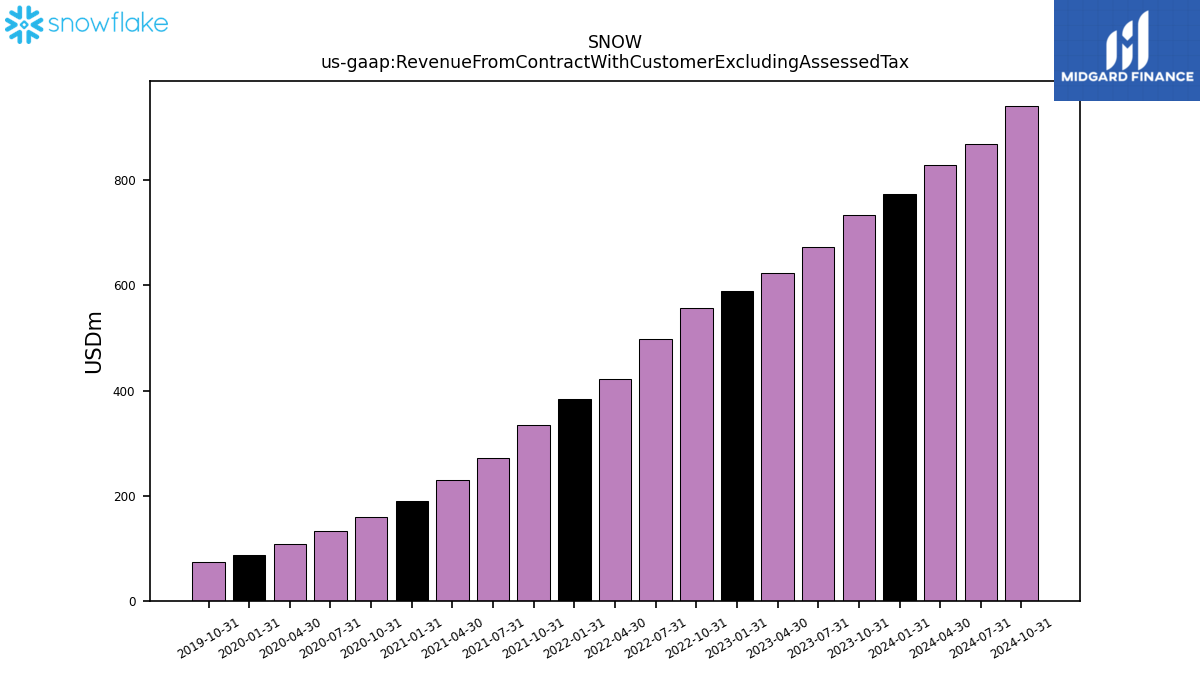
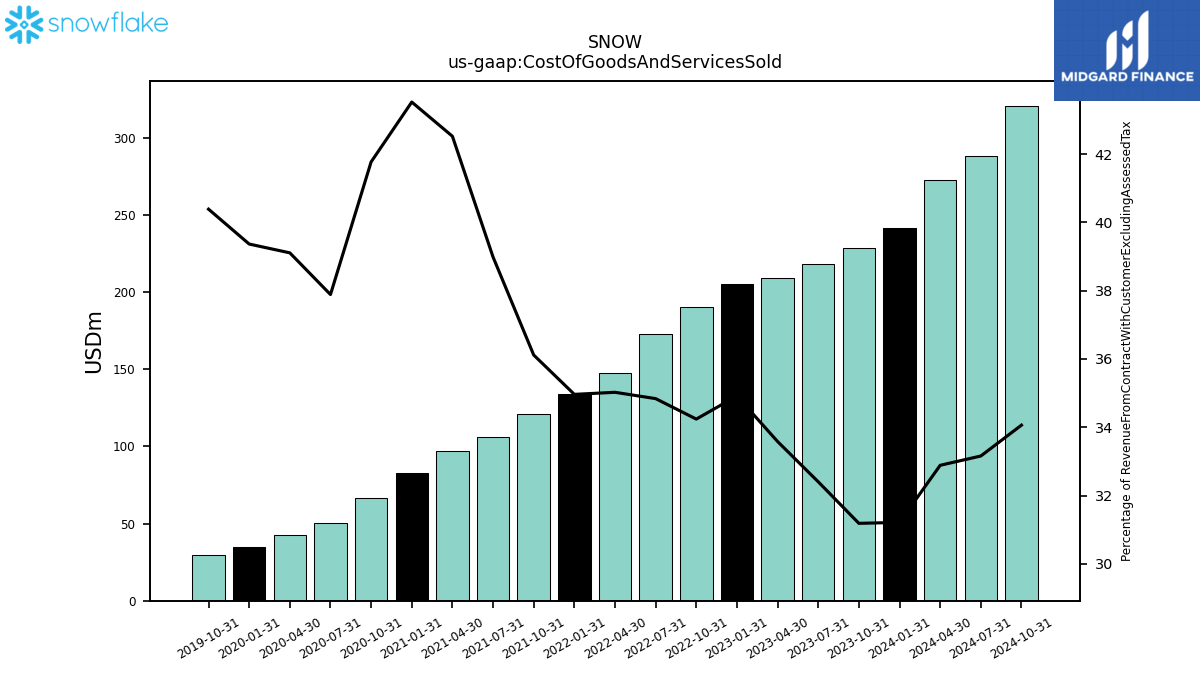
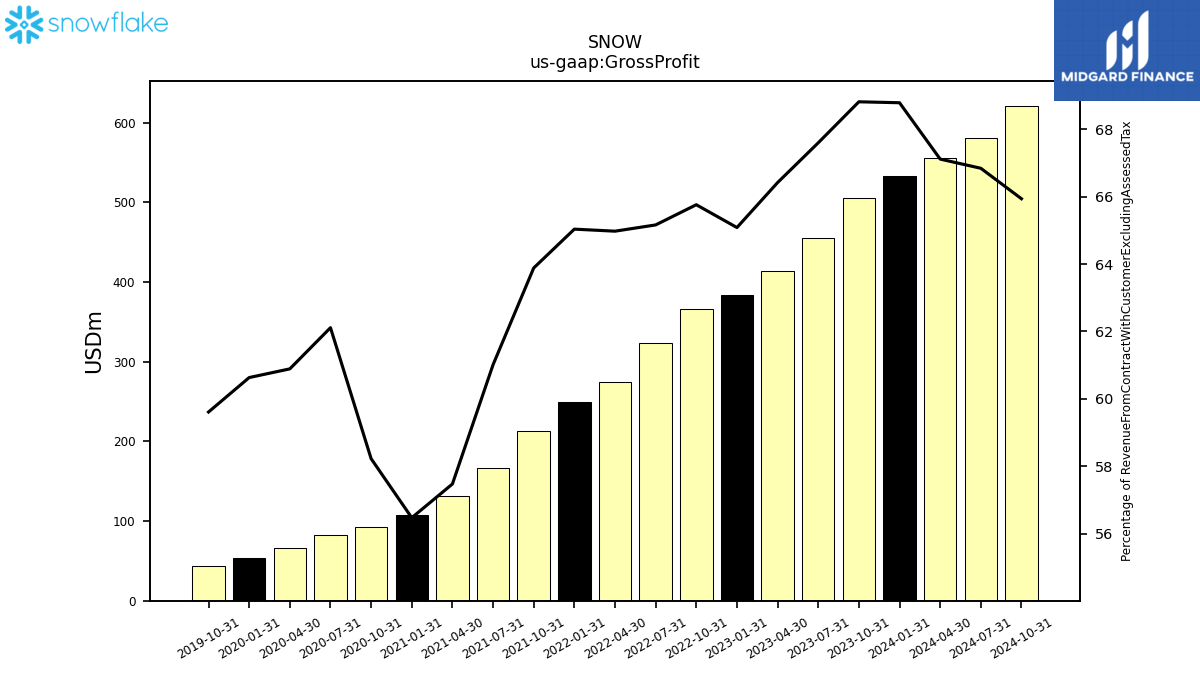
| Revenue From Contract With Customer Excluding Assessed Tax | 734.17 | 674.02 | 623.60 | 589.01 | 557.03 | 497.25 | 422.37 | 383.77 | 334.44 | 272.20 | 228.91 | 190.47 | 159.62 | 133.15 | 108.81 | 87.69 | 73.01 | |
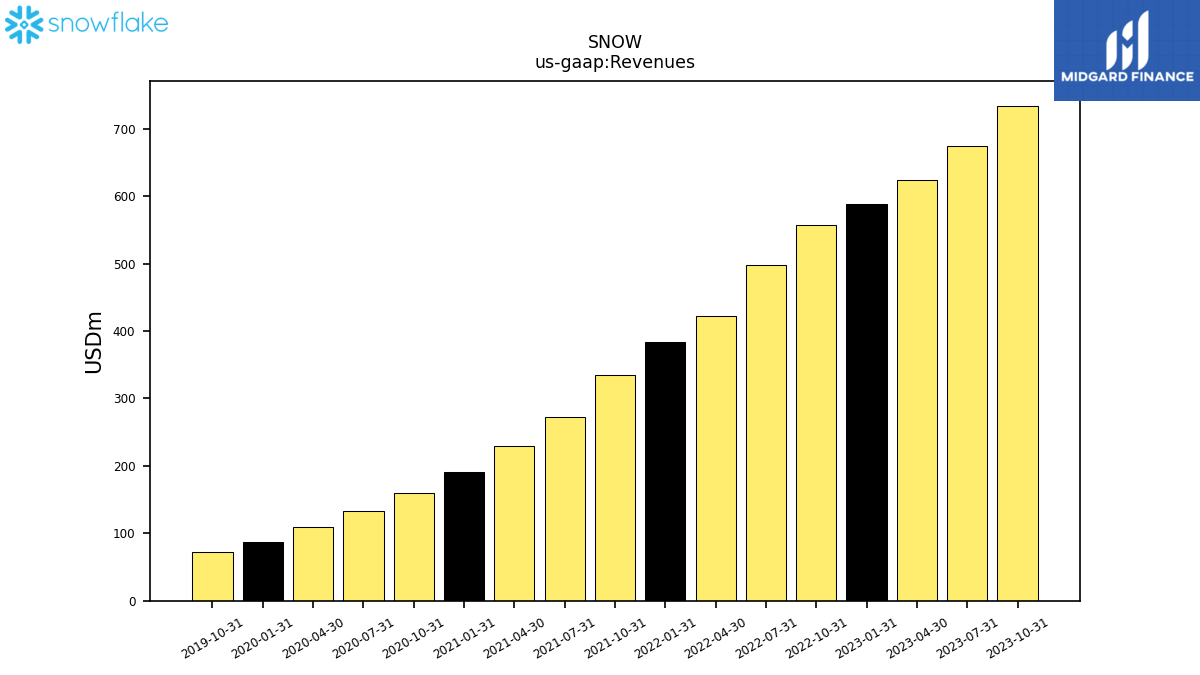
| Revenues | 734.17 | 674.02 | 623.60 | 589.01 | 557.03 | 497.25 | 422.37 | 383.77 | 334.44 | 272.20 | 228.91 | 190.47 | 159.62 | 133.15 | 108.81 | 87.69 | 73.01 | |
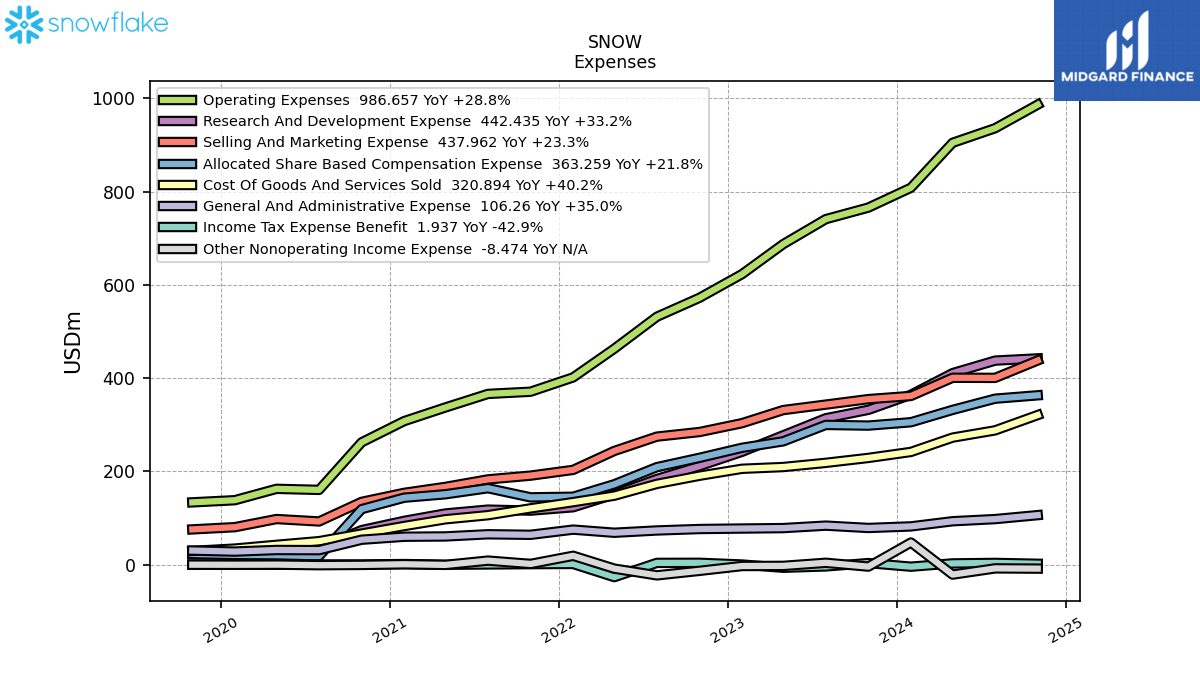
| Cost Of Goods And Services Sold | 228.95 | 218.39 | 209.41 | 205.66 | 190.72 | 173.23 | 147.93 | 134.18 | 120.79 | 106.12 | 97.35 | 82.90 | 66.68 | 50.45 | 42.56 | 34.52 | 29.49 | |
| Gross Profit | 505.23 | 455.63 | 414.19 | 383.36 | 366.31 | 324.02 | 274.44 | 249.59 | 213.66 | 166.08 | 131.57 | 107.56 | 92.94 | 82.70 | 66.26 | 53.17 | 43.52 | |
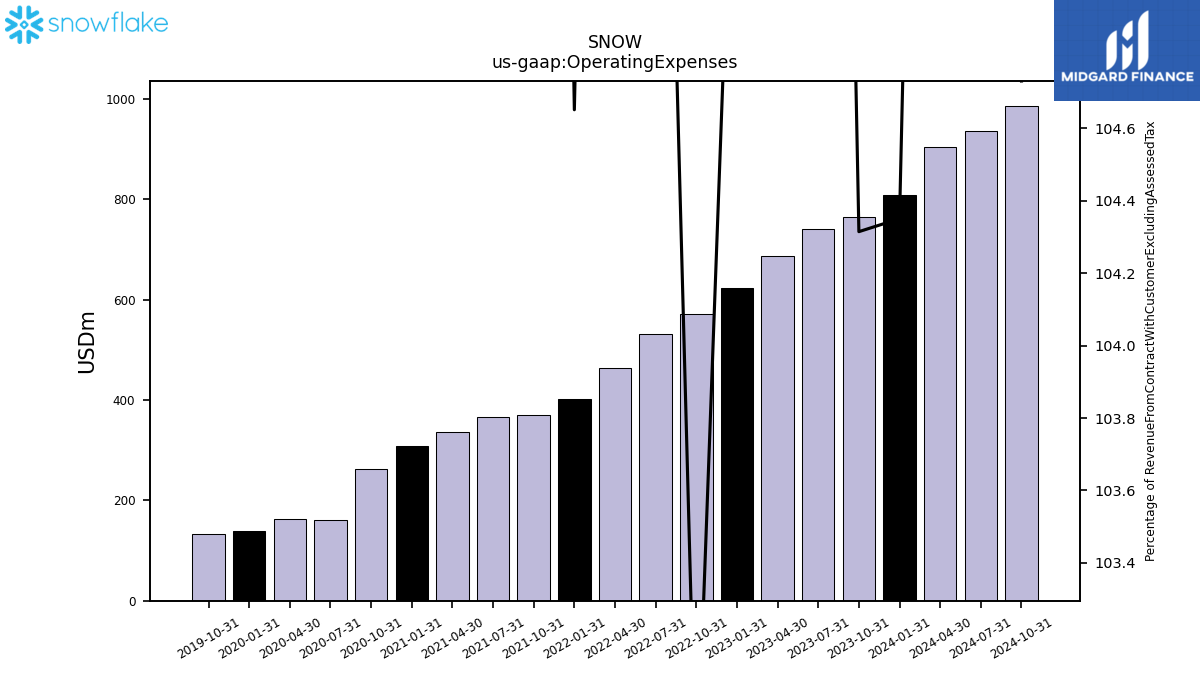
| Operating Expenses | 765.85 | 741.03 | 687.42 | 623.11 | 572.33 | 531.75 | 463.21 | 401.62 | 370.93 | 366.22 | 337.16 | 307.96 | 262.40 | 160.38 | 162.66 | 138.28 | 133.66 | |
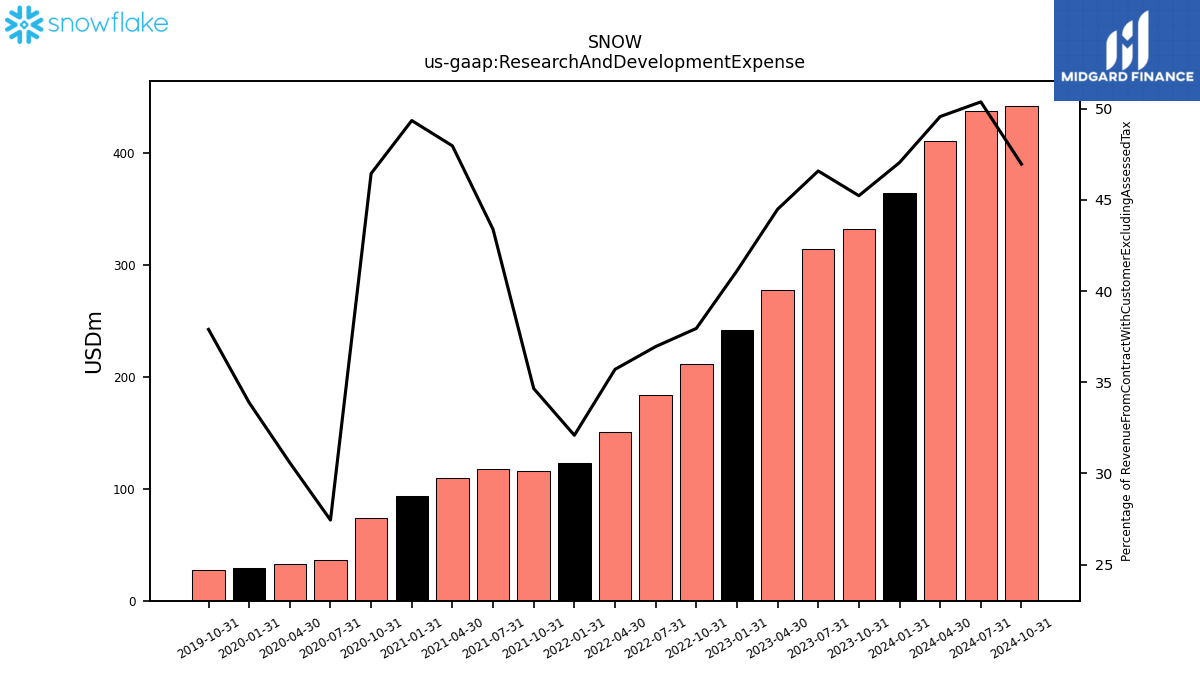
| Research And Development Expense | 332.06 | 314.00 | 277.41 | 242.12 | 211.39 | 183.75 | 150.80 | 123.15 | 115.90 | 118.09 | 109.80 | 94.00 | 74.14 | 36.53 | 33.28 | 29.71 | 27.67 | |
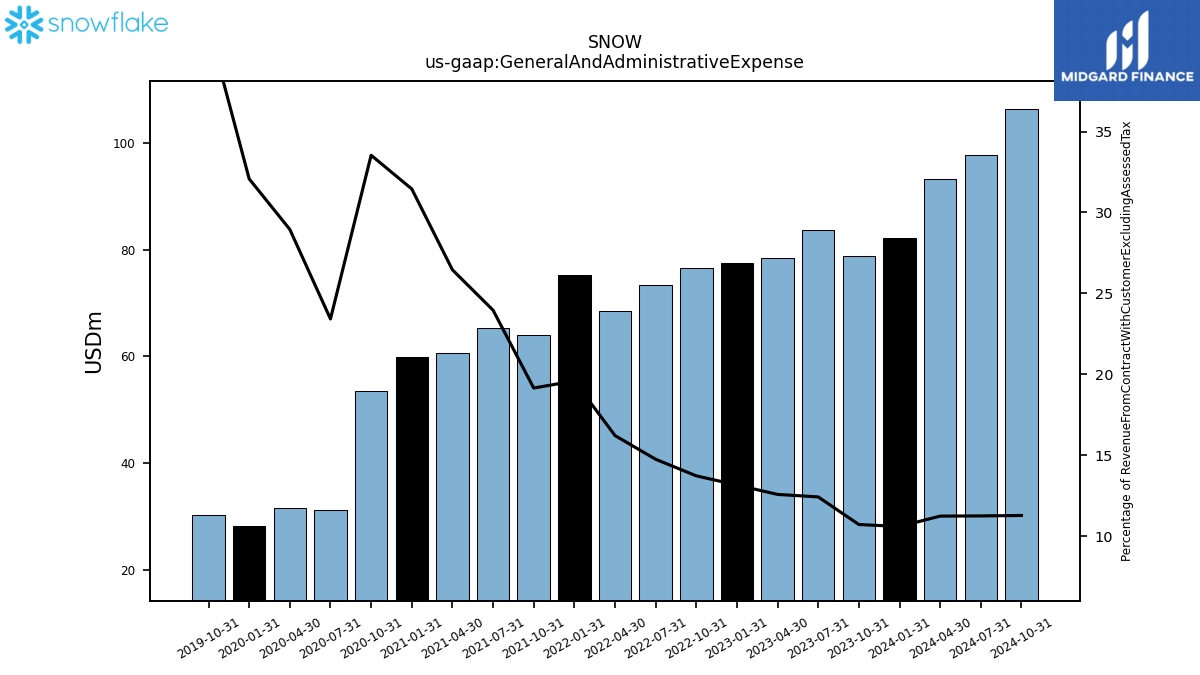
| General And Administrative Expense | 78.70 | 83.75 | 78.45 | 77.51 | 76.46 | 73.36 | 68.50 | 75.19 | 64.06 | 65.23 | 60.56 | 59.91 | 53.53 | 31.19 | 31.51 | 28.13 | 30.32 | |
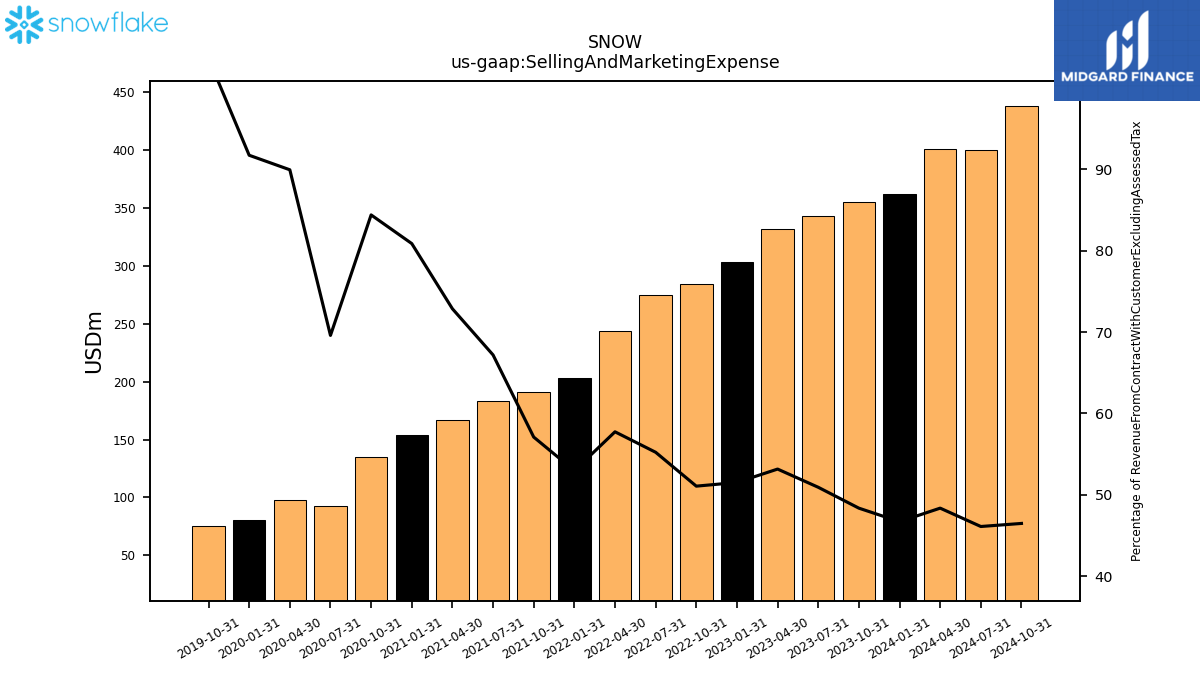
| Selling And Marketing Expense | 355.08 | 343.29 | 331.56 | 303.47 | 284.48 | 274.64 | 243.91 | 203.29 | 190.97 | 182.90 | 166.80 | 154.05 | 134.73 | 92.66 | 97.88 | 80.44 | 75.67 | |
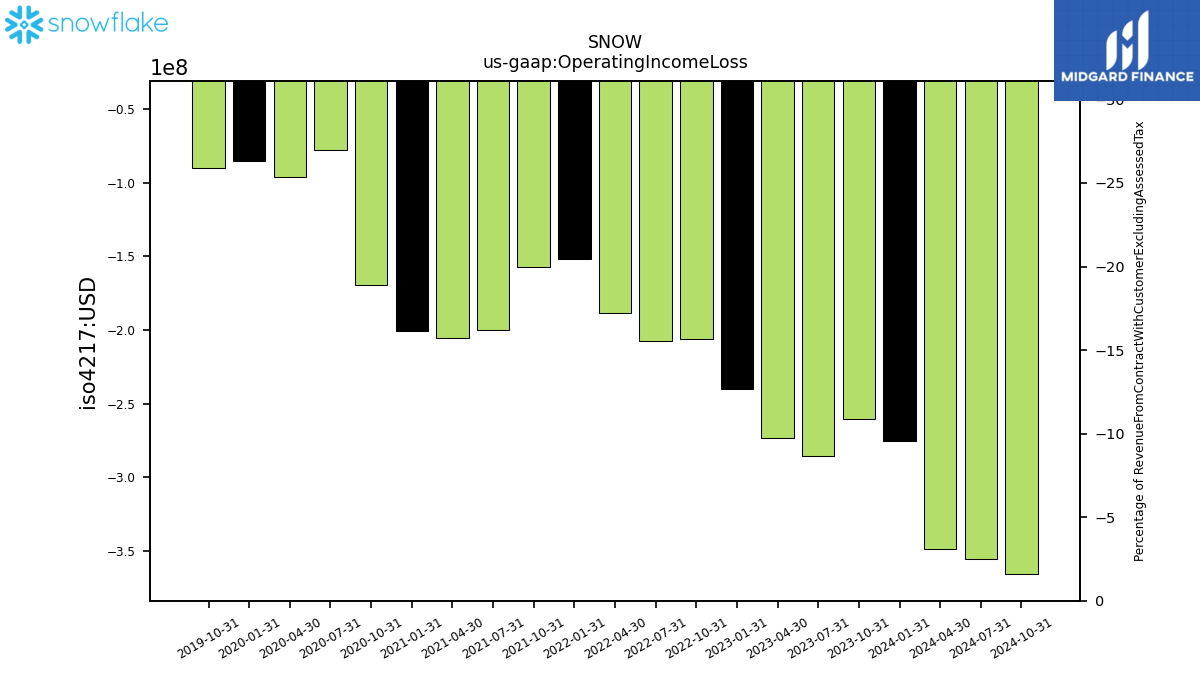
| Operating Income Loss | -260.62 | -285.41 | -273.24 | -239.75 | -206.02 | -207.73 | -188.77 | -152.03 | -157.27 | -200.14 | -205.59 | -200.40 | -169.45 | -77.68 | -96.40 | -85.11 | -90.13 | |
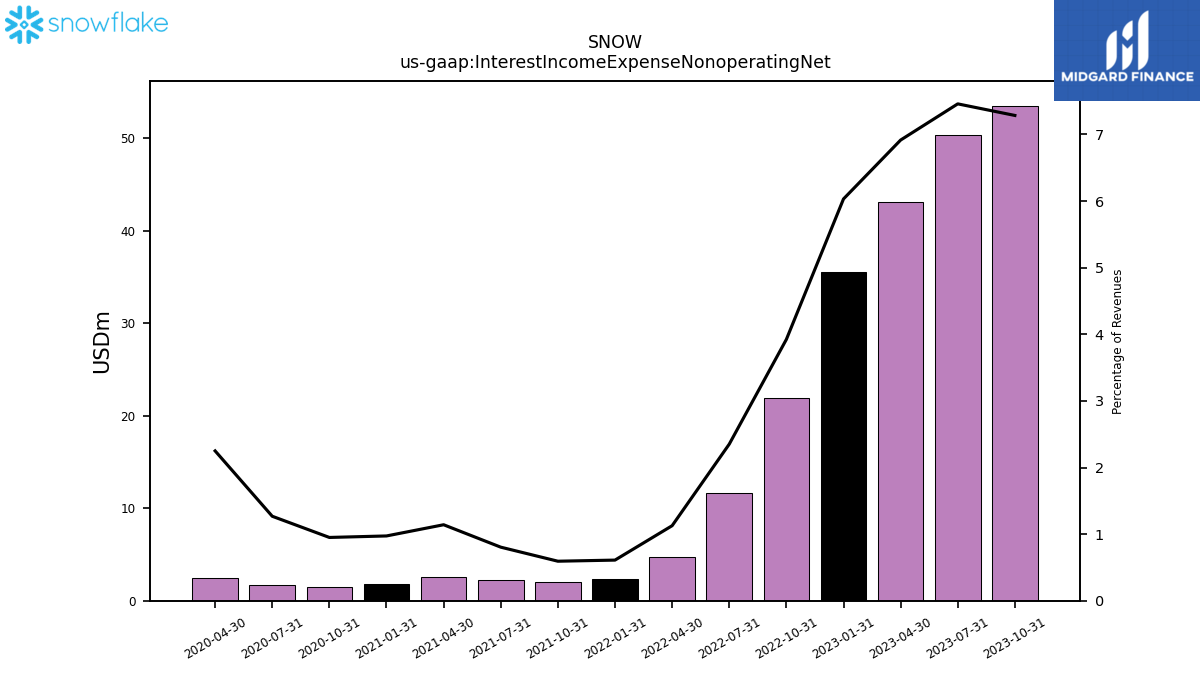
| Interest Income Expense Nonoperating Net | 53.49 | 50.28 | 43.13 | 35.53 | 21.86 | 11.69 | 4.76 | 2.34 | 1.99 | 2.19 | 2.61 | 1.85 | 1.52 | 1.69 | 2.45 | NA | NA | |
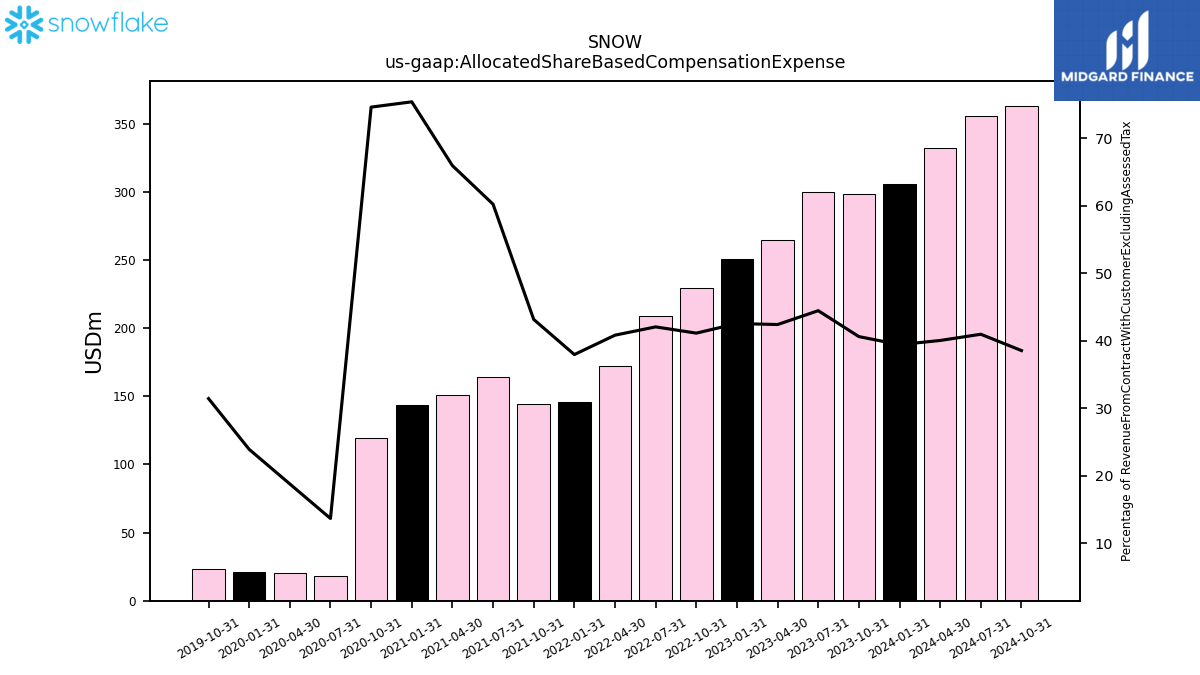
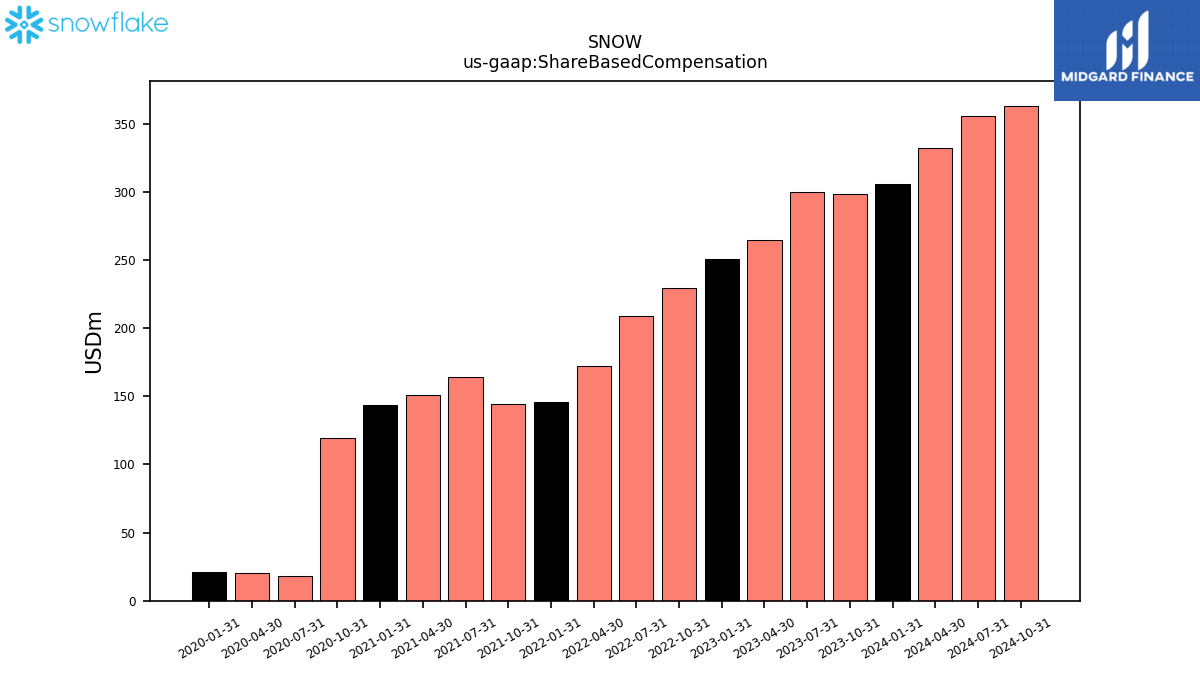
| Allocated Share Based Compensation Expense | 298.29 | 299.72 | 264.51 | 250.70 | 229.16 | 209.18 | 172.49 | 145.70 | 144.39 | 163.99 | 151.01 | 143.65 | 119.14 | 18.20 | 20.45 | 20.97 | 22.96 | |
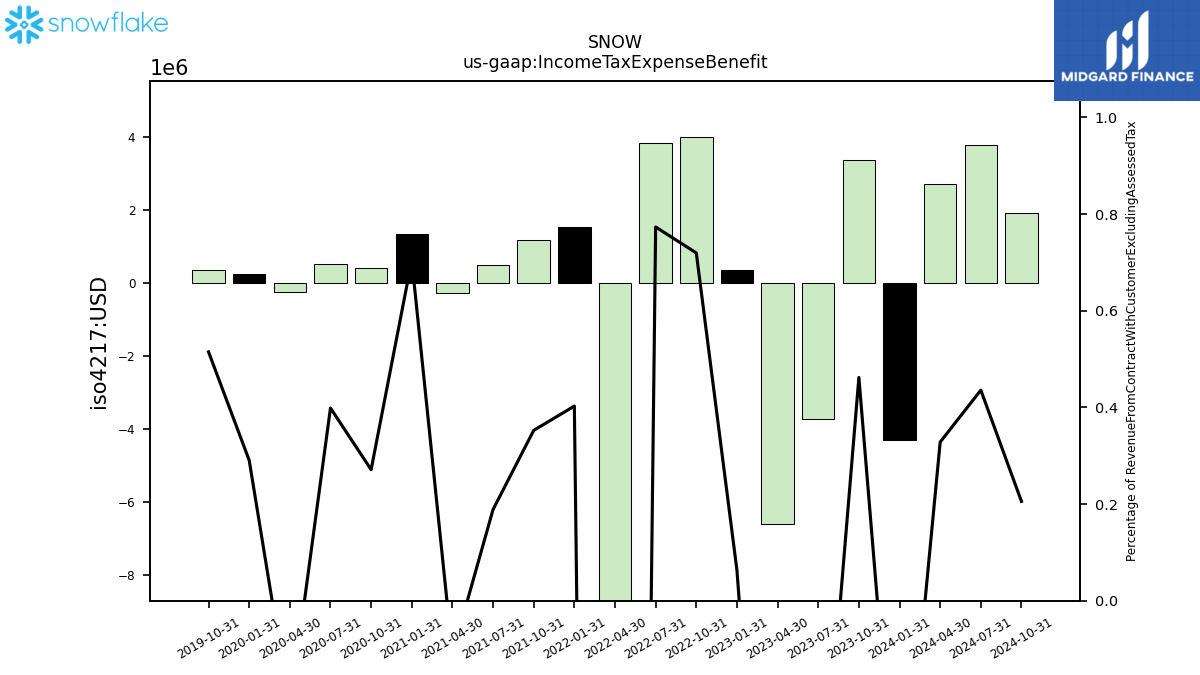
| Income Tax Expense Benefit | 3.39 | -3.72 | -6.61 | 0.37 | 4.01 | 3.85 | -26.69 | 1.55 | 1.18 | 0.51 | -0.25 | 1.34 | 0.43 | 0.53 | -0.24 | 0.26 | 0.38 | |
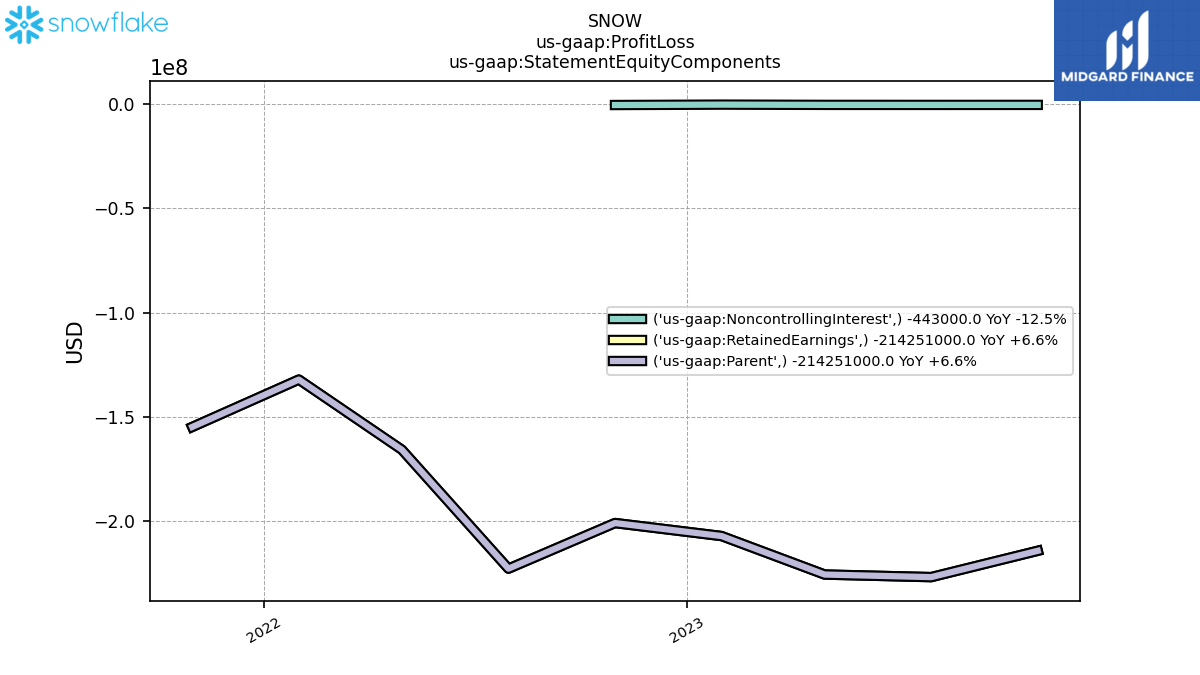
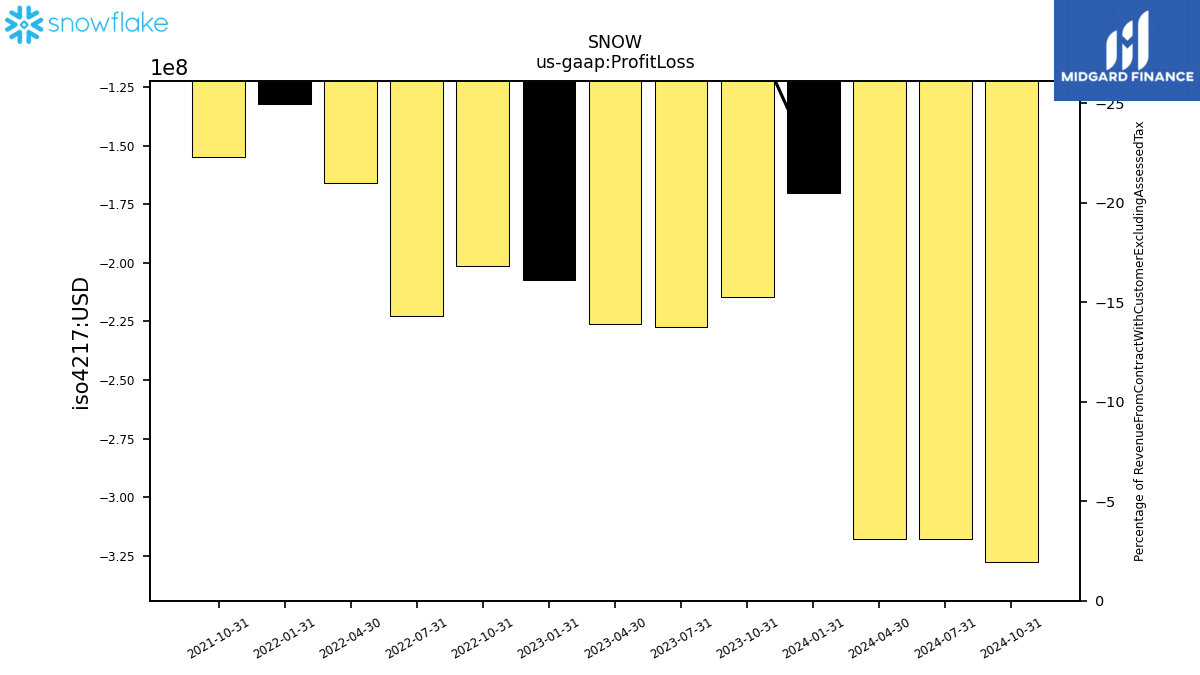
| Profit Loss | -214.69 | -227.32 | -226.06 | -207.48 | -201.44 | -222.81 | -165.79 | -132.15 | -154.86 | NA | NA | NA | NA | NA | NA | NA | NA | |
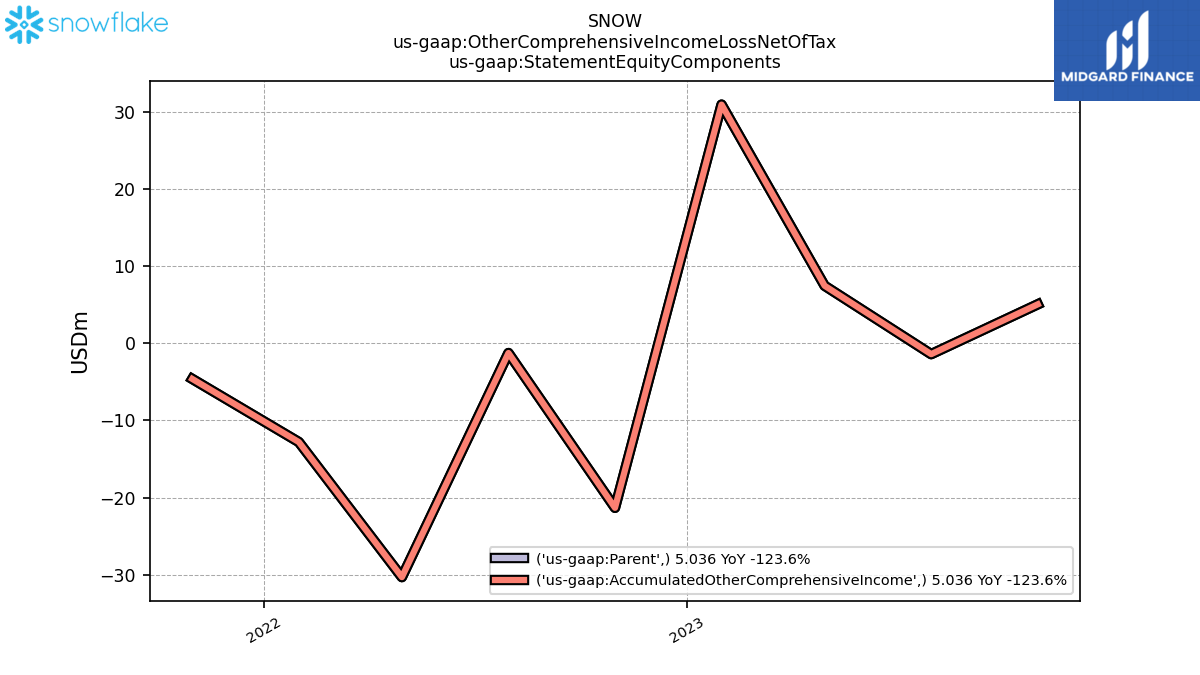
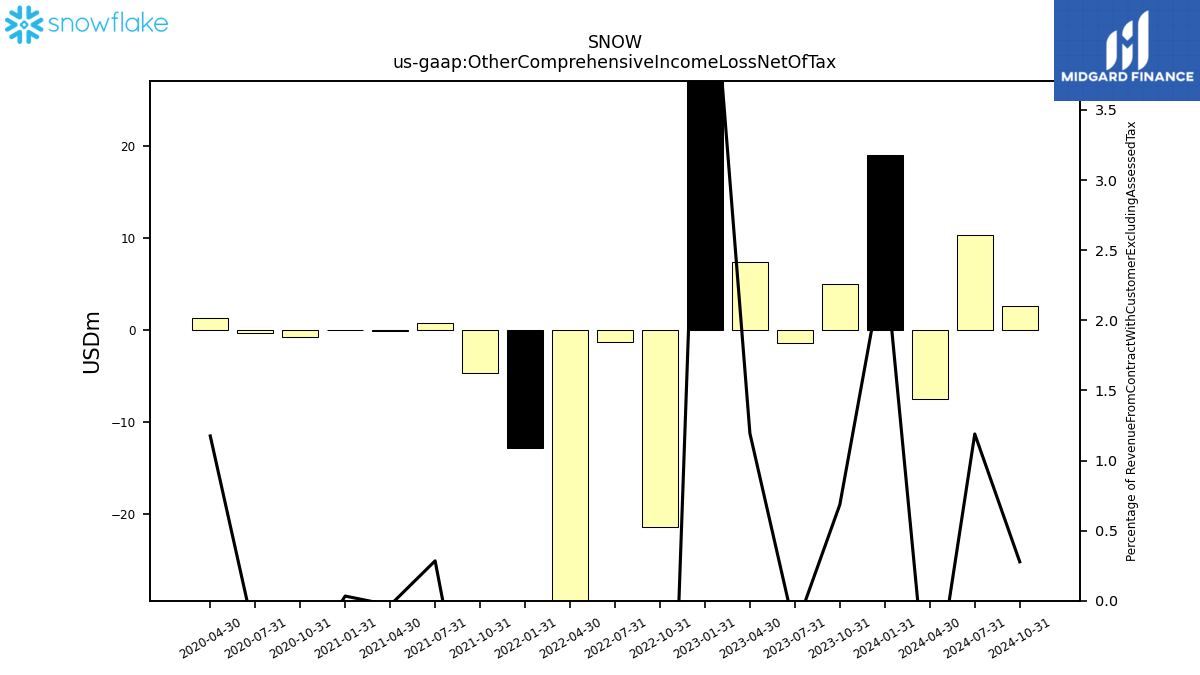
| Other Comprehensive Income Loss Net Of Tax | 5.04 | -1.42 | 7.44 | 30.91 | -21.32 | -1.27 | -30.30 | -12.80 | -4.63 | 0.78 | -0.07 | 0.06 | -0.77 | -0.35 | 1.28 | NA | NA | |
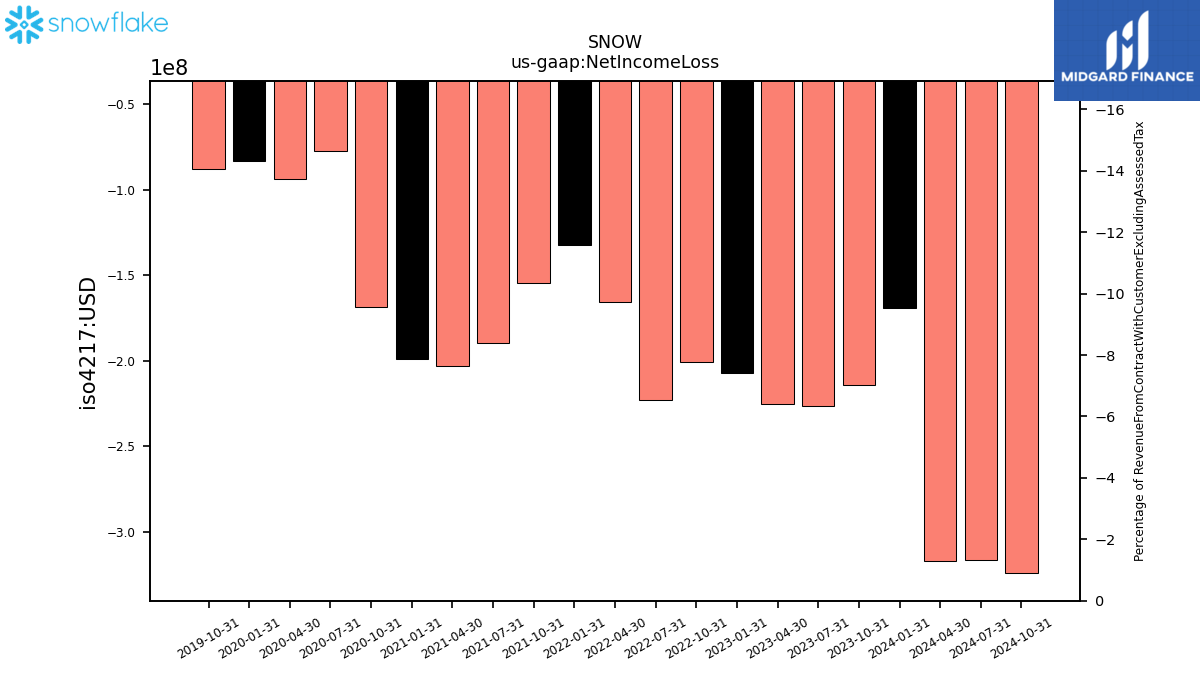
| Net Income Loss | -214.25 | -226.87 | -225.63 | -207.17 | -200.94 | -222.81 | -165.79 | -132.15 | -154.86 | -189.72 | -203.22 | -198.94 | -168.89 | -77.63 | -93.64 | -83.25 | -88.06 | |
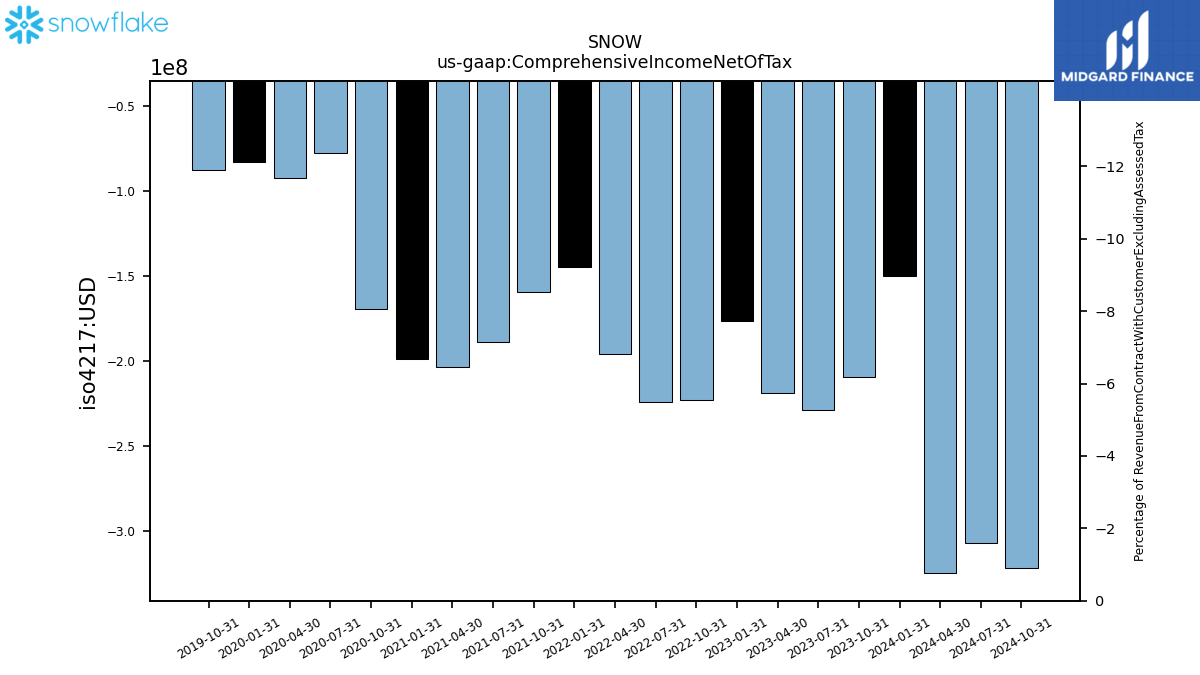
| Comprehensive Income Net Of Tax | -209.22 | -228.74 | -218.62 | -176.58 | -222.76 | -224.08 | -196.09 | -144.95 | -159.48 | -188.94 | -203.29 | -198.87 | -169.66 | -77.98 | -92.36 | -83.29 | -87.89 |
| 2023-10-31 | 2023-07-31 | 2023-04-30 | 2023-01-31 | 2022-10-31 | 2022-07-31 | 2022-04-30 | 2022-01-31 | 2021-10-31 | 2021-07-31 | 2021-04-30 | 2021-01-31 | 2020-10-31 | 2020-07-31 | 2020-04-30 | 2020-01-31 | 2019-10-31 | ||
|---|---|---|---|---|---|---|---|---|---|---|---|---|---|---|---|---|---|---|
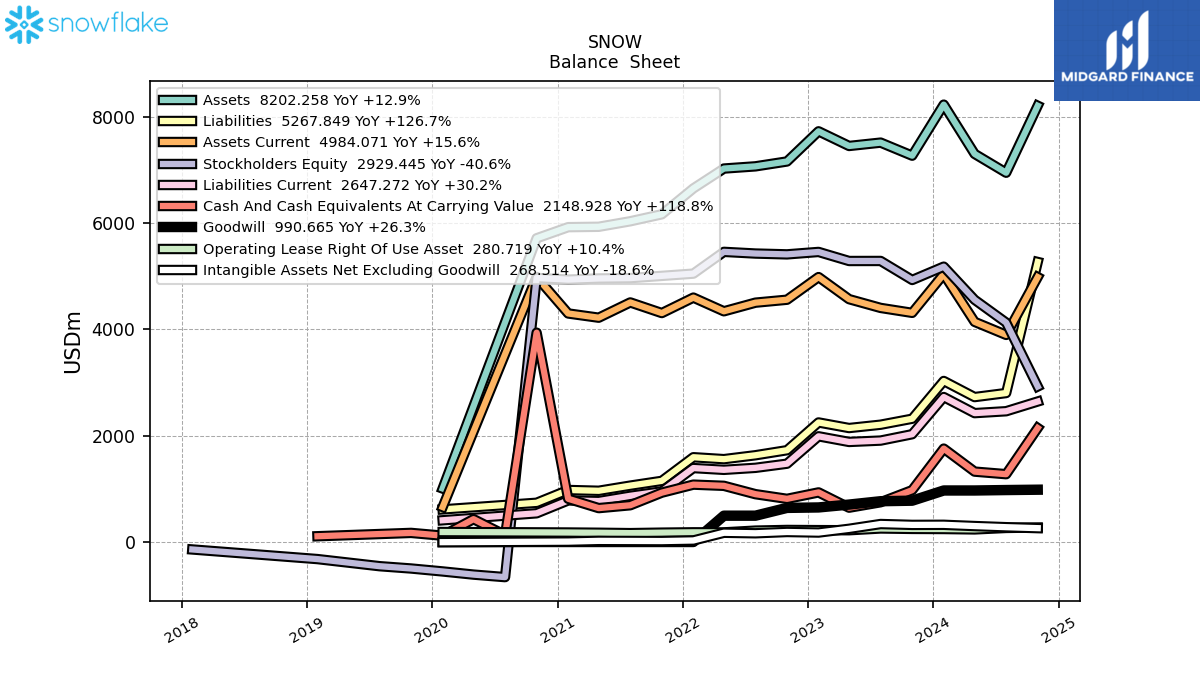
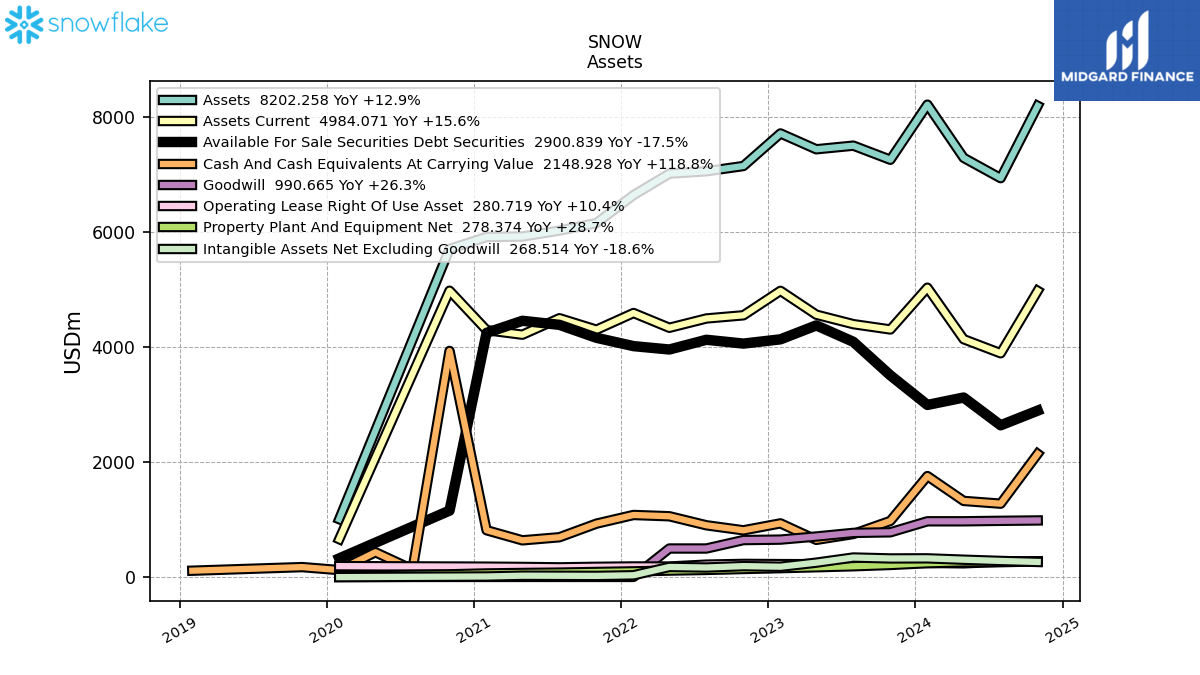
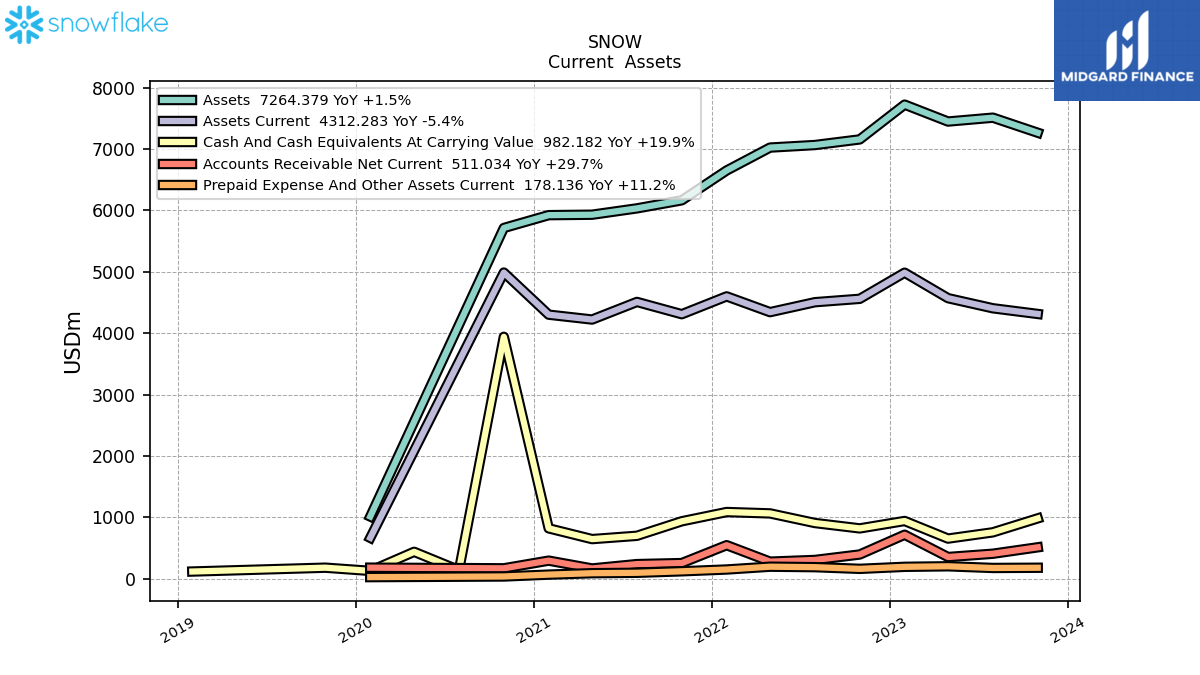
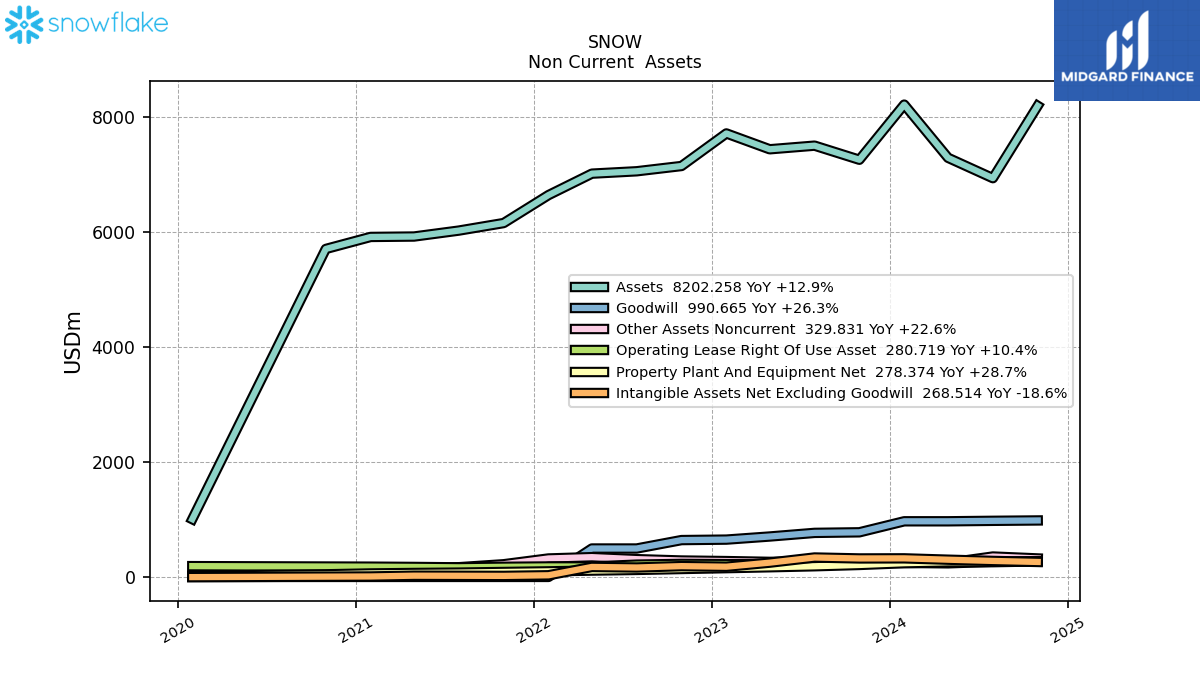
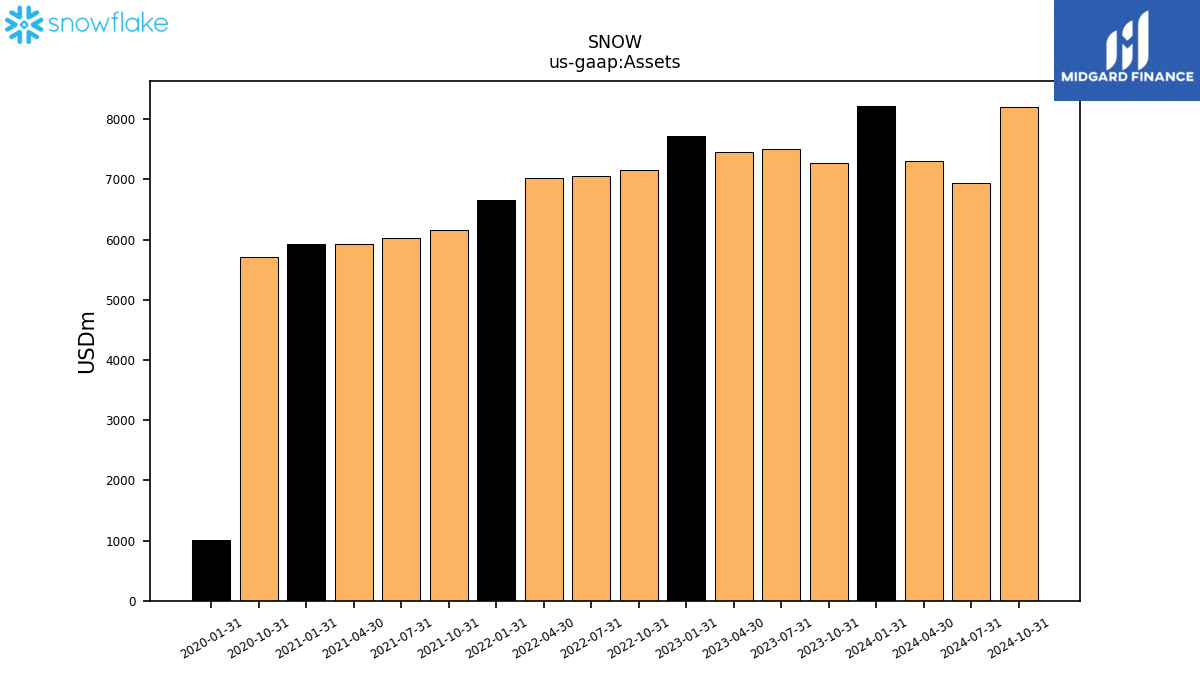
| Assets | 7264.38 | 7509.82 | 7446.77 | 7722.32 | 7155.69 | 7064.11 | 7022.70 | 6649.70 | 6163.47 | 6032.42 | 5929.01 | 5921.74 | 5712.89 | NA | NA | 1012.72 | NA | |
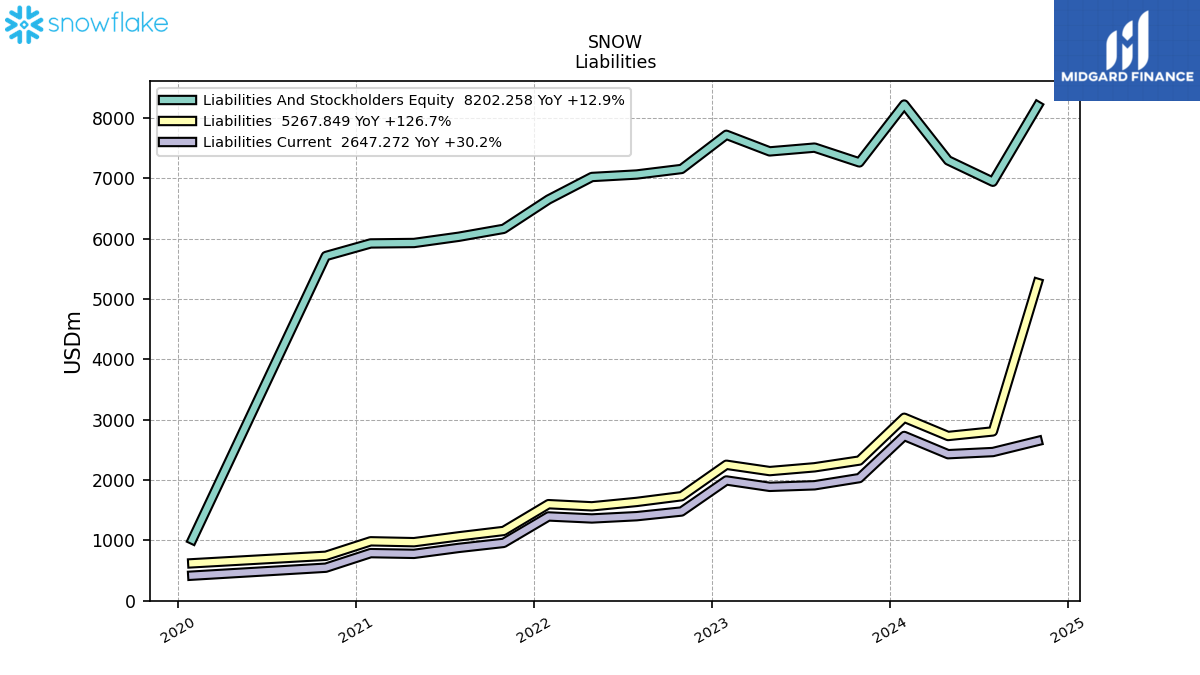
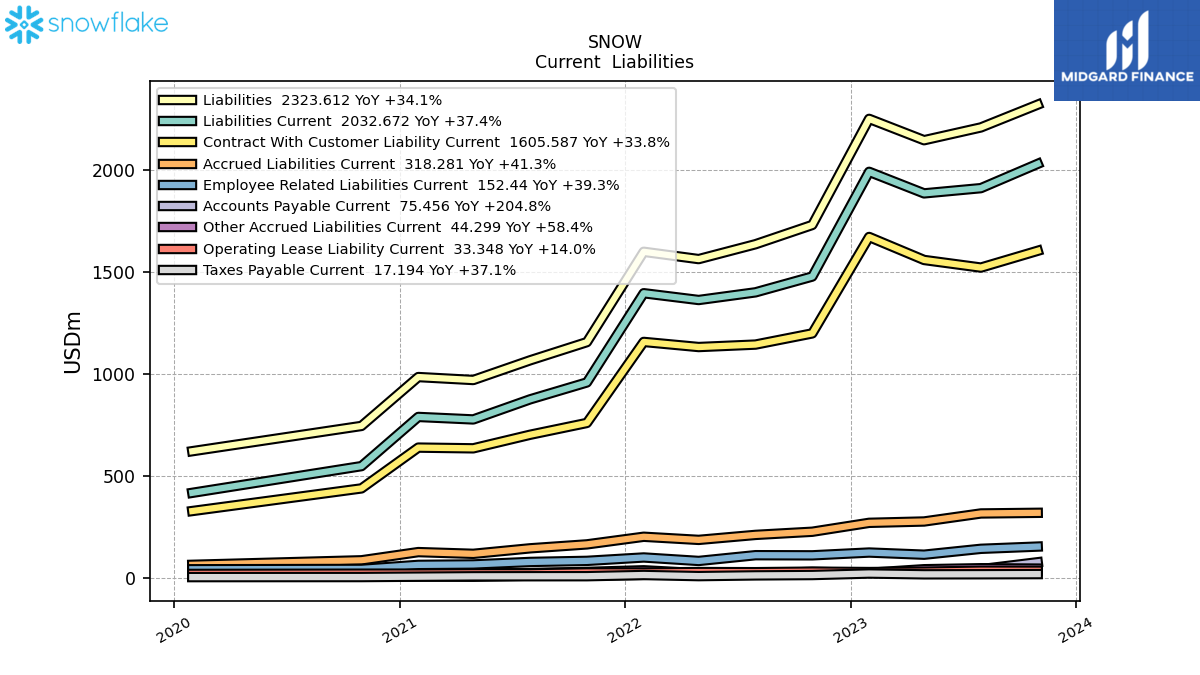
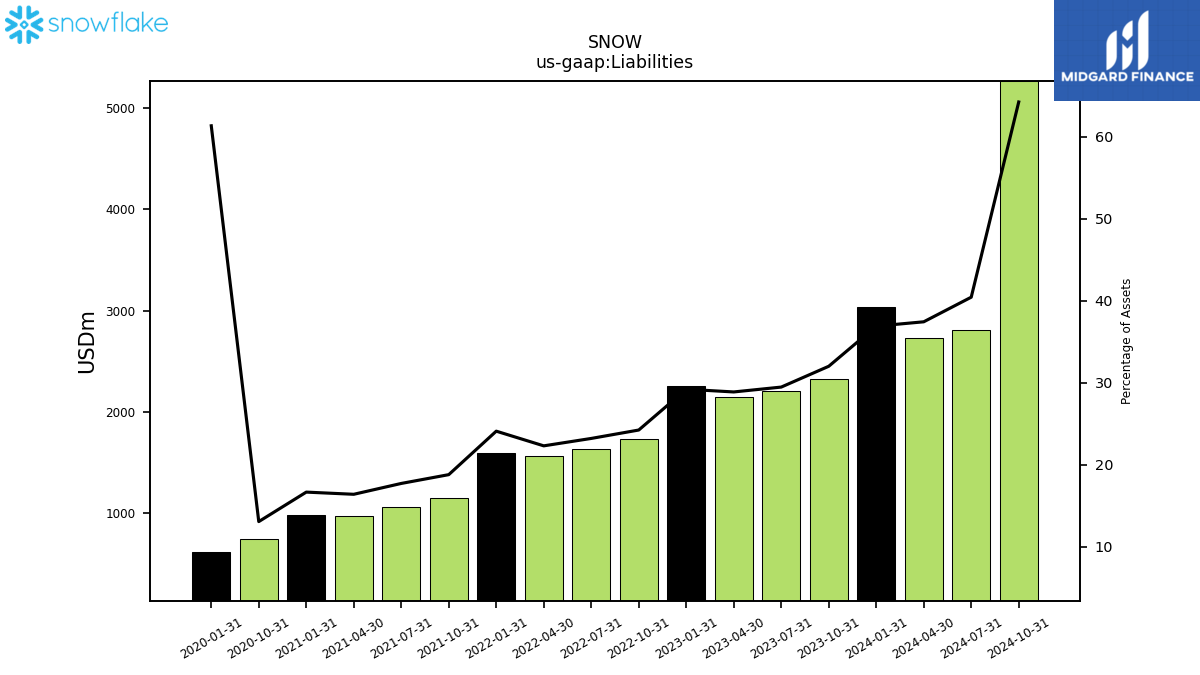
| Liabilities | 2323.61 | 2211.59 | 2148.79 | 2253.71 | 1732.42 | 1637.79 | 1564.70 | 1600.65 | 1156.79 | 1067.45 | 970.69 | 985.27 | 745.07 | NA | NA | 621.00 | NA | |
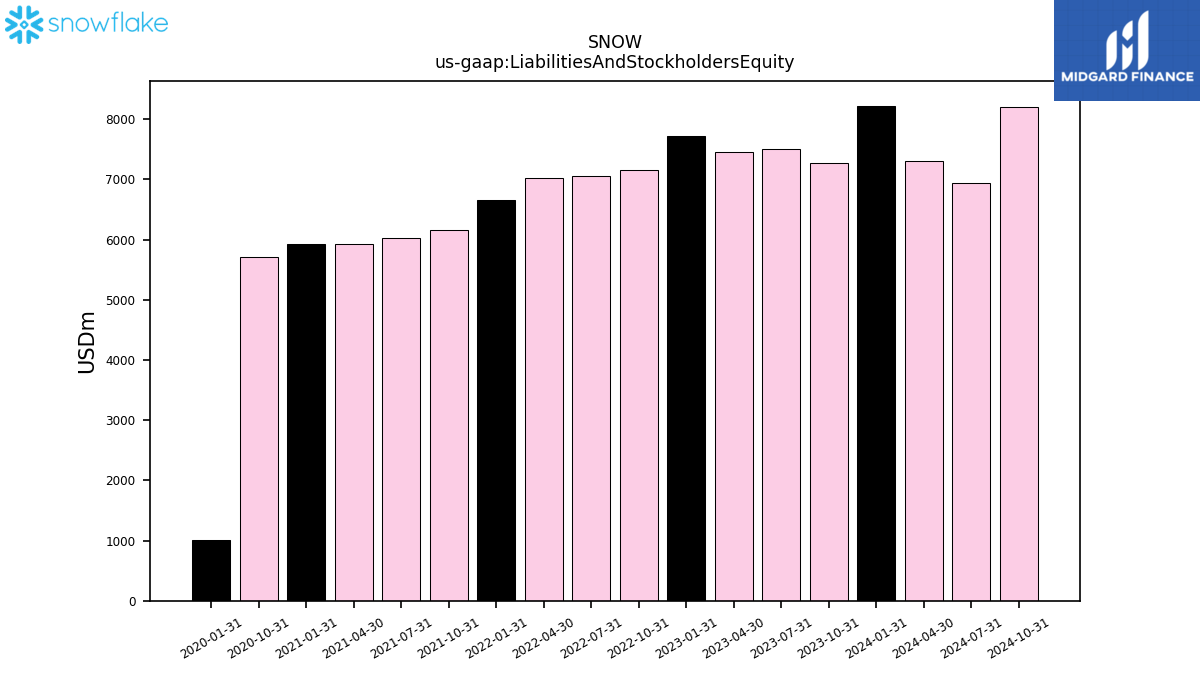
| Liabilities And Stockholders Equity | 7264.38 | 7509.82 | 7446.77 | 7722.32 | 7155.69 | 7064.11 | 7022.70 | 6649.70 | 6163.47 | 6032.42 | 5929.01 | 5921.74 | 5712.89 | NA | NA | 1012.72 | NA | |
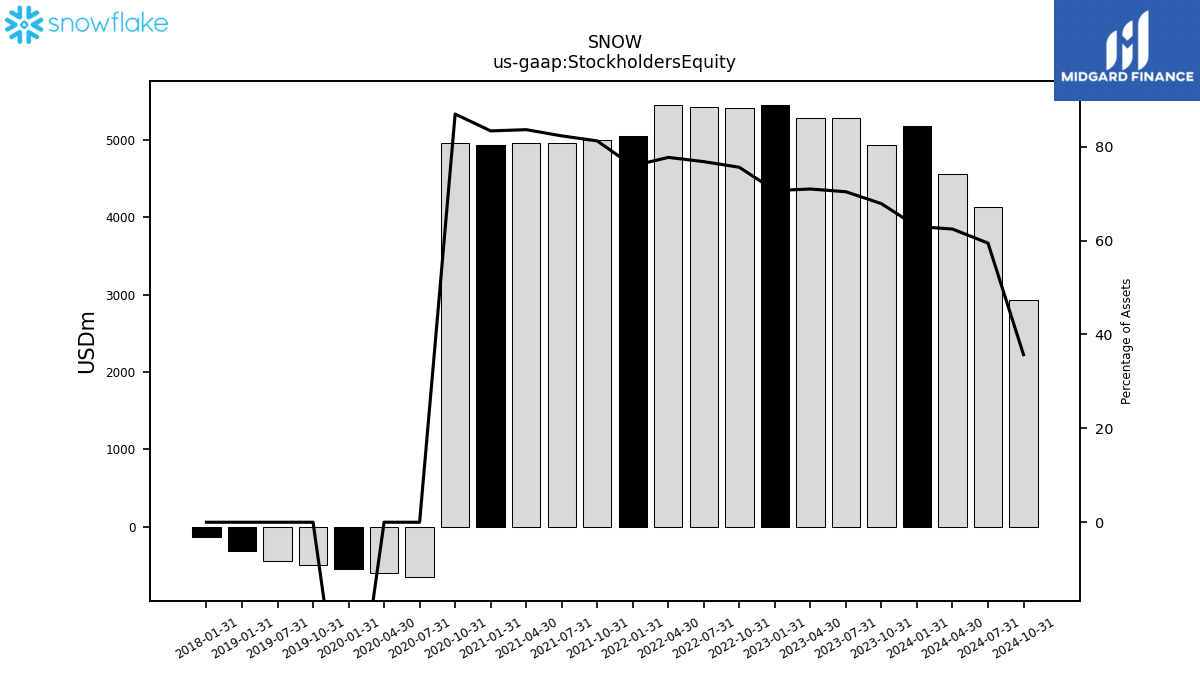
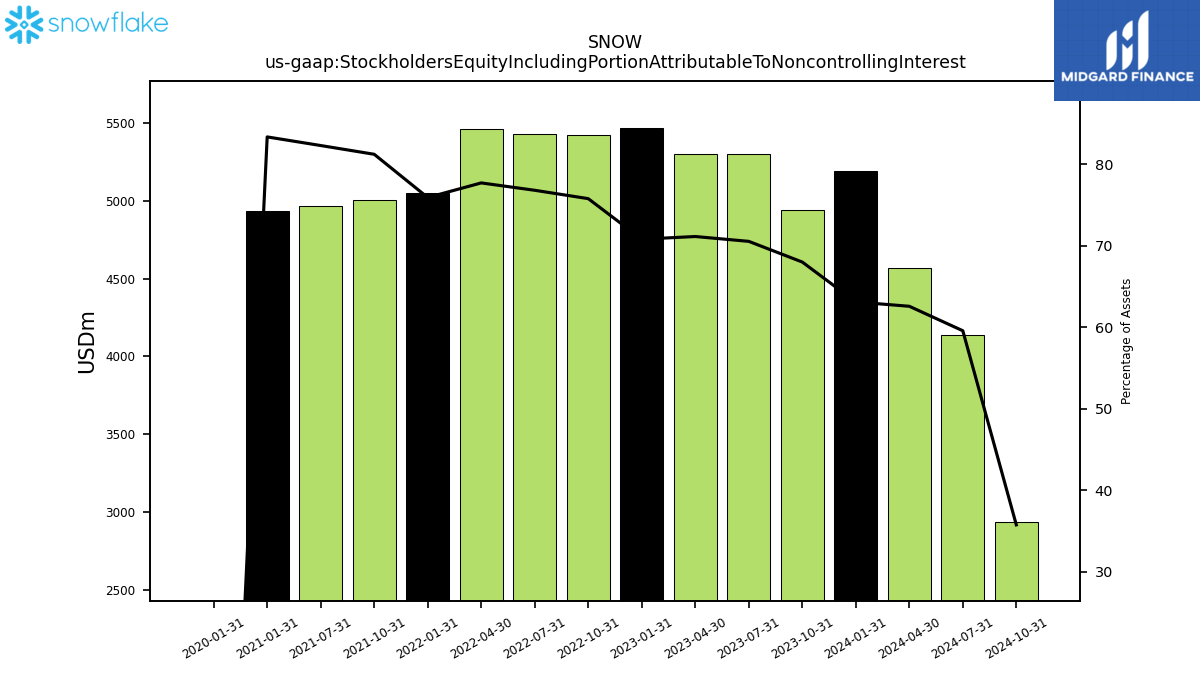
| Stockholders Equity | 4929.92 | 5286.94 | 5286.24 | 5456.44 | 5410.78 | 5426.32 | 5457.99 | 5049.05 | 5006.68 | 4964.97 | 4958.32 | 4936.47 | 4967.81 | -651.40 | -604.05 | -544.76 | -489.44 |
| 2023-10-31 | 2023-07-31 | 2023-04-30 | 2023-01-31 | 2022-10-31 | 2022-07-31 | 2022-04-30 | 2022-01-31 | 2021-10-31 | 2021-07-31 | 2021-04-30 | 2021-01-31 | 2020-10-31 | 2020-07-31 | 2020-04-30 | 2020-01-31 | 2019-10-31 | ||
|---|---|---|---|---|---|---|---|---|---|---|---|---|---|---|---|---|---|---|
| Assets Current | 4312.28 | 4404.95 | 4569.55 | 4984.69 | 4558.90 | 4503.70 | 4341.73 | 4598.64 | 4308.26 | 4508.10 | 4221.34 | 4300.65 | 4986.77 | NA | NA | 665.19 | NA | |
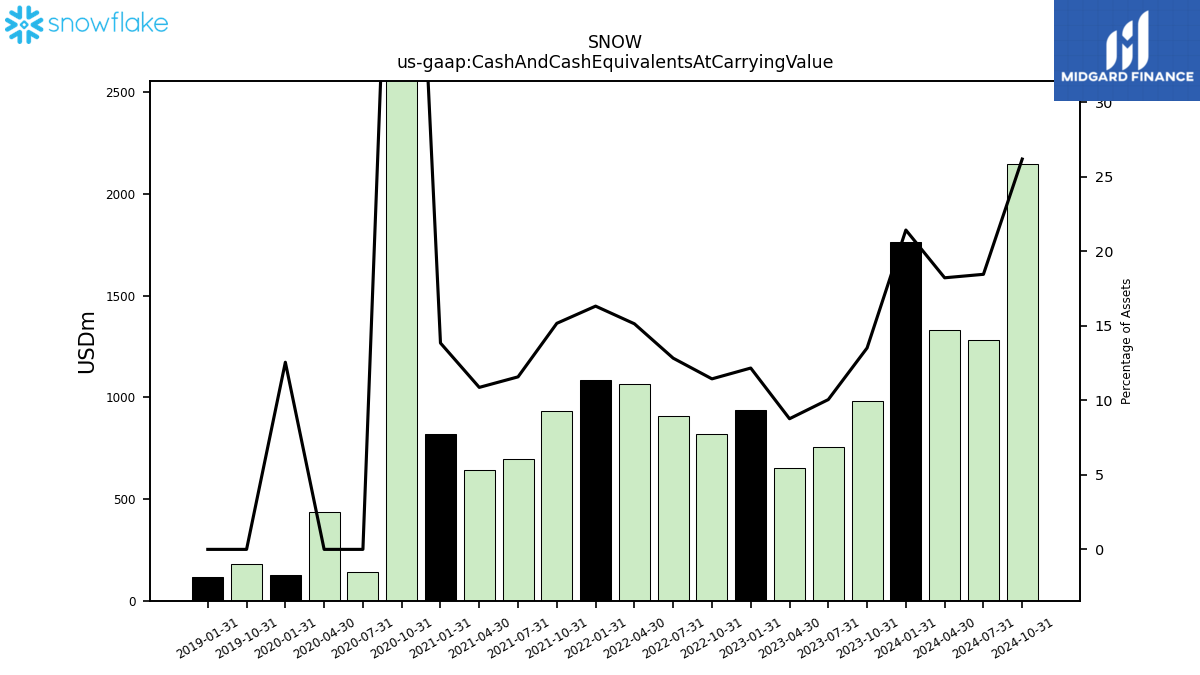
| Cash And Cash Equivalents At Carrying Value | 982.18 | 755.19 | 653.01 | 939.90 | 819.00 | 906.66 | 1063.40 | 1085.73 | 935.22 | 698.55 | 644.67 | 820.18 | 3939.93 | 138.90 | 437.56 | 127.21 | 179.14 | |
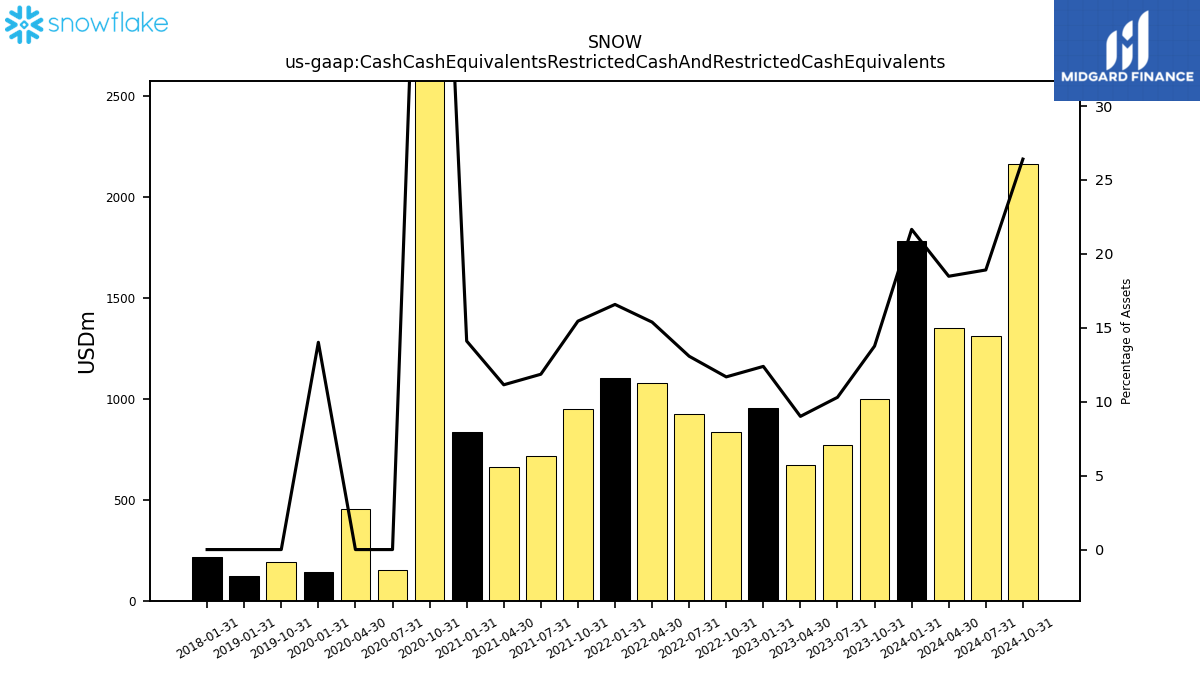
| Cash Cash Equivalents Restricted Cash And Restricted Cash Equivalents | 999.89 | 773.38 | 670.84 | 956.73 | 835.83 | 923.73 | 1080.41 | 1102.53 | 952.20 | 715.38 | 660.80 | 835.19 | 3954.92 | 153.89 | 452.85 | 141.98 | 193.76 | |
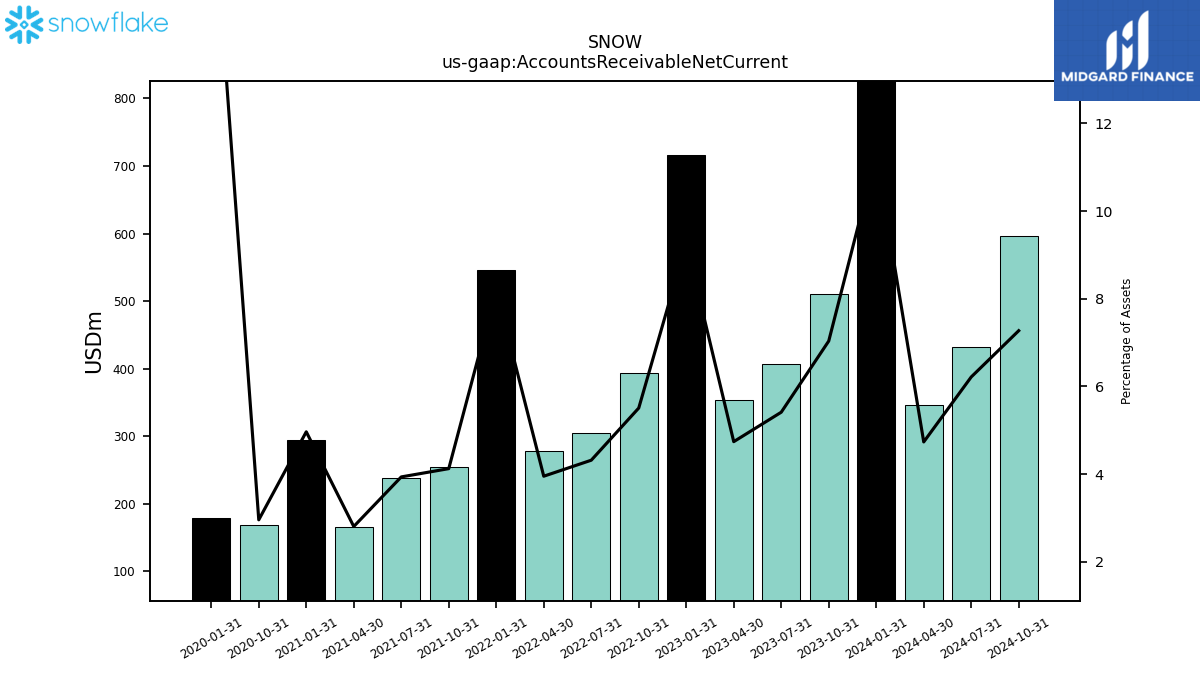
| Accounts Receivable Net Current | 511.03 | 406.40 | 352.99 | 715.82 | 394.06 | 304.96 | 277.56 | 545.63 | 254.24 | 237.46 | 166.34 | 294.02 | 168.98 | NA | NA | 179.46 | NA | |
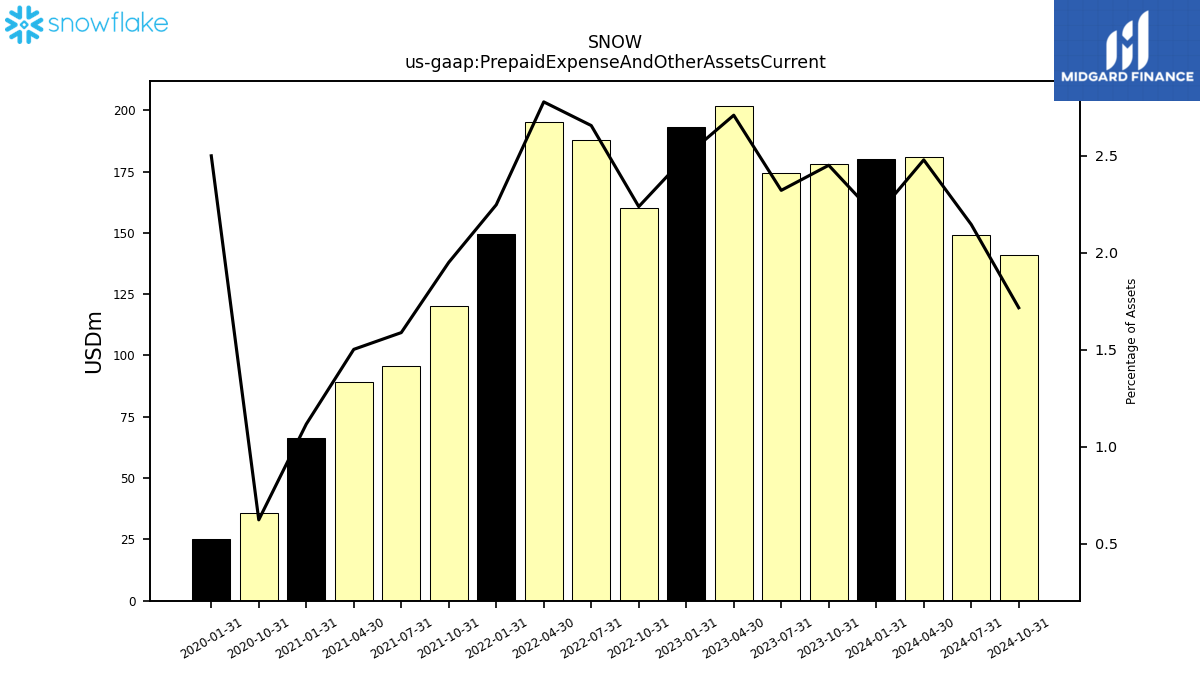
| Prepaid Expense And Other Assets Current | 178.14 | 174.44 | 201.82 | 193.10 | 160.22 | 187.69 | 195.15 | 149.52 | 120.29 | 95.89 | 89.13 | 66.20 | 35.68 | NA | NA | 25.33 | NA | |
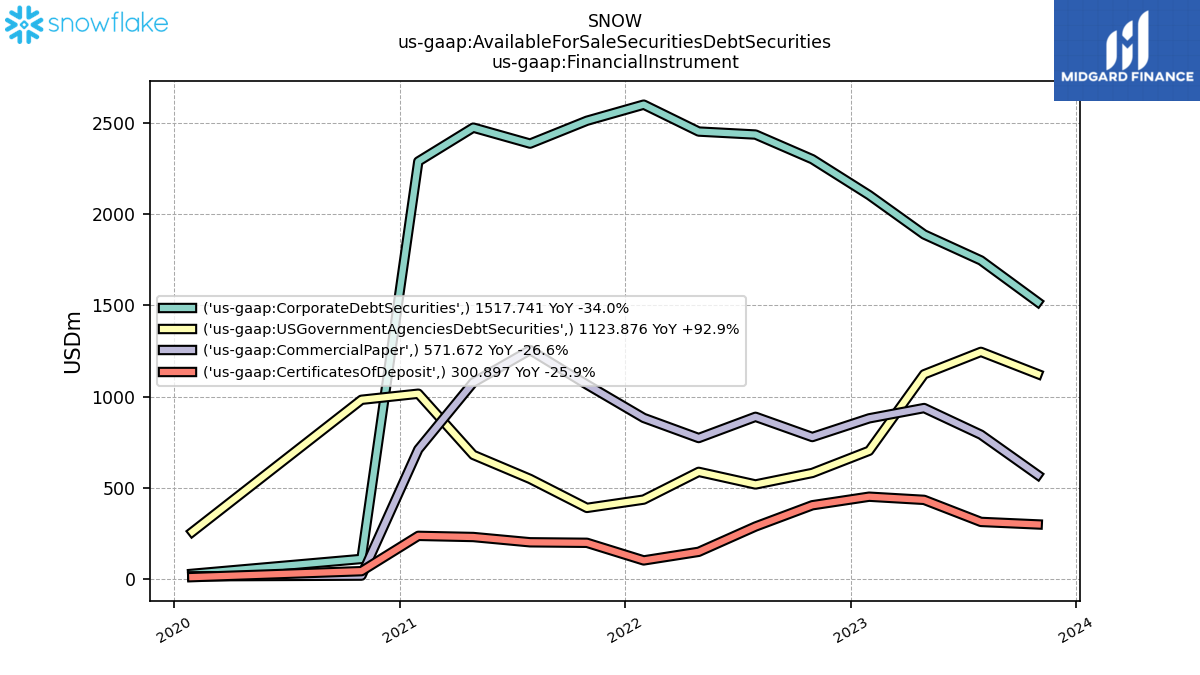
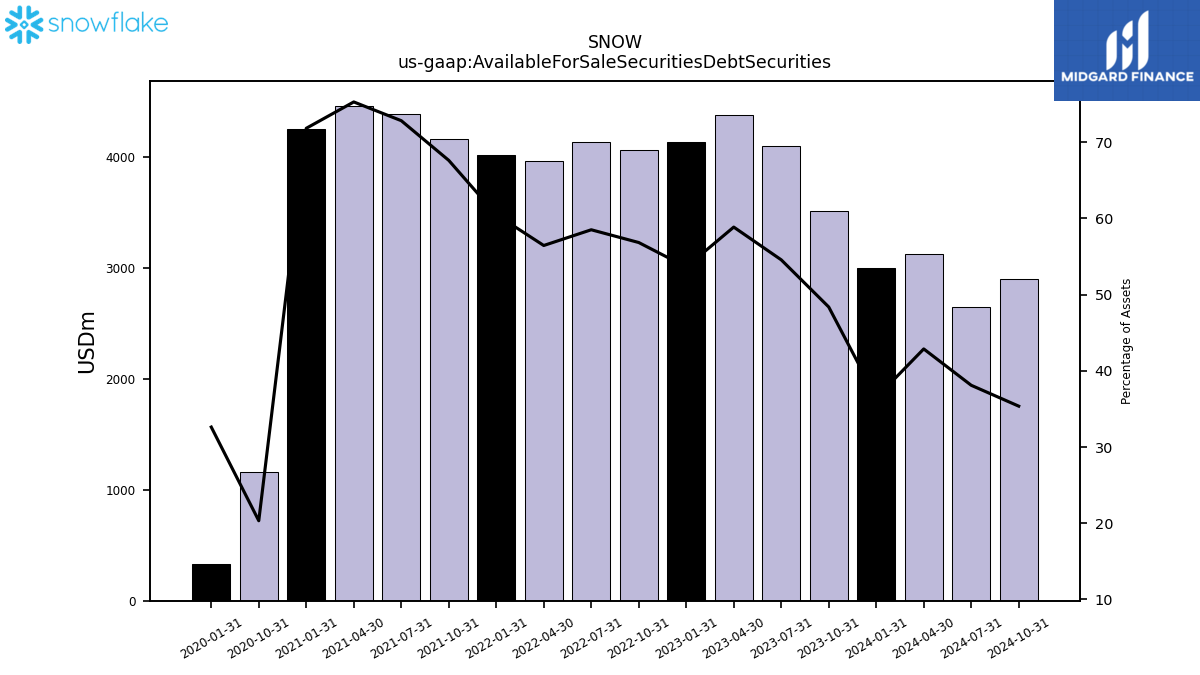
| Available For Sale Securities Debt Securities | 3514.19 | 4097.69 | 4383.23 | 4140.99 | 4066.96 | 4133.16 | 3964.06 | 4022.57 | 4167.47 | 4392.95 | 4463.43 | 4253.16 | 1161.53 | NA | NA | 330.38 | NA |
| 2023-10-31 | 2023-07-31 | 2023-04-30 | 2023-01-31 | 2022-10-31 | 2022-07-31 | 2022-04-30 | 2022-01-31 | 2021-10-31 | 2021-07-31 | 2021-04-30 | 2021-01-31 | 2020-10-31 | 2020-07-31 | 2020-04-30 | 2020-01-31 | 2019-10-31 | ||
|---|---|---|---|---|---|---|---|---|---|---|---|---|---|---|---|---|---|---|
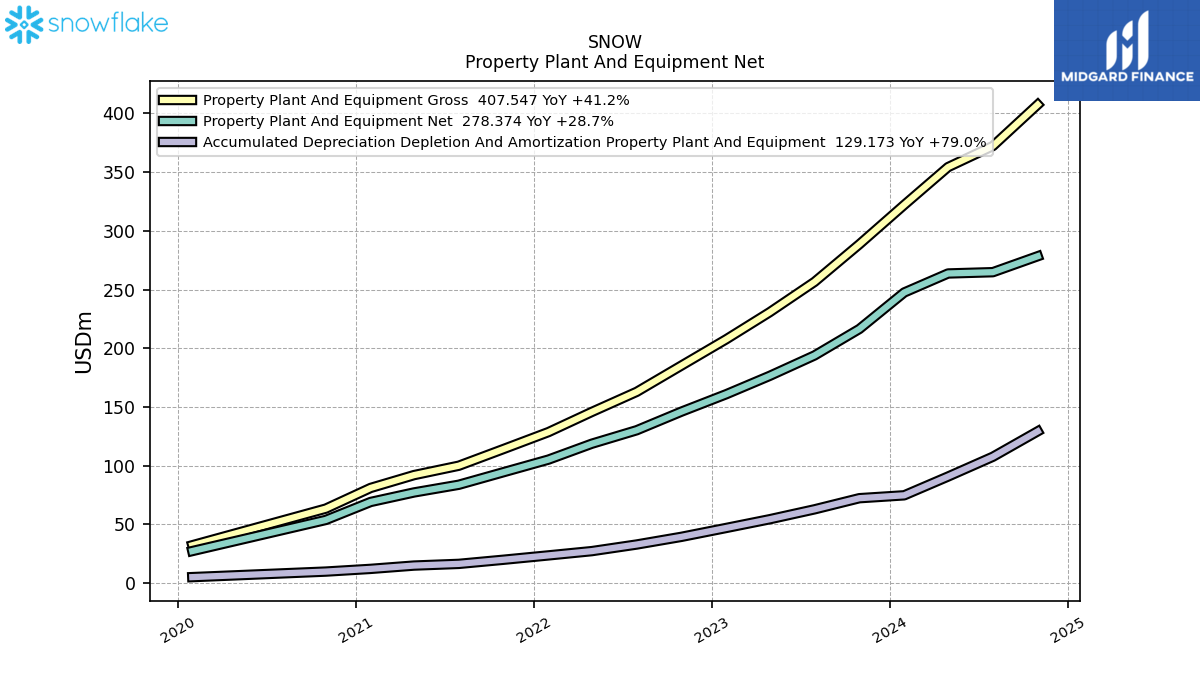
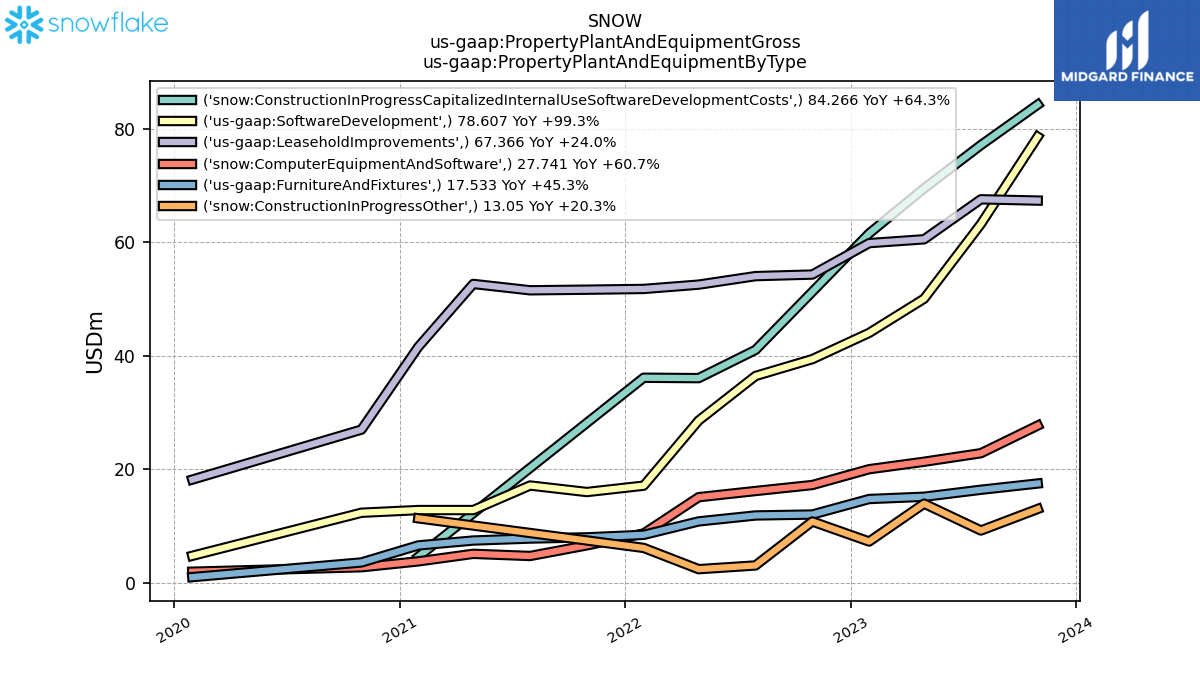
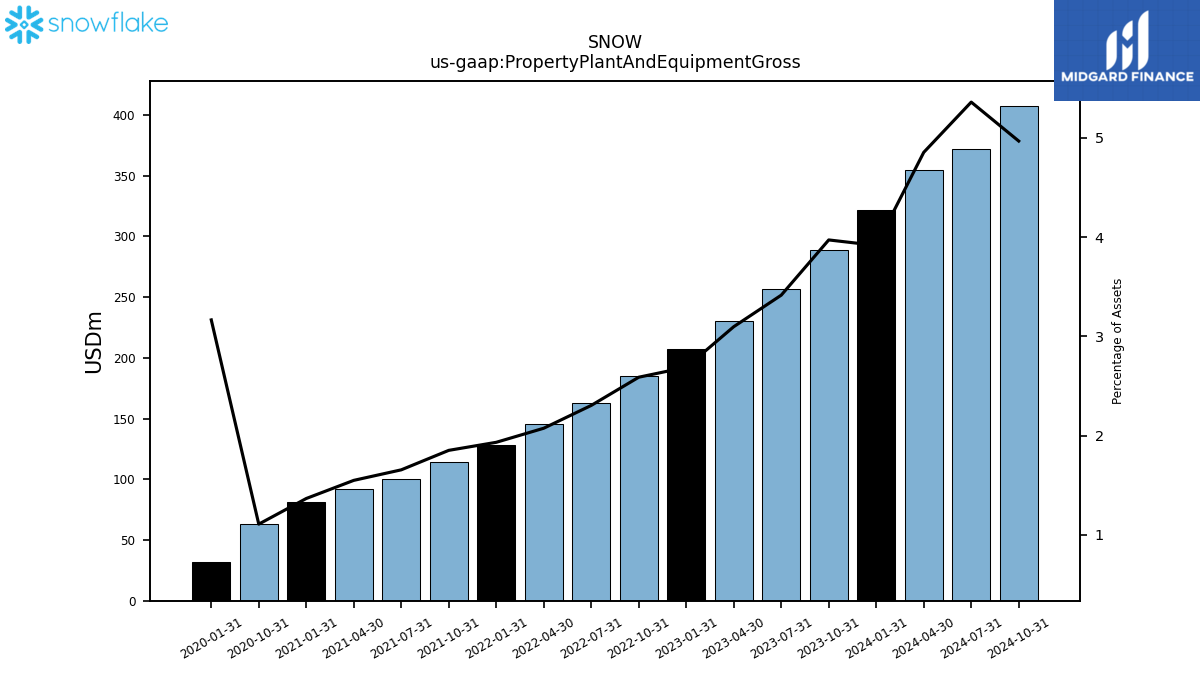
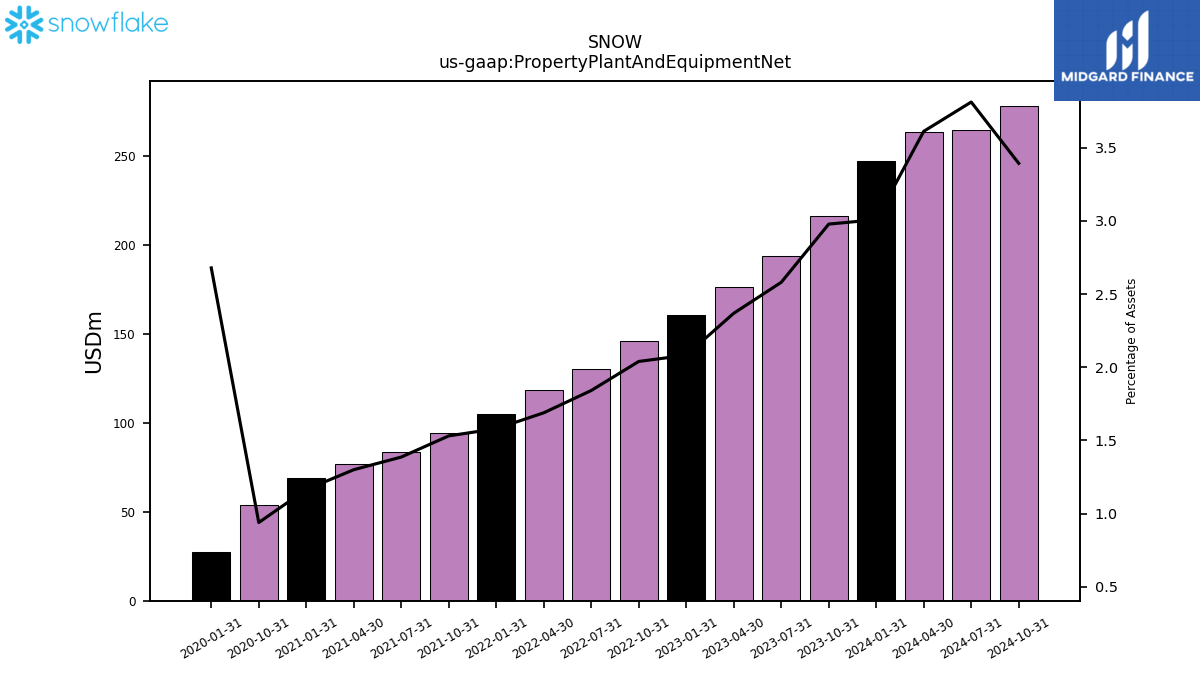
| Property Plant And Equipment Gross | 288.56 | 256.52 | 230.69 | 207.67 | 185.25 | 162.80 | 145.70 | 128.53 | 114.13 | 99.86 | 91.86 | 80.92 | 63.31 | NA | NA | 32.07 | NA | |
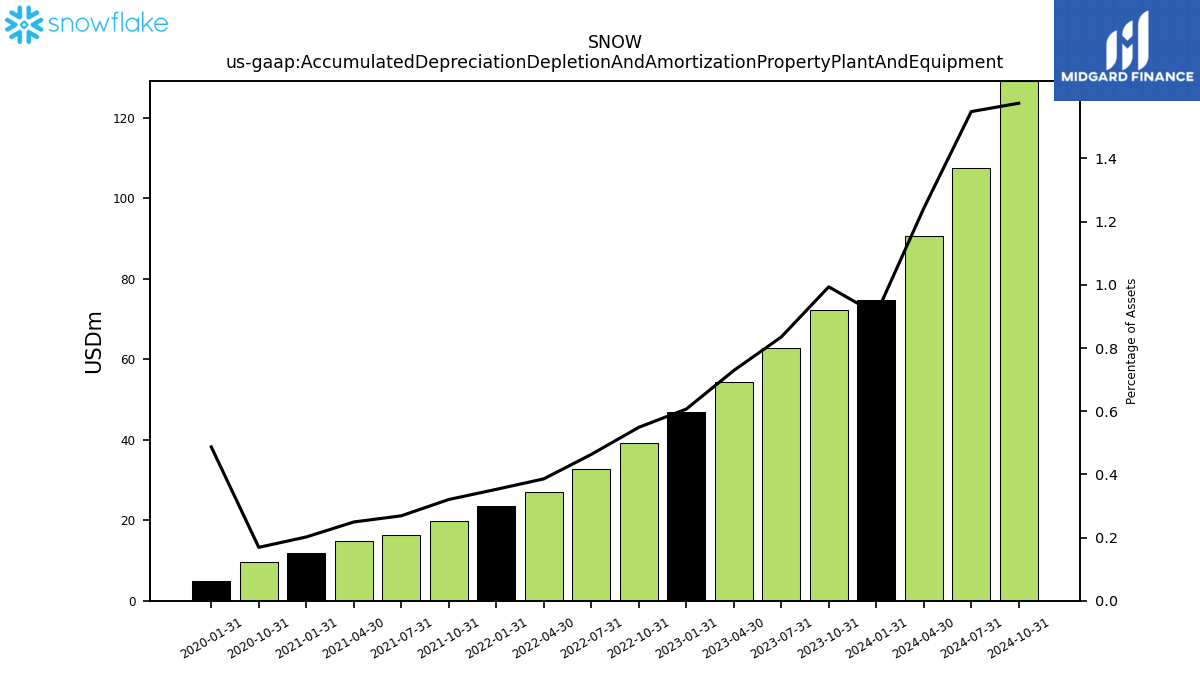
| Accumulated Depreciation Depletion And Amortization Property Plant And Equipment | 72.18 | 62.69 | 54.26 | 46.85 | 39.27 | 32.72 | 27.09 | 23.45 | 19.75 | 16.22 | 14.78 | 11.95 | 9.66 | NA | NA | 4.93 | NA | |
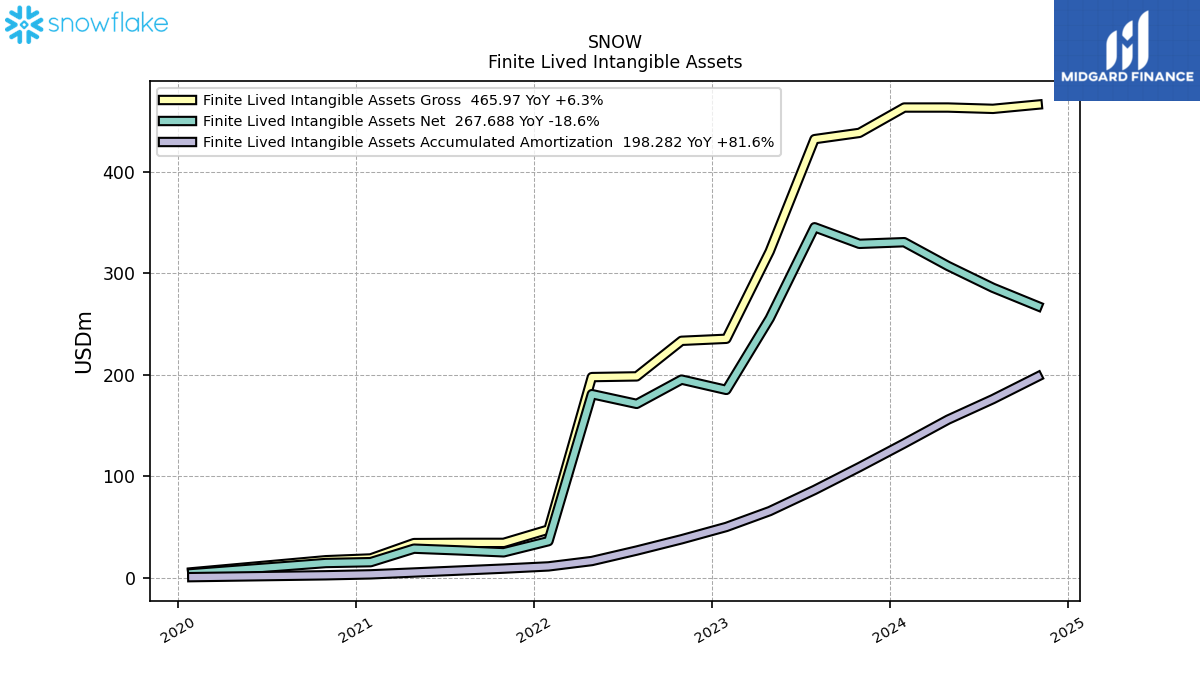
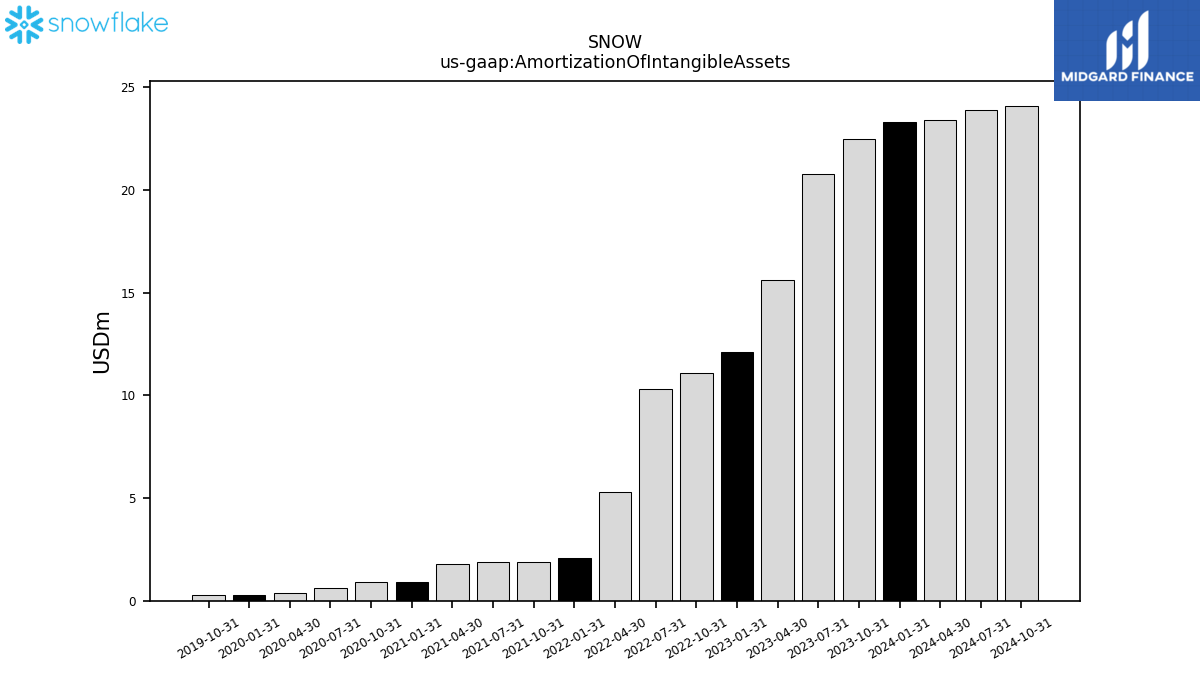
| Amortization Of Intangible Assets | 22.50 | 20.80 | 15.60 | 12.10 | 11.10 | 10.30 | 5.30 | 2.10 | 1.90 | 1.90 | 1.80 | 0.90 | 0.90 | 0.60 | 0.40 | 0.30 | 0.30 | |
| Property Plant And Equipment Net | 216.38 | 193.82 | 176.43 | 160.82 | 145.97 | 130.08 | 118.61 | 105.08 | 94.38 | 83.64 | 77.08 | 68.97 | 53.65 | NA | NA | 27.14 | NA | |
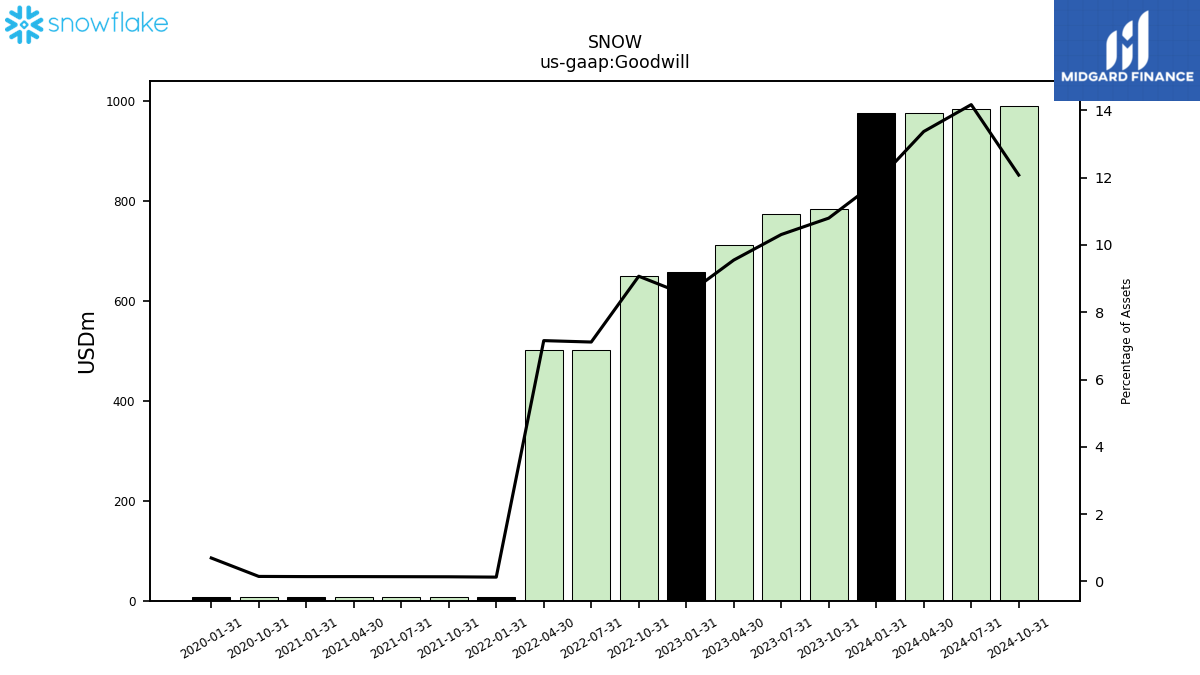
| Goodwill | 784.40 | 774.30 | 711.25 | 657.37 | 649.09 | 502.61 | 502.61 | 8.45 | 8.45 | 8.45 | 8.45 | 8.45 | 8.45 | NA | NA | 7.05 | NA | |
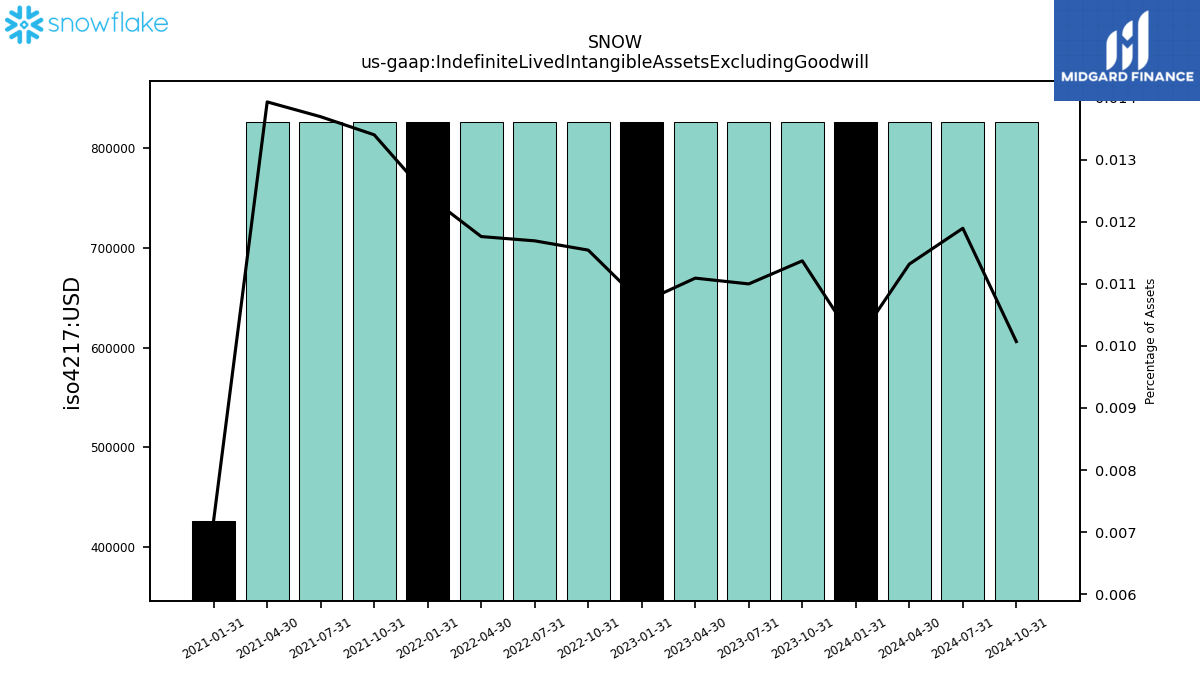
| Indefinite Lived Intangible Assets Excluding Goodwill | 0.83 | 0.83 | 0.83 | 0.83 | 0.83 | 0.83 | 0.83 | 0.83 | 0.83 | 0.83 | 0.83 | 0.43 | NA | NA | NA | NA | NA | |
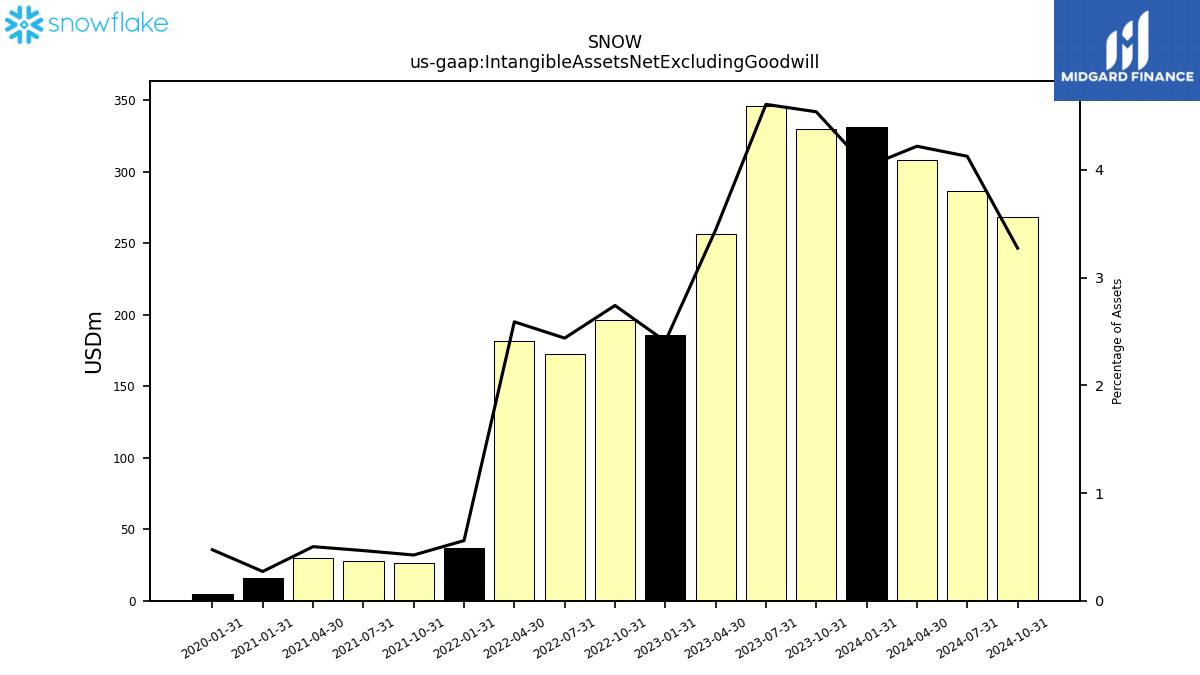
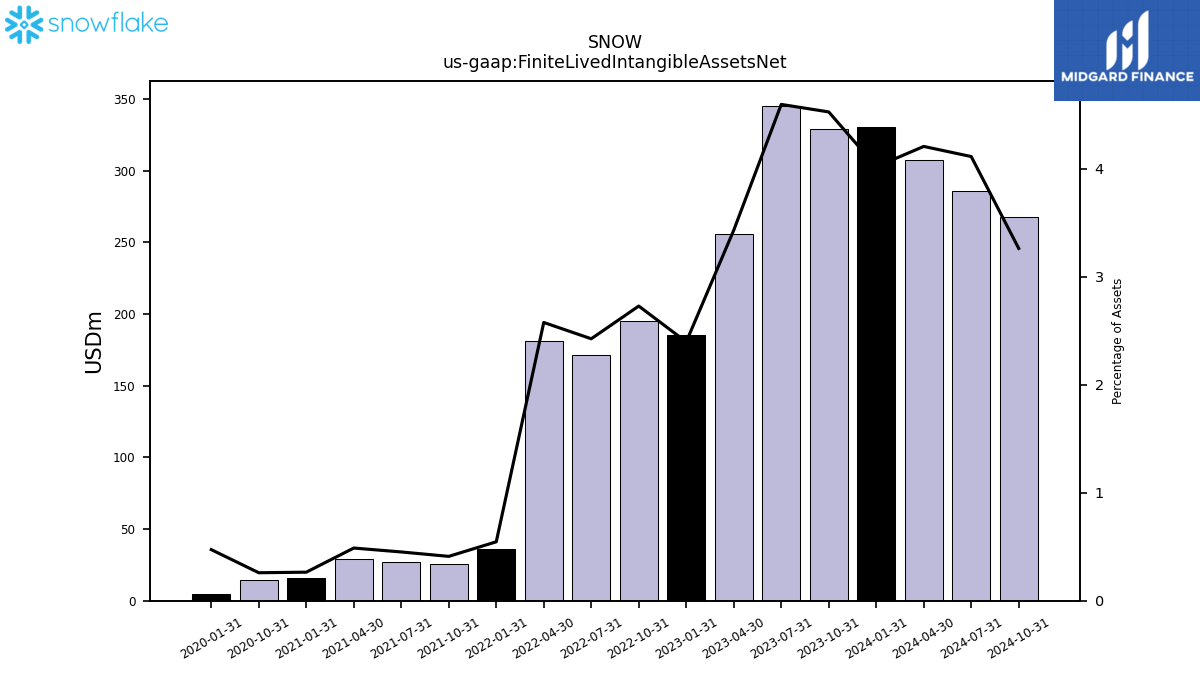
| Intangible Assets Net Excluding Goodwill | 329.77 | 346.10 | 256.42 | 186.01 | 196.16 | 172.25 | 181.85 | 37.14 | 26.17 | 28.09 | 29.77 | 16.09 | NA | NA | NA | 4.79 | NA | |
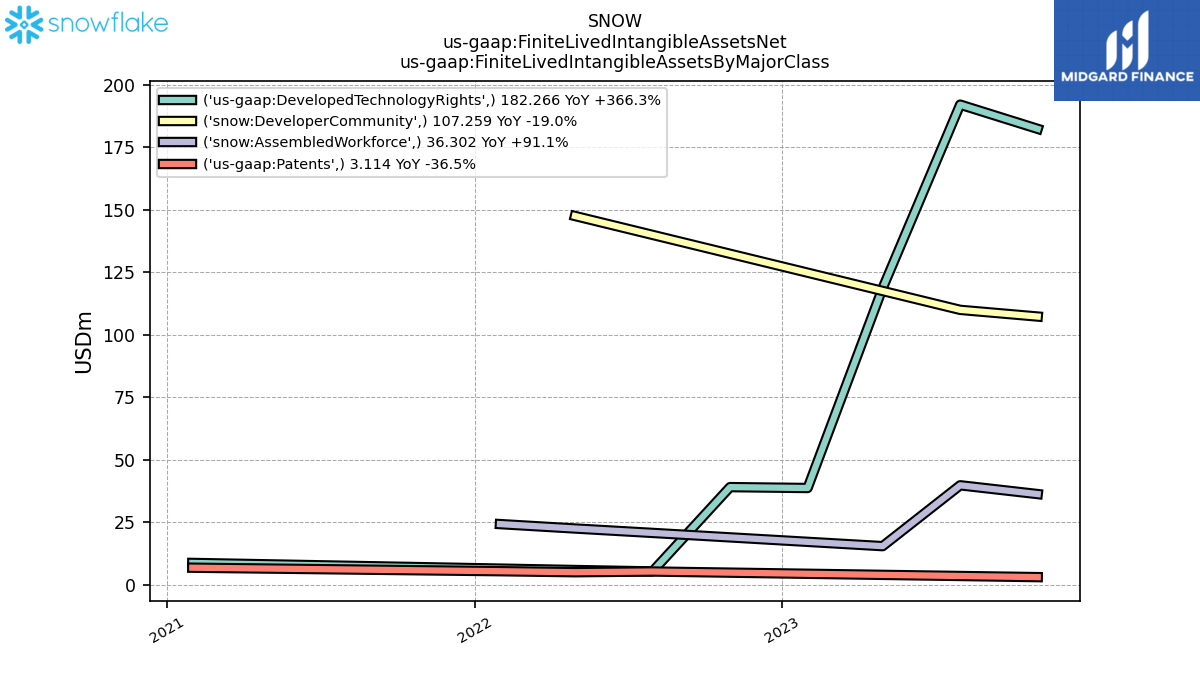
| Finite Lived Intangible Assets Net | 328.94 | 345.27 | 255.59 | 185.19 | 195.34 | 171.43 | 181.03 | 36.31 | 25.34 | 27.26 | 28.95 | 15.66 | 14.82 | NA | NA | 4.79 | NA | |
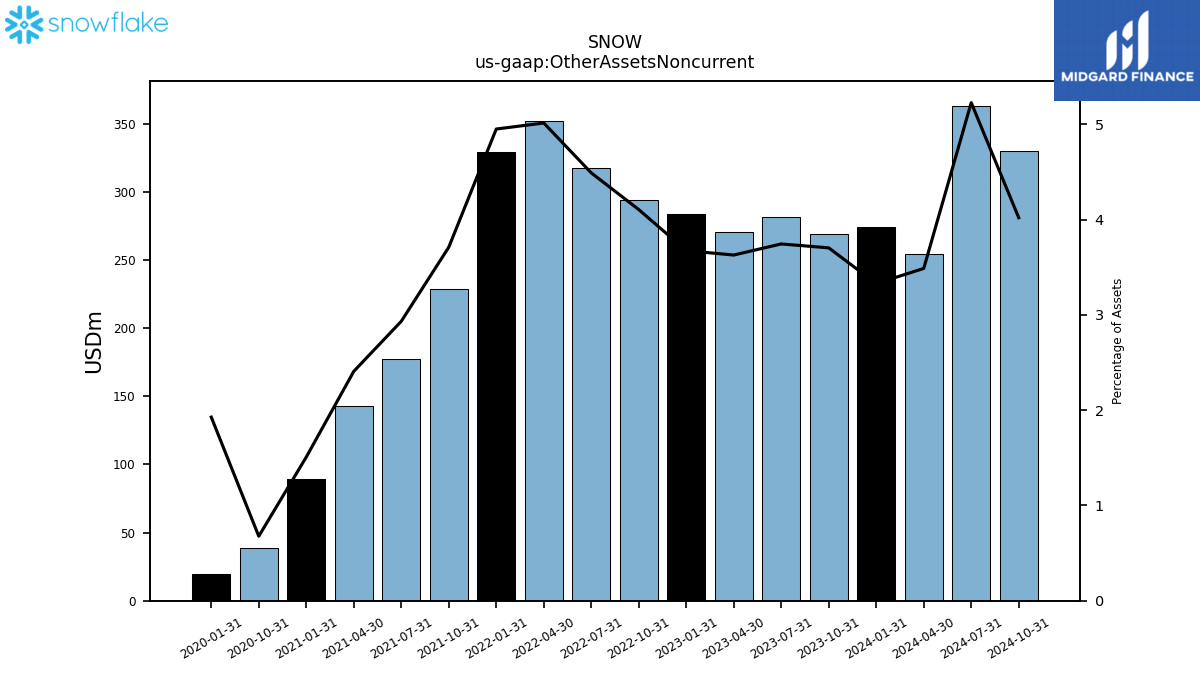
| Other Assets Noncurrent | 269.12 | 281.31 | 270.26 | 283.85 | 293.86 | 317.32 | 352.23 | 329.31 | 228.75 | 176.97 | 142.79 | 89.32 | 38.70 | NA | NA | 19.52 | NA | |
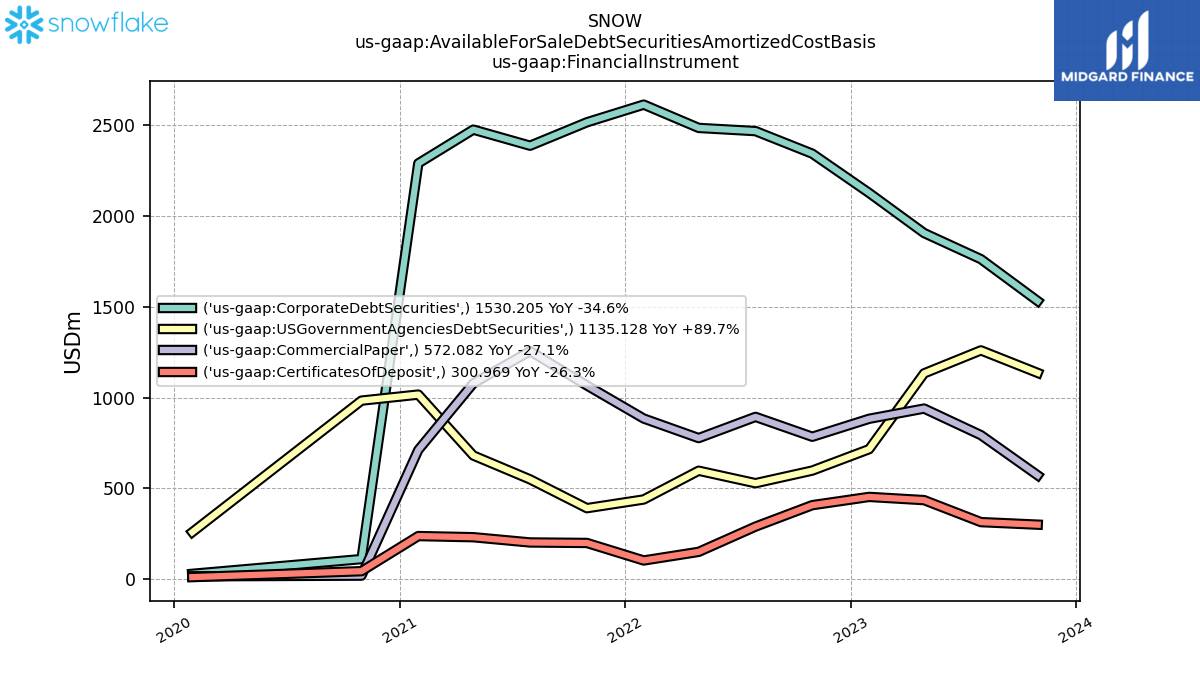
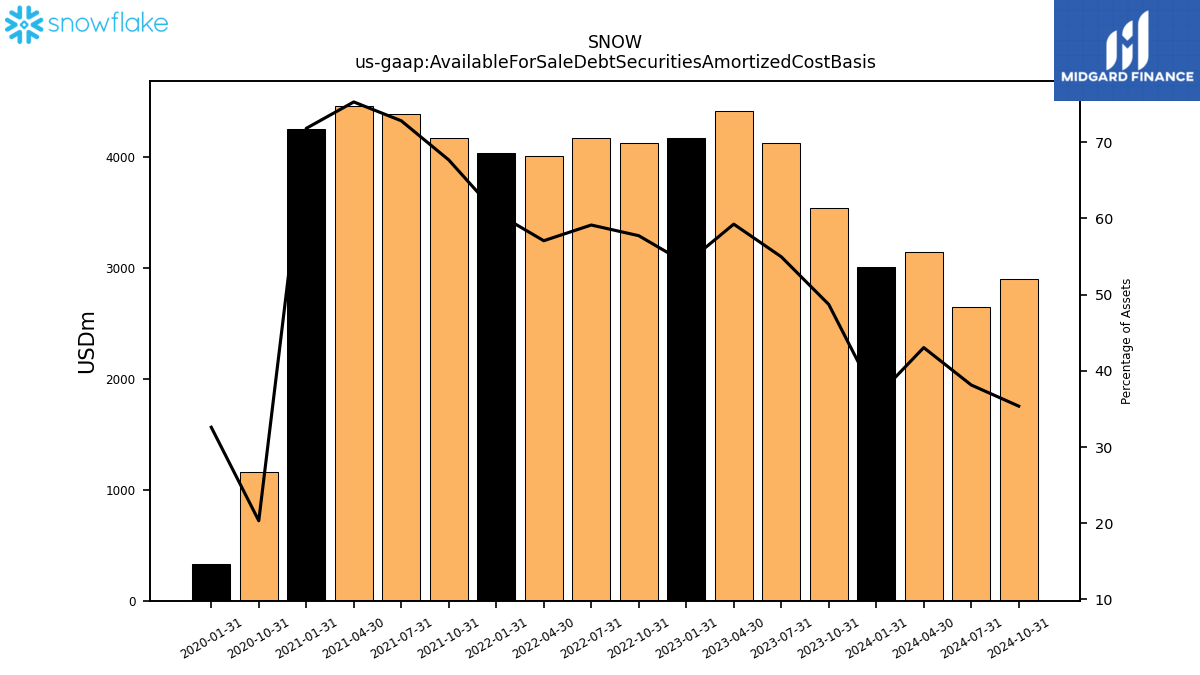
| Available For Sale Debt Securities Amortized Cost Basis | 3538.38 | 4127.81 | 4411.78 | 4176.98 | 4131.04 | 4177.04 | 4007.74 | 4037.94 | 4170.90 | 4392.12 | 4463.41 | 4252.73 | 1161.02 | NA | NA | 330.08 | NA |
| 2023-10-31 | 2023-07-31 | 2023-04-30 | 2023-01-31 | 2022-10-31 | 2022-07-31 | 2022-04-30 | 2022-01-31 | 2021-10-31 | 2021-07-31 | 2021-04-30 | 2021-01-31 | 2020-10-31 | 2020-07-31 | 2020-04-30 | 2020-01-31 | 2019-10-31 | ||
|---|---|---|---|---|---|---|---|---|---|---|---|---|---|---|---|---|---|---|
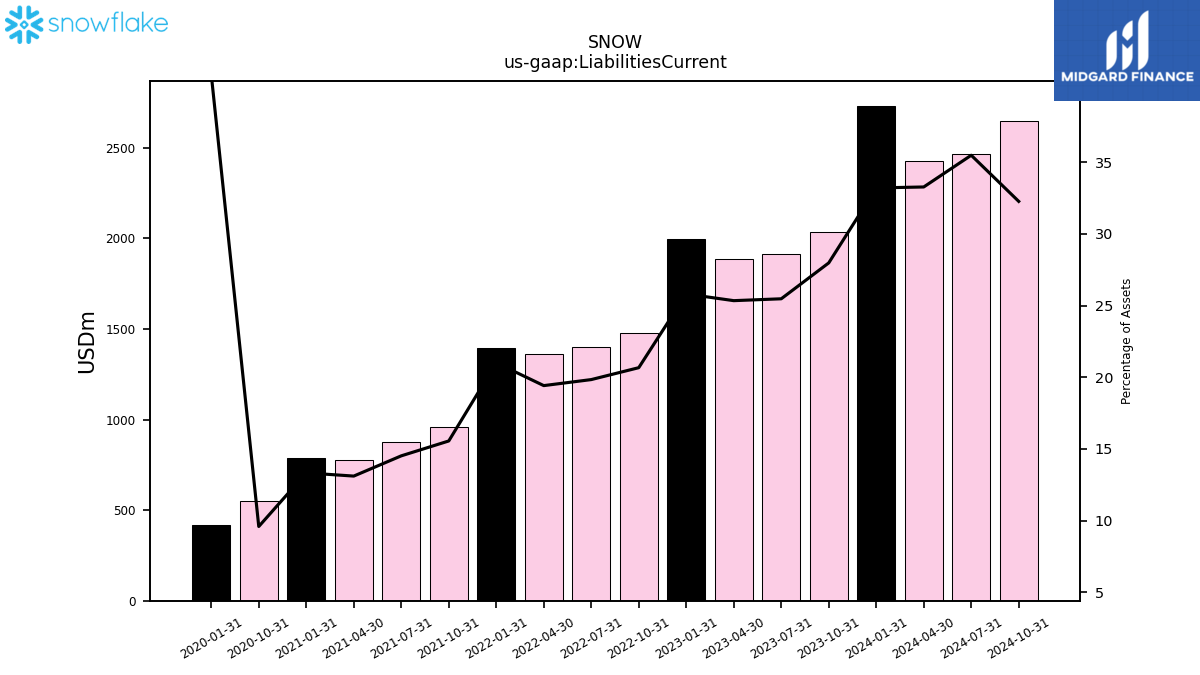
| Liabilities Current | 2032.67 | 1913.31 | 1887.54 | 1993.52 | 1479.04 | 1401.44 | 1363.72 | 1397.09 | 958.74 | 875.74 | 777.00 | 789.26 | 547.66 | NA | NA | 416.45 | NA | |
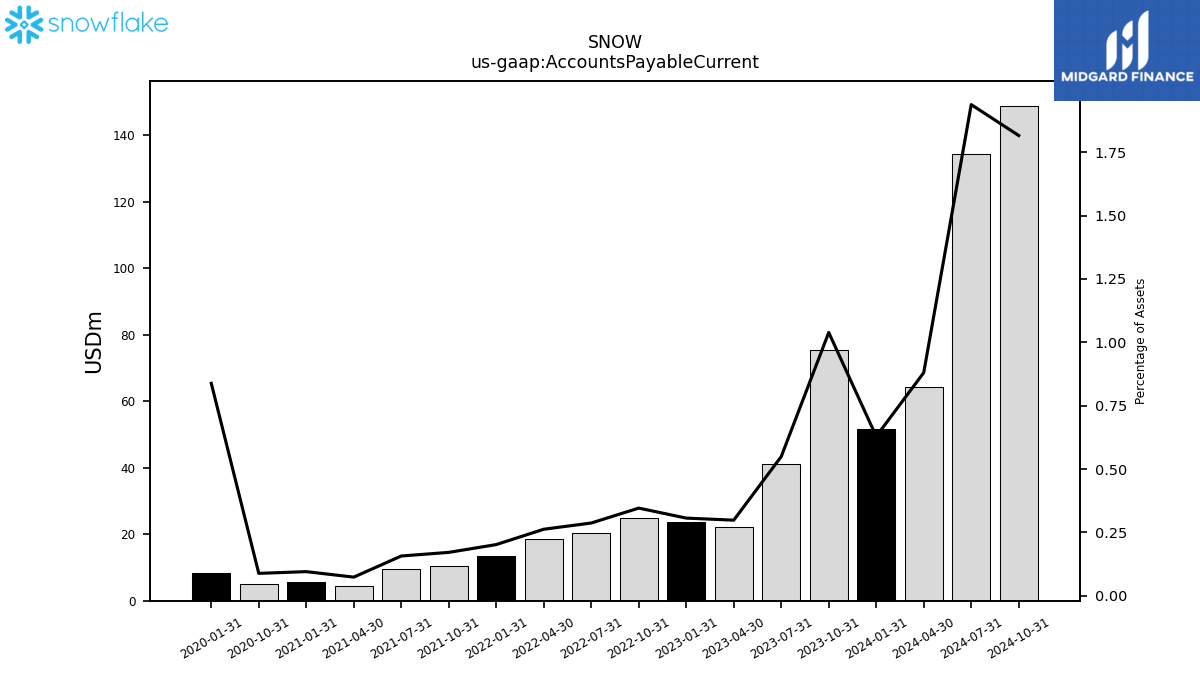
| Accounts Payable Current | 75.46 | 41.25 | 22.22 | 23.67 | 24.76 | 20.29 | 18.44 | 13.44 | 10.56 | 9.47 | 4.37 | 5.65 | 5.06 | NA | NA | 8.49 | NA | |
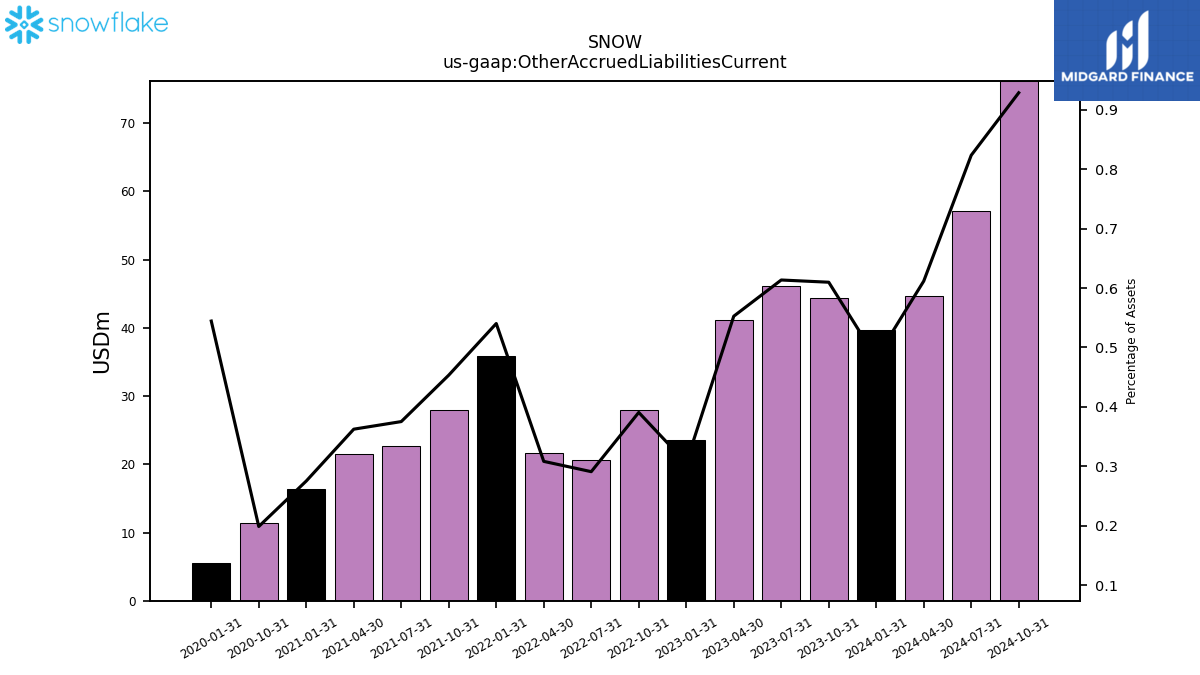
| Other Accrued Liabilities Current | 44.30 | 46.08 | 41.15 | 23.61 | 27.96 | 20.56 | 21.66 | 35.93 | 27.95 | 22.64 | 21.50 | 16.30 | 11.36 | NA | NA | 5.51 | NA | |
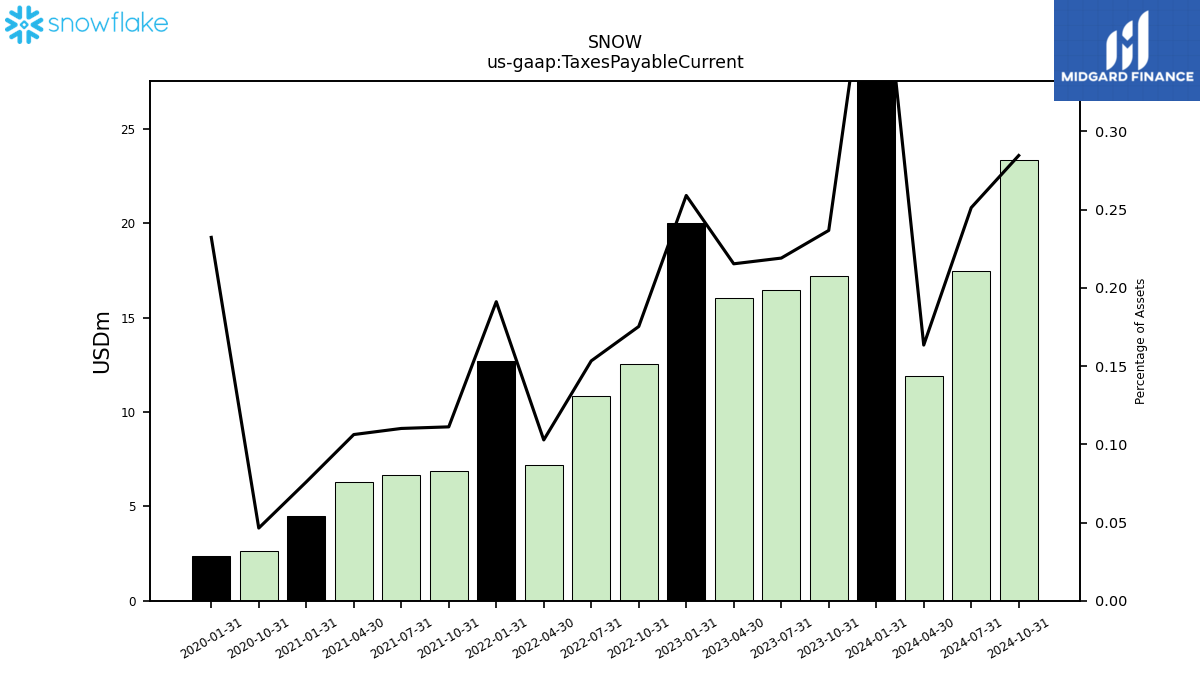
| Taxes Payable Current | 17.19 | 16.45 | 16.04 | 20.00 | 12.54 | 10.83 | 7.22 | 12.71 | 6.85 | 6.64 | 6.30 | 4.50 | 2.65 | NA | NA | 2.35 | NA | |
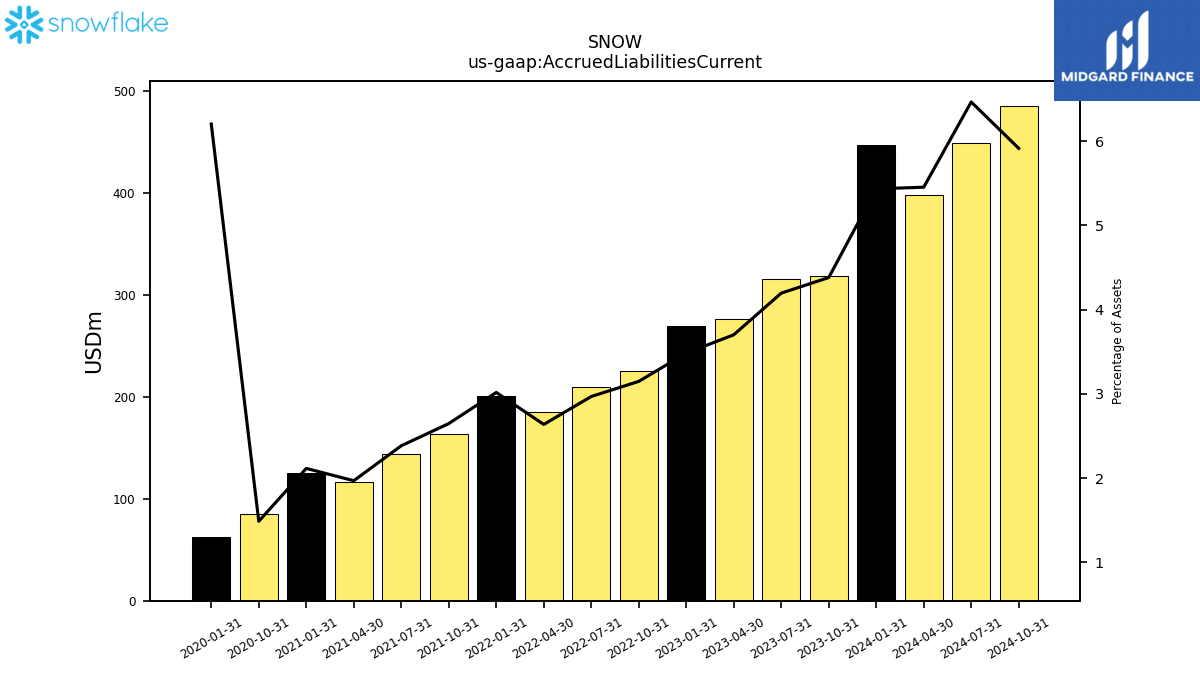
| Accrued Liabilities Current | 318.28 | 315.13 | 275.69 | 269.07 | 225.32 | 209.77 | 185.28 | 200.66 | 163.24 | 143.86 | 116.81 | 125.31 | 85.04 | NA | NA | 62.82 | NA | |
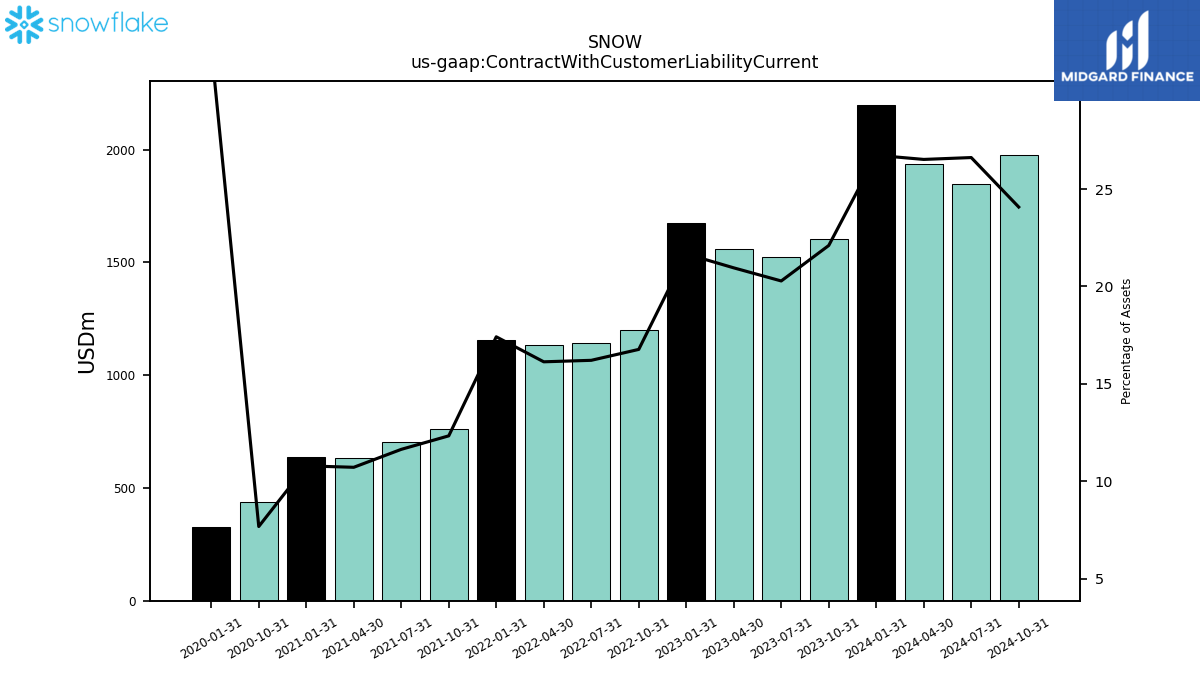
| Contract With Customer Liability Current | 1605.59 | 1523.09 | 1560.44 | 1673.47 | 1199.70 | 1144.77 | 1132.70 | 1157.89 | 759.74 | 701.76 | 635.09 | 638.65 | 438.23 | NA | NA | 327.06 | NA |
| 2023-10-31 | 2023-07-31 | 2023-04-30 | 2023-01-31 | 2022-10-31 | 2022-07-31 | 2022-04-30 | 2022-01-31 | 2021-10-31 | 2021-07-31 | 2021-04-30 | 2021-01-31 | 2020-10-31 | 2020-07-31 | 2020-04-30 | 2020-01-31 | 2019-10-31 | ||
|---|---|---|---|---|---|---|---|---|---|---|---|---|---|---|---|---|---|---|
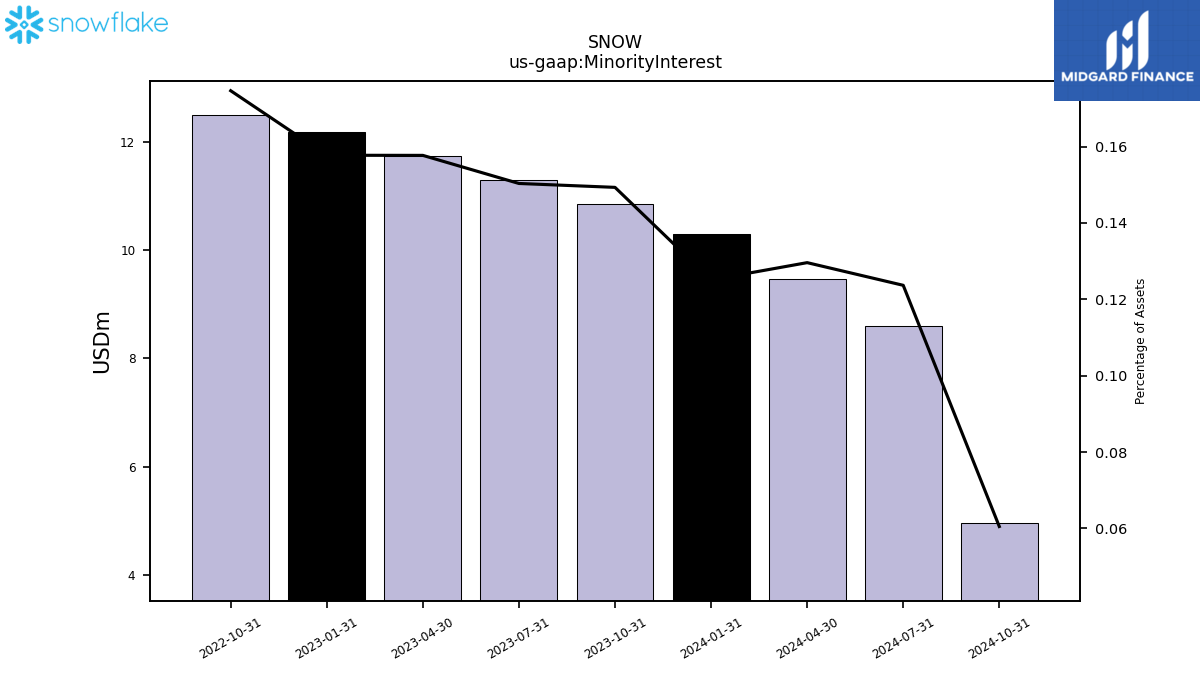
| Minority Interest | 10.85 | 11.29 | 11.74 | 12.18 | 12.49 | NA | NA | NA | NA | NA | NA | NA | NA | NA | NA | NA | NA | |
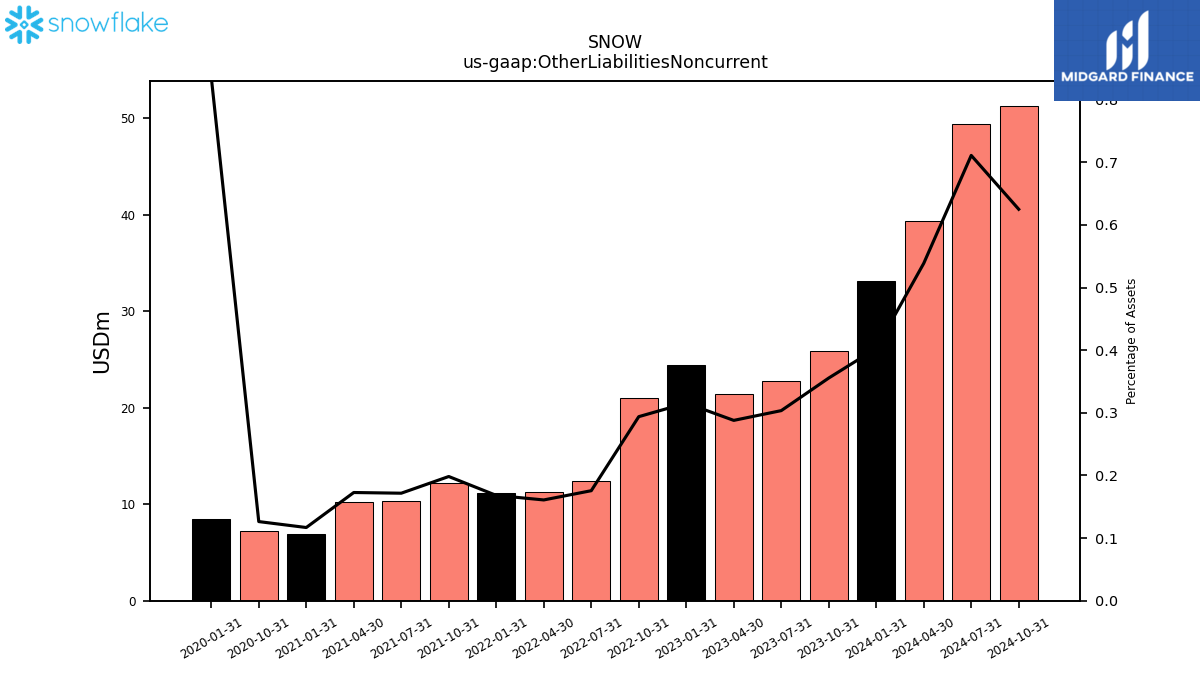
| Other Liabilities Noncurrent | 25.83 | 22.79 | 21.44 | 24.37 | 21.03 | 12.41 | 11.30 | 11.18 | 12.22 | 10.36 | 10.24 | 6.92 | 7.22 | NA | NA | 8.47 | NA | |
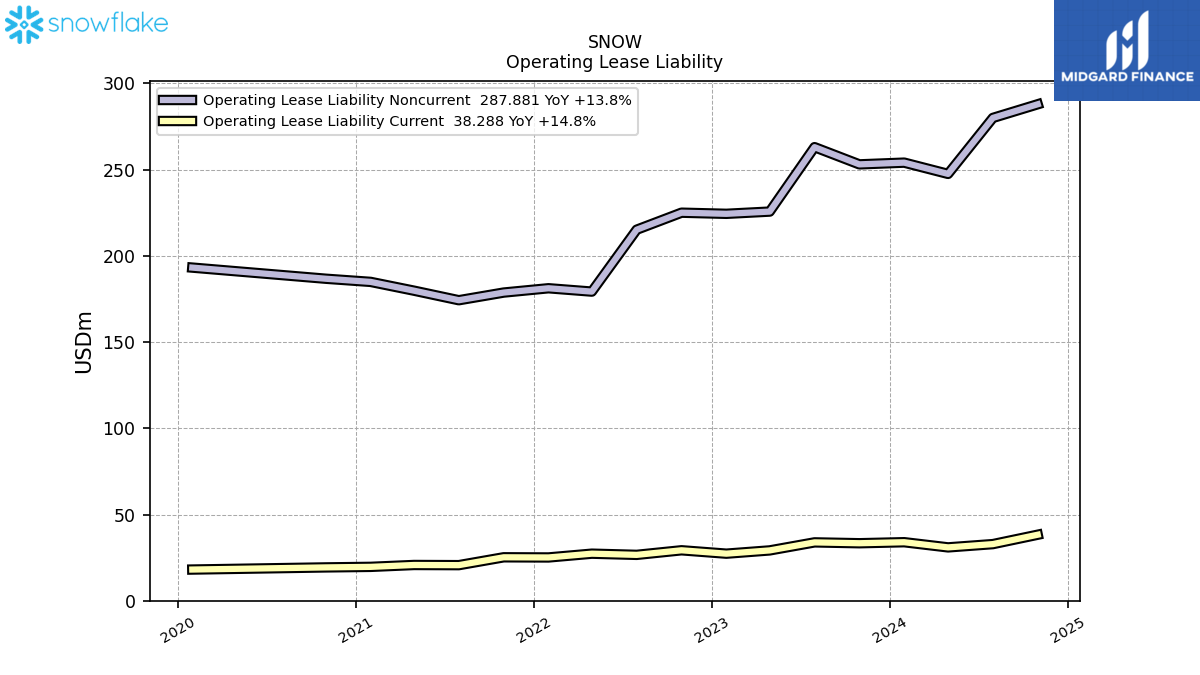
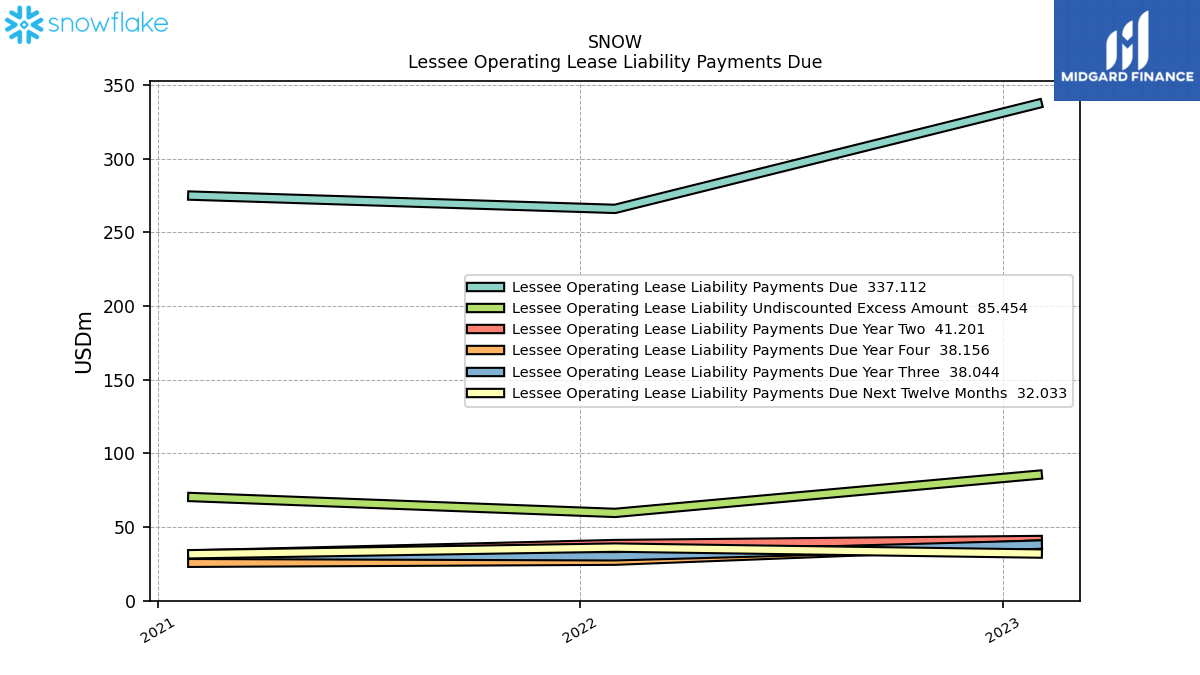
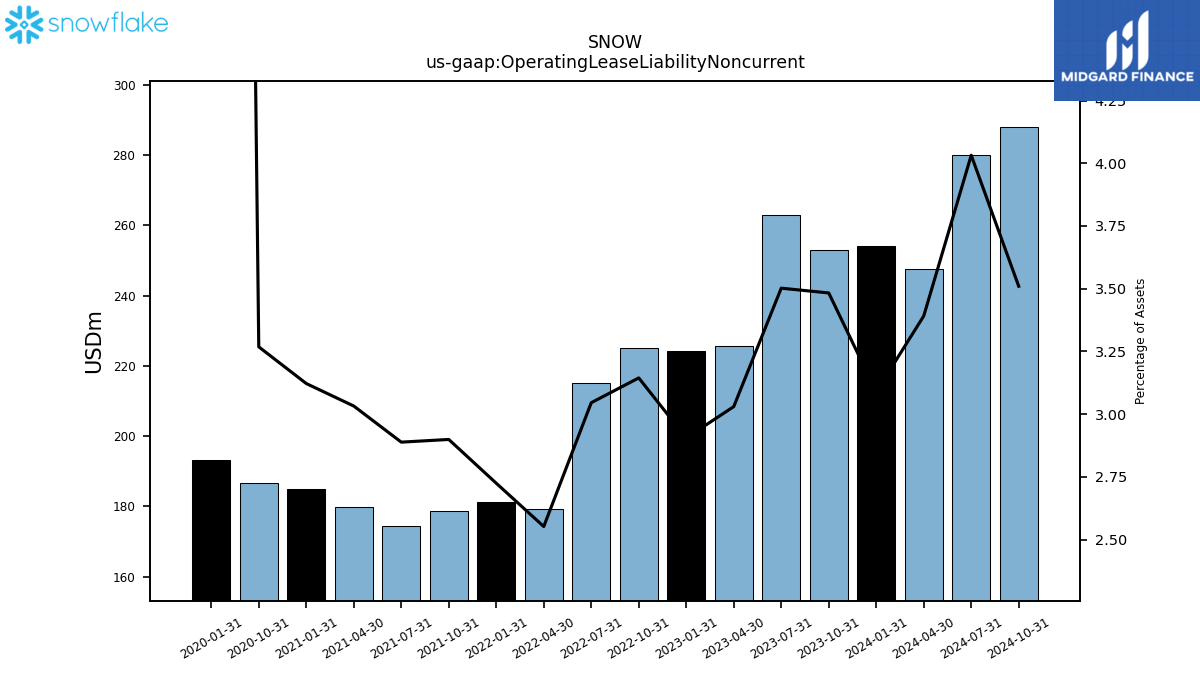
| Operating Lease Liability Noncurrent | 253.03 | 263.01 | 225.65 | 224.36 | 225.01 | 215.15 | 179.25 | 181.20 | 178.70 | 174.26 | 179.80 | 184.89 | 186.72 | NA | NA | 193.18 | NA |
| 2023-10-31 | 2023-07-31 | 2023-04-30 | 2023-01-31 | 2022-10-31 | 2022-07-31 | 2022-04-30 | 2022-01-31 | 2021-10-31 | 2021-07-31 | 2021-04-30 | 2021-01-31 | 2020-10-31 | 2020-07-31 | 2020-04-30 | 2020-01-31 | 2019-10-31 | ||
|---|---|---|---|---|---|---|---|---|---|---|---|---|---|---|---|---|---|---|
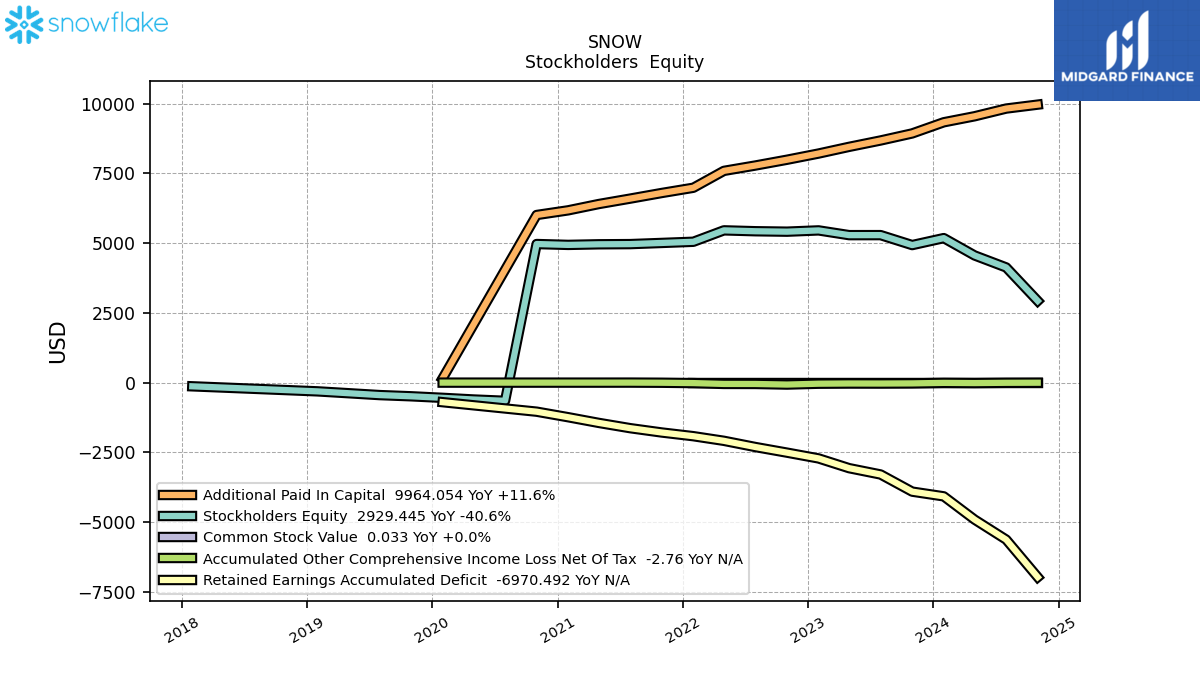
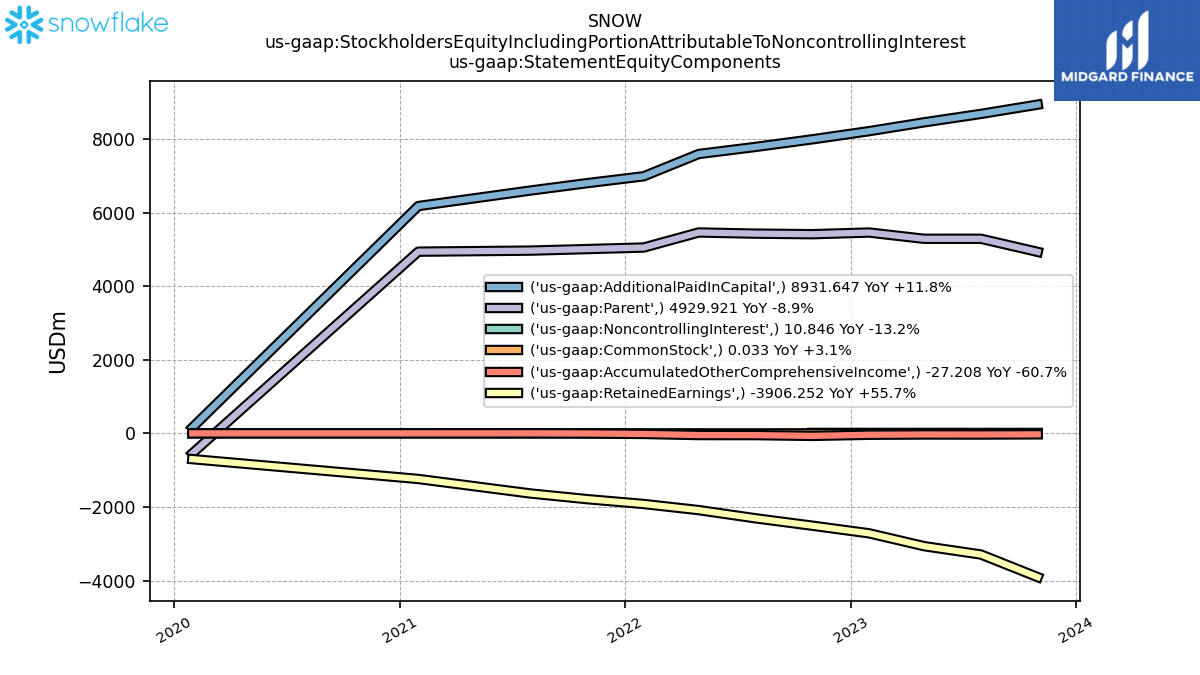
| Stockholders Equity | 4929.92 | 5286.94 | 5286.24 | 5456.44 | 5410.78 | 5426.32 | 5457.99 | 5049.05 | 5006.68 | 4964.97 | 4958.32 | 4936.47 | 4967.81 | -651.40 | -604.05 | -544.76 | -489.44 | |
| Stockholders Equity Including Portion Attributable To Noncontrolling Interest | 4940.77 | 5298.23 | 5297.98 | 5468.61 | 5423.27 | 5426.32 | 5457.99 | 5049.05 | 5006.68 | 4964.97 | NA | 4936.47 | NA | NA | NA | -544.76 | NA | |
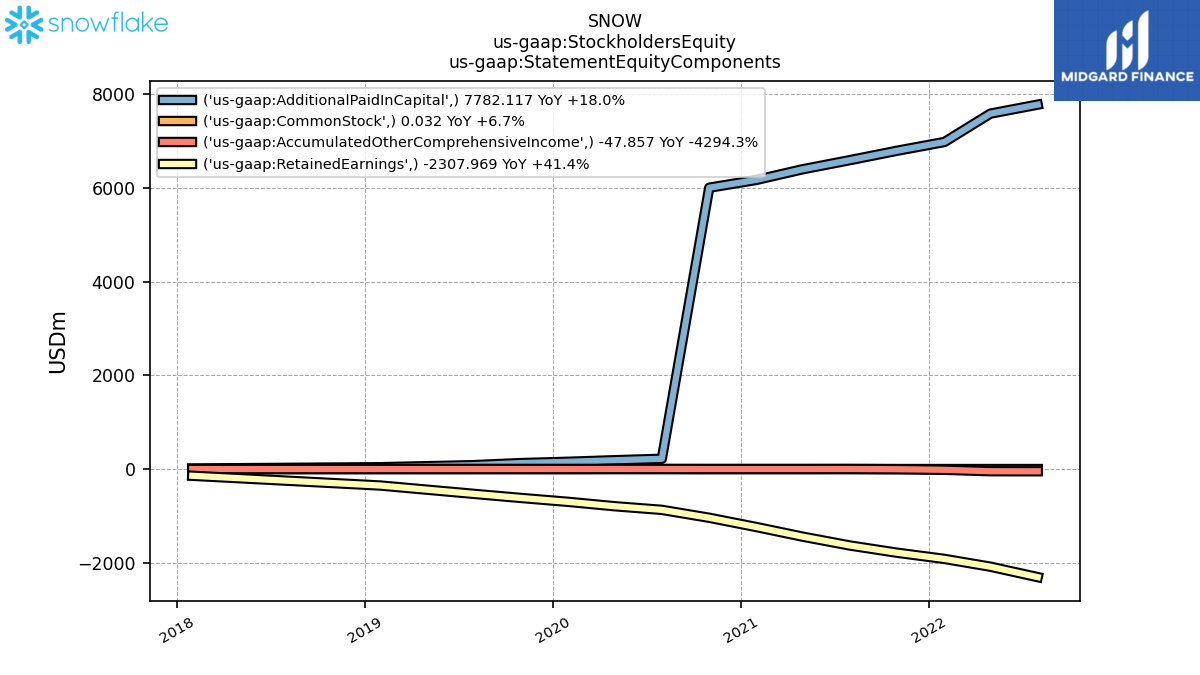
| Common Stock Value | 0.03 | 0.03 | 0.03 | 0.03 | 0.03 | 0.03 | 0.03 | 0.03 | NA | NA | NA | NA | NA | NA | NA | NA | NA | |
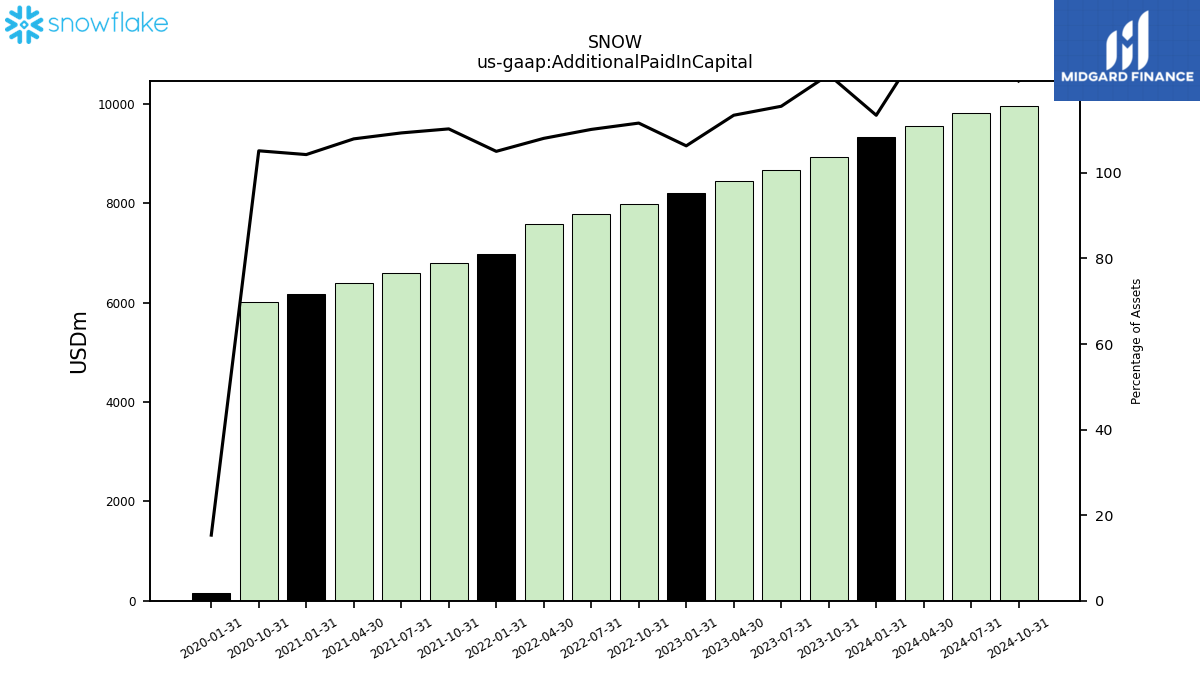
| Additional Paid In Capital | 8931.65 | 8679.41 | 8450.43 | 8210.75 | 7988.83 | 7782.12 | 7589.71 | 6984.67 | 6797.35 | 6596.15 | 6400.57 | 6175.43 | 6007.90 | NA | NA | 155.34 | NA | |
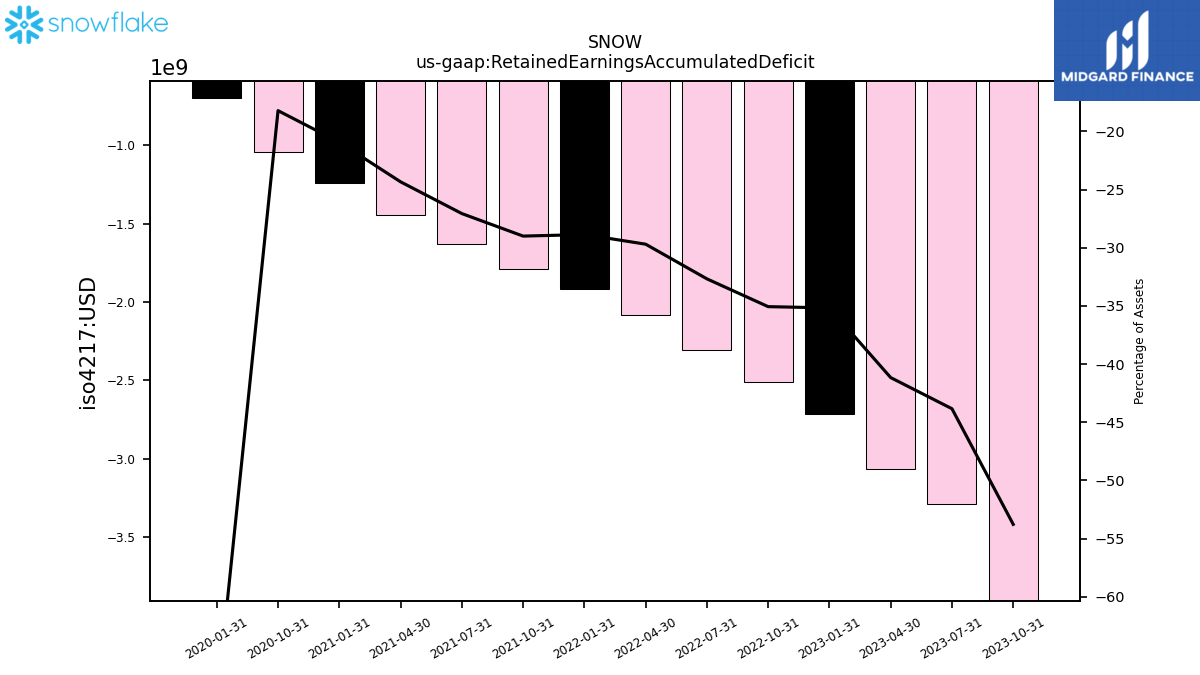
| Retained Earnings Accumulated Deficit | -3906.25 | -3291.96 | -3065.10 | -2716.07 | -2508.91 | -2307.97 | -2085.16 | -1919.37 | -1787.22 | -1632.36 | -1442.64 | -1239.42 | -1040.49 | NA | NA | -700.32 | NA | |
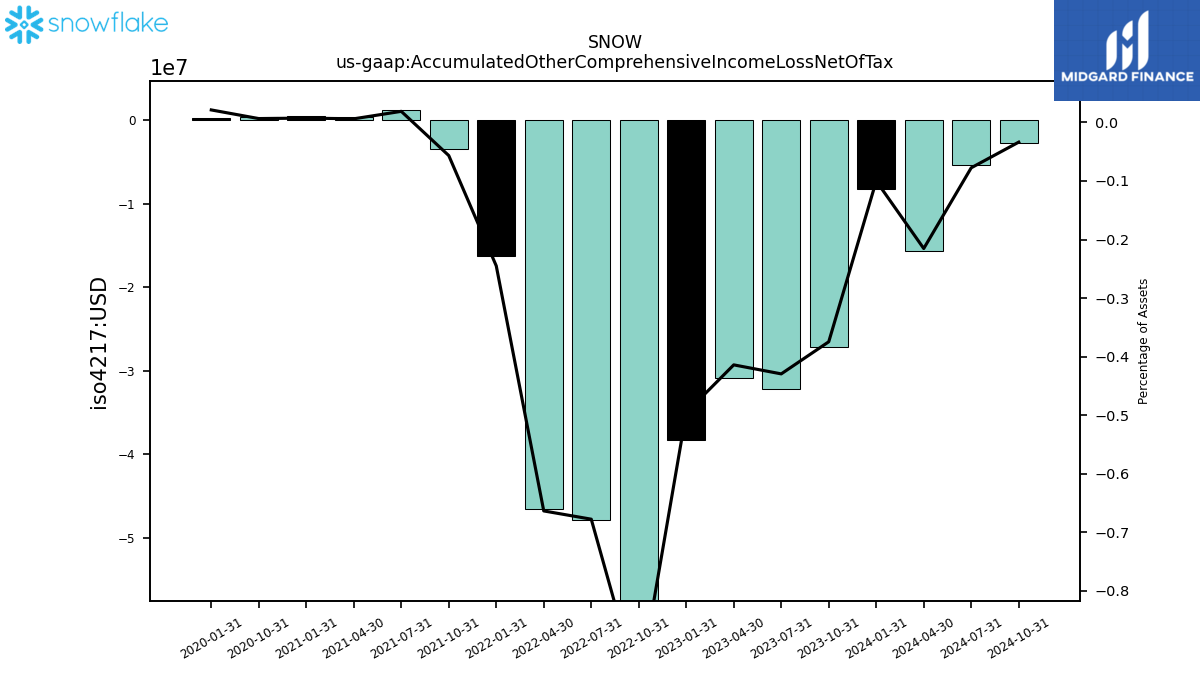
| Accumulated Other Comprehensive Income Loss Net Of Tax | -27.21 | -32.24 | -30.83 | -38.27 | -69.18 | -47.86 | -46.59 | -16.29 | -3.49 | 1.14 | 0.37 | 0.44 | 0.38 | NA | NA | 0.22 | NA | |
| Minority Interest | 10.85 | 11.29 | 11.74 | 12.18 | 12.49 | NA | NA | NA | NA | NA | NA | NA | NA | NA | NA | NA | NA | |
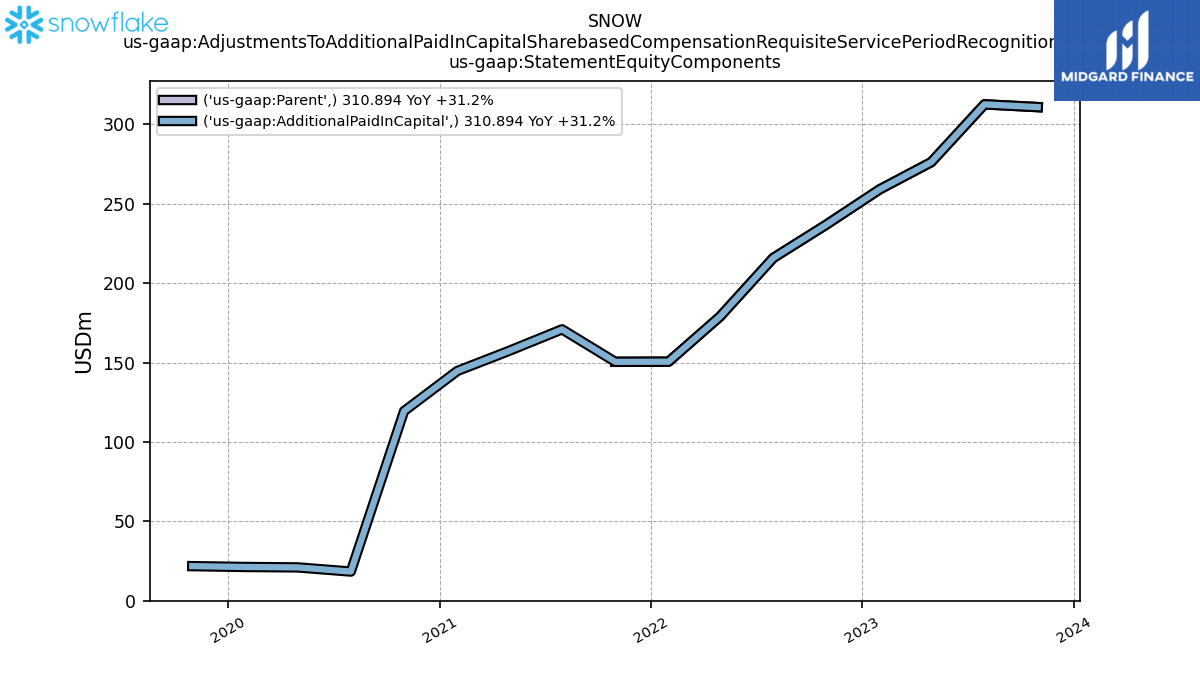
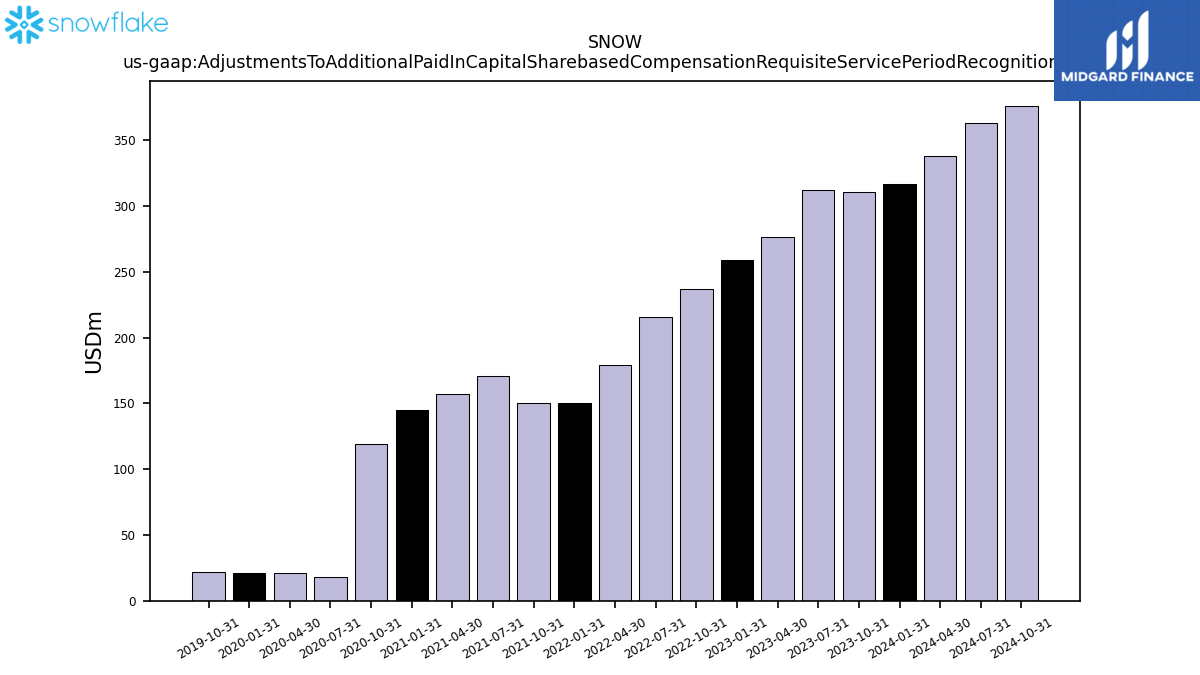
| Adjustments To Additional Paid In Capital Sharebased Compensation Requisite Service Period Recognition Value | 310.89 | 312.62 | 276.23 | 259.11 | 236.96 | 215.90 | 178.99 | 150.56 | 150.47 | 170.93 | 157.31 | 144.70 | 119.42 | 18.38 | 21.00 | 21.27 | 21.79 |
| 2023-10-31 | 2023-07-31 | 2023-04-30 | 2023-01-31 | 2022-10-31 | 2022-07-31 | 2022-04-30 | 2022-01-31 | 2021-10-31 | 2021-07-31 | 2021-04-30 | 2021-01-31 | 2020-10-31 | 2020-07-31 | 2020-04-30 | 2020-01-31 | 2019-10-31 | ||
|---|---|---|---|---|---|---|---|---|---|---|---|---|---|---|---|---|---|---|
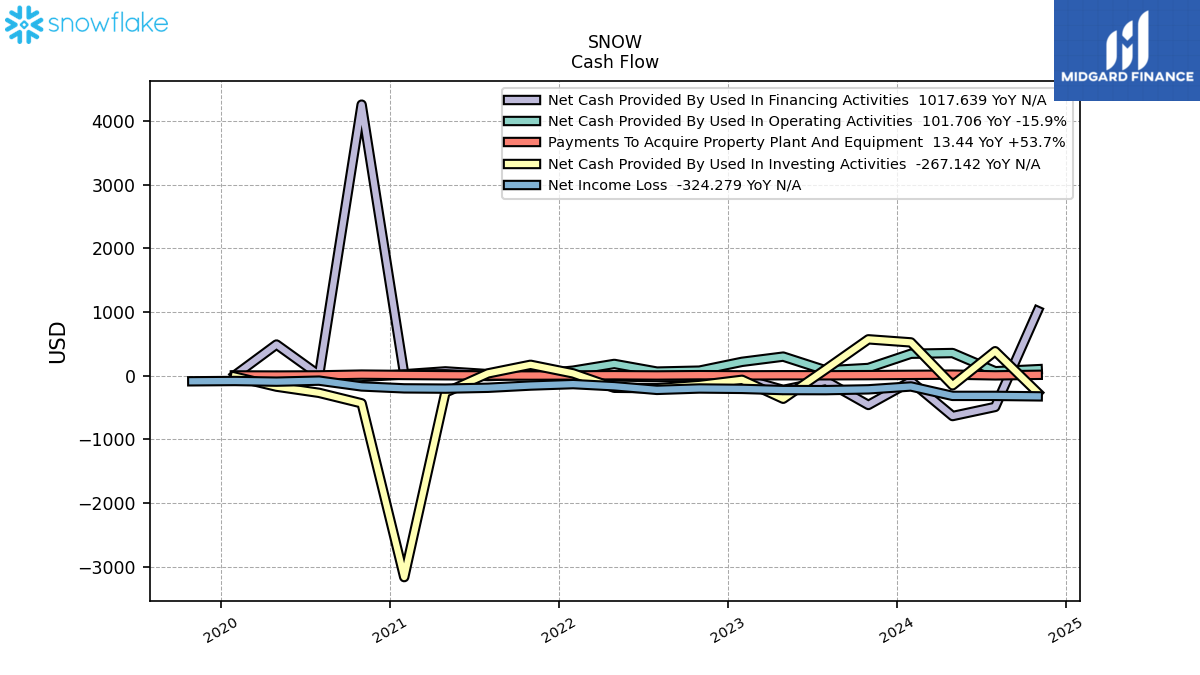
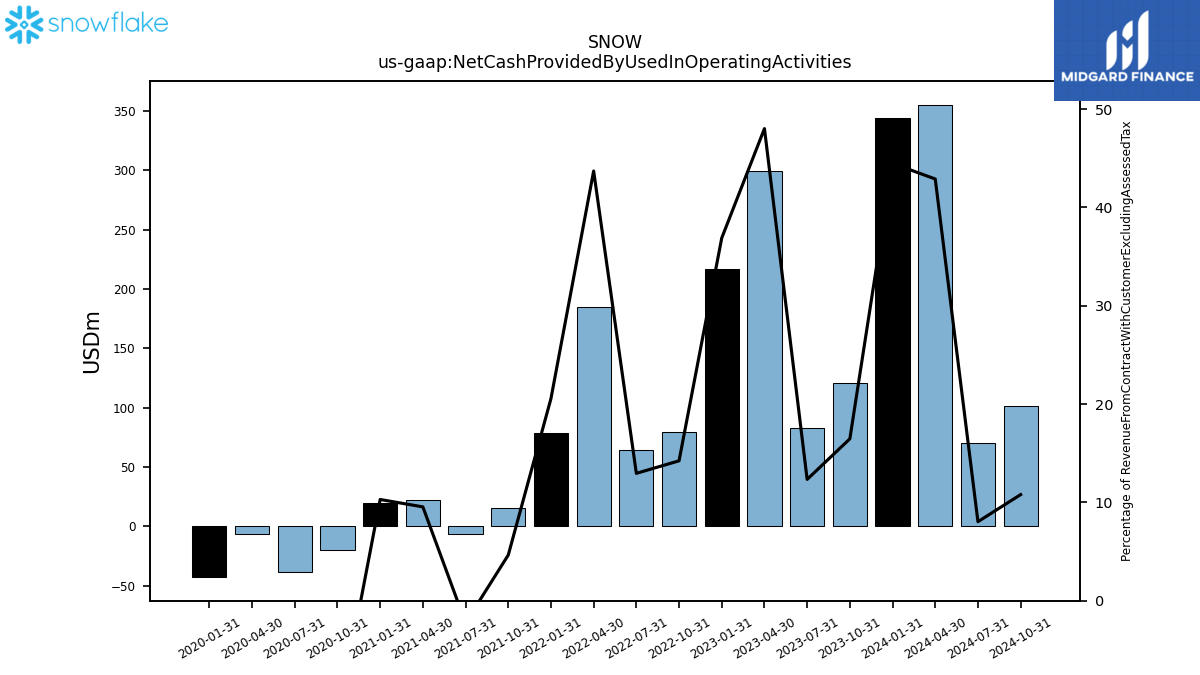
| Net Cash Provided By Used In Operating Activities | 120.91 | 83.19 | 299.44 | 217.32 | 79.28 | 64.43 | 184.61 | 78.90 | 15.54 | -6.11 | 21.85 | 19.61 | -19.75 | -38.69 | -6.59 | -42.79 | NA | |
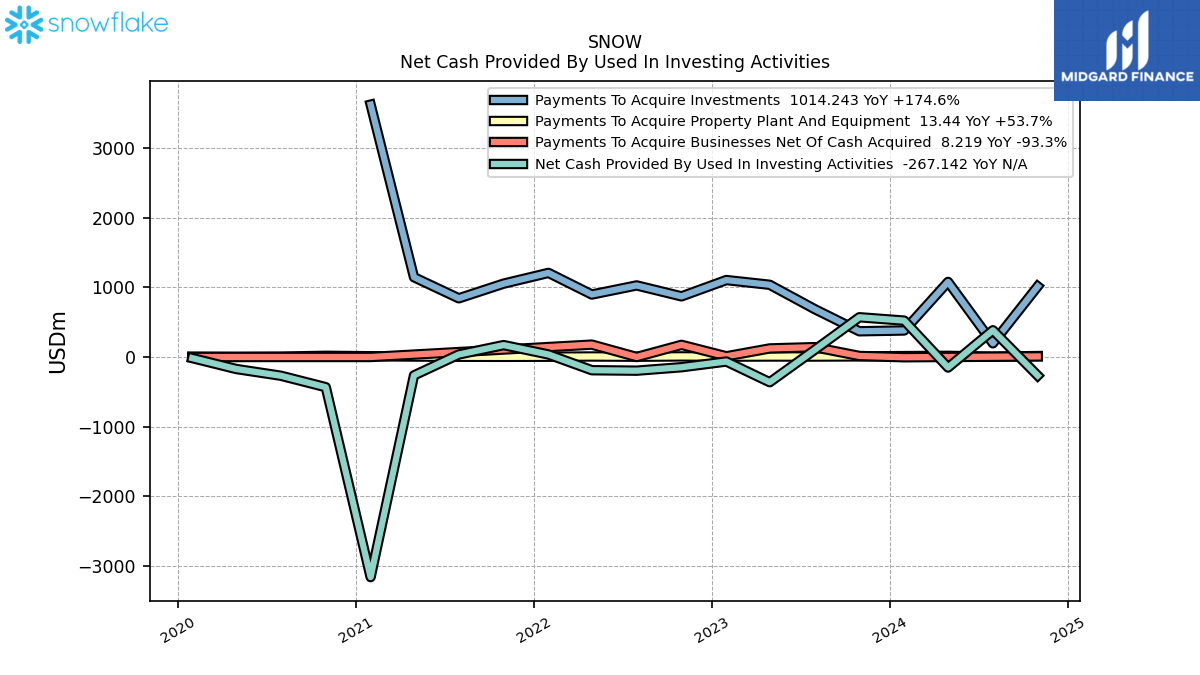
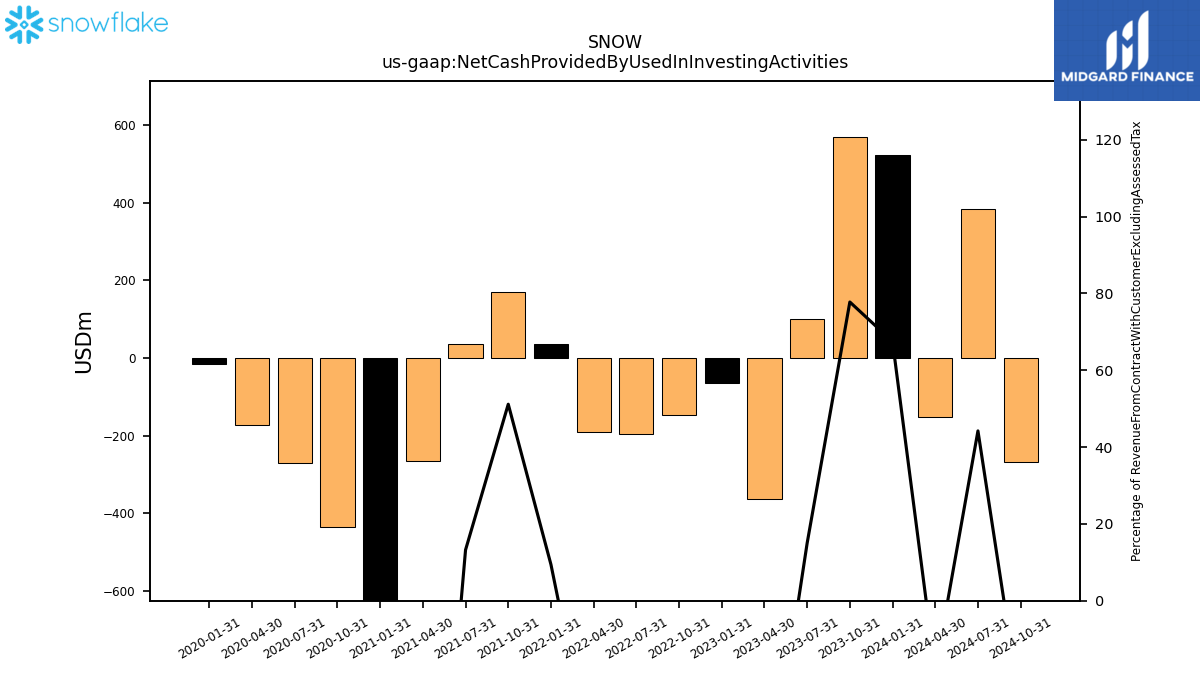
| Net Cash Provided By Used In Investing Activities | 570.86 | 101.04 | -362.21 | -64.78 | -146.86 | -196.45 | -189.79 | 36.17 | 171.06 | 36.04 | -264.07 | -3161.61 | -433.63 | -269.40 | -172.00 | -15.65 | NA | |
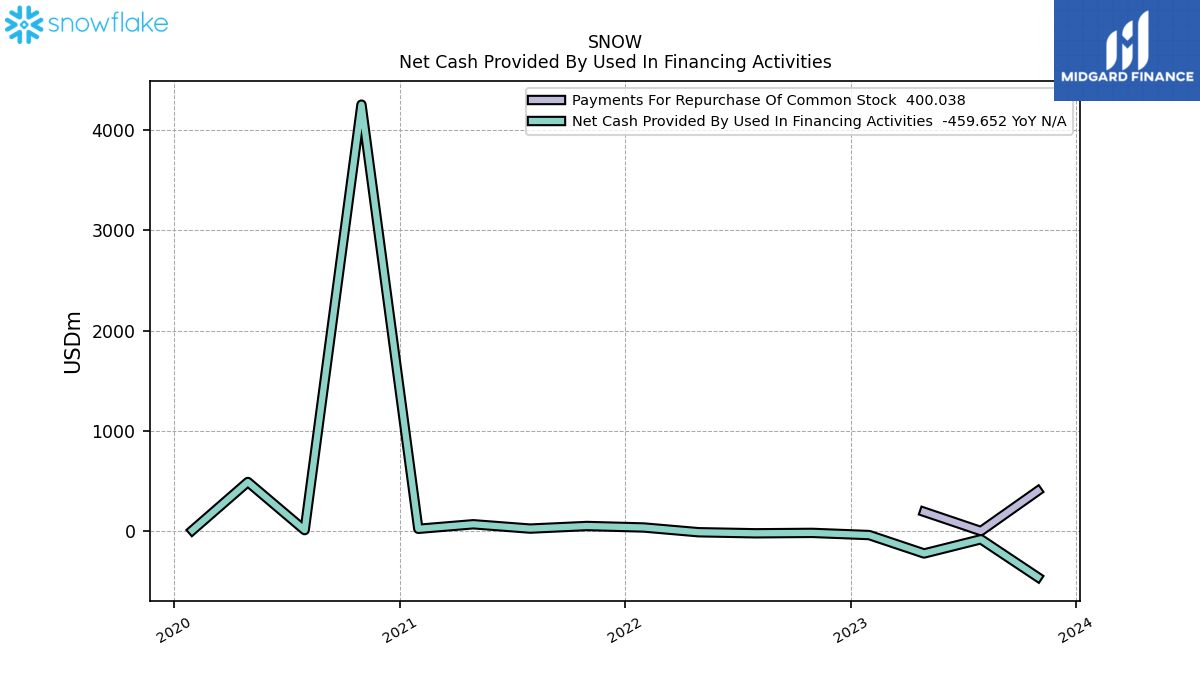
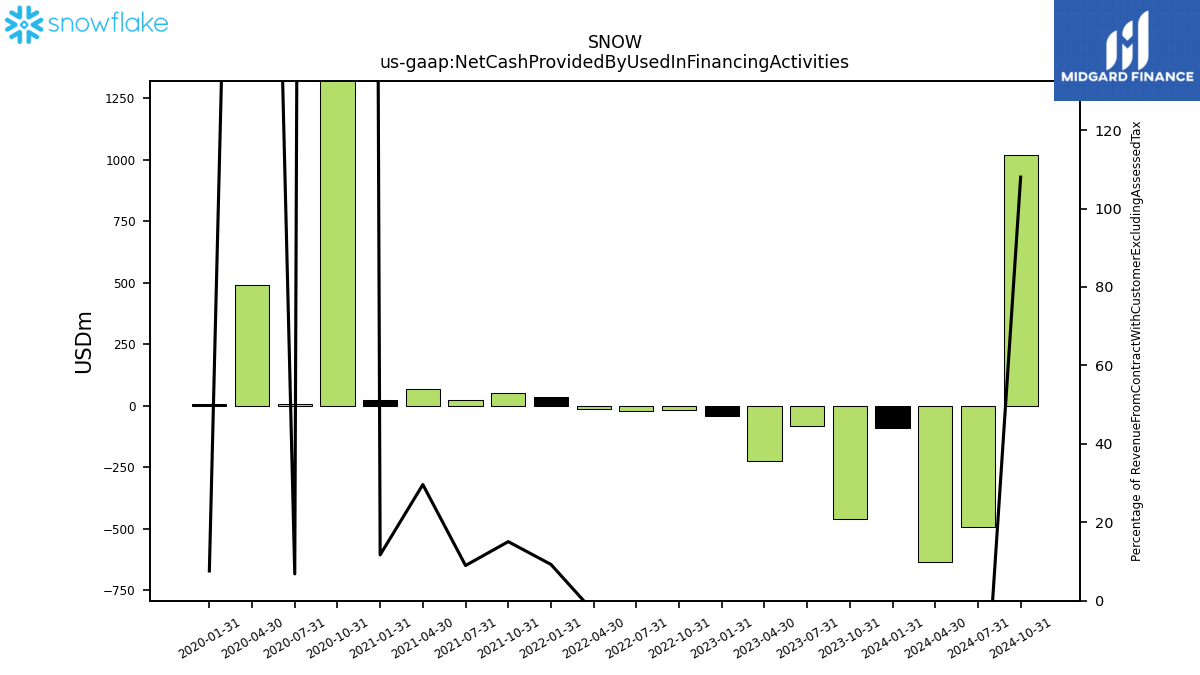
| Net Cash Provided By Used In Financing Activities | -459.65 | -82.16 | -223.66 | -40.08 | -18.32 | -22.37 | -11.85 | 35.53 | 50.41 | 24.46 | 67.80 | 22.28 | 4254.42 | 9.12 | 489.47 | 6.66 | NA |
| 2023-10-31 | 2023-07-31 | 2023-04-30 | 2023-01-31 | 2022-10-31 | 2022-07-31 | 2022-04-30 | 2022-01-31 | 2021-10-31 | 2021-07-31 | 2021-04-30 | 2021-01-31 | 2020-10-31 | 2020-07-31 | 2020-04-30 | 2020-01-31 | 2019-10-31 | ||
|---|---|---|---|---|---|---|---|---|---|---|---|---|---|---|---|---|---|---|
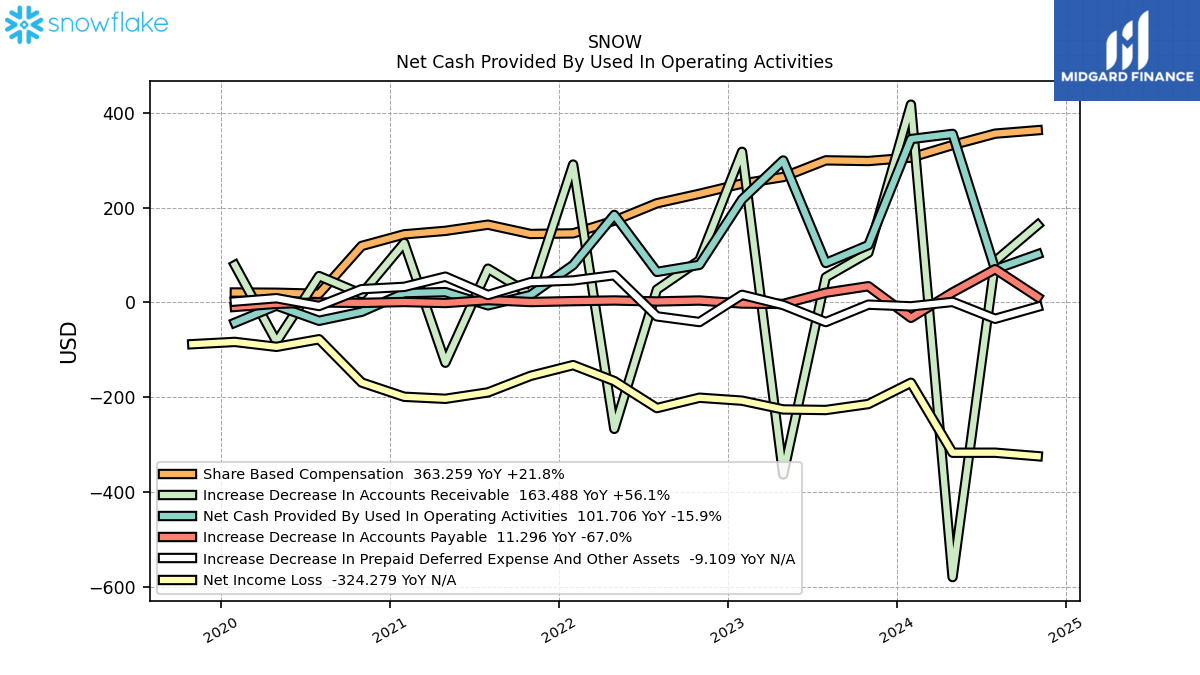
| Net Cash Provided By Used In Operating Activities | 120.91 | 83.19 | 299.44 | 217.32 | 79.28 | 64.43 | 184.61 | 78.90 | 15.54 | -6.11 | 21.85 | 19.61 | -19.75 | -38.69 | -6.59 | -42.79 | NA | |
| Net Income Loss | -214.25 | -226.87 | -225.63 | -207.17 | -200.94 | -222.81 | -165.79 | -132.15 | -154.86 | -189.72 | -203.22 | -198.94 | -168.89 | -77.63 | -93.64 | -83.25 | -88.06 | |
| Profit Loss | -214.69 | -227.32 | -226.06 | -207.48 | -201.44 | -222.81 | -165.79 | -132.15 | -154.86 | NA | NA | NA | NA | NA | NA | NA | NA | |
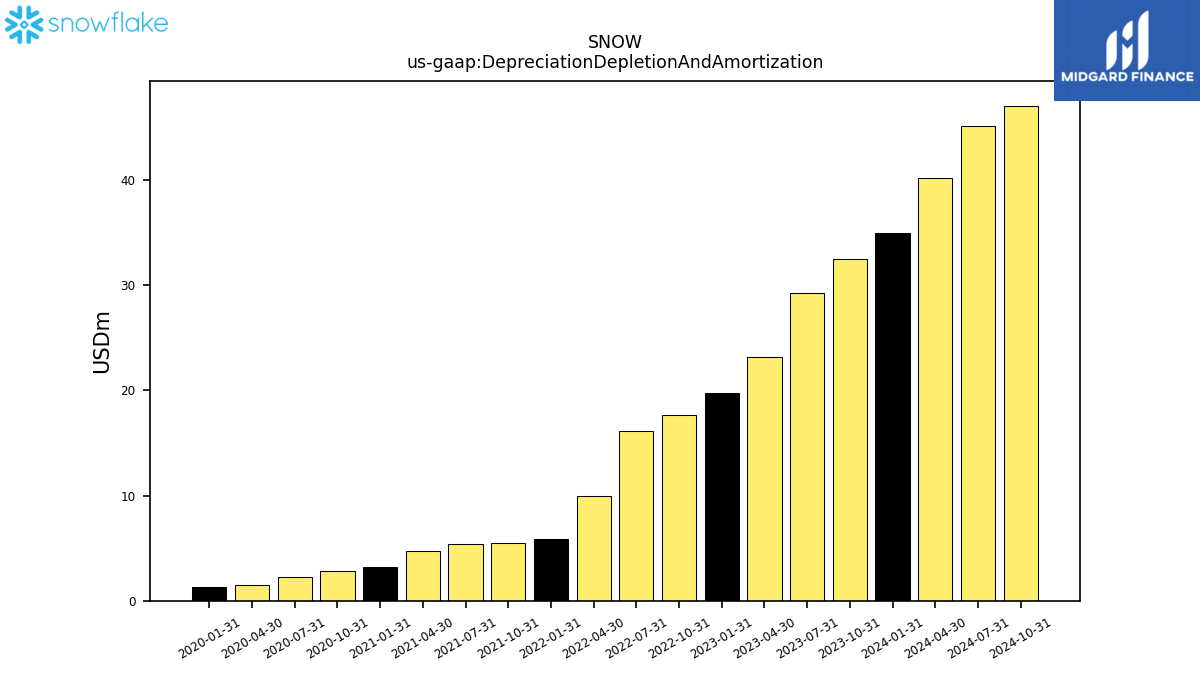
| Depreciation Depletion And Amortization | 32.47 | 29.28 | 23.16 | 19.73 | 17.70 | 16.17 | 9.94 | 5.91 | 5.52 | 5.38 | 4.68 | 3.21 | 2.85 | 2.24 | 1.52 | 1.26 | NA | |
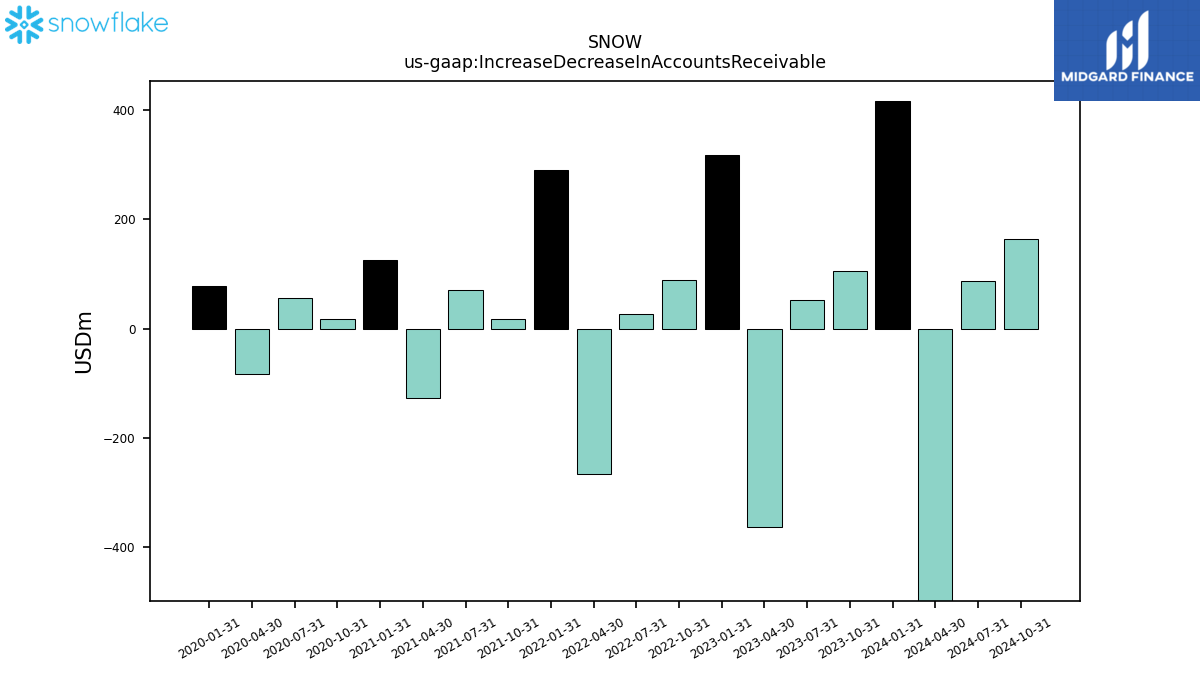
| Increase Decrease In Accounts Receivable | 104.70 | 53.05 | -362.89 | 317.69 | 88.85 | 27.09 | -266.66 | 290.79 | 16.75 | 71.28 | -127.18 | 125.51 | 17.91 | 55.57 | -82.70 | 78.68 | NA | |
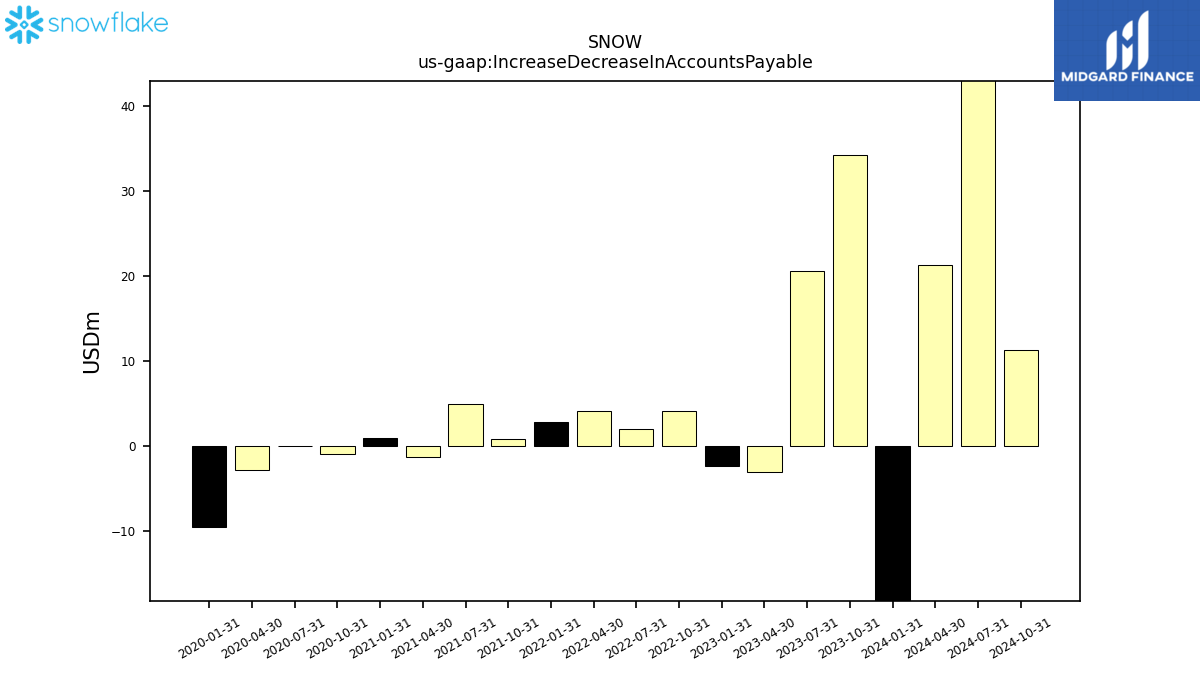
| Increase Decrease In Accounts Payable | 34.20 | 20.56 | -3.09 | -2.28 | 4.08 | 2.07 | 4.16 | 2.78 | 0.87 | 4.97 | -1.25 | 0.93 | -0.96 | 0.01 | -2.86 | -9.45 | NA | |
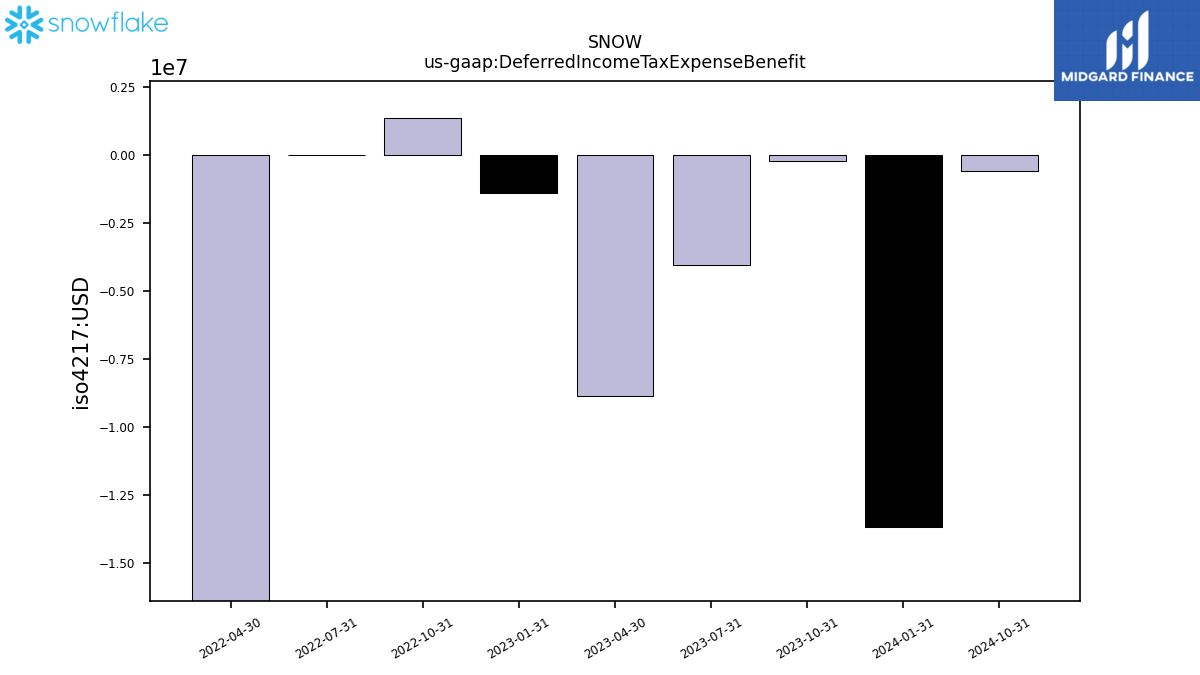
| Deferred Income Tax Expense Benefit | -0.21 | -4.03 | -8.87 | -1.39 | 1.39 | 0.00 | -26.66 | NA | NA | NA | NA | NA | NA | NA | NA | NA | NA | |
| Share Based Compensation | 298.29 | 299.72 | 264.51 | 250.70 | 229.16 | 209.18 | 172.49 | 145.70 | 144.39 | 163.99 | 151.01 | 143.65 | 119.14 | 18.20 | 20.45 | 20.97 | NA |
| 2023-10-31 | 2023-07-31 | 2023-04-30 | 2023-01-31 | 2022-10-31 | 2022-07-31 | 2022-04-30 | 2022-01-31 | 2021-10-31 | 2021-07-31 | 2021-04-30 | 2021-01-31 | 2020-10-31 | 2020-07-31 | 2020-04-30 | 2020-01-31 | 2019-10-31 | ||
|---|---|---|---|---|---|---|---|---|---|---|---|---|---|---|---|---|---|---|
| Net Cash Provided By Used In Investing Activities | 570.86 | 101.04 | -362.21 | -64.78 | -146.86 | -196.45 | -189.79 | 36.17 | 171.06 | 36.04 | -264.07 | -3161.61 | -433.63 | -269.40 | -172.00 | -15.65 | NA | |
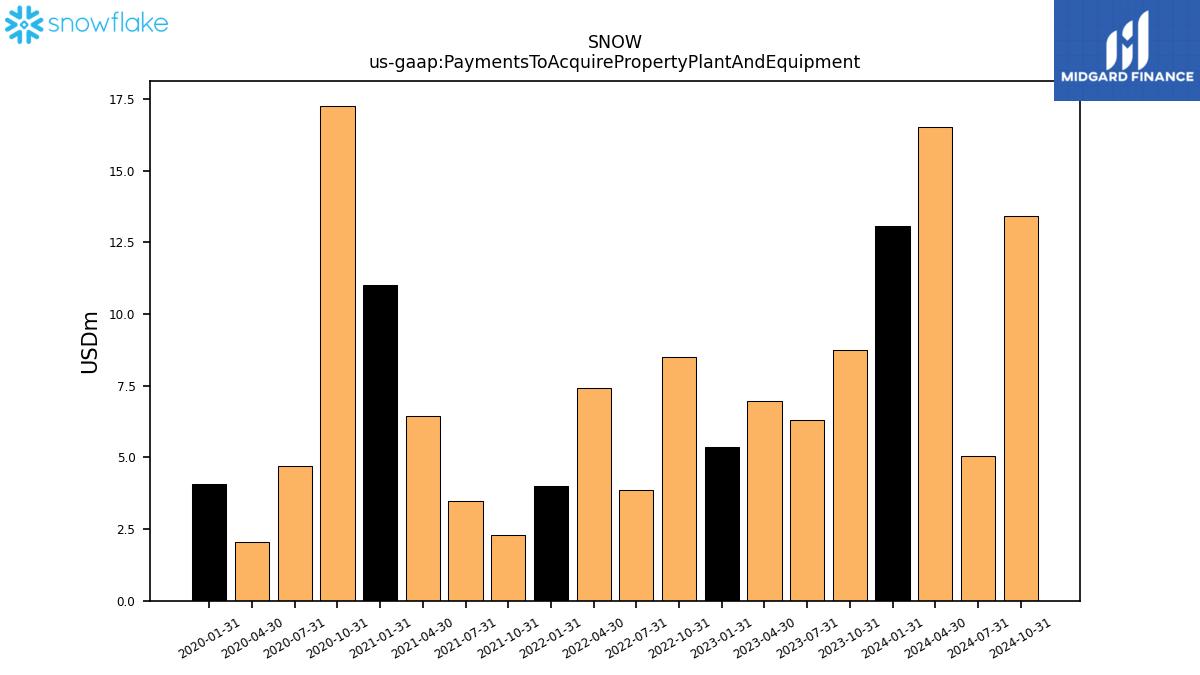
| Payments To Acquire Property Plant And Equipment | 8.75 | 6.30 | 6.97 | 5.36 | 8.51 | 3.85 | 7.41 | 4.01 | 2.28 | 3.50 | 6.43 | 11.02 | 17.27 | 4.71 | 2.03 | 4.08 | NA | |
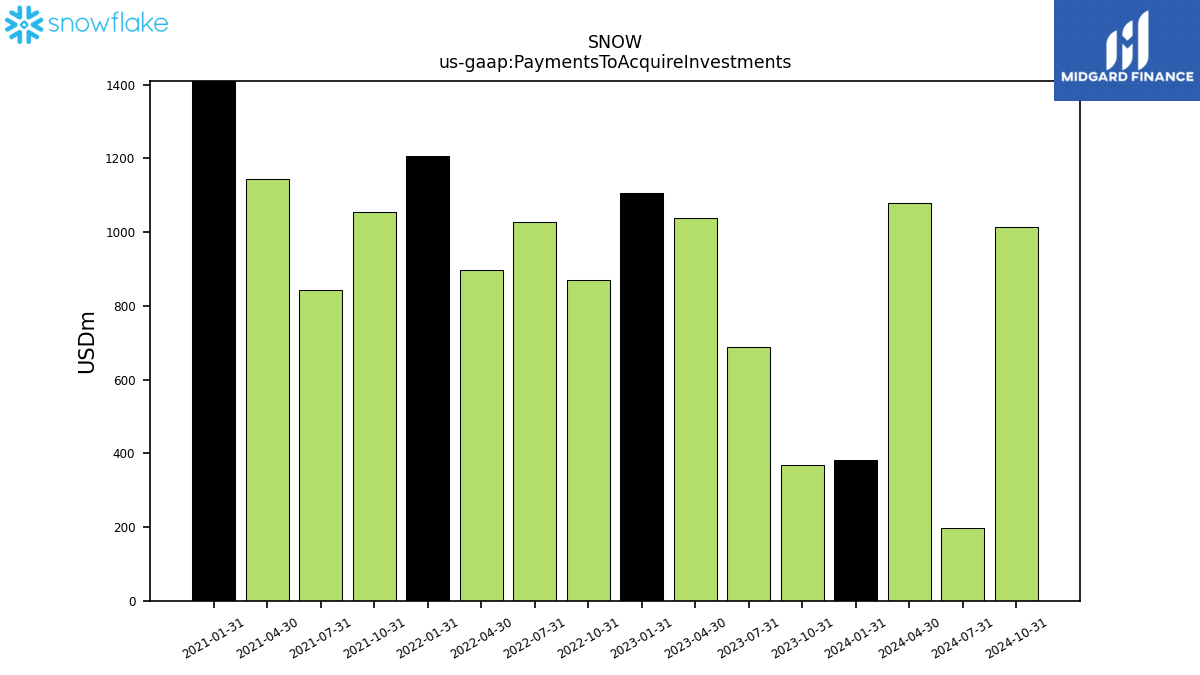
| Payments To Acquire Investments | 369.37 | 688.68 | 1037.29 | 1105.15 | 870.91 | 1027.97 | 897.29 | 1207.94 | 1053.76 | 842.96 | 1145.67 | 3624.83 | NA | NA | NA | NA | NA |
| 2023-10-31 | 2023-07-31 | 2023-04-30 | 2023-01-31 | 2022-10-31 | 2022-07-31 | 2022-04-30 | 2022-01-31 | 2021-10-31 | 2021-07-31 | 2021-04-30 | 2021-01-31 | 2020-10-31 | 2020-07-31 | 2020-04-30 | 2020-01-31 | 2019-10-31 | ||
|---|---|---|---|---|---|---|---|---|---|---|---|---|---|---|---|---|---|---|
| Net Cash Provided By Used In Financing Activities | -459.65 | -82.16 | -223.66 | -40.08 | -18.32 | -22.37 | -11.85 | 35.53 | 50.41 | 24.46 | 67.80 | 22.28 | 4254.42 | 9.12 | 489.47 | 6.66 | NA | |
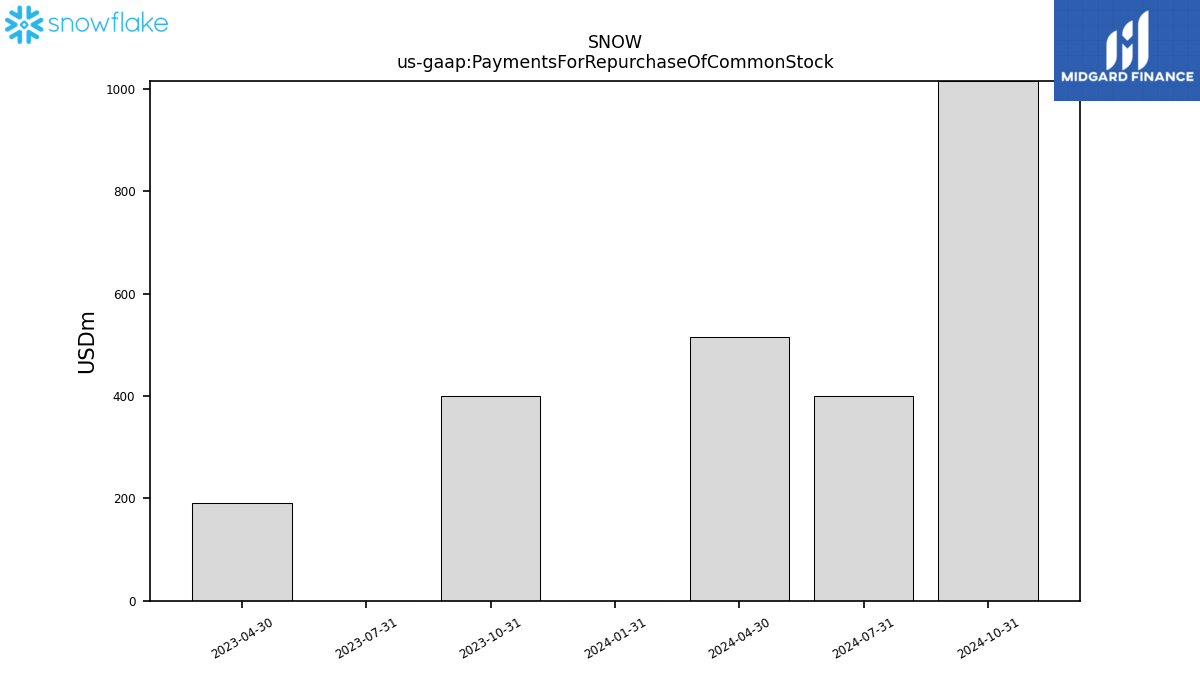
| Payments For Repurchase Of Common Stock | 400.04 | 0.00 | 191.69 | NA | NA | NA | NA | NA | NA | NA | NA | NA | NA | NA | NA | NA | NA |
| 2023-10-31 | 2023-07-31 | 2023-04-30 | 2023-01-31 | 2022-10-31 | 2022-07-31 | 2022-04-30 | 2022-01-31 | 2021-10-31 | 2021-07-31 | 2021-04-30 | 2021-01-31 | 2020-10-31 | 2020-07-31 | 2020-04-30 | 2020-01-31 | 2019-10-31 | ||
|---|---|---|---|---|---|---|---|---|---|---|---|---|---|---|---|---|---|---|
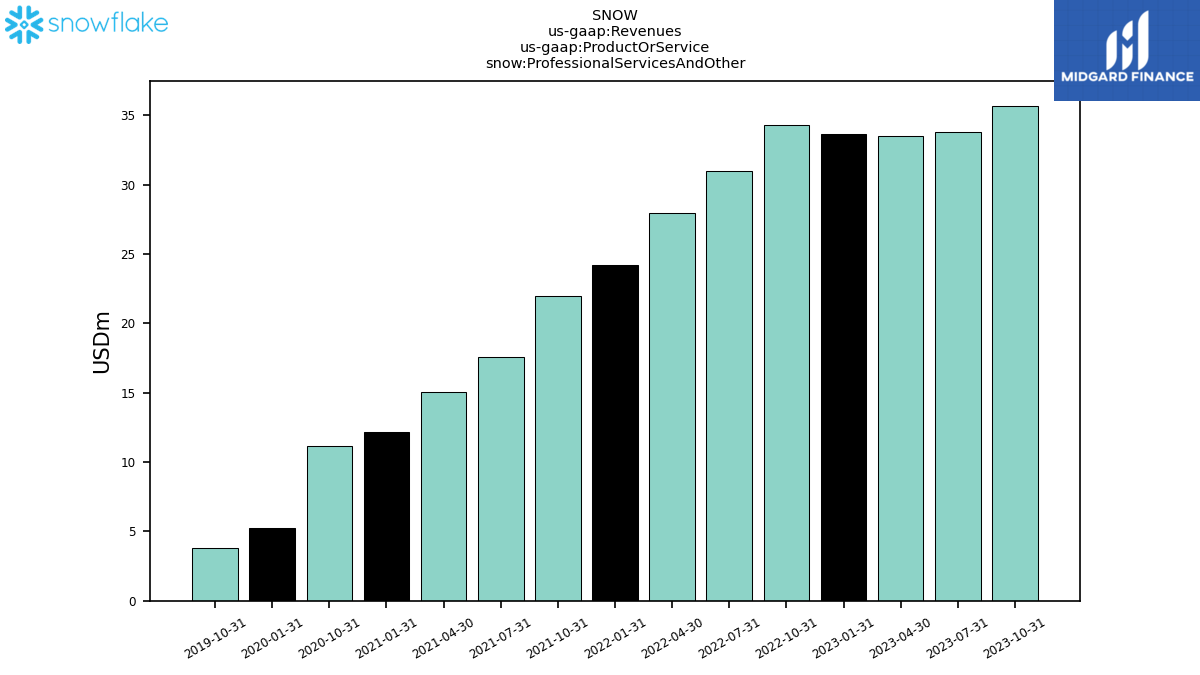
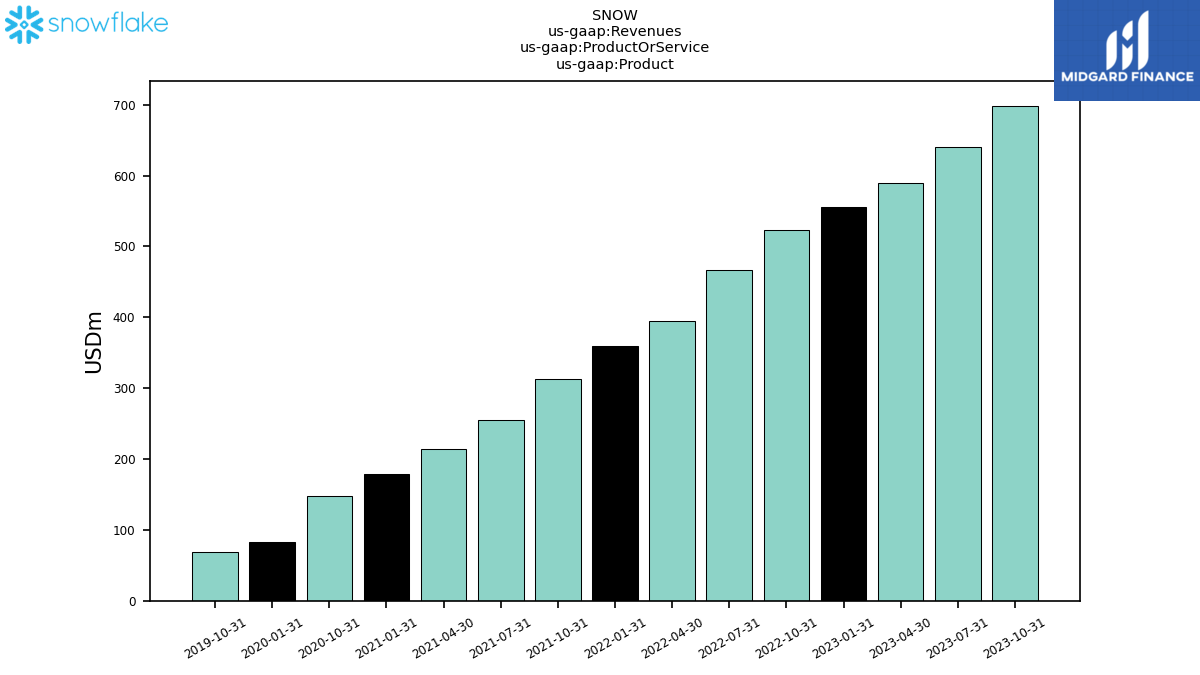
| Revenues | 734.17 | 674.02 | 623.60 | 589.01 | 557.03 | 497.25 | 422.37 | 383.77 | 334.44 | 272.20 | 228.91 | 190.47 | 159.62 | 133.15 | 108.81 | 87.69 | 73.01 | |
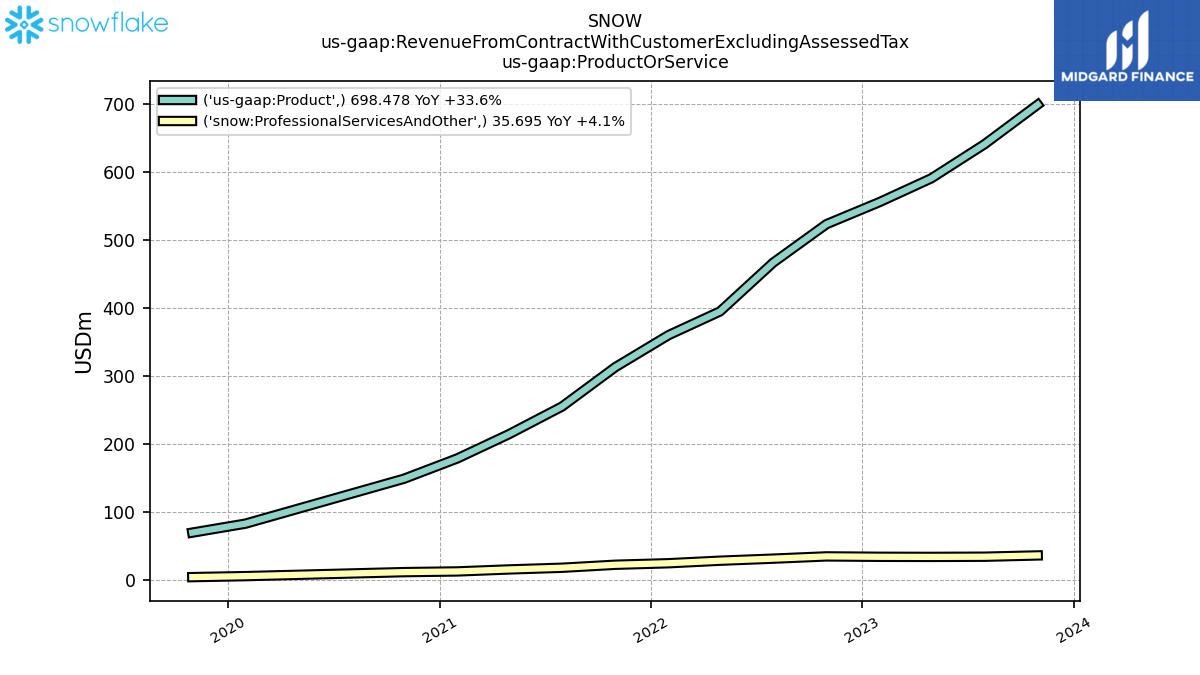
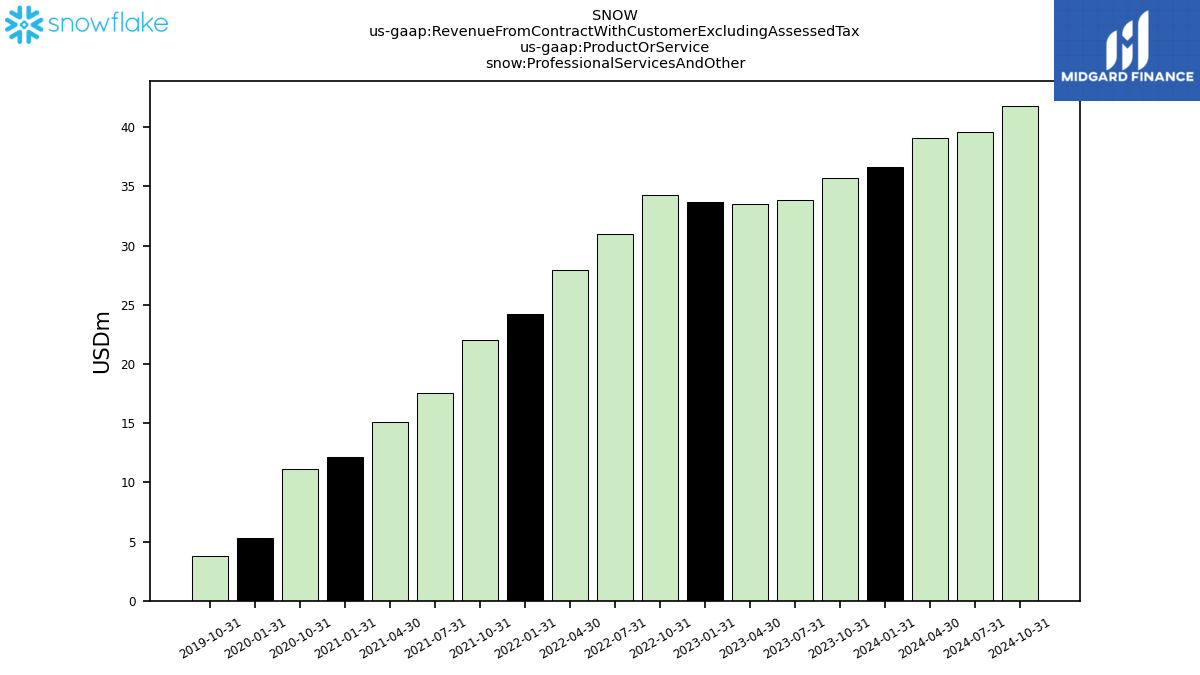
| Professional Services And Other | 35.70 | 33.81 | 33.53 | 33.68 | 34.28 | 30.98 | 27.94 | 24.22 | 21.98 | 17.57 | 15.08 | 12.18 | 11.15 | NA | NA | 5.26 | 3.80 | |
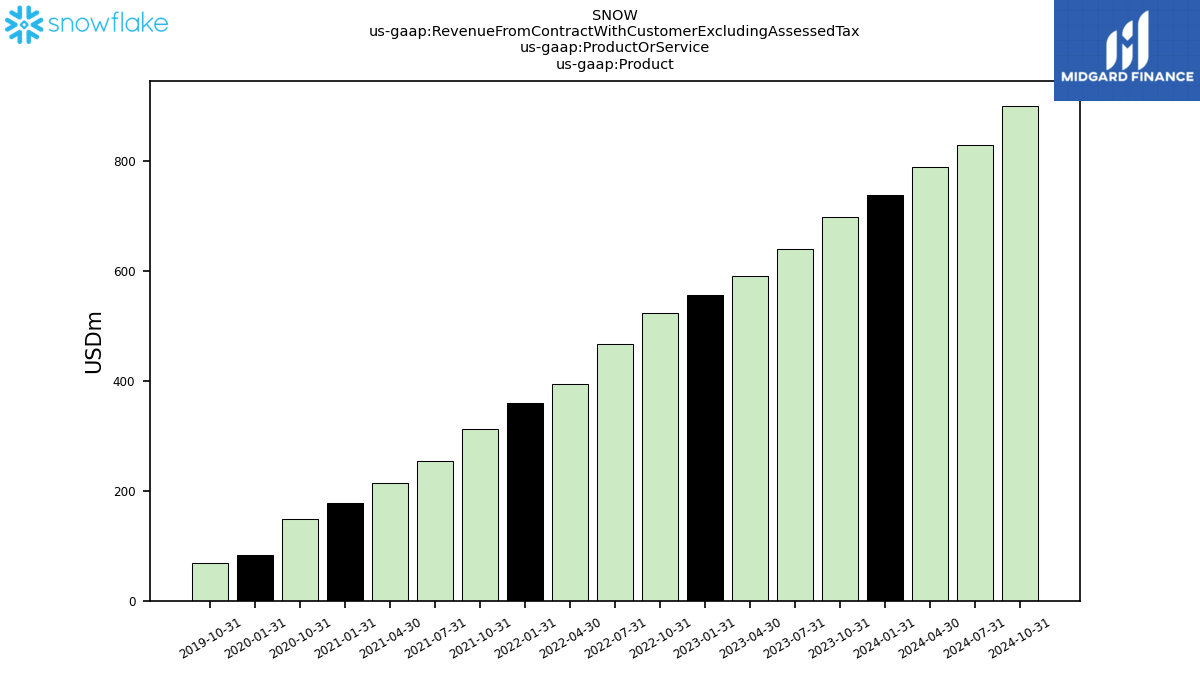
| Product | 698.48 | 640.21 | 590.07 | 555.33 | 522.75 | 466.27 | 394.43 | 359.56 | 312.46 | 254.62 | 213.83 | 178.29 | 148.47 | NA | NA | 82.43 | 69.21 | |
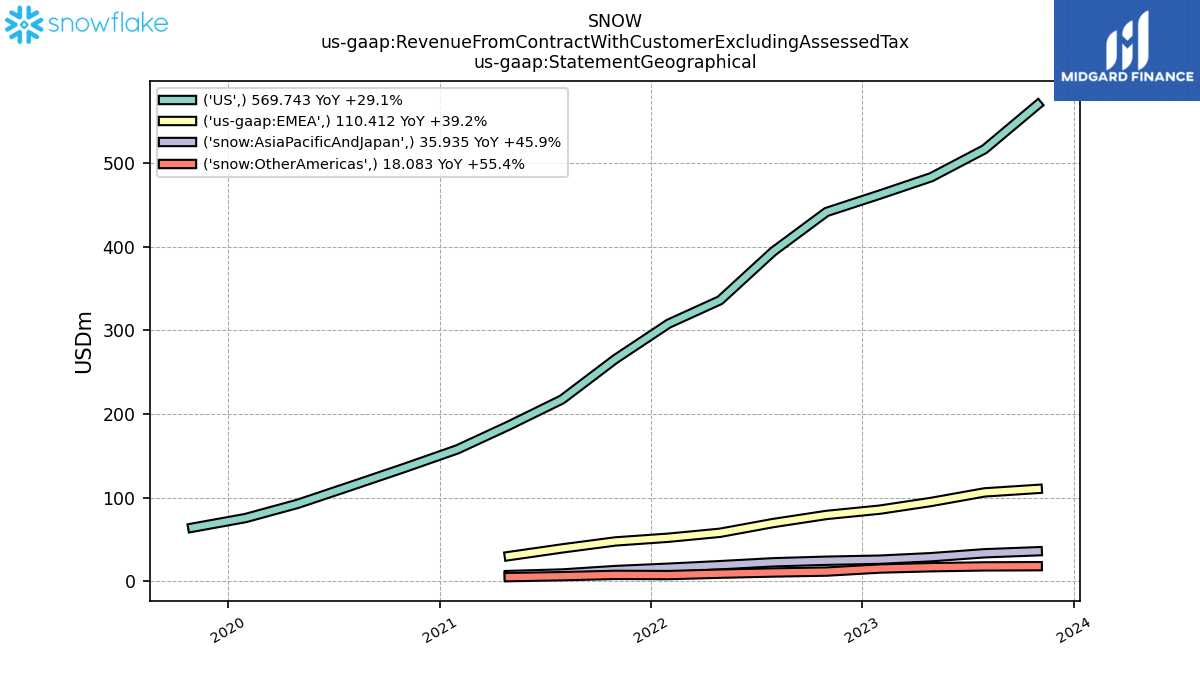
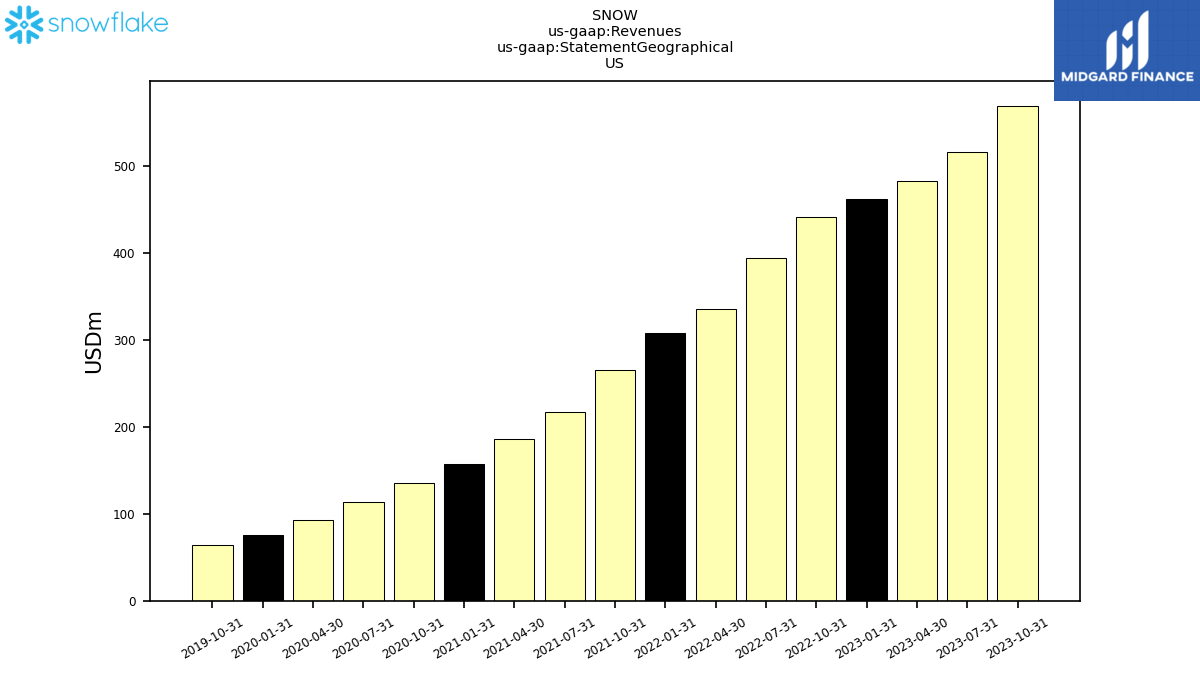
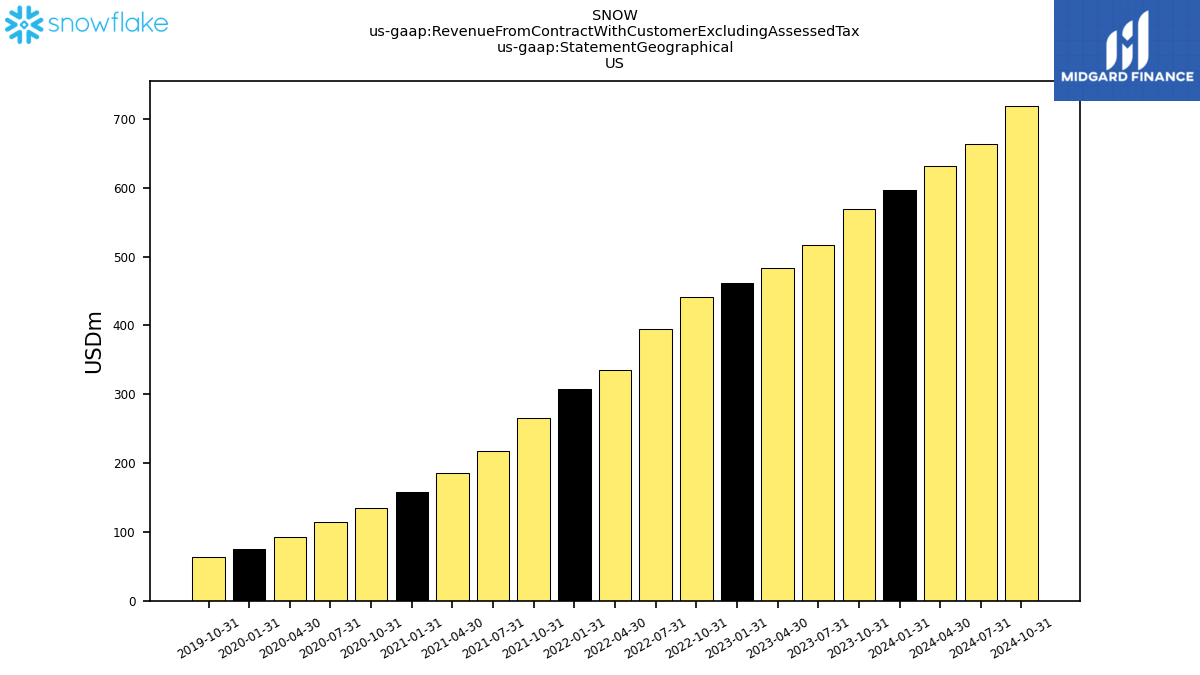
| US | 569.74 | 516.37 | 482.99 | 462.20 | 441.43 | 394.28 | 335.93 | 307.90 | 265.61 | 217.38 | 186.19 | 157.70 | 135.43 | 113.89 | 92.58 | 75.62 | 64.10 | |
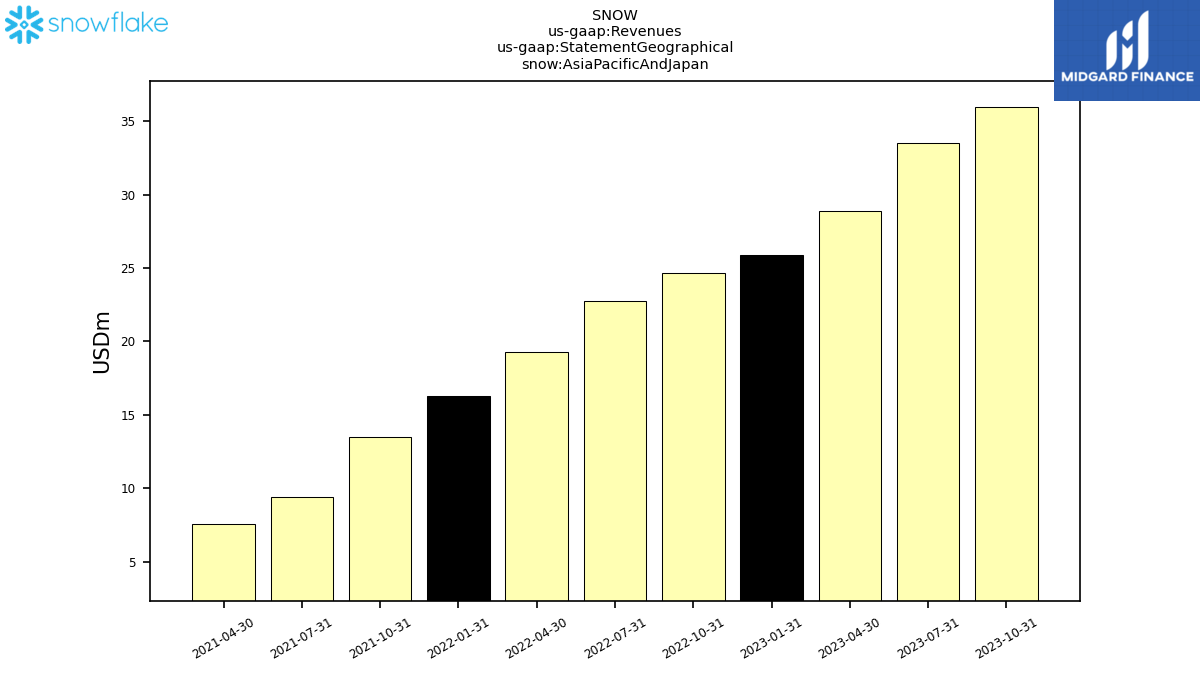
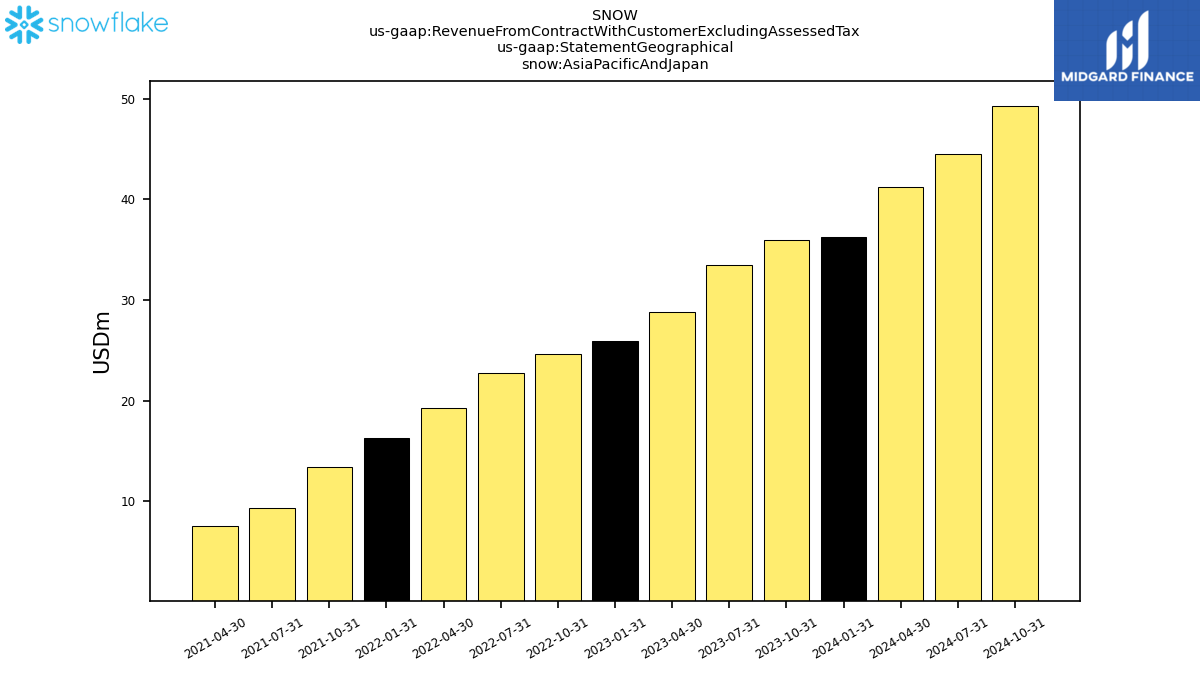
| Asia Pacific And Japan | 35.94 | 33.52 | 28.86 | 25.89 | 24.63 | 22.75 | 19.30 | 16.29 | 13.46 | 9.38 | 7.54 | NA | NA | NA | NA | NA | NA | |
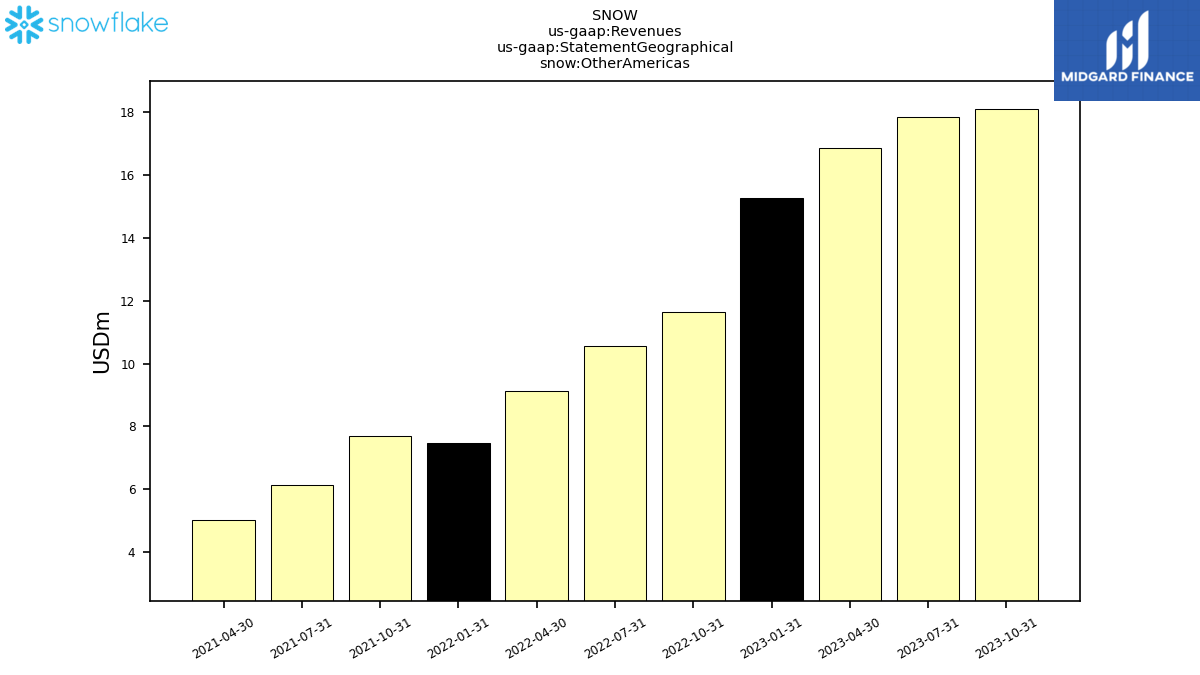
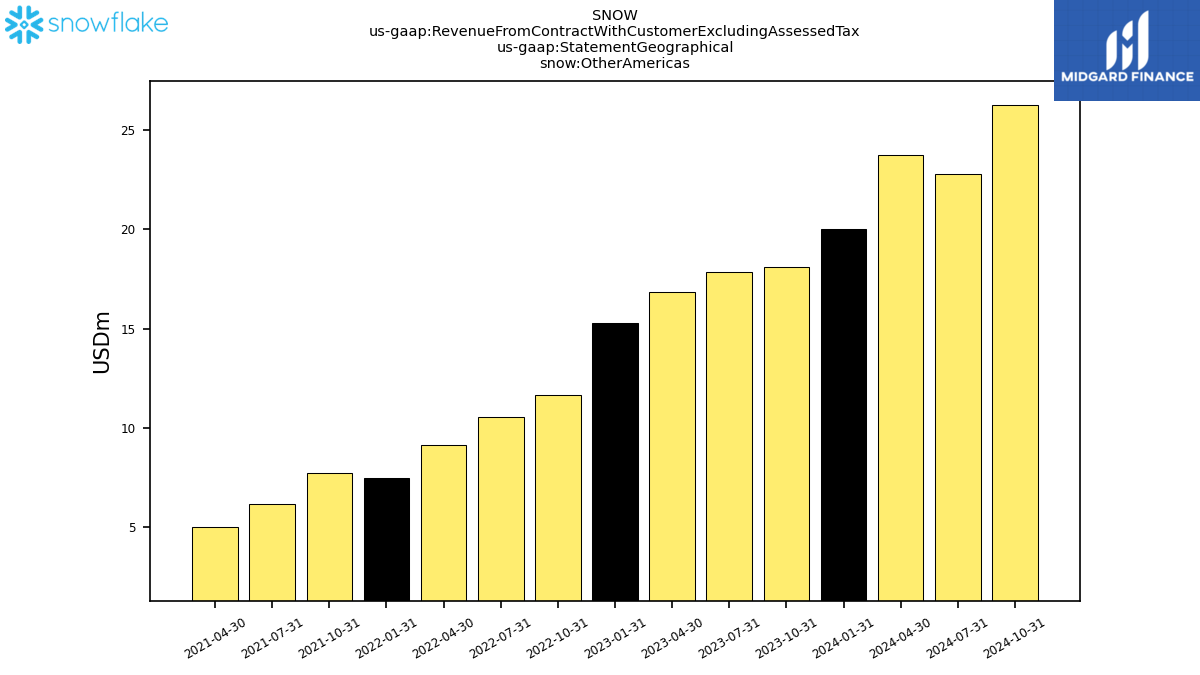
| Other Americas | 18.08 | 17.84 | 16.86 | 15.26 | 11.64 | 10.55 | 9.13 | 7.46 | 7.70 | 6.14 | 5.02 | NA | NA | NA | NA | NA | NA | |
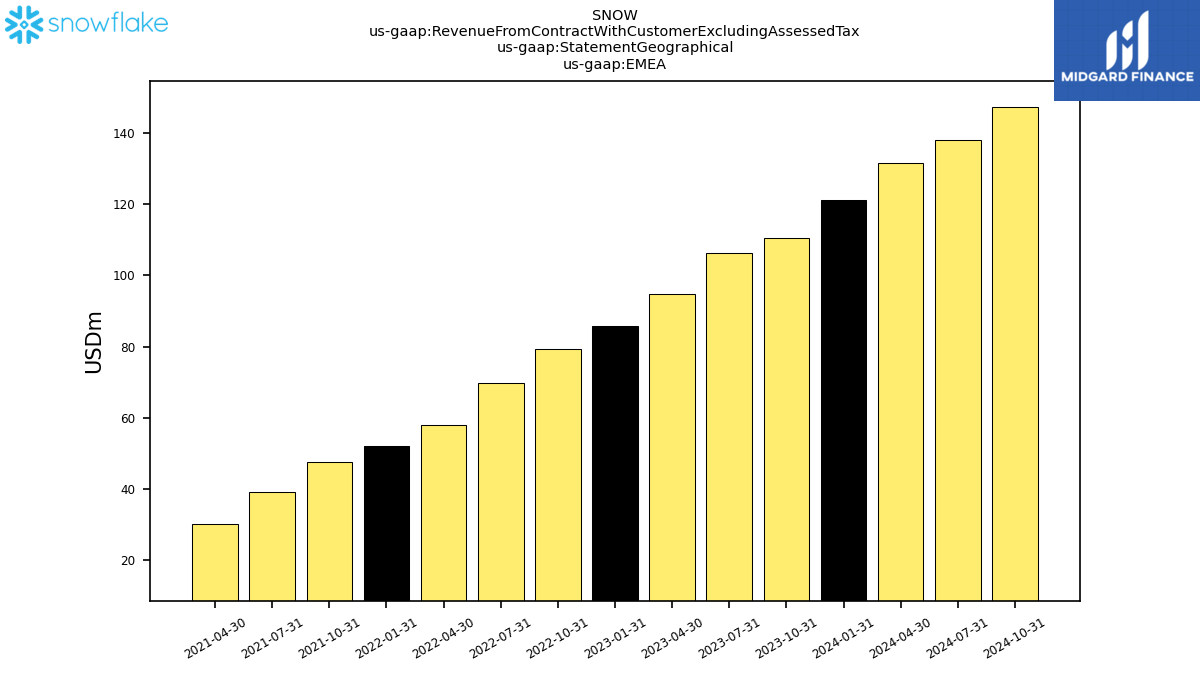
| EMEA | 110.41 | 106.28 | 94.89 | 85.66 | 79.33 | 69.67 | 58.02 | 52.12 | 47.67 | 39.30 | 30.17 | NA | NA | NA | NA | NA | NA | |
| Revenue From Contract With Customer Excluding Assessed Tax | 734.17 | 674.02 | 623.60 | 589.01 | 557.03 | 497.25 | 422.37 | 383.77 | 334.44 | 272.20 | 228.91 | 190.47 | 159.62 | 133.15 | 108.81 | 87.69 | 73.01 | |
| Professional Services And Other | 35.70 | 33.81 | 33.53 | 33.68 | 34.28 | 30.98 | 27.94 | 24.22 | 21.98 | 17.57 | 15.08 | 12.18 | 11.15 | NA | NA | 5.26 | 3.80 | |
| Product | 698.48 | 640.21 | 590.07 | 555.33 | 522.75 | 466.27 | 394.43 | 359.56 | 312.46 | 254.62 | 213.83 | 178.29 | 148.47 | NA | NA | 82.43 | 69.21 | |
| US | 569.74 | 516.37 | 482.99 | 462.20 | 441.43 | 394.28 | 335.93 | 307.90 | 265.61 | 217.38 | 186.19 | 157.70 | 135.43 | 113.89 | 92.58 | 75.62 | 64.10 | |
| Asia Pacific And Japan | 35.94 | 33.52 | 28.86 | 25.89 | 24.63 | 22.75 | 19.30 | 16.29 | 13.46 | 9.38 | 7.54 | NA | NA | NA | NA | NA | NA | |
| Other Americas | 18.08 | 17.84 | 16.86 | 15.26 | 11.64 | 10.55 | 9.13 | 7.46 | 7.70 | 6.14 | 5.02 | NA | NA | NA | NA | NA | NA | |
| EMEA | 110.41 | 106.28 | 94.89 | 85.66 | 79.33 | 69.67 | 58.02 | 52.12 | 47.67 | 39.30 | 30.17 | NA | NA | NA | NA | NA | NA |


