
| 2024-03-31 | 2023-12-31 | 2023-09-30 | 2023-06-30 | 2023-03-31 | 2022-12-31 | 2022-09-30 | 2022-06-30 | 2022-03-31 | 2021-12-31 | 2021-09-30 | 2021-06-30 | 2021-03-31 | 2020-12-31 | 2020-09-30 | 2020-06-30 | ||
|---|---|---|---|---|---|---|---|---|---|---|---|---|---|---|---|---|---|
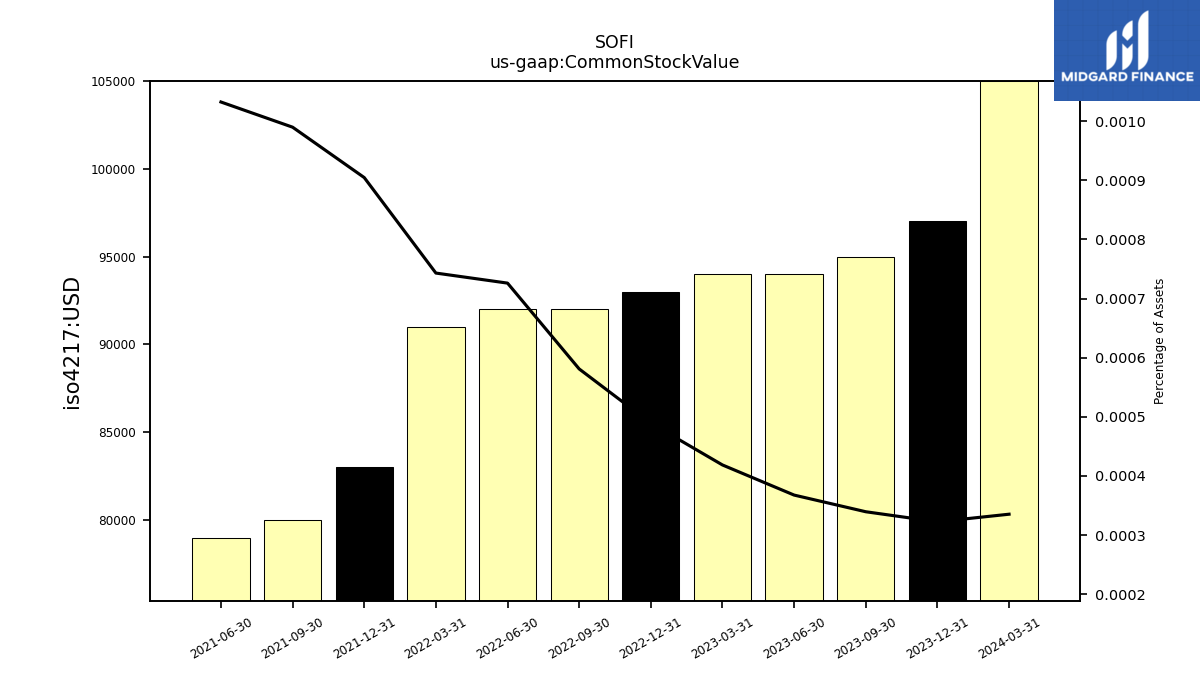
| Common Stock Value | 0.10 | 0.10 | 0.10 | 0.09 | 0.09 | 0.09 | 0.09 | 0.09 | 0.09 | 0.08 | 0.08 | 0.08 | NA | NA | NA | NA | |
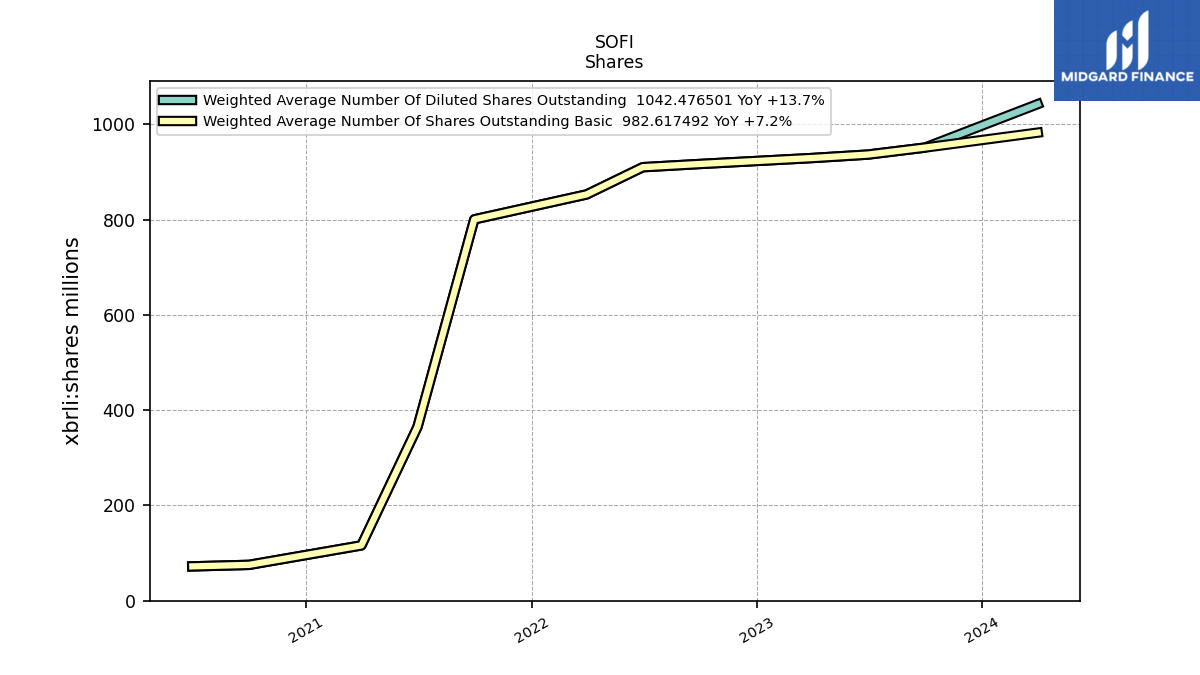
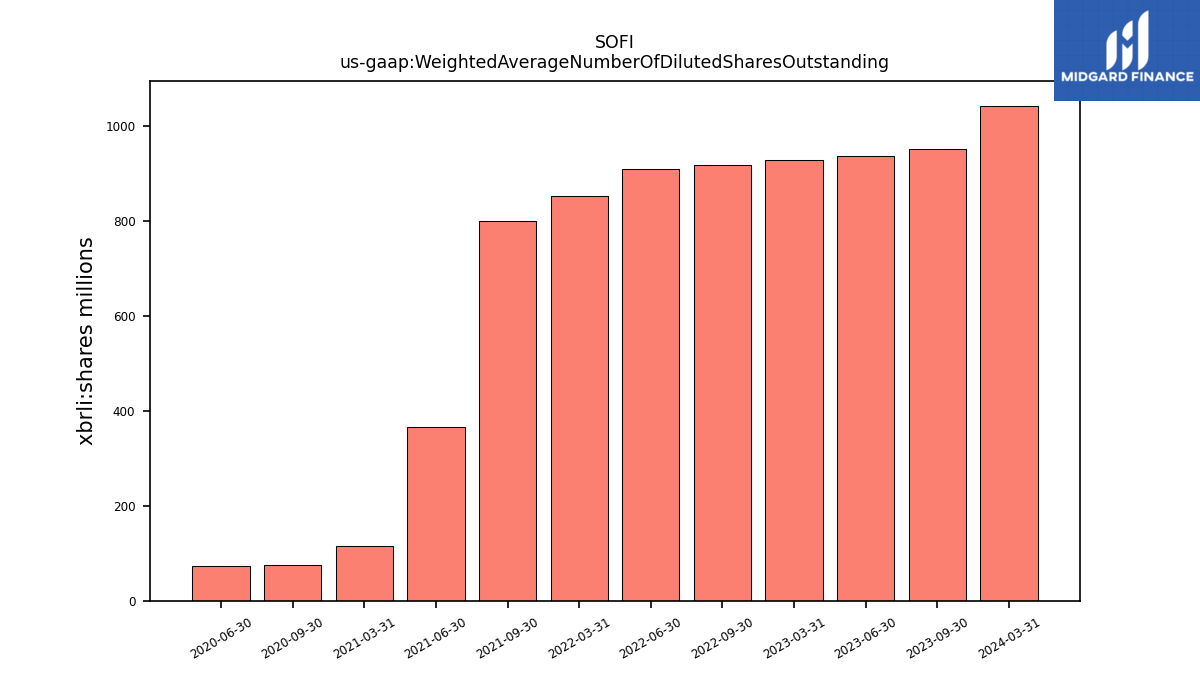
| Weighted Average Number Of Diluted Shares Outstanding | 1042.48 | NA | 951.18 | 936.57 | 929.27 | NA | 916.76 | 910.05 | 852.85 | NA | 800.57 | 365.04 | 116.15 | NA | 75.32 | 72.15 | |
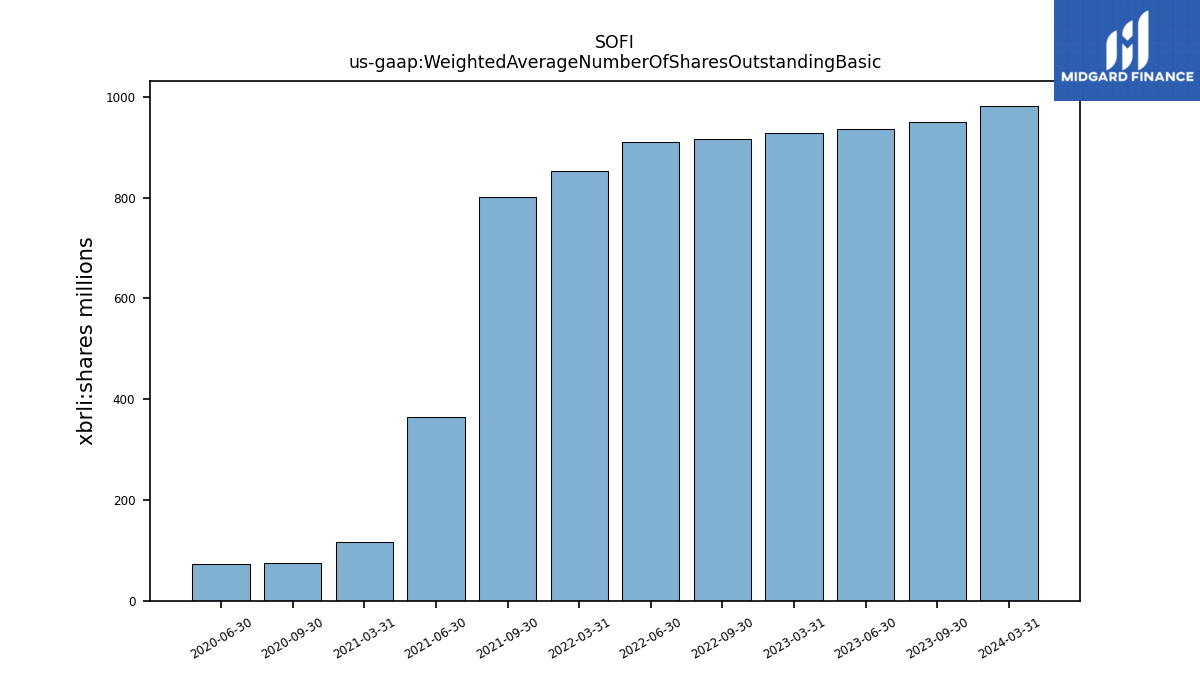
| Weighted Average Number Of Shares Outstanding Basic | 982.62 | NA | 951.18 | 936.57 | 929.27 | NA | 916.76 | 910.05 | 852.85 | NA | 800.57 | 365.04 | 116.15 | NA | 75.32 | 72.15 | |
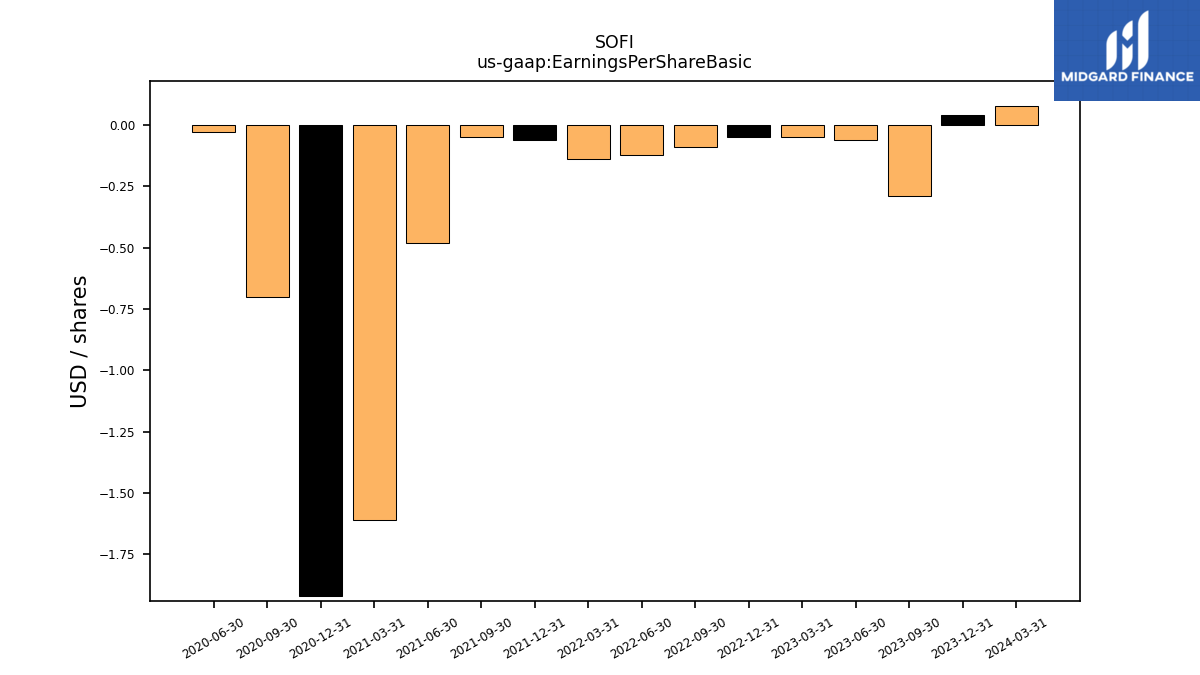
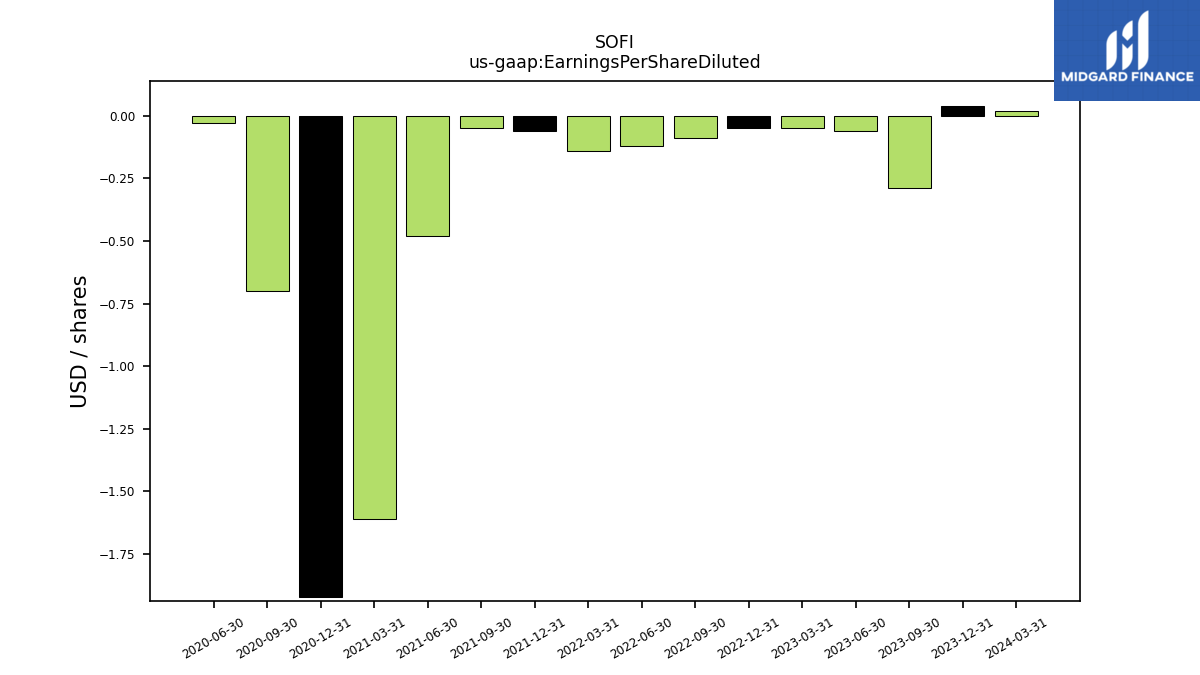
| Earnings Per Share Basic | 0.08 | 0.04 | -0.29 | -0.06 | -0.05 | -0.05 | -0.09 | -0.12 | -0.14 | -0.06 | -0.05 | -0.48 | -1.61 | -1.92 | -0.70 | -0.03 | |
| Earnings Per Share Diluted | 0.02 | 0.04 | -0.29 | -0.06 | -0.05 | -0.05 | -0.09 | -0.12 | -0.14 | -0.06 | -0.05 | -0.48 | -1.61 | -1.92 | -0.70 | -0.03 |
| 2024-03-31 | 2023-12-31 | 2023-09-30 | 2023-06-30 | 2023-03-31 | 2022-12-31 | 2022-09-30 | 2022-06-30 | 2022-03-31 | 2021-12-31 | 2021-09-30 | 2021-06-30 | 2021-03-31 | 2020-12-31 | 2020-09-30 | 2020-06-30 | ||
|---|---|---|---|---|---|---|---|---|---|---|---|---|---|---|---|---|---|
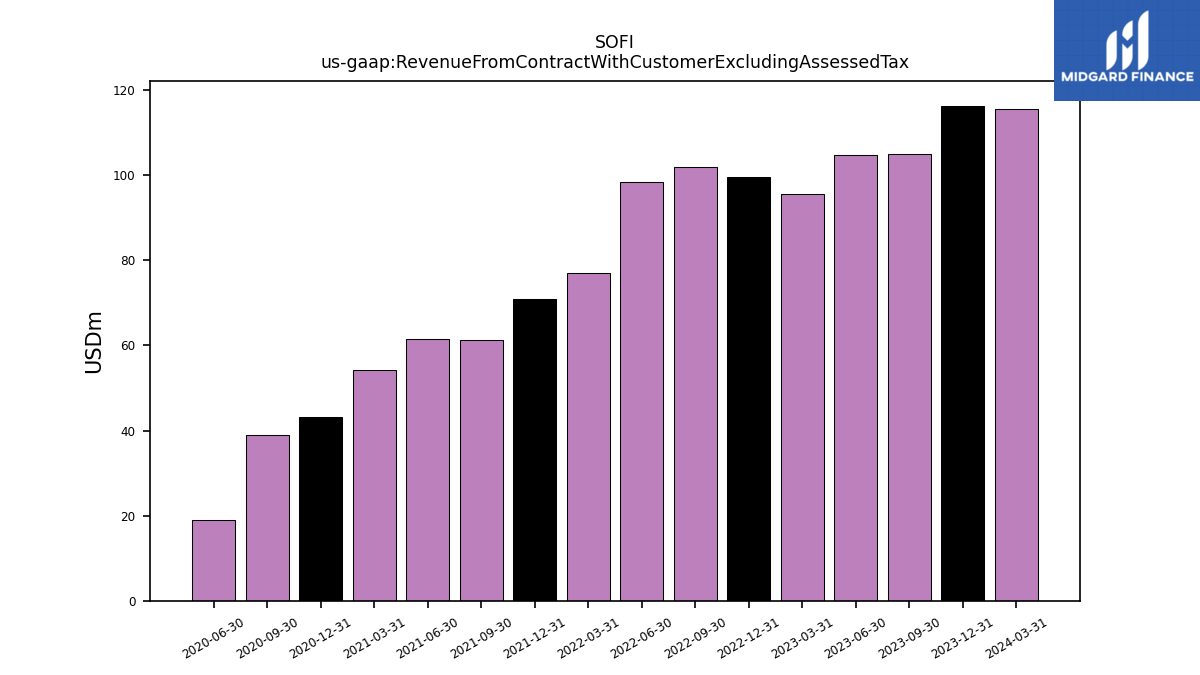
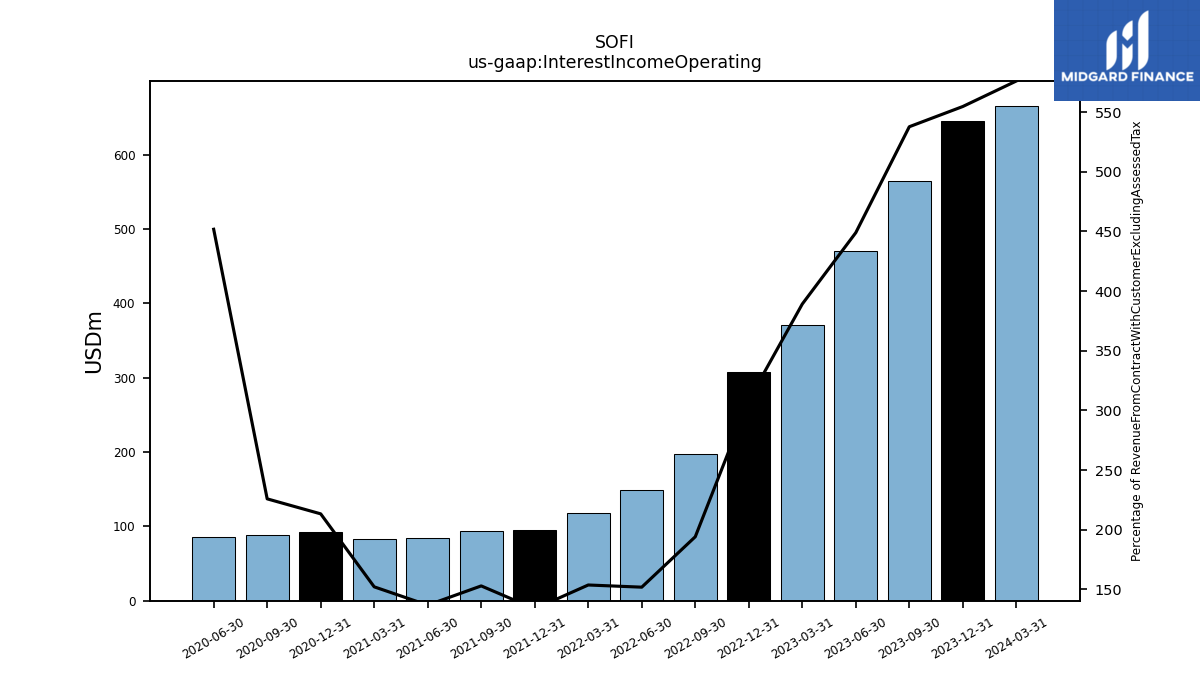
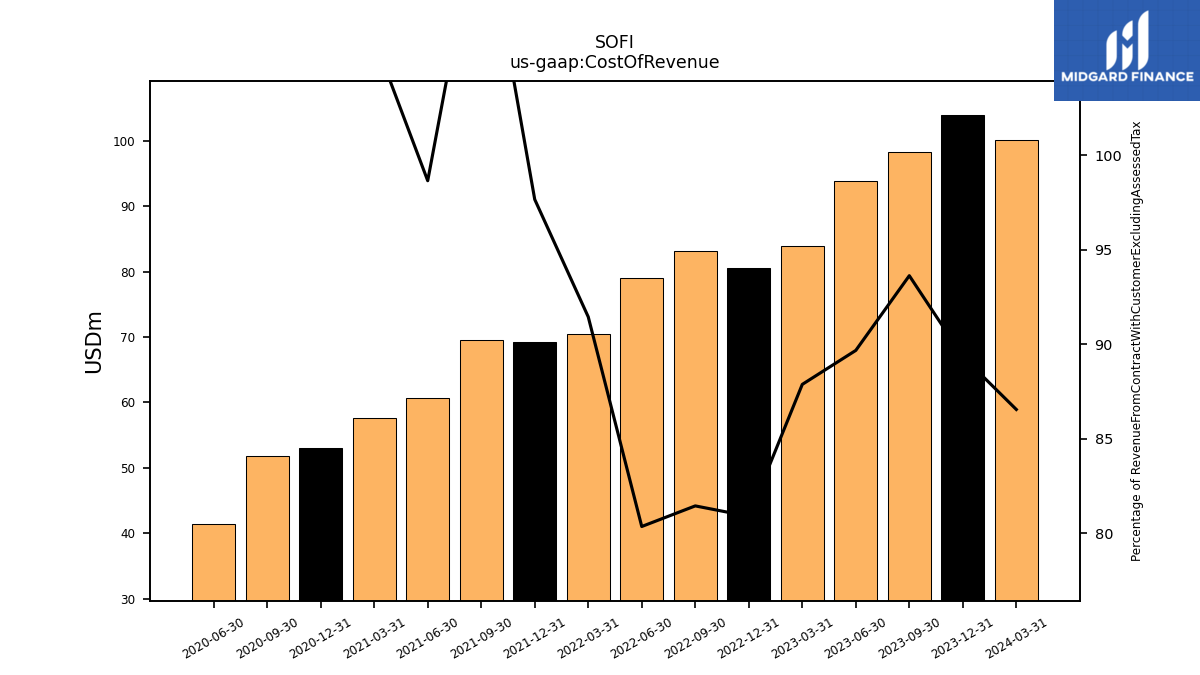
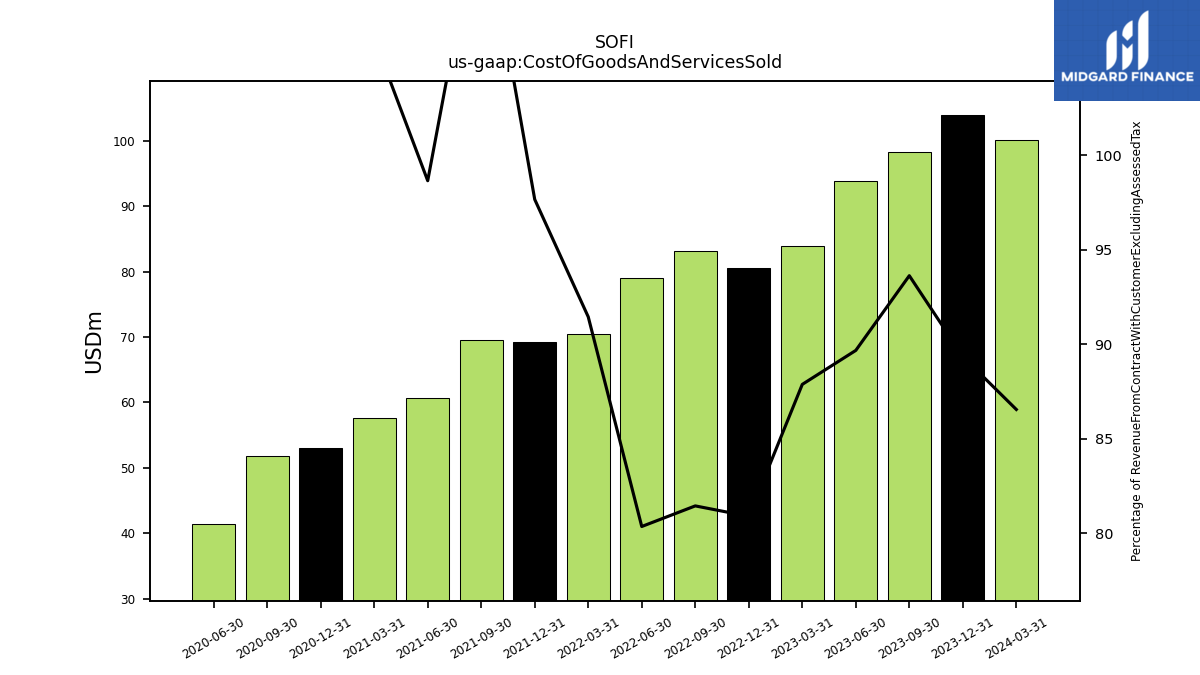
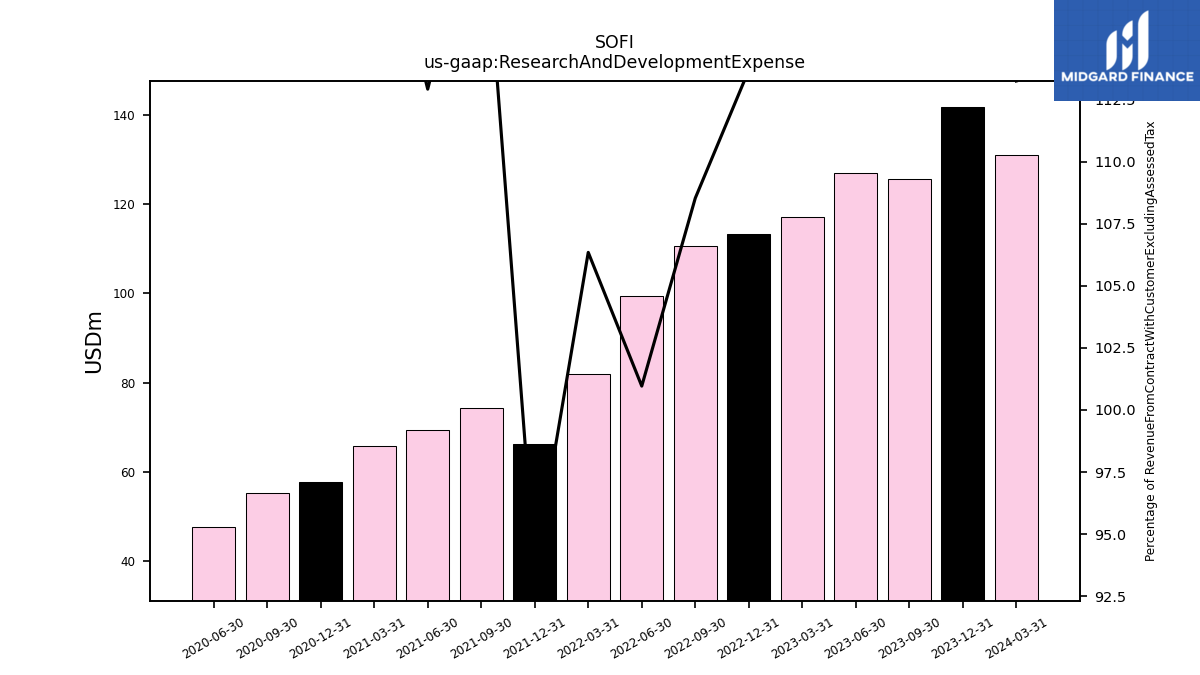
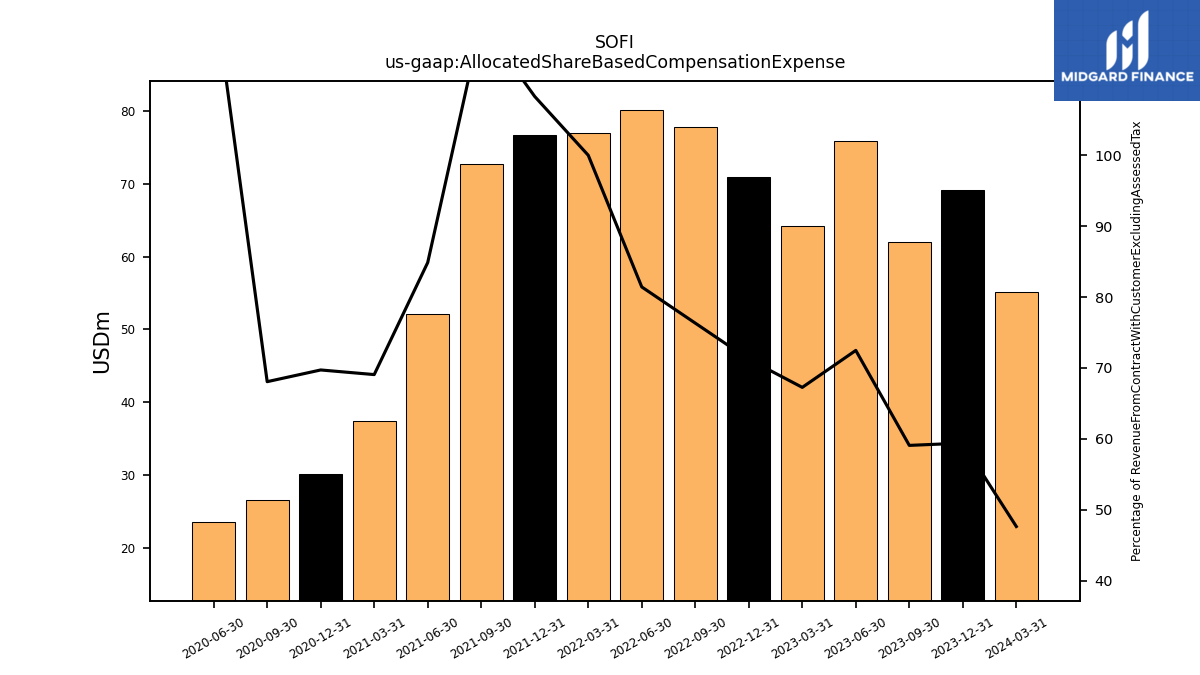
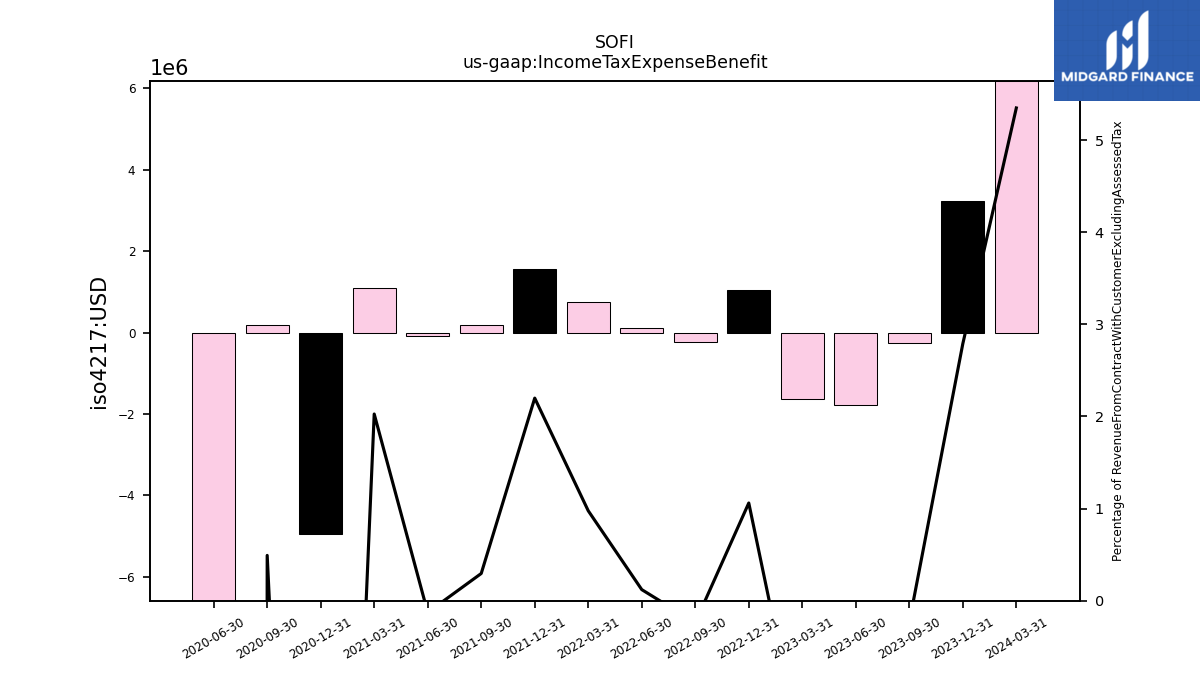
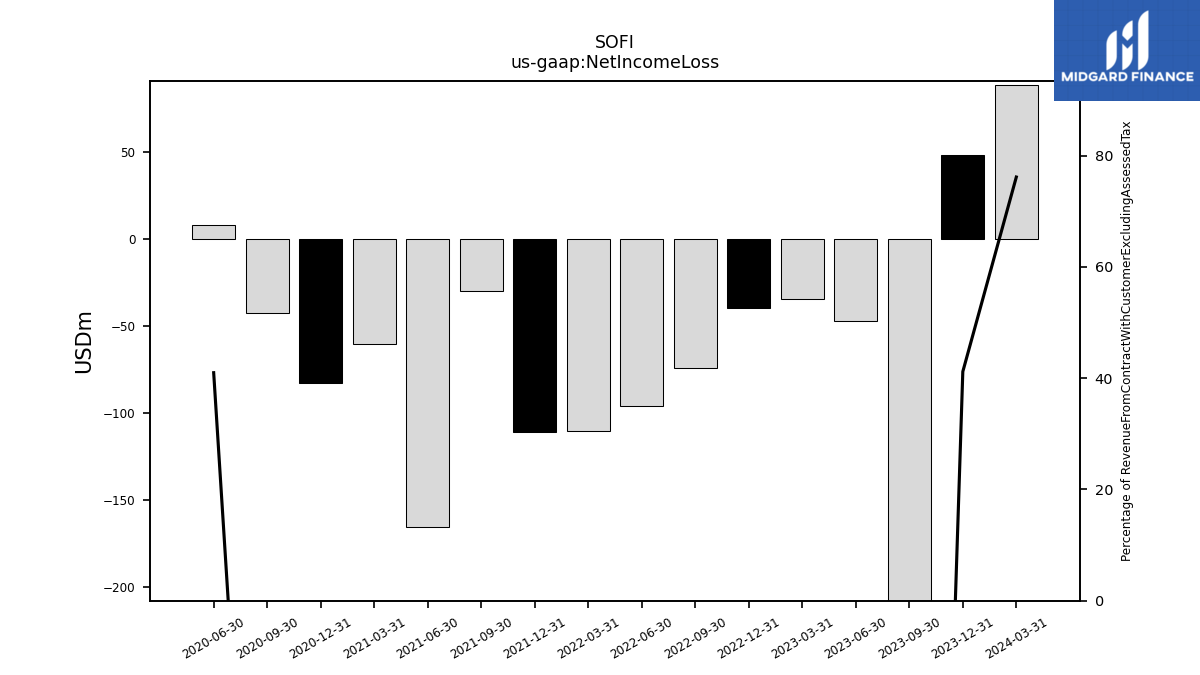
| Revenue From Contract With Customer Excluding Assessed Tax | 115.61 | 116.33 | 104.94 | 104.69 | 95.48 | 99.65 | 102.00 | 98.42 | 77.02 | 70.85 | 61.19 | 61.45 | 54.23 | 43.16 | 39.01 | 19.05 | |
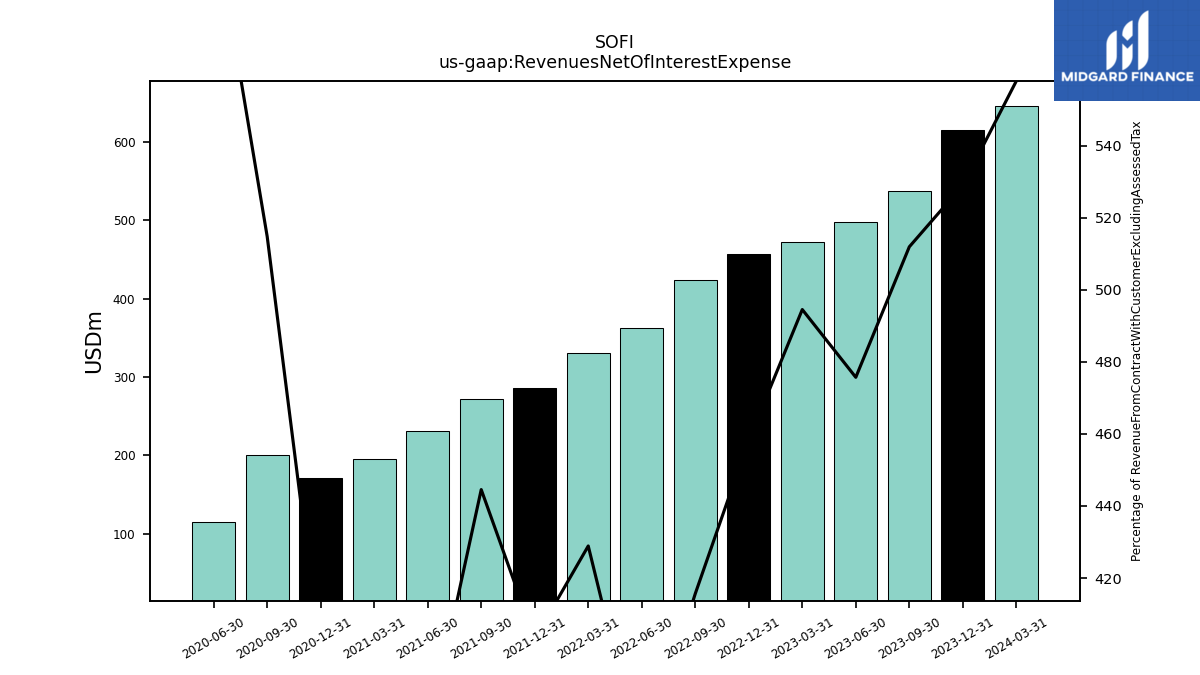
| Revenues Net Of Interest Expense | 645.00 | 615.40 | 537.21 | 498.02 | 472.16 | 456.68 | 423.99 | 362.53 | 330.34 | 285.61 | 272.01 | 231.27 | 195.98 | 171.49 | 200.79 | 114.95 | |
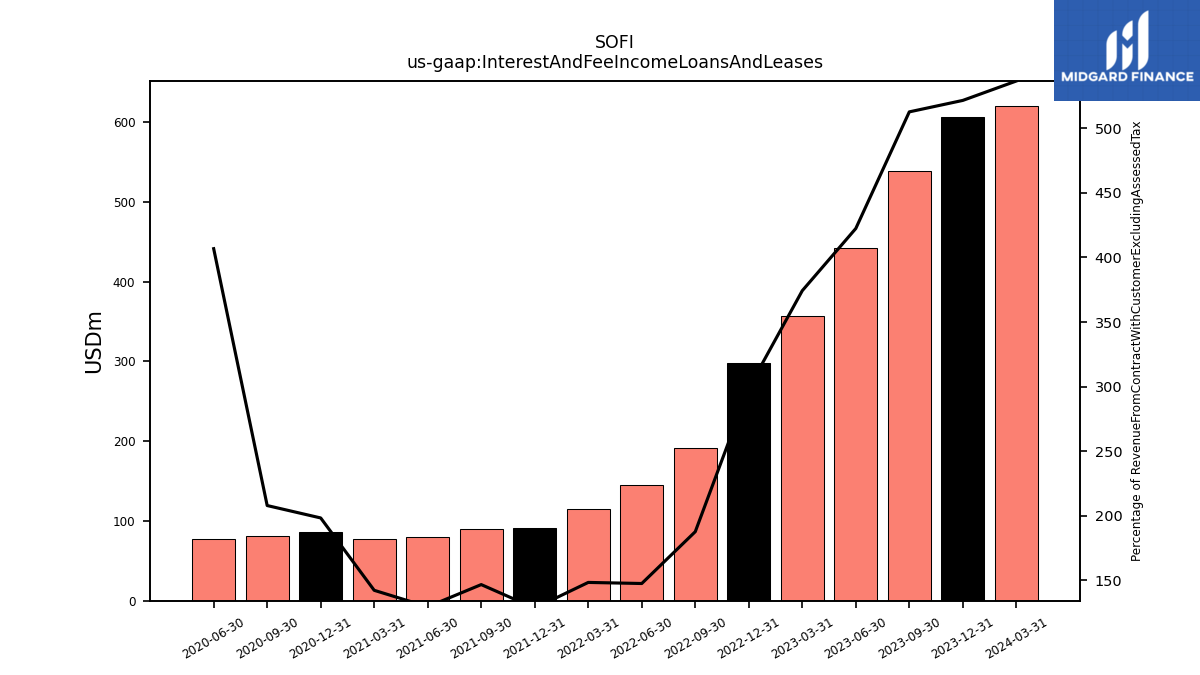
| Interest And Fee Income Loans And Leases | 620.23 | 606.65 | 537.95 | 442.19 | 357.34 | 297.82 | 191.53 | 145.34 | 114.39 | 91.12 | 89.84 | 79.68 | 77.22 | 85.62 | 81.13 | 77.48 | |
| Interest Income Operating | 665.91 | 645.24 | 564.27 | 470.00 | 371.56 | 307.41 | 198.04 | 149.51 | 118.41 | 94.78 | 93.60 | 84.11 | 82.53 | 92.07 | 88.12 | 86.06 | |
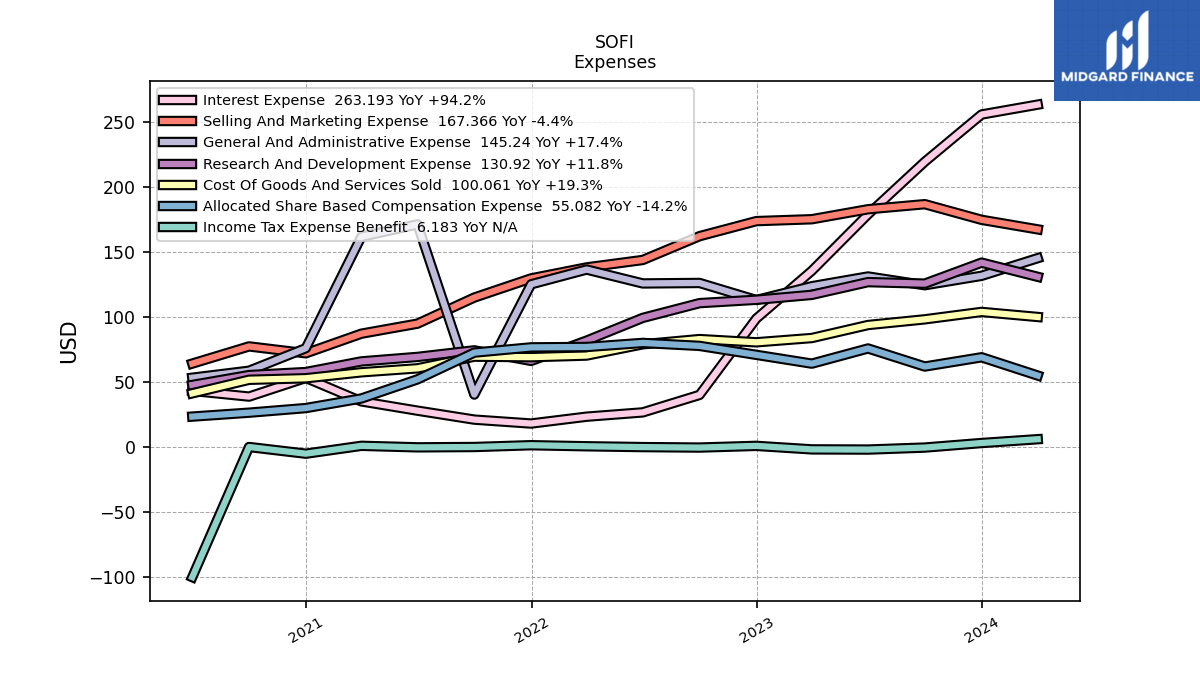
| Cost Of Revenue | 100.06 | 103.95 | 98.26 | 93.89 | 83.91 | 80.61 | 83.08 | 79.09 | 70.44 | 69.19 | 69.59 | 60.62 | 57.57 | 53.01 | 51.82 | 41.41 | |
| Cost Of Goods And Services Sold | 100.06 | 103.95 | 98.26 | 93.89 | 83.91 | 80.61 | 83.08 | 79.09 | 70.44 | 69.19 | 69.59 | 60.62 | 57.57 | 53.01 | 51.82 | 41.41 | |
| Research And Development Expense | 130.92 | 141.82 | 125.70 | 126.84 | 117.06 | 113.28 | 110.70 | 99.37 | 81.91 | 66.32 | 74.43 | 69.39 | 65.95 | 57.77 | 55.43 | 47.83 | |
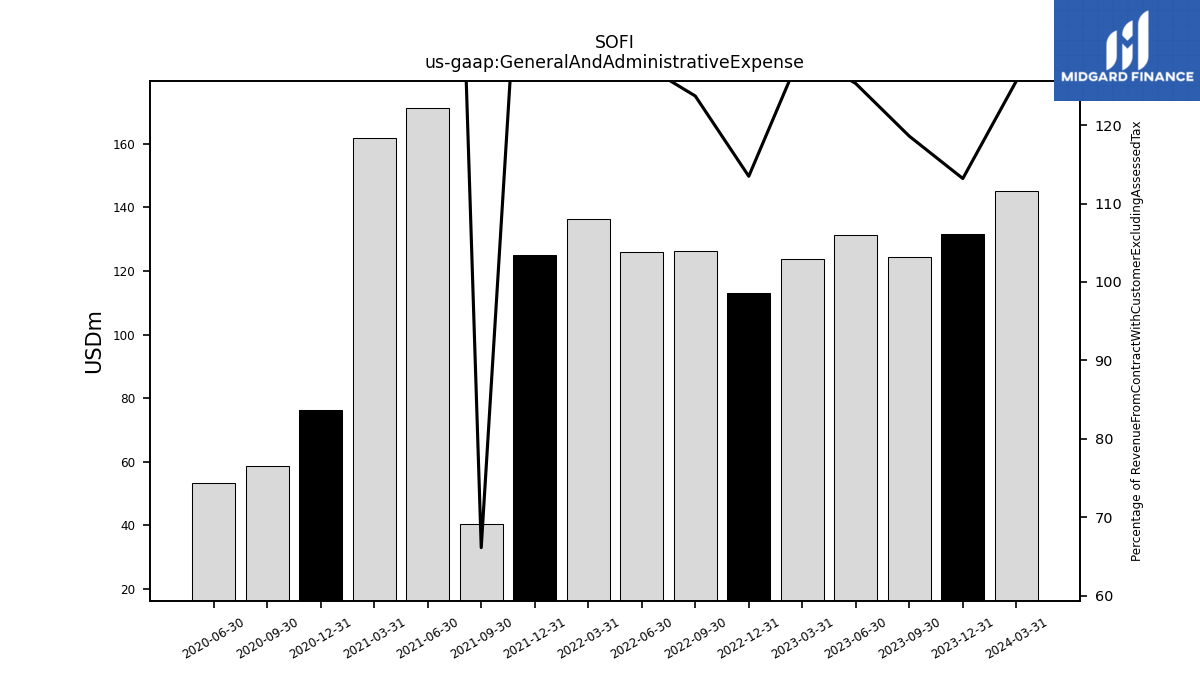
| General And Administrative Expense | 145.24 | 131.69 | 124.46 | 131.18 | 123.69 | 113.08 | 126.20 | 125.83 | 136.50 | 125.16 | 40.46 | 171.22 | 161.70 | 76.10 | 58.77 | 53.40 | |
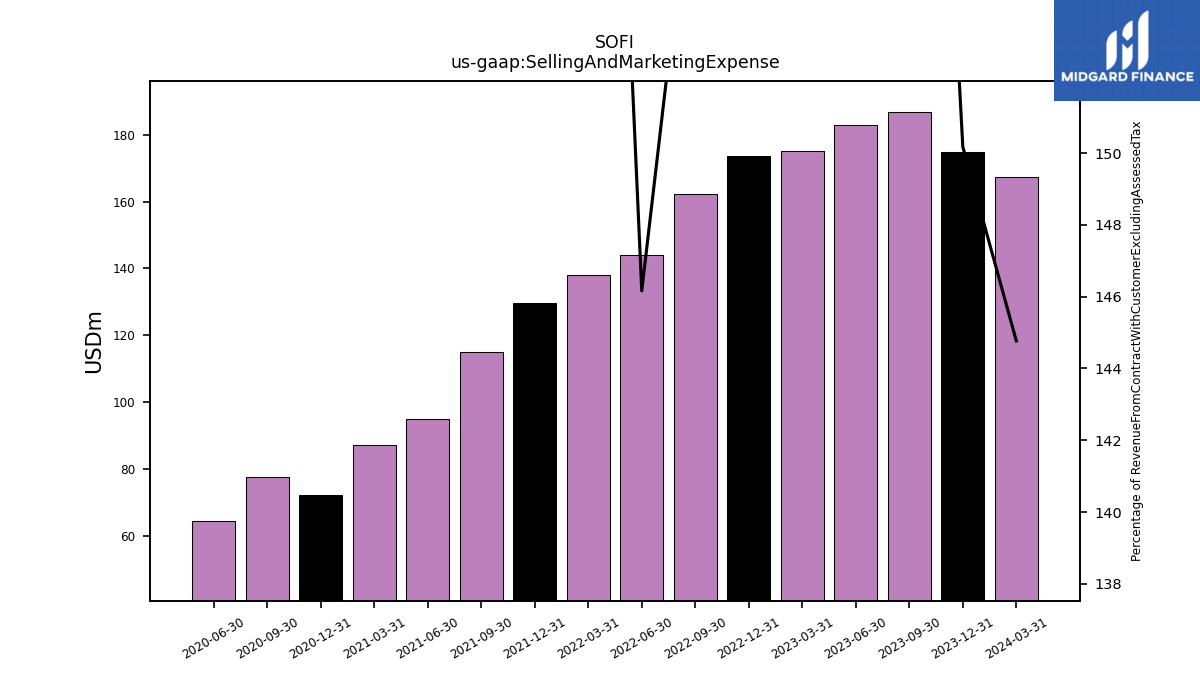
| Selling And Marketing Expense | 167.37 | 174.71 | 186.72 | 182.82 | 175.15 | 173.70 | 162.13 | 143.85 | 138.14 | 129.71 | 114.98 | 94.95 | 87.23 | 72.18 | 77.46 | 64.27 | |
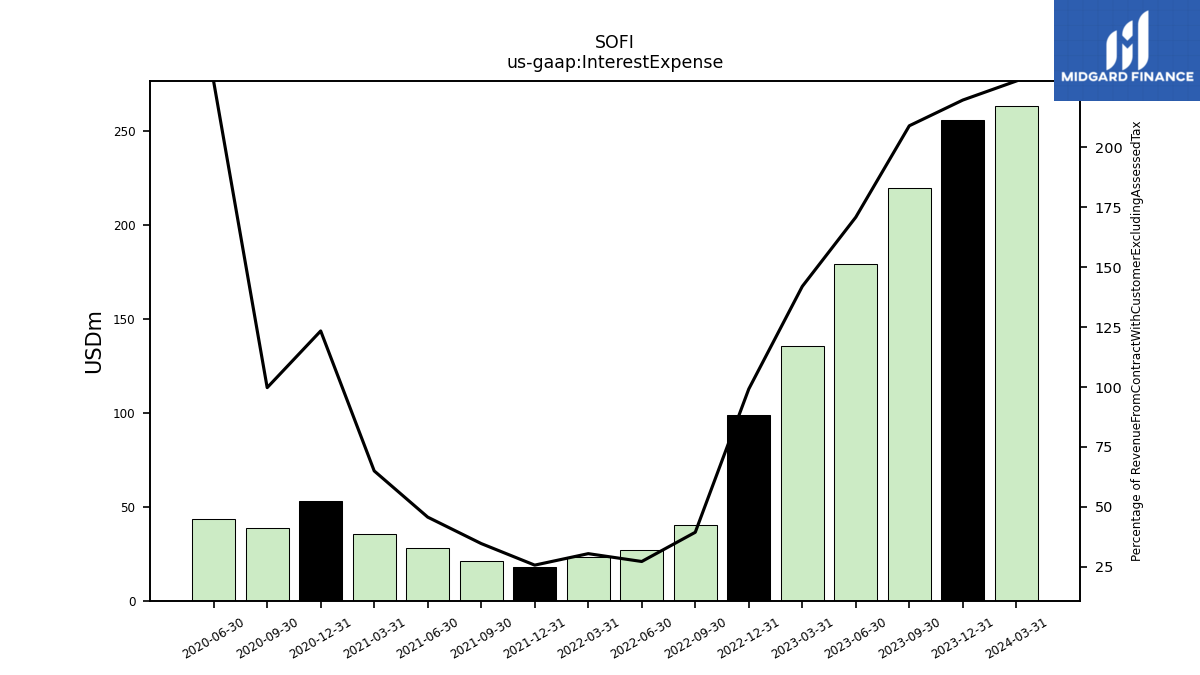
| Interest Expense | 263.19 | 255.60 | 219.31 | 178.87 | 135.55 | 98.82 | 40.19 | 26.78 | 23.48 | 18.21 | 21.23 | 28.10 | 35.25 | 53.25 | 38.91 | 43.32 | |
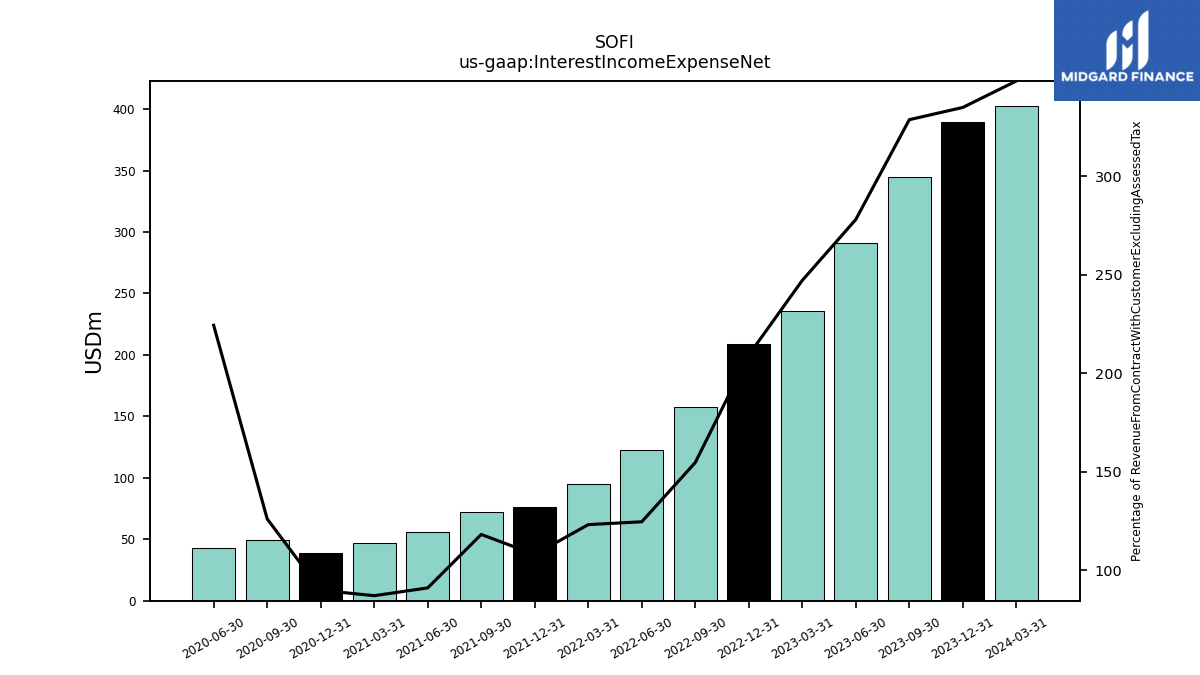
| Interest Income Expense Net | 402.72 | 389.64 | 344.96 | 291.13 | 236.01 | 208.58 | 157.85 | 122.73 | 94.93 | 76.58 | 72.38 | 56.01 | 47.28 | 38.82 | 49.21 | 42.75 | |
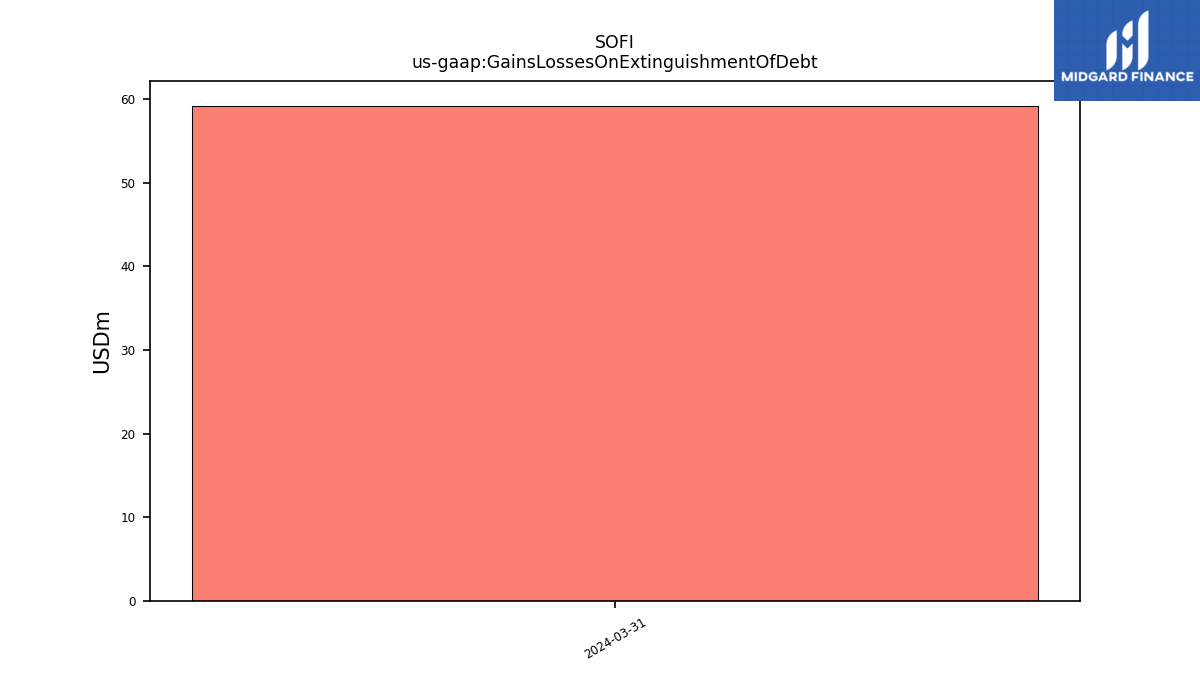
| Gains Losses On Extinguishment Of Debt | 59.19 | NA | NA | NA | NA | NA | NA | NA | NA | NA | NA | NA | NA | NA | NA | NA | |
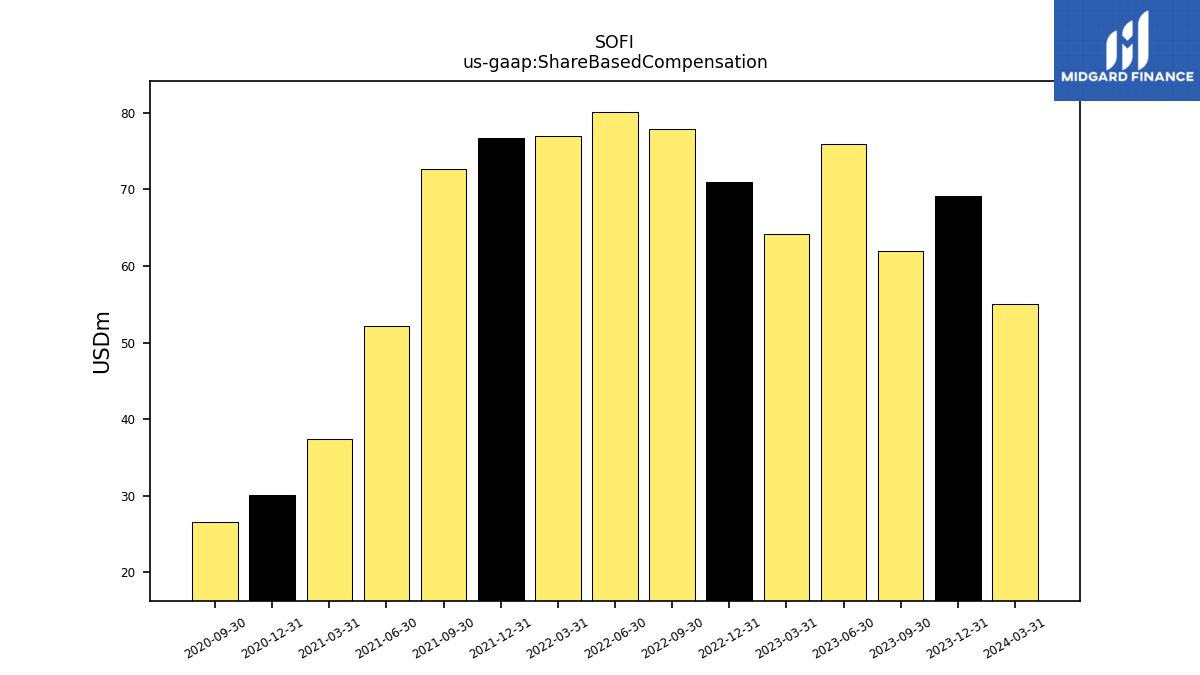
| Allocated Share Based Compensation Expense | 55.08 | 69.11 | 62.01 | 75.88 | 64.23 | 70.98 | 77.86 | 80.14 | 77.02 | 76.72 | 72.68 | 52.15 | 37.45 | 30.09 | 26.55 | 23.55 | |
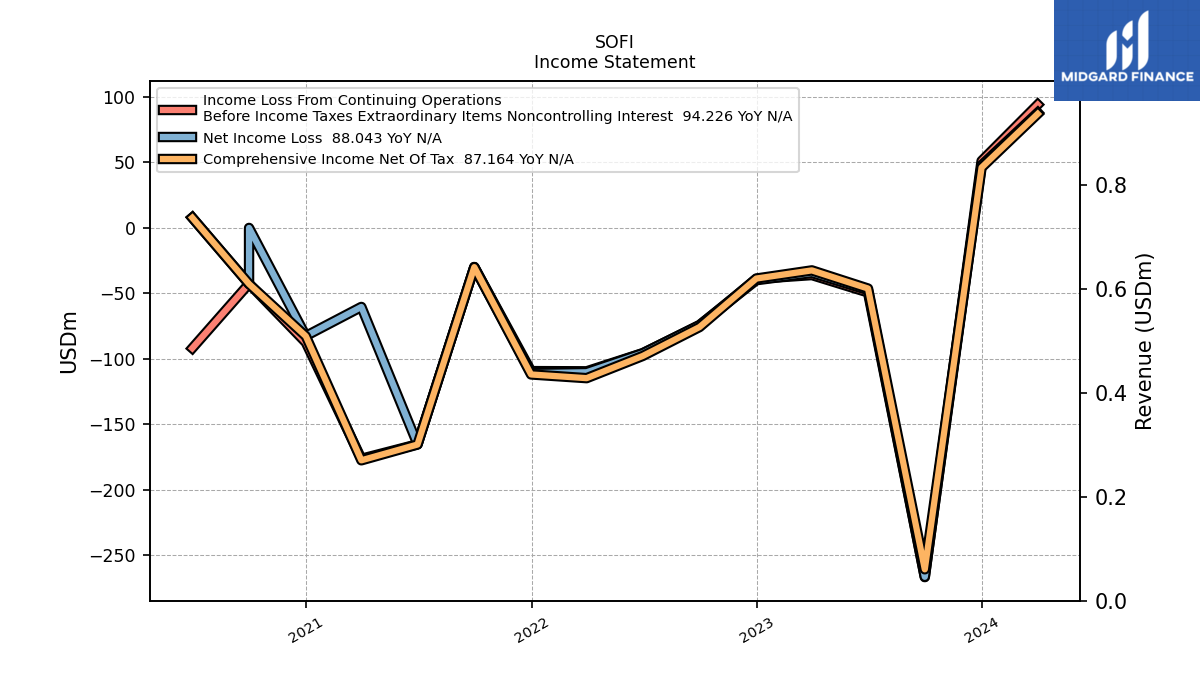
| Income Tax Expense Benefit | 6.18 | 3.25 | -0.24 | -1.78 | -1.64 | 1.06 | -0.24 | 0.12 | 0.75 | 1.56 | 0.18 | -0.08 | 1.10 | -4.95 | 0.19 | -99.77 | |
| Net Income Loss | 88.04 | 47.91 | -266.68 | -47.55 | -34.42 | -40.01 | -74.21 | -95.83 | -110.36 | -111.01 | -30.05 | -165.31 | -60.39 | -82.62 | -42.88 | 7.81 | |
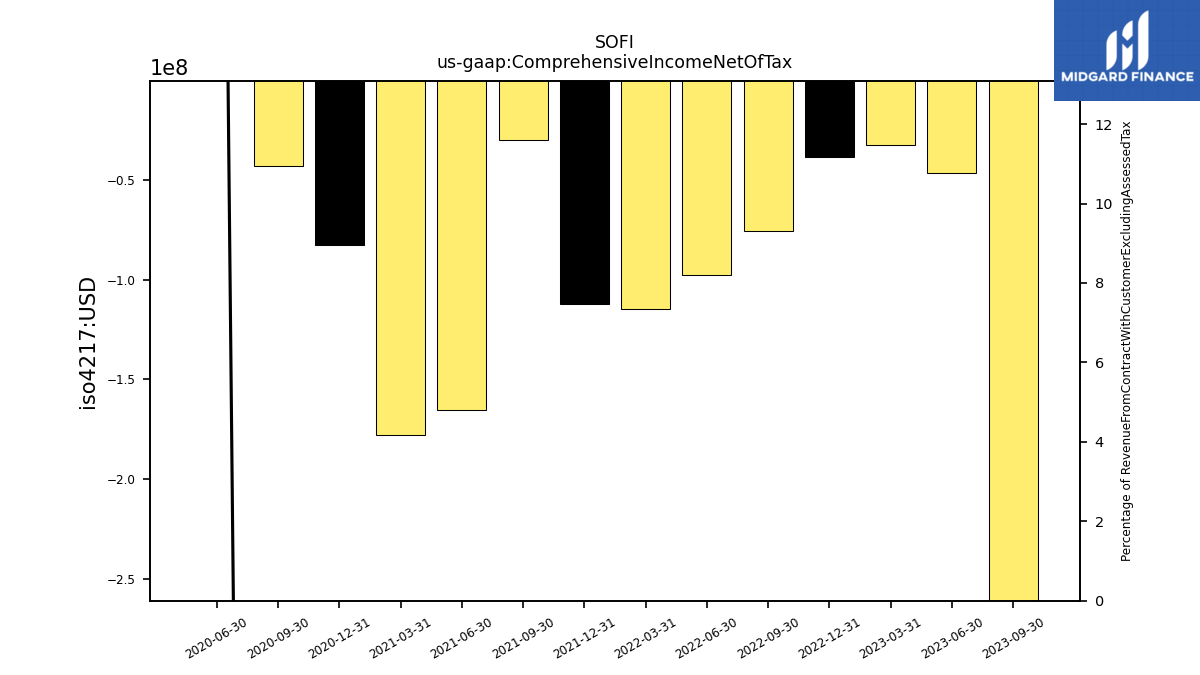
| Comprehensive Income Net Of Tax | 87.16 | 46.10 | -260.96 | -46.33 | -32.47 | -38.70 | -75.80 | -97.88 | -114.85 | -112.03 | -29.99 | -165.58 | -177.64 | -82.74 | -42.85 | 7.77 | |
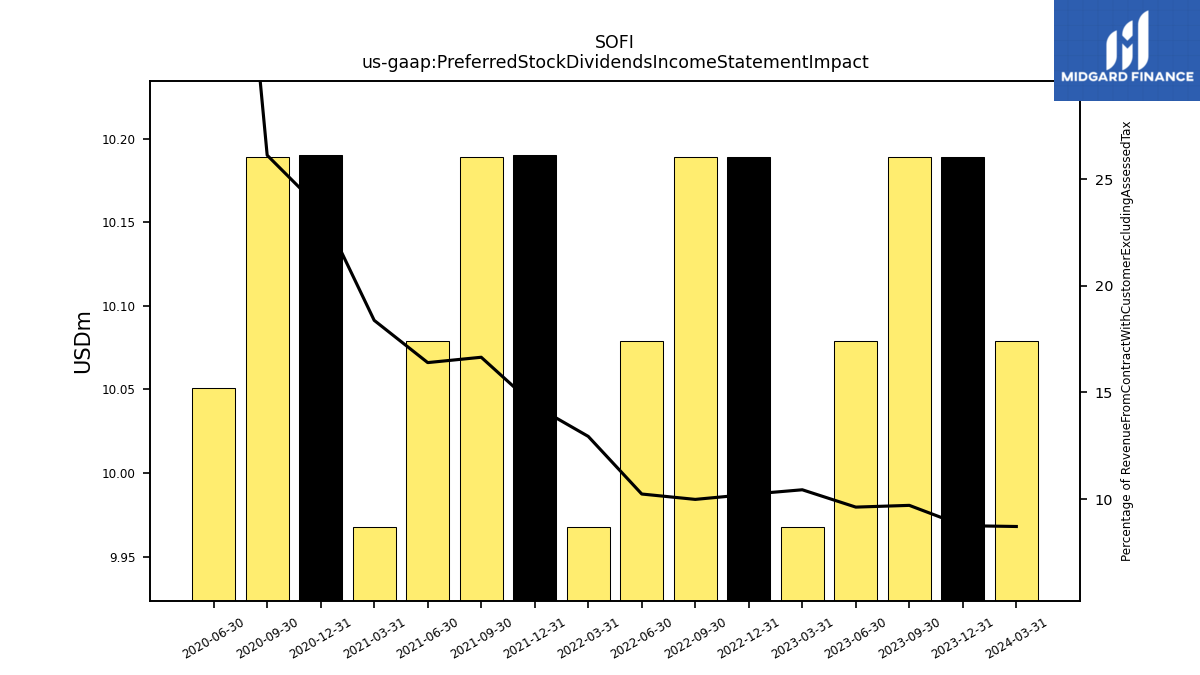
| Preferred Stock Dividends Income Statement Impact | 10.08 | 10.19 | 10.19 | 10.08 | 9.97 | 10.19 | 10.19 | 10.08 | 9.97 | 10.19 | 10.19 | 10.08 | 9.97 | 10.19 | 10.19 | 10.05 | |
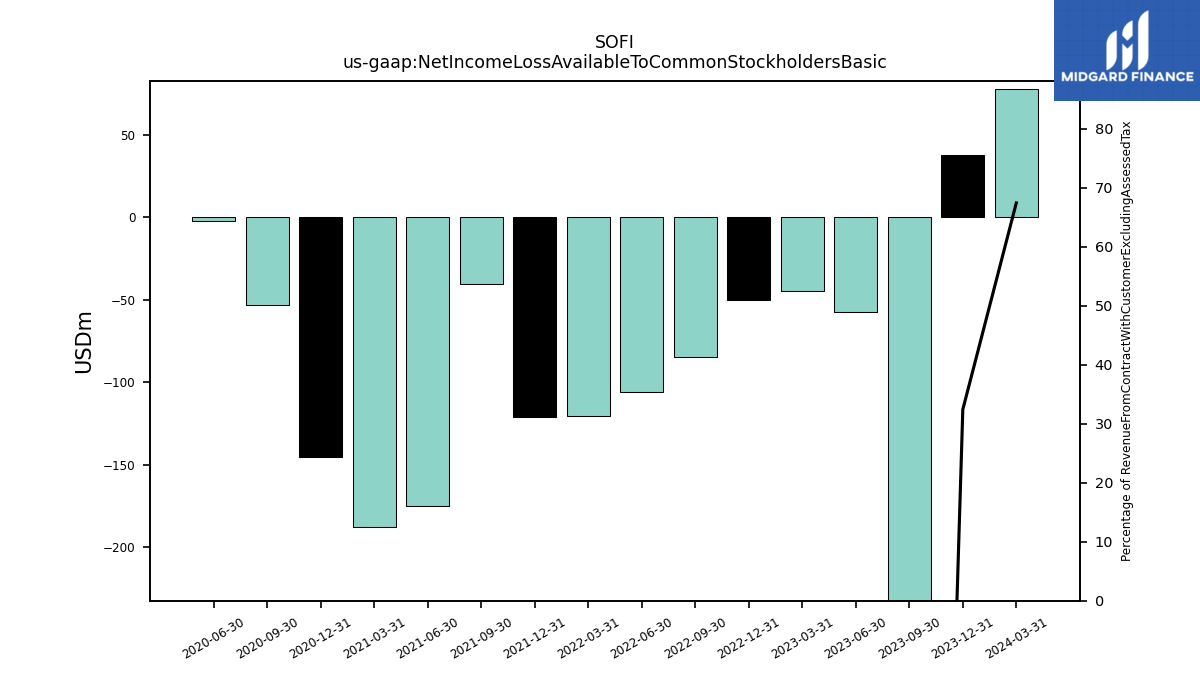
| Net Income Loss Available To Common Stockholders Basic | 77.96 | 37.72 | -276.87 | -57.63 | -44.39 | -50.20 | -84.40 | -105.91 | -120.33 | -121.20 | -40.24 | -175.39 | -187.53 | -145.46 | -53.07 | -2.24 | |
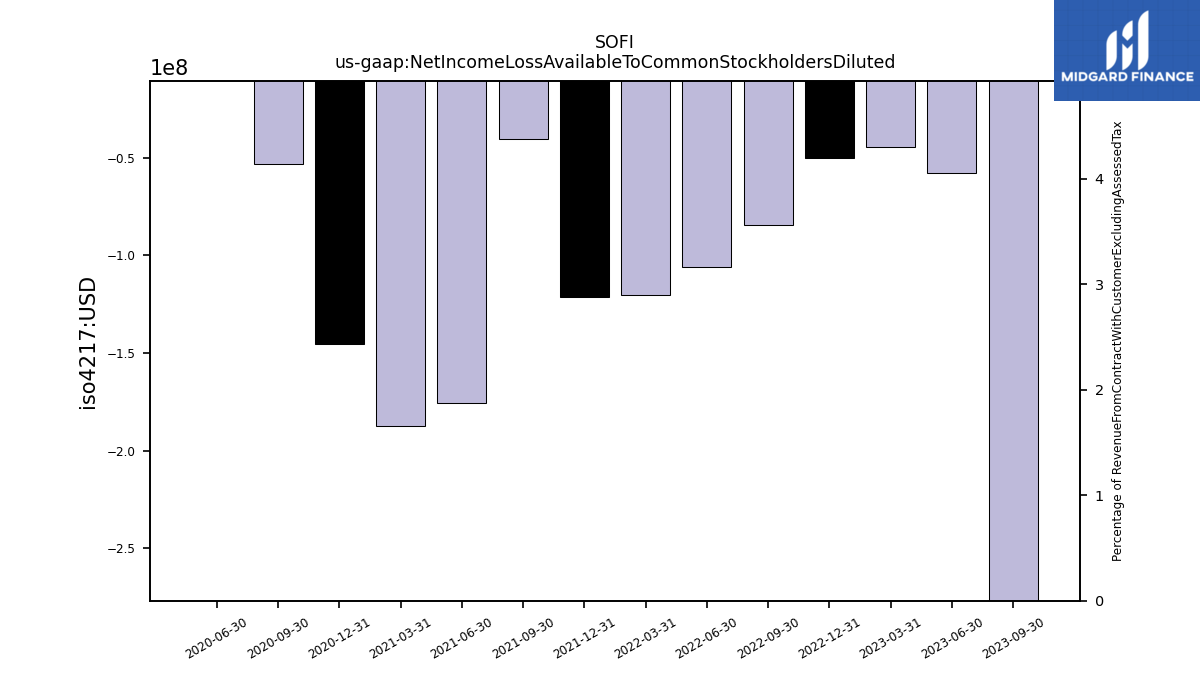
| Net Income Loss Available To Common Stockholders Diluted | 22.52 | 37.72 | -276.87 | -57.63 | -44.39 | -50.20 | -84.40 | -105.91 | -120.33 | -121.20 | -40.24 | -175.39 | -187.53 | -145.46 | -53.07 | -2.24 | |
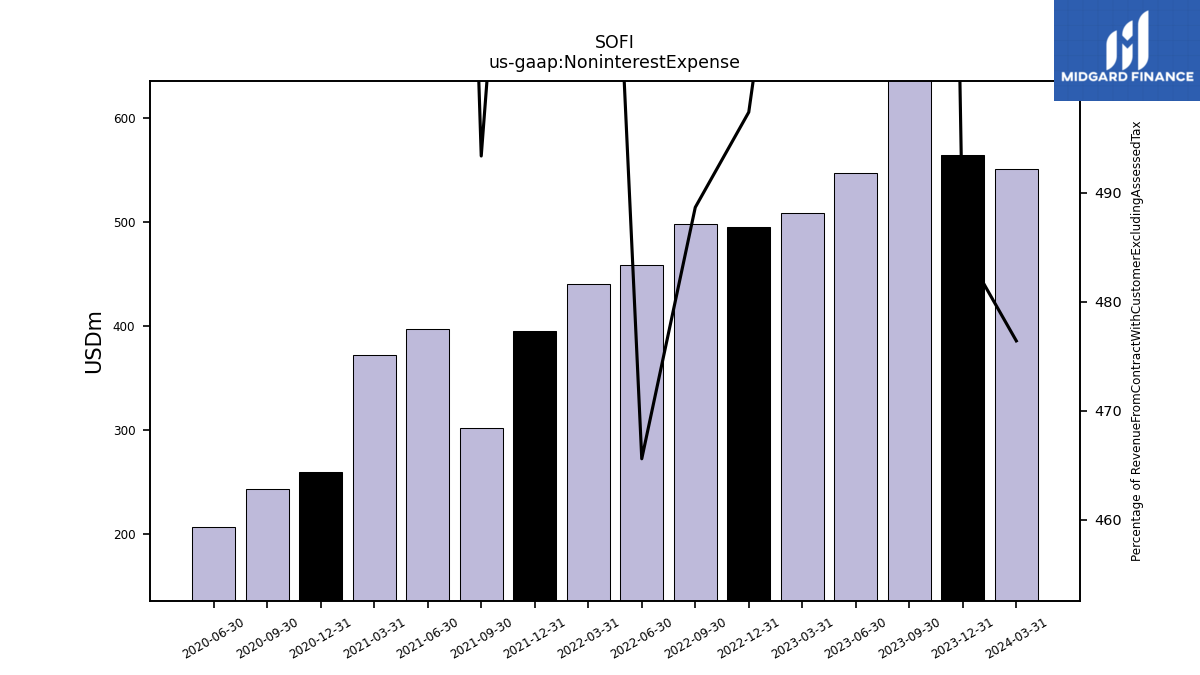
| Noninterest Expense | 550.77 | 564.25 | 804.14 | 547.35 | 508.22 | 495.63 | 498.44 | 458.24 | 439.95 | 395.06 | 301.87 | 396.67 | 372.45 | 259.06 | 243.47 | 206.91 | |
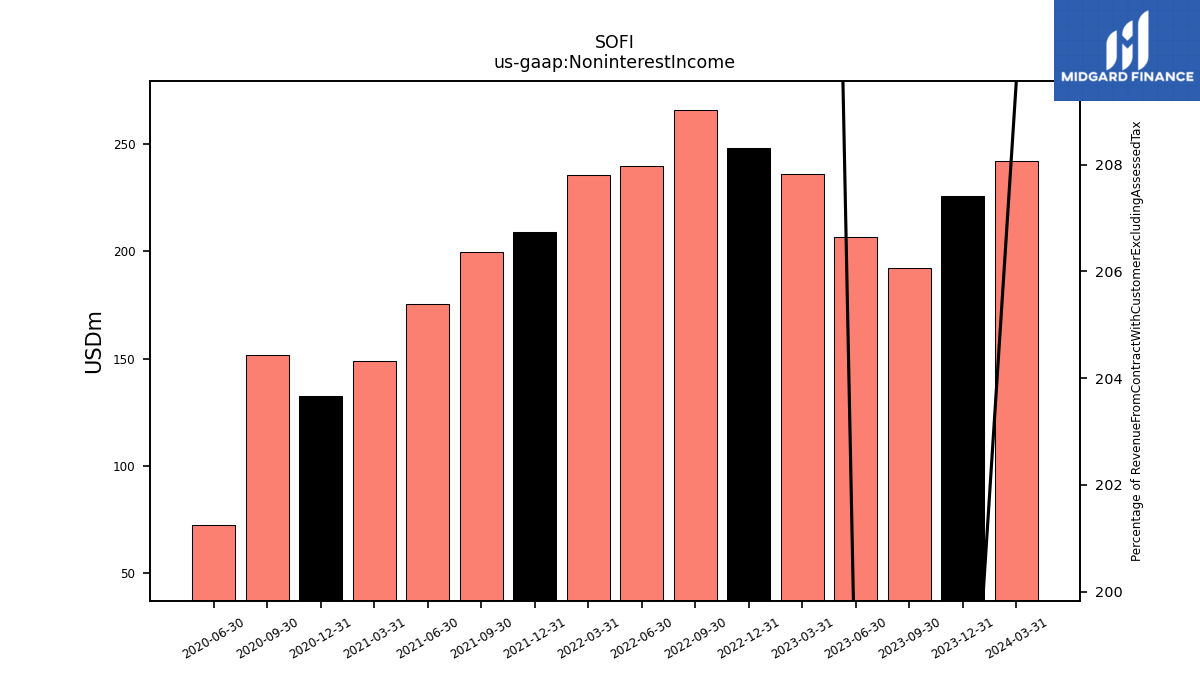
| Noninterest Income | 242.28 | 225.76 | 192.25 | 206.89 | 236.15 | 248.09 | 266.13 | 239.80 | 235.41 | 209.03 | 199.63 | 175.26 | 148.70 | 132.67 | 151.57 | 72.20 | |
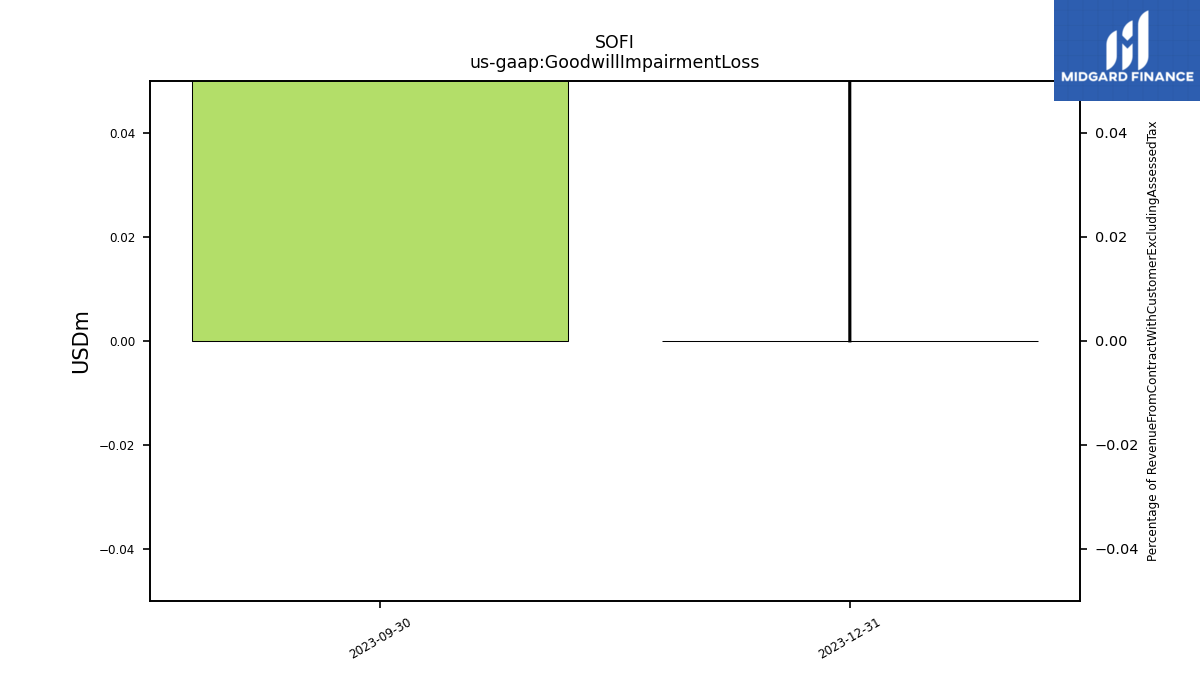
| Goodwill Impairment Loss | NA | 0.00 | 247.17 | NA | NA | NA | NA | NA | NA | NA | NA | NA | NA | NA | NA | NA |
| 2024-03-31 | 2023-12-31 | 2023-09-30 | 2023-06-30 | 2023-03-31 | 2022-12-31 | 2022-09-30 | 2022-06-30 | 2022-03-31 | 2021-12-31 | 2021-09-30 | 2021-06-30 | 2021-03-31 | 2020-12-31 | 2020-09-30 | 2020-06-30 | ||
|---|---|---|---|---|---|---|---|---|---|---|---|---|---|---|---|---|---|
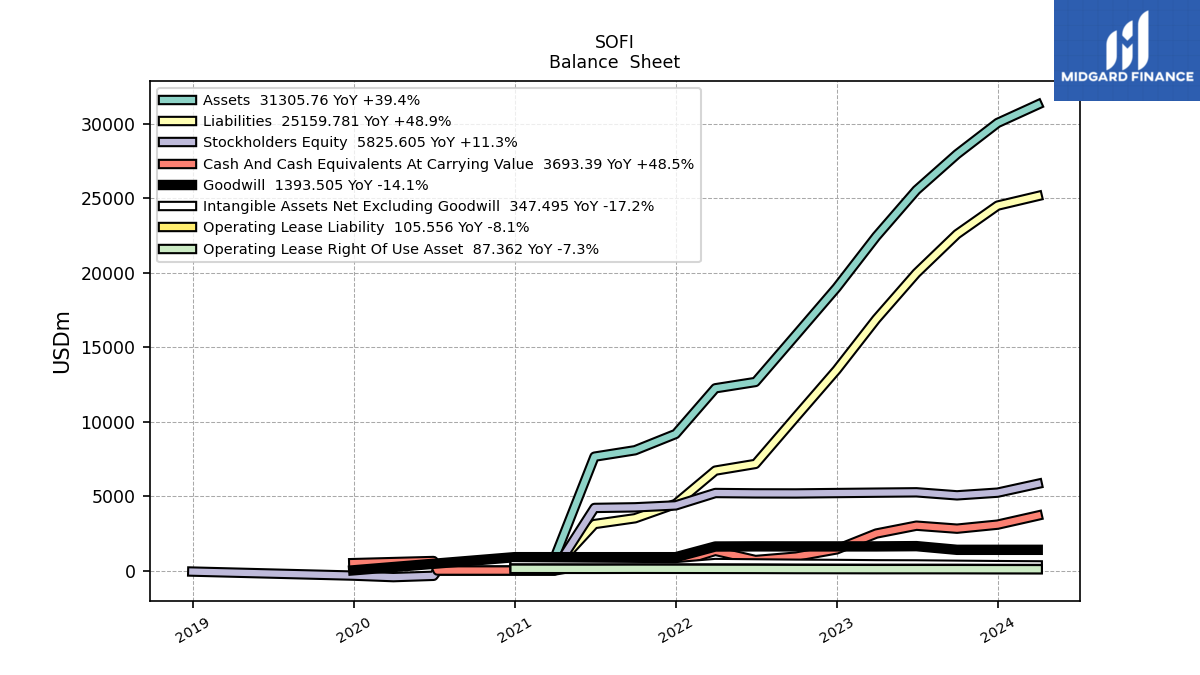
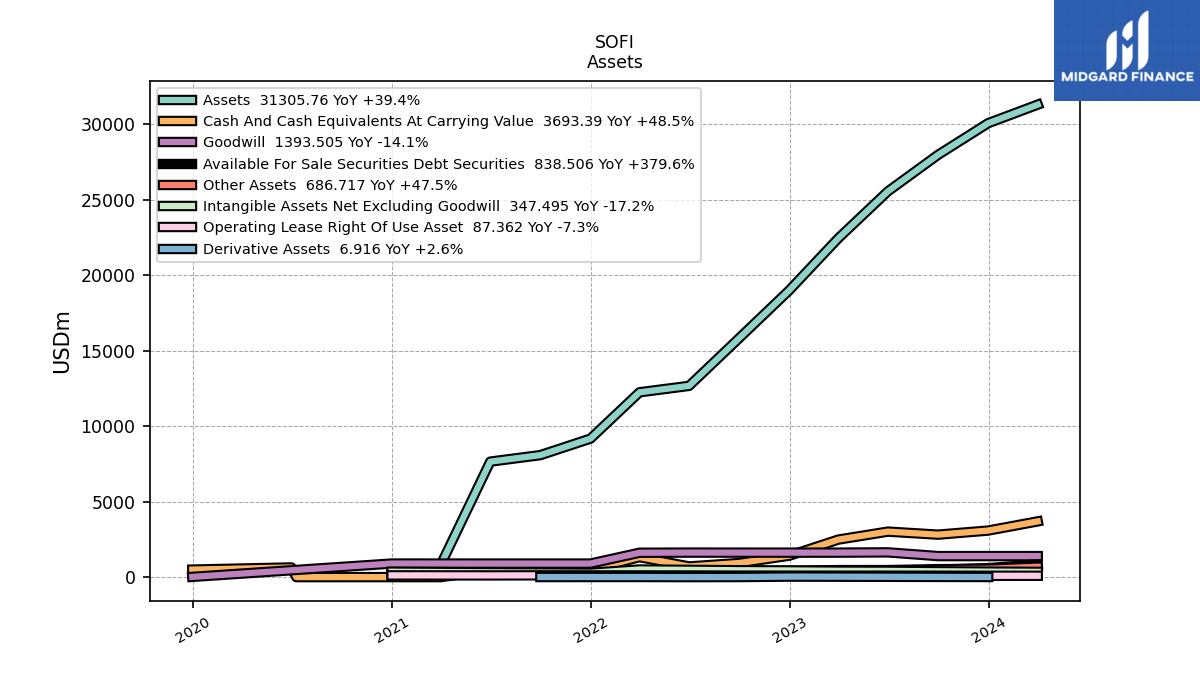
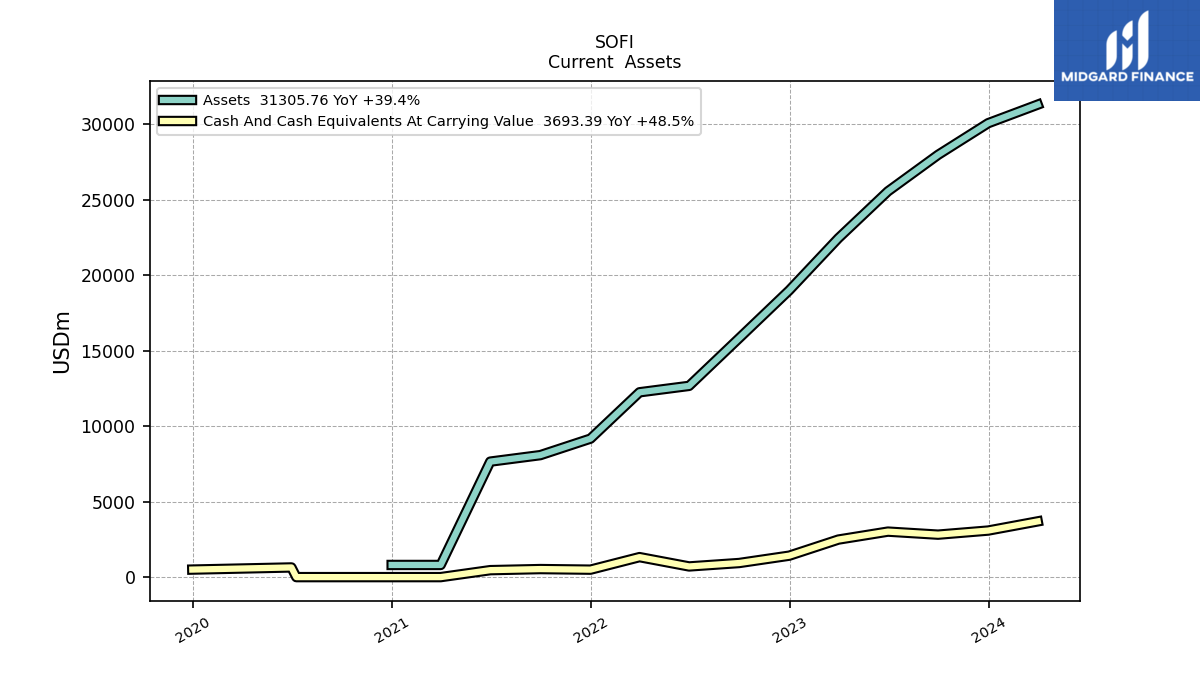
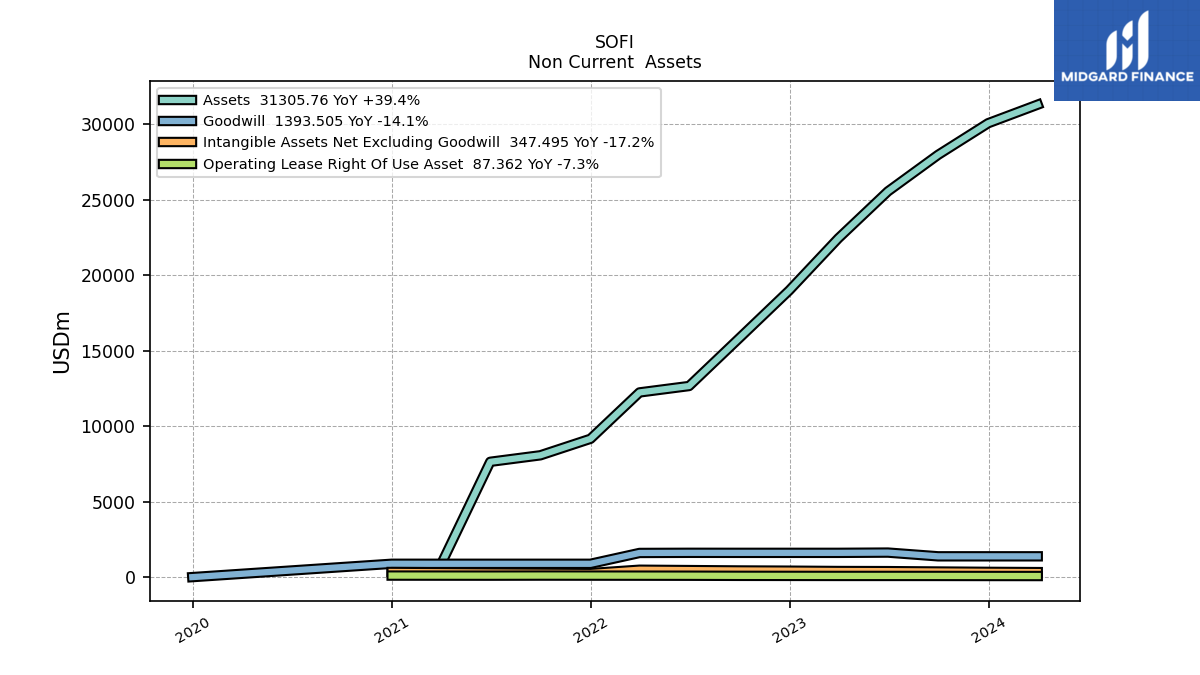
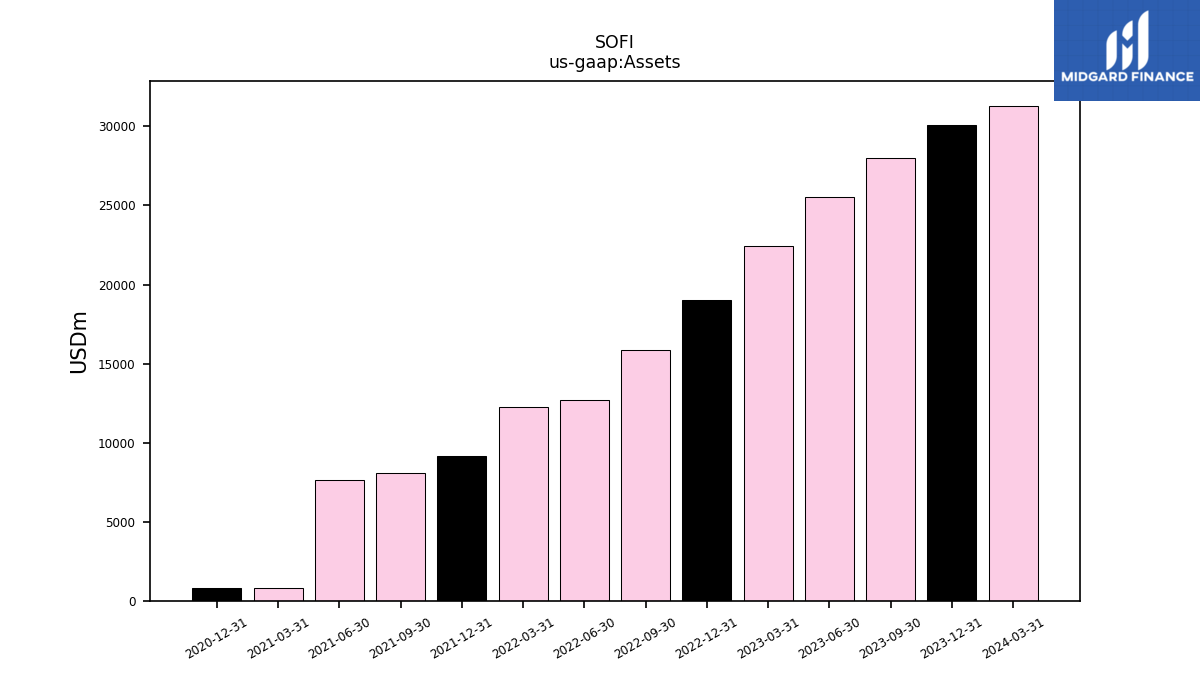
| Assets | 31305.76 | 30074.86 | 27977.15 | 25561.45 | 22452.96 | 19007.67 | 15834.90 | 12670.89 | 12246.58 | 9176.33 | 8083.32 | 7653.00 | 805.82 | 806.08 | NA | NA | |
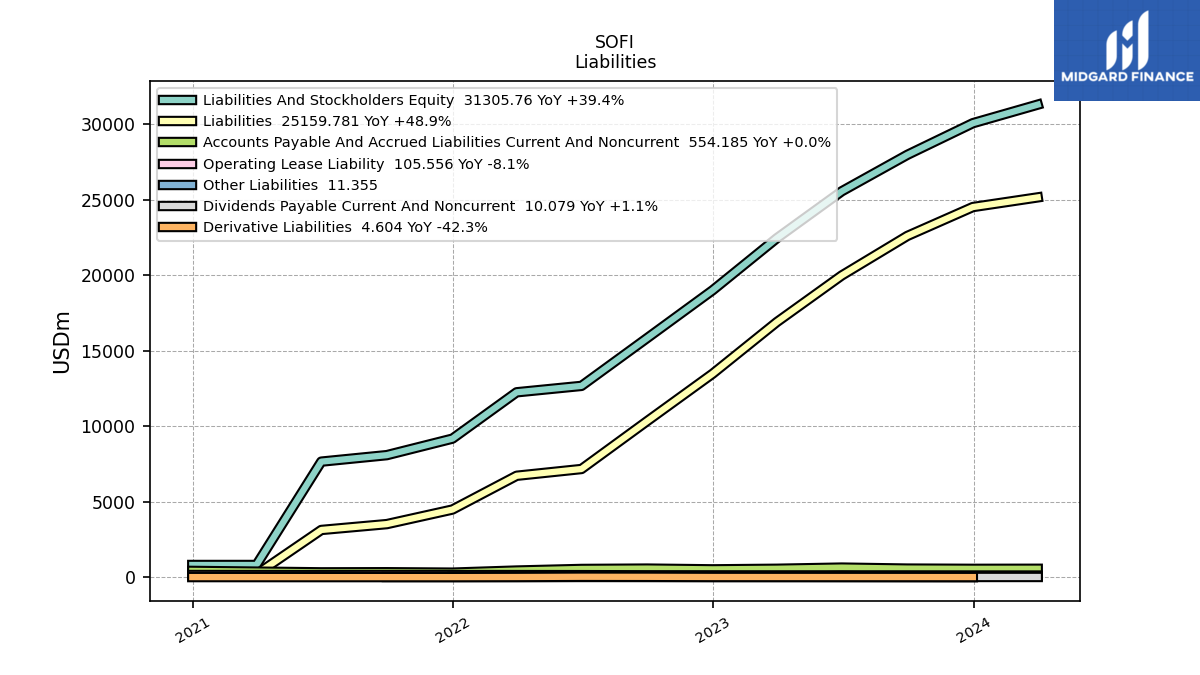
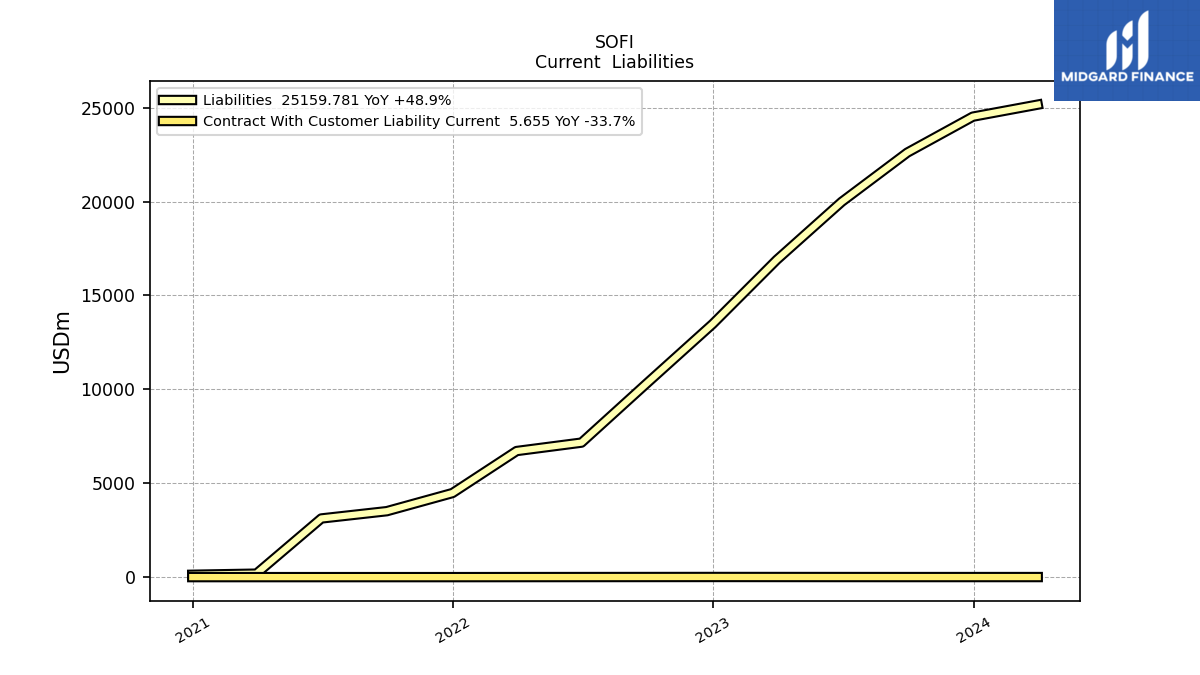
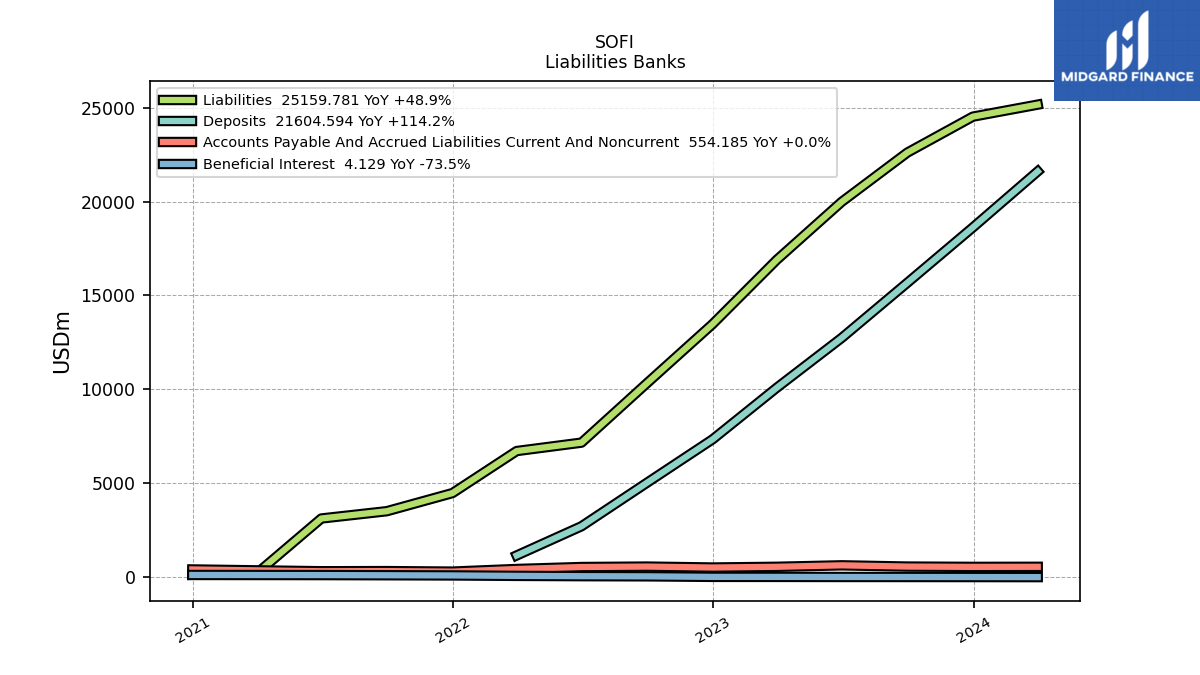
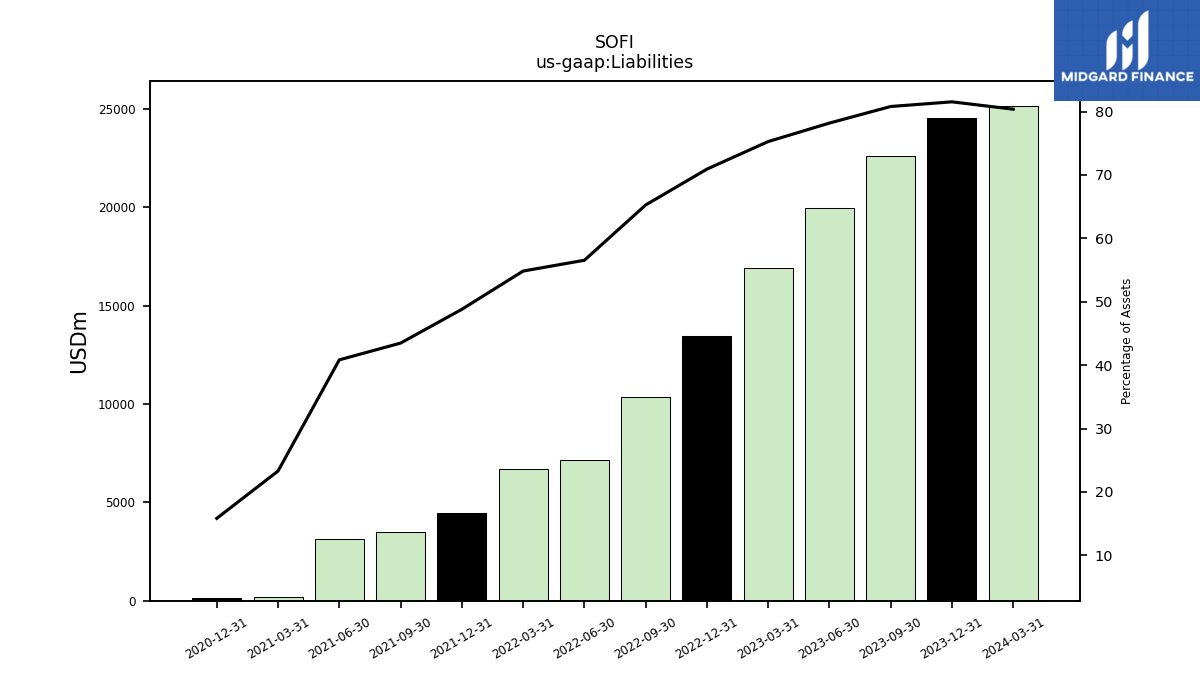
| Liabilities | 25159.78 | 24519.87 | 22603.39 | 19983.41 | 16898.51 | 13479.20 | 10333.53 | 7164.33 | 6715.90 | 4478.62 | 3514.42 | 3125.24 | 187.77 | 127.64 | NA | NA | |
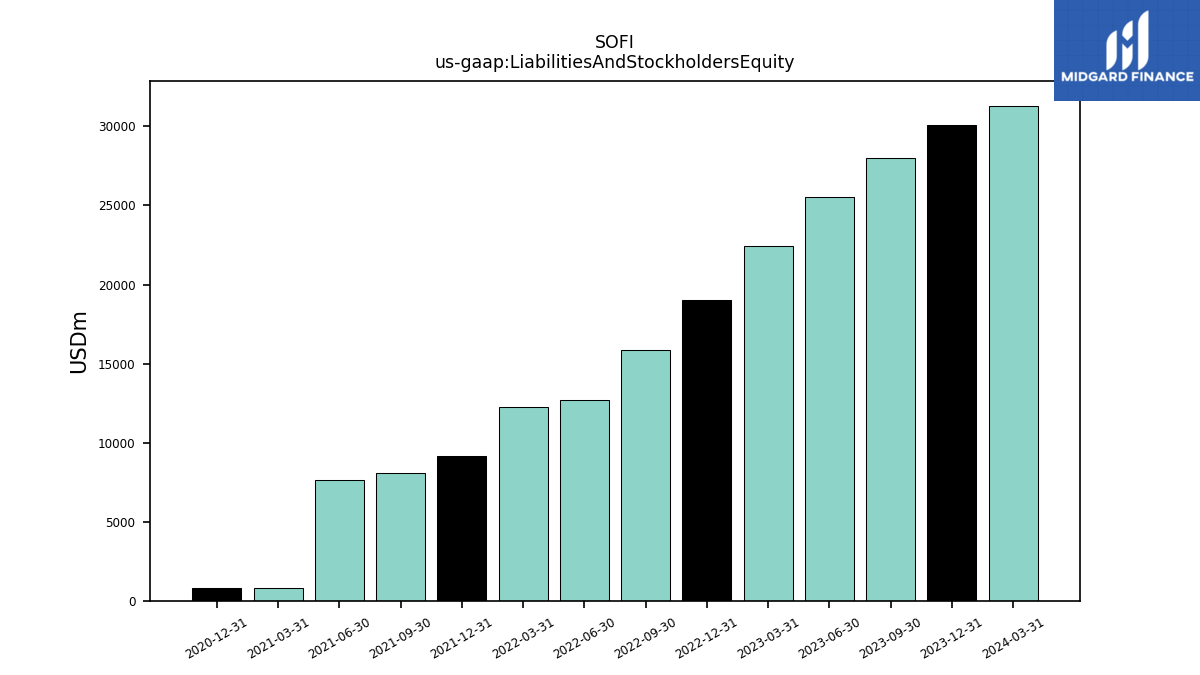
| Liabilities And Stockholders Equity | 31305.76 | 30074.86 | 27977.15 | 25561.45 | 22452.96 | 19007.67 | 15834.90 | 12670.89 | 12246.58 | 9176.33 | 8083.32 | 7653.00 | 805.82 | 806.08 | NA | NA | |
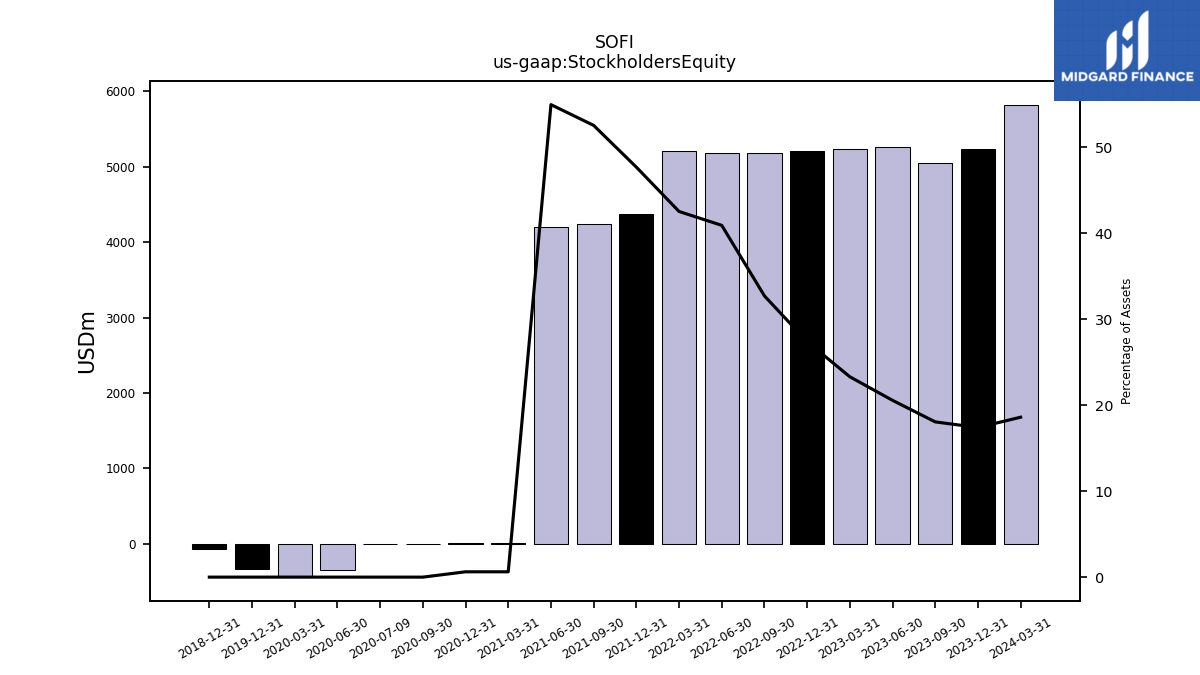
| Stockholders Equity | 5825.60 | 5234.61 | 5053.39 | 5257.66 | 5234.07 | 5208.10 | 5181.00 | 5186.18 | 5210.30 | 4377.33 | 4248.53 | 4207.39 | 5.00 | 5.00 | 0.02 | -352.51 |
| 2024-03-31 | 2023-12-31 | 2023-09-30 | 2023-06-30 | 2023-03-31 | 2022-12-31 | 2022-09-30 | 2022-06-30 | 2022-03-31 | 2021-12-31 | 2021-09-30 | 2021-06-30 | 2021-03-31 | 2020-12-31 | 2020-09-30 | 2020-06-30 | ||
|---|---|---|---|---|---|---|---|---|---|---|---|---|---|---|---|---|---|
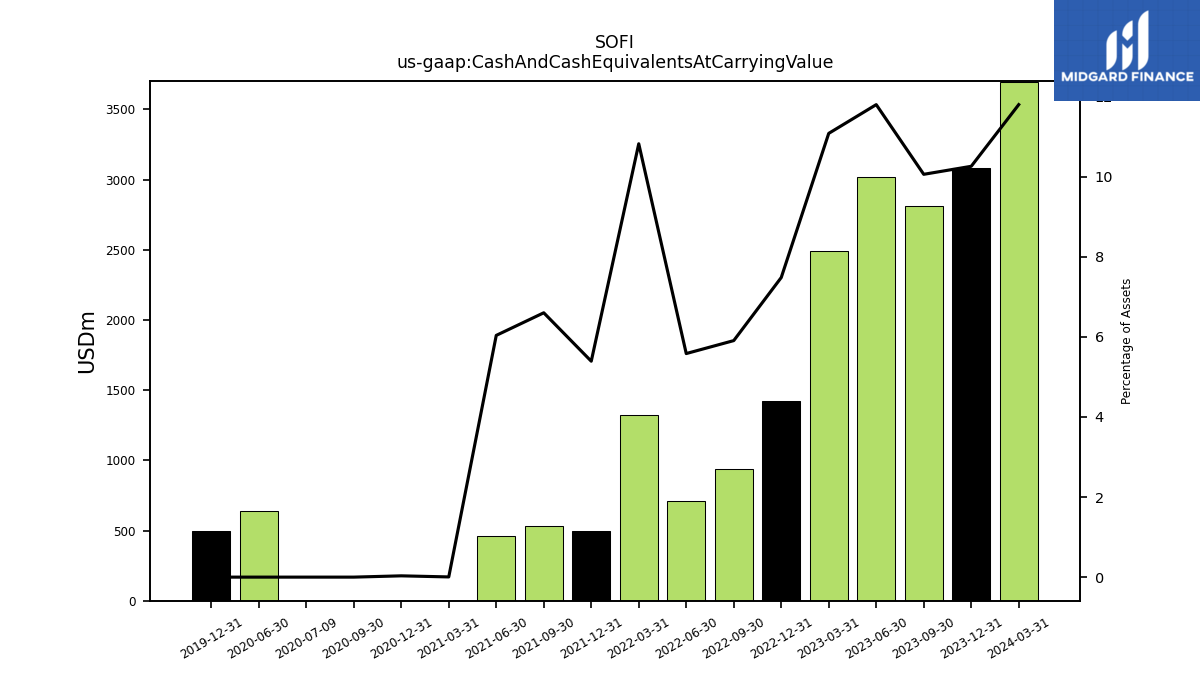
| Cash And Cash Equivalents At Carrying Value | 3693.39 | 3085.02 | 2813.88 | 3015.65 | 2487.78 | 1421.91 | 935.16 | 707.30 | 1325.13 | 494.71 | 533.52 | 461.92 | 0.04 | 0.26 | 0.14 | 641.50 | |
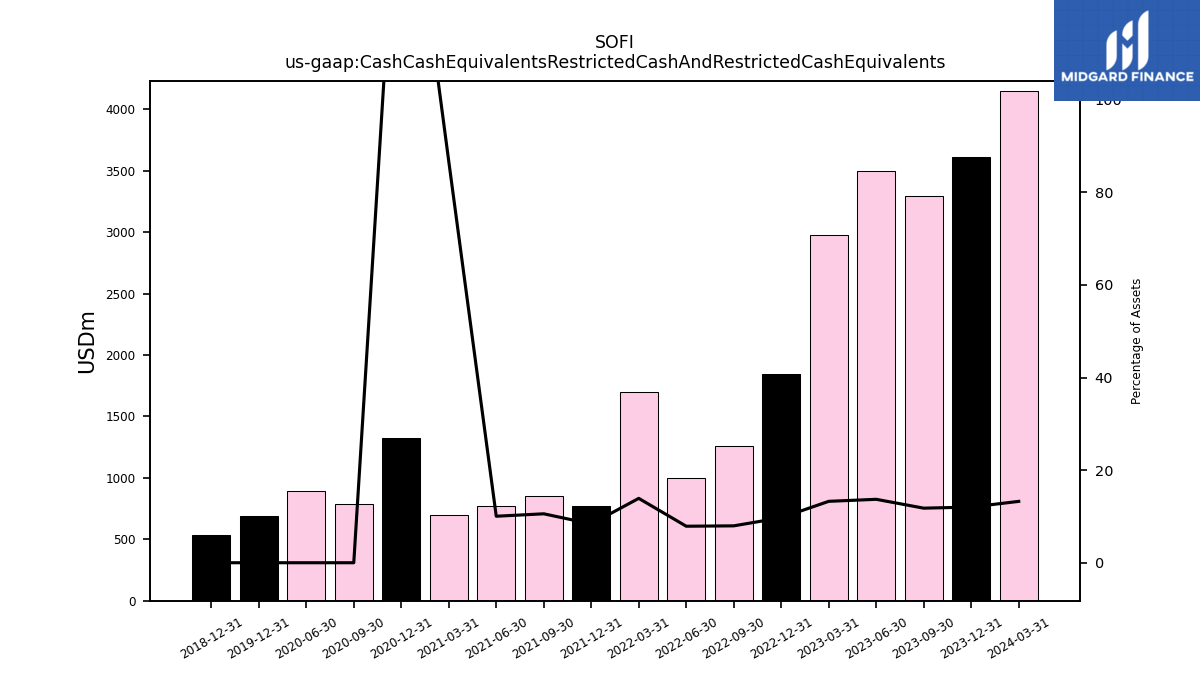
| Cash Cash Equivalents Restricted Cash And Restricted Cash Equivalents | 4147.91 | 3615.58 | 3297.02 | 3501.13 | 2977.51 | 1846.30 | 1261.43 | 998.93 | 1702.21 | 768.44 | 854.23 | 768.45 | 698.57 | 1323.43 | 785.03 | 896.12 | |
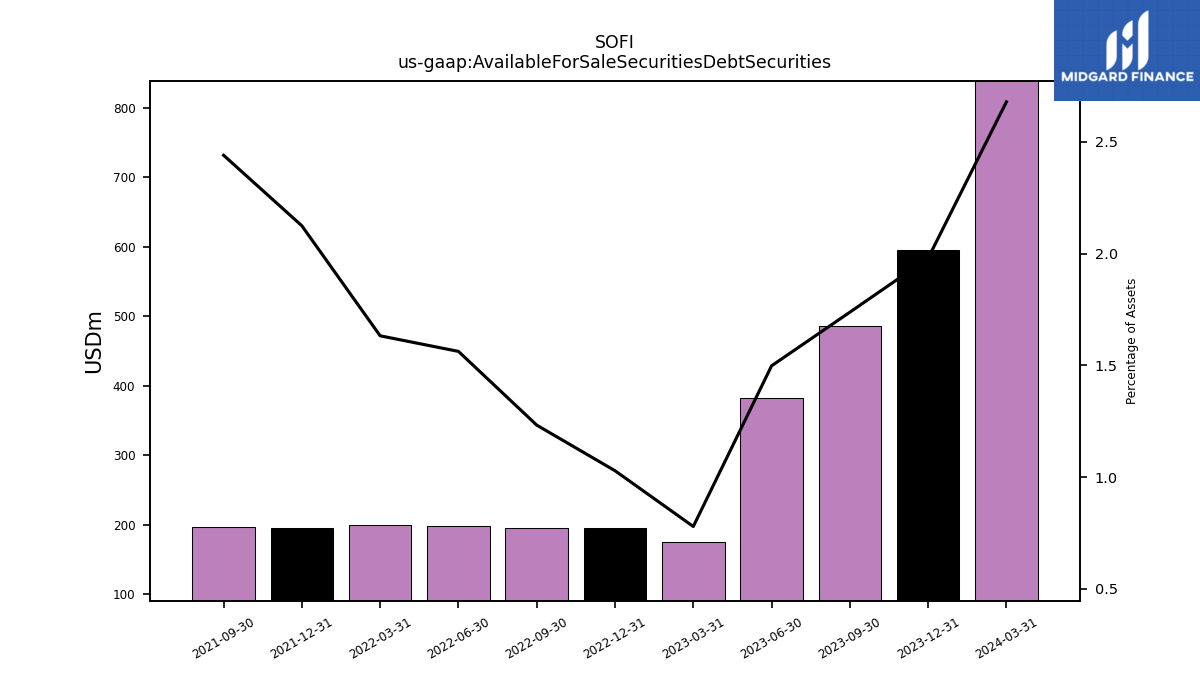
| Available For Sale Securities Debt Securities | 838.51 | 595.19 | 486.09 | 382.78 | 174.84 | 195.44 | 195.13 | 197.93 | 199.84 | 194.91 | 197.20 | NA | NA | NA | NA | NA |
| 2024-03-31 | 2023-12-31 | 2023-09-30 | 2023-06-30 | 2023-03-31 | 2022-12-31 | 2022-09-30 | 2022-06-30 | 2022-03-31 | 2021-12-31 | 2021-09-30 | 2021-06-30 | 2021-03-31 | 2020-12-31 | 2020-09-30 | 2020-06-30 | ||
|---|---|---|---|---|---|---|---|---|---|---|---|---|---|---|---|---|---|
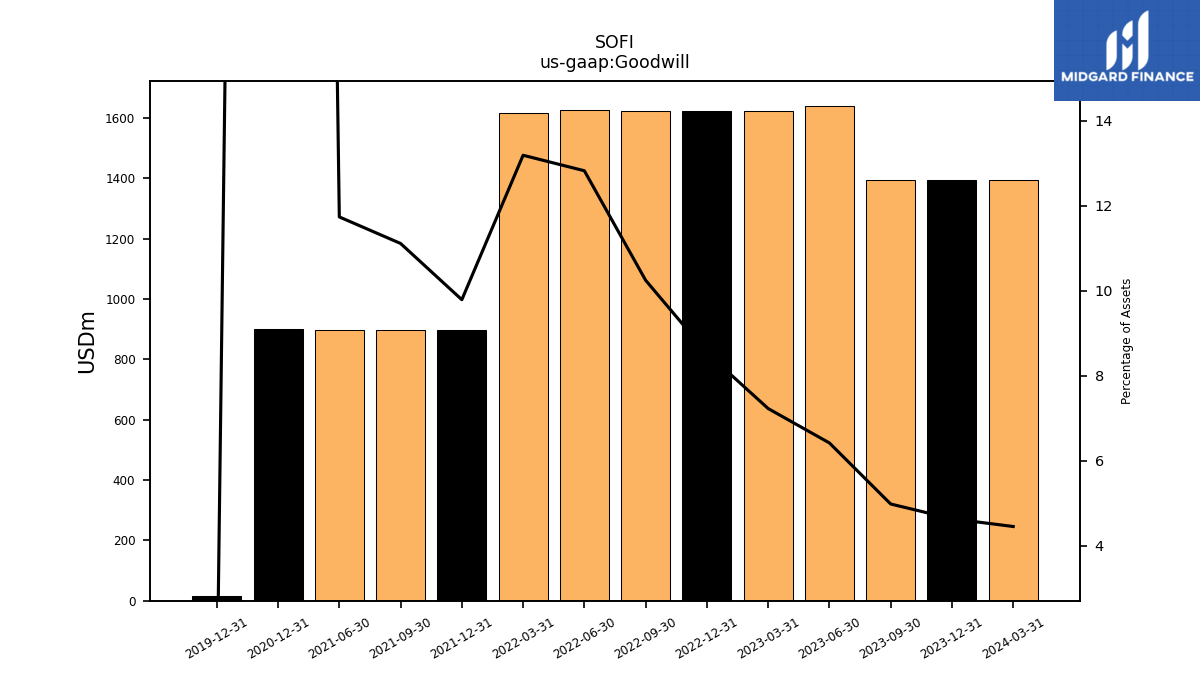
| Goodwill | 1393.51 | 1393.51 | 1393.51 | 1640.68 | 1622.99 | 1622.99 | 1622.95 | 1625.38 | 1615.69 | 898.53 | 898.53 | 898.53 | NA | 899.27 | NA | NA | |
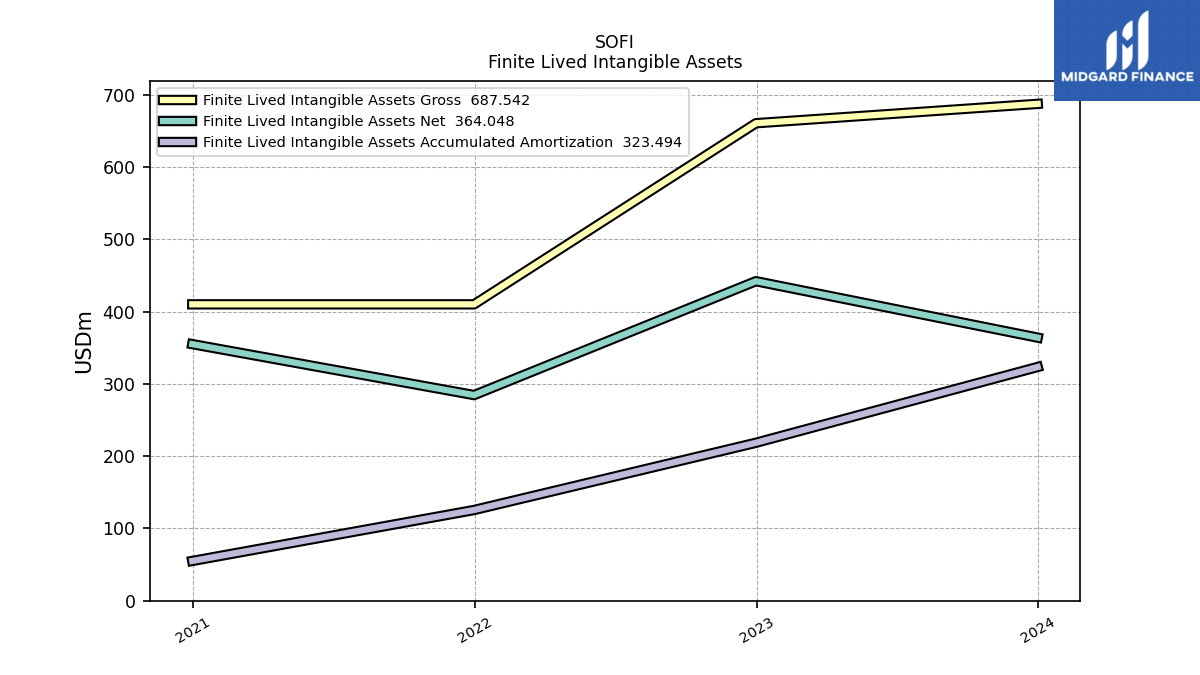
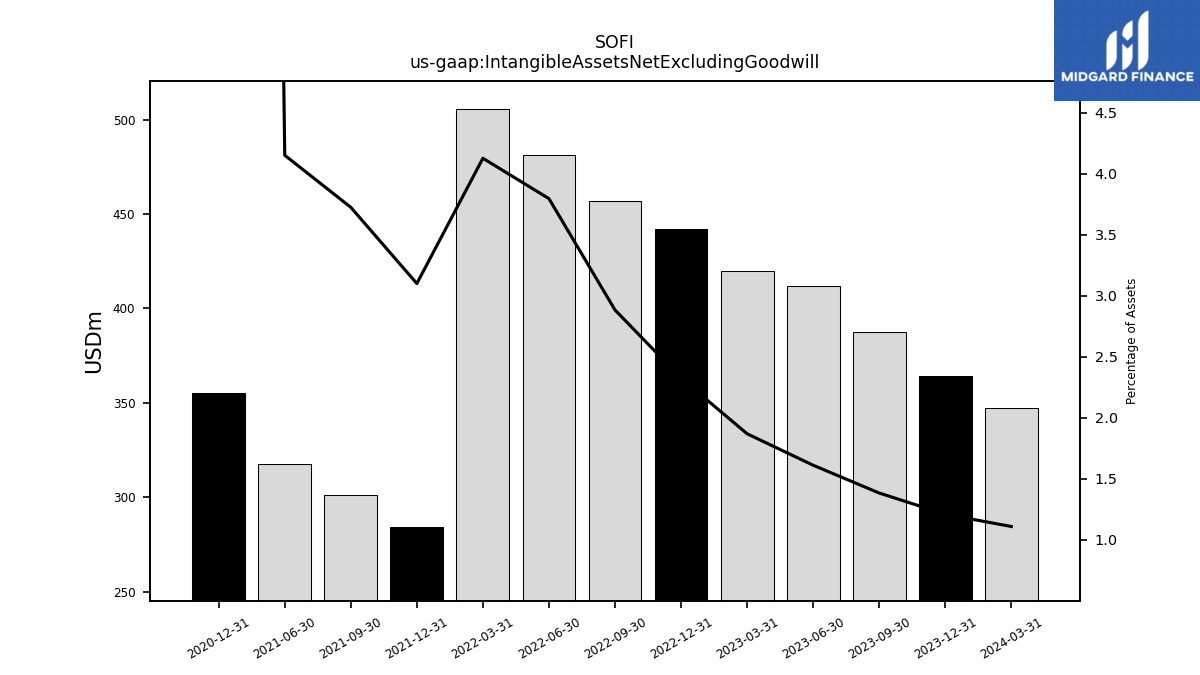
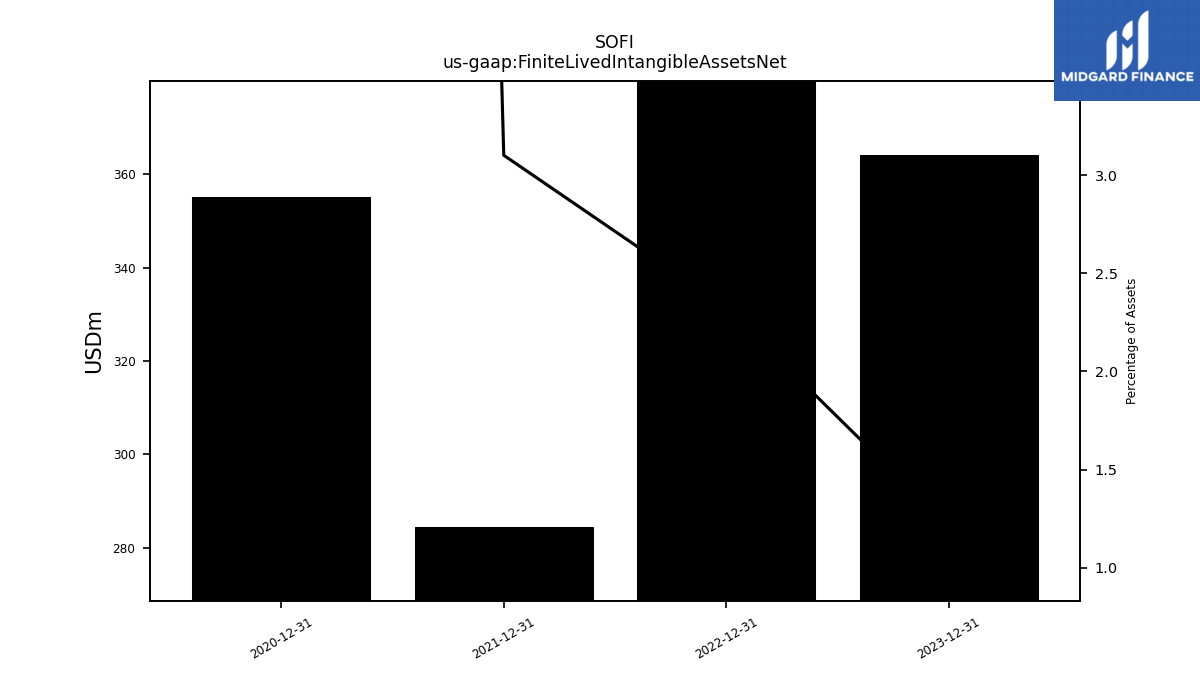
| Intangible Assets Net Excluding Goodwill | 347.50 | 364.05 | 387.31 | 412.10 | 419.88 | 442.15 | 456.77 | 481.12 | 505.53 | 284.58 | 301.19 | 317.80 | NA | 355.09 | NA | NA | |
| Finite Lived Intangible Assets Net | NA | 364.05 | NA | NA | NA | 442.15 | NA | NA | NA | 284.58 | NA | NA | NA | 355.09 | NA | NA |
| 2024-03-31 | 2023-12-31 | 2023-09-30 | 2023-06-30 | 2023-03-31 | 2022-12-31 | 2022-09-30 | 2022-06-30 | 2022-03-31 | 2021-12-31 | 2021-09-30 | 2021-06-30 | 2021-03-31 | 2020-12-31 | 2020-09-30 | 2020-06-30 | ||
|---|---|---|---|---|---|---|---|---|---|---|---|---|---|---|---|---|---|
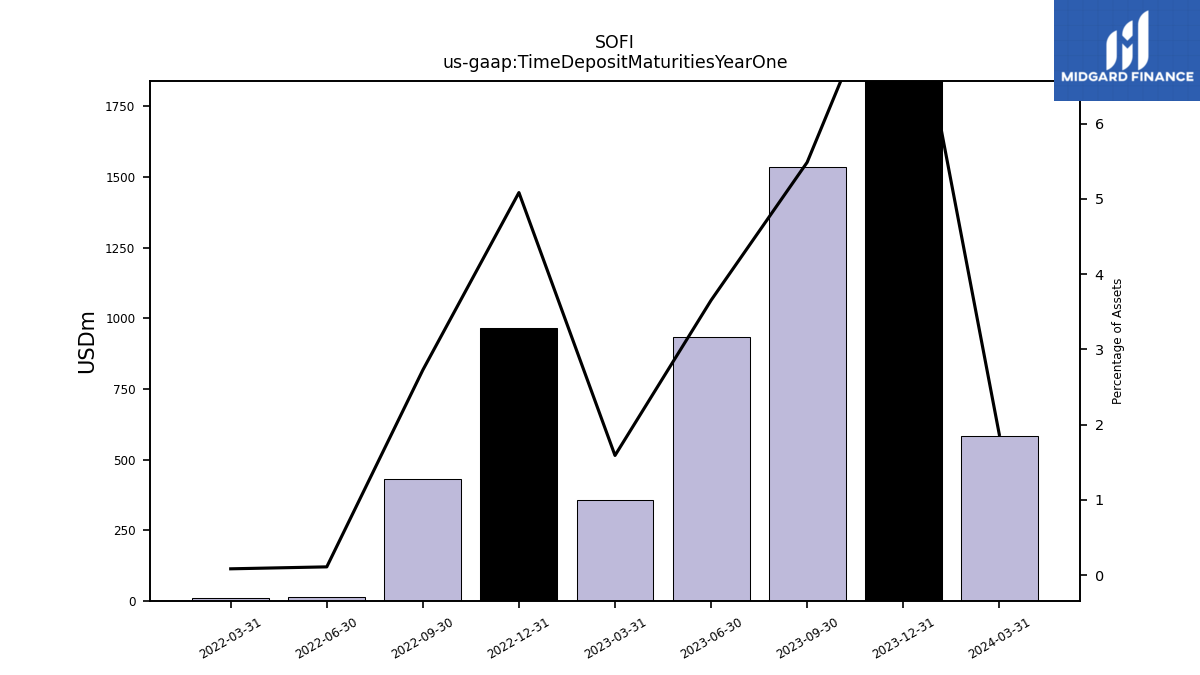
| Time Deposit Maturities Year One | 585.07 | 2578.88 | 1535.21 | 933.77 | 357.05 | 966.56 | 431.76 | 13.84 | 10.21 | NA | NA | NA | NA | NA | NA | NA | |
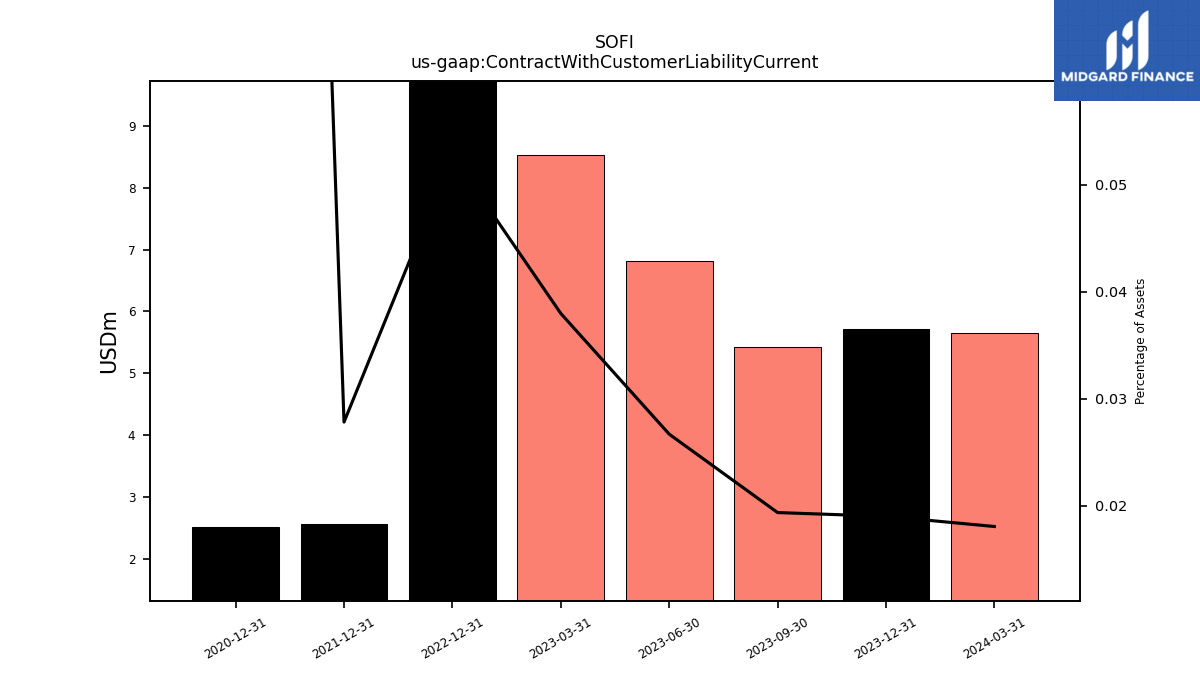
| Contract With Customer Liability Current | 5.66 | 5.72 | 5.42 | 6.82 | 8.53 | 10.03 | NA | NA | NA | 2.55 | NA | NA | NA | 2.52 | NA | NA | |
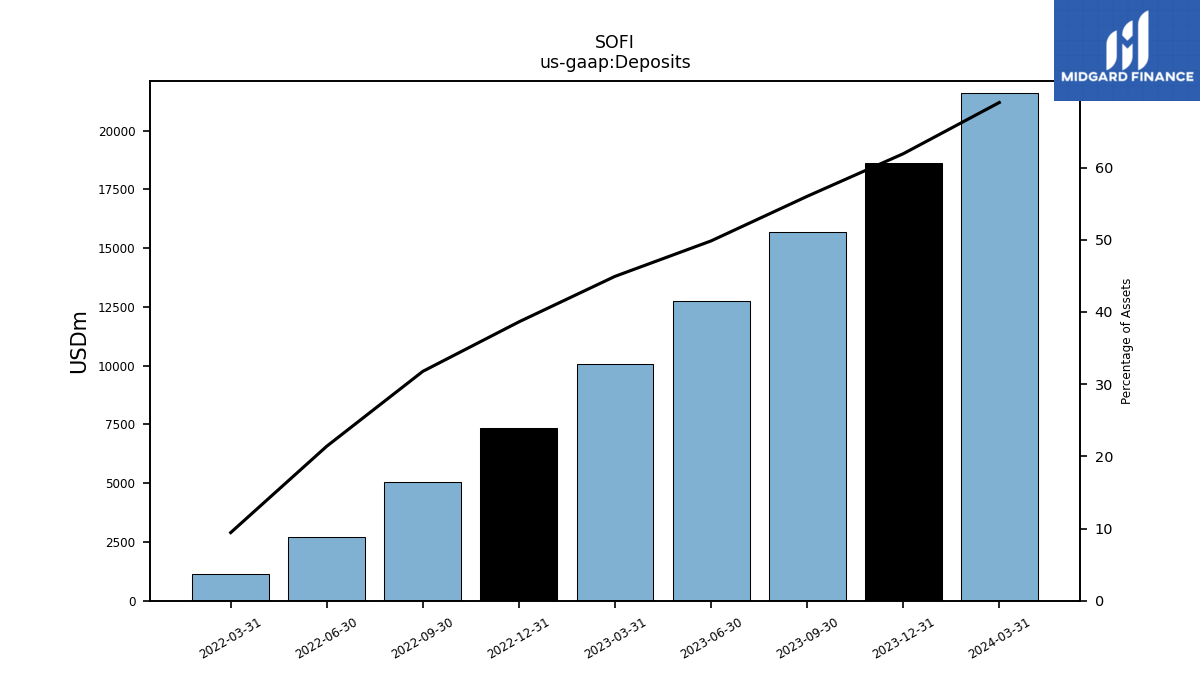
| Deposits | 21604.59 | 18620.66 | 15671.97 | 12740.07 | 10088.44 | 7342.30 | 5031.63 | 2712.26 | 1155.92 | NA | NA | NA | NA | NA | NA | NA |
| 2024-03-31 | 2023-12-31 | 2023-09-30 | 2023-06-30 | 2023-03-31 | 2022-12-31 | 2022-09-30 | 2022-06-30 | 2022-03-31 | 2021-12-31 | 2021-09-30 | 2021-06-30 | 2021-03-31 | 2020-12-31 | 2020-09-30 | 2020-06-30 | ||
|---|---|---|---|---|---|---|---|---|---|---|---|---|---|---|---|---|---|
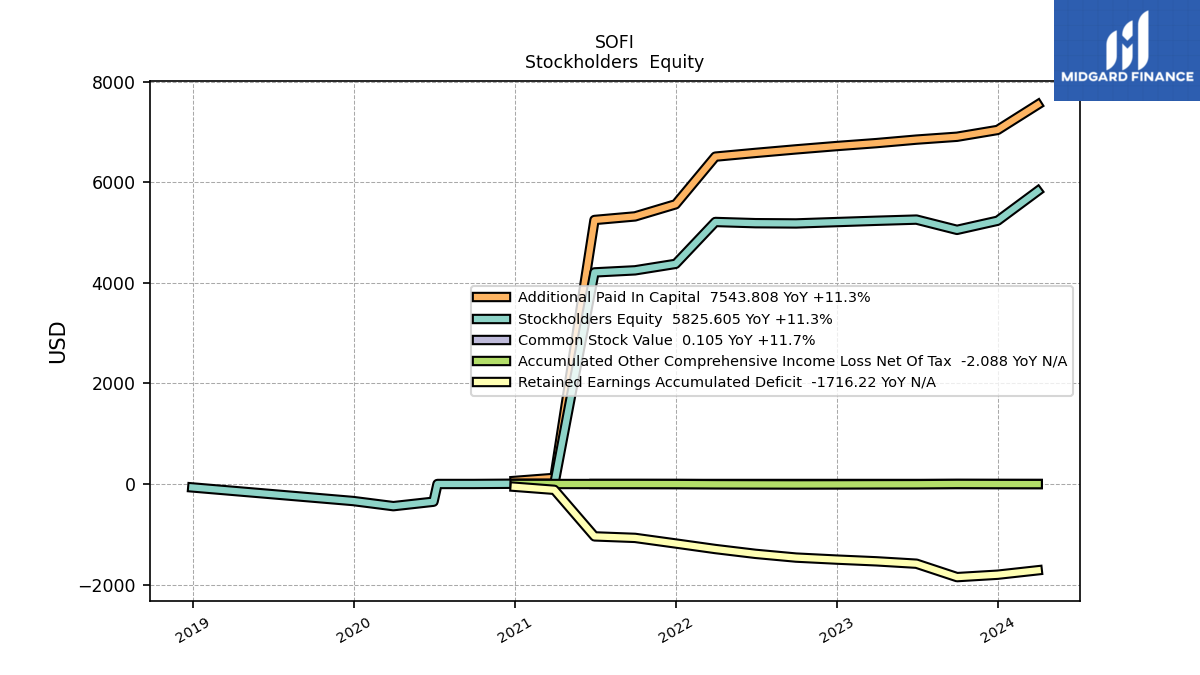
| Stockholders Equity | 5825.60 | 5234.61 | 5053.39 | 5257.66 | 5234.07 | 5208.10 | 5181.00 | 5186.18 | 5210.30 | 4377.33 | 4248.53 | 4207.39 | 5.00 | 5.00 | 0.02 | -352.51 | |
| Common Stock Value | 0.10 | 0.10 | 0.10 | 0.09 | 0.09 | 0.09 | 0.09 | 0.09 | 0.09 | 0.08 | 0.08 | 0.08 | NA | NA | NA | NA | |
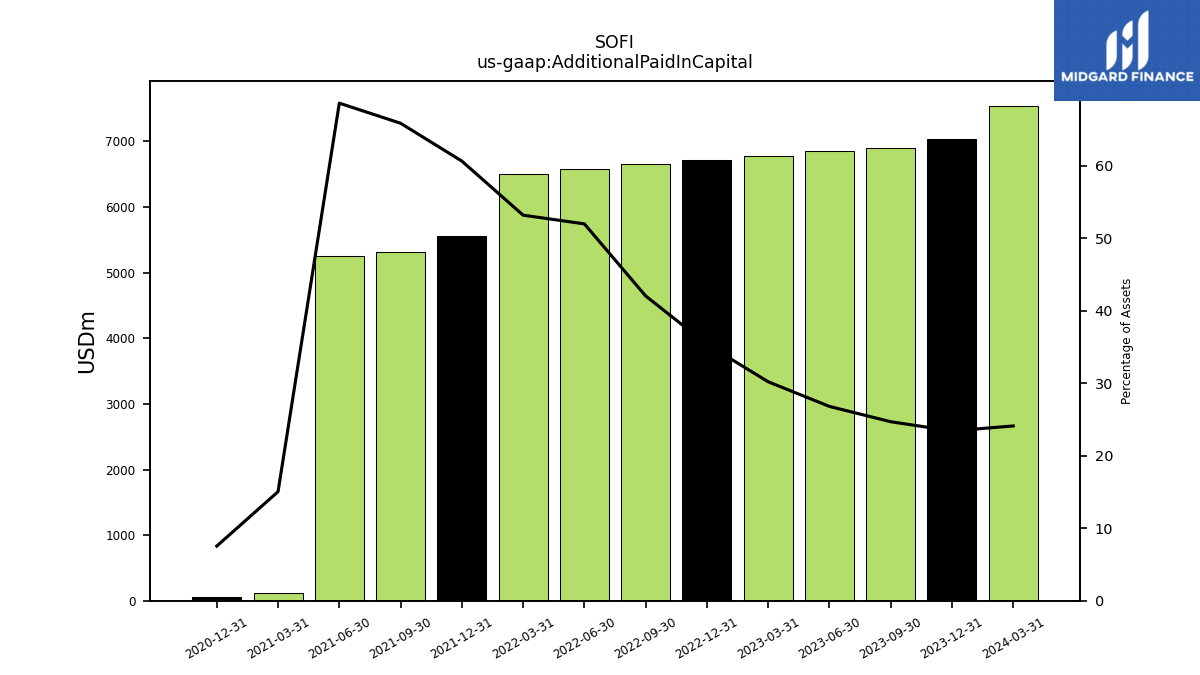
| Additional Paid In Capital | 7543.81 | 7039.99 | 6904.87 | 6848.18 | 6778.26 | 6719.83 | 6654.03 | 6583.40 | 6509.64 | 5561.83 | 5321.01 | 5249.88 | 121.16 | 60.77 | NA | NA | |
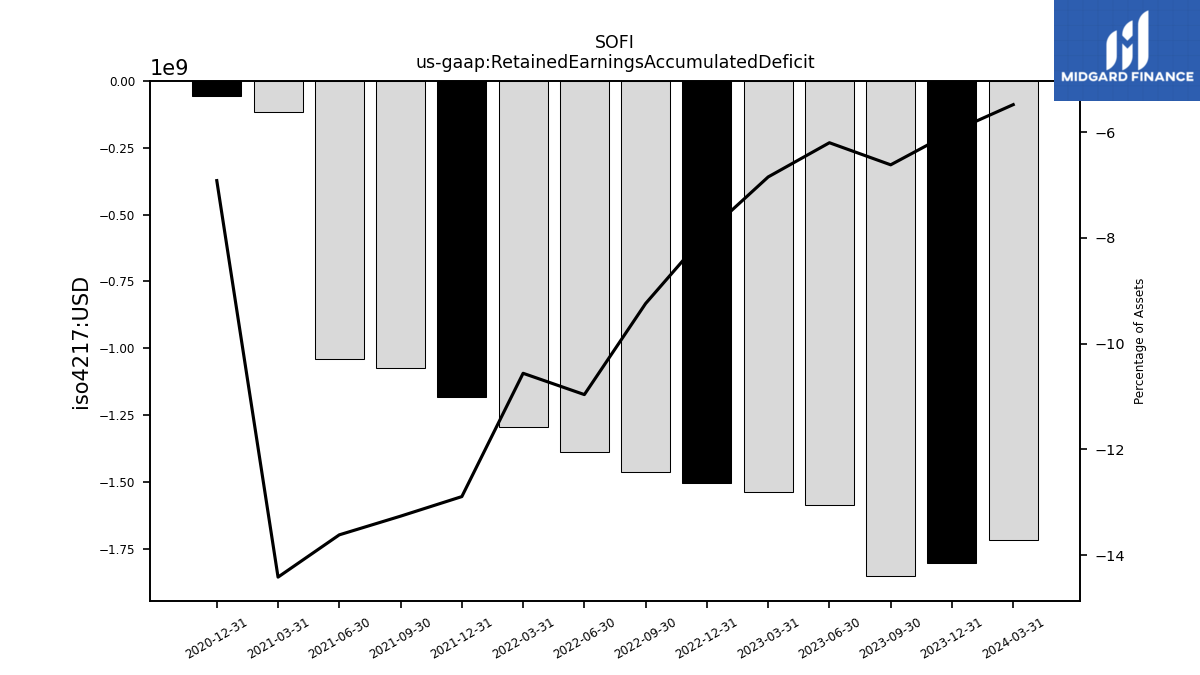
| Retained Earnings Accumulated Deficit | -1716.22 | -1804.26 | -1852.18 | -1585.49 | -1537.94 | -1503.52 | -1463.52 | -1389.31 | -1293.47 | -1183.11 | -1072.10 | -1042.06 | -116.17 | -55.77 | NA | NA | |
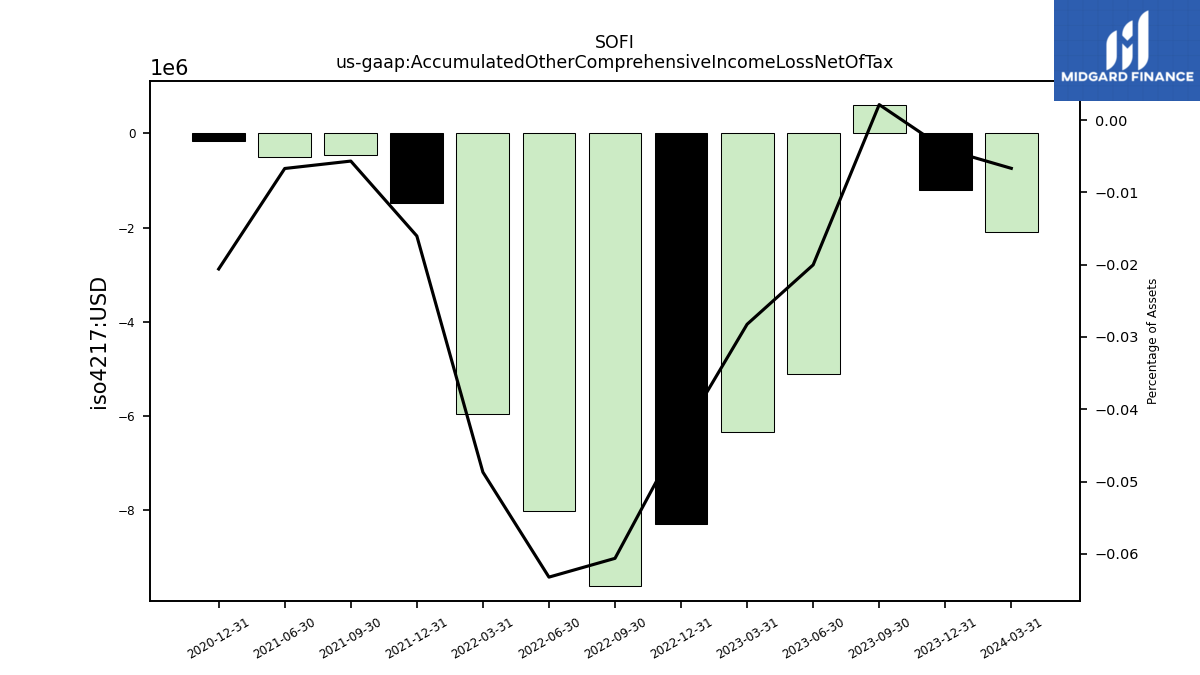
| Accumulated Other Comprehensive Income Loss Net Of Tax | -2.09 | -1.21 | 0.60 | -5.12 | -6.34 | -8.30 | -9.60 | -8.01 | -5.96 | -1.47 | -0.46 | -0.51 | NA | -0.17 | NA | NA | |
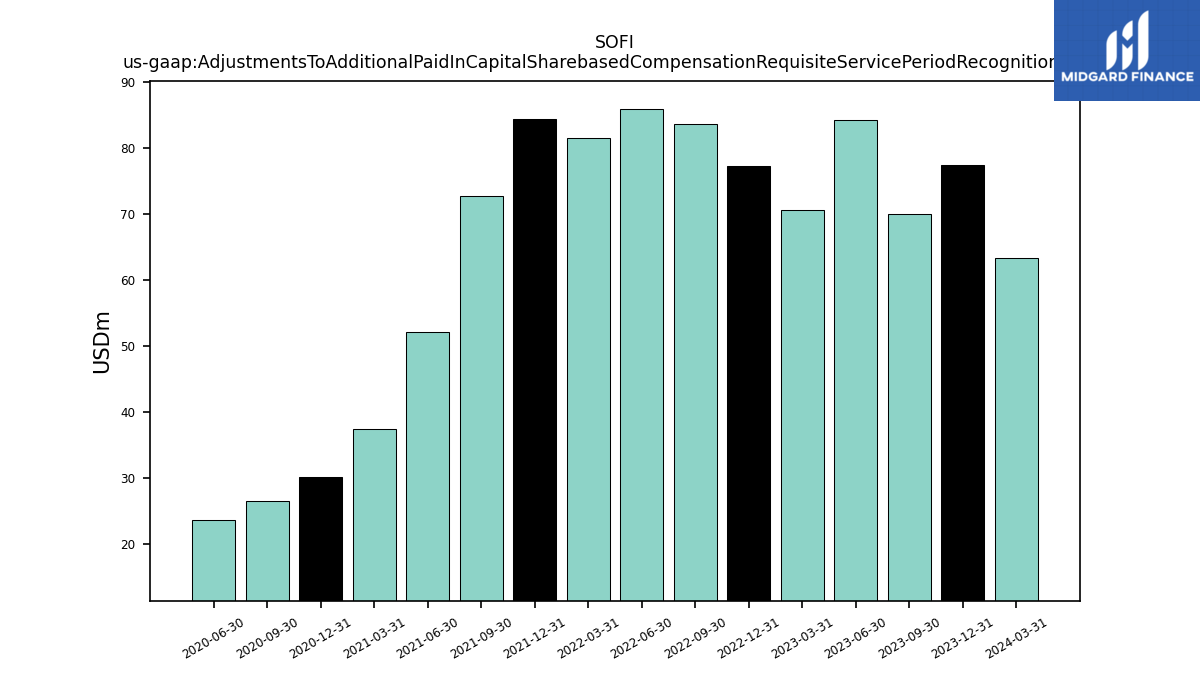
| Adjustments To Additional Paid In Capital Sharebased Compensation Requisite Service Period Recognition Value | 63.39 | 77.42 | 70.06 | 84.21 | 70.65 | 77.38 | 83.68 | 85.90 | 81.62 | 84.50 | 72.68 | 52.15 | 37.45 | 30.09 | 26.55 | 23.55 |
| 2024-03-31 | 2023-12-31 | 2023-09-30 | 2023-06-30 | 2023-03-31 | 2022-12-31 | 2022-09-30 | 2022-06-30 | 2022-03-31 | 2021-12-31 | 2021-09-30 | 2021-06-30 | 2021-03-31 | 2020-12-31 | 2020-09-30 | 2020-06-30 | ||
|---|---|---|---|---|---|---|---|---|---|---|---|---|---|---|---|---|---|
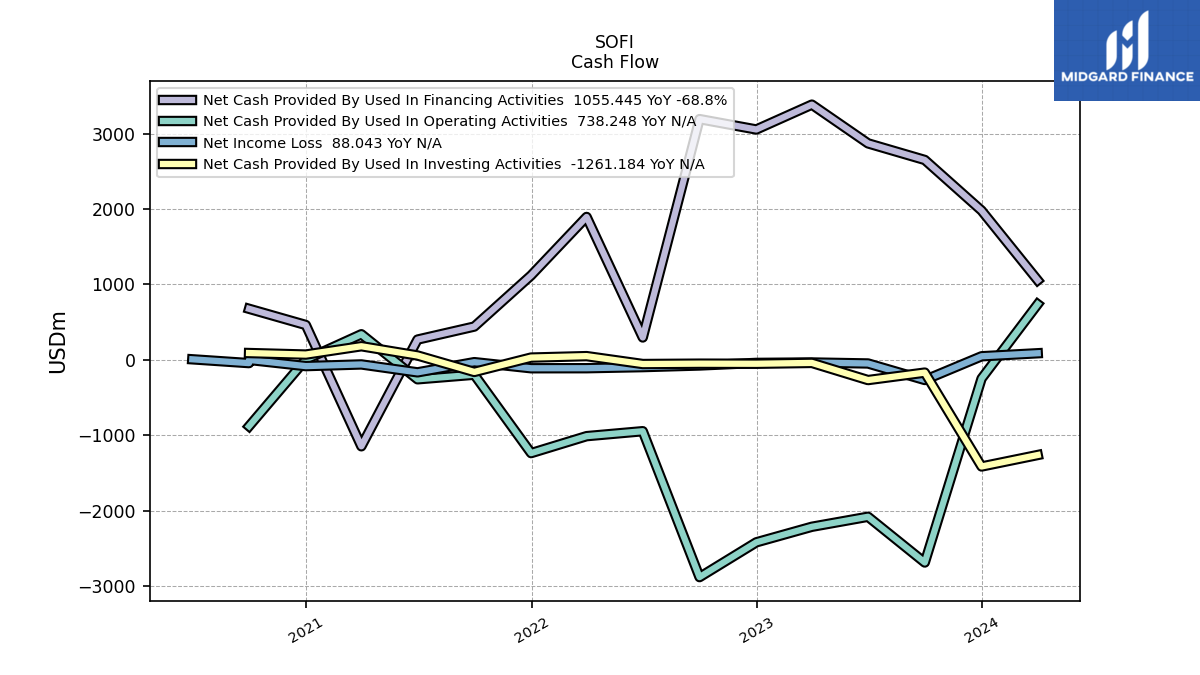
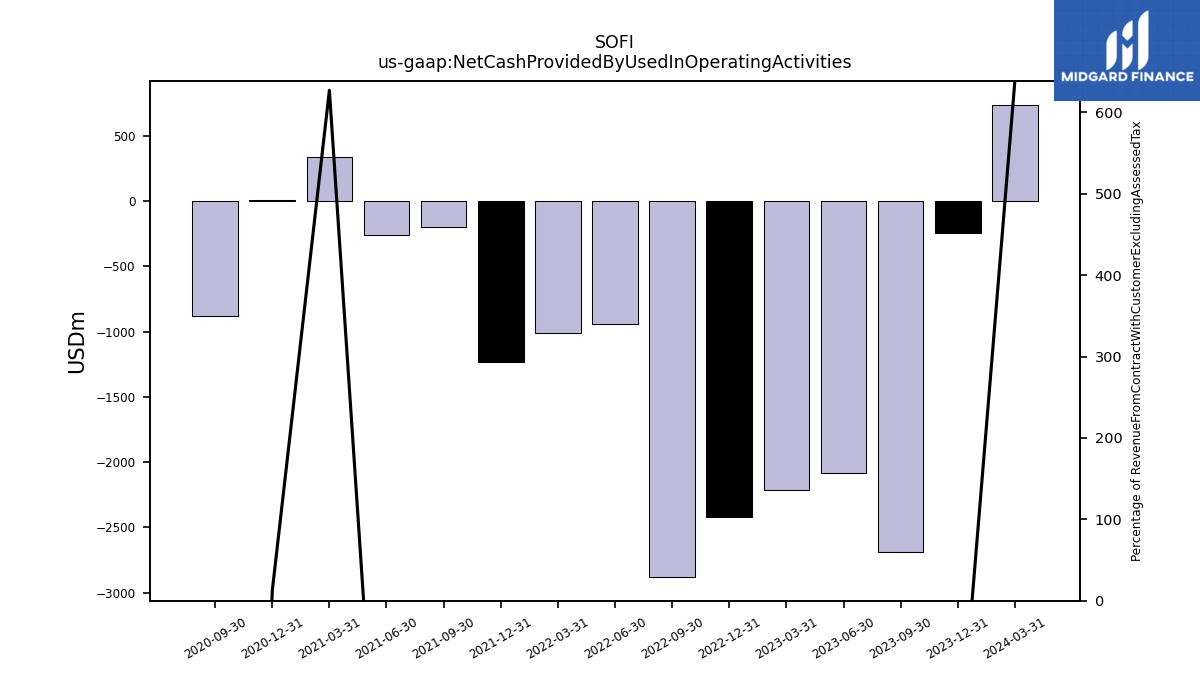
| Net Cash Provided By Used In Operating Activities | 738.25 | -247.94 | -2686.52 | -2079.92 | -2212.76 | -2418.84 | -2880.30 | -945.50 | -1011.22 | -1236.29 | -196.54 | -257.44 | 340.05 | 5.18 | -879.44 | NA | |
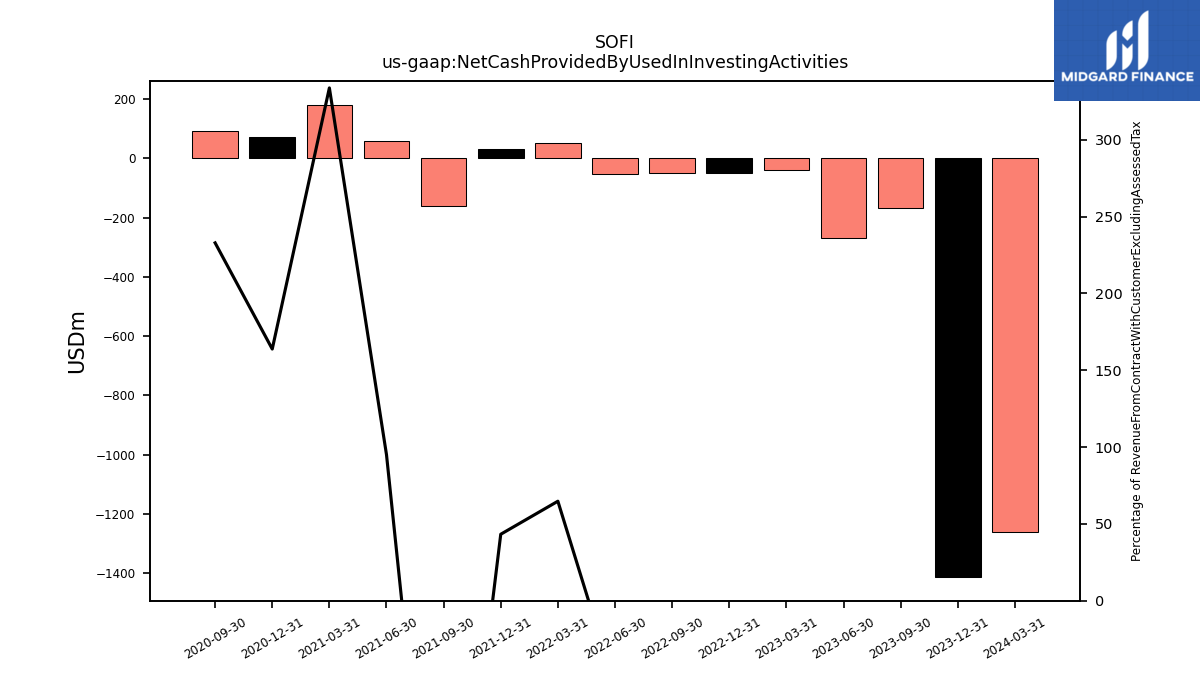
| Net Cash Provided By Used In Investing Activities | -1261.18 | -1413.53 | -168.51 | -267.67 | -40.15 | -51.41 | -50.01 | -54.80 | 49.88 | 30.66 | -159.80 | 58.39 | 180.95 | 70.69 | 90.83 | NA | |
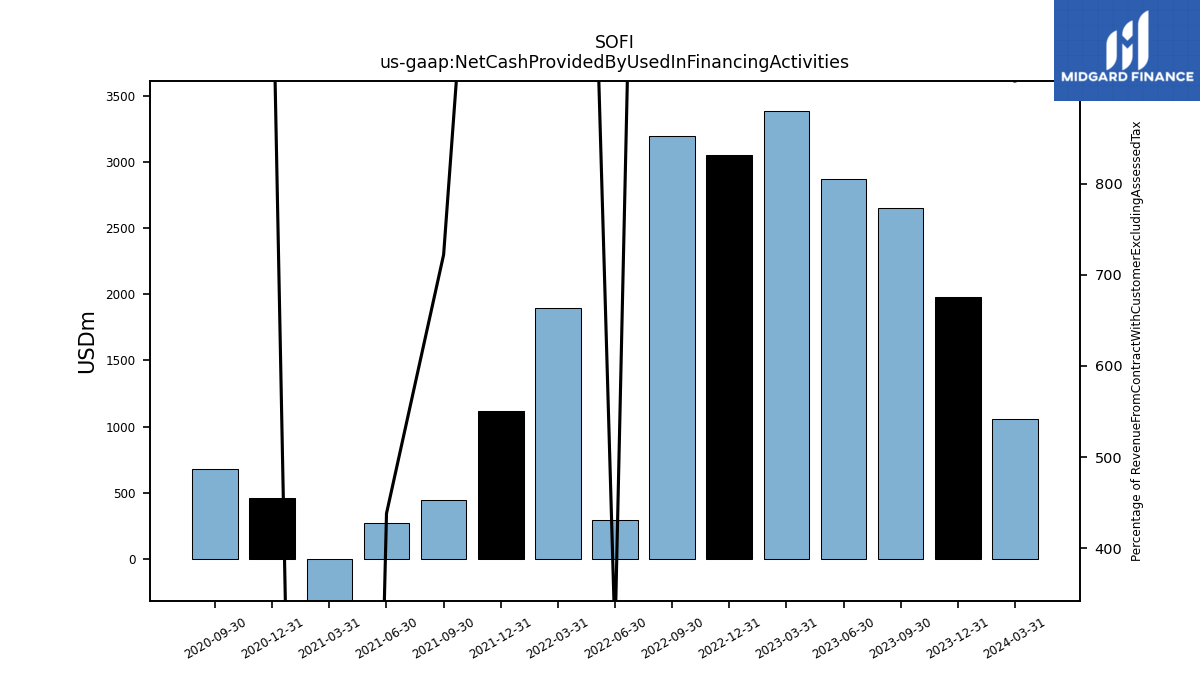
| Net Cash Provided By Used In Financing Activities | 1055.44 | 1979.56 | 2650.81 | 2870.81 | 3384.42 | 3054.77 | 3192.48 | 297.07 | 1895.16 | 1119.65 | 441.91 | 269.20 | -1145.78 | 462.66 | 677.49 | NA |
| 2024-03-31 | 2023-12-31 | 2023-09-30 | 2023-06-30 | 2023-03-31 | 2022-12-31 | 2022-09-30 | 2022-06-30 | 2022-03-31 | 2021-12-31 | 2021-09-30 | 2021-06-30 | 2021-03-31 | 2020-12-31 | 2020-09-30 | 2020-06-30 | ||
|---|---|---|---|---|---|---|---|---|---|---|---|---|---|---|---|---|---|
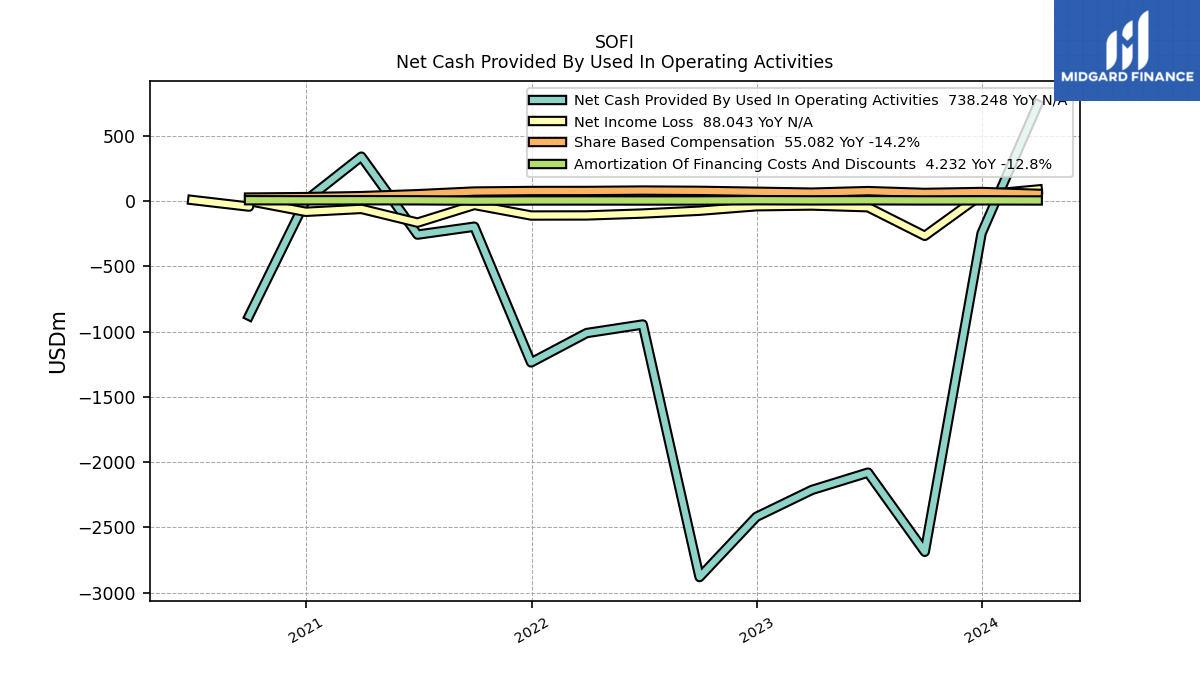
| Net Cash Provided By Used In Operating Activities | 738.25 | -247.94 | -2686.52 | -2079.92 | -2212.76 | -2418.84 | -2880.30 | -945.50 | -1011.22 | -1236.29 | -196.54 | -257.44 | 340.05 | 5.18 | -879.44 | NA | |
| Net Income Loss | 88.04 | 47.91 | -266.68 | -47.55 | -34.42 | -40.01 | -74.21 | -95.83 | -110.36 | -111.01 | -30.05 | -165.31 | -60.39 | -82.62 | -42.88 | 7.81 | |
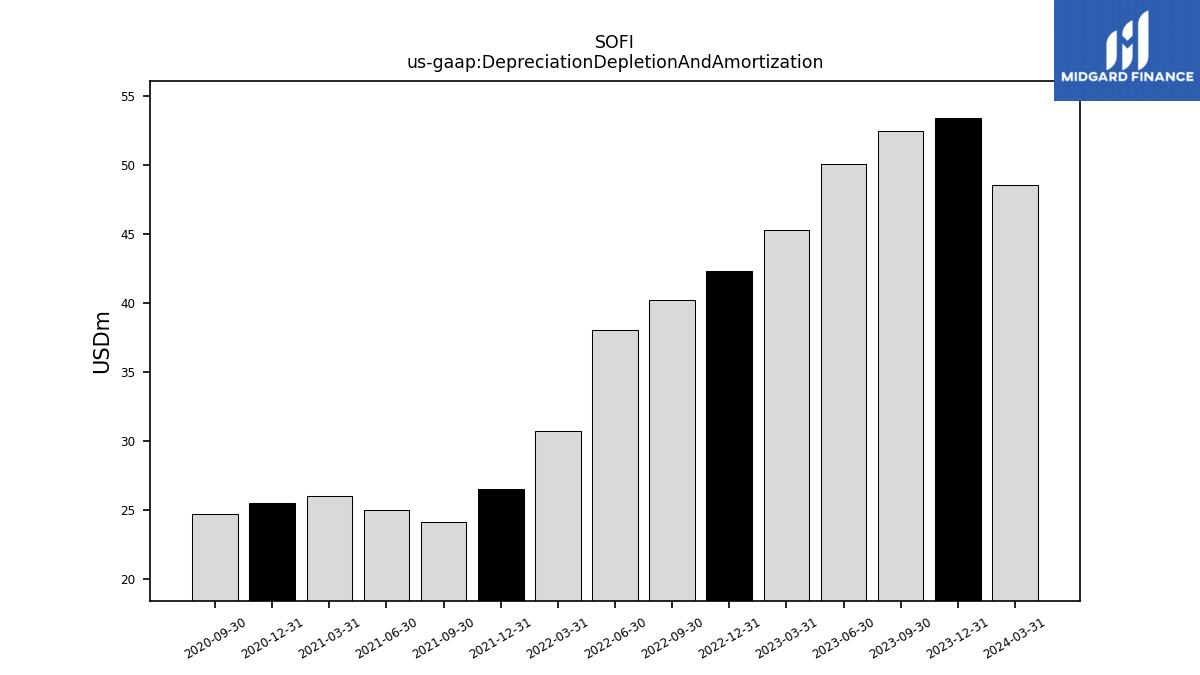
| Depreciation Depletion And Amortization | 48.54 | 53.45 | 52.52 | 50.13 | 45.32 | 42.35 | 40.25 | 38.06 | 30.70 | 26.53 | 24.07 | 24.99 | 25.98 | 25.49 | 24.68 | NA | |
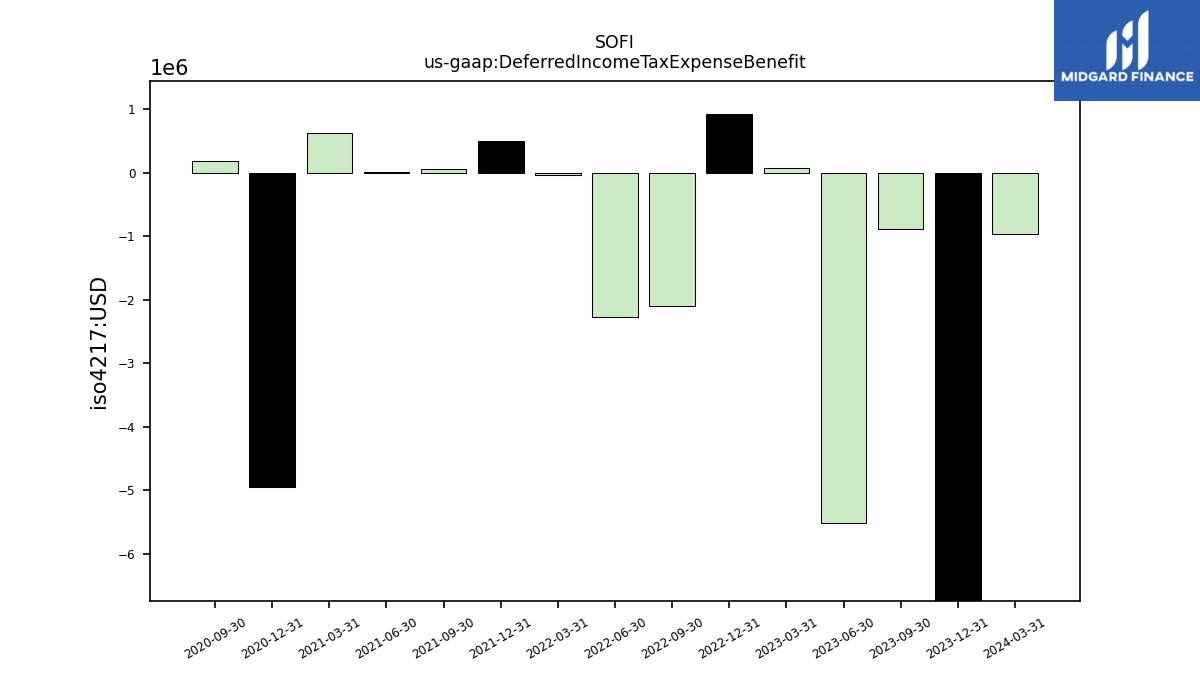
| Deferred Income Tax Expense Benefit | -0.97 | -9.49 | -0.89 | -5.51 | 0.07 | 0.92 | -2.10 | -2.28 | -0.04 | 0.51 | 0.06 | 0.01 | 0.62 | -4.95 | 0.18 | NA | |
| Share Based Compensation | 55.08 | 69.11 | 62.01 | 75.88 | 64.23 | 70.98 | 77.86 | 80.14 | 77.02 | 76.72 | 72.68 | 52.15 | 37.45 | 30.09 | 26.55 | NA |
| 2024-03-31 | 2023-12-31 | 2023-09-30 | 2023-06-30 | 2023-03-31 | 2022-12-31 | 2022-09-30 | 2022-06-30 | 2022-03-31 | 2021-12-31 | 2021-09-30 | 2021-06-30 | 2021-03-31 | 2020-12-31 | 2020-09-30 | 2020-06-30 | ||
|---|---|---|---|---|---|---|---|---|---|---|---|---|---|---|---|---|---|
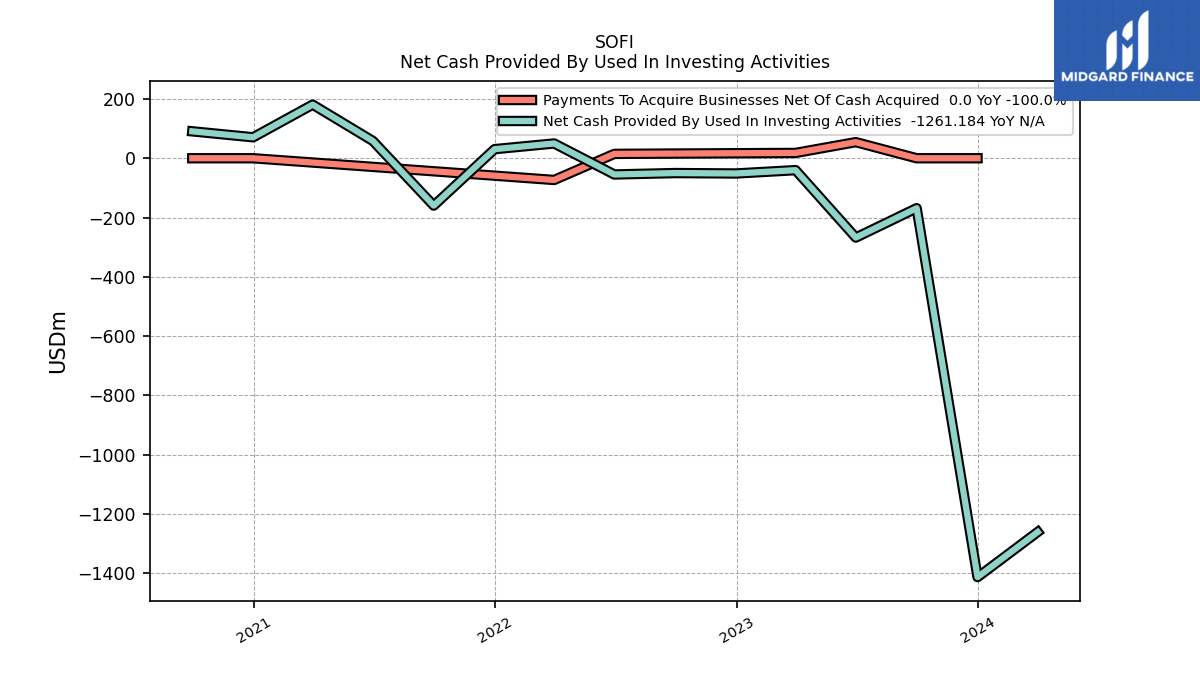
| Net Cash Provided By Used In Investing Activities | -1261.18 | -1413.53 | -168.51 | -267.67 | -40.15 | -51.41 | -50.01 | -54.80 | 49.88 | 30.66 | -159.80 | 58.39 | 180.95 | 70.69 | 90.83 | NA | |
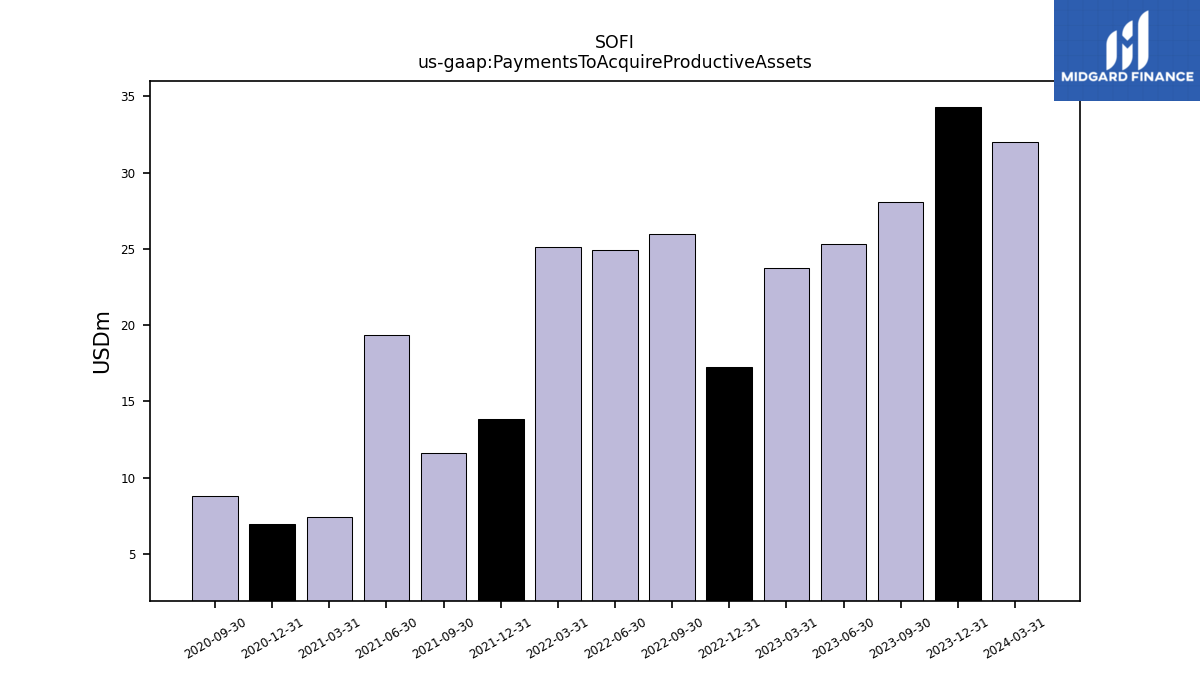
| Payments To Acquire Productive Assets | 31.98 | 34.29 | 28.04 | 25.35 | 23.72 | 17.23 | 25.95 | 24.91 | 25.11 | 13.82 | 11.64 | 19.36 | 7.45 | 6.93 | 8.79 | NA |
| 2024-03-31 | 2023-12-31 | 2023-09-30 | 2023-06-30 | 2023-03-31 | 2022-12-31 | 2022-09-30 | 2022-06-30 | 2022-03-31 | 2021-12-31 | 2021-09-30 | 2021-06-30 | 2021-03-31 | 2020-12-31 | 2020-09-30 | 2020-06-30 | ||
|---|---|---|---|---|---|---|---|---|---|---|---|---|---|---|---|---|---|
| Net Cash Provided By Used In Financing Activities | 1055.44 | 1979.56 | 2650.81 | 2870.81 | 3384.42 | 3054.77 | 3192.48 | 297.07 | 1895.16 | 1119.65 | 441.91 | 269.20 | -1145.78 | 462.66 | 677.49 | NA |
| 2024-03-31 | 2023-12-31 | 2023-09-30 | 2023-06-30 | 2023-03-31 | 2022-12-31 | 2022-09-30 | 2022-06-30 | 2022-03-31 | 2021-12-31 | 2021-09-30 | 2021-06-30 | 2021-03-31 | 2020-12-31 | 2020-09-30 | 2020-06-30 | ||
|---|---|---|---|---|---|---|---|---|---|---|---|---|---|---|---|---|---|
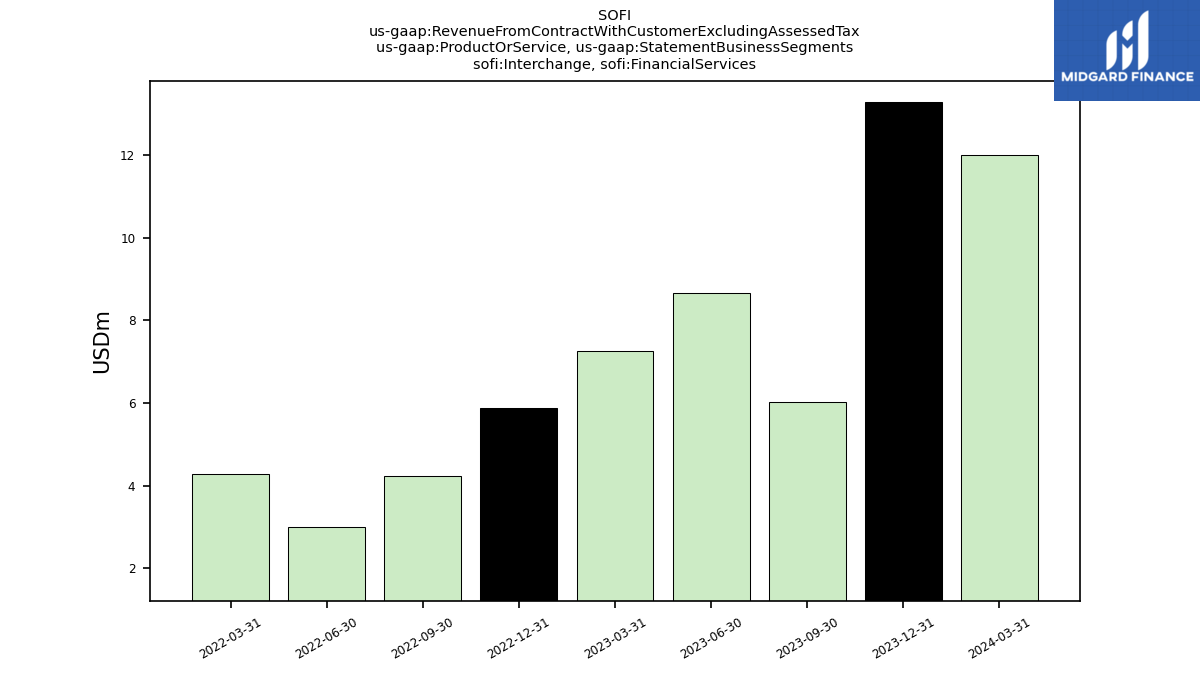
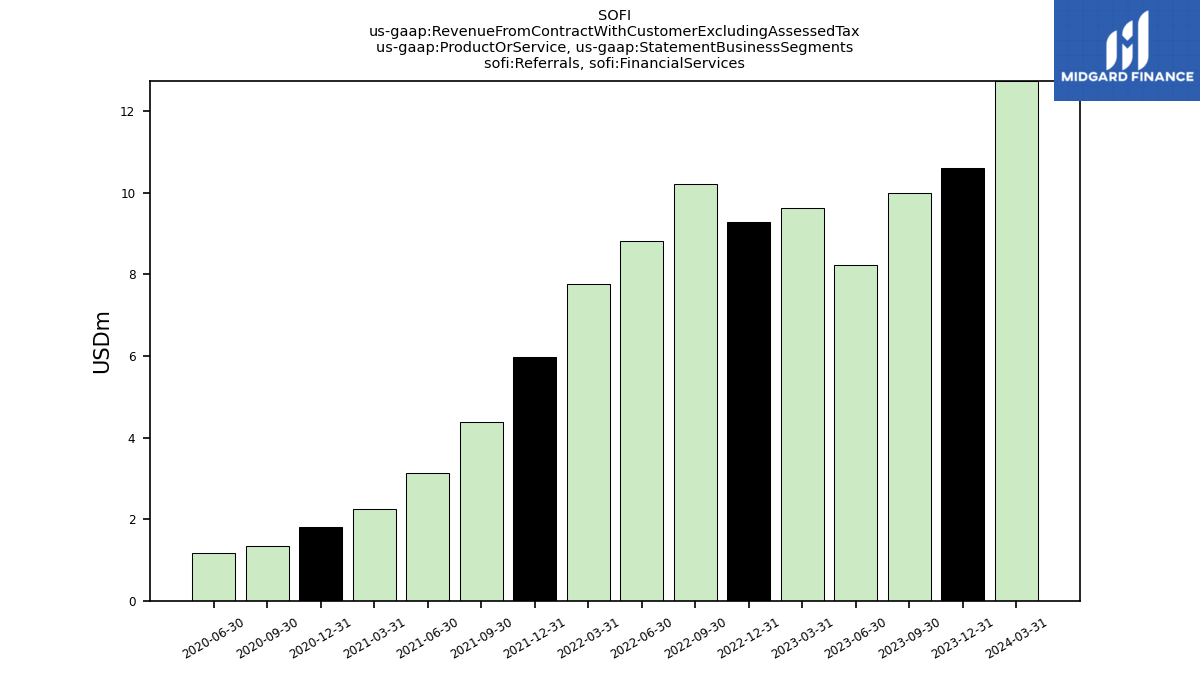
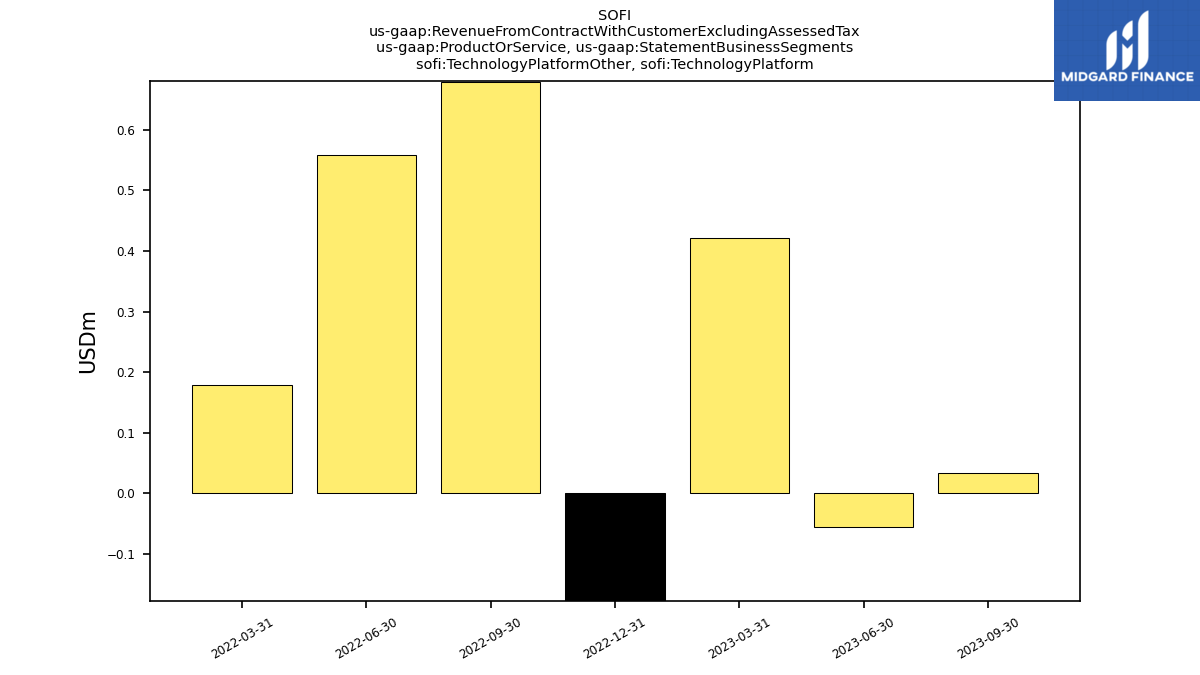
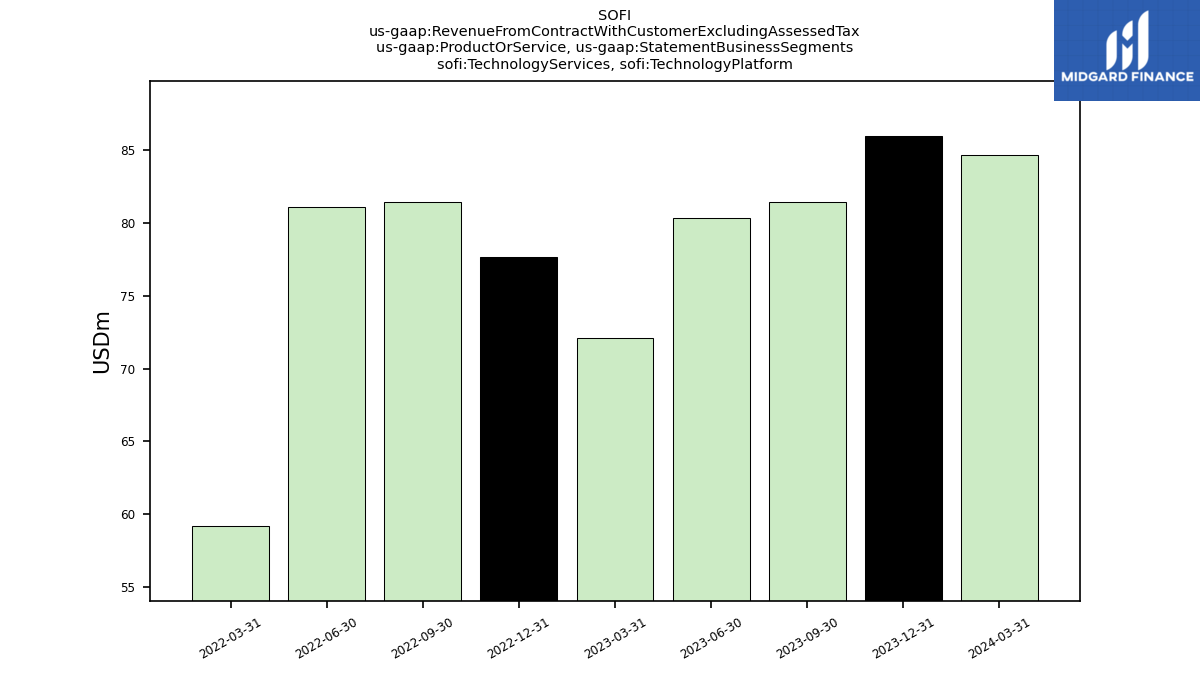
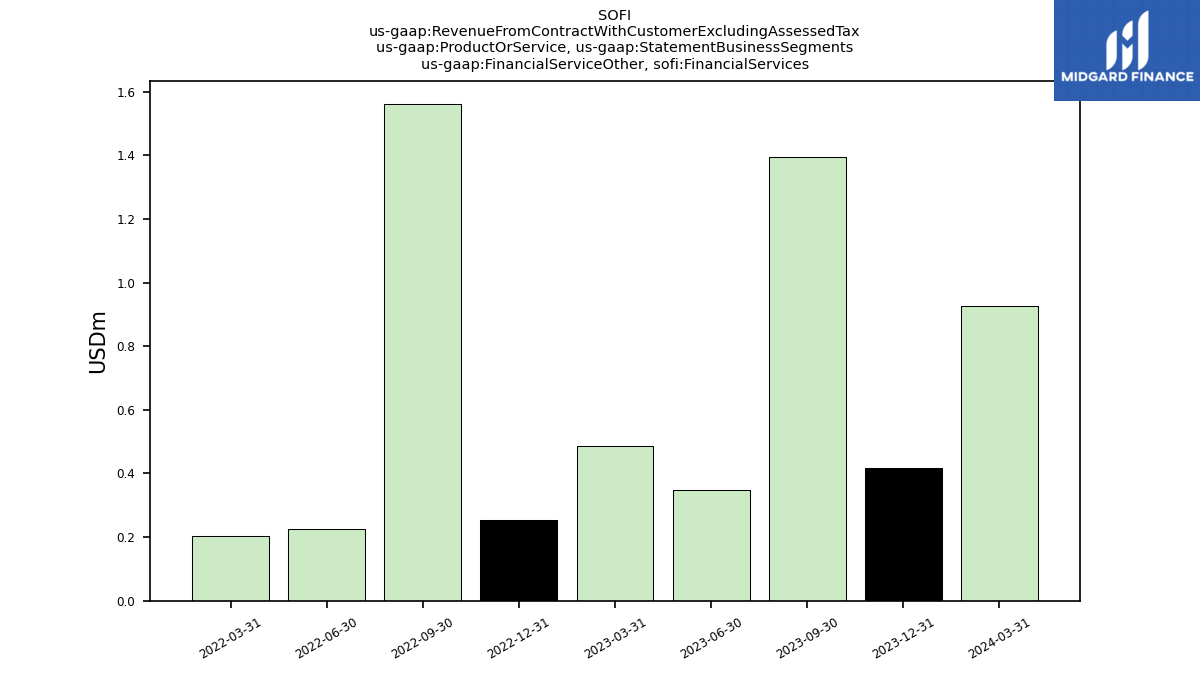
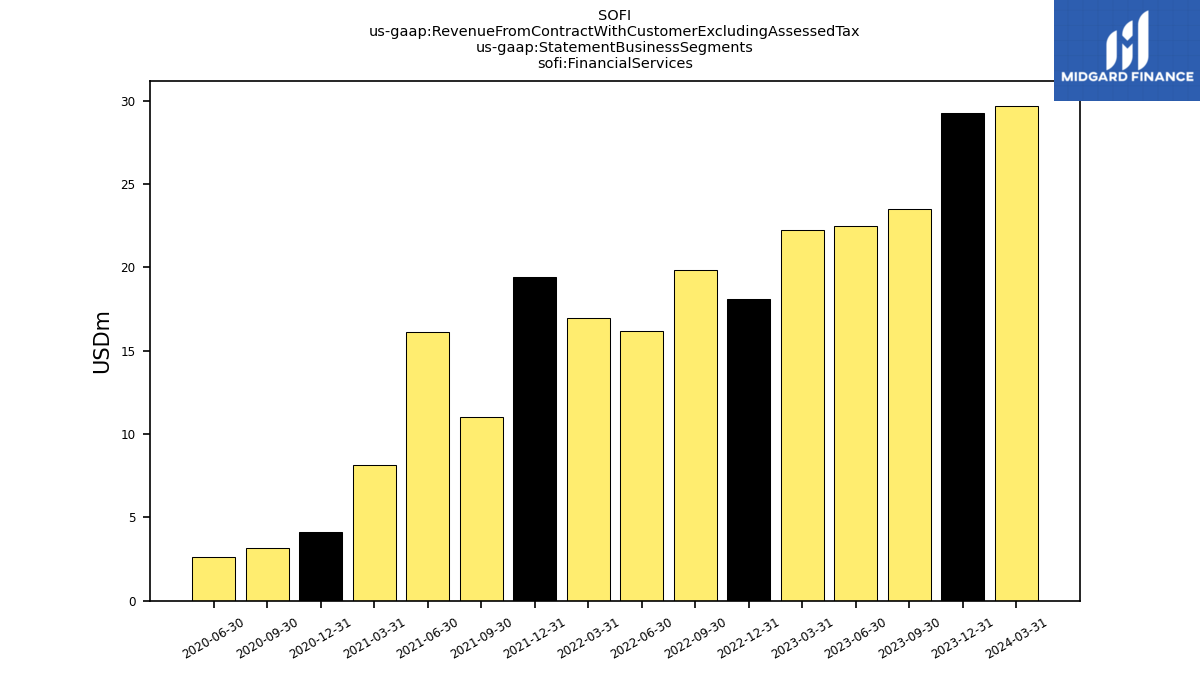
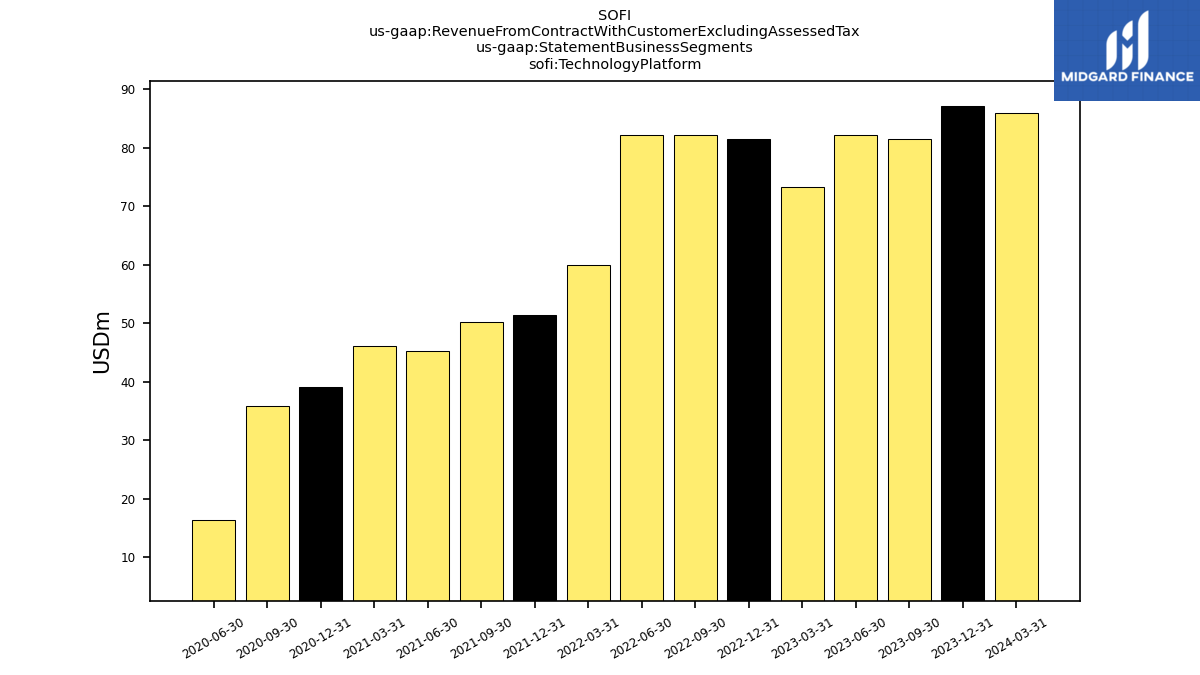
| Revenue From Contract With Customer Excluding Assessed Tax | 115.61 | 116.33 | 104.94 | 104.69 | 95.48 | 99.65 | 102.00 | 98.42 | 77.02 | 70.85 | 61.19 | 61.45 | 54.23 | 43.16 | 39.01 | 19.05 | |
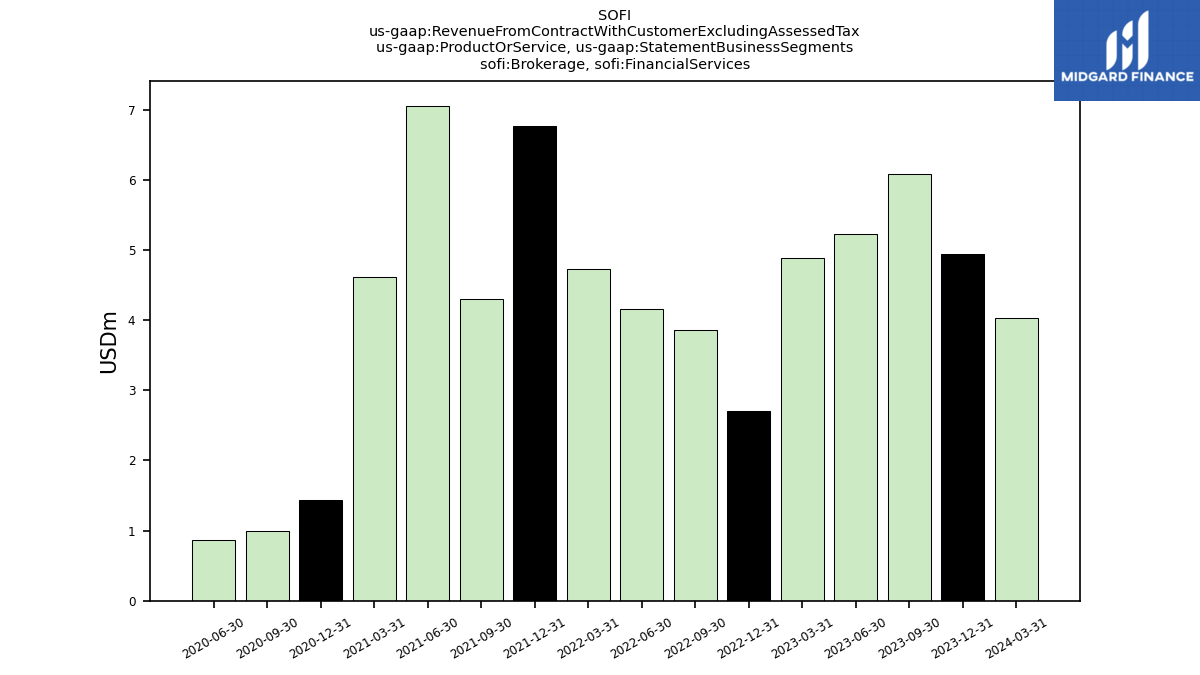
| Brokerage, Financial Services | 4.03 | 4.94 | 6.08 | 5.22 | 4.88 | 2.71 | 3.85 | 4.16 | 4.73 | 6.77 | 4.30 | 7.05 | 4.61 | 1.43 | 0.99 | 0.87 | |
| Interchange, Financial Services | 12.00 | 13.29 | 6.03 | 8.66 | 7.27 | 5.87 | 4.22 | 3.01 | 4.29 | NA | NA | NA | NA | NA | NA | NA | |
| Referrals, Financial Services | 12.74 | 10.61 | 9.98 | 8.22 | 9.63 | 9.27 | 10.21 | 8.80 | 7.77 | 5.98 | 4.38 | 3.14 | 2.25 | 1.80 | 1.34 | 1.16 | |
| Technology Platform Other, Technology Platform | 1.26 | 1.11 | 0.03 | -0.06 | 0.42 | -1.61 | 0.68 | 0.56 | 0.18 | NA | NA | NA | NA | NA | NA | NA | |
| Technology Services, Technology Platform | 84.65 | 85.97 | 81.42 | 80.33 | 72.13 | 77.64 | 81.47 | 81.11 | 59.16 | NA | NA | NA | NA | NA | NA | NA | |
| Financial Service Other, Financial Services | 0.93 | 0.42 | 1.40 | 0.35 | 0.49 | 0.26 | 1.56 | 0.23 | 0.20 | NA | NA | NA | NA | NA | NA | NA | |
| Financial Services | 29.70 | 29.25 | 23.49 | 22.46 | 22.26 | 18.10 | 19.85 | 16.19 | 16.99 | 19.41 | 11.00 | 16.12 | 8.13 | 4.12 | 3.18 | 2.61 | |
| Technology Platform | 85.91 | 87.08 | 81.45 | 82.23 | 73.22 | 81.55 | 82.15 | 82.23 | 60.03 | 51.44 | 50.19 | 45.33 | 46.10 | 39.03 | 35.82 | 16.44 | |
| Interest Income Operating | 665.91 | 645.24 | 564.27 | 470.00 | 371.56 | 307.41 | 198.04 | 149.51 | 118.41 | 94.78 | 93.60 | 84.11 | 82.53 | 92.07 | 88.12 | 86.06 | |
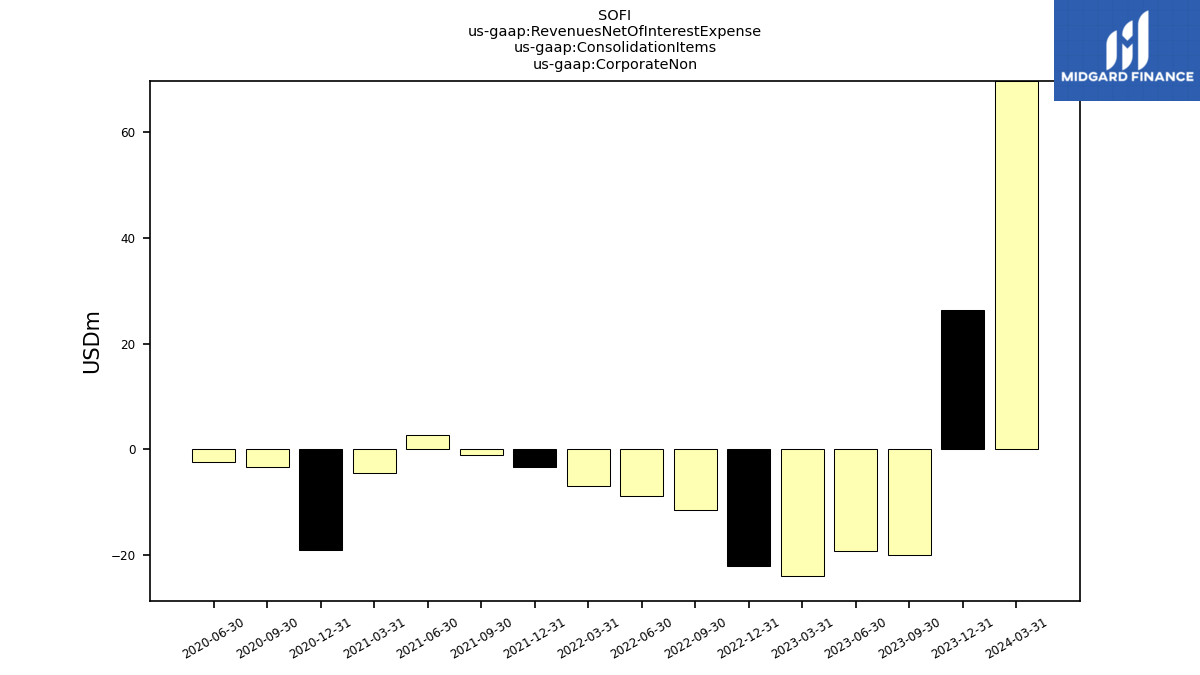
| Revenues Net Of Interest Expense | 645.00 | 615.40 | 537.21 | 498.02 | 472.16 | 456.68 | 423.99 | 362.53 | 330.34 | 285.61 | 272.01 | 231.27 | 195.98 | 171.49 | 200.79 | 114.95 | |
| Corporate Non | 69.60 | 26.26 | -19.93 | -19.10 | -23.91 | -21.98 | -11.44 | -8.85 | -6.99 | -3.41 | -1.13 | 2.65 | -4.52 | -19.03 | -3.38 | -2.38 | |
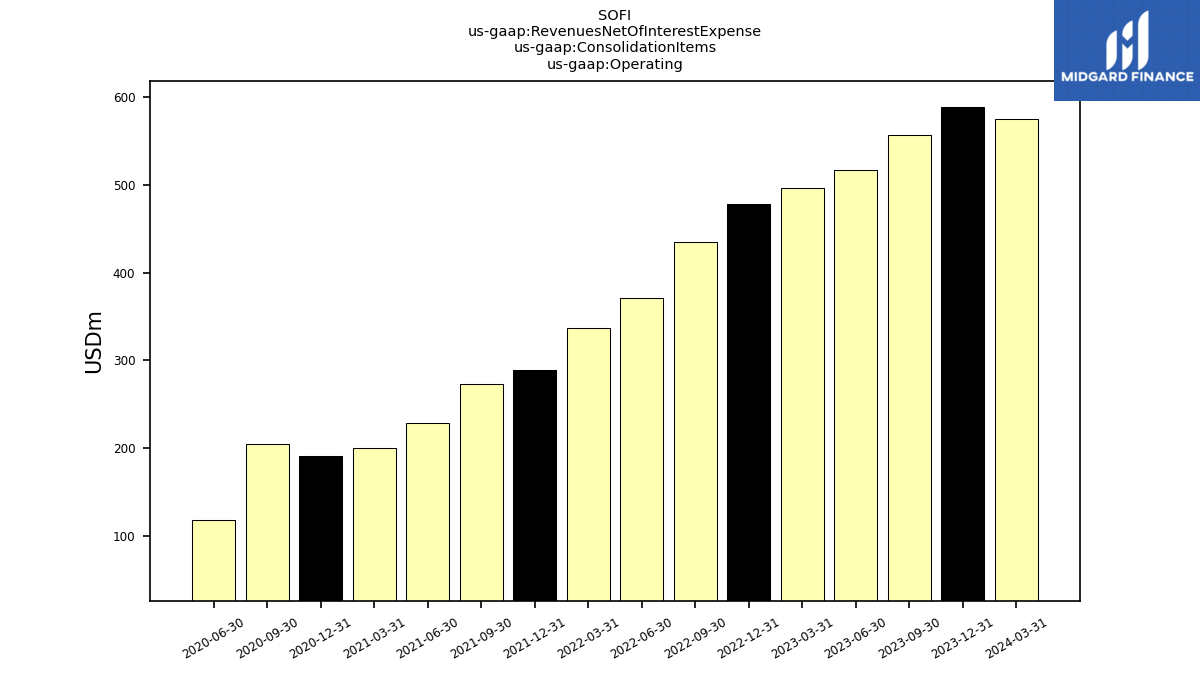
| Operating | 575.39 | 589.15 | 557.14 | 517.12 | 496.07 | 478.66 | 435.42 | 371.38 | 337.34 | 289.02 | 273.14 | 228.63 | 200.50 | 190.53 | 204.17 | 117.33 | |
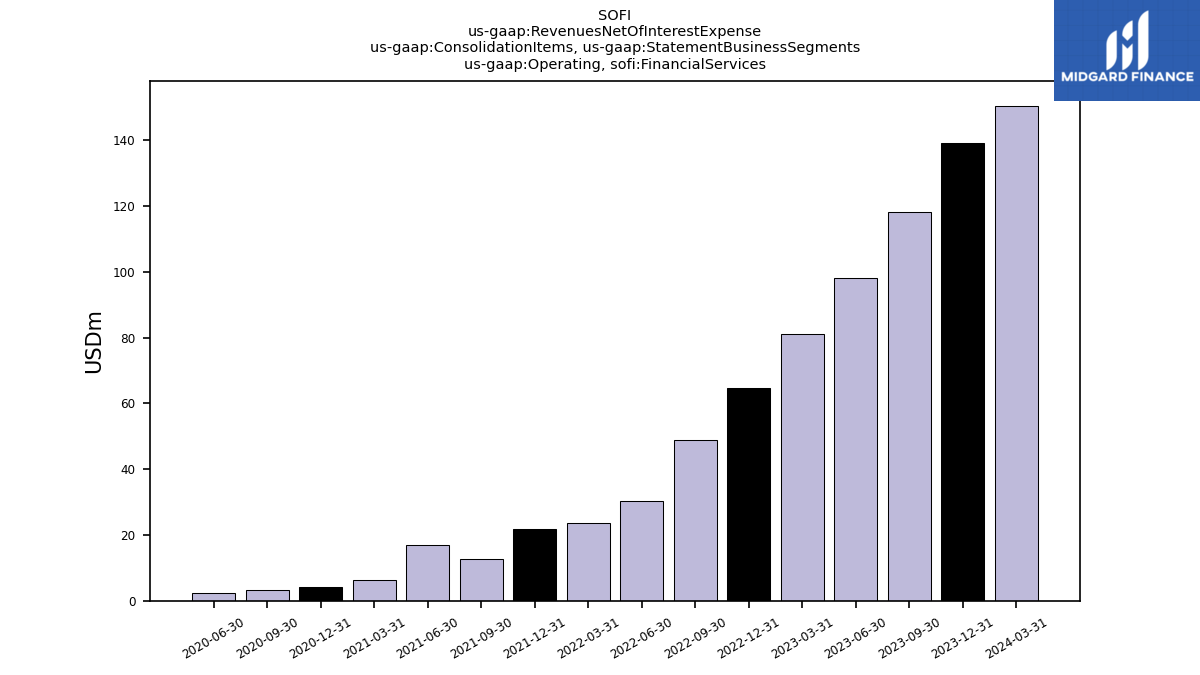
| Operating, Financial Services | 150.55 | 139.12 | 118.25 | 98.05 | 81.10 | 64.82 | 48.95 | 30.36 | 23.54 | 21.96 | 12.62 | 17.04 | 6.46 | 4.05 | 3.24 | 2.43 | |
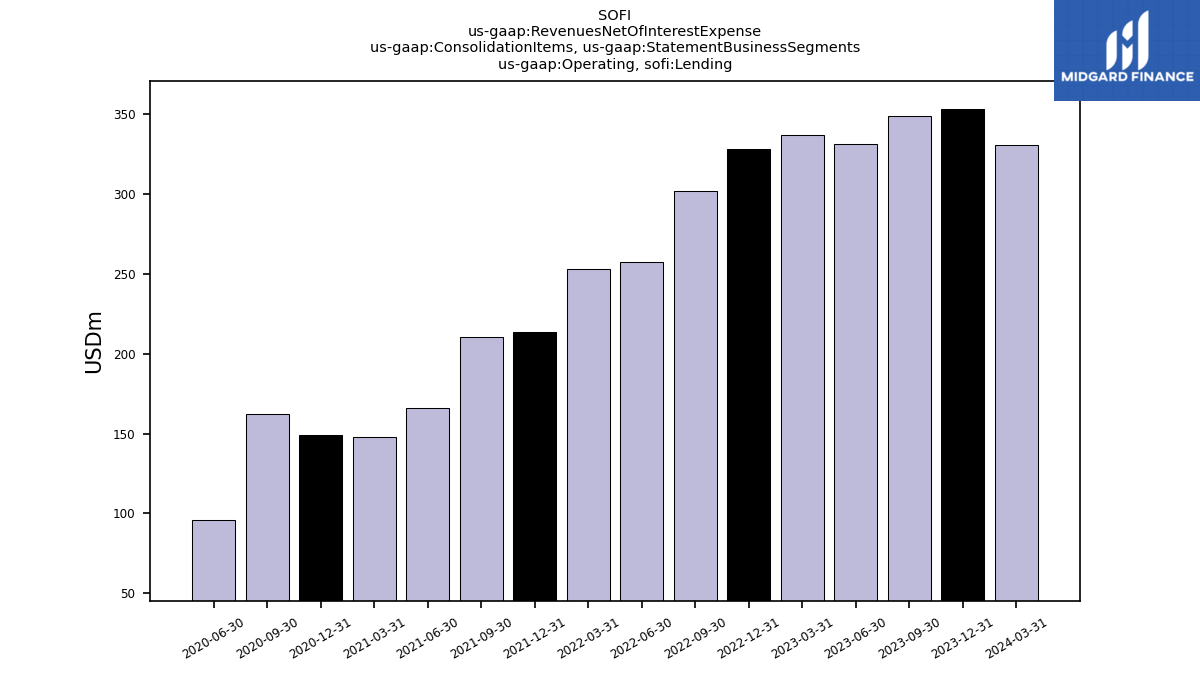
| Operating, Lending | 330.48 | 353.13 | 348.97 | 331.44 | 337.08 | 328.19 | 301.69 | 257.12 | 252.99 | 213.76 | 210.29 | 166.29 | 147.98 | 148.99 | 162.11 | 95.88 | |
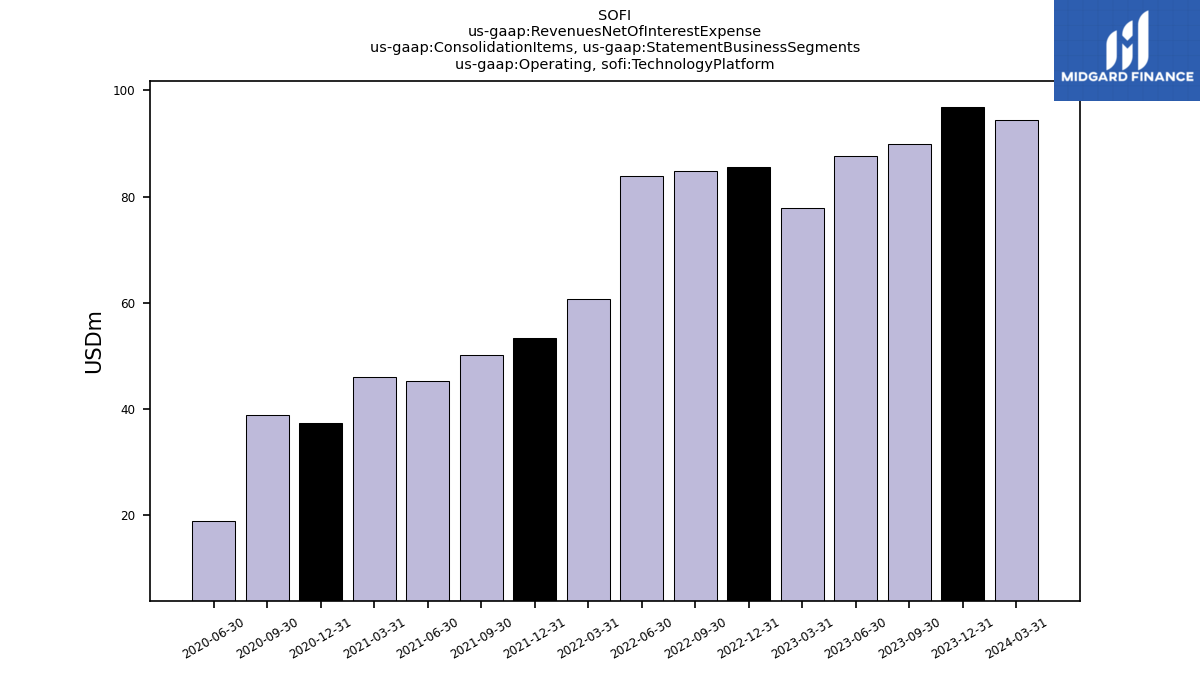
| Operating, Technology Platform | 94.37 | 96.91 | 89.92 | 87.62 | 77.89 | 85.65 | 84.78 | 83.90 | 60.80 | 53.30 | 50.23 | 45.30 | 46.06 | 37.48 | 38.82 | 19.02 |