
| 2023-09-30 | 2023-06-30 | 2023-03-31 | 2022-12-31 | 2022-09-30 | 2022-06-30 | 2022-03-31 | 2021-12-31 | 2021-09-30 | 2021-06-30 | 2021-03-31 | ||
|---|---|---|---|---|---|---|---|---|---|---|---|---|
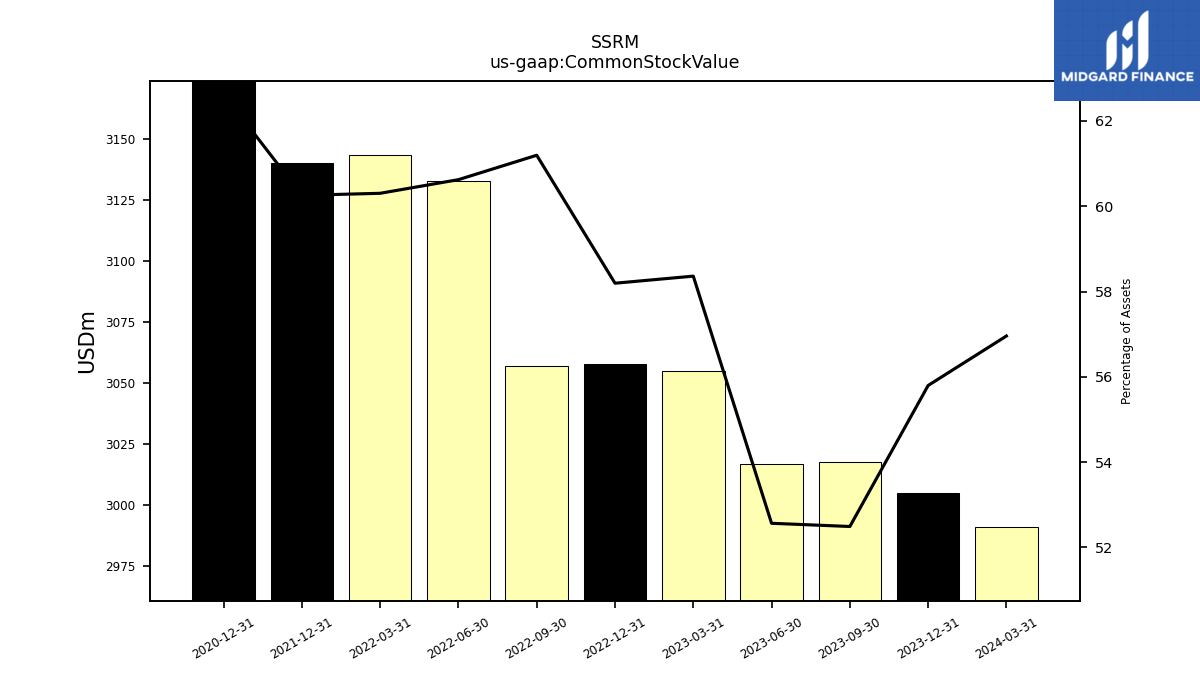
| Common Stock Value | 3017.85 | 3016.84 | 3055.06 | 3057.92 | 3056.92 | 3133.01 | 3143.45 | 3140.19 | NA | NA | NA | |
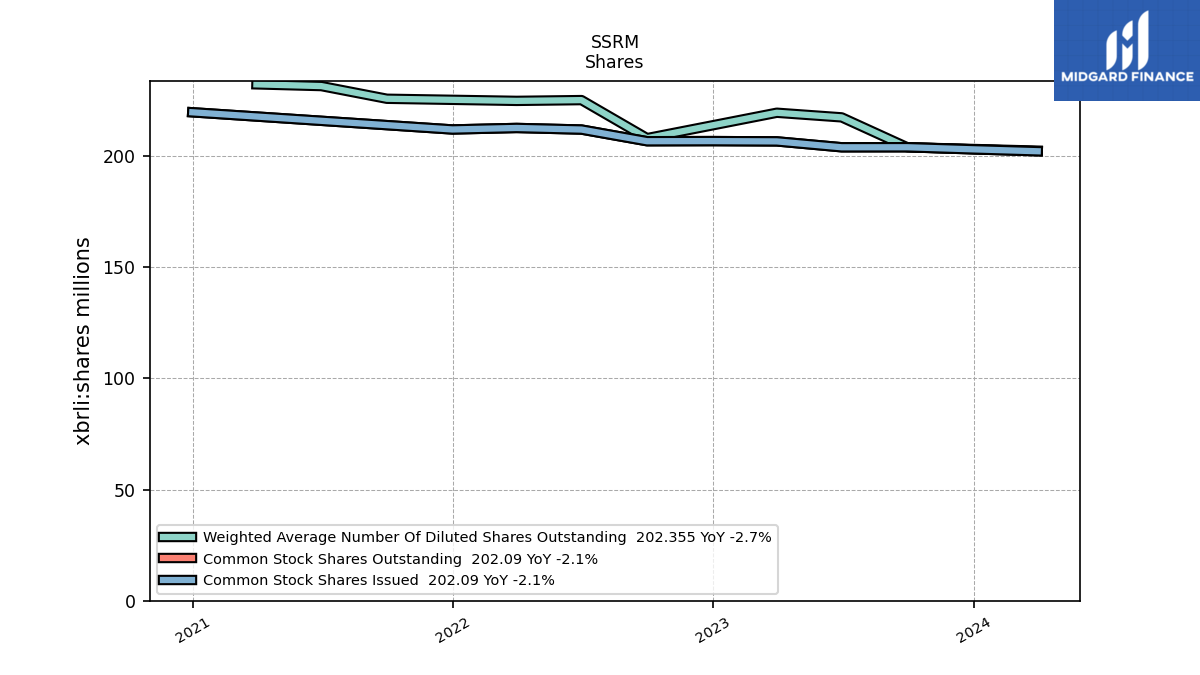
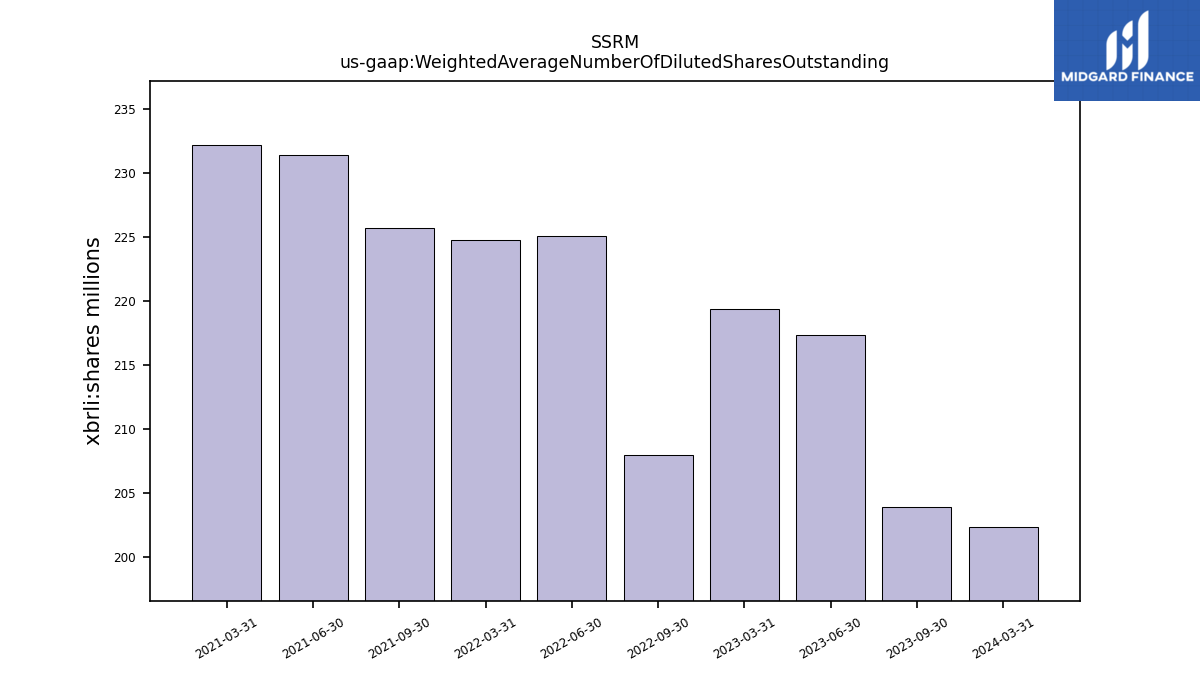
| Weighted Average Number Of Diluted Shares Outstanding | 203.88 | 217.32 | 219.40 | NA | 207.98 | 225.08 | 224.74 | NA | 225.69 | 231.39 | 232.17 | |
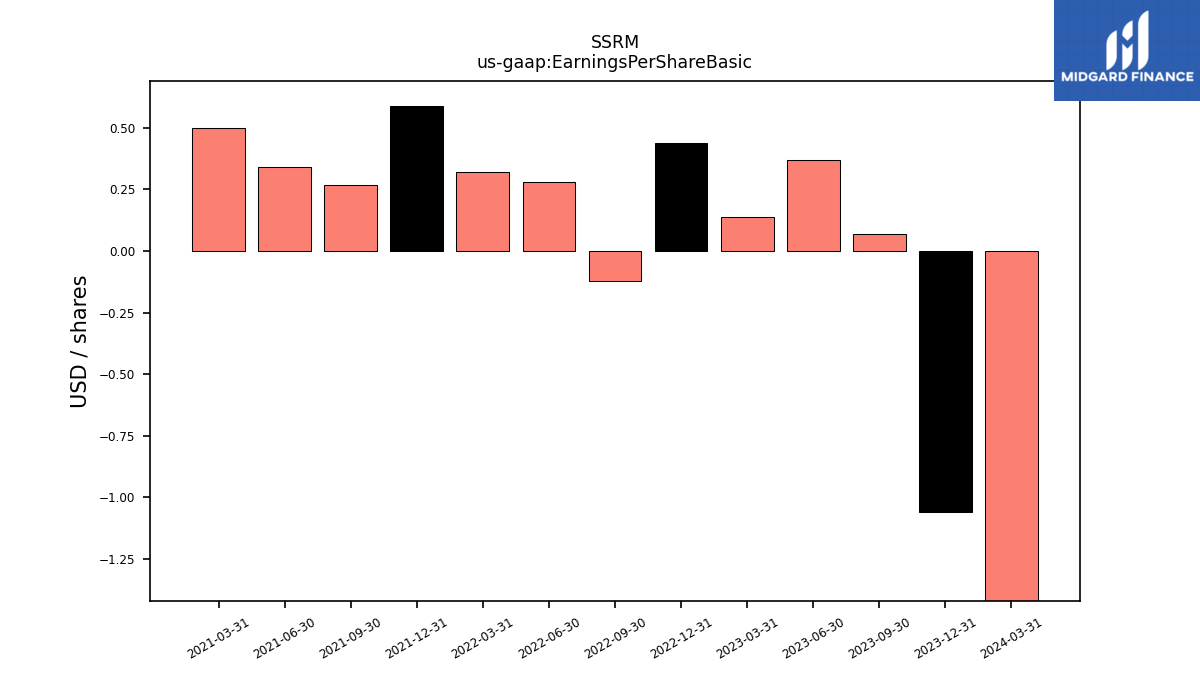
| Earnings Per Share Basic | 0.07 | 0.37 | 0.14 | 0.44 | -0.12 | 0.28 | 0.32 | 0.59 | 0.27 | 0.34 | 0.50 | |
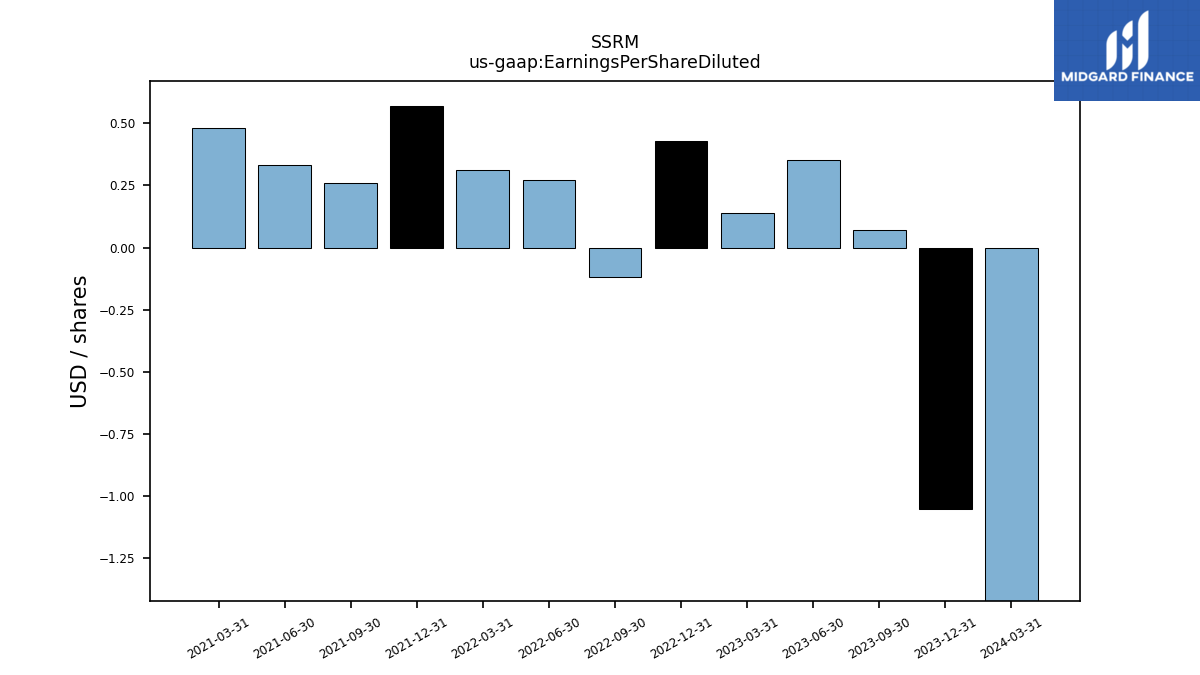
| Earnings Per Share Diluted | 0.07 | 0.35 | 0.14 | 0.43 | -0.12 | 0.27 | 0.31 | 0.57 | 0.26 | 0.33 | 0.48 |
| 2023-09-30 | 2023-06-30 | 2023-03-31 | 2022-12-31 | 2022-09-30 | 2022-06-30 | 2022-03-31 | 2021-12-31 | 2021-09-30 | 2021-06-30 | 2021-03-31 | ||
|---|---|---|---|---|---|---|---|---|---|---|---|---|
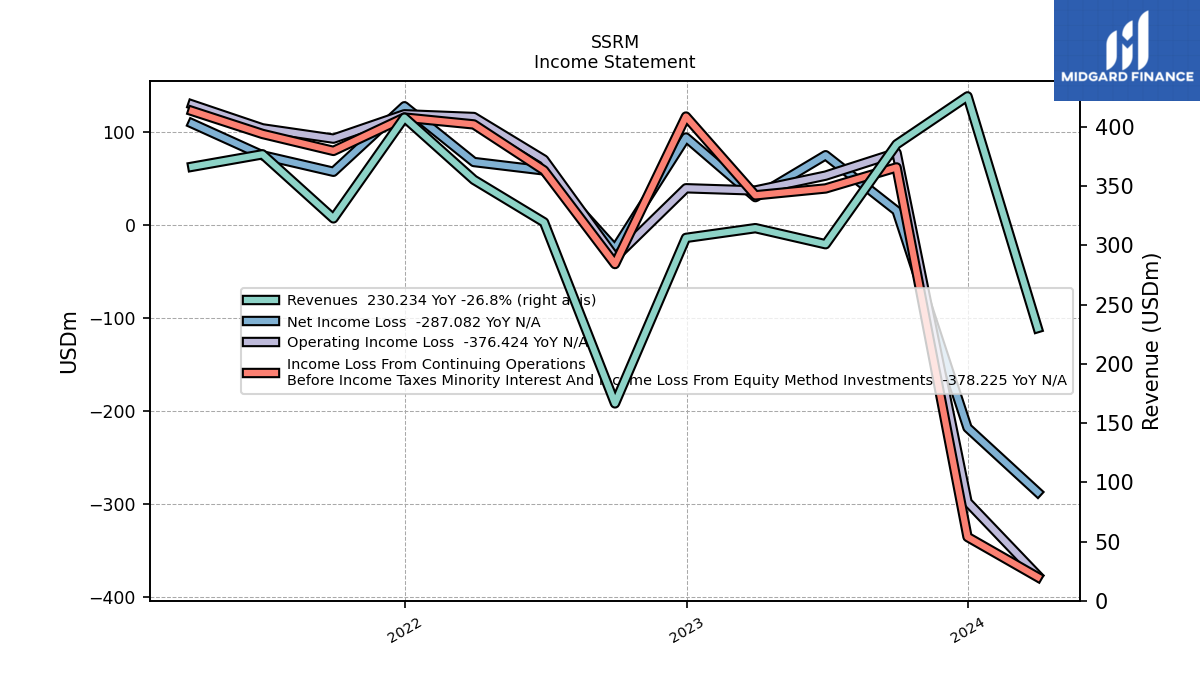
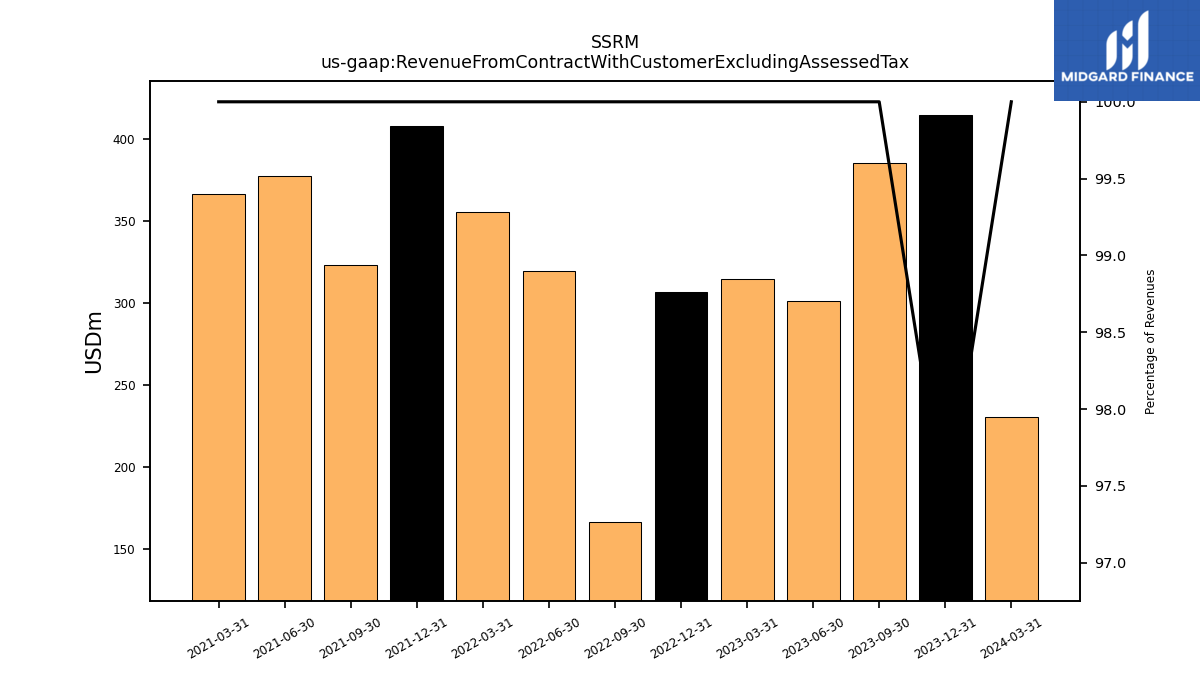
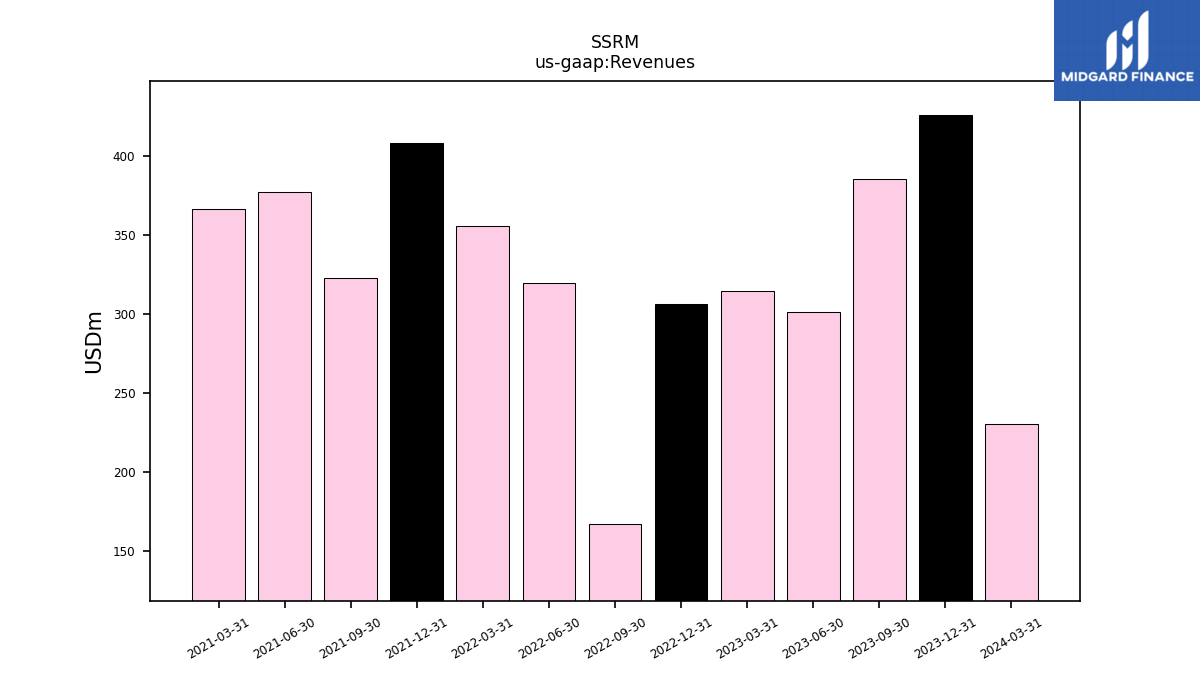
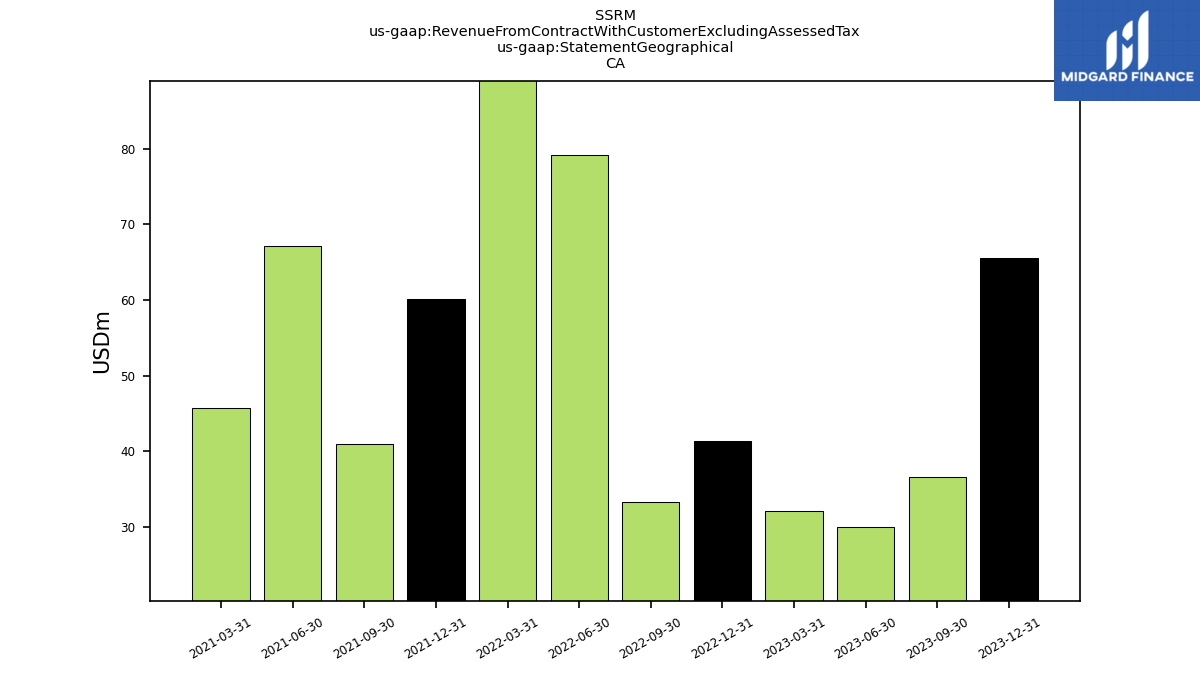
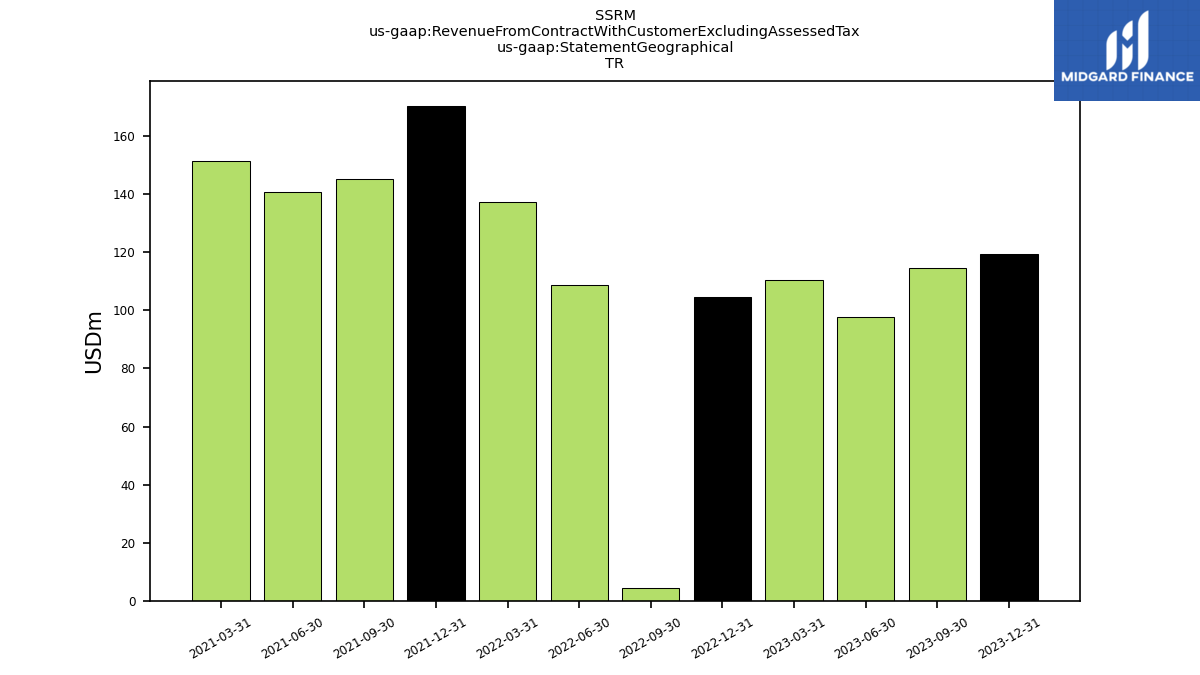
| Revenue From Contract With Customer Excluding Assessed Tax | 385.39 | 301.03 | 314.61 | 306.38 | 166.63 | 319.58 | 355.45 | 407.92 | 322.85 | 376.95 | 366.48 | |
| Revenues | 385.39 | 301.03 | 314.61 | 306.38 | 166.63 | 319.58 | 355.45 | 407.92 | 322.85 | 376.95 | 366.48 | |
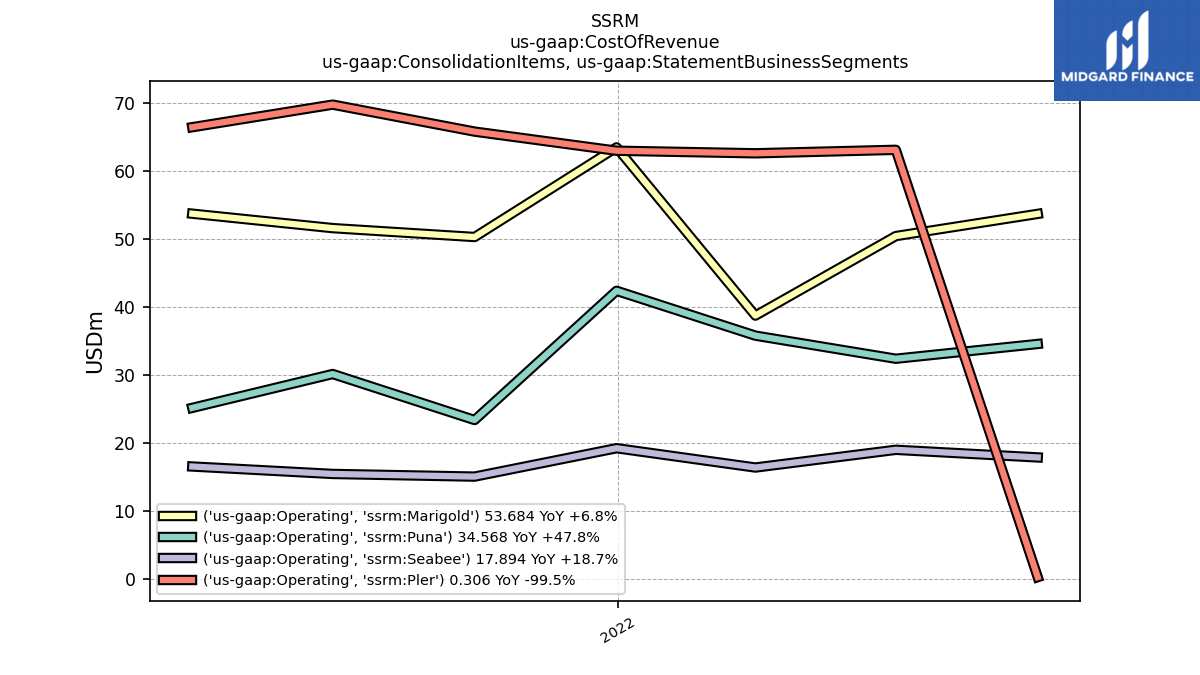
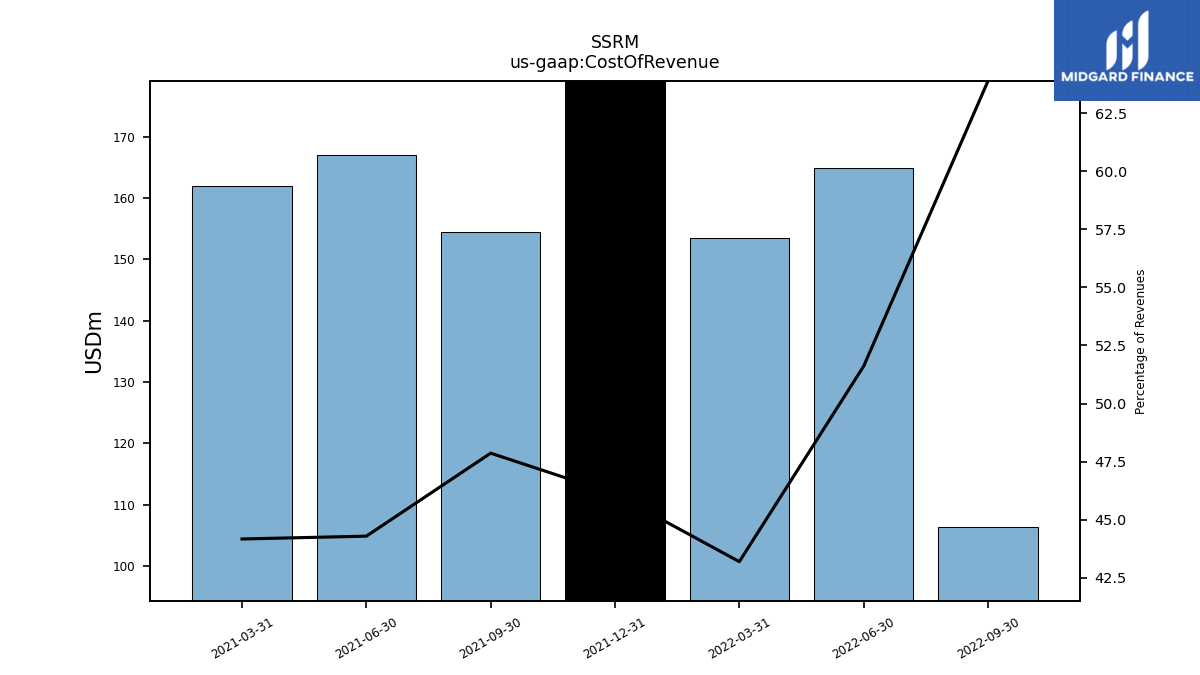
| Cost Of Revenue | NA | NA | NA | NA | 106.45 | 164.93 | 153.52 | 188.04 | 154.52 | 166.95 | 161.86 | |
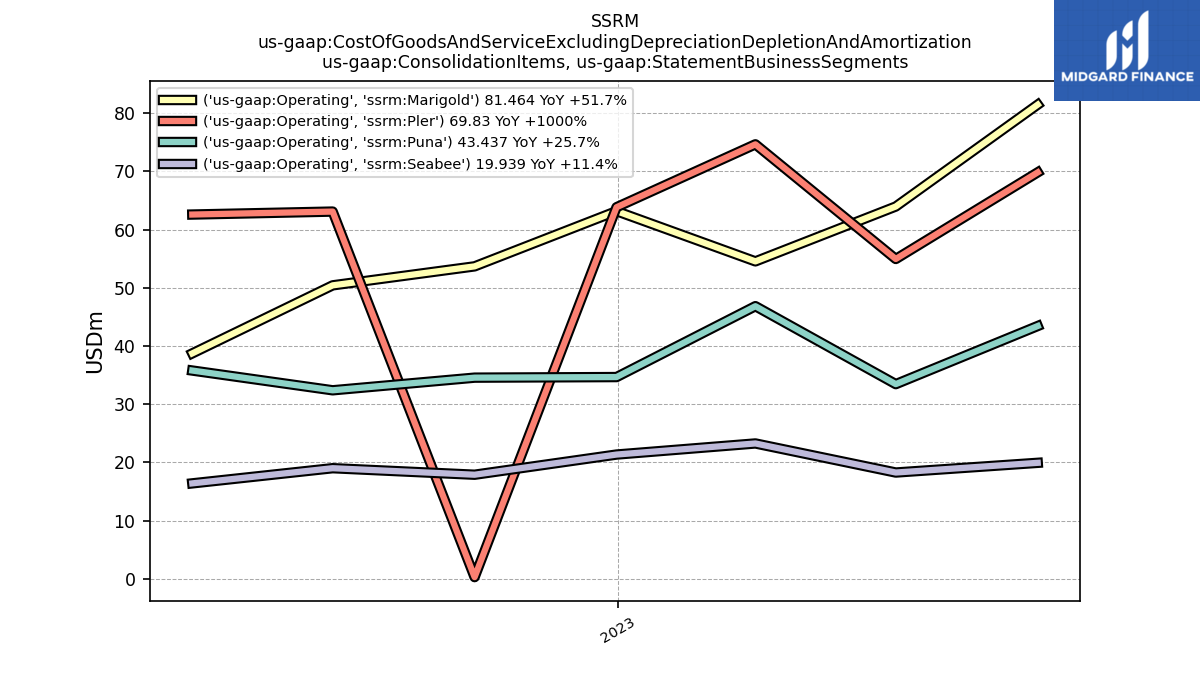
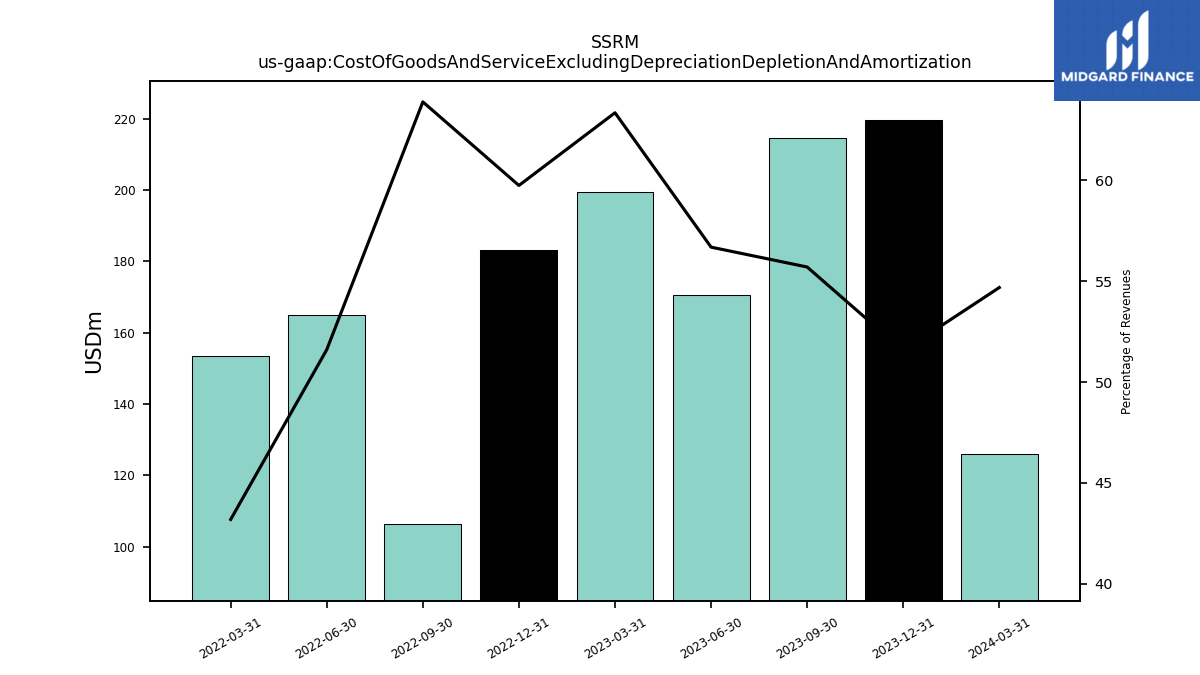
| Cost Of Goods And Service Excluding Depreciation Depletion And Amortization | 214.67 | 170.64 | 199.30 | 183.04 | 106.45 | 164.93 | 153.52 | NA | NA | NA | NA | |
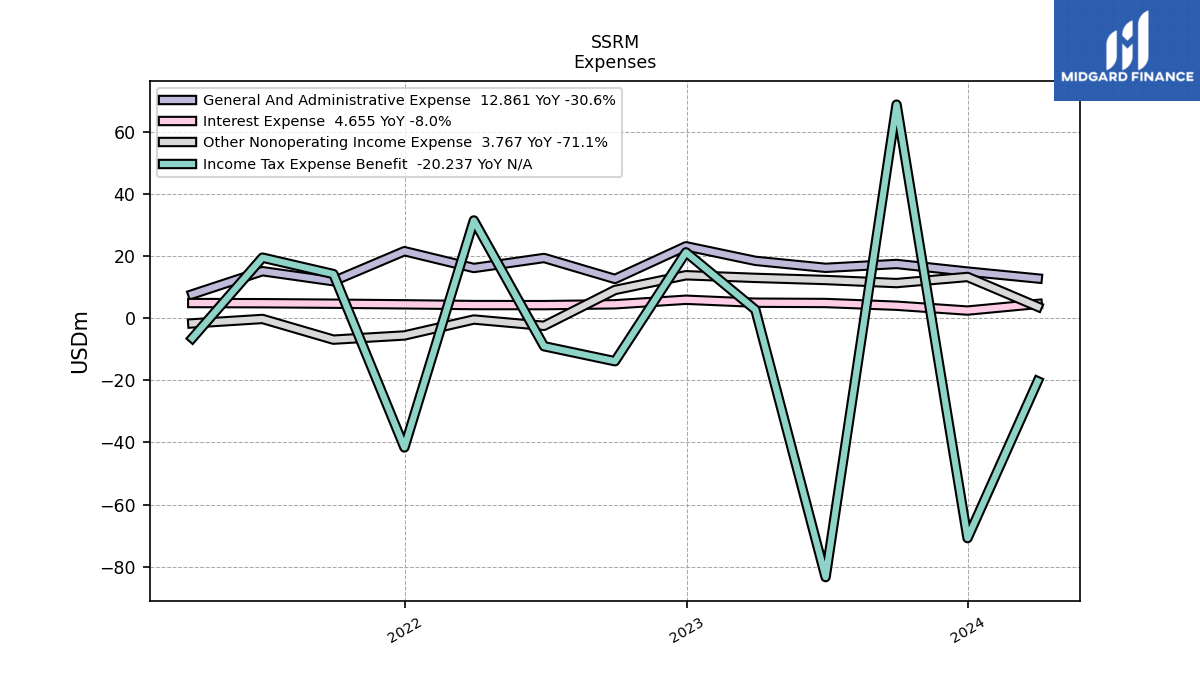
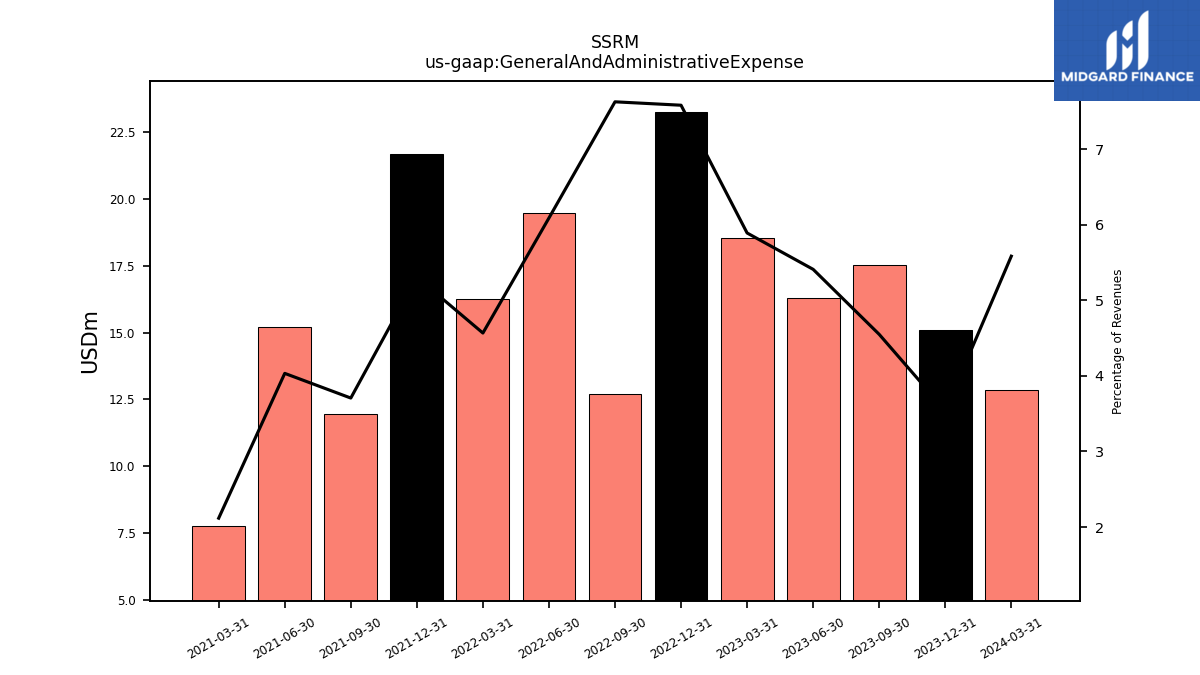
| General And Administrative Expense | 17.54 | 16.29 | 18.54 | 23.24 | 12.71 | 19.47 | 16.24 | 21.66 | 11.97 | 15.21 | 7.76 | |
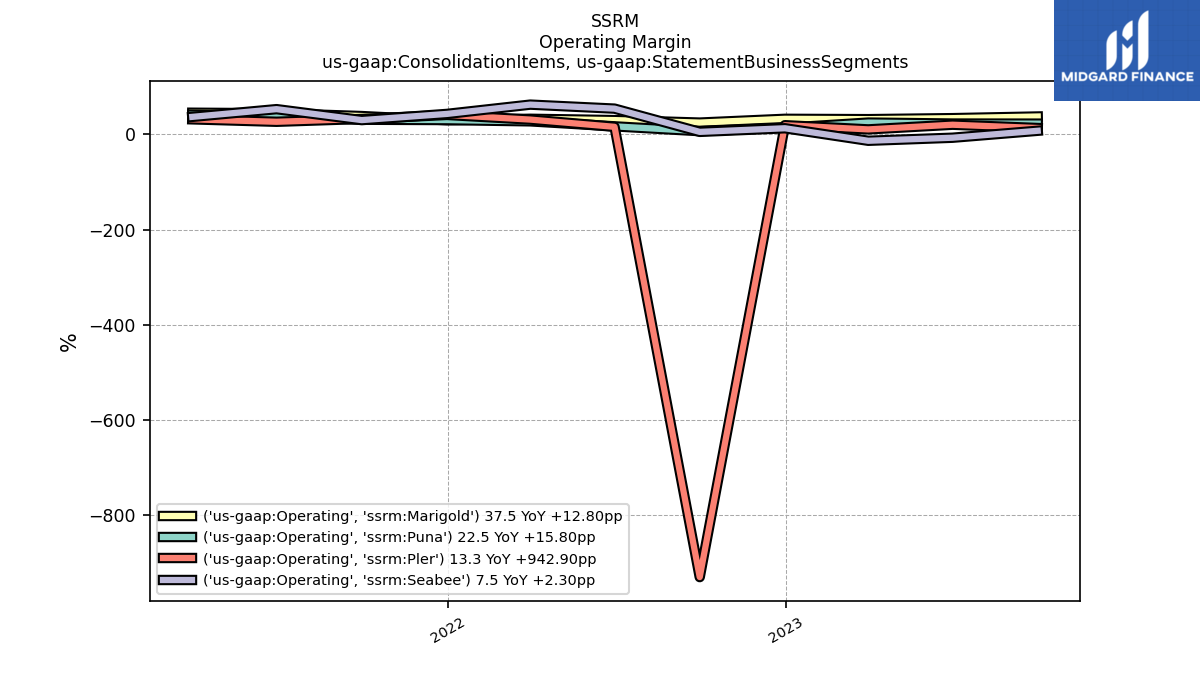
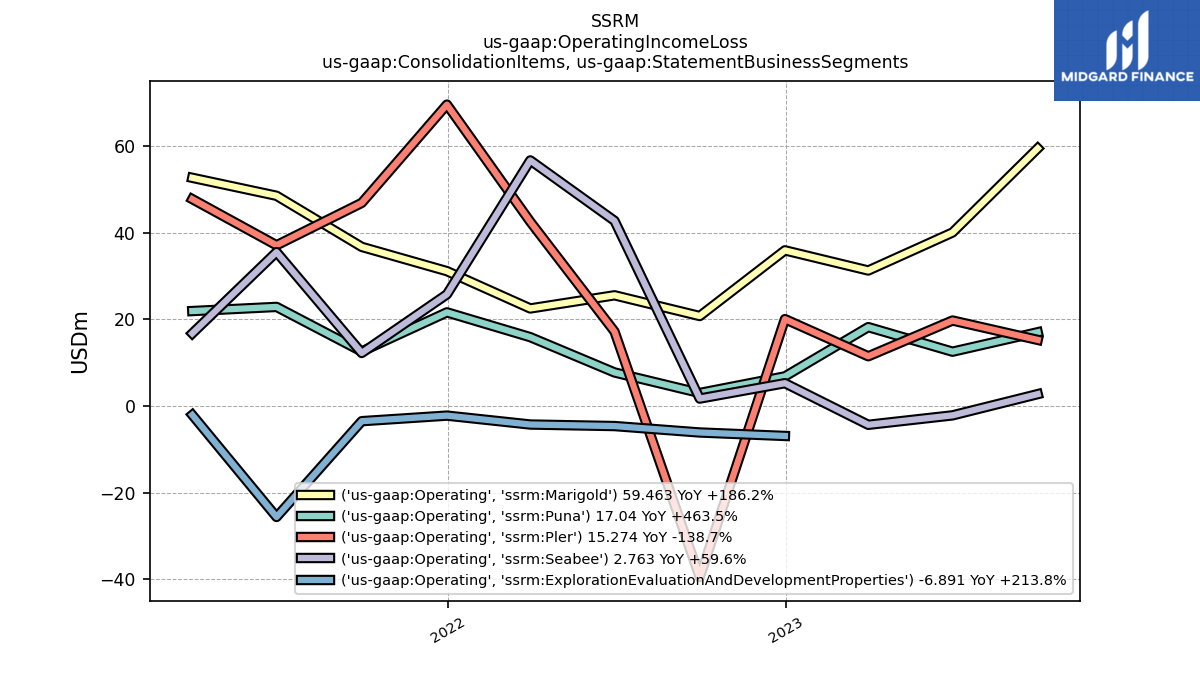
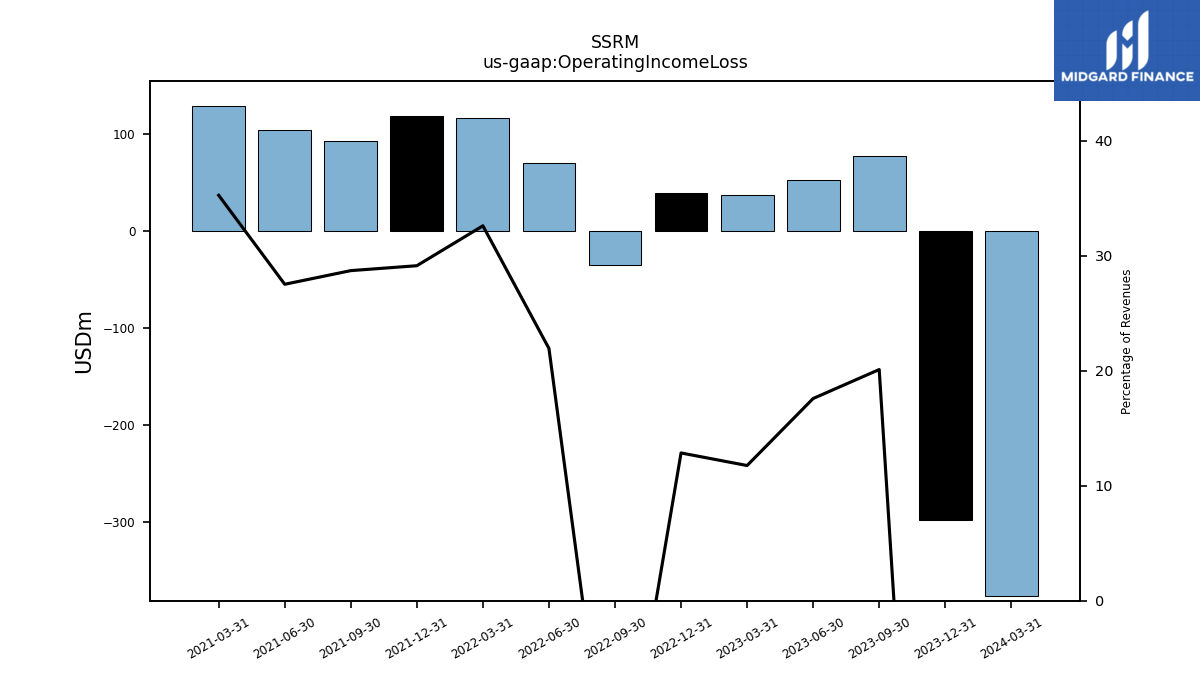
| Operating Income Loss | 77.47 | 52.93 | 36.98 | 39.37 | -35.06 | 70.09 | 115.87 | 118.82 | 92.66 | 103.72 | 129.18 | |
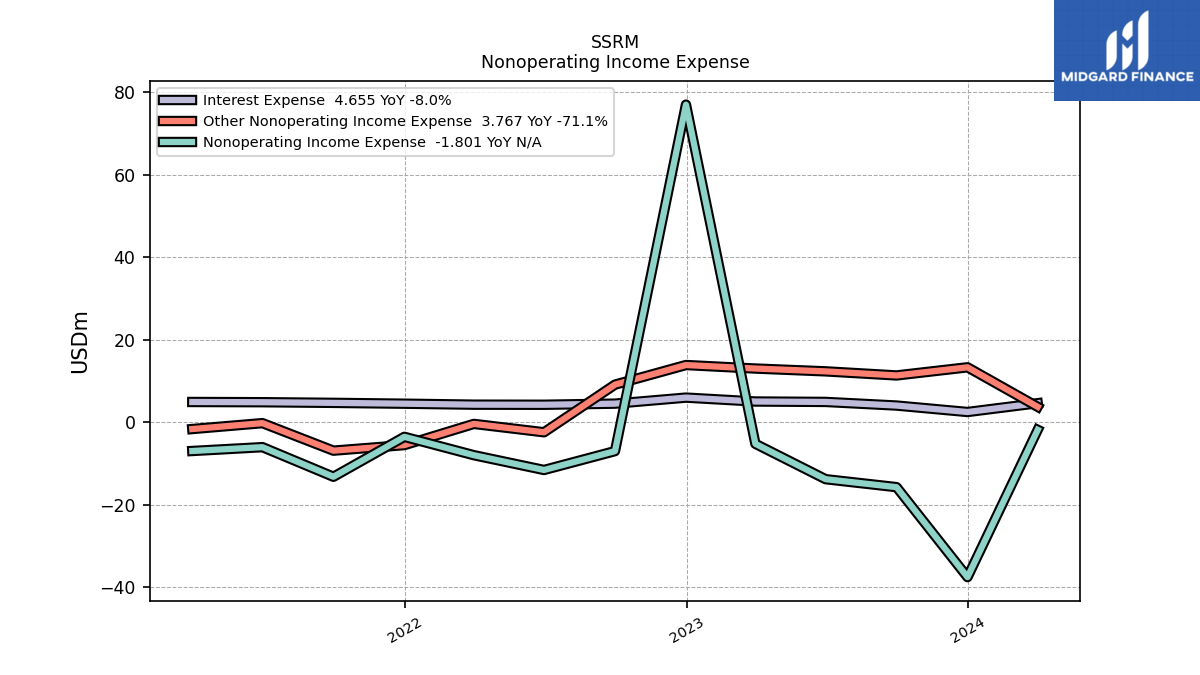
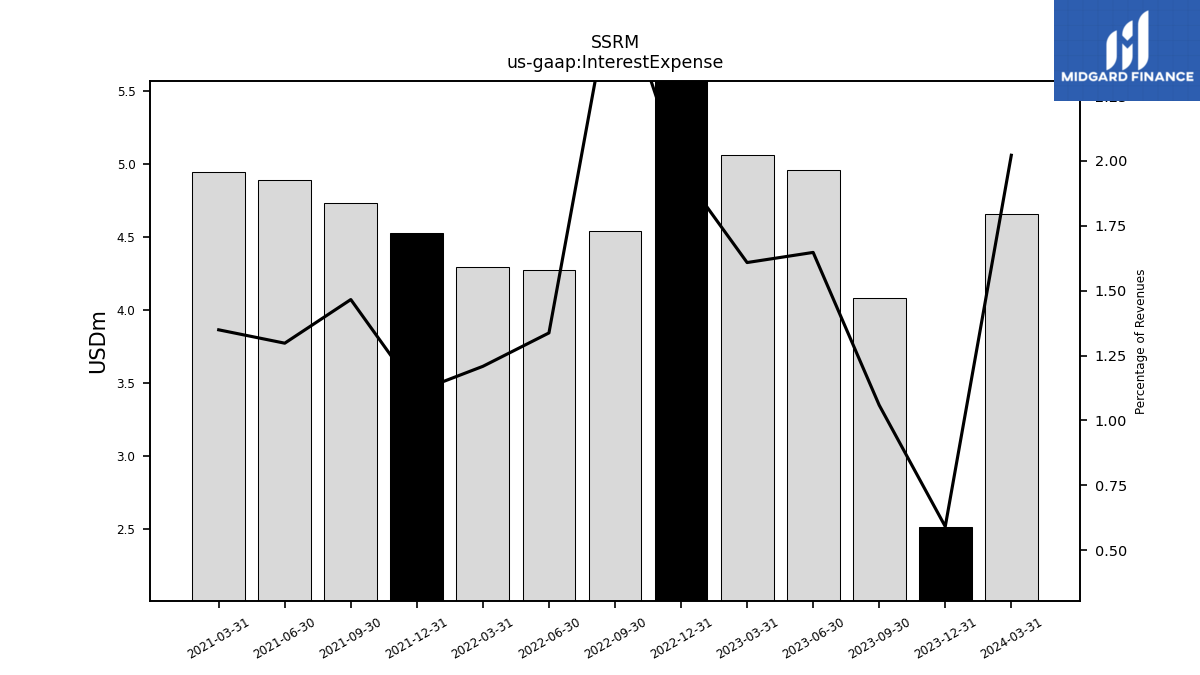
| Interest Expense | 4.08 | 4.96 | 5.06 | 6.01 | 4.54 | 4.27 | 4.29 | 4.53 | 4.73 | 4.89 | 4.94 | |
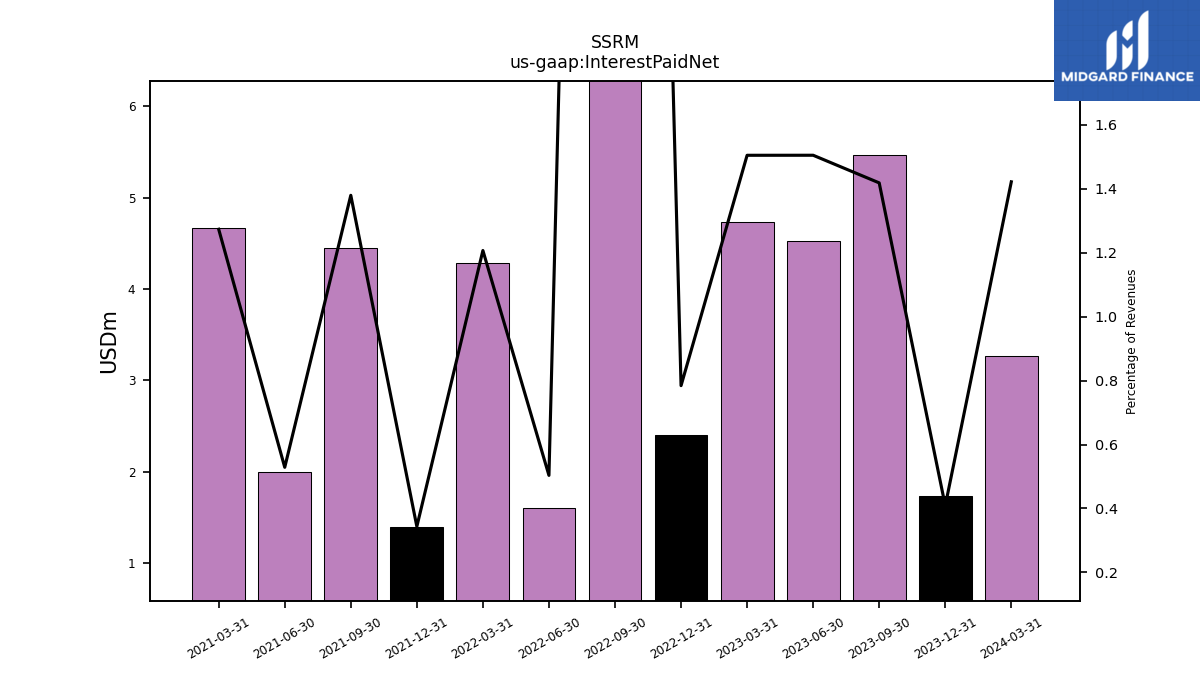
| Interest Paid Net | 5.46 | 4.53 | 4.73 | 2.40 | 14.28 | 1.61 | 4.29 | 1.40 | 4.45 | 1.99 | 4.67 | |
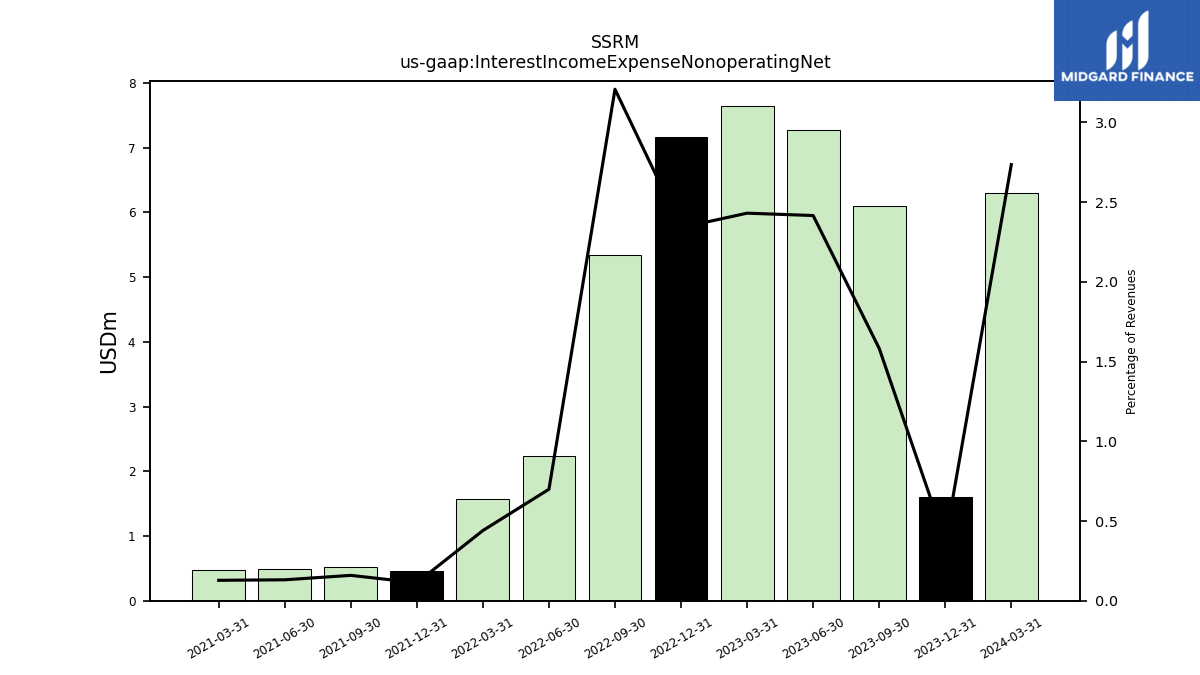
| Interest Income Expense Nonoperating Net | 6.10 | 7.27 | 7.65 | 7.17 | 5.34 | 2.23 | 1.56 | 0.46 | 0.51 | 0.49 | 0.47 | |
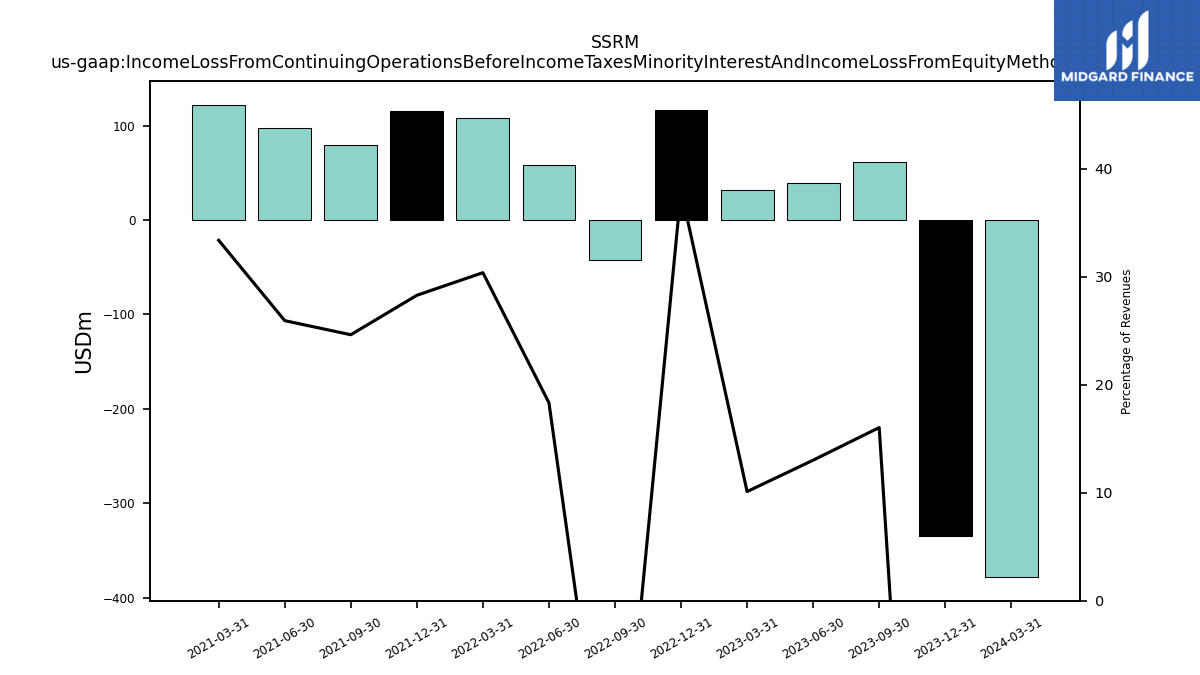
| Income Loss From Continuing Operations Before Income Taxes Minority Interest And Income Loss From Equity Method Investments | 61.77 | 39.16 | 31.79 | 116.39 | -42.03 | 58.56 | 107.92 | 115.32 | 79.48 | 97.71 | 122.25 | |
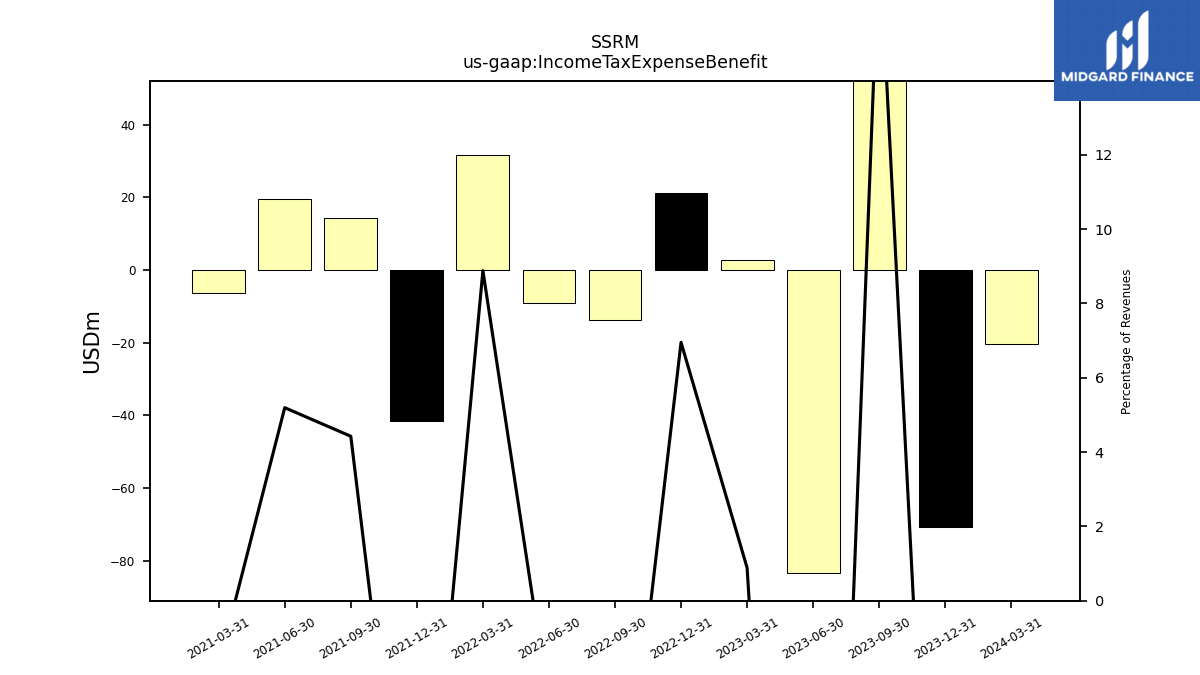
| Income Tax Expense Benefit | 68.89 | -83.39 | 2.79 | 21.29 | -13.81 | -8.98 | 31.56 | -41.60 | 14.29 | 19.58 | -6.38 | |
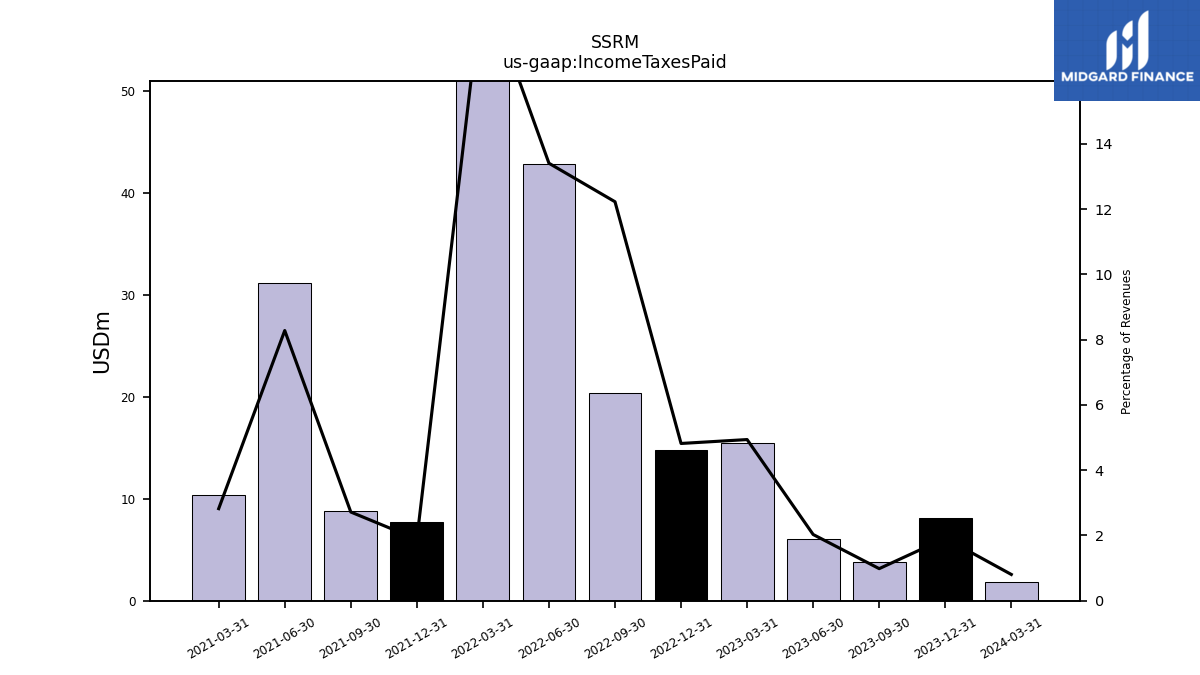
| Income Taxes Paid | 3.79 | 6.11 | 15.53 | 14.76 | 20.36 | 42.83 | 67.59 | 7.69 | 8.78 | 31.20 | 10.34 | |
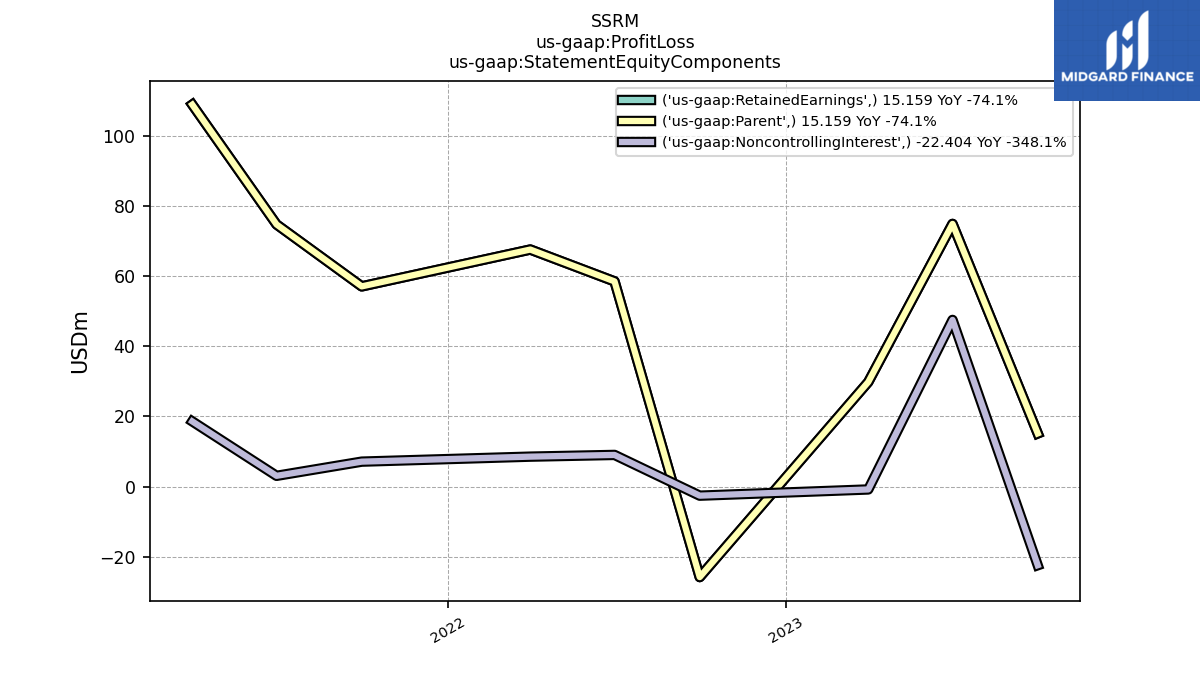
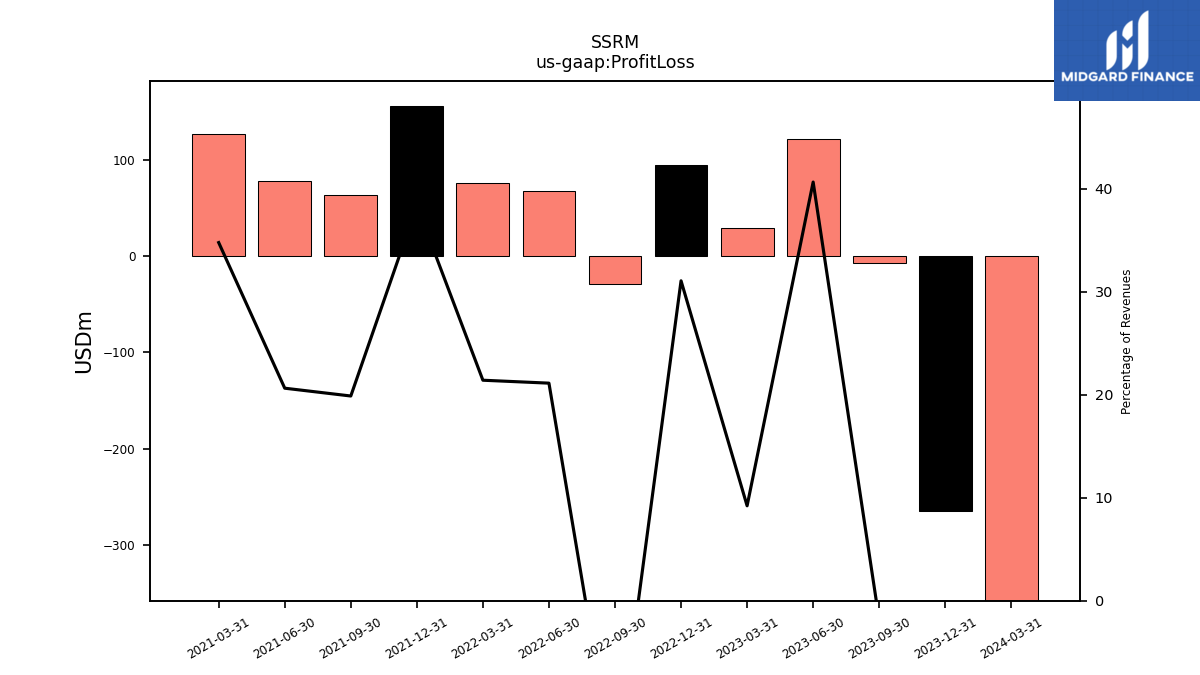
| Profit Loss | -7.25 | 122.38 | 29.00 | 95.18 | -28.37 | 67.52 | 76.11 | 156.50 | 64.18 | 77.79 | 127.45 | |
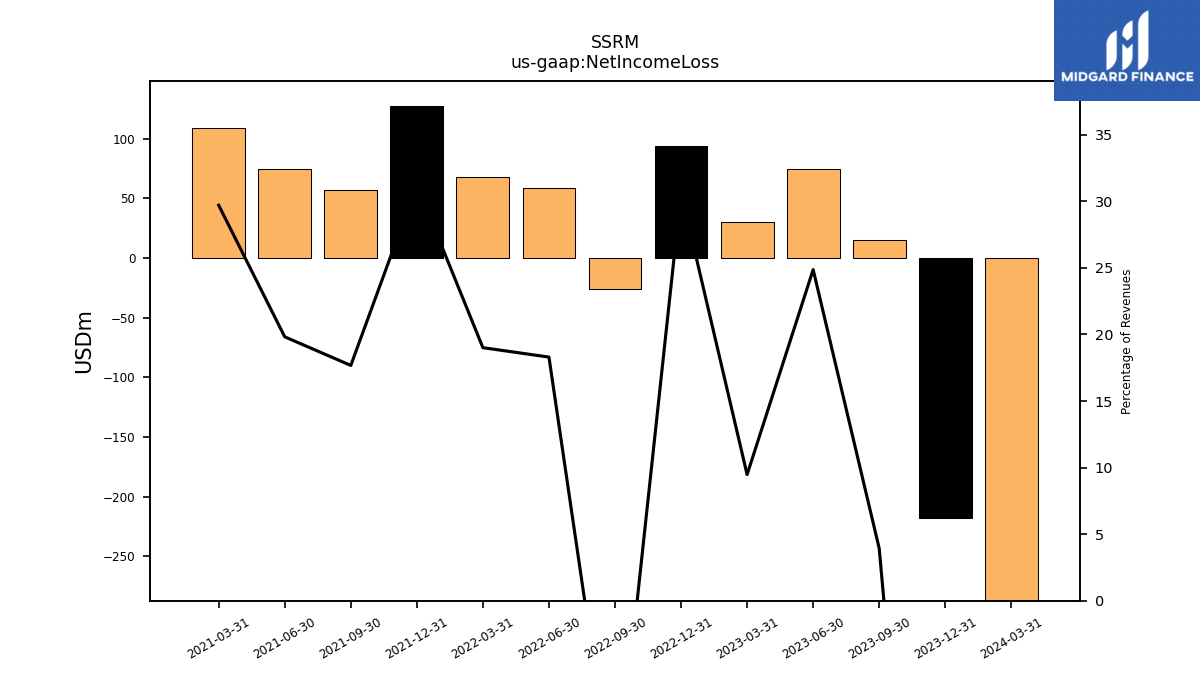
| Net Income Loss | 15.16 | 74.87 | 29.81 | 93.88 | -25.79 | 58.49 | 67.56 | 127.44 | 57.06 | 74.72 | 108.86 | |
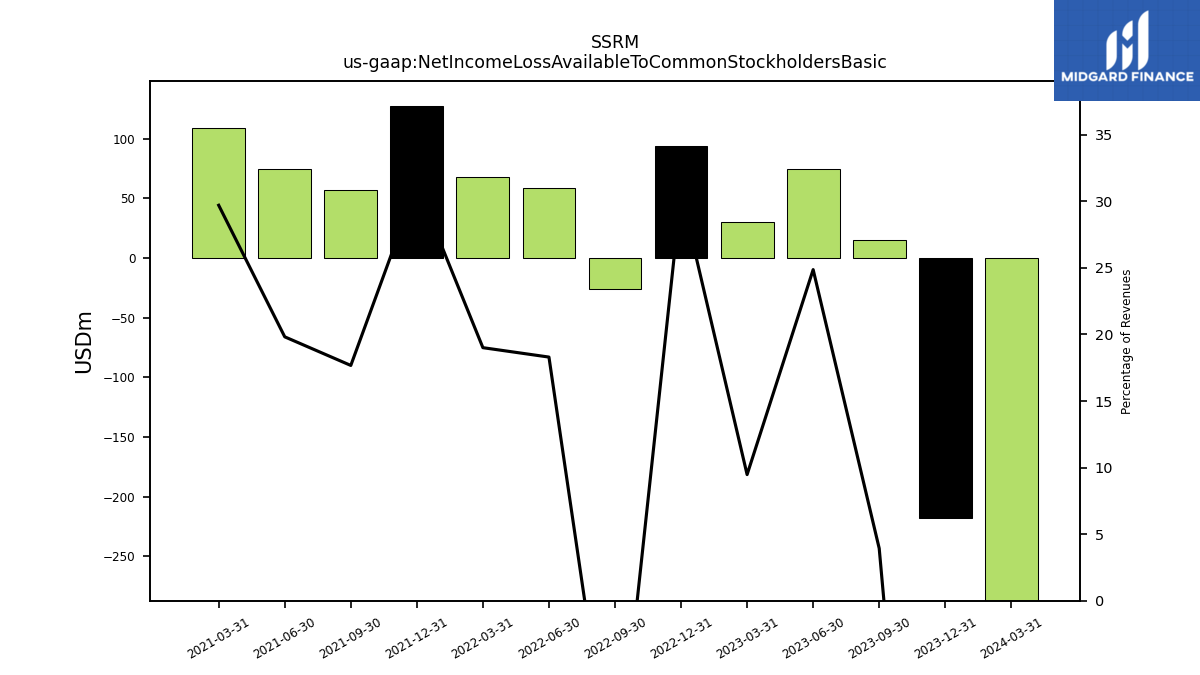
| Net Income Loss Available To Common Stockholders Basic | 15.16 | 74.87 | 29.81 | 93.88 | -25.79 | 58.49 | 67.56 | 127.44 | 57.06 | 74.72 | 108.86 | |
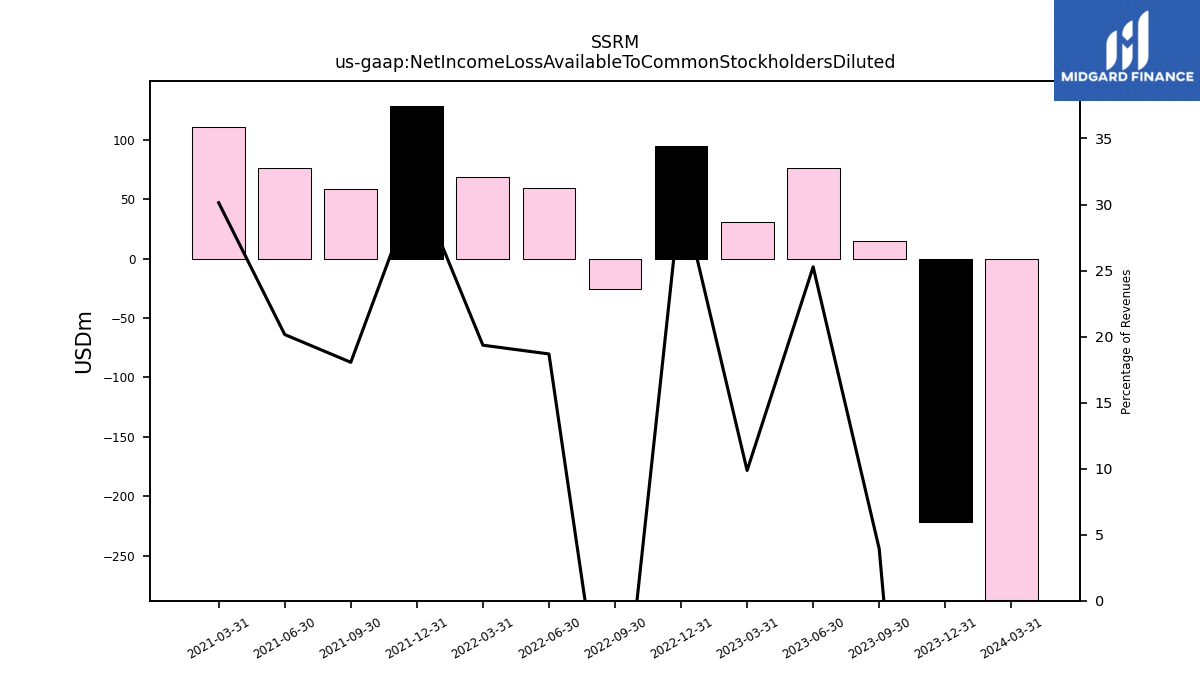
| Net Income Loss Available To Common Stockholders Diluted | 15.16 | 76.10 | 31.03 | 95.12 | -25.79 | 59.72 | 68.78 | 128.66 | 58.29 | 75.98 | 110.44 |
| 2023-09-30 | 2023-06-30 | 2023-03-31 | 2022-12-31 | 2022-09-30 | 2022-06-30 | 2022-03-31 | 2021-12-31 | 2021-09-30 | 2021-06-30 | 2021-03-31 | ||
|---|---|---|---|---|---|---|---|---|---|---|---|---|
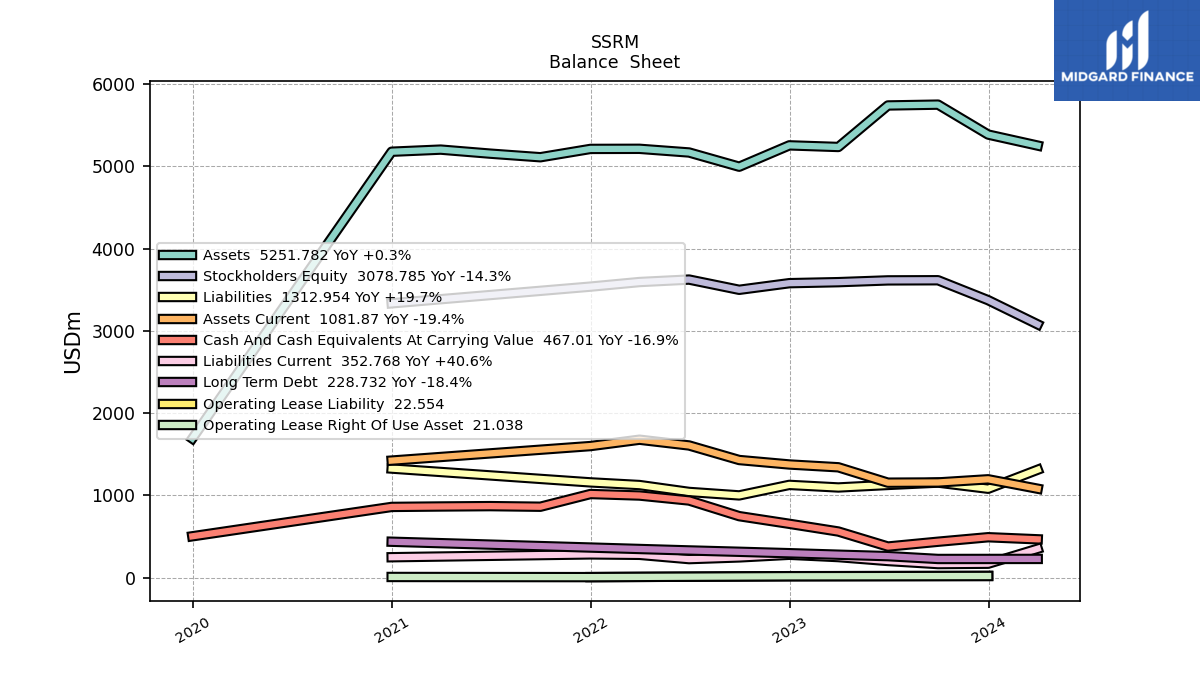
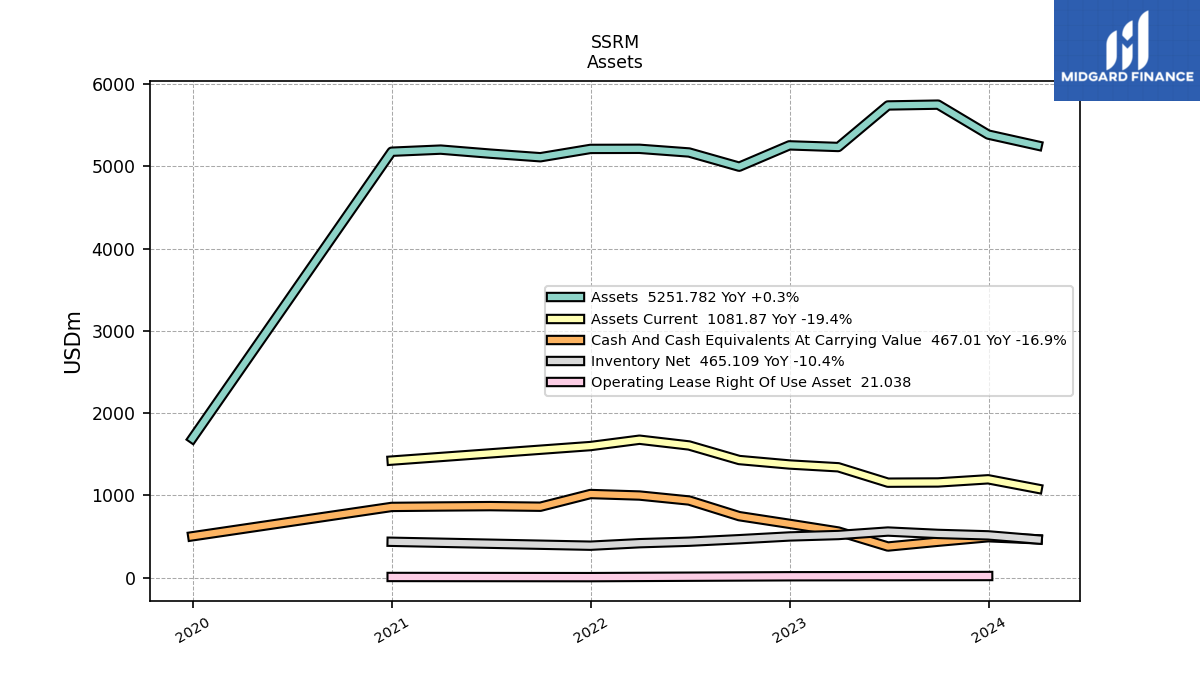
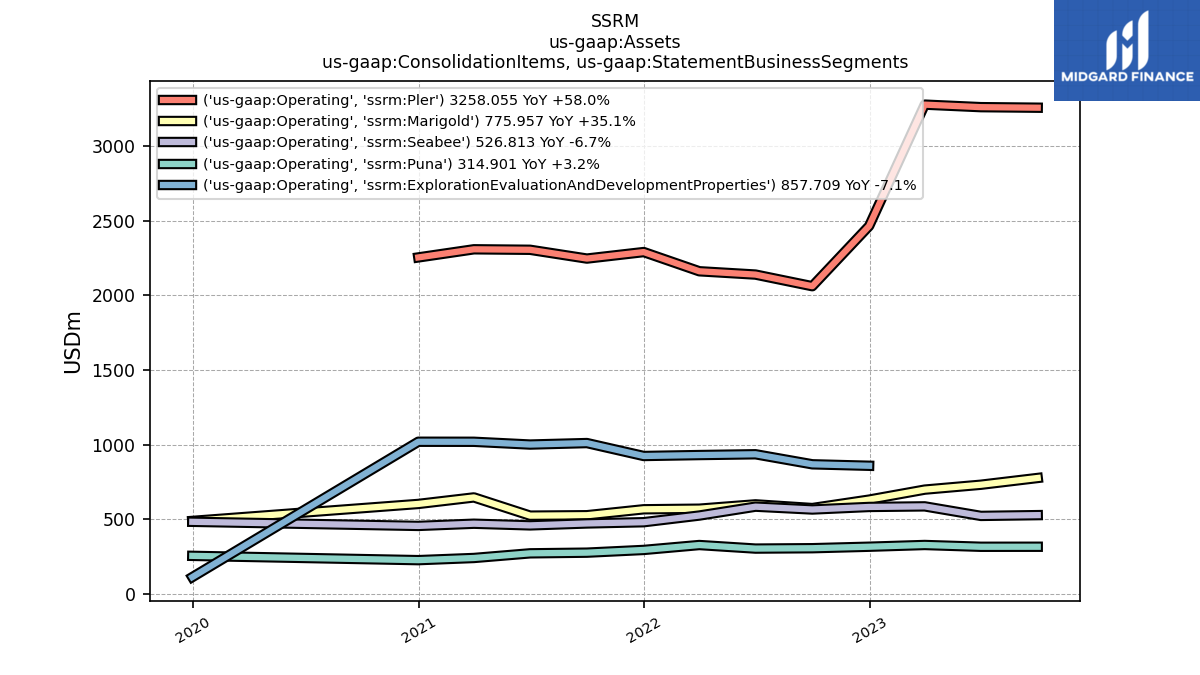
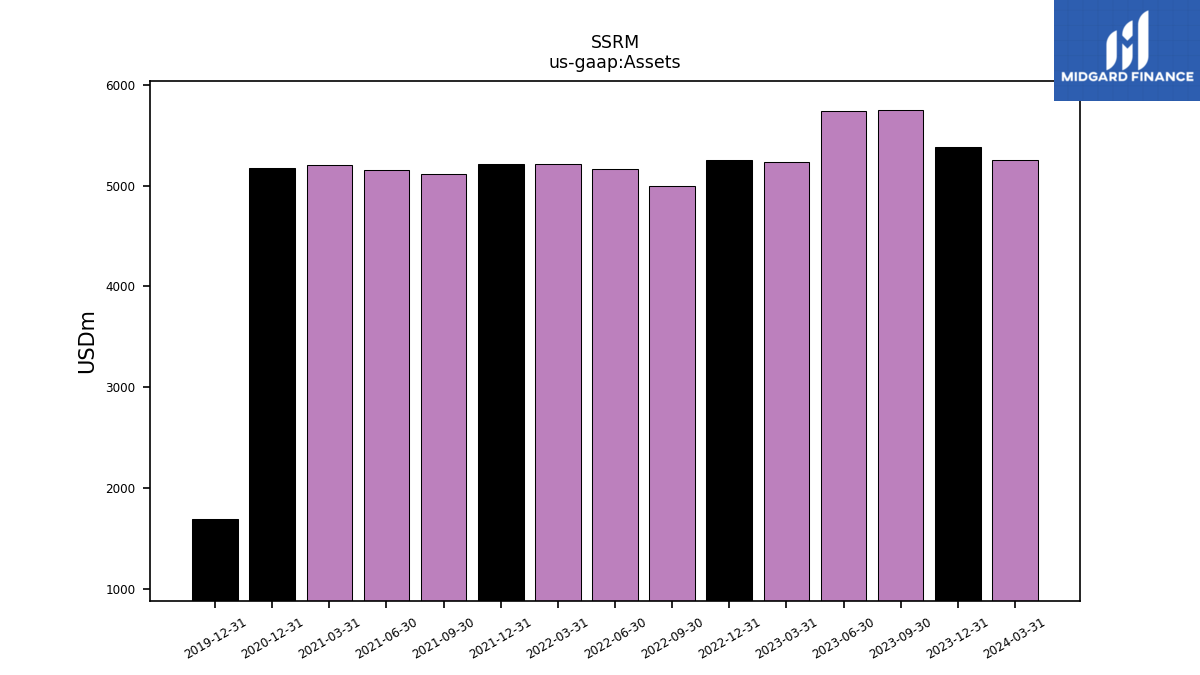
| Assets | 5749.66 | 5739.48 | 5234.80 | 5254.66 | 4995.26 | 5167.95 | 5212.66 | 5211.44 | 5110.17 | 5153.91 | 5203.01 | |
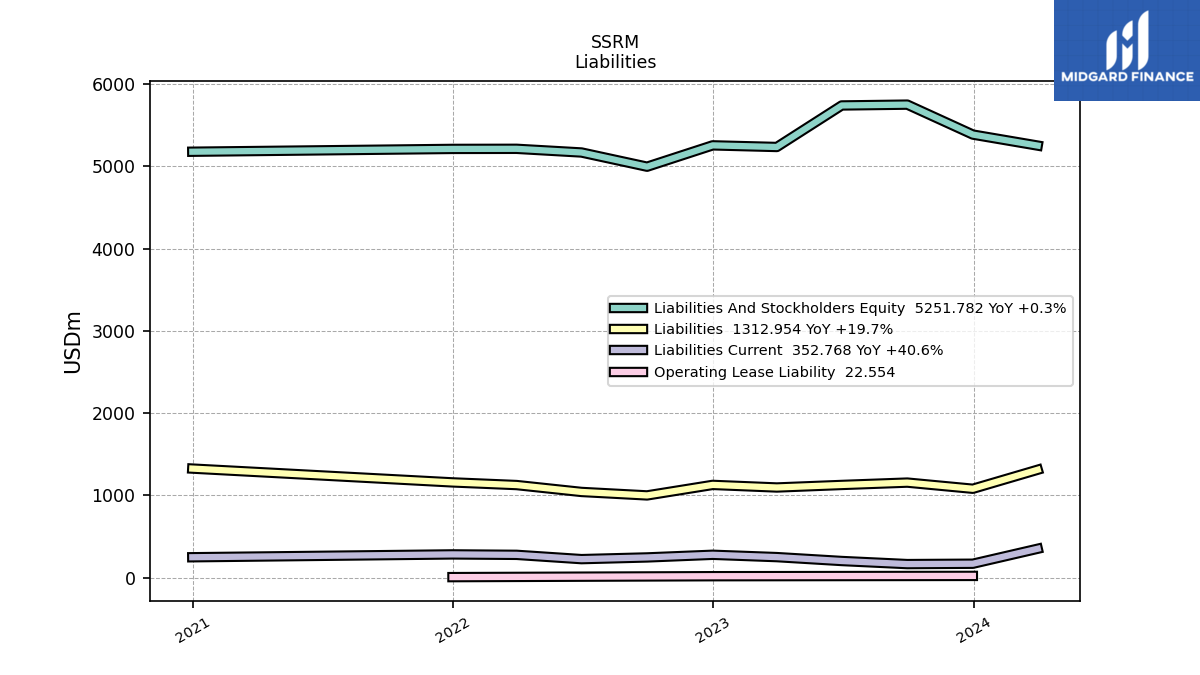
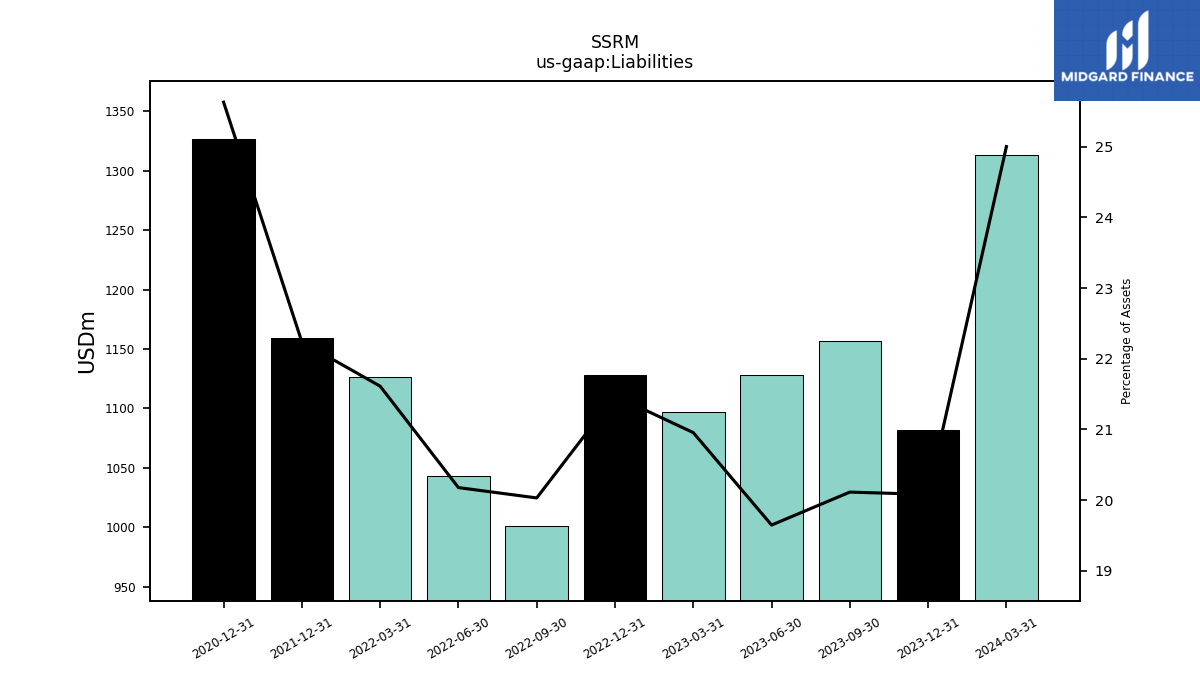
| Liabilities | 1156.55 | 1127.75 | 1096.99 | 1128.46 | 1000.68 | 1042.82 | 1126.57 | 1158.92 | NA | NA | NA | |
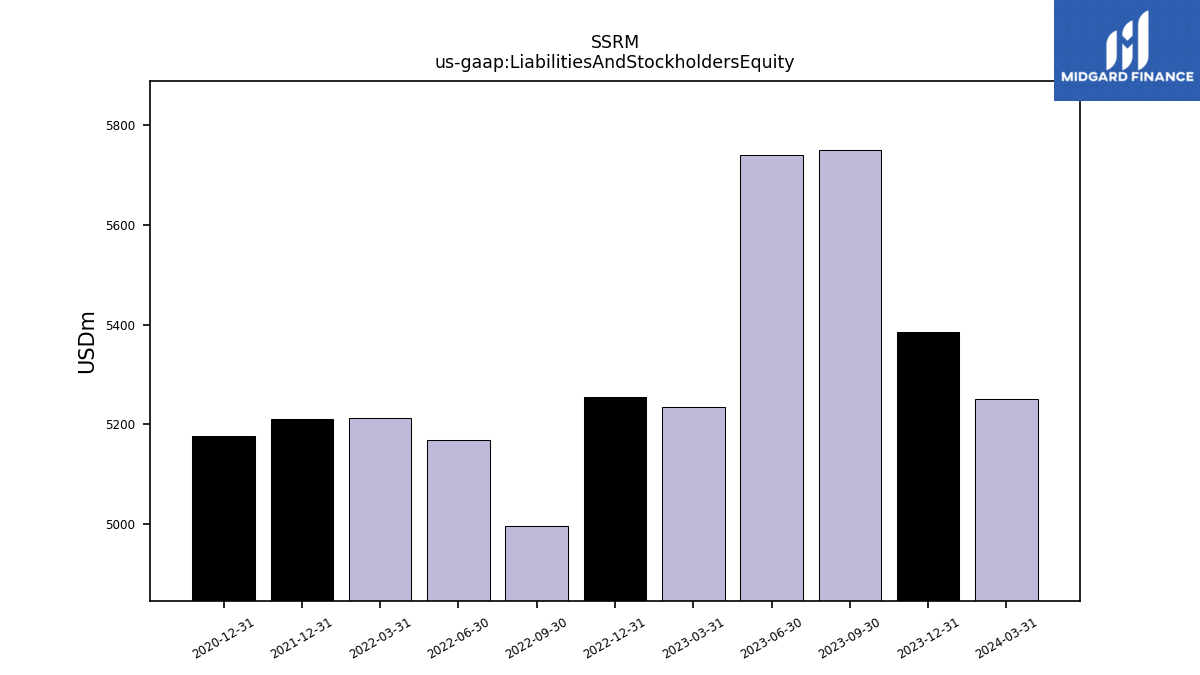
| Liabilities And Stockholders Equity | 5749.66 | 5739.48 | 5234.80 | 5254.66 | 4995.26 | 5167.95 | 5212.66 | 5211.44 | NA | NA | NA | |
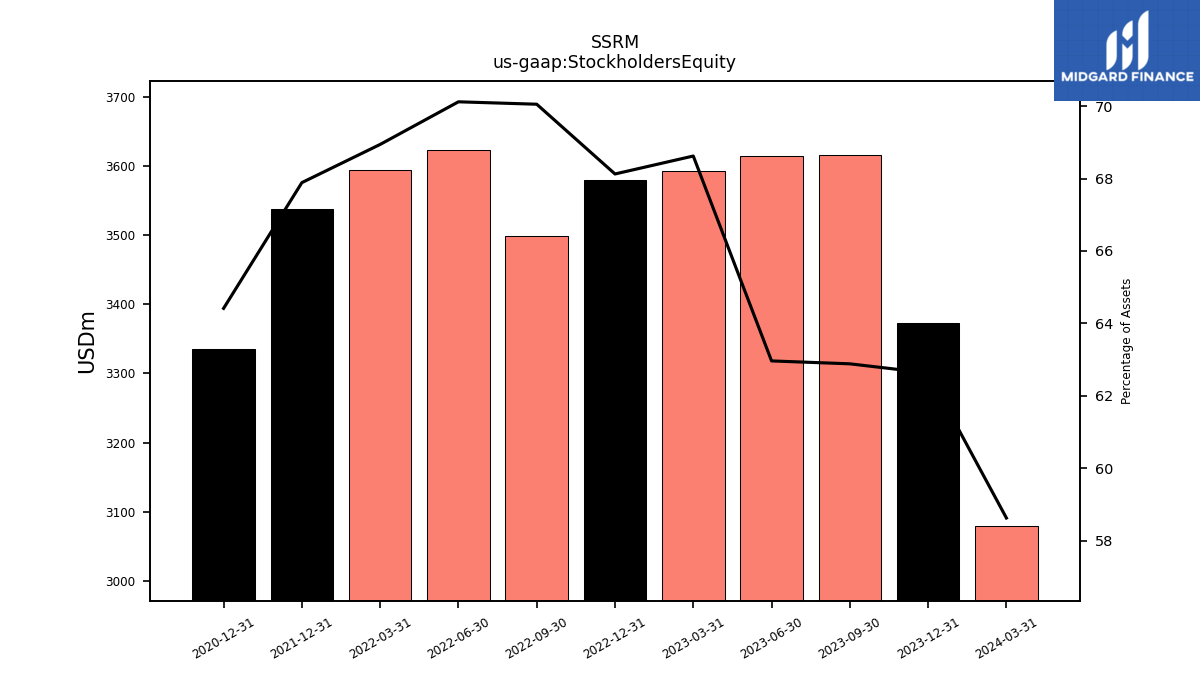
| Stockholders Equity | 3615.48 | 3613.69 | 3592.16 | 3579.74 | 3499.25 | 3623.67 | 3593.66 | 3537.86 | NA | NA | NA |
| 2023-09-30 | 2023-06-30 | 2023-03-31 | 2022-12-31 | 2022-09-30 | 2022-06-30 | 2022-03-31 | 2021-12-31 | 2021-09-30 | 2021-06-30 | 2021-03-31 | ||
|---|---|---|---|---|---|---|---|---|---|---|---|---|
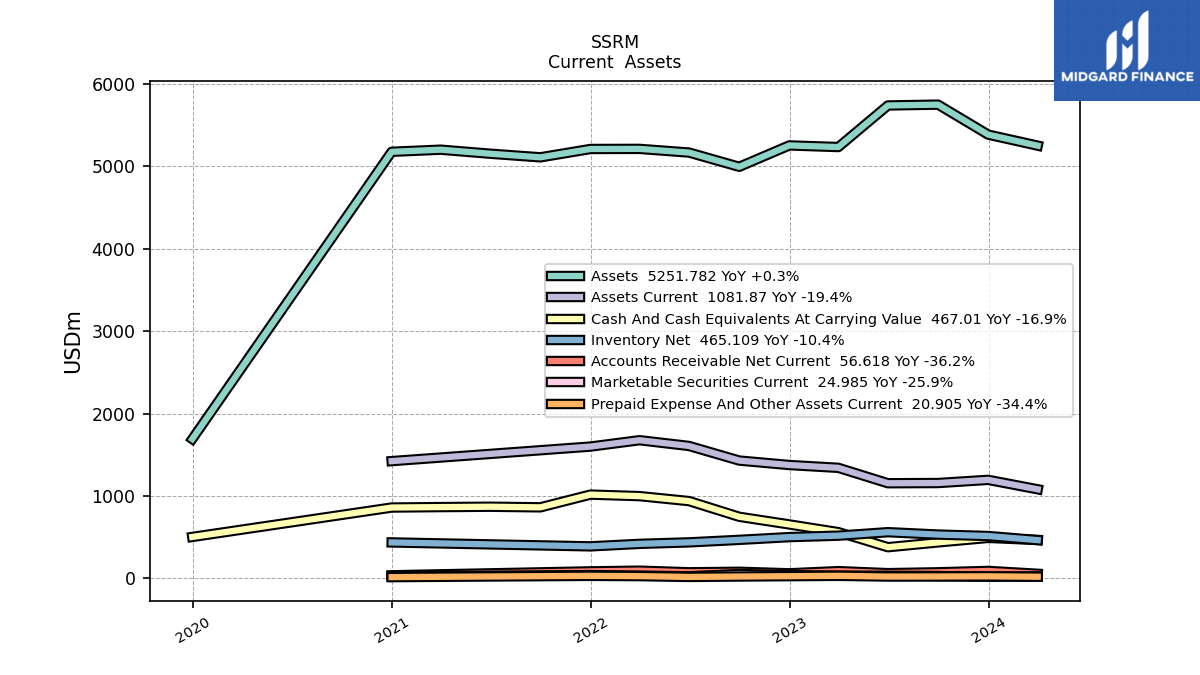
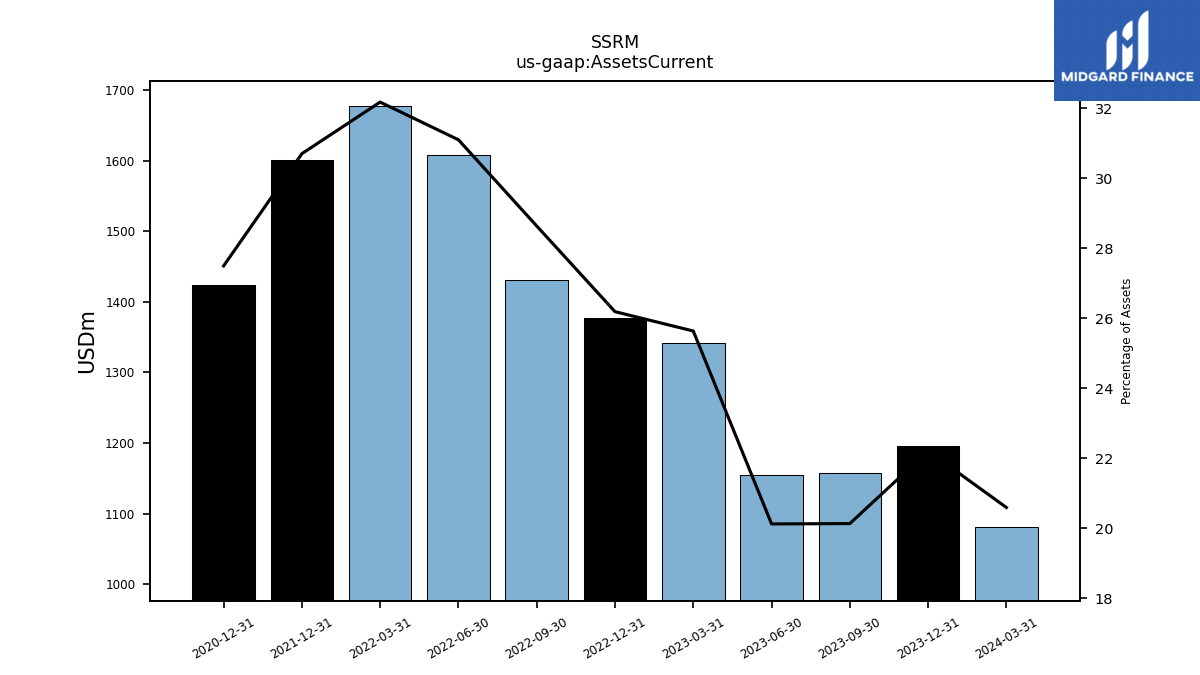
| Assets Current | 1157.98 | 1155.38 | 1342.31 | 1376.43 | 1430.74 | 1607.49 | 1677.54 | 1600.31 | NA | NA | NA | |
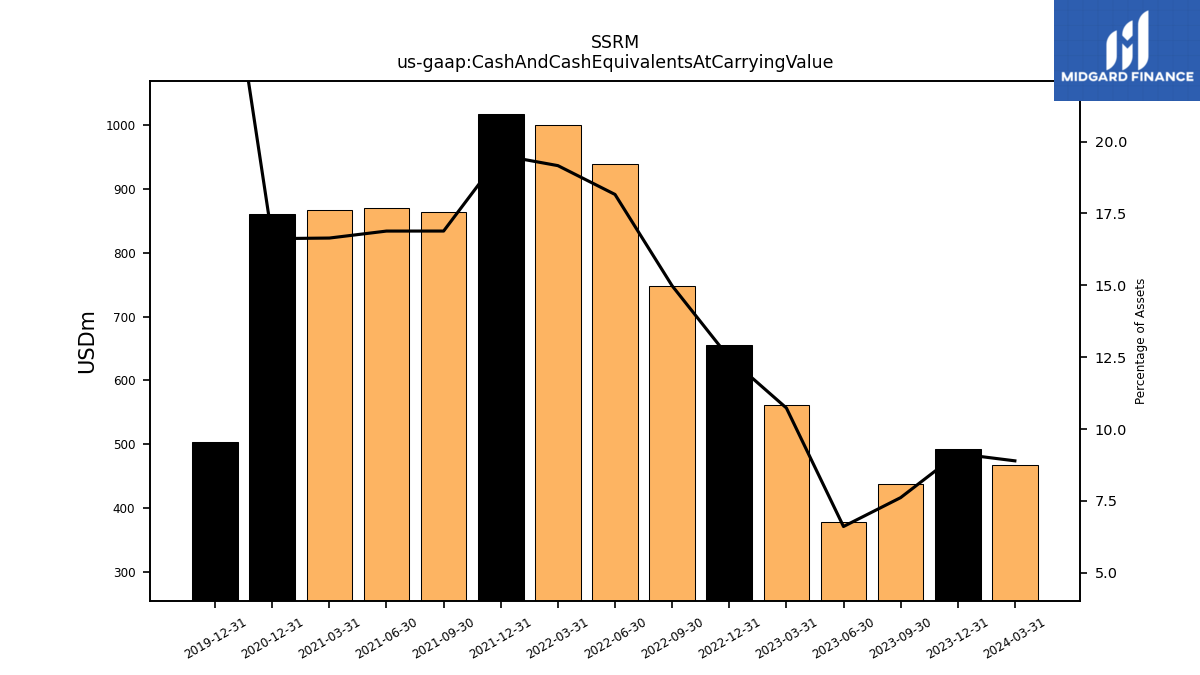
| Cash And Cash Equivalents At Carrying Value | 437.68 | 379.24 | 561.78 | 655.45 | 748.48 | 938.60 | 998.99 | 1017.56 | 863.02 | 870.35 | 866.01 | |
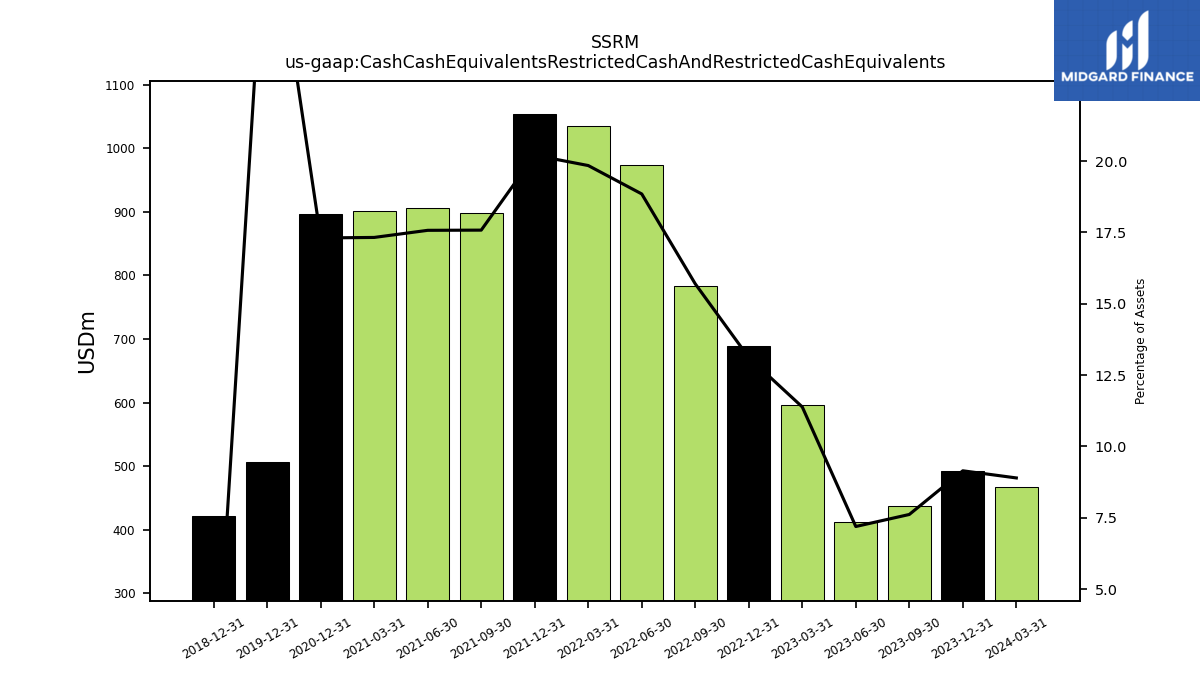
| Cash Cash Equivalents Restricted Cash And Restricted Cash Equivalents | 437.77 | 412.80 | 595.81 | 689.11 | 784.04 | 973.99 | 1034.30 | 1052.87 | 898.31 | 905.64 | 901.30 | |
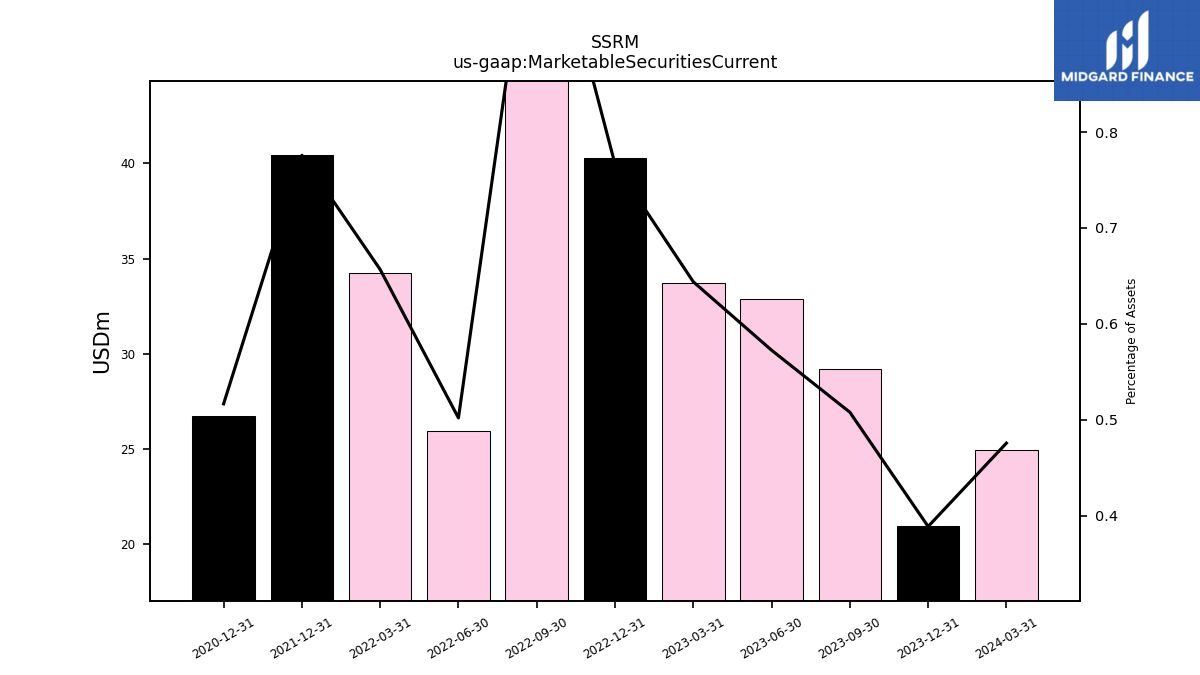
| Marketable Securities Current | 29.21 | 32.87 | 33.71 | 40.28 | 53.83 | 25.95 | 34.23 | 40.43 | NA | NA | NA | |
| Accounts Receivable Net Current | 74.91 | 64.40 | 88.69 | 62.56 | 81.04 | 74.83 | 94.53 | 86.12 | NA | NA | NA | |
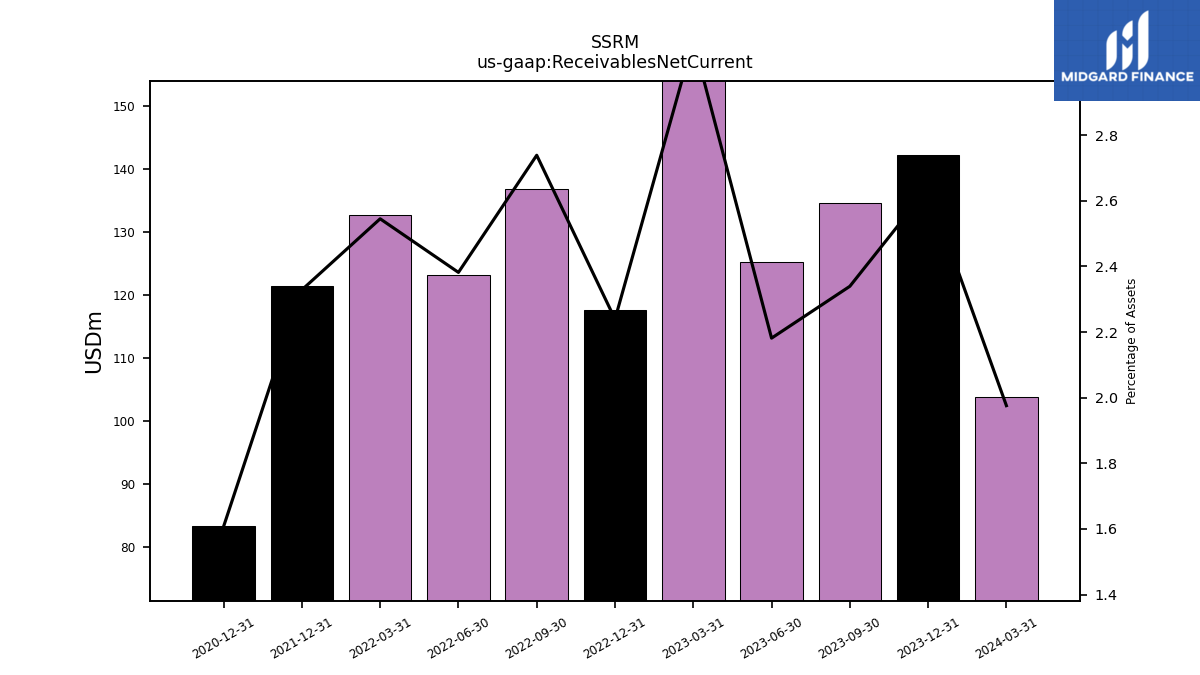
| Receivables Net Current | 134.52 | 125.21 | 161.75 | 117.67 | 136.82 | 123.10 | 132.68 | 121.36 | NA | NA | NA | |
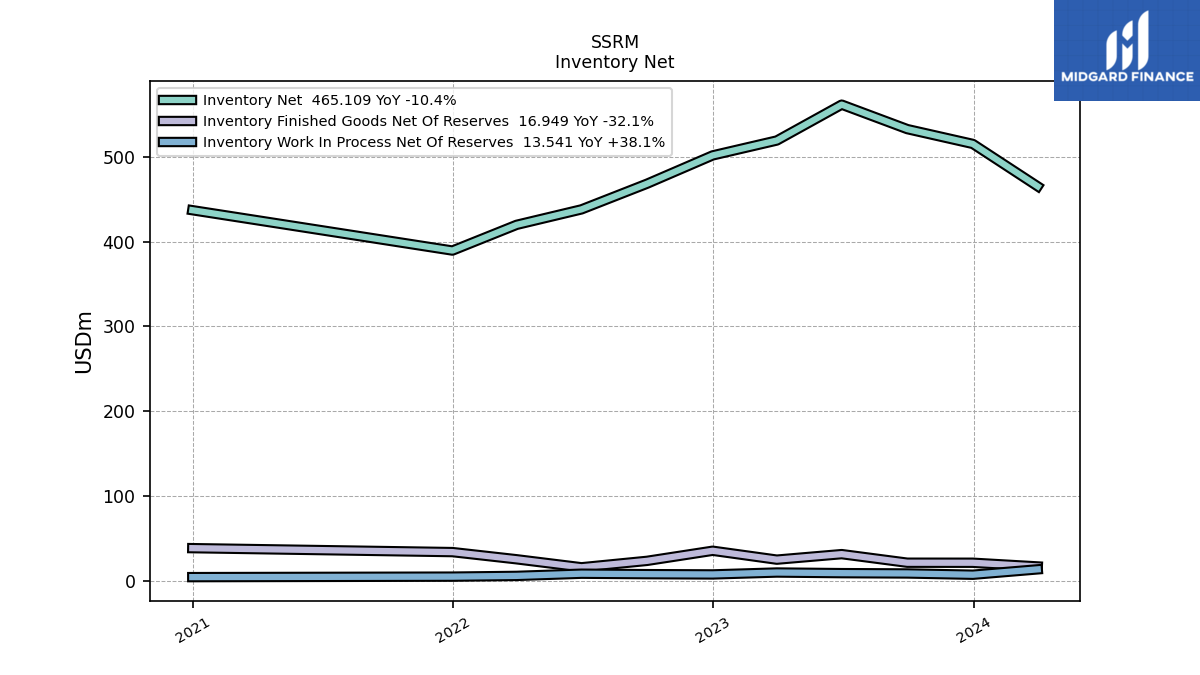
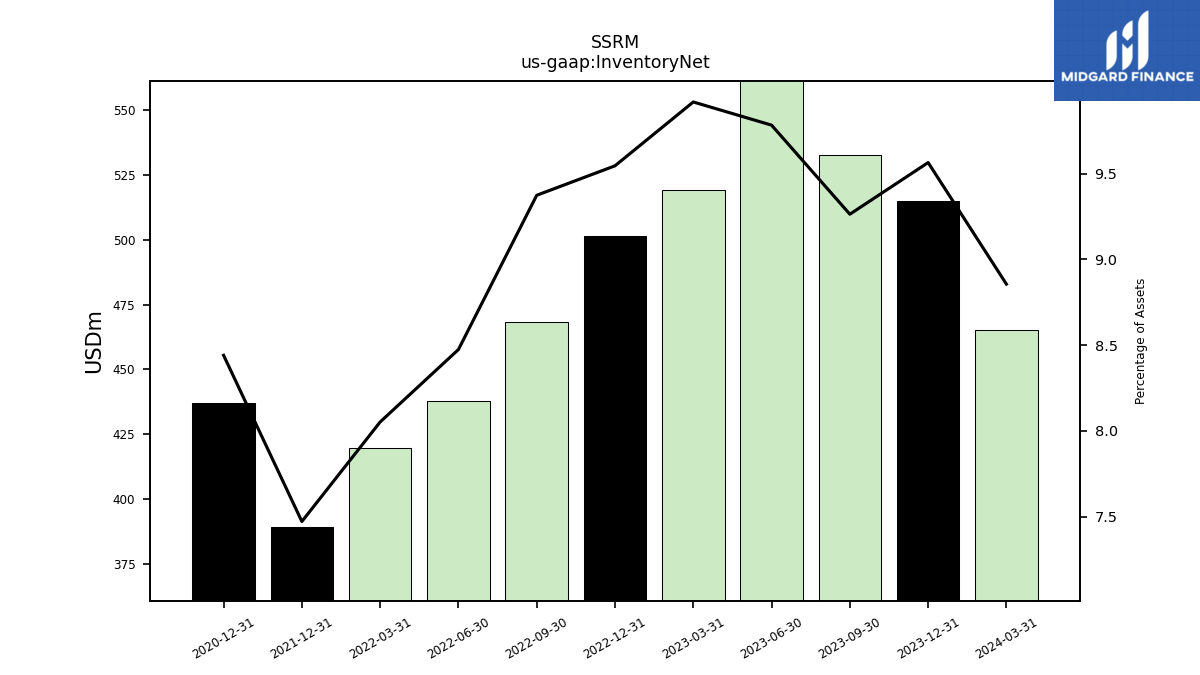
| Inventory Net | 532.63 | 561.50 | 519.19 | 501.61 | 468.26 | 437.98 | 419.75 | 389.42 | NA | NA | NA | |
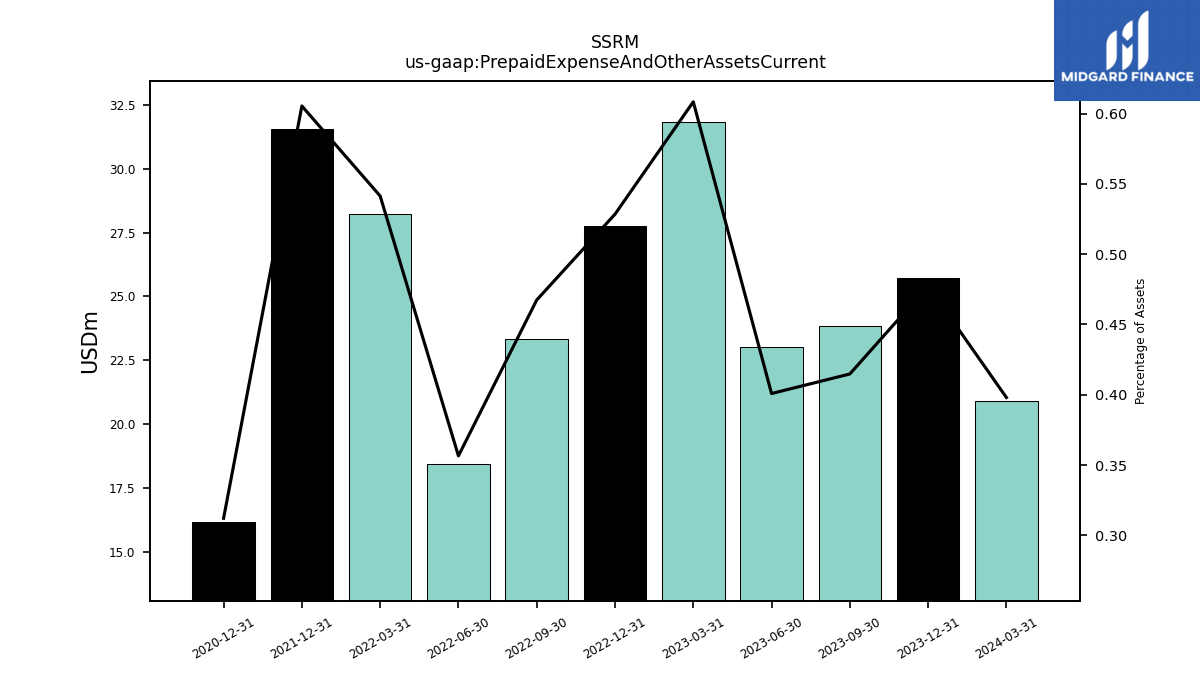
| Prepaid Expense And Other Assets Current | 23.85 | 23.01 | 31.84 | 27.77 | 23.35 | 18.43 | 28.22 | 31.55 | NA | NA | NA |
| 2023-09-30 | 2023-06-30 | 2023-03-31 | 2022-12-31 | 2022-09-30 | 2022-06-30 | 2022-03-31 | 2021-12-31 | 2021-09-30 | 2021-06-30 | 2021-03-31 | ||
|---|---|---|---|---|---|---|---|---|---|---|---|---|
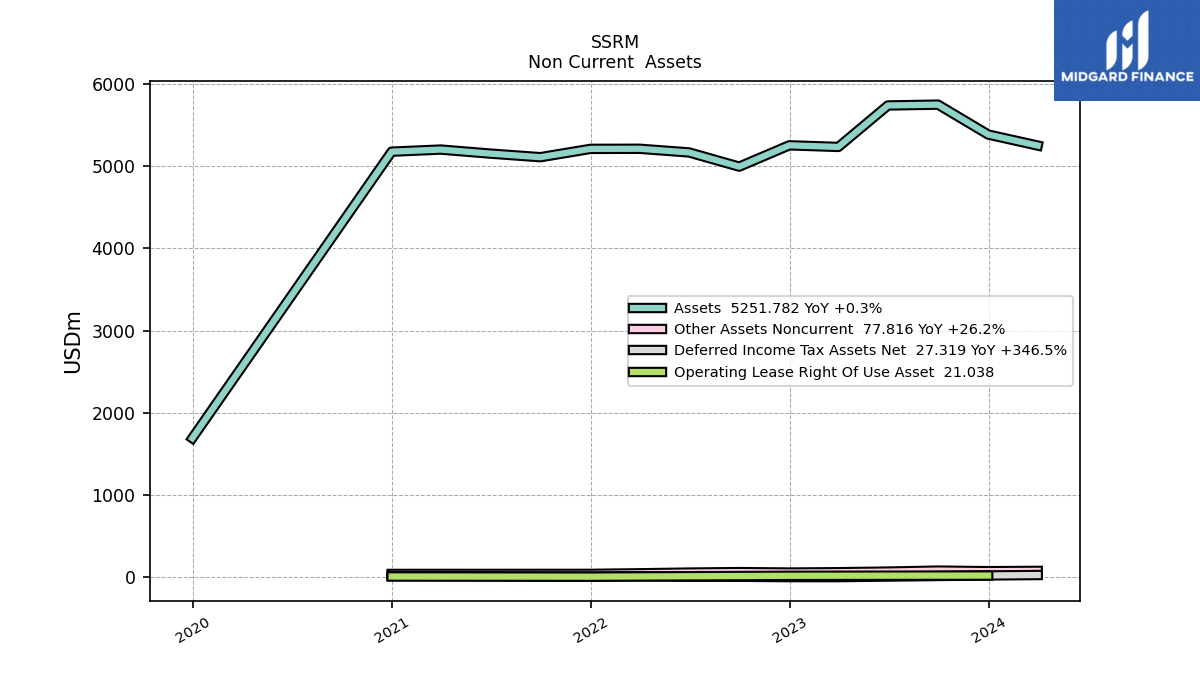
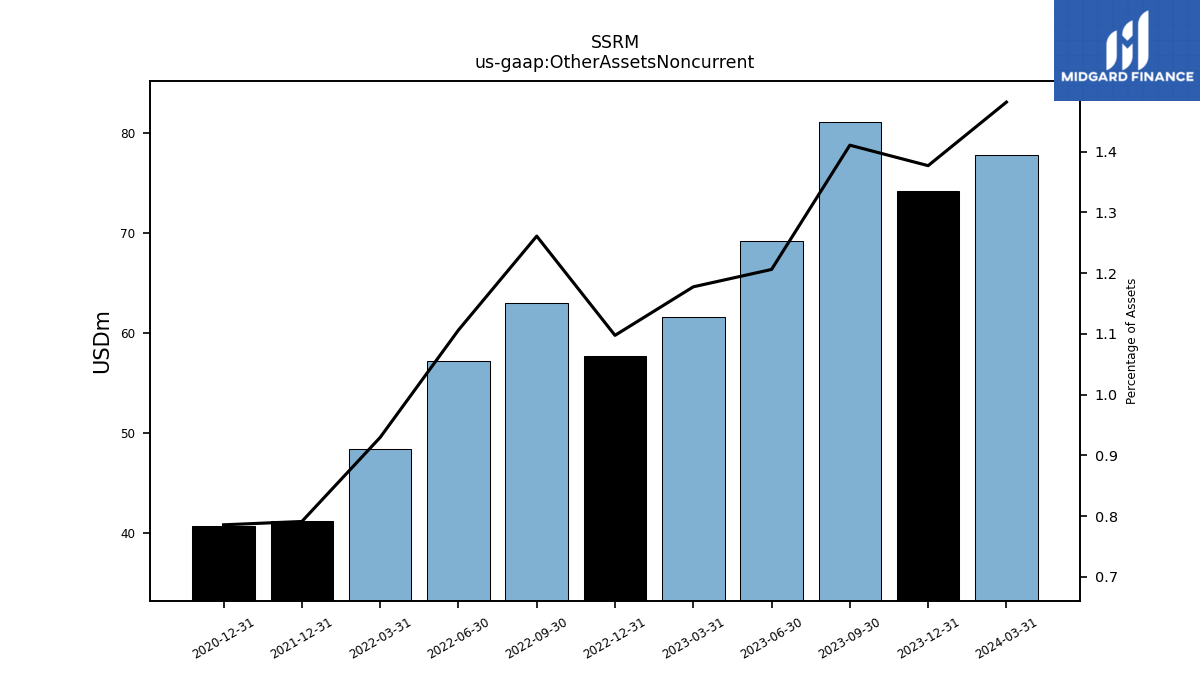
| Other Assets Noncurrent | 81.12 | 69.23 | 61.65 | 57.68 | 63.00 | 57.18 | 48.46 | 41.23 | NA | NA | NA |
| 2023-09-30 | 2023-06-30 | 2023-03-31 | 2022-12-31 | 2022-09-30 | 2022-06-30 | 2022-03-31 | 2021-12-31 | 2021-09-30 | 2021-06-30 | 2021-03-31 | ||
|---|---|---|---|---|---|---|---|---|---|---|---|---|
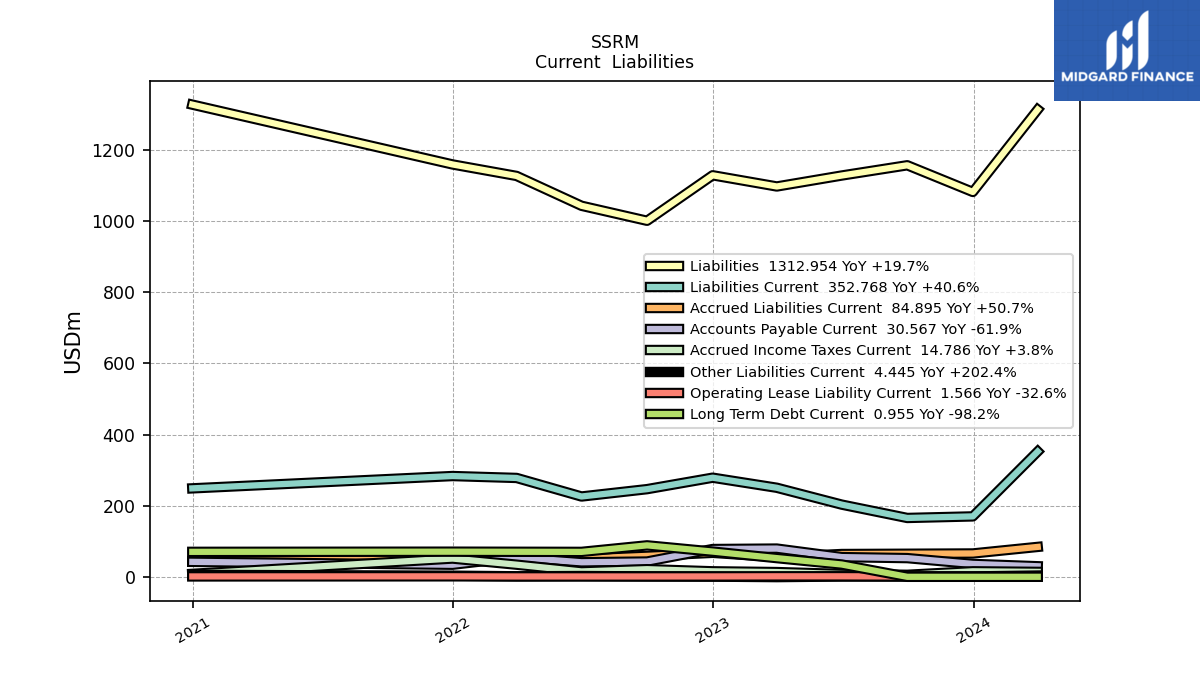
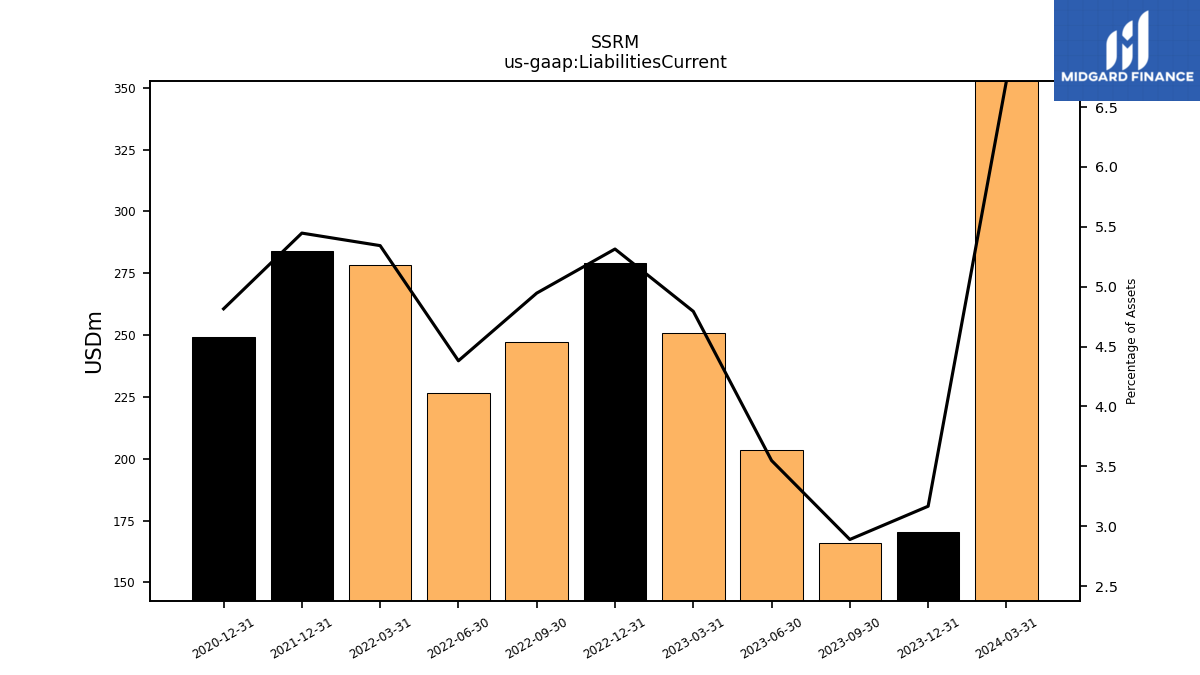
| Liabilities Current | 166.15 | 203.68 | 250.96 | 279.25 | 247.08 | 226.43 | 278.50 | 283.88 | NA | NA | NA | |
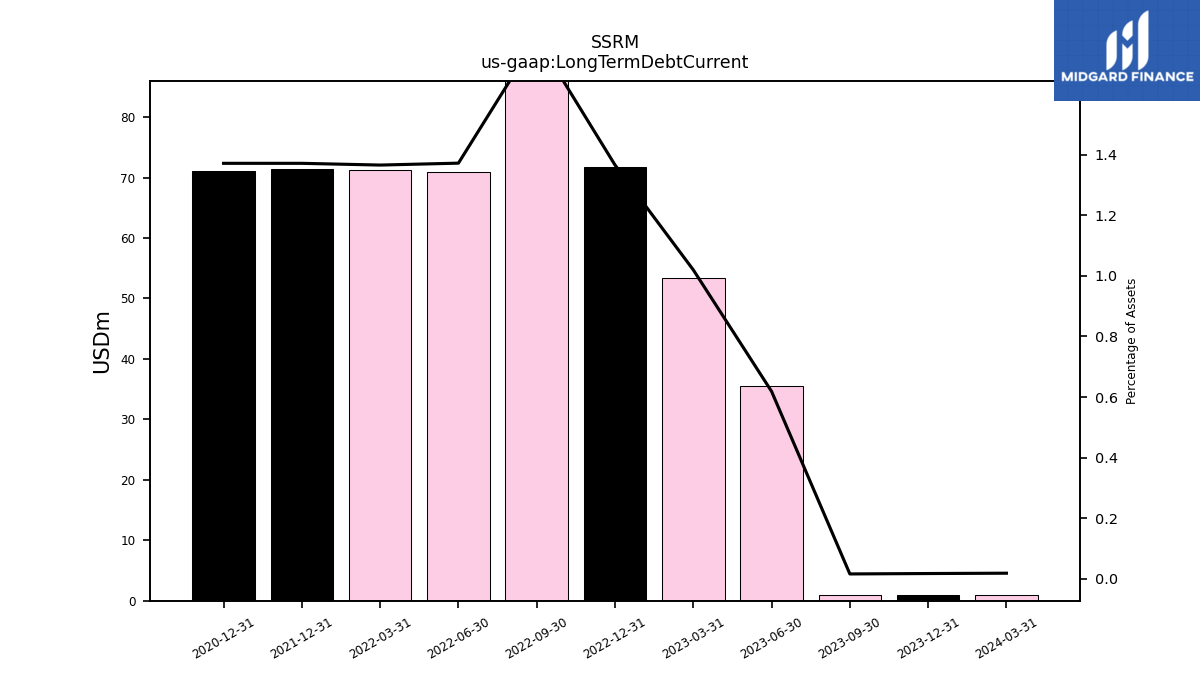
| Long Term Debt Current | 0.91 | 35.51 | 53.39 | 71.80 | 89.25 | 70.92 | 71.21 | 71.49 | NA | NA | NA | |
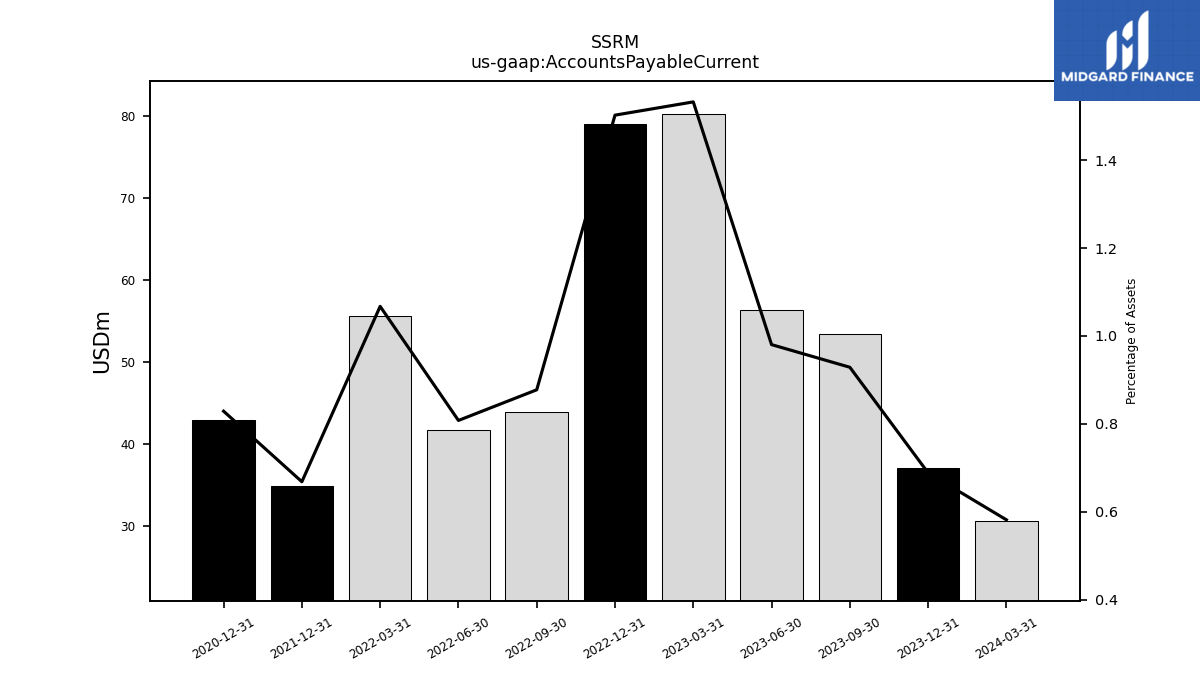
| Accounts Payable Current | 53.41 | 56.27 | 80.21 | 78.93 | 43.84 | 41.76 | 55.63 | 34.84 | NA | NA | NA | |
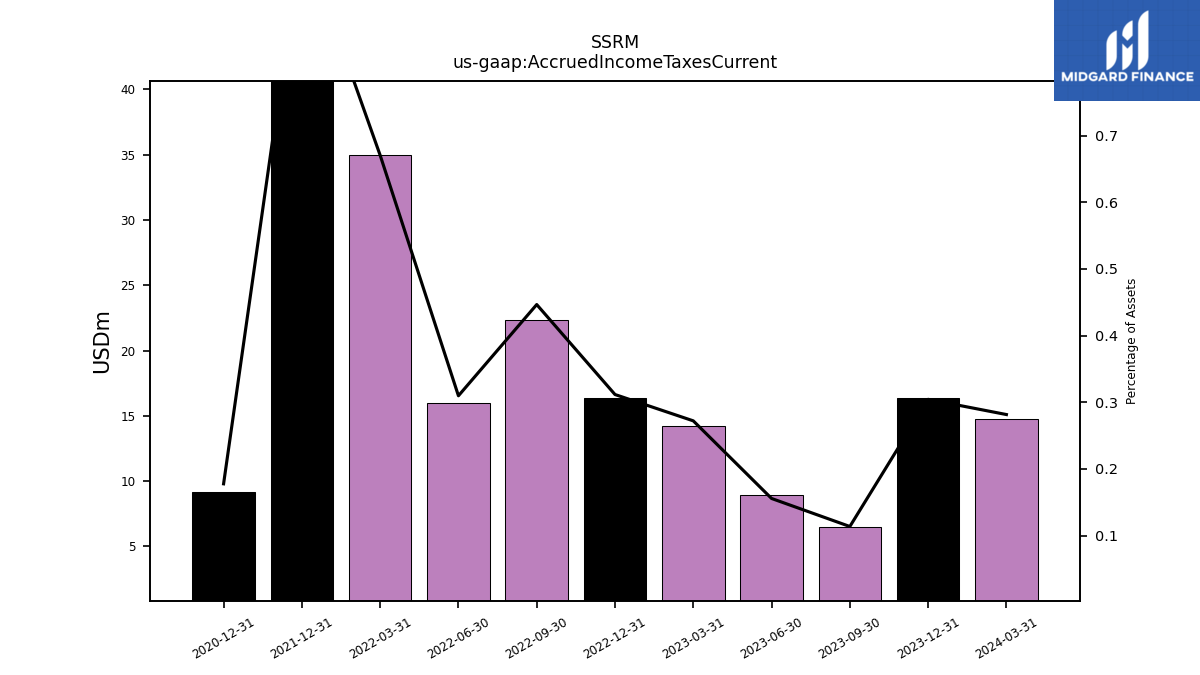
| Accrued Income Taxes Current | 6.53 | 8.93 | 14.24 | 16.37 | 22.31 | 16.01 | 34.96 | 52.21 | NA | NA | NA | |
| Dividends Payable Current | NA | NA | NA | NA | NA | NA | 15.02 | NA | NA | NA | NA | |
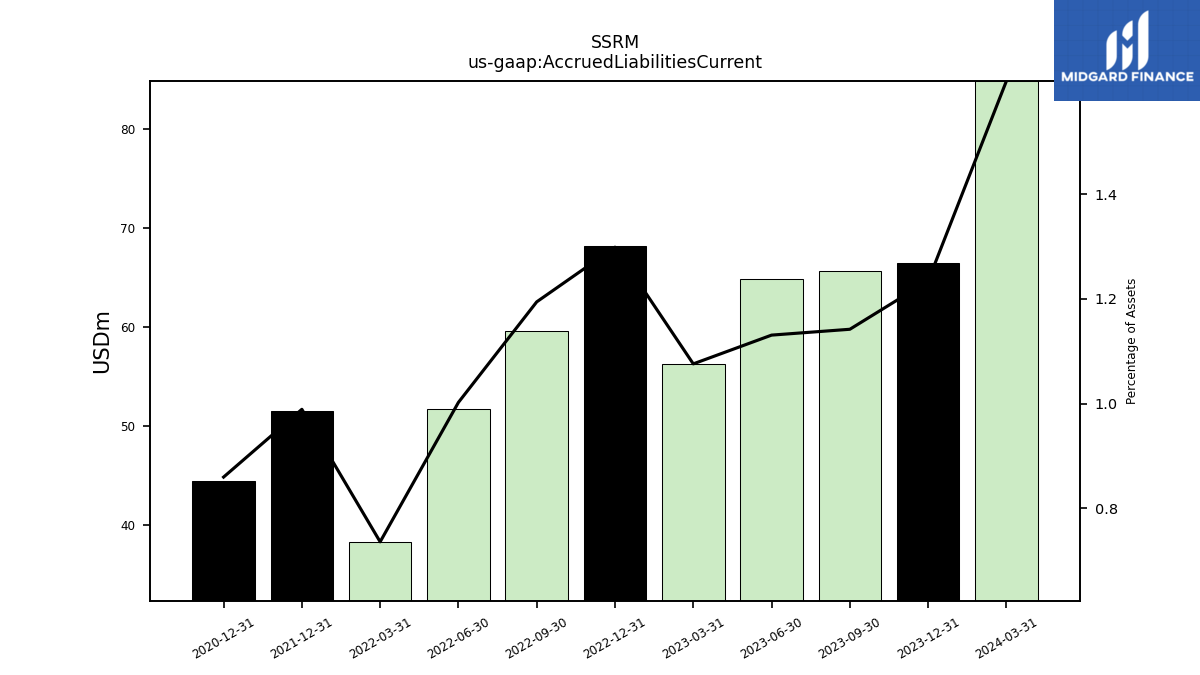
| Accrued Liabilities Current | 65.66 | 64.91 | 56.32 | 68.25 | 59.66 | 51.80 | 38.36 | 51.54 | NA | NA | NA | |
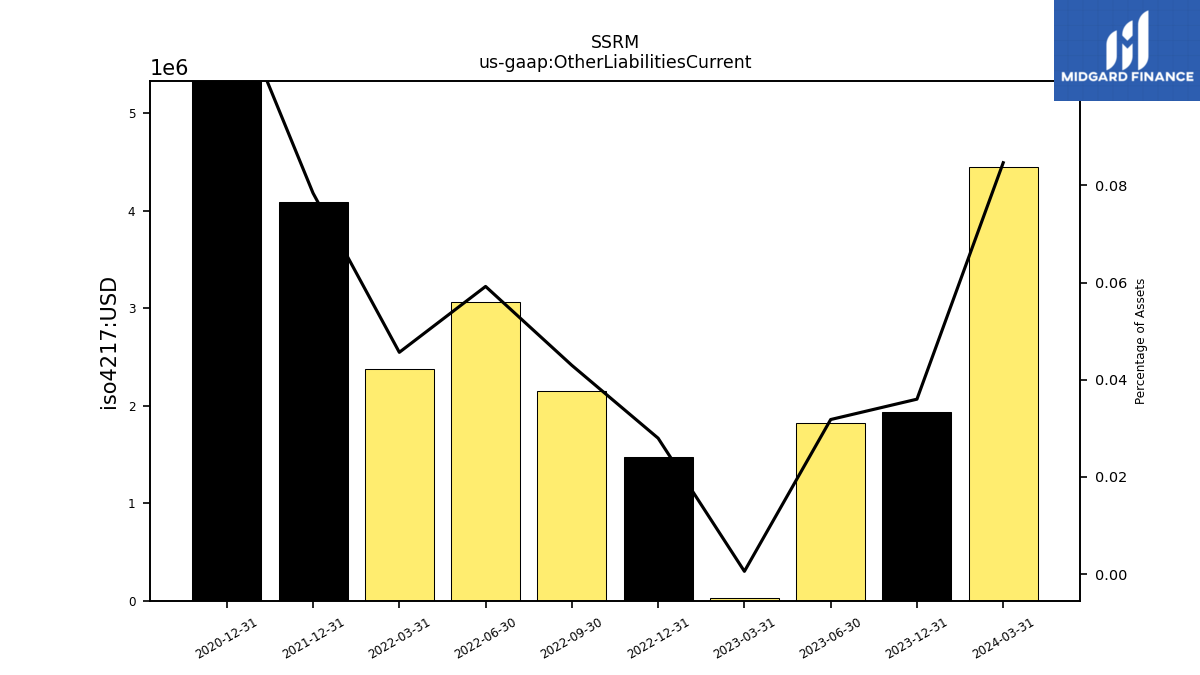
| Other Liabilities Current | NA | 1.83 | 0.03 | 1.47 | 2.15 | 3.06 | 2.38 | 4.08 | NA | NA | NA |
| 2023-09-30 | 2023-06-30 | 2023-03-31 | 2022-12-31 | 2022-09-30 | 2022-06-30 | 2022-03-31 | 2021-12-31 | 2021-09-30 | 2021-06-30 | 2021-03-31 | ||
|---|---|---|---|---|---|---|---|---|---|---|---|---|
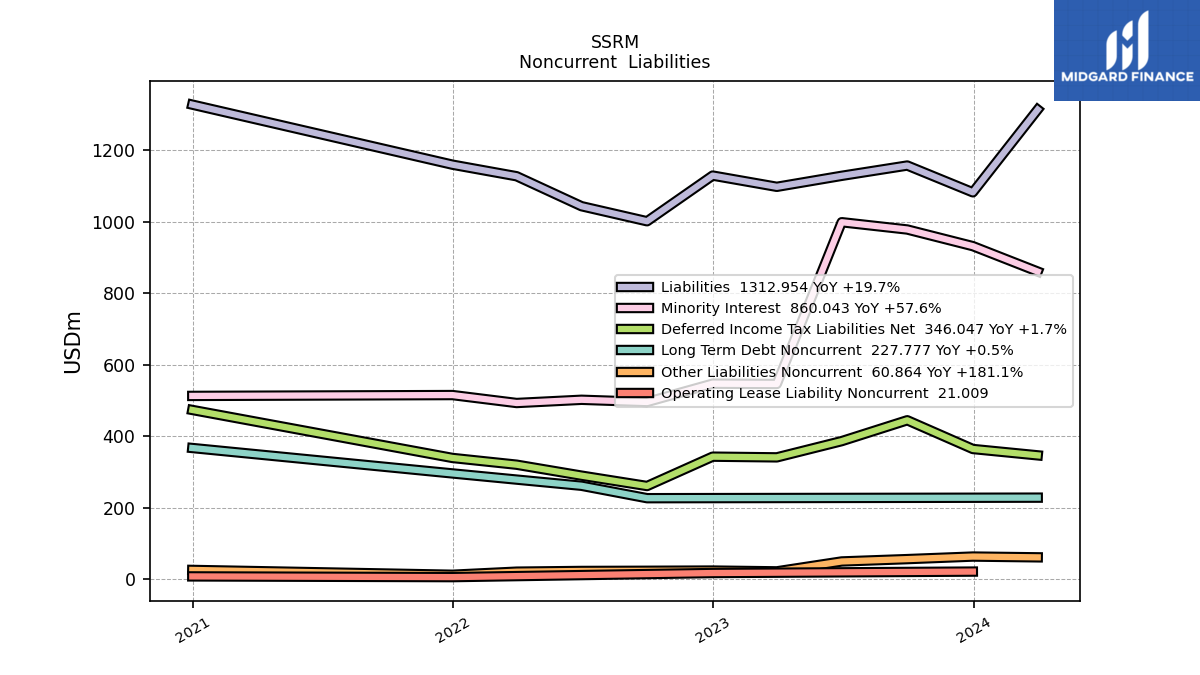
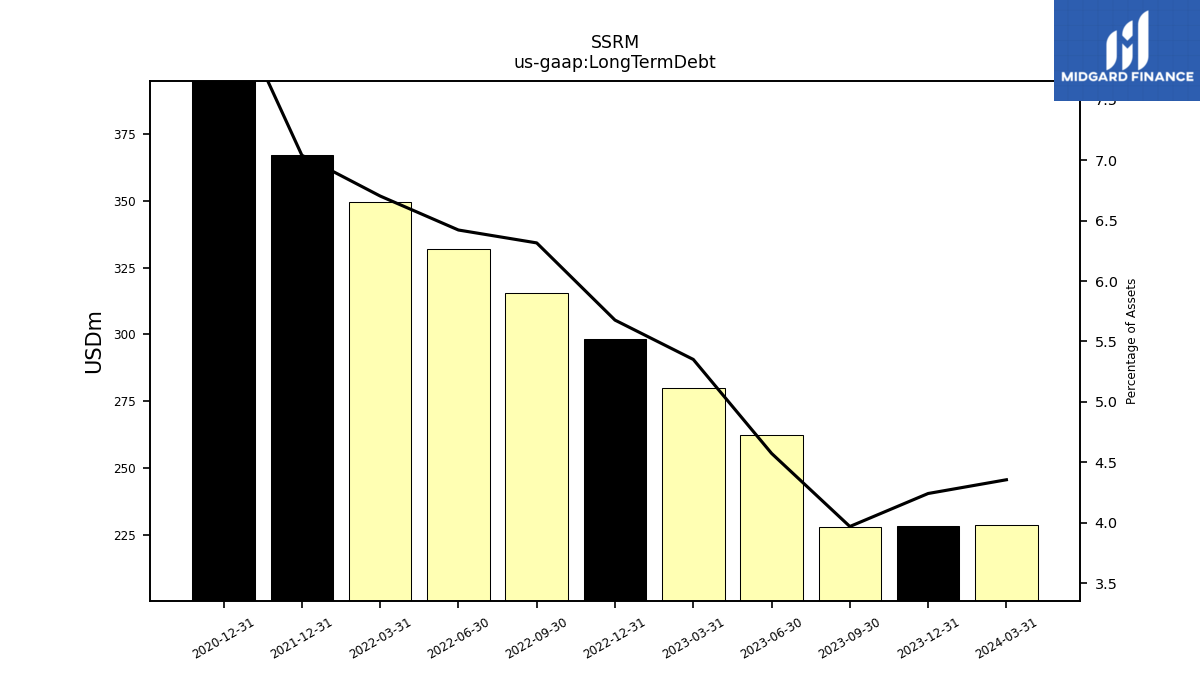
| Long Term Debt | 228.16 | 262.51 | 280.14 | 298.31 | 315.51 | 331.93 | 349.47 | 366.98 | NA | NA | NA | |
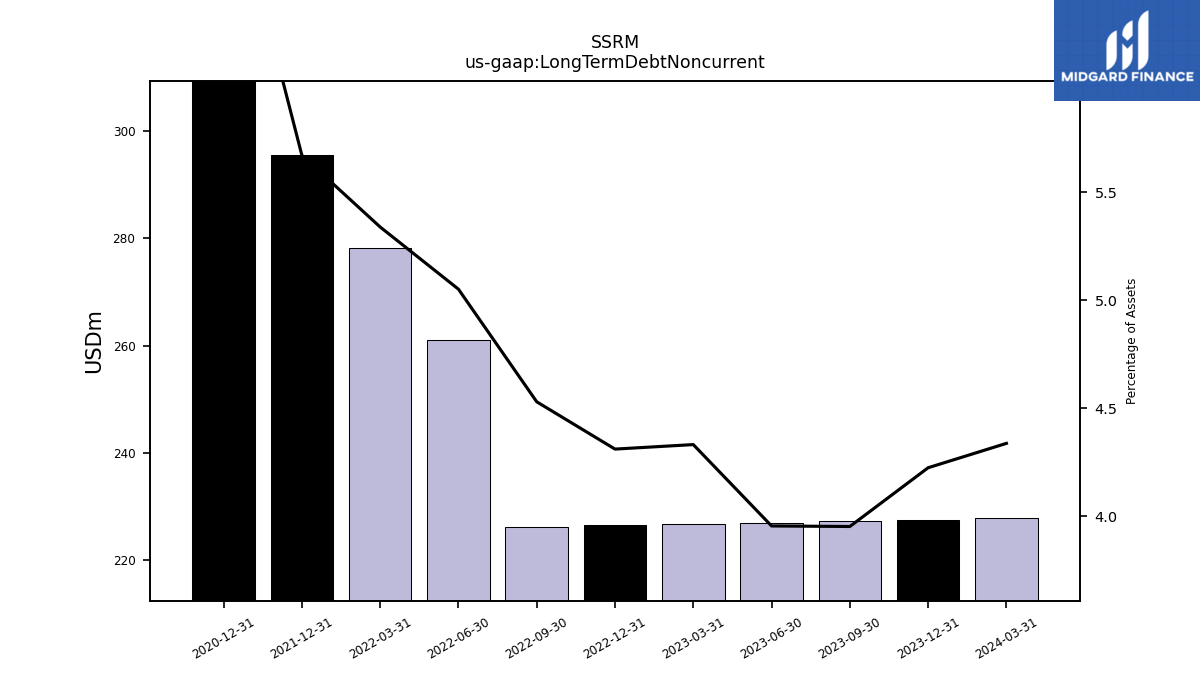
| Long Term Debt Noncurrent | 227.26 | 227.00 | 226.75 | 226.51 | 226.26 | 261.01 | 278.26 | 295.49 | NA | NA | NA | |
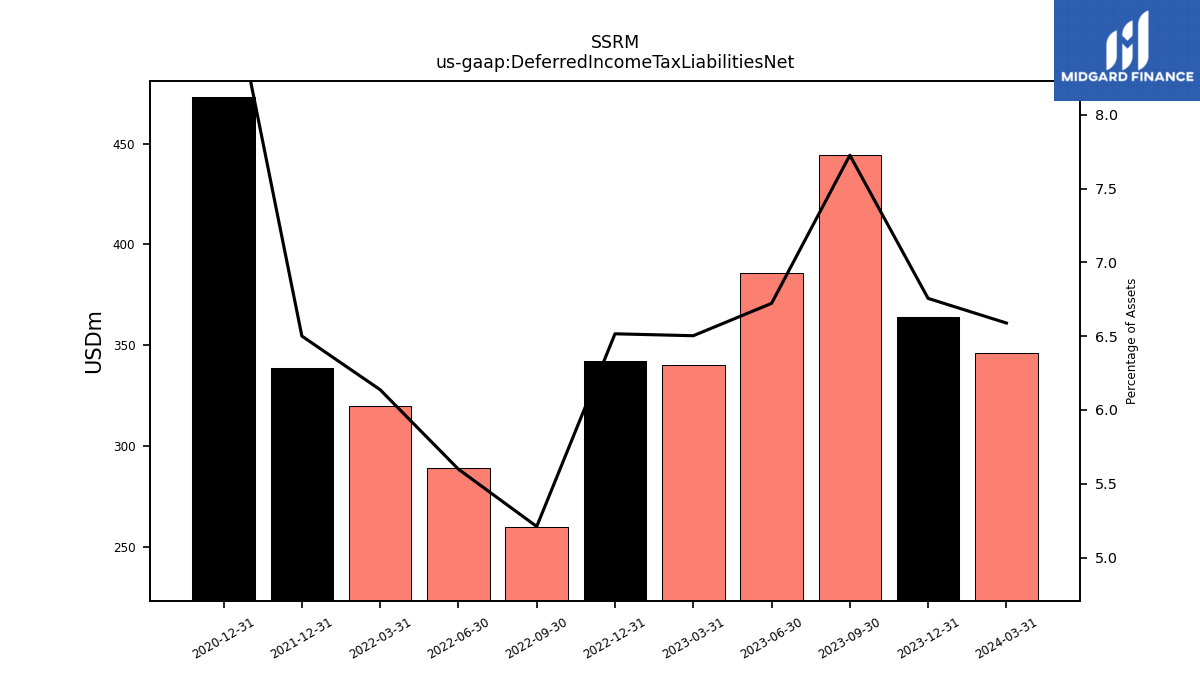
| Deferred Income Tax Liabilities Net | 444.19 | 385.83 | 340.42 | 342.40 | 260.30 | 289.35 | 319.92 | 338.79 | NA | NA | NA | |
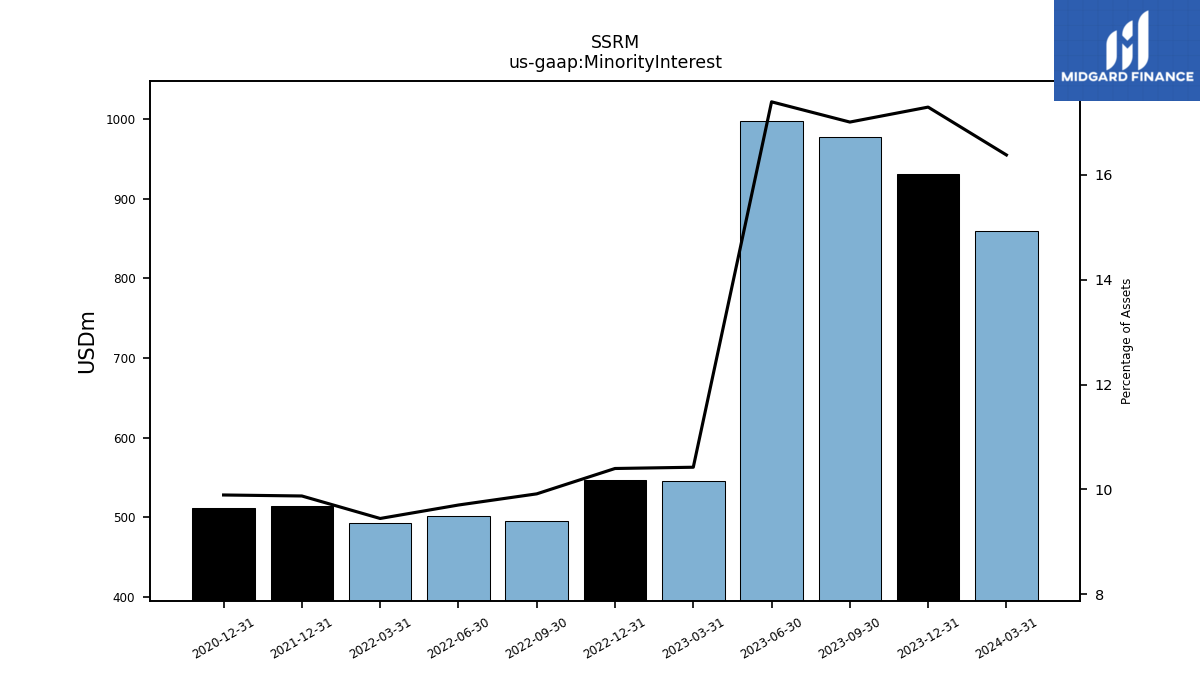
| Minority Interest | 977.64 | 998.04 | 545.65 | 546.46 | 495.33 | 501.46 | 492.43 | 514.66 | NA | NA | NA | |
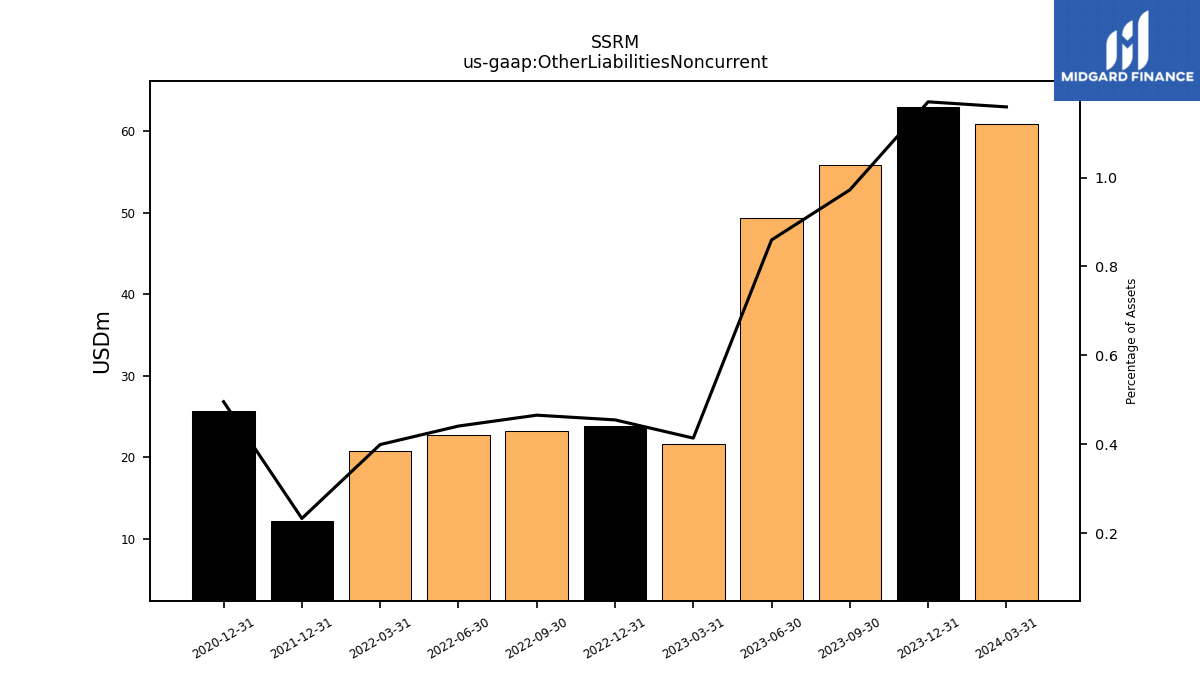
| Other Liabilities Noncurrent | 55.90 | 49.33 | 21.65 | 23.89 | 23.24 | 22.77 | 20.80 | 12.13 | NA | NA | NA | |
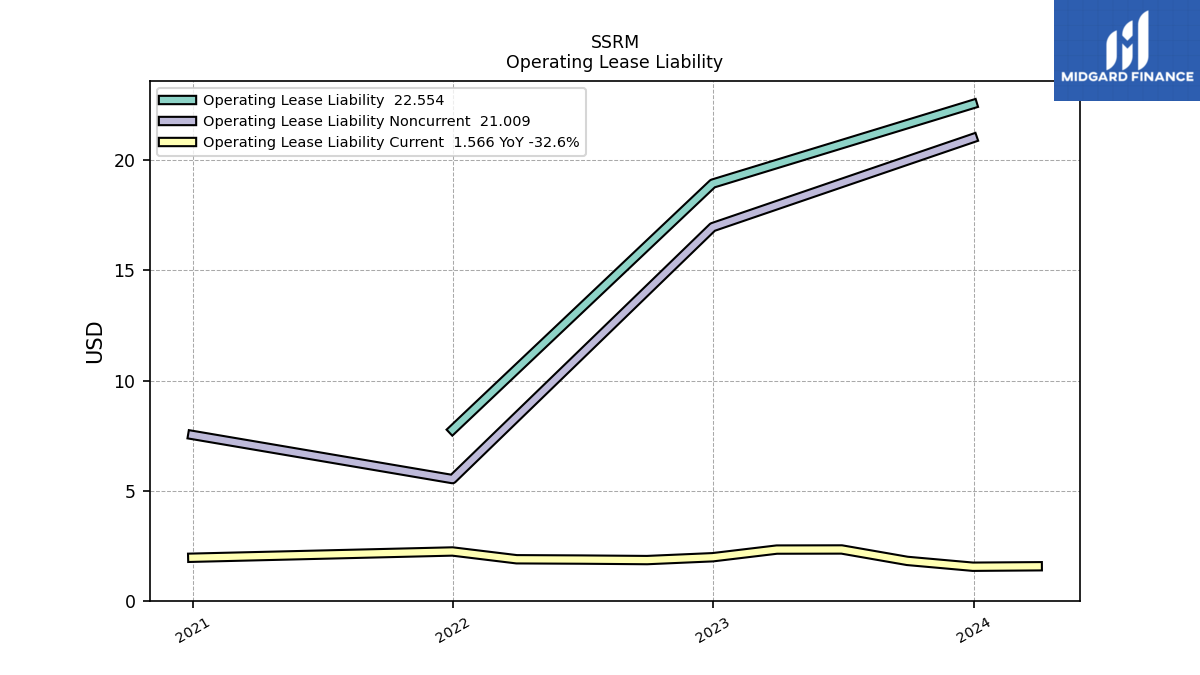
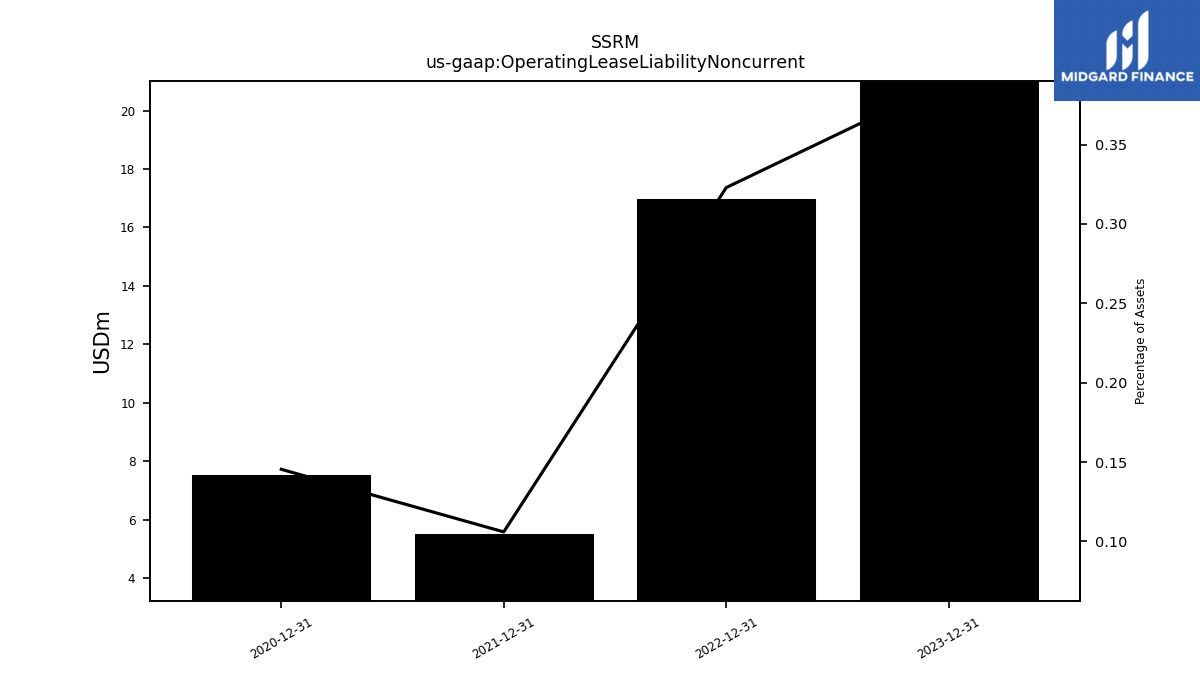
| Operating Lease Liability Noncurrent | NA | NA | NA | 16.97 | NA | NA | NA | 5.53 | NA | NA | NA |
| 2023-09-30 | 2023-06-30 | 2023-03-31 | 2022-12-31 | 2022-09-30 | 2022-06-30 | 2022-03-31 | 2021-12-31 | 2021-09-30 | 2021-06-30 | 2021-03-31 | ||
|---|---|---|---|---|---|---|---|---|---|---|---|---|
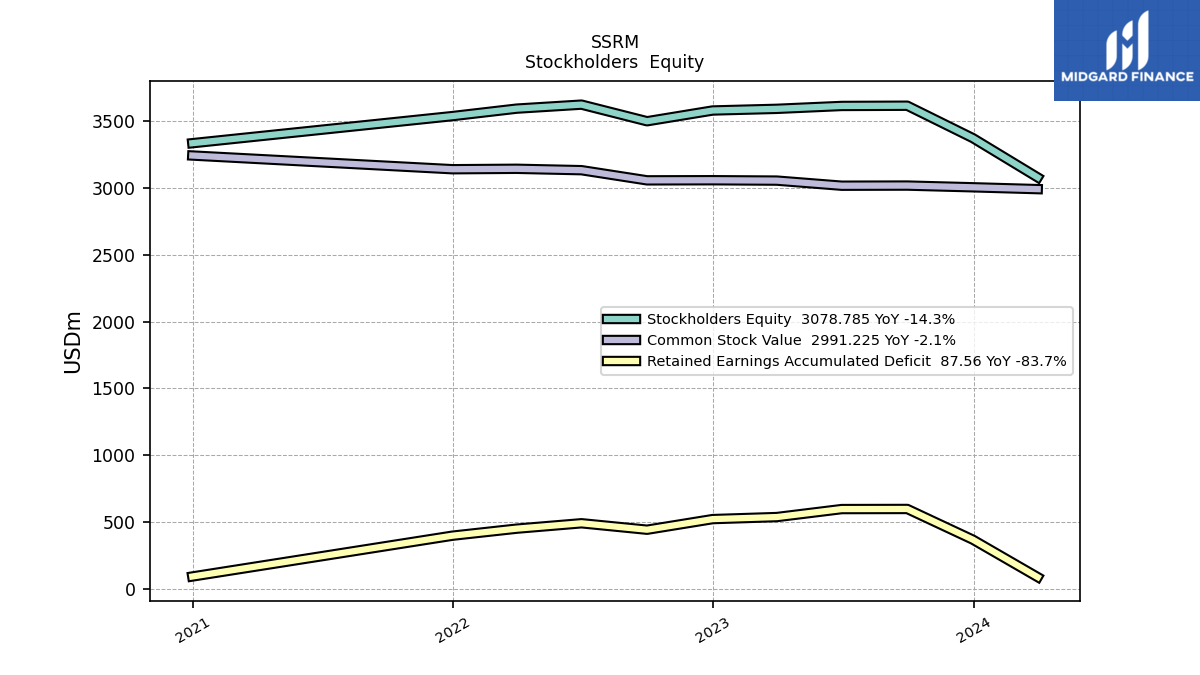
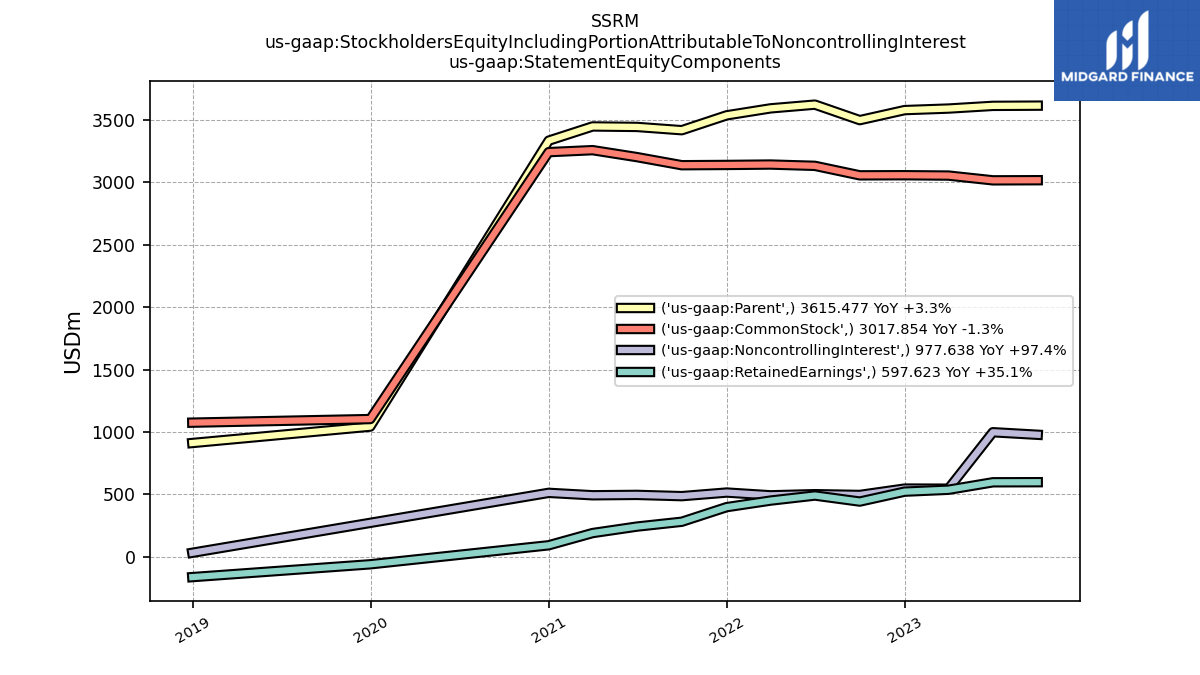
| Stockholders Equity | 3615.48 | 3613.69 | 3592.16 | 3579.74 | 3499.25 | 3623.67 | 3593.66 | 3537.86 | NA | NA | NA | |
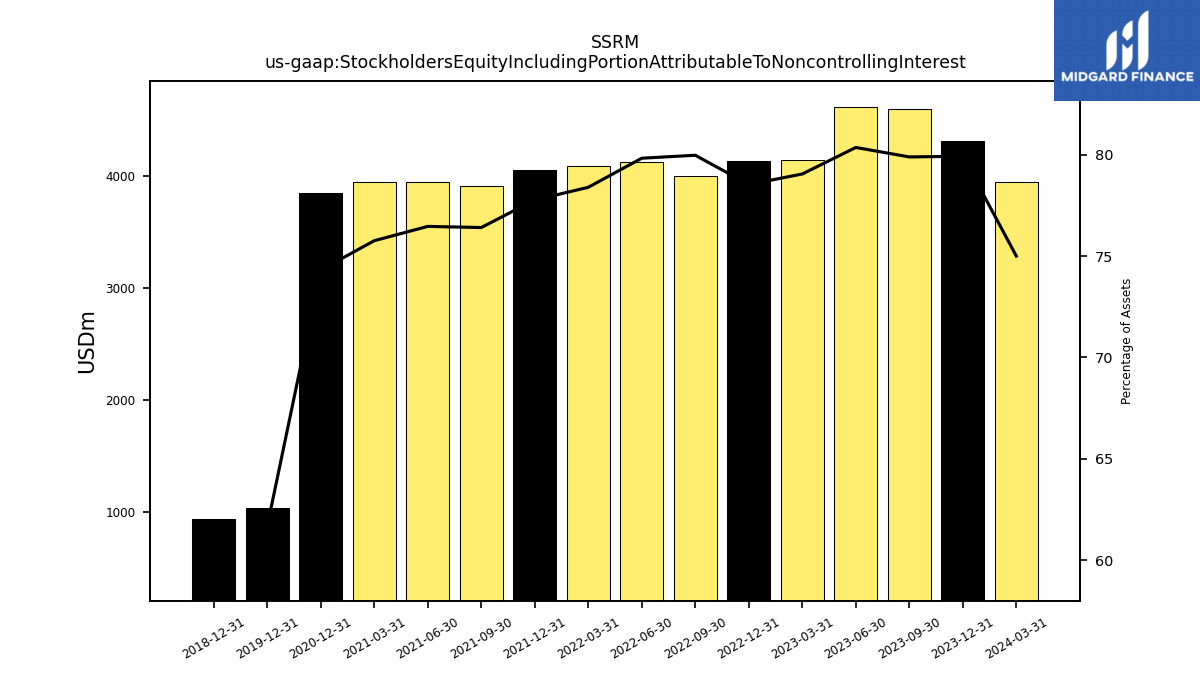
| Stockholders Equity Including Portion Attributable To Noncontrolling Interest | 4593.11 | 4611.73 | 4137.81 | 4126.20 | 3994.58 | 4125.13 | 4086.09 | 4052.52 | 3904.39 | 3940.73 | 3941.52 | |
| Common Stock Value | 3017.85 | 3016.84 | 3055.06 | 3057.92 | 3056.92 | 3133.01 | 3143.45 | 3140.19 | NA | NA | NA | |
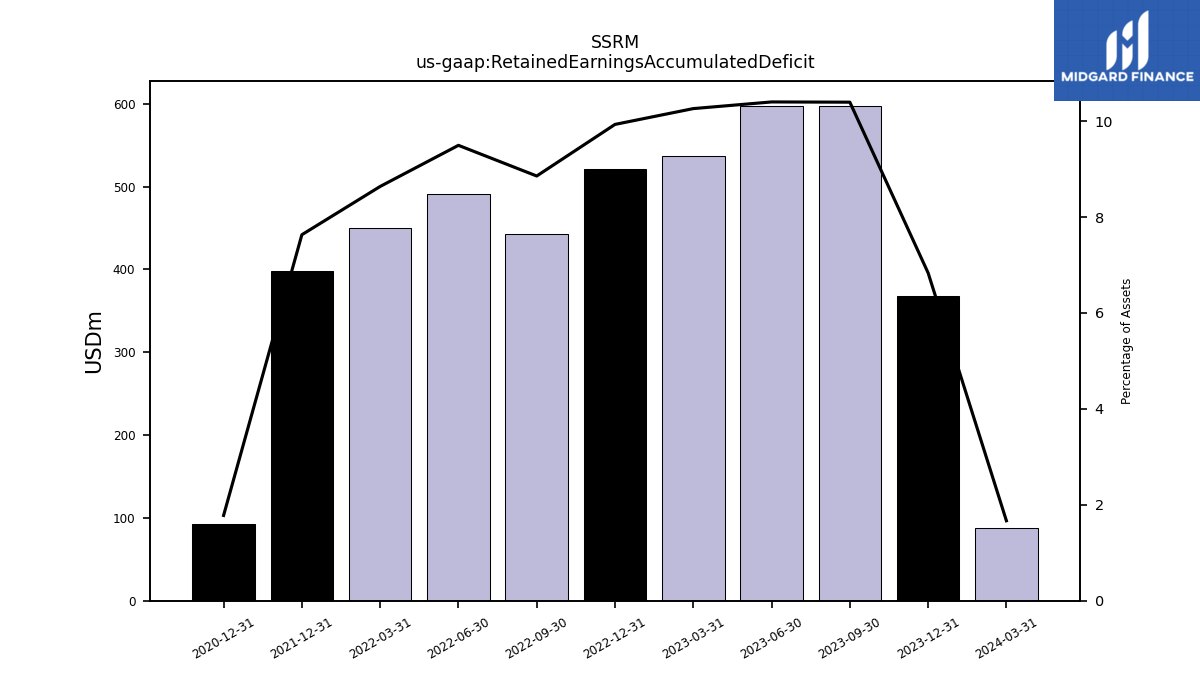
| Retained Earnings Accumulated Deficit | 597.62 | 596.84 | 537.10 | 521.82 | 442.32 | 490.66 | 450.21 | 397.67 | NA | NA | NA | |
| Minority Interest | 977.64 | 998.04 | 545.65 | 546.46 | 495.33 | 501.46 | 492.43 | 514.66 | NA | NA | NA | |
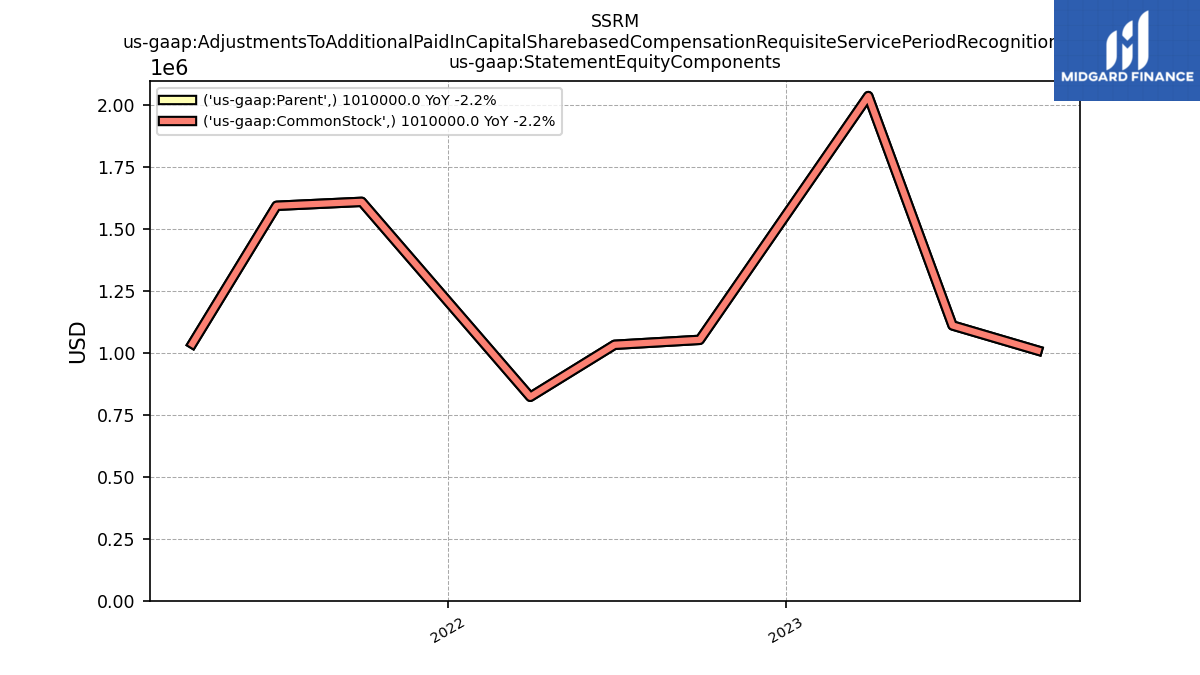
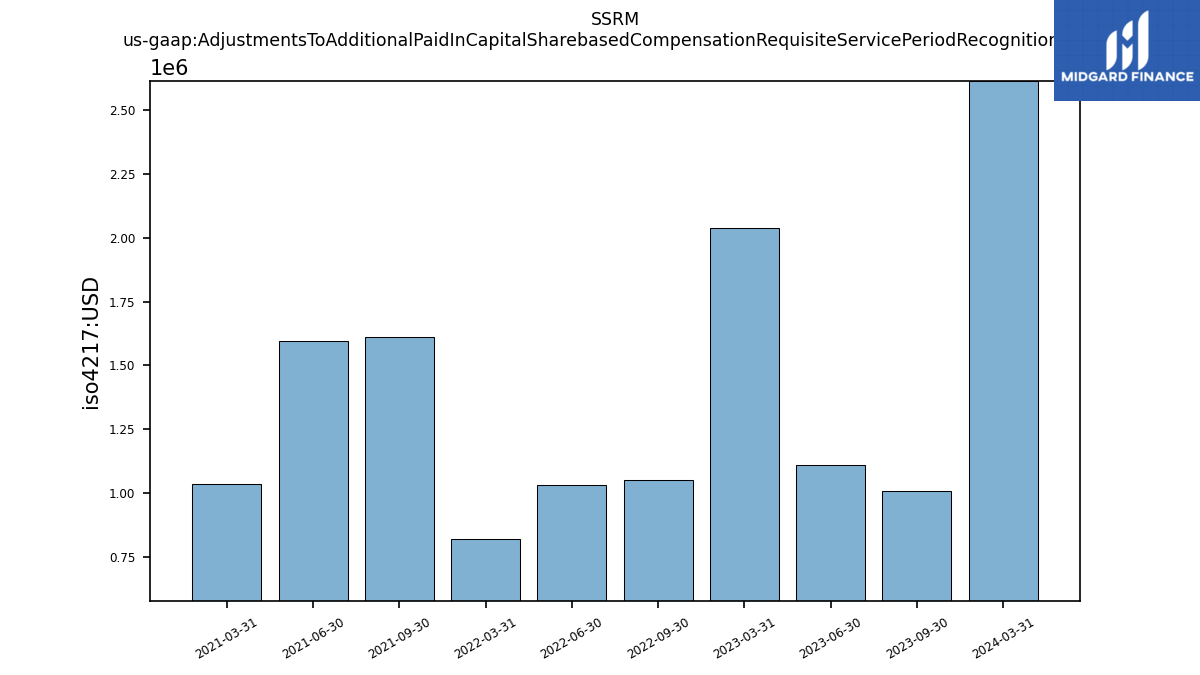
| Adjustments To Additional Paid In Capital Sharebased Compensation Requisite Service Period Recognition Value | 1.01 | 1.11 | 2.04 | NA | 1.05 | 1.03 | 0.82 | NA | 1.61 | 1.59 | 1.04 | |
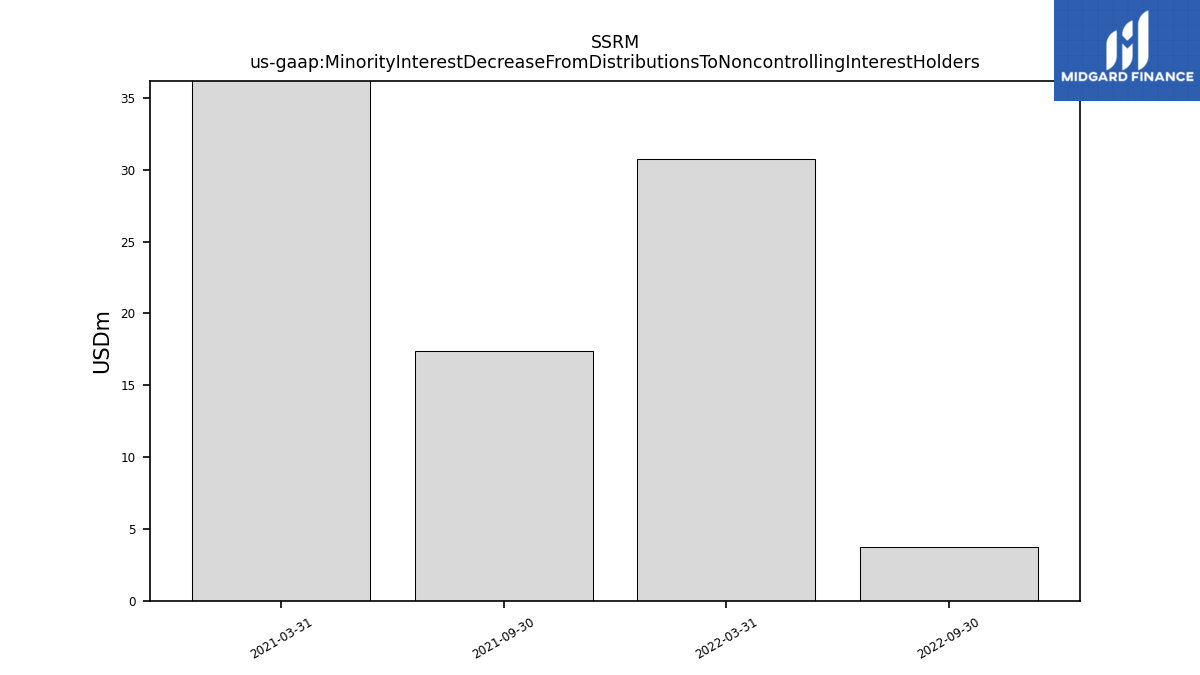
| Minority Interest Decrease From Distributions To Noncontrolling Interest Holders | NA | NA | NA | NA | 3.75 | NA | 30.77 | NA | 17.38 | NA | 38.08 |
| 2023-09-30 | 2023-06-30 | 2023-03-31 | 2022-12-31 | 2022-09-30 | 2022-06-30 | 2022-03-31 | 2021-12-31 | 2021-09-30 | 2021-06-30 | 2021-03-31 | ||
|---|---|---|---|---|---|---|---|---|---|---|---|---|
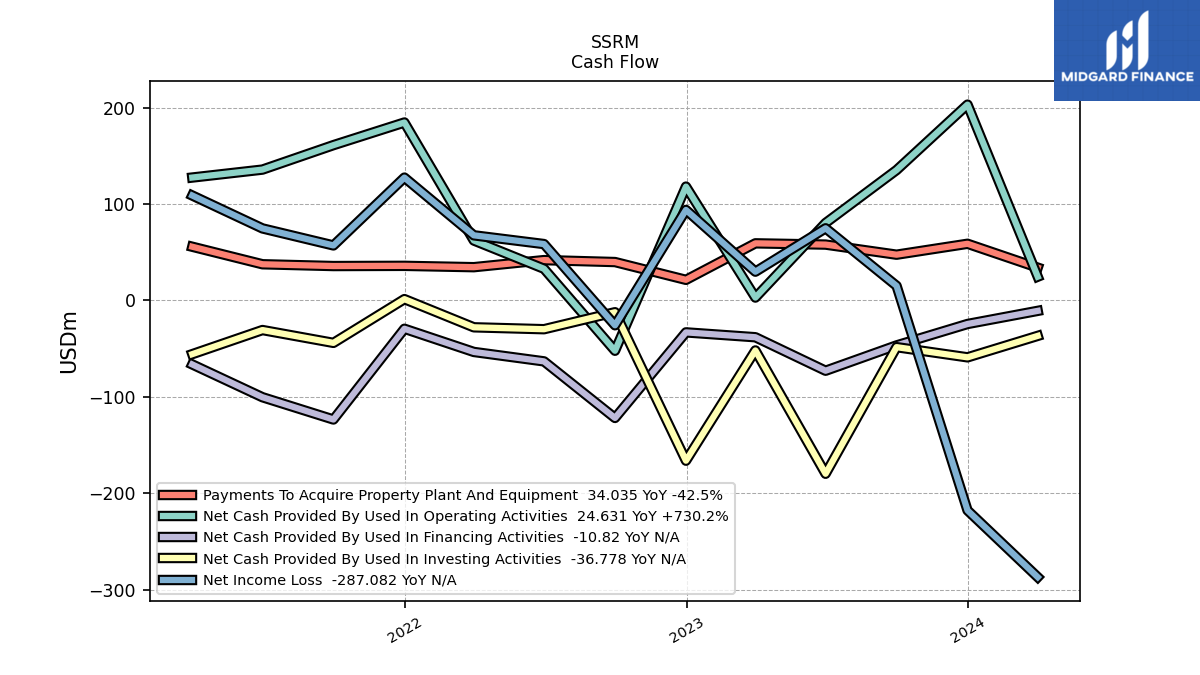
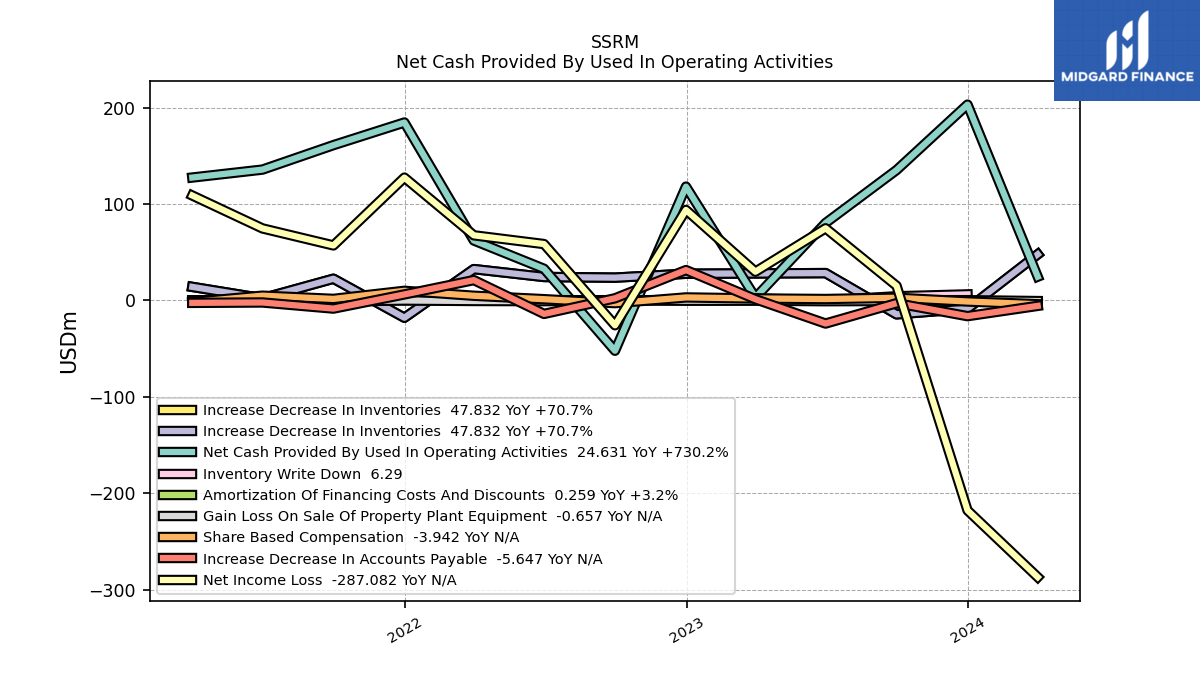
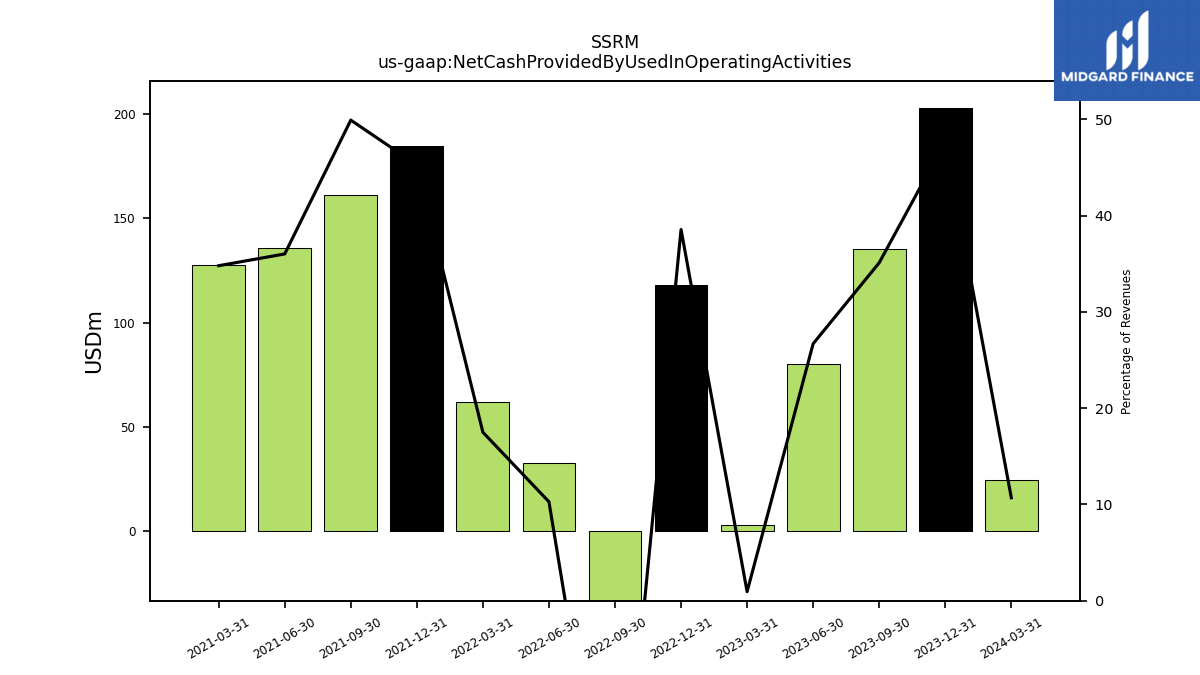
| Net Cash Provided By Used In Operating Activities | 135.26 | 80.34 | 2.97 | 118.10 | -52.23 | 32.84 | 62.19 | 184.61 | 161.12 | 135.75 | 127.50 | |
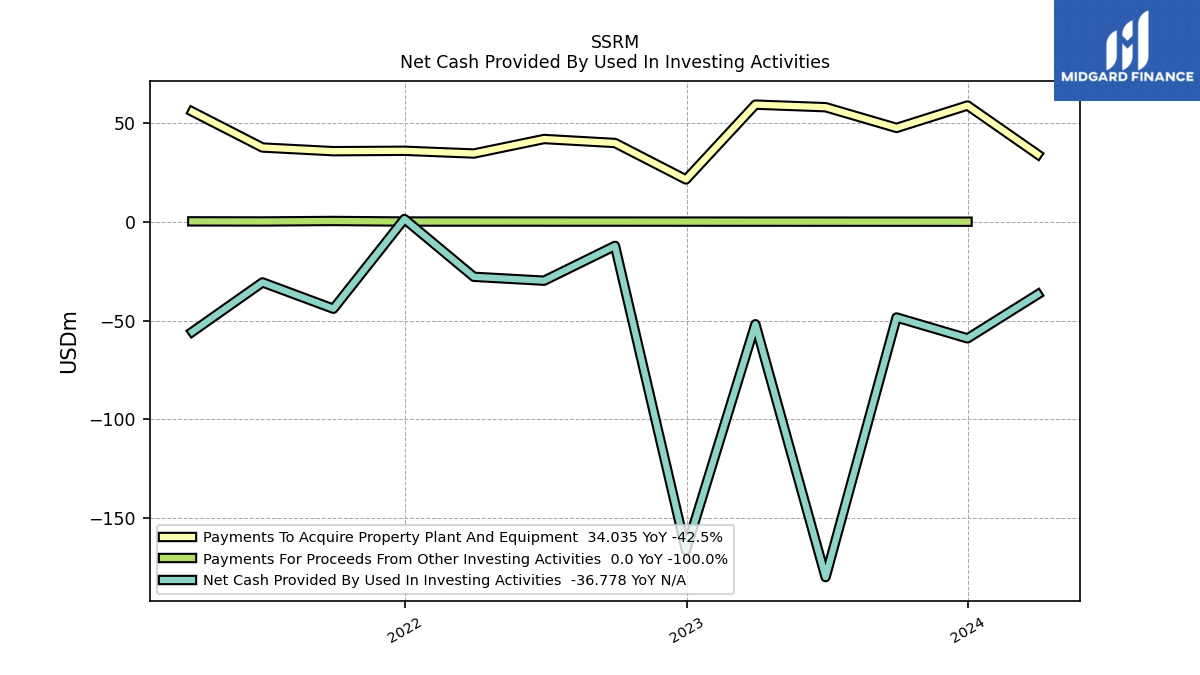
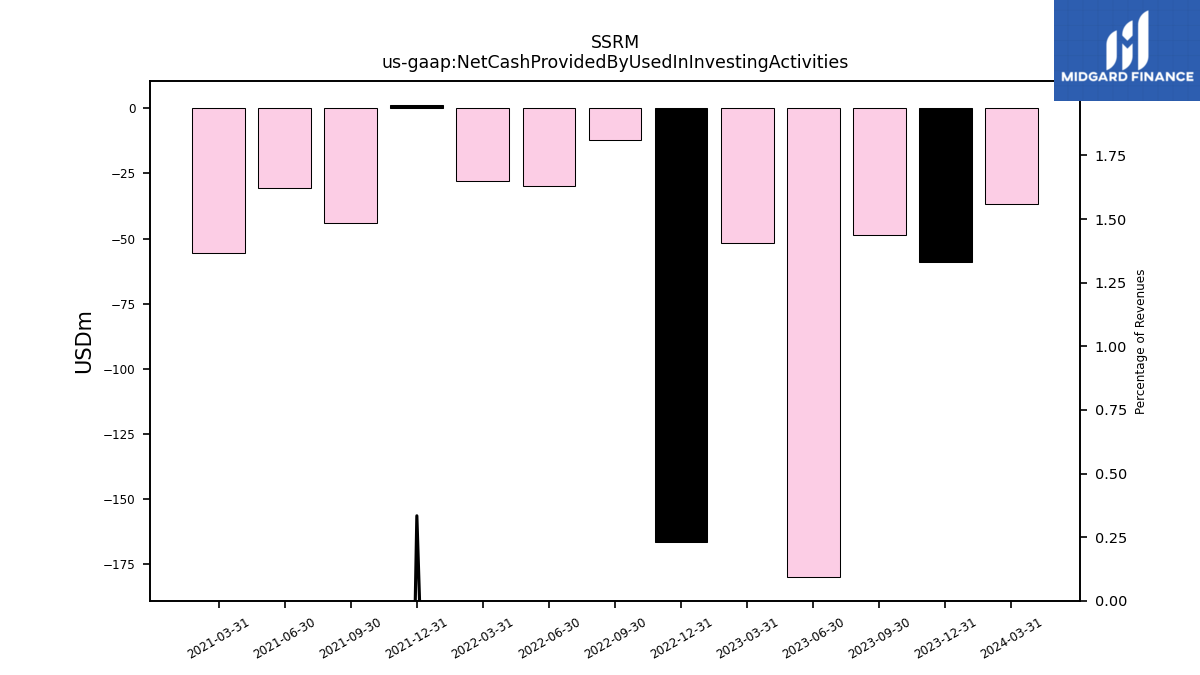
| Net Cash Provided By Used In Investing Activities | -48.47 | -179.86 | -51.88 | -166.30 | -12.24 | -29.86 | -27.89 | 1.36 | -44.05 | -30.72 | -55.73 | |
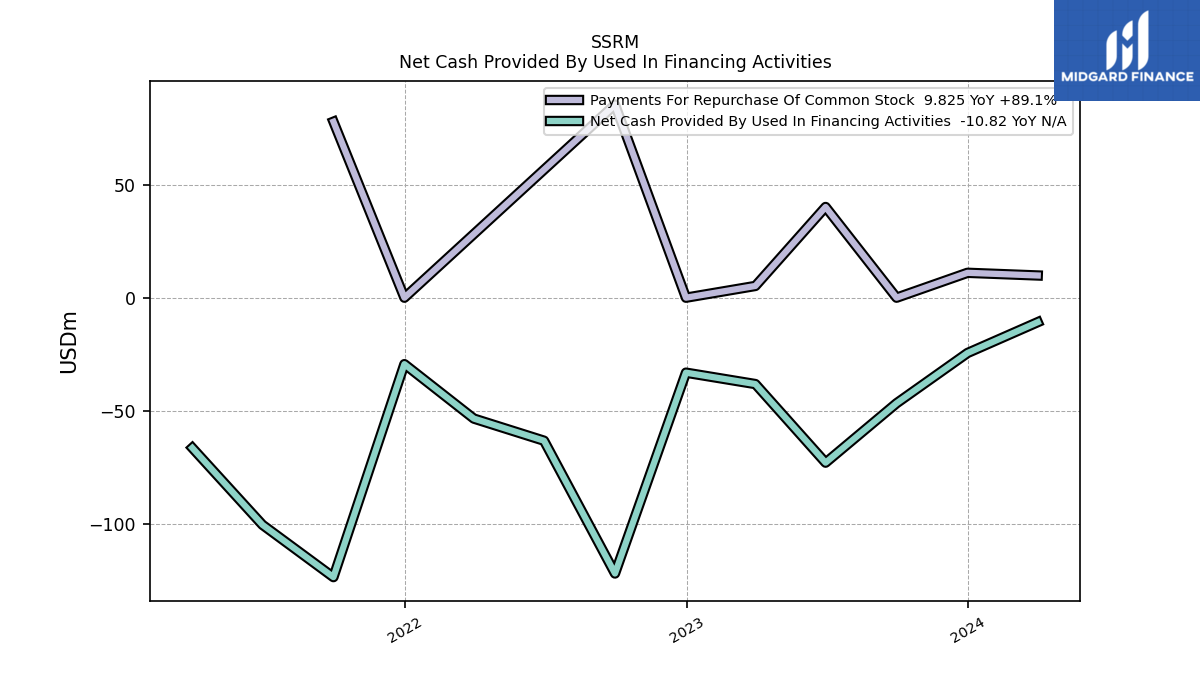
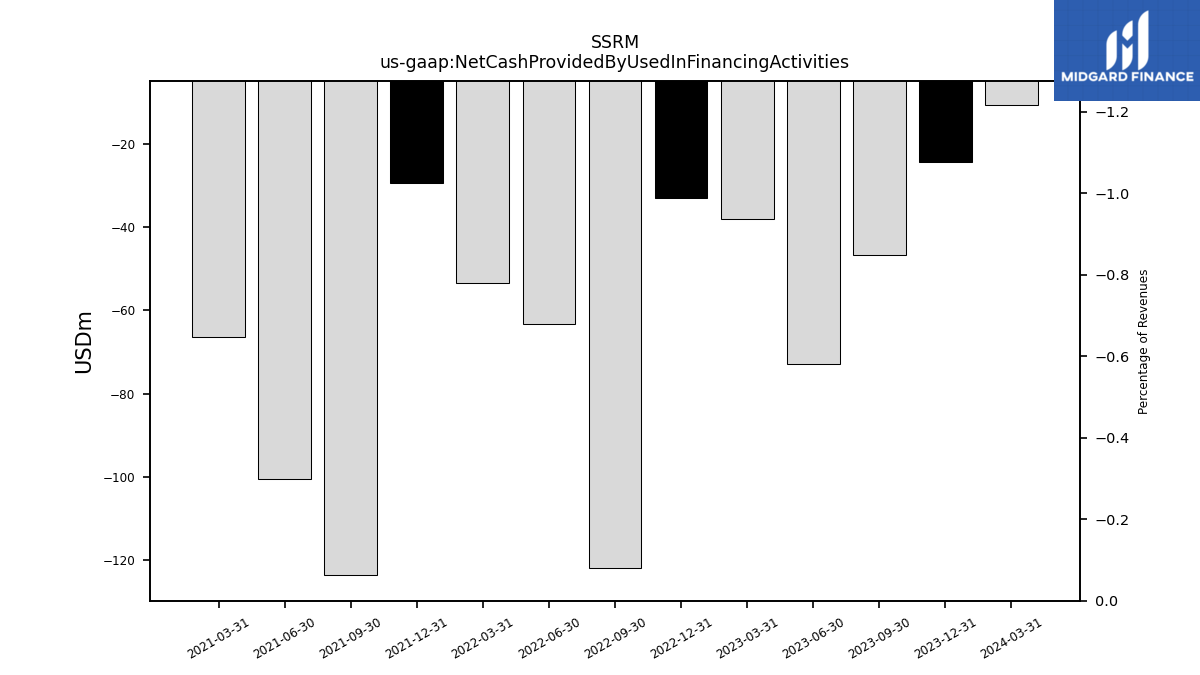
| Net Cash Provided By Used In Financing Activities | -46.67 | -72.94 | -38.19 | -33.15 | -121.95 | -63.23 | -53.45 | -29.38 | -123.55 | -100.43 | -66.41 |
| 2023-09-30 | 2023-06-30 | 2023-03-31 | 2022-12-31 | 2022-09-30 | 2022-06-30 | 2022-03-31 | 2021-12-31 | 2021-09-30 | 2021-06-30 | 2021-03-31 | ||
|---|---|---|---|---|---|---|---|---|---|---|---|---|
| Net Cash Provided By Used In Operating Activities | 135.26 | 80.34 | 2.97 | 118.10 | -52.23 | 32.84 | 62.19 | 184.61 | 161.12 | 135.75 | 127.50 | |
| Net Income Loss | 15.16 | 74.87 | 29.81 | 93.88 | -25.79 | 58.49 | 67.56 | 127.44 | 57.06 | 74.72 | 108.86 | |
| Profit Loss | -7.25 | 122.38 | 29.00 | 95.18 | -28.37 | 67.52 | 76.11 | 156.50 | 64.18 | 77.79 | 127.45 | |
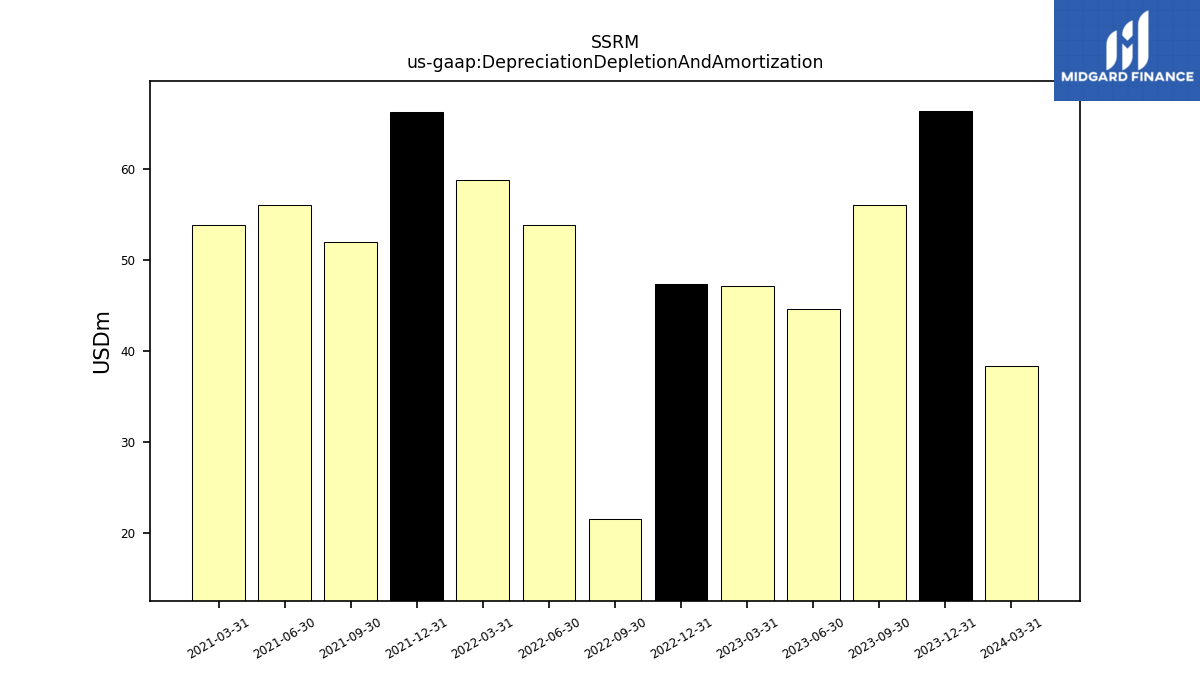
| Depreciation Depletion And Amortization | 55.99 | 44.64 | 47.09 | 47.30 | 21.55 | 53.85 | 58.74 | 66.23 | 51.96 | 55.99 | 53.78 | |
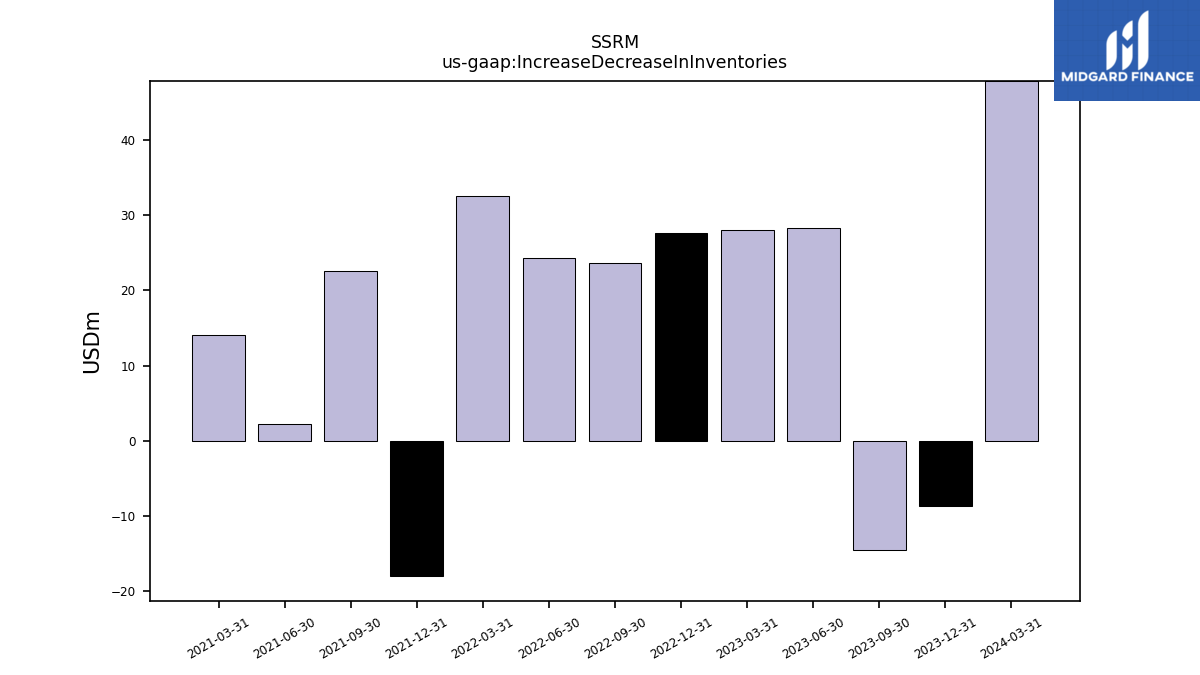
| Increase Decrease In Inventories | -14.44 | 28.35 | 28.02 | 27.69 | 23.65 | 24.33 | 32.52 | -17.95 | 22.52 | 2.22 | 14.06 | |
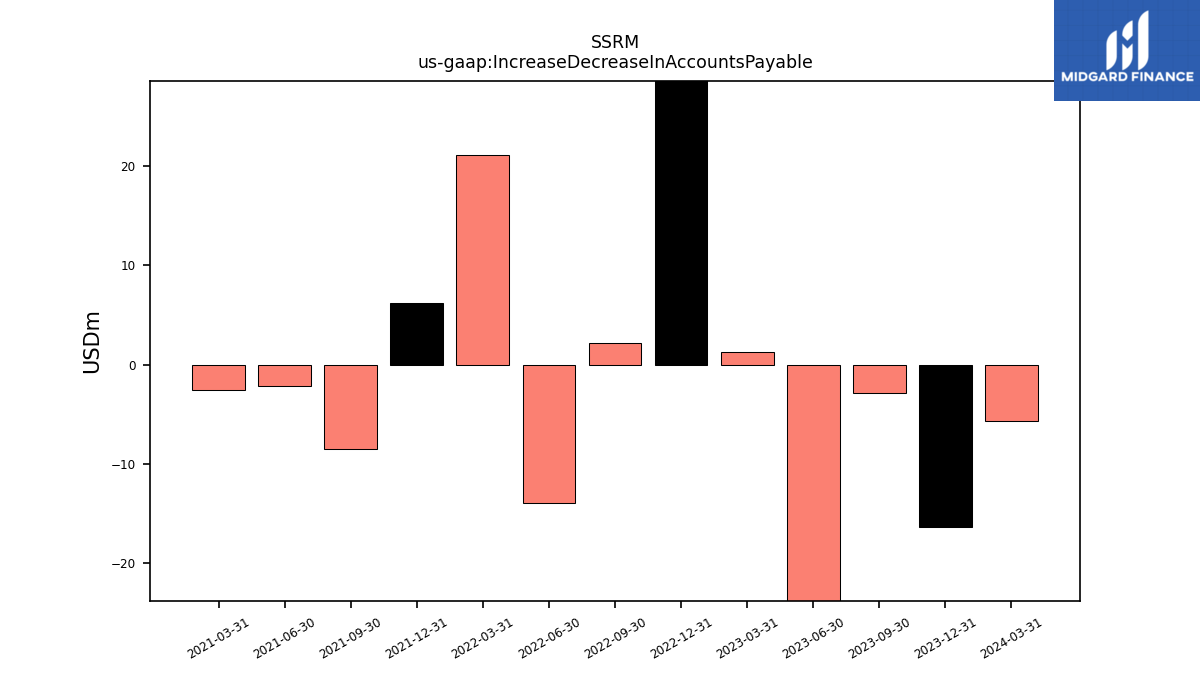
| Increase Decrease In Accounts Payable | -2.86 | -23.98 | 1.28 | 31.50 | 2.22 | -13.99 | 21.09 | 6.24 | -8.48 | -2.13 | -2.52 | |
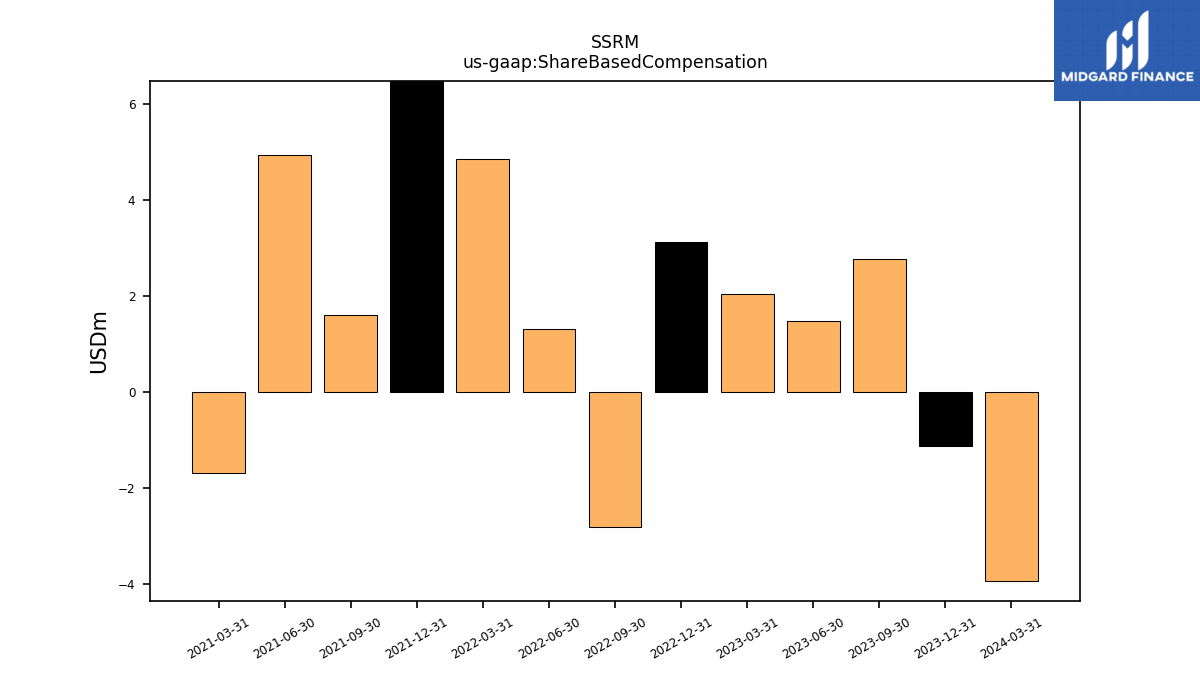
| Share Based Compensation | 2.77 | 1.47 | 2.05 | 3.12 | -2.80 | 1.31 | 4.85 | 9.97 | 1.60 | 4.93 | -1.70 |
| 2023-09-30 | 2023-06-30 | 2023-03-31 | 2022-12-31 | 2022-09-30 | 2022-06-30 | 2022-03-31 | 2021-12-31 | 2021-09-30 | 2021-06-30 | 2021-03-31 | ||
|---|---|---|---|---|---|---|---|---|---|---|---|---|
| Net Cash Provided By Used In Investing Activities | -48.47 | -179.86 | -51.88 | -166.30 | -12.24 | -29.86 | -27.89 | 1.36 | -44.05 | -30.72 | -55.73 | |
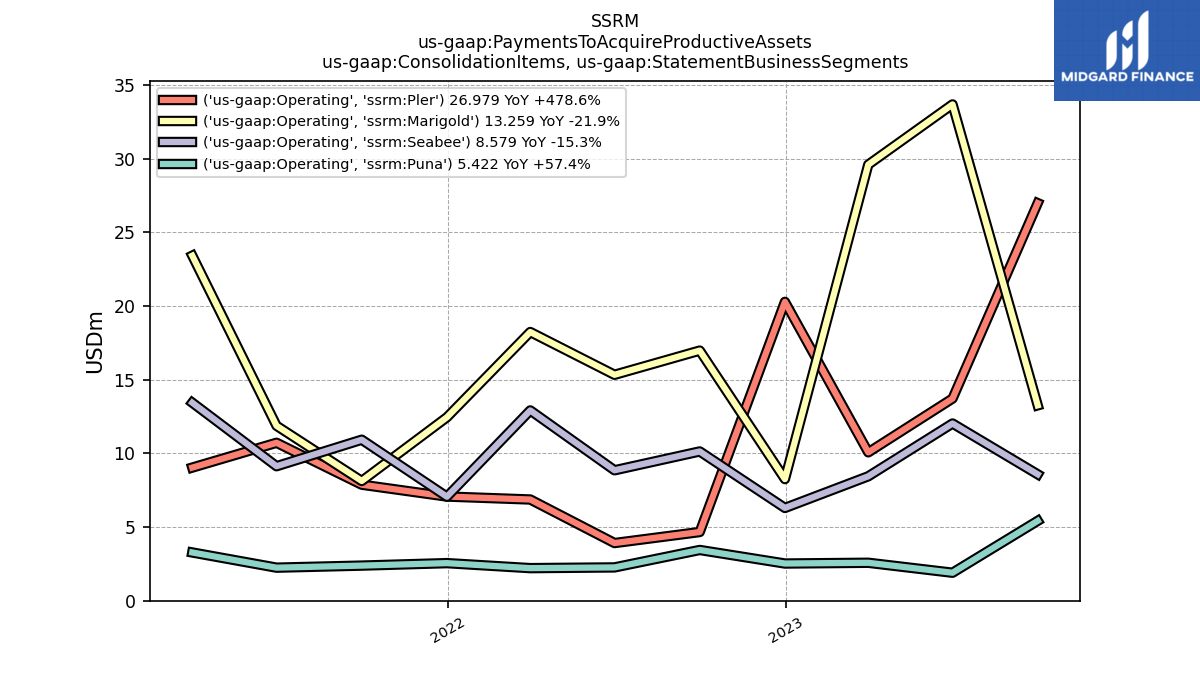
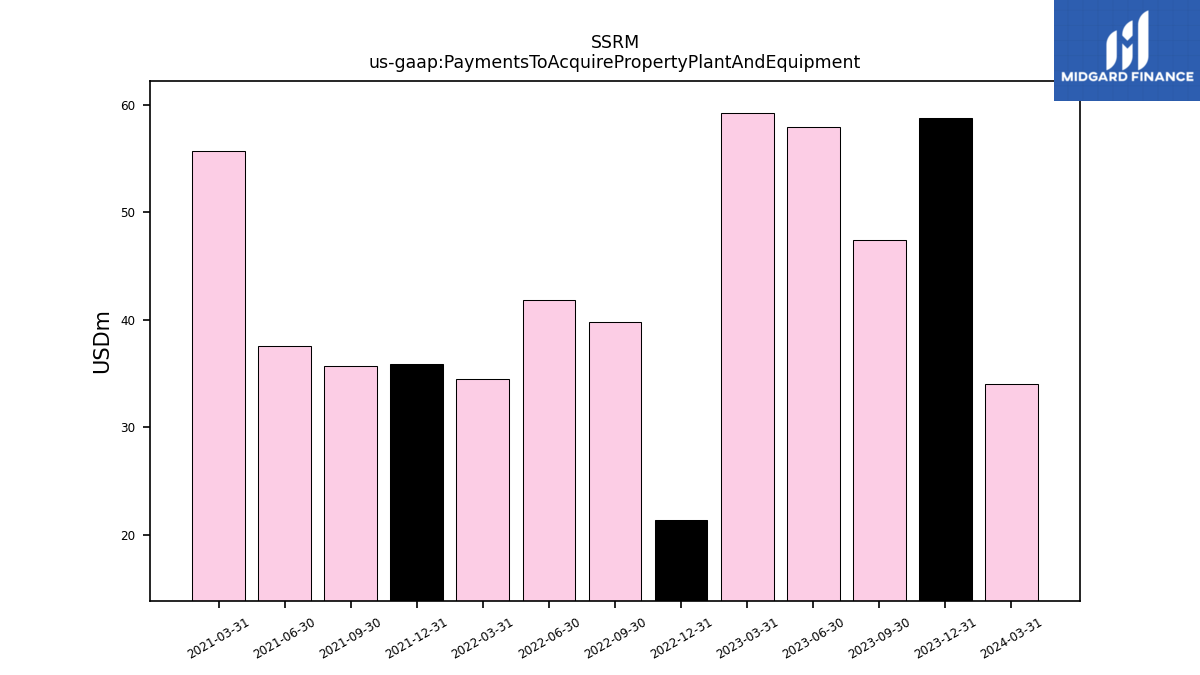
| Payments To Acquire Property Plant And Equipment | 47.46 | 57.94 | 59.24 | 21.36 | 39.83 | 41.84 | 34.49 | 35.89 | 35.68 | 37.54 | 55.71 | |
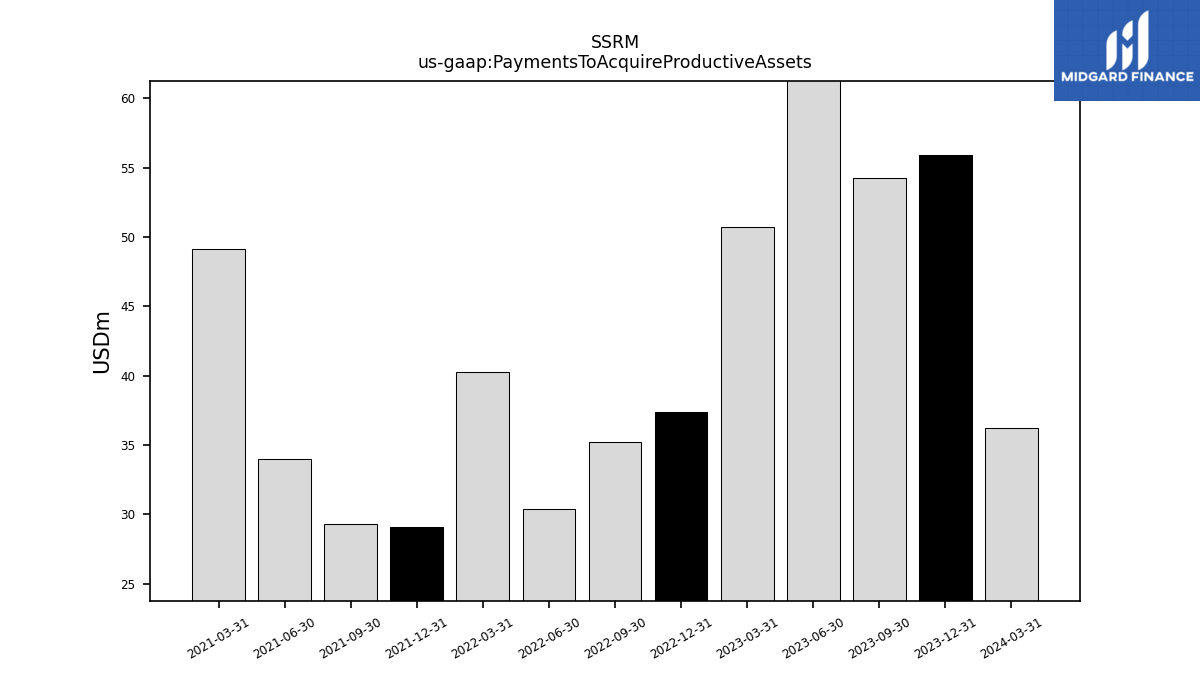
| Payments To Acquire Productive Assets | 54.24 | 61.32 | 50.68 | 37.36 | 35.21 | 30.36 | 40.23 | 29.13 | 29.31 | 33.97 | 49.16 |
| 2023-09-30 | 2023-06-30 | 2023-03-31 | 2022-12-31 | 2022-09-30 | 2022-06-30 | 2022-03-31 | 2021-12-31 | 2021-09-30 | 2021-06-30 | 2021-03-31 | ||
|---|---|---|---|---|---|---|---|---|---|---|---|---|
| Net Cash Provided By Used In Financing Activities | -46.67 | -72.94 | -38.19 | -33.15 | -121.95 | -63.23 | -53.45 | -29.38 | -123.55 | -100.43 | -66.41 | |
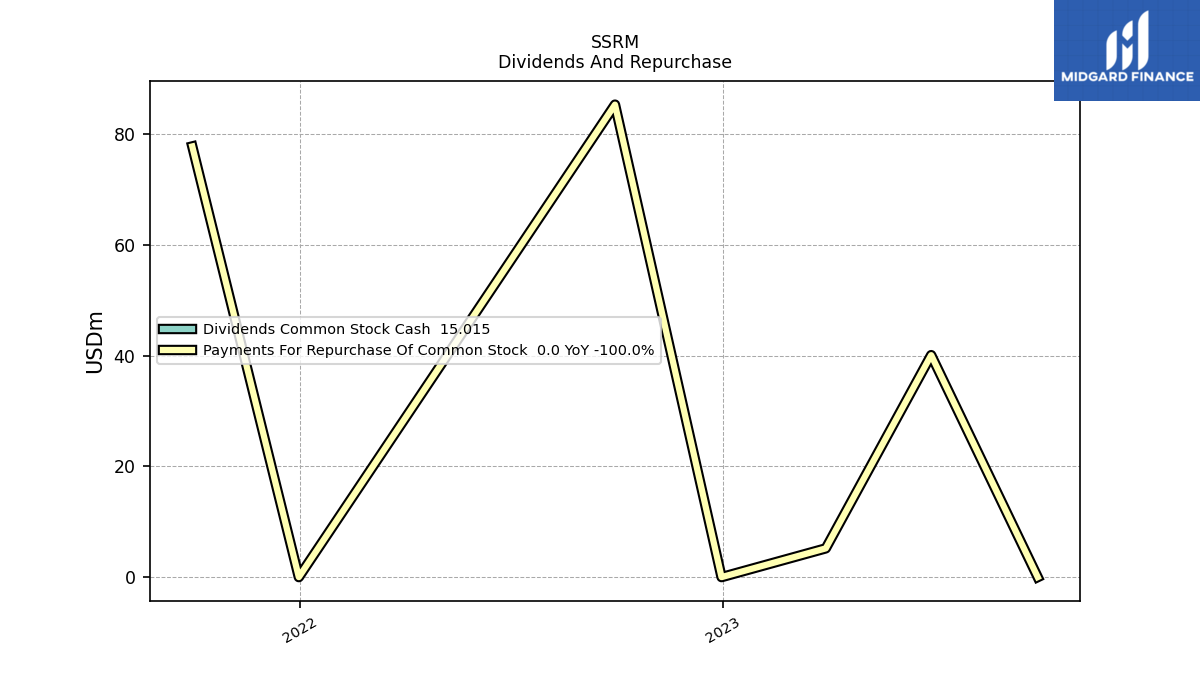
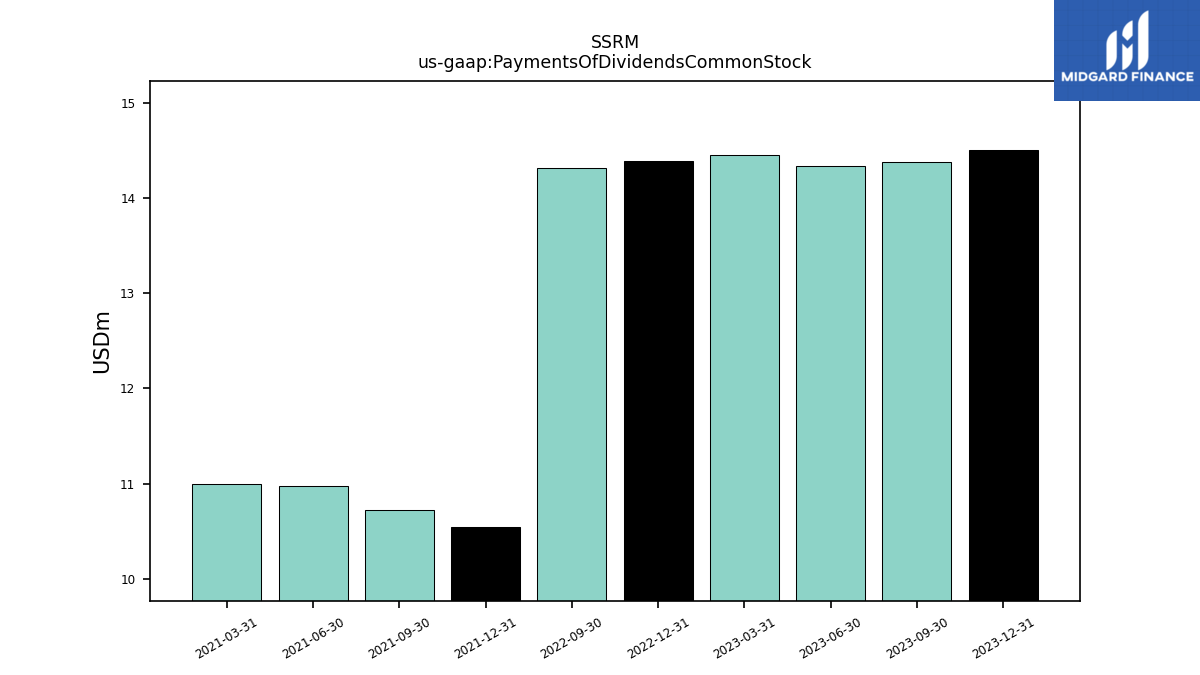
| Payments Of Dividends Common Stock | 14.38 | 14.34 | 14.45 | 14.39 | 14.31 | NA | NA | 10.55 | 10.72 | 10.97 | 10.99 | |
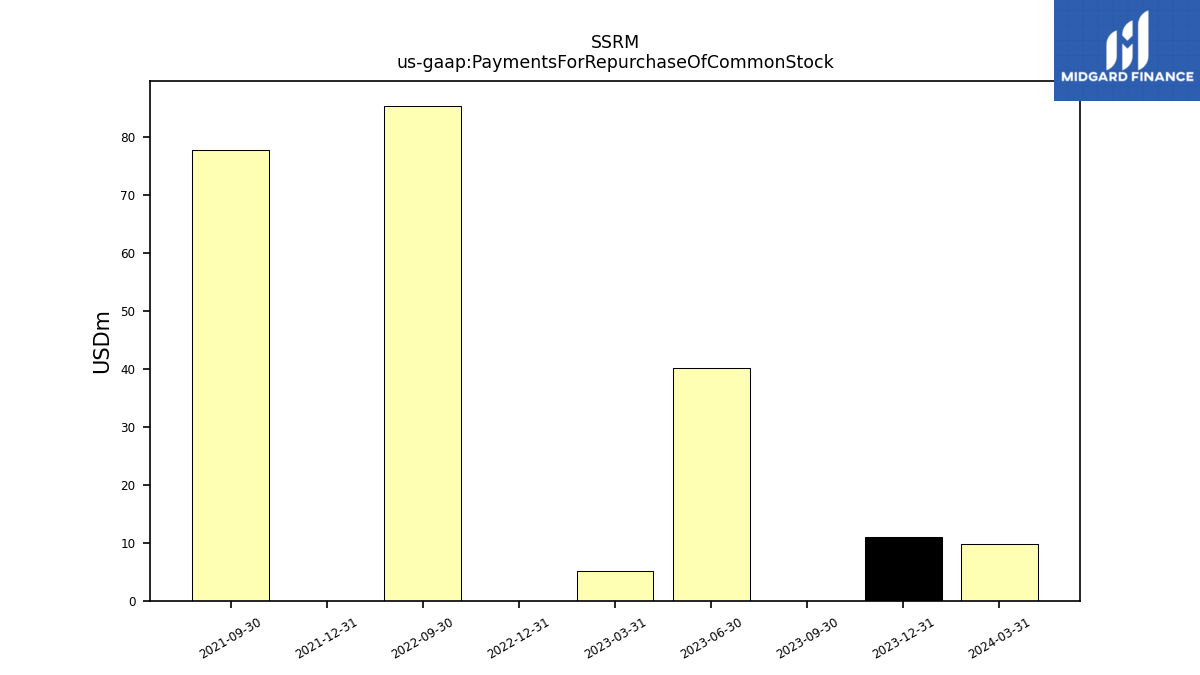
| Payments For Repurchase Of Common Stock | 0.00 | 40.11 | 5.20 | 0.00 | 85.37 | NA | NA | 0.00 | 77.82 | NA | NA |
| 2023-09-30 | 2023-06-30 | 2023-03-31 | 2022-12-31 | 2022-09-30 | 2022-06-30 | 2022-03-31 | 2021-12-31 | 2021-09-30 | 2021-06-30 | 2021-03-31 | ||
|---|---|---|---|---|---|---|---|---|---|---|---|---|
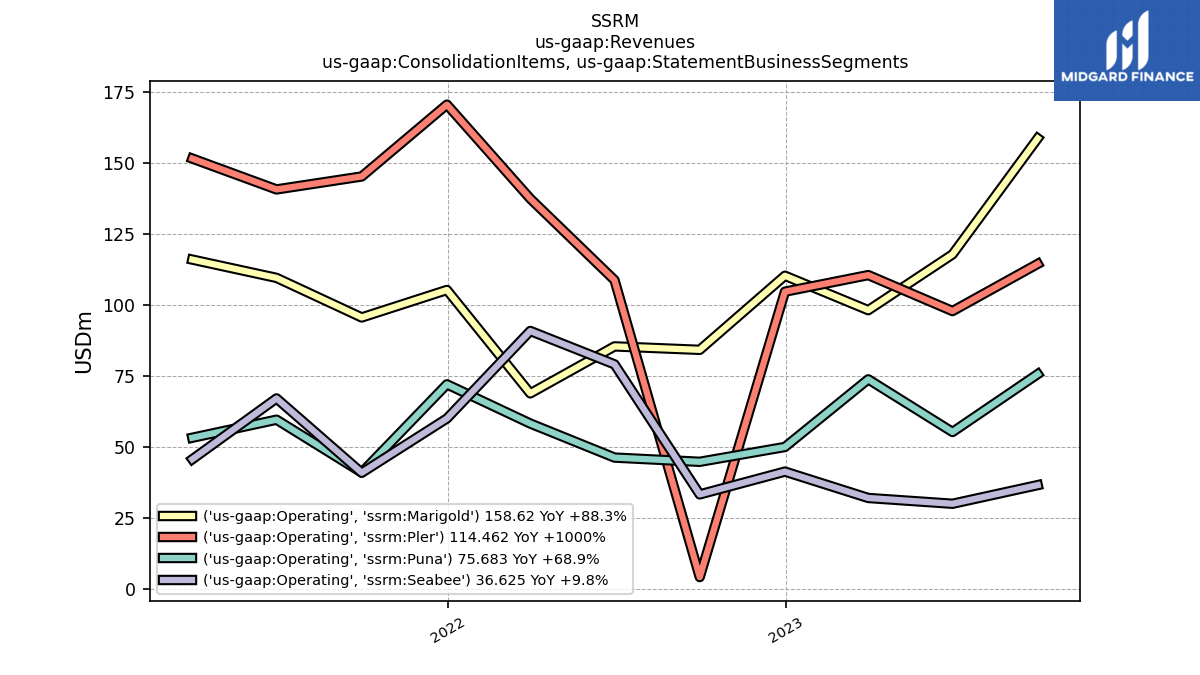
| Revenues | 385.39 | 301.03 | 314.61 | 306.38 | 166.63 | 319.58 | 355.45 | 407.92 | 322.85 | 376.95 | 366.48 | |
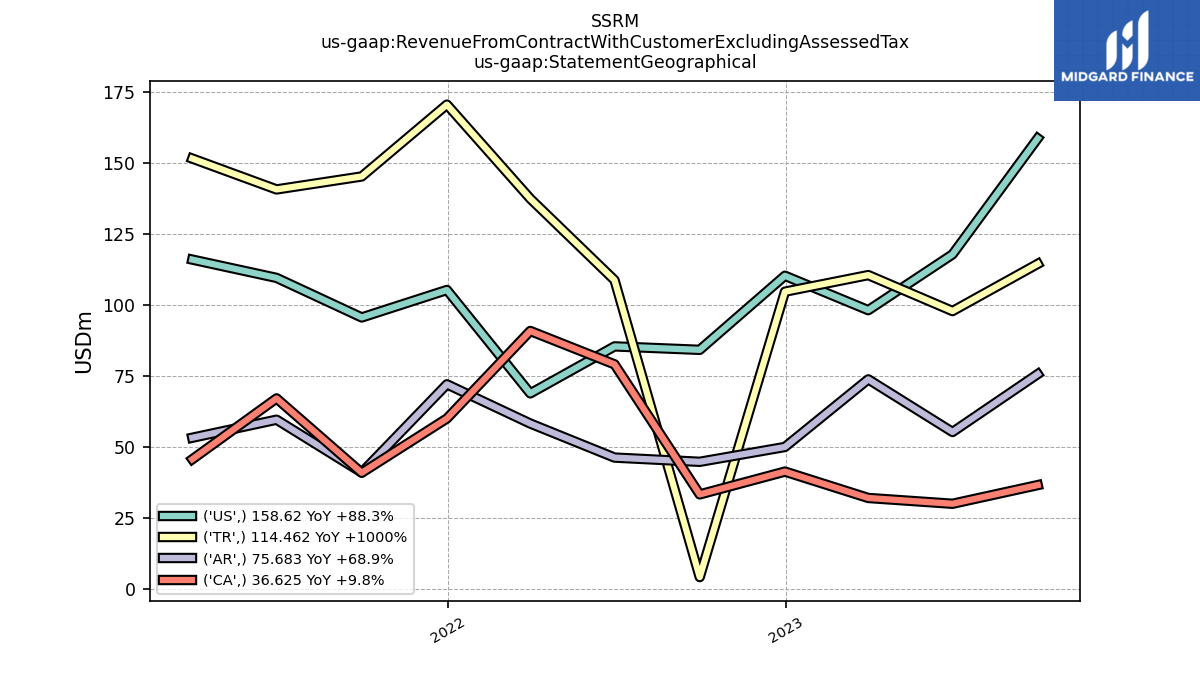
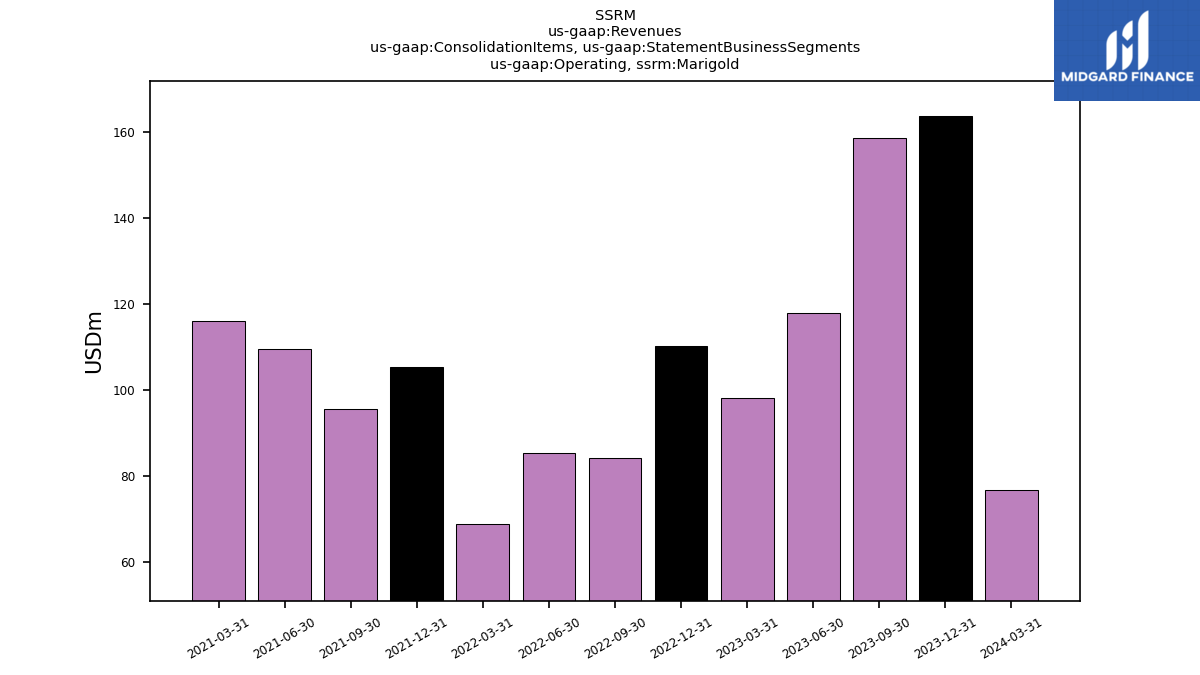
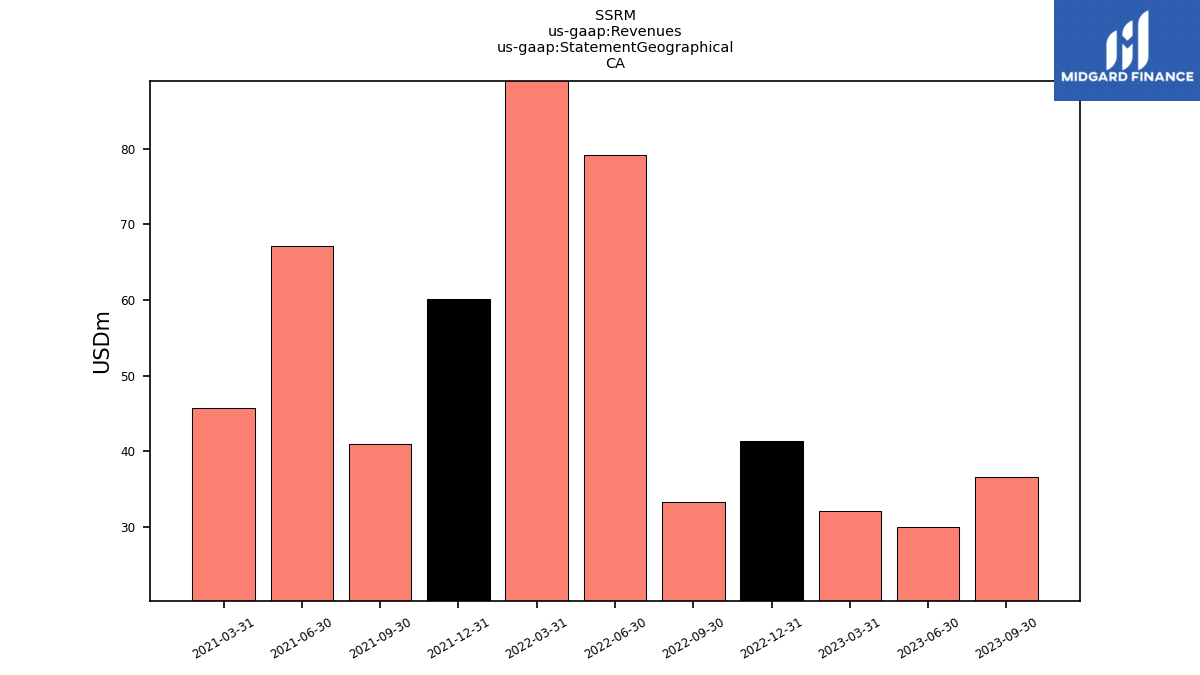
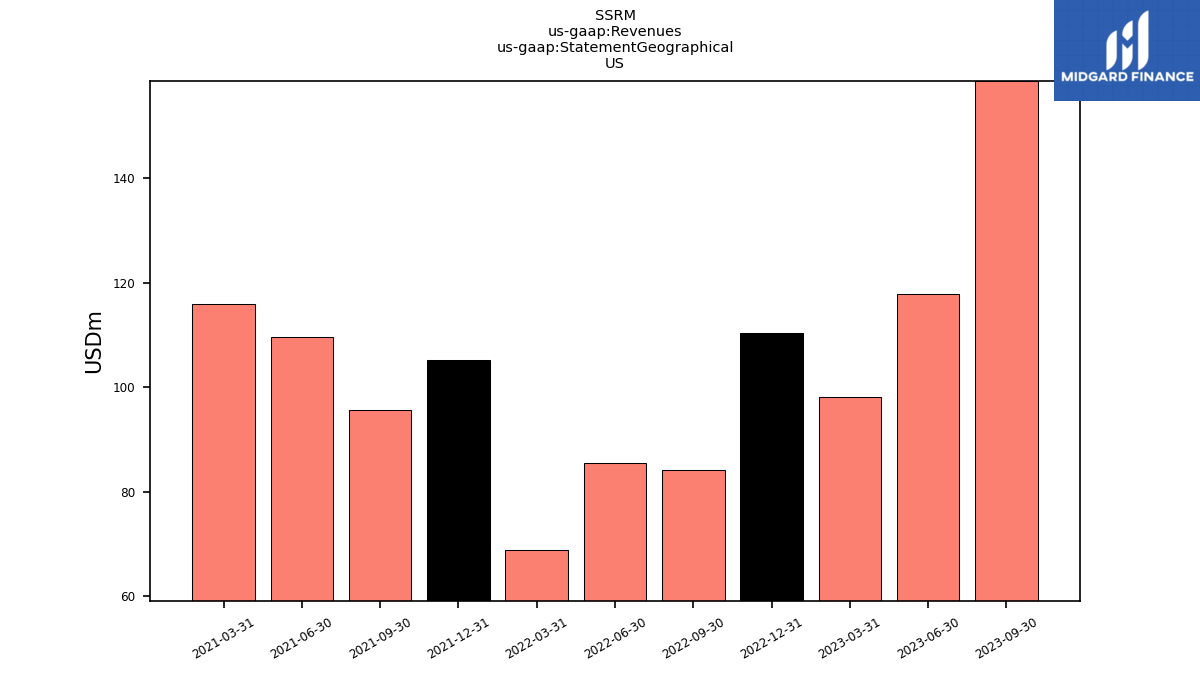
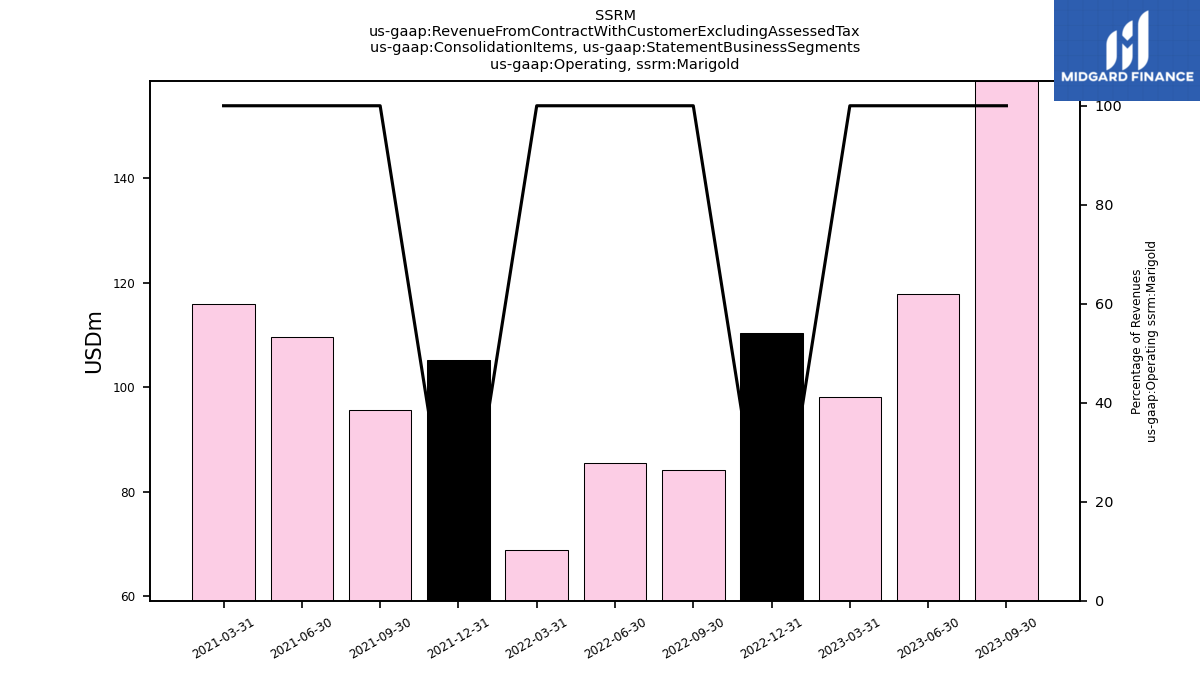
| Operating, Marigold | 158.62 | 117.81 | 98.17 | 110.28 | 84.22 | 85.42 | 68.89 | 105.28 | 95.61 | 109.53 | 115.97 | |
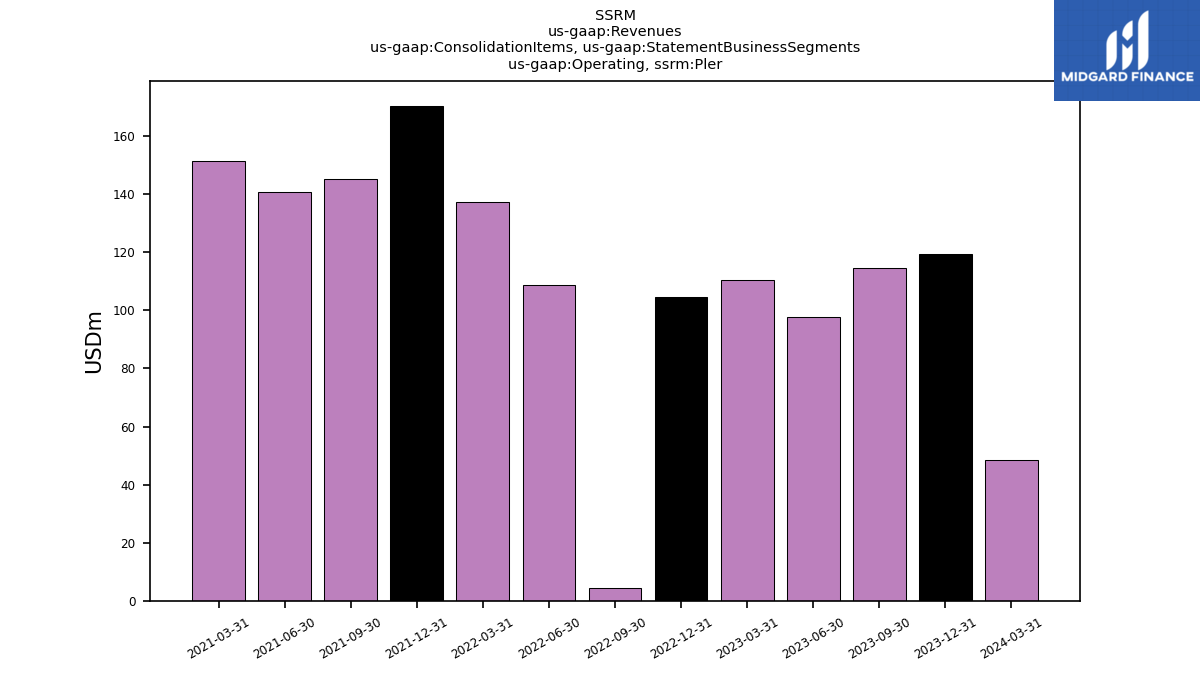
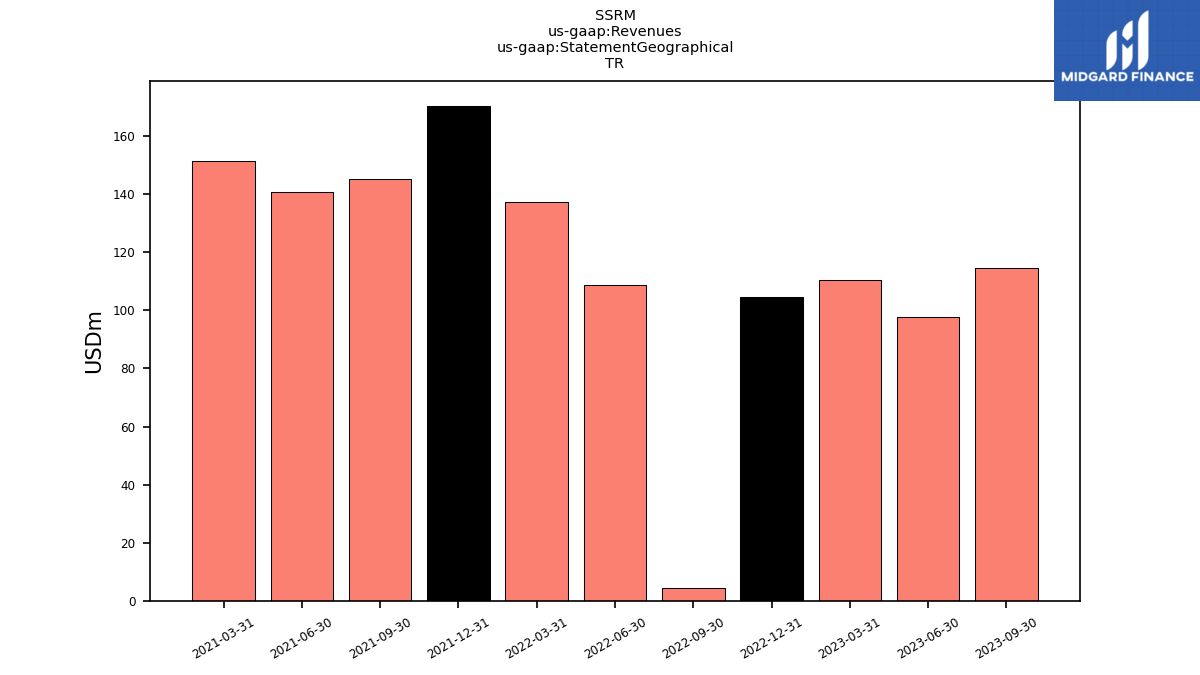
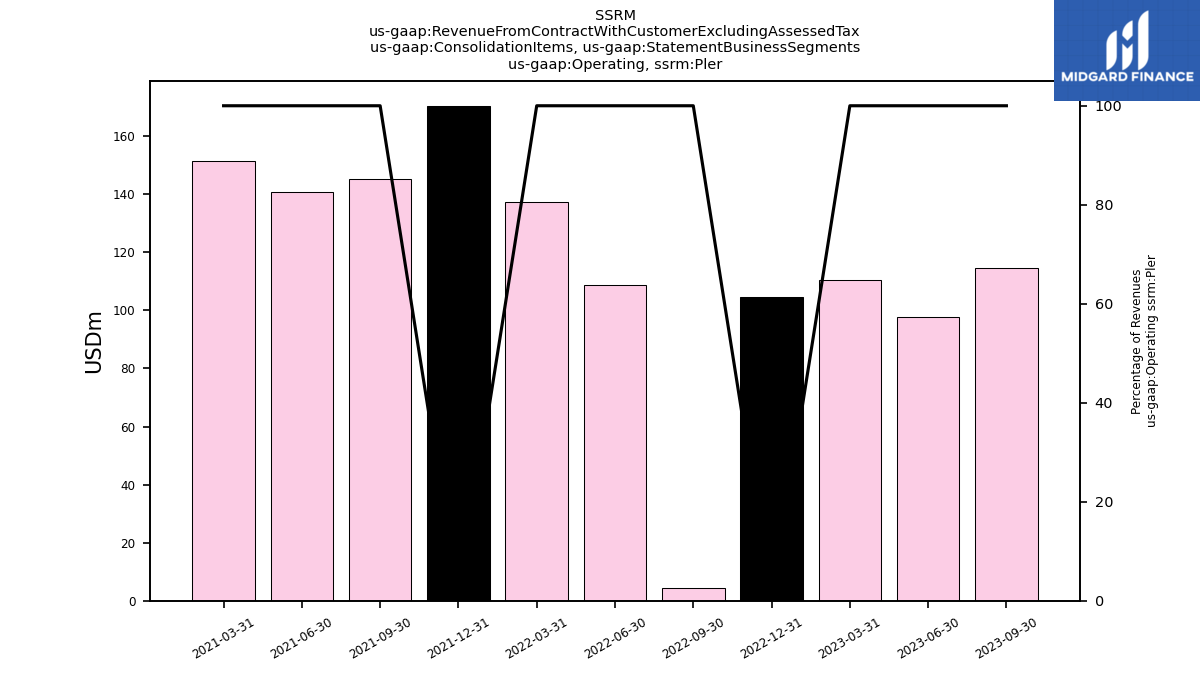
| Operating, Pler | 114.46 | 97.86 | 110.51 | 104.67 | 4.25 | 108.74 | 137.41 | 170.49 | 145.22 | 140.65 | 151.52 | |
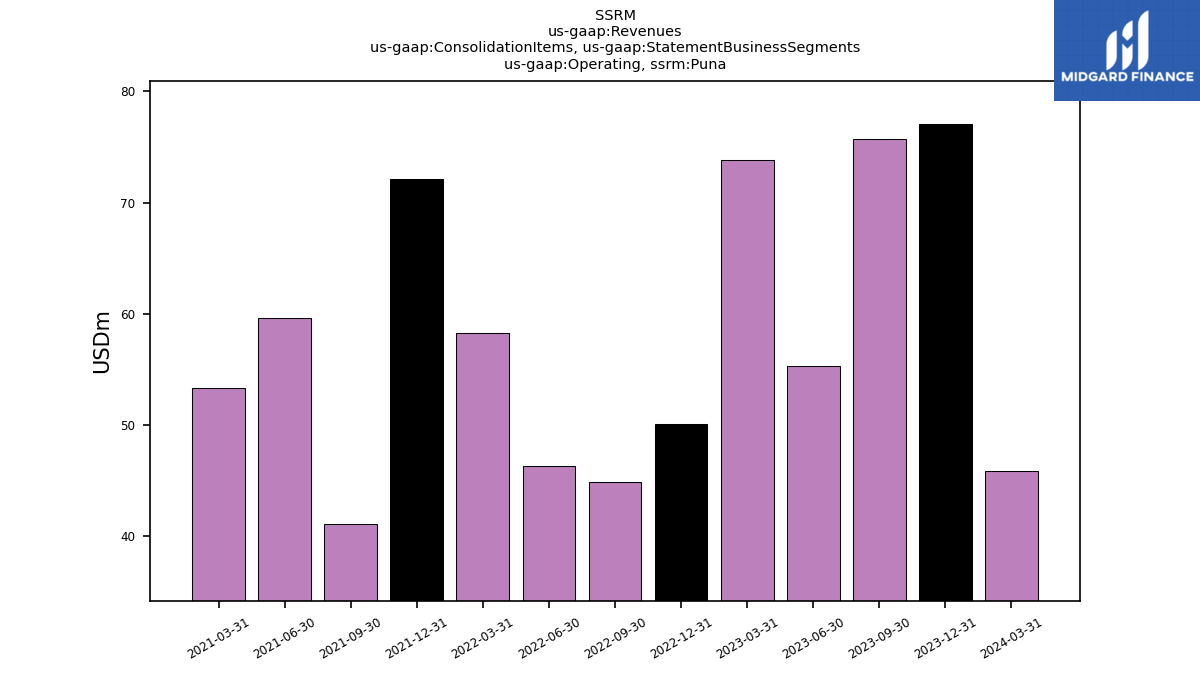
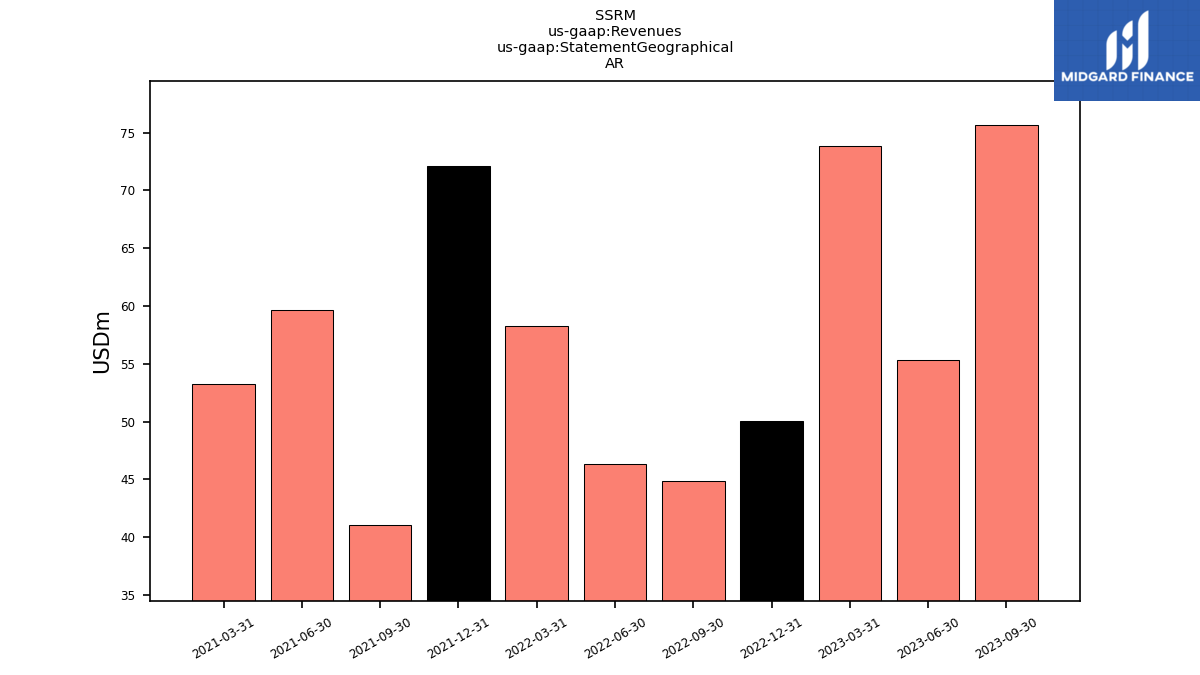
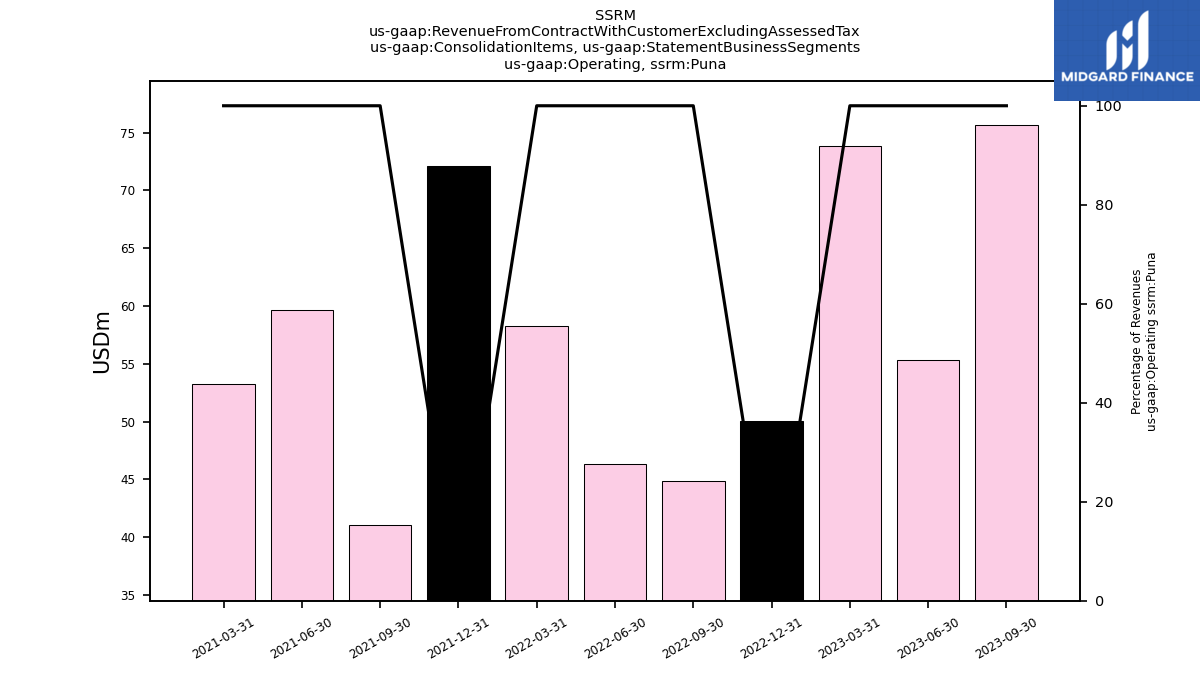
| Operating, Puna | 75.68 | 55.31 | 73.84 | 50.04 | 44.82 | 46.30 | 58.29 | 72.09 | 41.06 | 59.64 | 53.28 | |
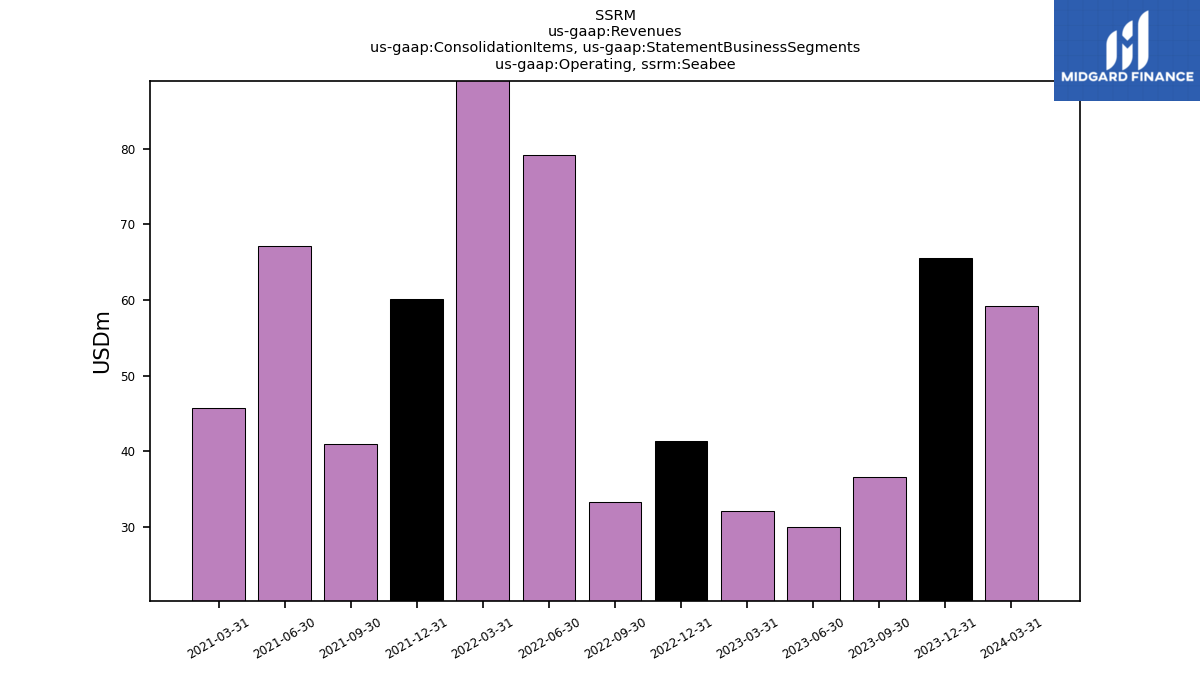
| Operating, Seabee | 36.62 | 30.06 | 32.09 | 41.38 | 33.35 | 79.11 | 90.86 | 60.06 | 40.97 | 67.13 | 45.71 | |
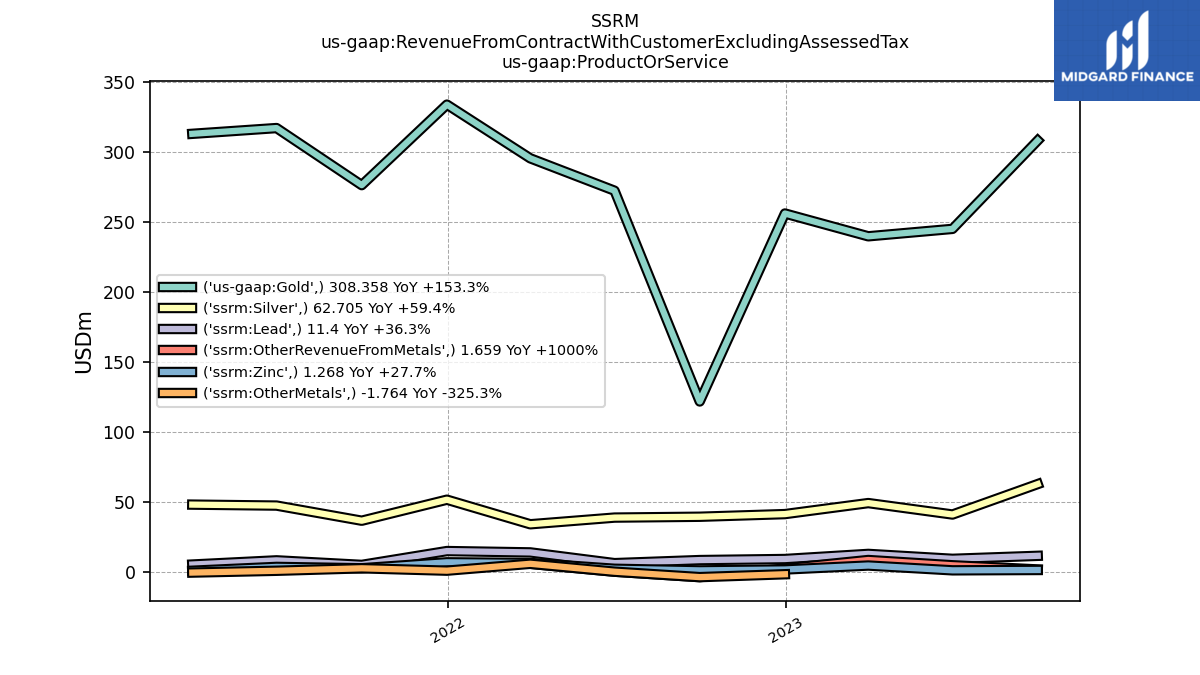
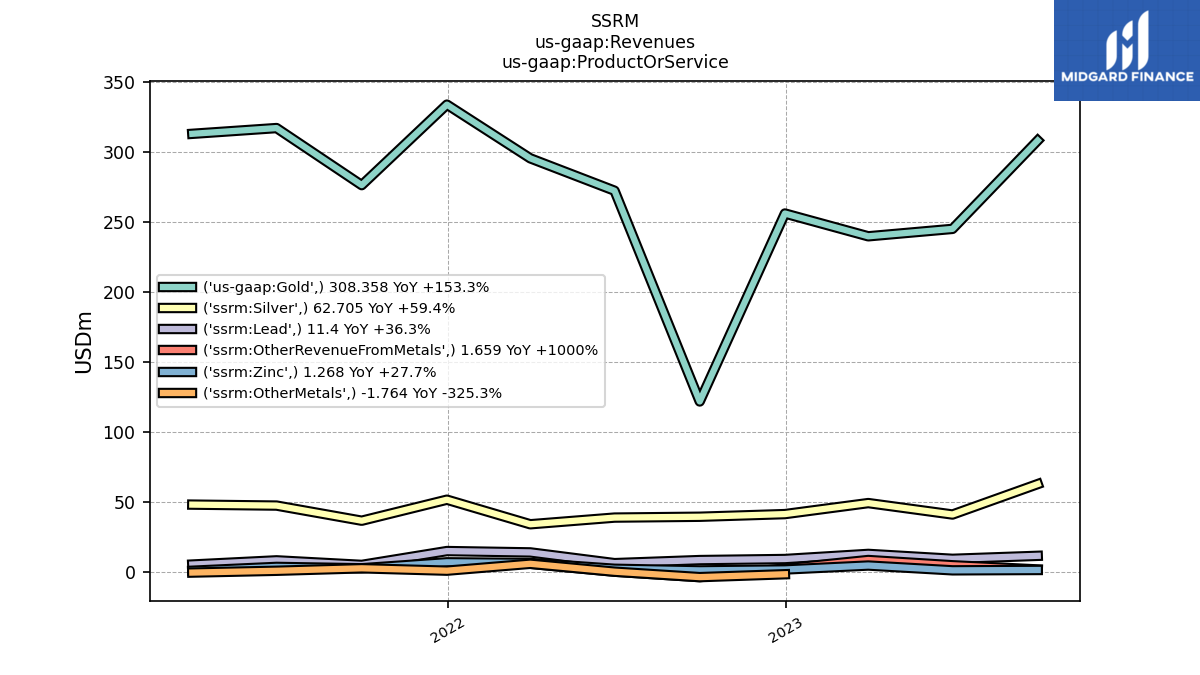
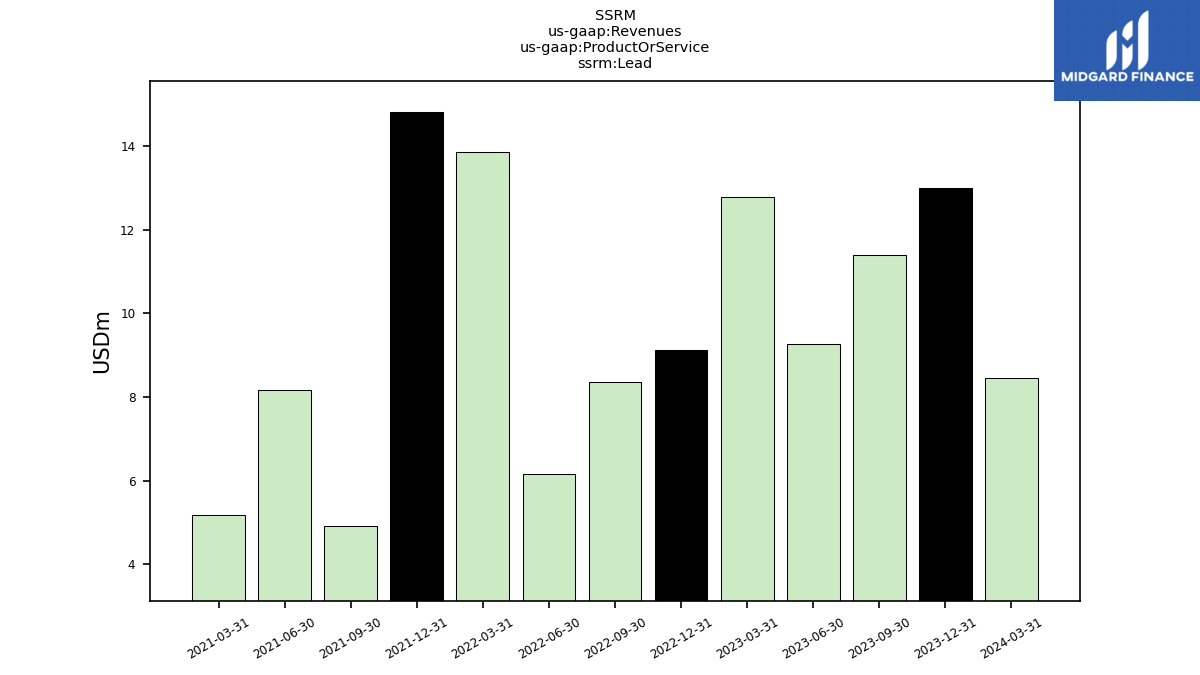
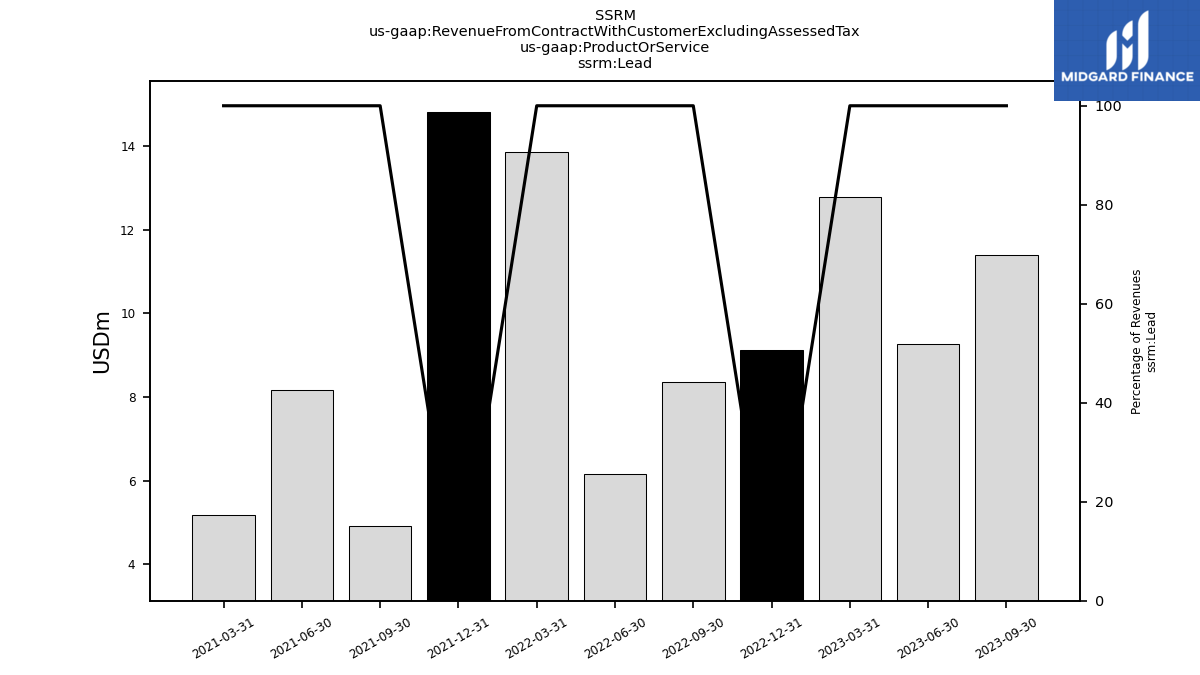
| Lead | 11.40 | 9.26 | 12.78 | 9.13 | 8.37 | 6.17 | 13.86 | 14.81 | 4.92 | 8.17 | 5.17 | |
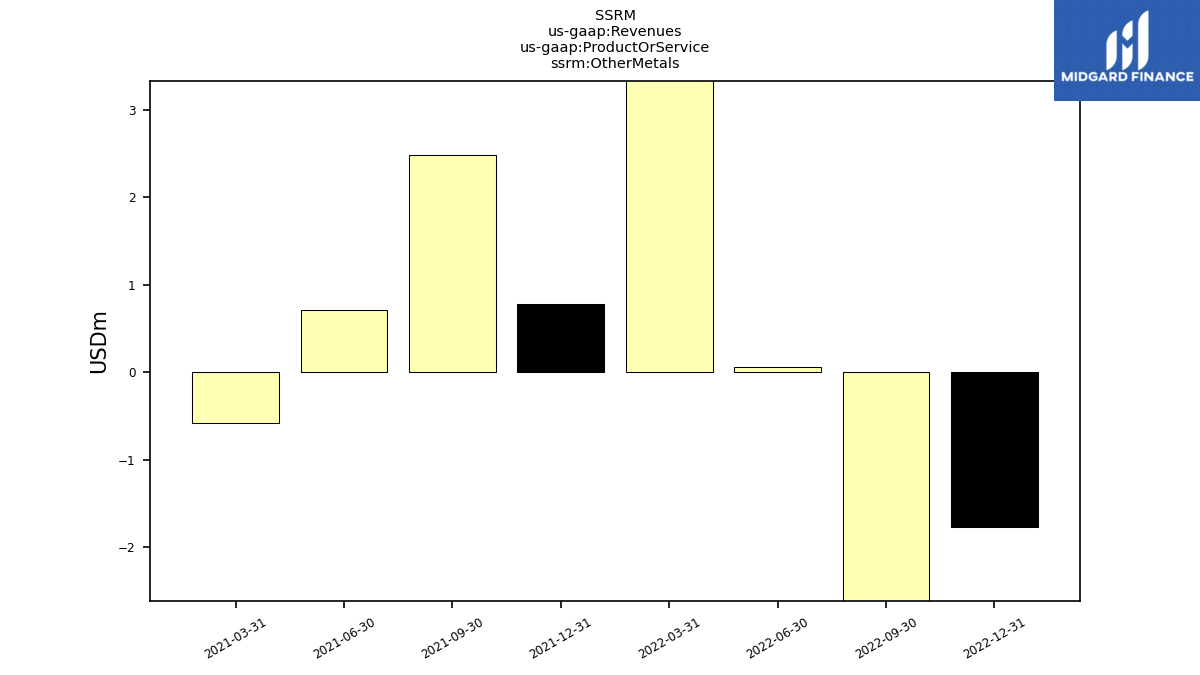
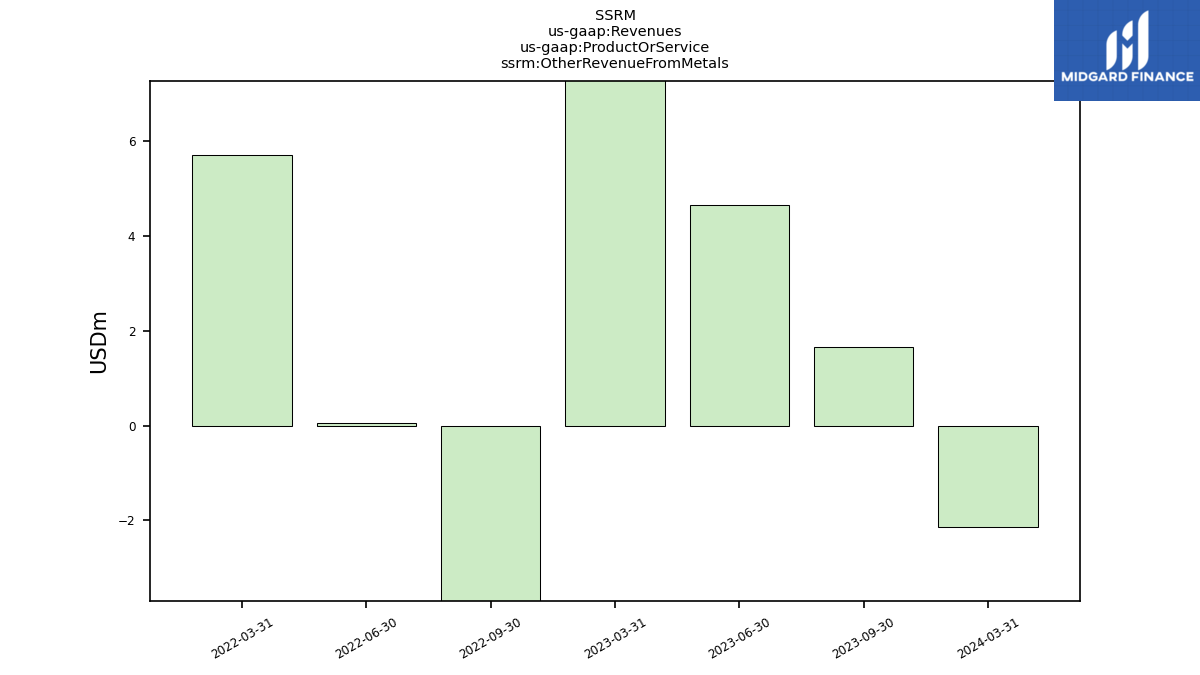
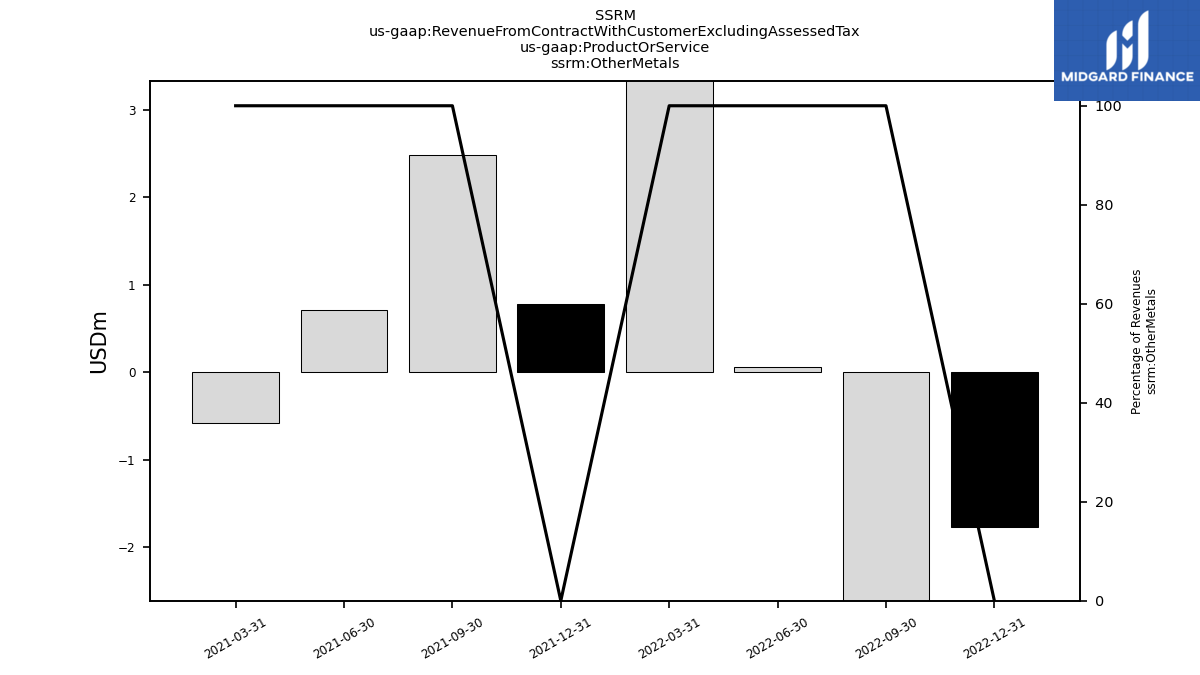
| Other Metals | NA | NA | NA | -1.76 | -3.83 | 0.06 | 5.70 | 0.78 | 2.48 | 0.71 | -0.58 | |
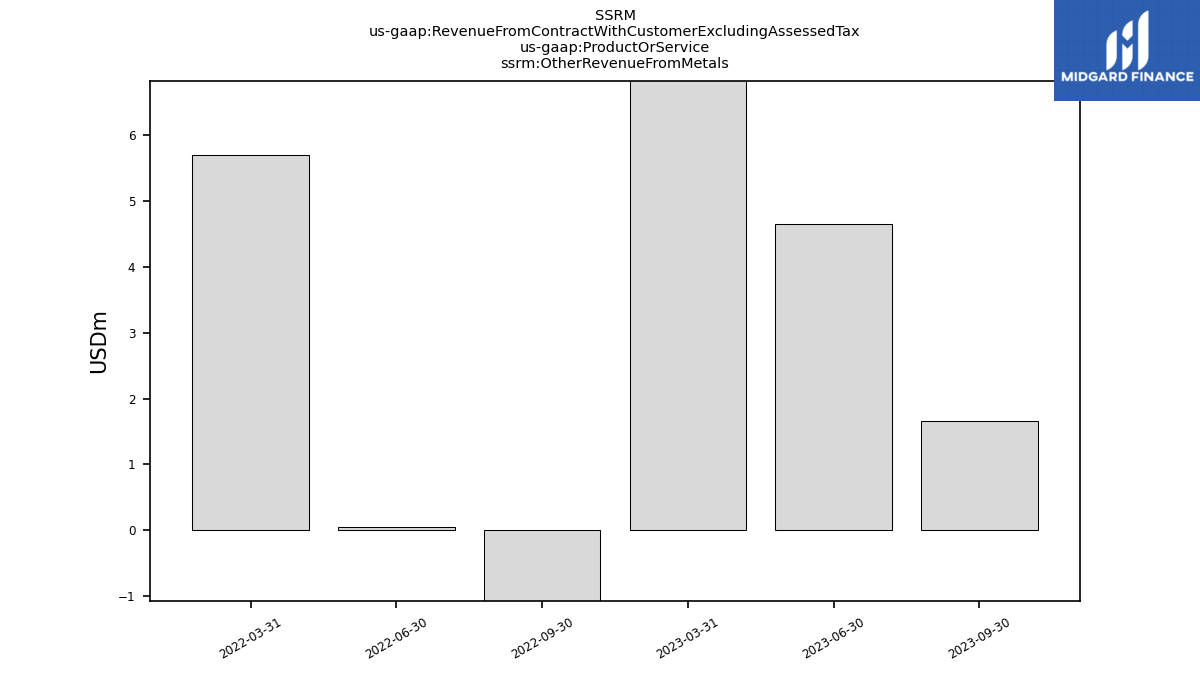
| Other Revenue From Metals | 1.66 | 4.65 | 8.40 | NA | -3.83 | 0.06 | 5.70 | NA | NA | NA | NA | |
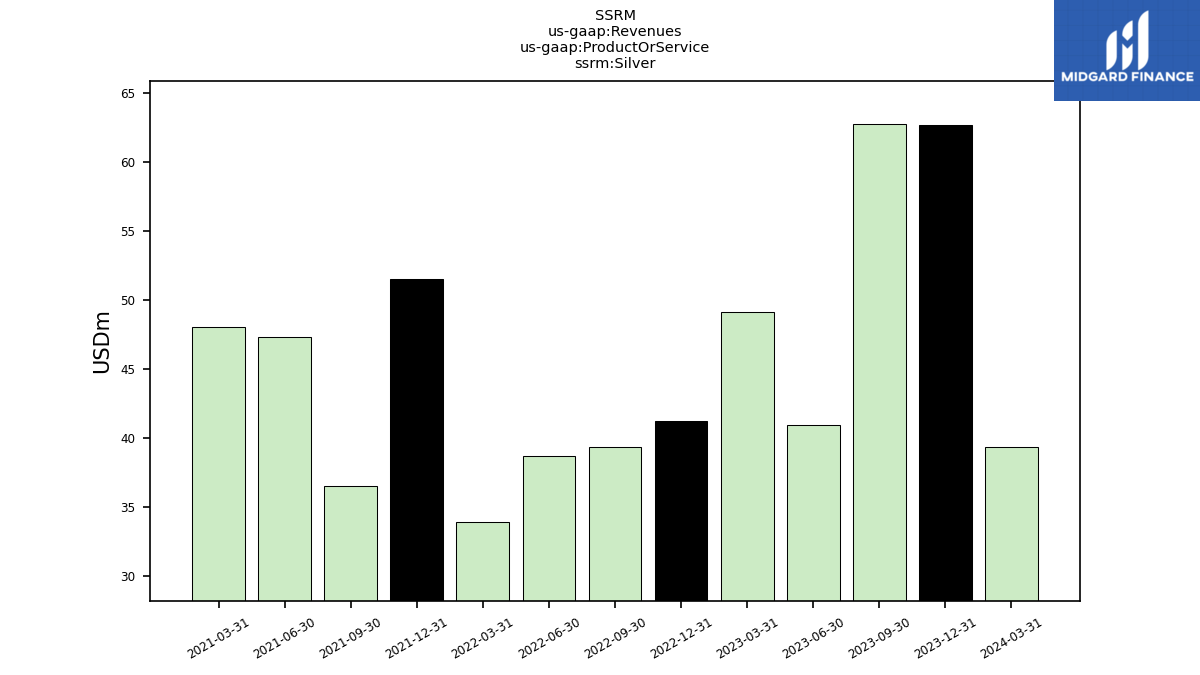
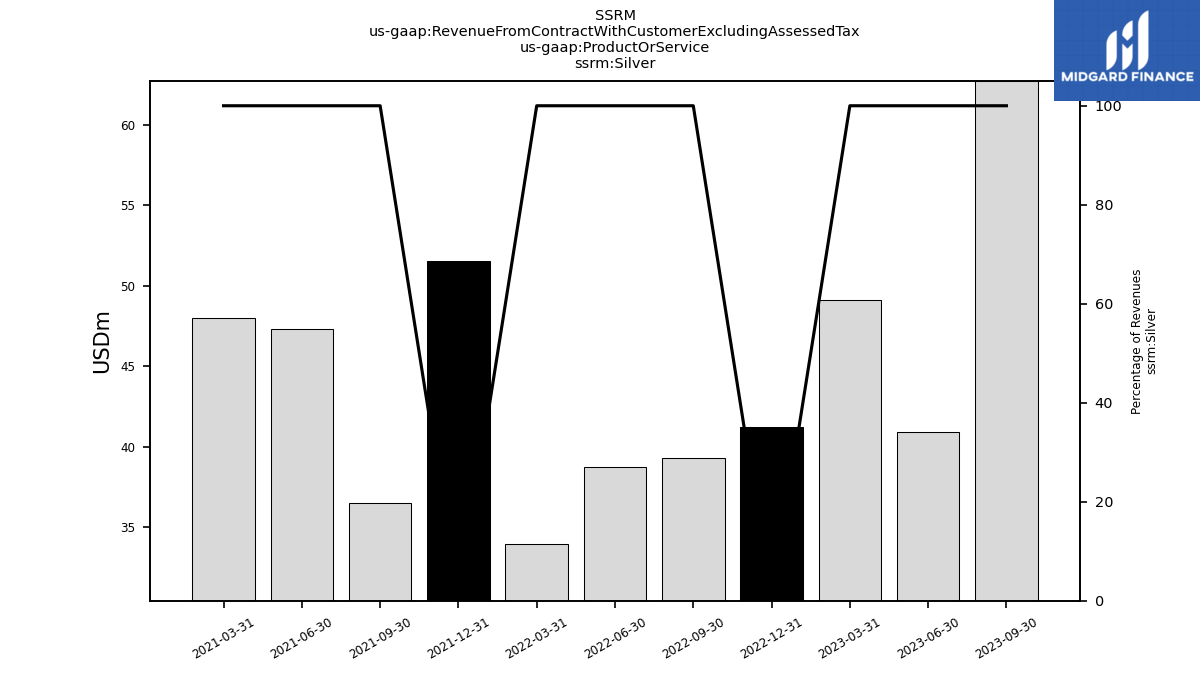
| Silver | 62.70 | 40.93 | 49.12 | 41.24 | 39.34 | 38.74 | 33.97 | 51.54 | 36.50 | 47.33 | 48.01 | |
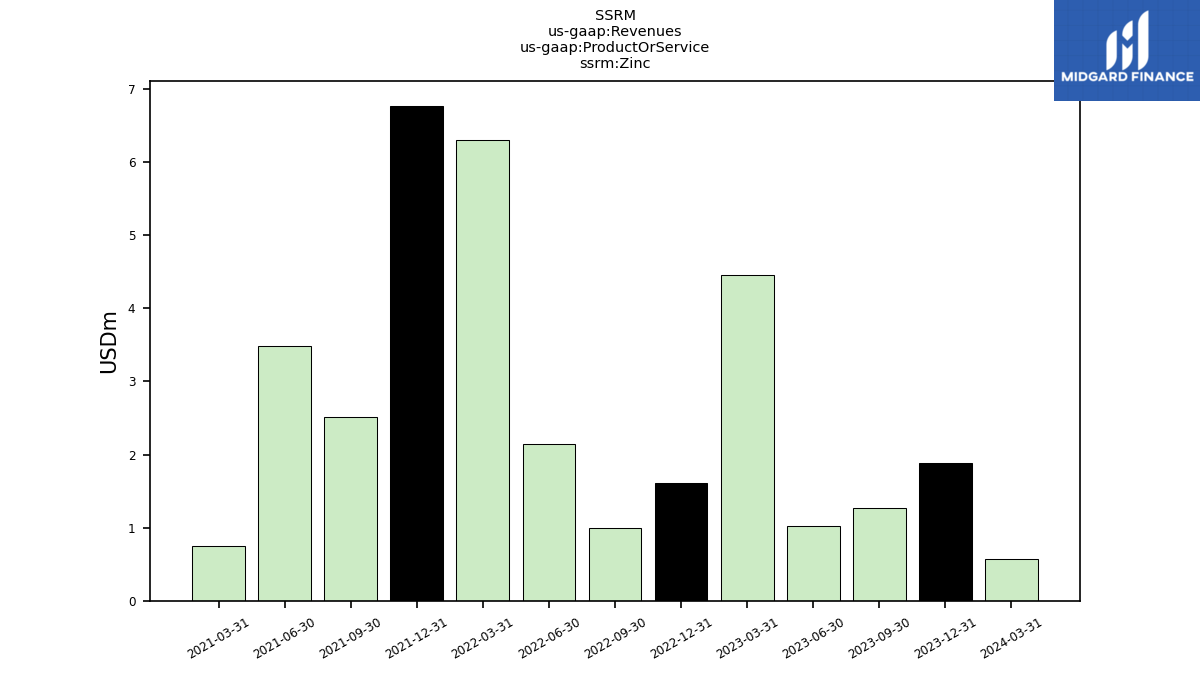
| Zinc | 1.27 | 1.02 | 4.46 | 1.61 | 0.99 | 2.15 | 6.31 | 6.77 | 2.51 | 3.48 | 0.74 | |
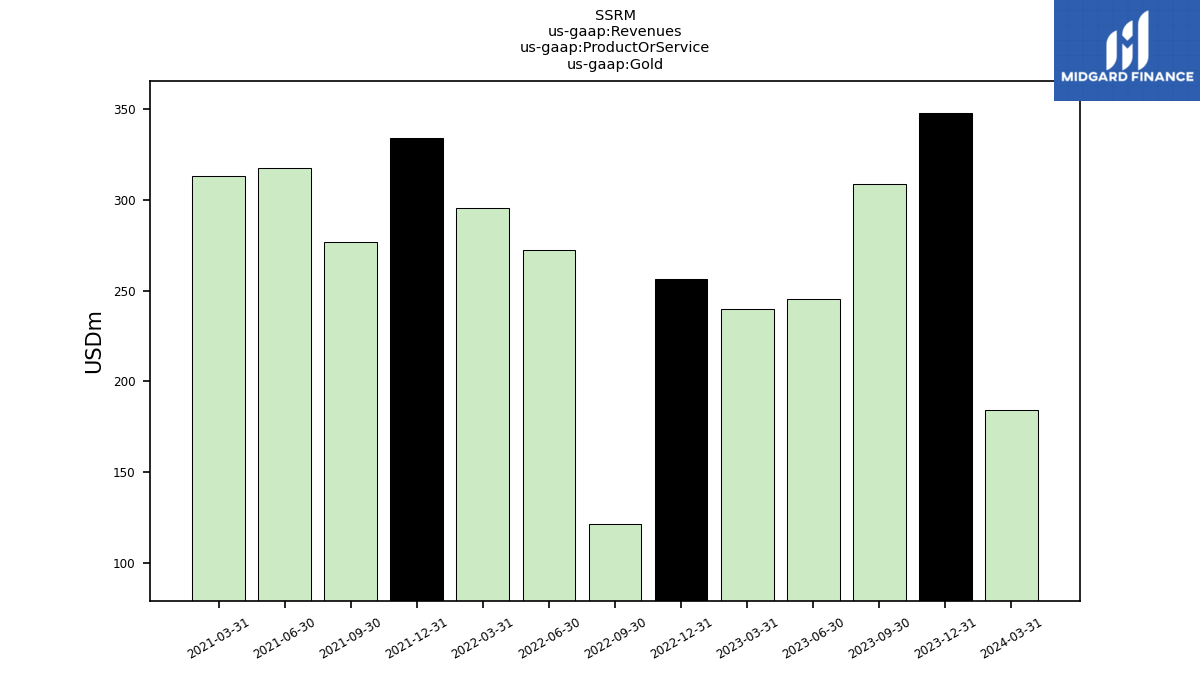
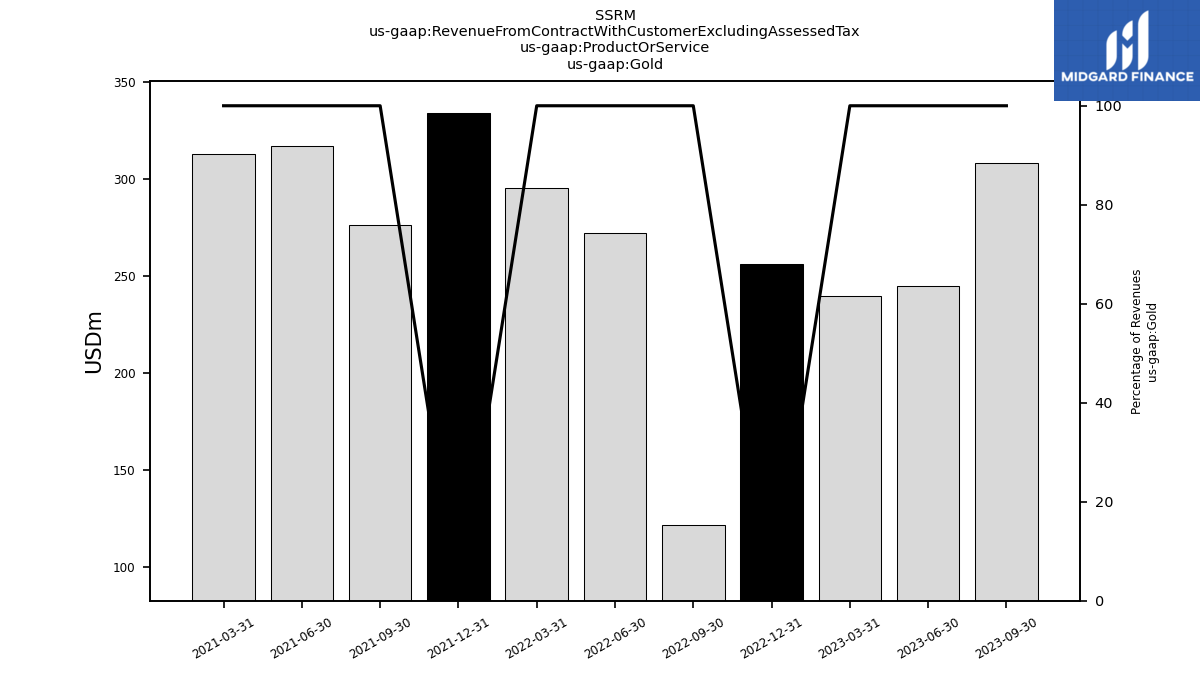
| Gold | 308.36 | 245.17 | 239.86 | 256.17 | 121.76 | 272.47 | 295.62 | 334.01 | 276.44 | 317.26 | 313.13 | |
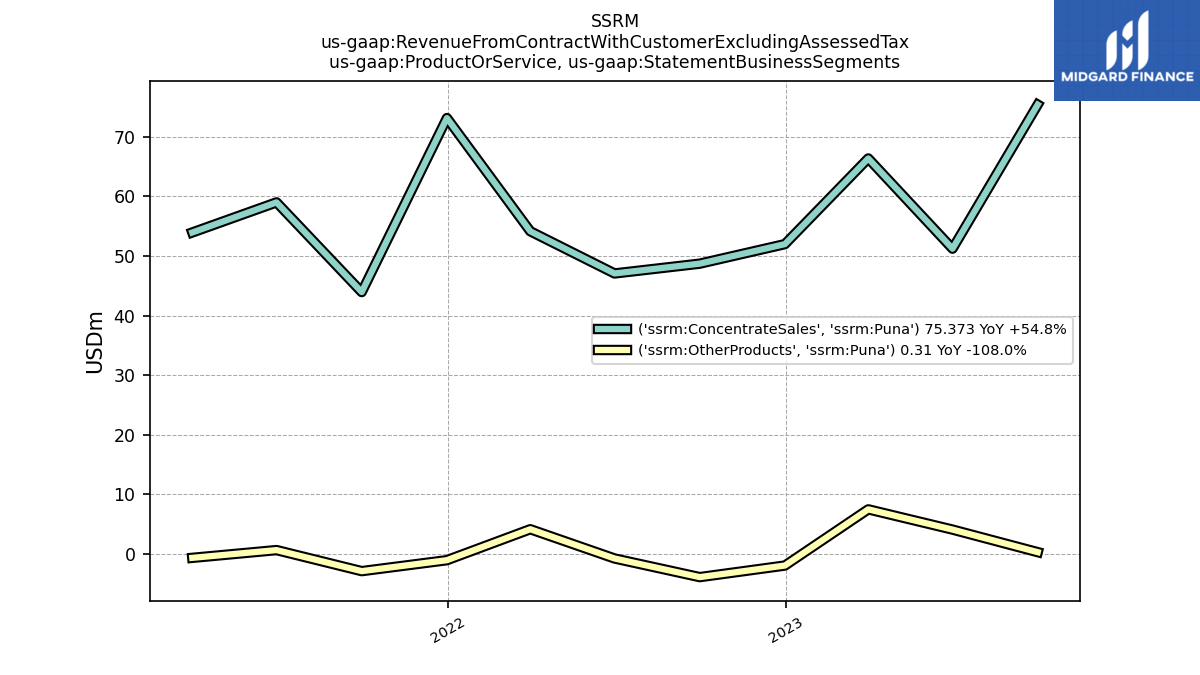
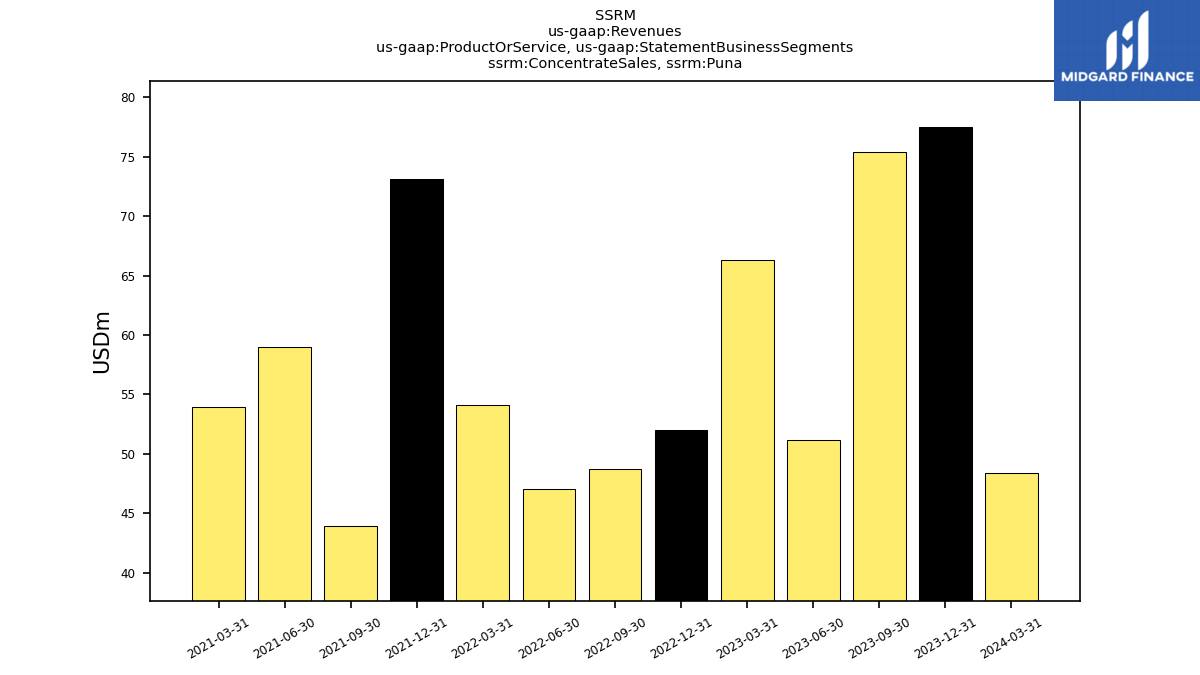
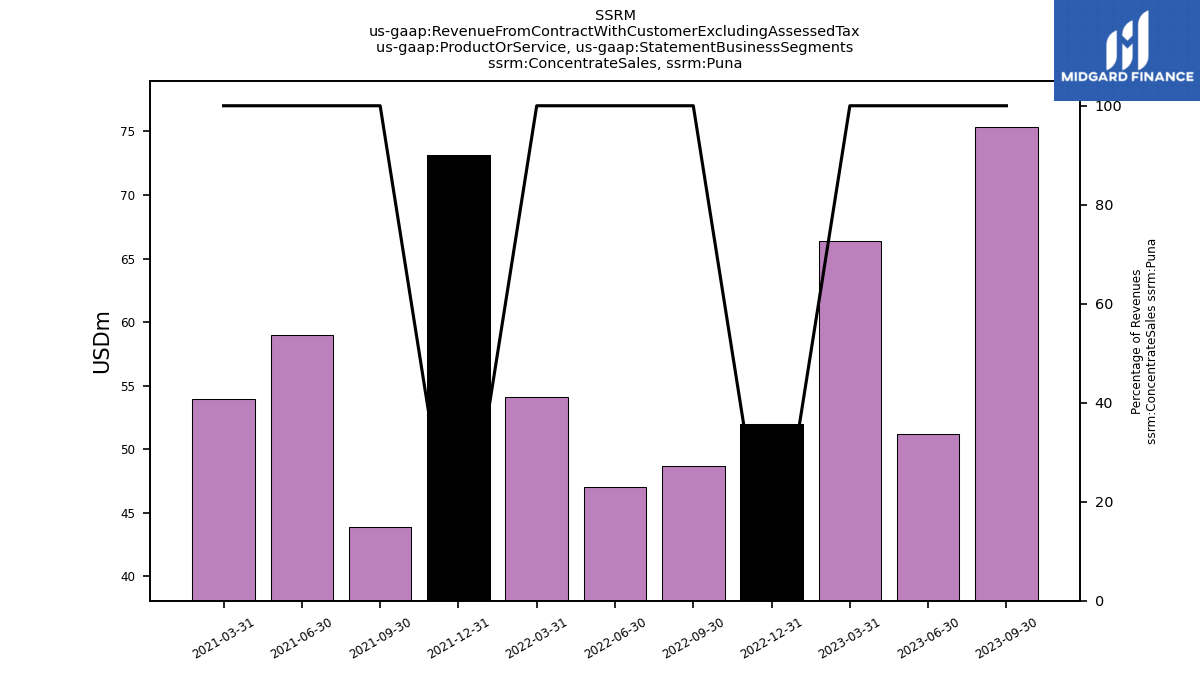
| Concentrate Sales, Puna | 75.37 | 51.21 | 66.35 | 51.98 | 48.70 | 47.05 | 54.13 | 73.12 | 43.93 | 58.98 | 53.93 | |
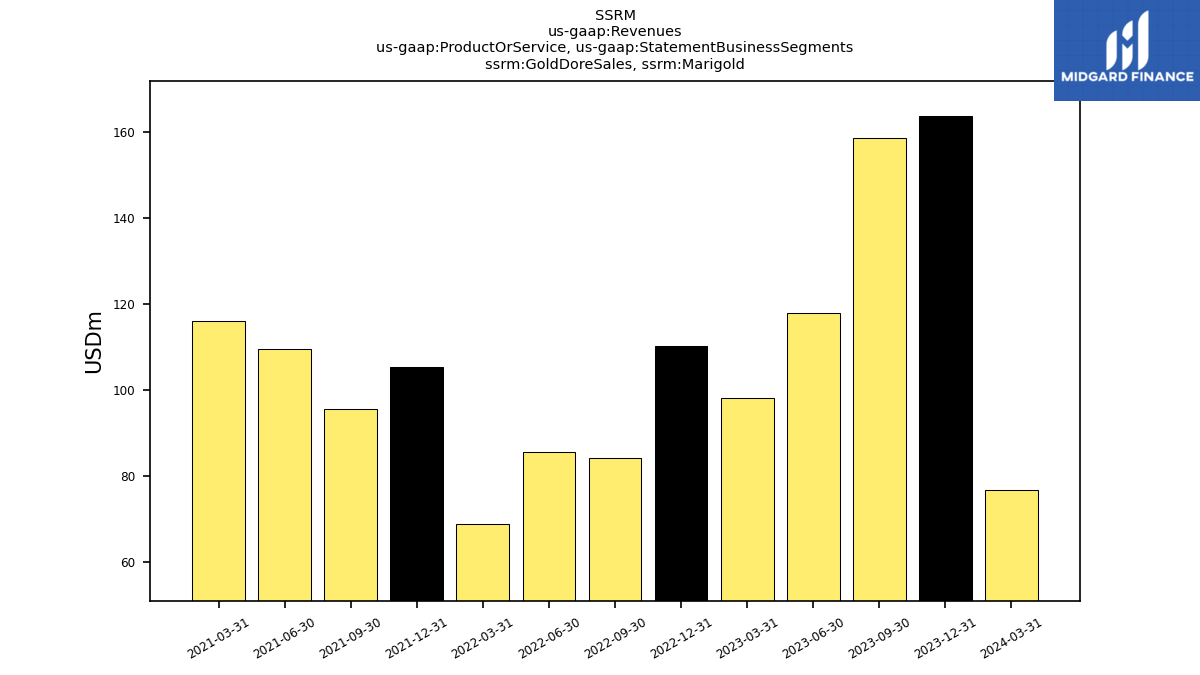
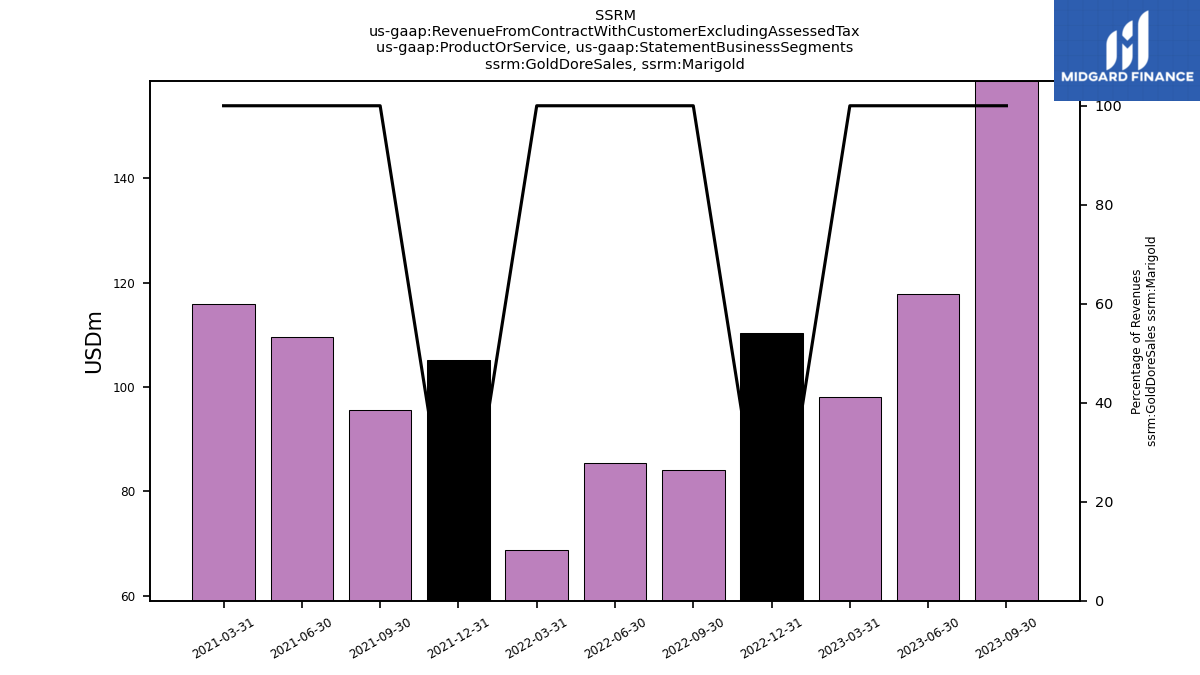
| Gold Dore Sales, Marigold | 158.59 | 117.77 | 98.13 | 110.25 | 84.18 | 85.40 | 68.85 | 105.25 | 95.59 | 109.51 | 115.94 | |
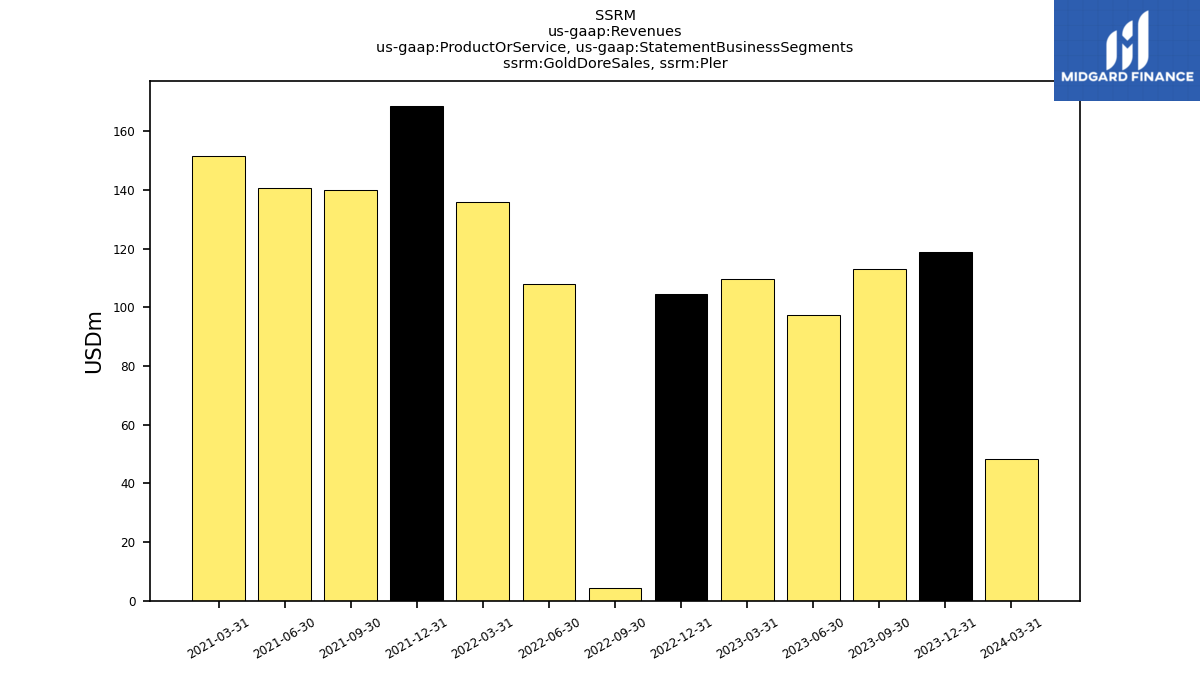
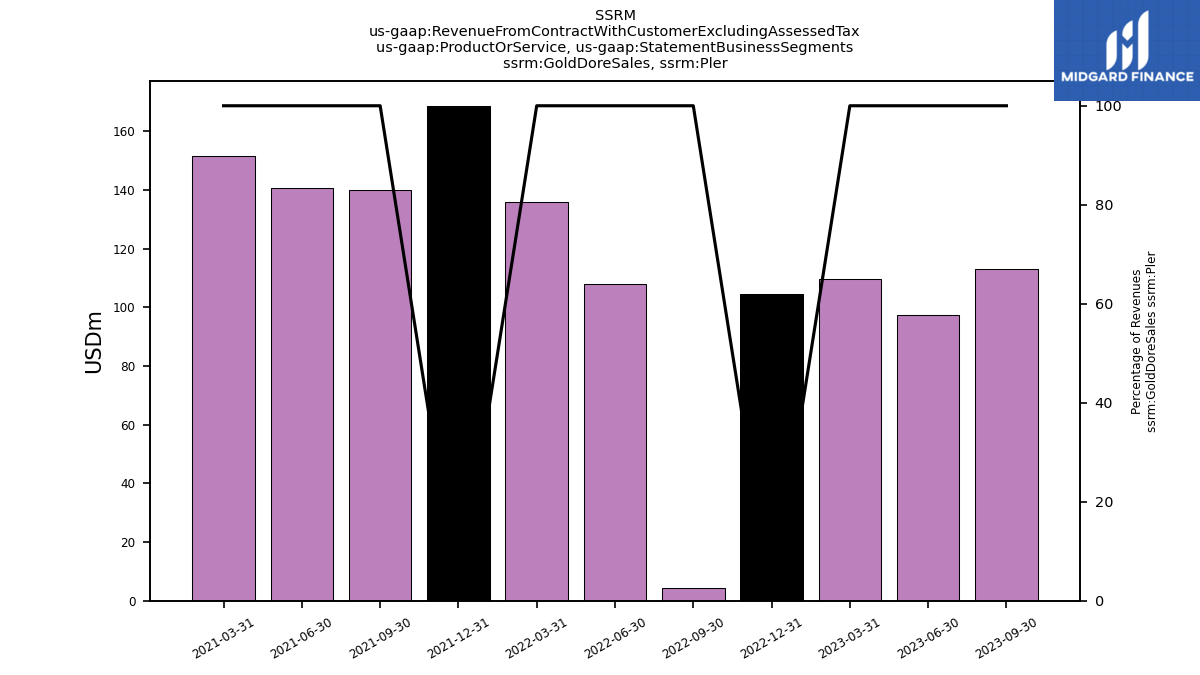
| Gold Dore Sales, Pler | 113.16 | 97.36 | 109.65 | 104.55 | 4.25 | 108.00 | 135.94 | 168.72 | 139.90 | 140.65 | 151.52 | |
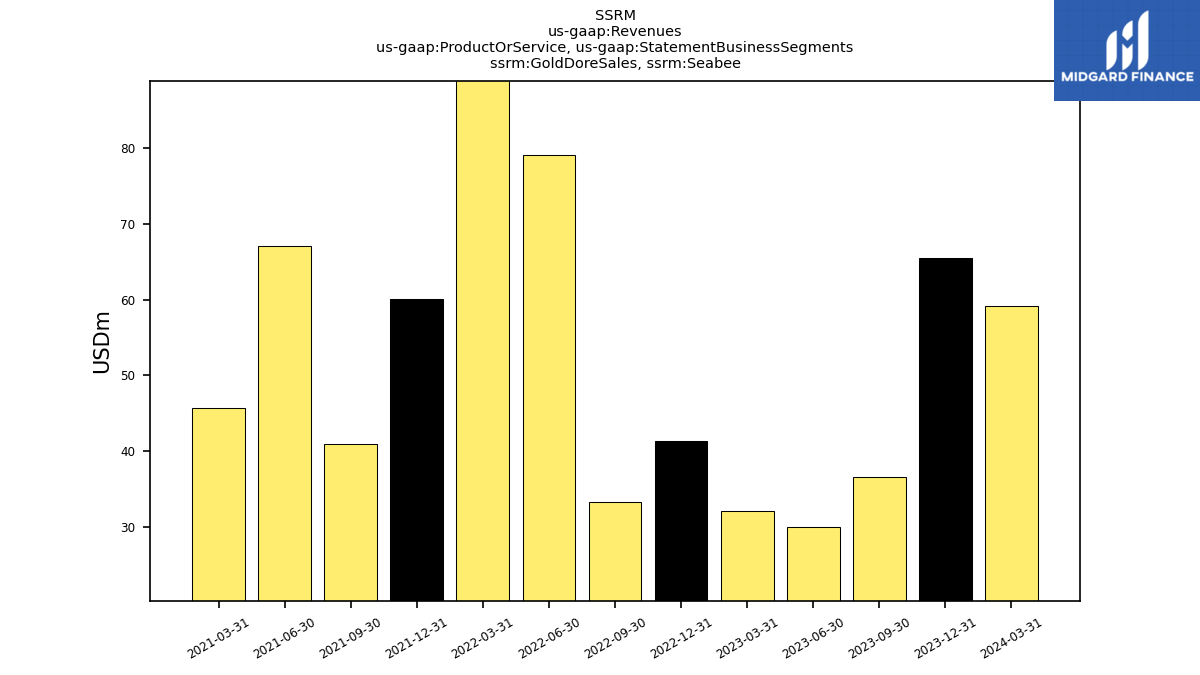
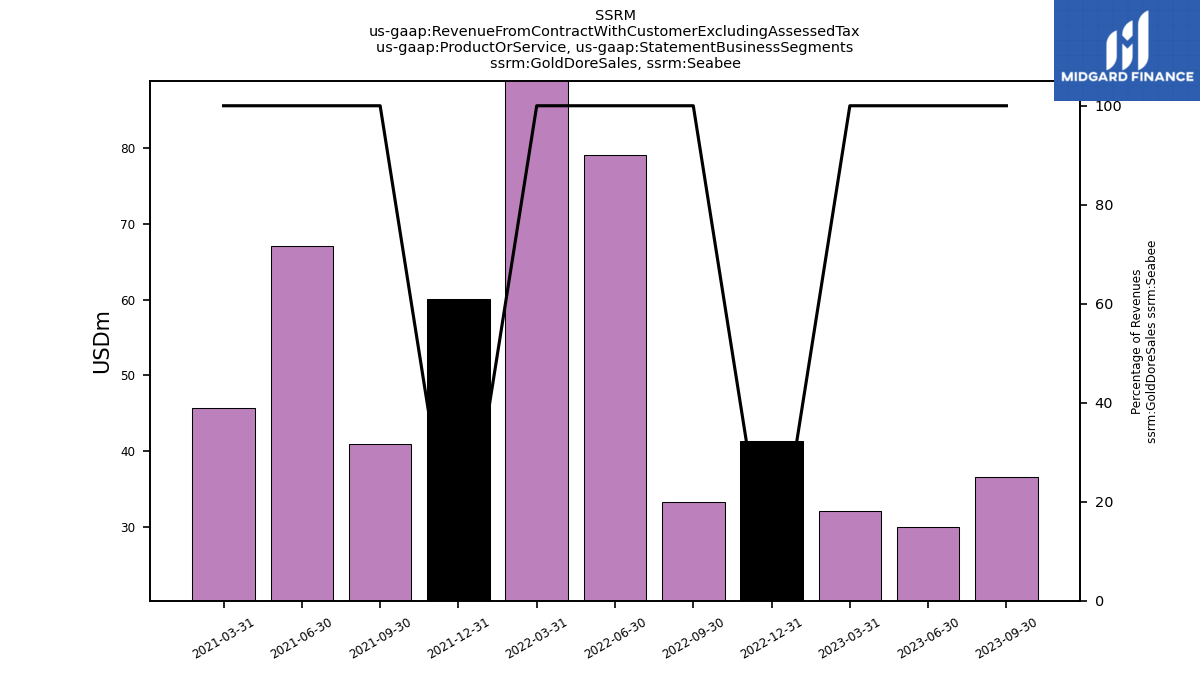
| Gold Dore Sales, Seabee | 36.61 | 30.04 | 32.08 | 41.37 | 33.33 | 79.07 | 90.82 | 60.05 | 40.95 | 67.10 | 45.68 | |
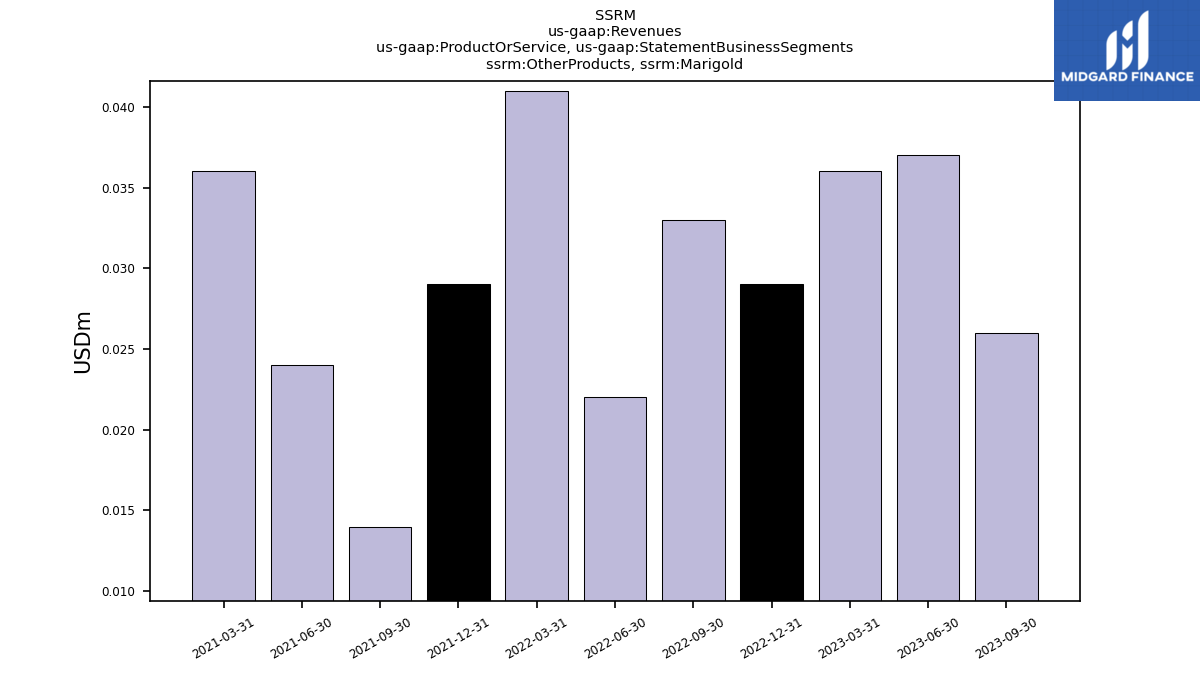
| Other Products, Marigold | 0.03 | 0.04 | 0.04 | 0.03 | 0.03 | 0.02 | 0.04 | 0.03 | 0.01 | 0.02 | 0.04 | |
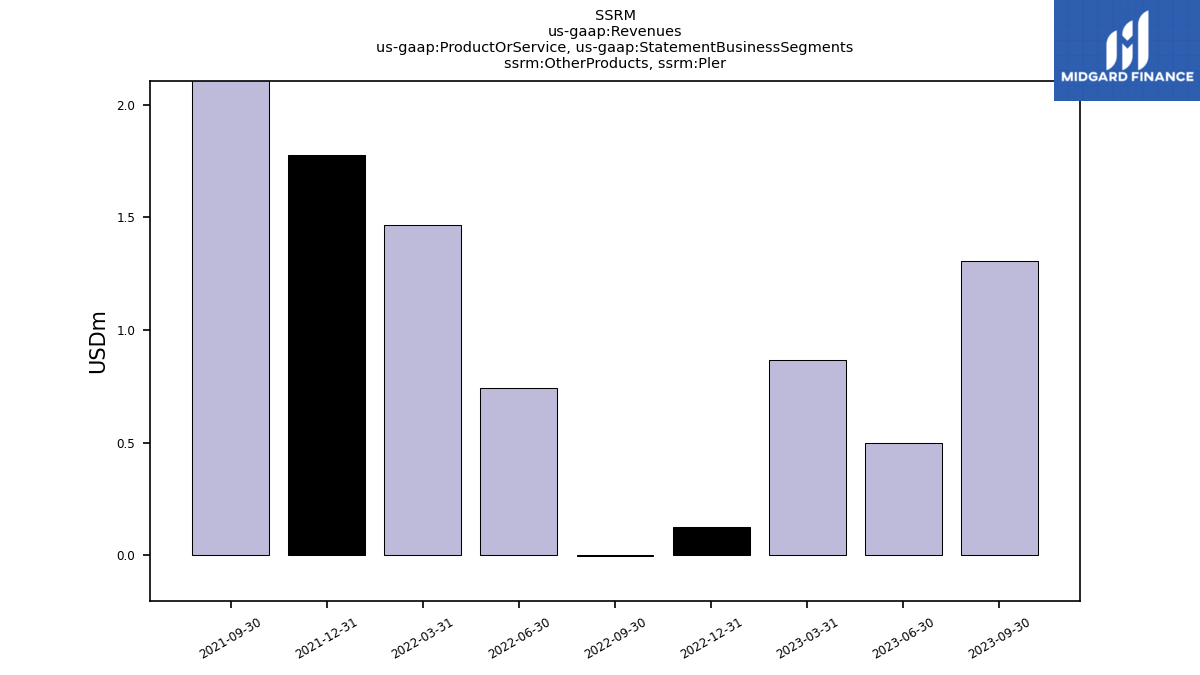
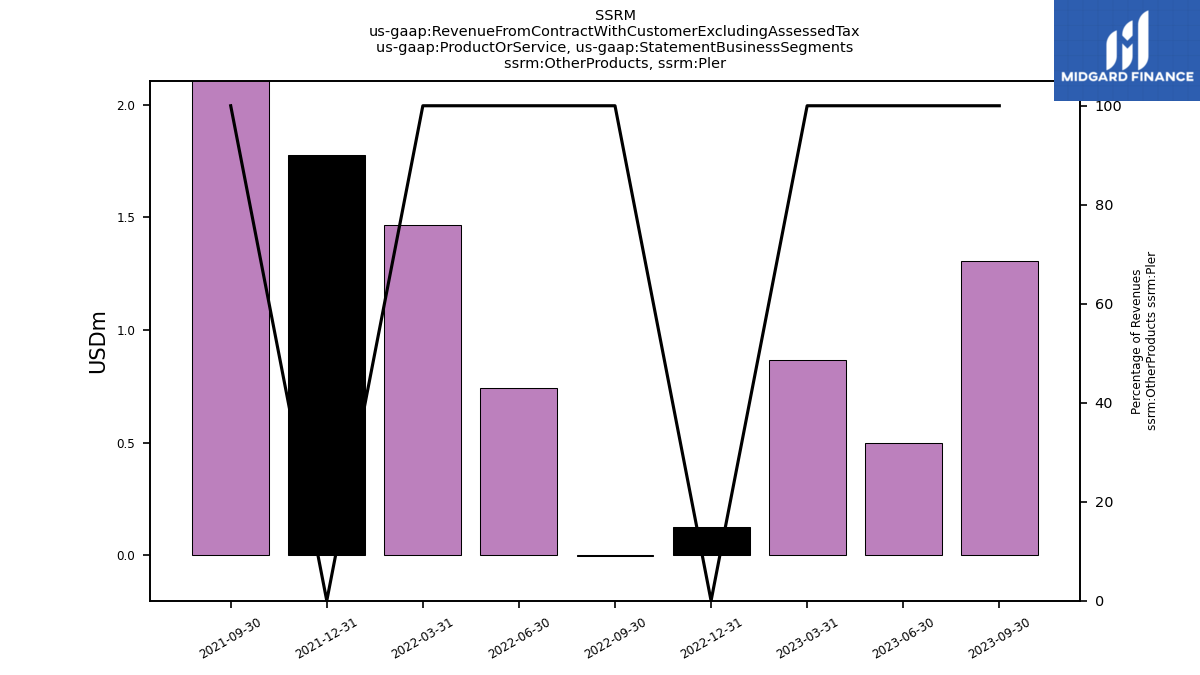
| Other Products, Pler | 1.31 | 0.50 | 0.87 | 0.13 | -0.01 | 0.74 | 1.46 | 1.77 | 5.32 | NA | NA | |
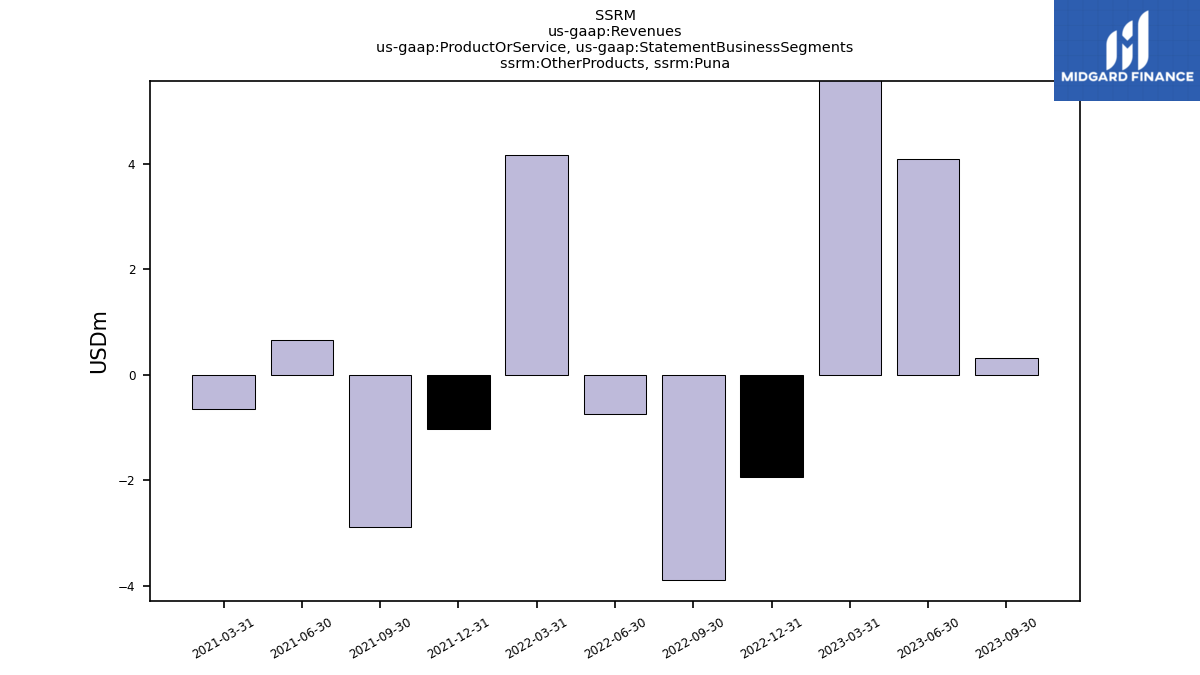
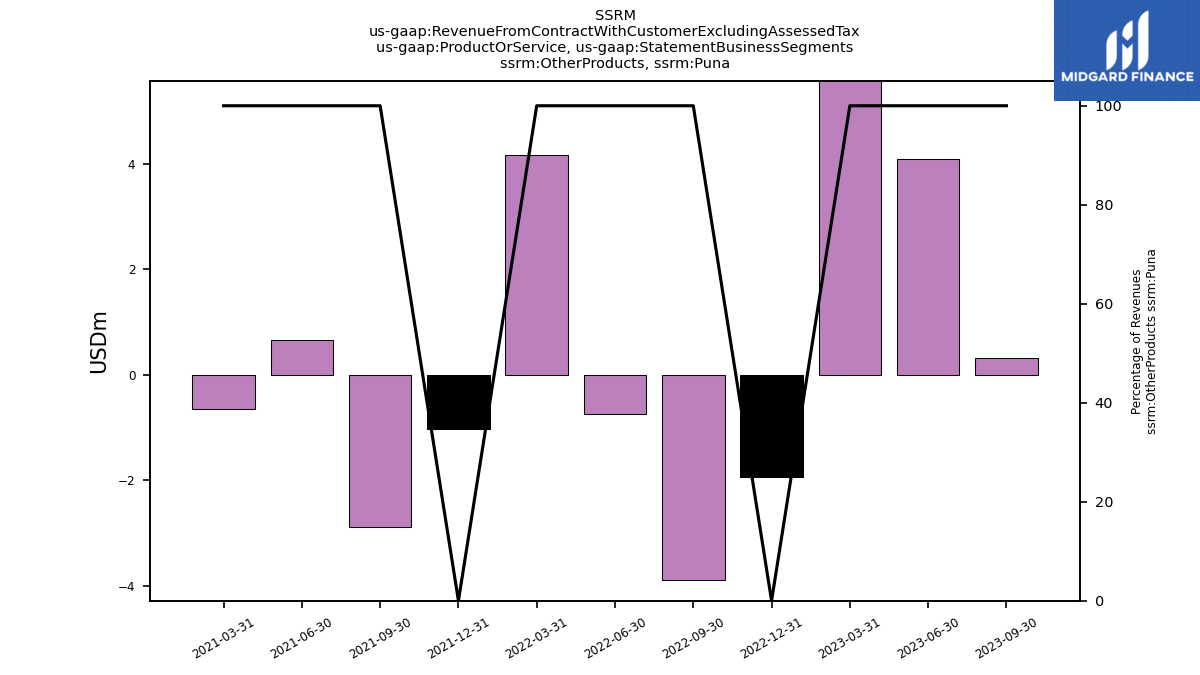
| Other Products, Puna | 0.31 | 4.09 | 7.49 | -1.94 | -3.88 | -0.75 | 4.16 | -1.04 | -2.87 | 0.66 | -0.65 | |
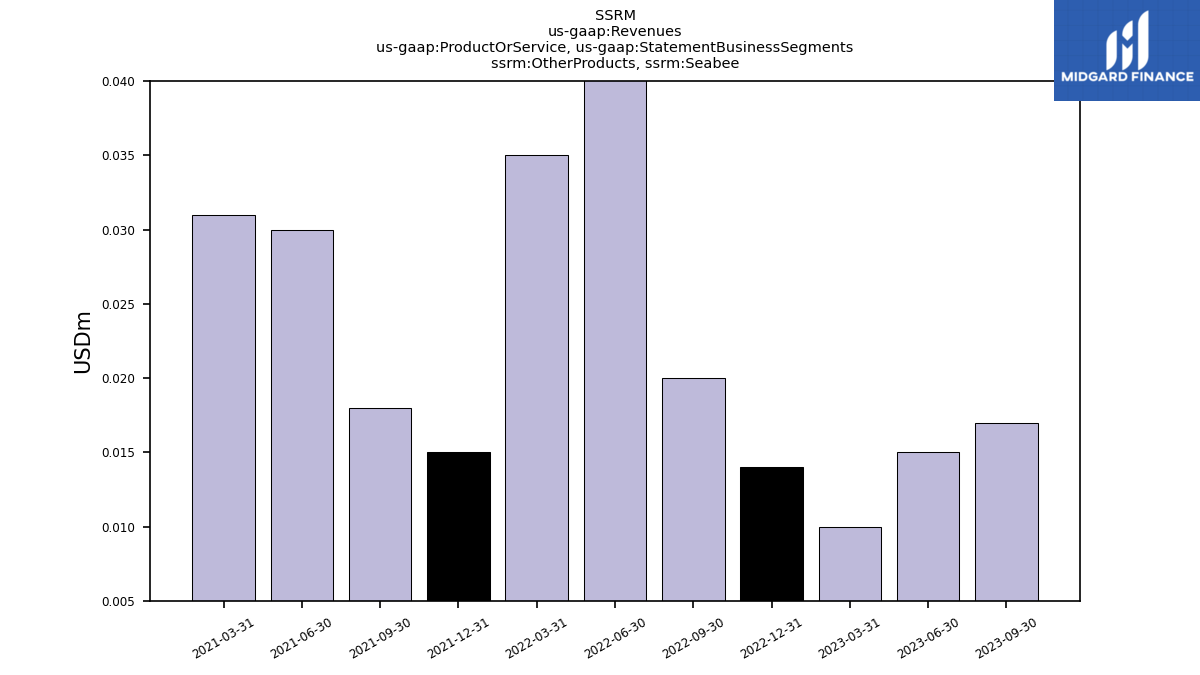
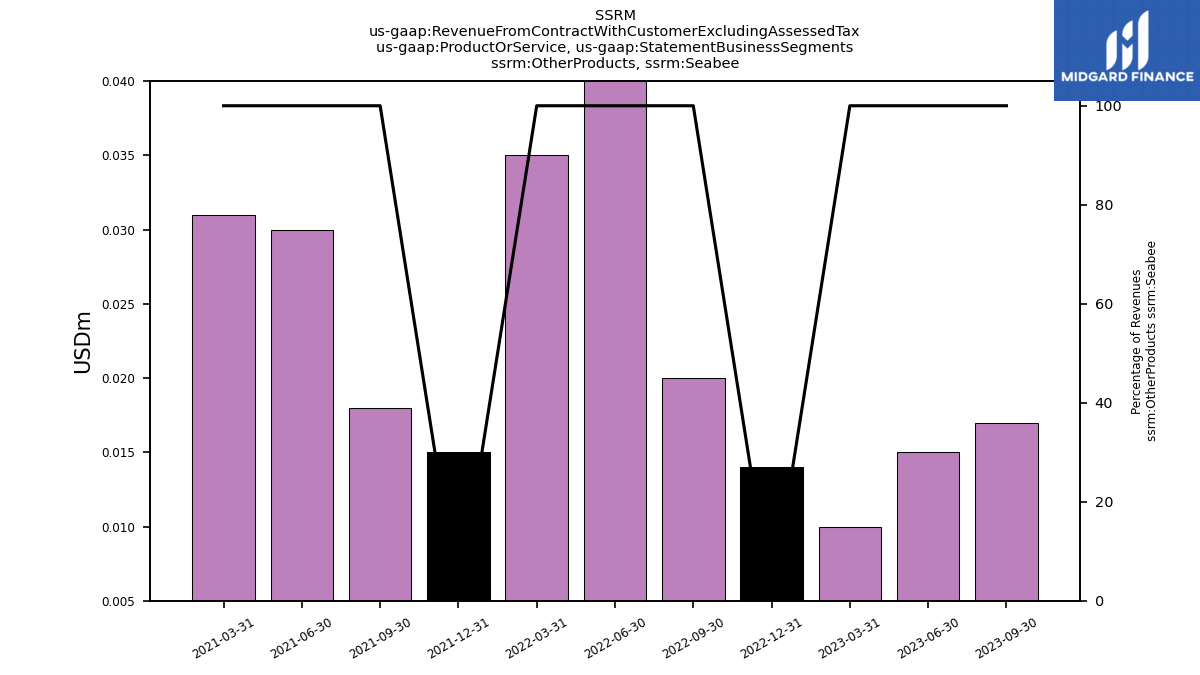
| Other Products, Seabee | 0.02 | 0.01 | 0.01 | 0.01 | 0.02 | 0.04 | 0.04 | 0.01 | 0.02 | 0.03 | 0.03 | |
| 75.68 | 55.31 | 73.84 | 50.04 | 44.82 | 46.30 | 58.29 | 72.09 | 41.06 | 59.64 | 53.28 | ||
| 36.62 | 30.06 | 32.09 | 41.38 | 33.35 | 79.11 | 90.86 | 60.06 | 40.97 | 67.13 | 45.71 | ||
| 114.46 | 97.86 | 110.51 | 104.67 | 4.25 | 108.74 | 137.41 | 170.49 | 145.22 | 140.65 | 151.52 | ||
| US | 158.62 | 117.81 | 98.17 | 110.28 | 84.22 | 85.42 | 68.89 | 105.28 | 95.61 | 109.53 | 115.97 | |
| Revenue From Contract With Customer Excluding Assessed Tax | 385.39 | 301.03 | 314.61 | 306.38 | 166.63 | 319.58 | 355.45 | 407.92 | 322.85 | 376.95 | 366.48 | |
| Operating, Marigold | 158.62 | 117.81 | 98.17 | 110.28 | 84.22 | 85.42 | 68.89 | 105.28 | 95.61 | 109.53 | 115.97 | |
| Operating, Pler | 114.46 | 97.86 | 110.51 | 104.67 | 4.25 | 108.74 | 137.41 | 170.49 | 145.22 | 140.65 | 151.52 | |
| Operating, Puna | 75.68 | 55.31 | 73.84 | 50.04 | 44.82 | 46.30 | 58.29 | 72.09 | 41.06 | 59.64 | 53.28 | |
| Operating, Seabee | 36.62 | 30.06 | 32.09 | 41.38 | 33.35 | 79.11 | 90.86 | 60.06 | 40.97 | 67.13 | 45.71 | |
| Lead | 11.40 | 9.26 | 12.78 | 9.13 | 8.37 | 6.17 | 13.86 | 14.81 | 4.92 | 8.17 | 5.17 | |
| Other Metals | NA | NA | NA | -1.76 | -3.83 | 0.06 | 5.70 | 0.78 | 2.48 | 0.71 | -0.58 | |
| Other Revenue From Metals | 1.66 | 4.65 | 8.40 | NA | -3.83 | 0.06 | 5.70 | NA | NA | NA | NA | |
| Silver | 62.70 | 40.93 | 49.12 | 41.24 | 39.34 | 38.74 | 33.97 | 51.54 | 36.50 | 47.33 | 48.01 | |
| Zinc | 1.27 | 1.02 | 4.46 | 1.61 | 0.99 | 2.15 | 6.31 | 6.77 | 2.51 | 3.48 | 0.74 | |
| Gold | 308.36 | 245.17 | 239.86 | 256.17 | 121.76 | 272.47 | 295.62 | 334.01 | 276.44 | 317.26 | 313.13 | |
| Concentrate Sales, Puna | 75.37 | 51.21 | 66.35 | 51.98 | 48.70 | 47.05 | 54.13 | 73.12 | 43.93 | 58.98 | 53.93 | |
| Gold Dore Sales, Marigold | 158.59 | 117.77 | 98.13 | 110.25 | 84.18 | 85.40 | 68.85 | 105.25 | 95.59 | 109.51 | 115.94 | |
| Gold Dore Sales, Pler | 113.16 | 97.36 | 109.65 | 104.55 | 4.25 | 108.00 | 135.94 | 168.72 | 139.90 | 140.65 | 151.52 | |
| Gold Dore Sales, Seabee | 36.61 | 30.04 | 32.08 | 41.37 | 33.33 | 79.07 | 90.82 | 60.05 | 40.95 | 67.10 | 45.68 | |
| Other Products, Marigold | 0.03 | 0.04 | 0.04 | 0.03 | 0.03 | 0.02 | 0.04 | 0.03 | 0.01 | 0.02 | 0.04 | |
| Other Products, Pler | 1.31 | 0.50 | 0.87 | 0.13 | -0.01 | 0.74 | 1.46 | 1.77 | 5.32 | NA | NA | |
| Other Products, Puna | 0.31 | 4.09 | 7.49 | -1.94 | -3.88 | -0.75 | 4.16 | -1.04 | -2.87 | 0.66 | -0.65 | |
| Other Products, Seabee | 0.02 | 0.01 | 0.01 | 0.01 | 0.02 | 0.04 | 0.04 | 0.01 | 0.02 | 0.03 | 0.03 | |
| 75.68 | 55.31 | 73.84 | 50.04 | 44.82 | 46.30 | 58.29 | 72.09 | 41.06 | 59.64 | 53.28 | ||
| 36.62 | 30.06 | 32.09 | 41.38 | 33.35 | 79.11 | 90.86 | 60.06 | 40.97 | 67.13 | 45.71 | ||
| 114.46 | 97.86 | 110.51 | 104.67 | 4.25 | 108.74 | 137.41 | 170.49 | 145.22 | 140.65 | 151.52 | ||
| US | 158.62 | 117.81 | 98.17 | 110.28 | 84.22 | 85.42 | 68.89 | 105.28 | 95.61 | 109.53 | 115.97 |


