
| 2024-03-31 | 2023-12-31 | 2023-09-30 | 2023-06-30 | 2023-03-31 | 2022-12-31 | 2022-09-30 | 2022-06-30 | 2022-03-31 | 2021-12-31 | 2021-09-30 | 2021-06-30 | 2021-03-31 | 2020-12-31 | 2020-09-30 | 2020-06-30 | 2020-03-31 | 2019-12-31 | 2019-09-30 | 2019-06-30 | 2019-03-31 | 2018-12-31 | 2018-09-30 | 2018-06-30 | 2018-03-31 | 2017-12-31 | 2017-09-30 | 2017-06-30 | 2017-03-31 | 2016-12-31 | 2016-09-30 | 2016-06-30 | 2016-03-31 | 2015-12-31 | 2015-09-30 | 2015-06-30 | 2015-03-31 | 2014-12-31 | 2014-09-30 | 2014-06-30 | 2014-03-31 | 2013-12-31 | 2013-09-30 | 2013-06-30 | 2013-03-31 | 2013-03-30 | 2012-12-31 | 2012-09-30 | 2012-06-30 | 2012-03-31 | 2011-12-31 | 2011-09-30 | 2011-06-30 | 2011-03-31 | 2010-12-31 | 2010-09-30 | 2010-06-30 | 2010-03-31 | ||
|---|---|---|---|---|---|---|---|---|---|---|---|---|---|---|---|---|---|---|---|---|---|---|---|---|---|---|---|---|---|---|---|---|---|---|---|---|---|---|---|---|---|---|---|---|---|---|---|---|---|---|---|---|---|---|---|---|---|---|---|
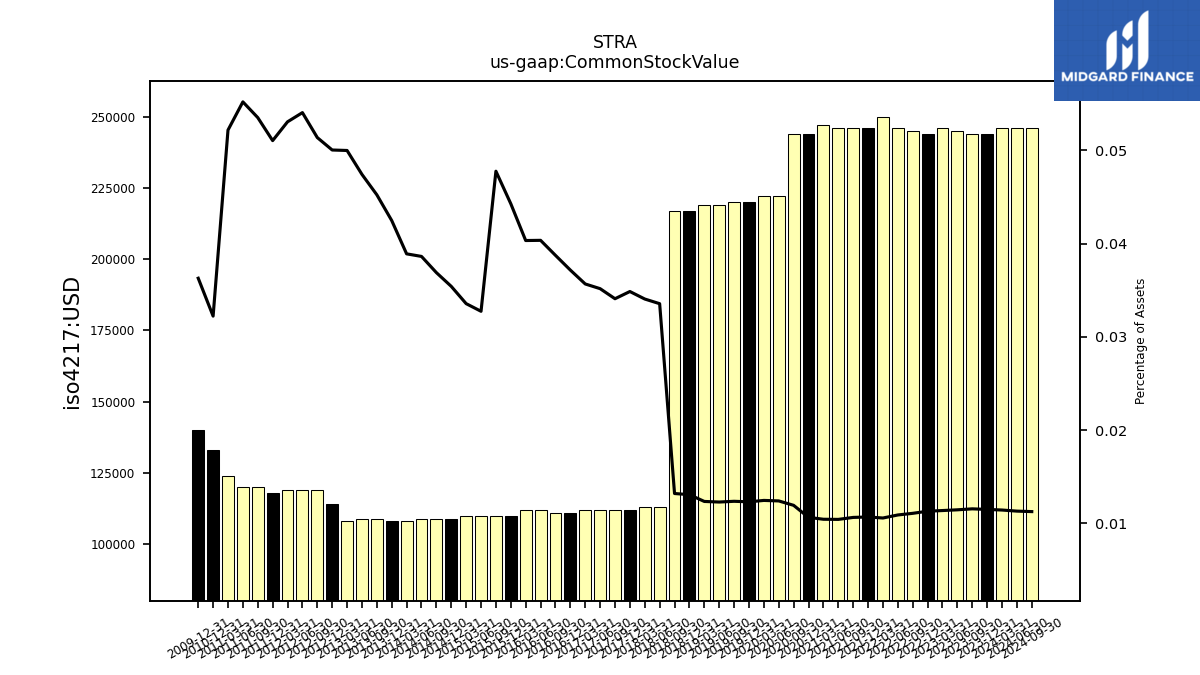
| Common Stock Value | 0.25 | 0.24 | 0.24 | 0.24 | 0.25 | 0.24 | 0.24 | 0.25 | 0.25 | 0.25 | 0.25 | 0.25 | 0.25 | 0.24 | 0.24 | 0.22 | 0.22 | 0.22 | 0.22 | 0.22 | 0.22 | 0.22 | 0.22 | 0.11 | 0.11 | 0.11 | 0.11 | 0.11 | 0.11 | 0.11 | 0.11 | 0.11 | 0.11 | 0.11 | 0.11 | 0.11 | 0.11 | 0.11 | 0.11 | 0.11 | 0.11 | 0.11 | 0.11 | 0.11 | 0.11 | NA | 0.11 | 0.12 | 0.12 | 0.12 | 0.12 | 0.12 | 0.12 | 0.12 | 0.13 | NA | NA | NA | |
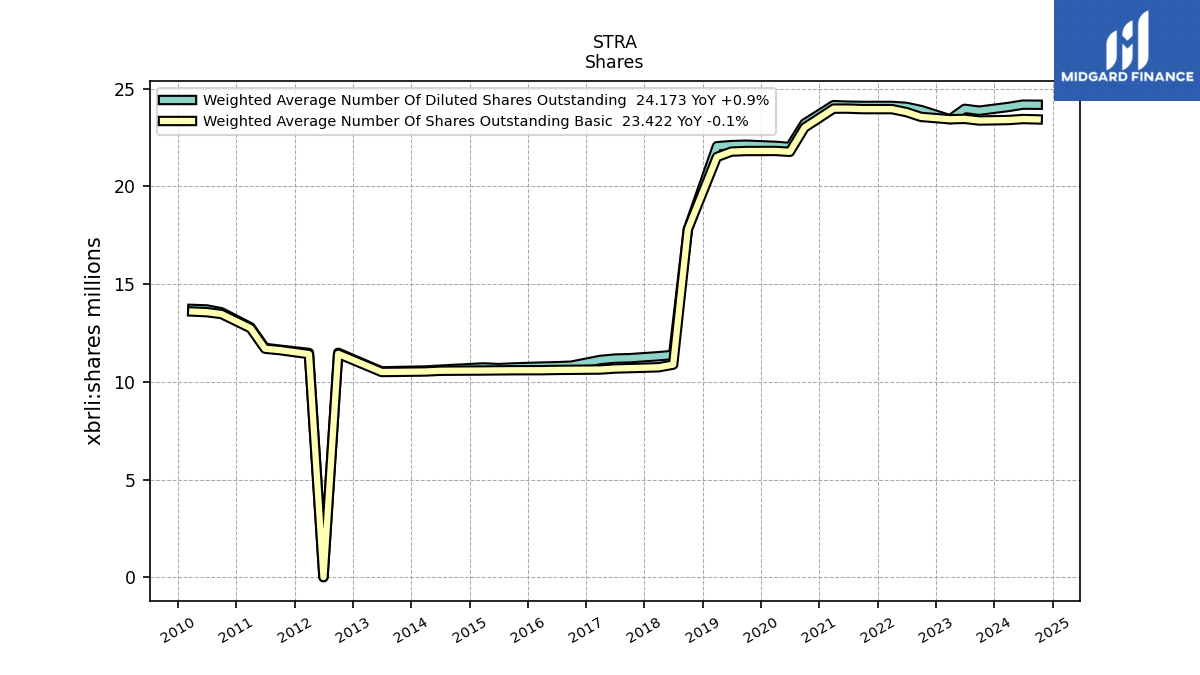
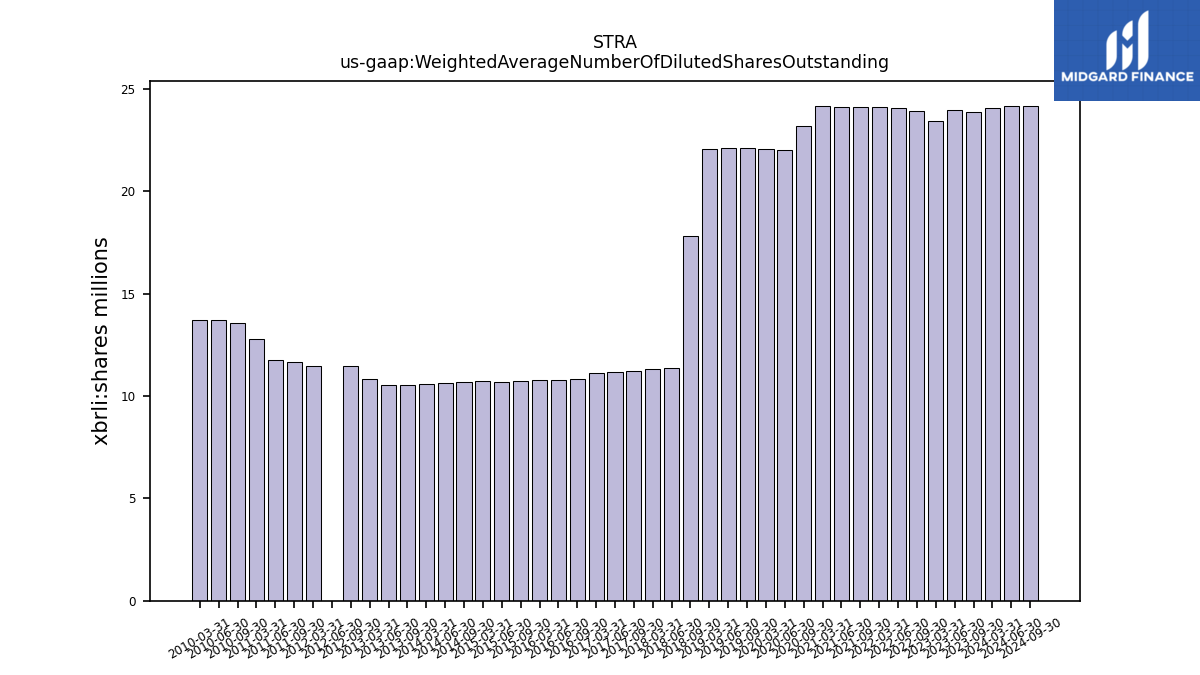
| Weighted Average Number Of Diluted Shares Outstanding | 24.06 | NA | 23.87 | 23.96 | 23.43 | NA | 23.90 | 24.06 | 24.11 | NA | 24.11 | 24.13 | 24.15 | NA | 23.21 | 22.01 | 22.07 | NA | 22.13 | 22.11 | 22.05 | NA | 17.80 | 11.38 | 11.31 | NA | 11.21 | 11.19 | 11.12 | NA | 10.83 | 10.80 | 10.78 | NA | 10.74 | 10.71 | 10.74 | NA | 10.66 | 10.62 | 10.58 | NA | 10.55 | 10.54 | 10.85 | NA | NA | 11.49 | 0.01 | 11.48 | NA | 11.65 | 11.74 | 12.79 | NA | 13.56 | 13.70 | 13.73 | |
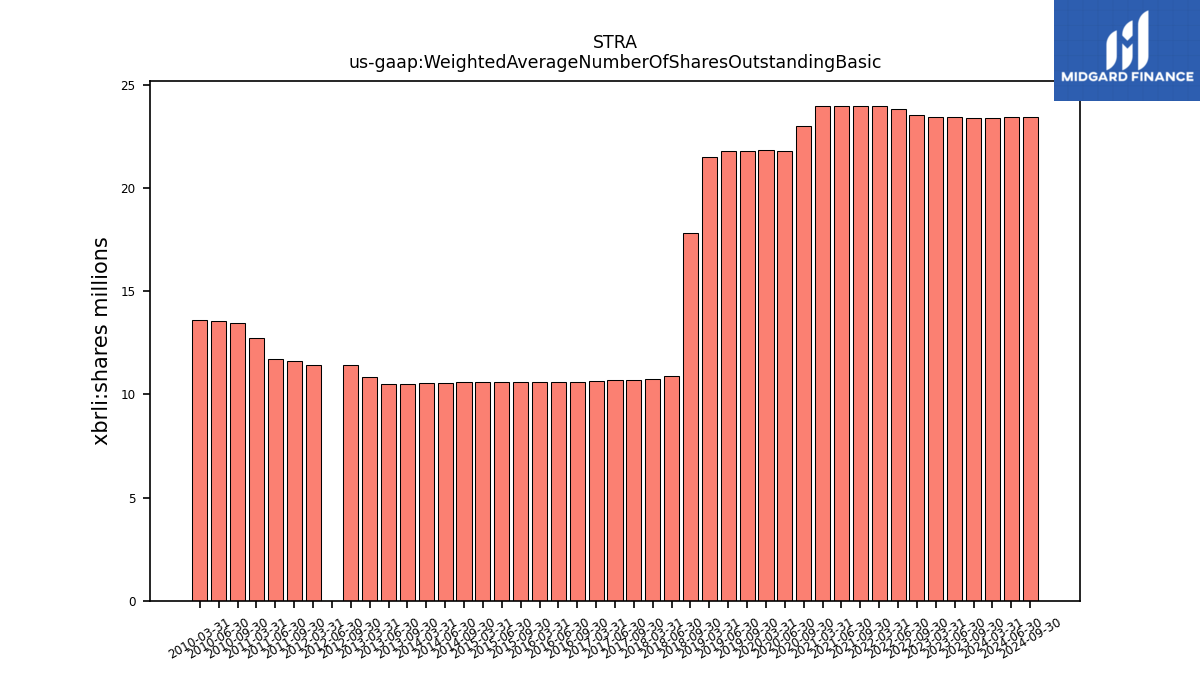
| Weighted Average Number Of Shares Outstanding Basic | 23.39 | NA | 23.36 | 23.45 | 23.43 | NA | 23.55 | 23.80 | 23.95 | NA | 23.95 | 23.98 | 23.97 | NA | 23.00 | 21.76 | 21.81 | NA | 21.81 | 21.78 | 21.50 | NA | 17.80 | 10.88 | 10.74 | NA | 10.70 | 10.68 | 10.63 | NA | 10.62 | 10.61 | 10.60 | NA | 10.59 | 10.59 | 10.58 | NA | 10.57 | 10.56 | 10.53 | NA | 10.51 | 10.50 | 10.81 | NA | NA | 11.43 | 0.01 | 11.42 | NA | 11.62 | 11.69 | 12.74 | NA | 13.47 | 13.56 | 13.60 | |
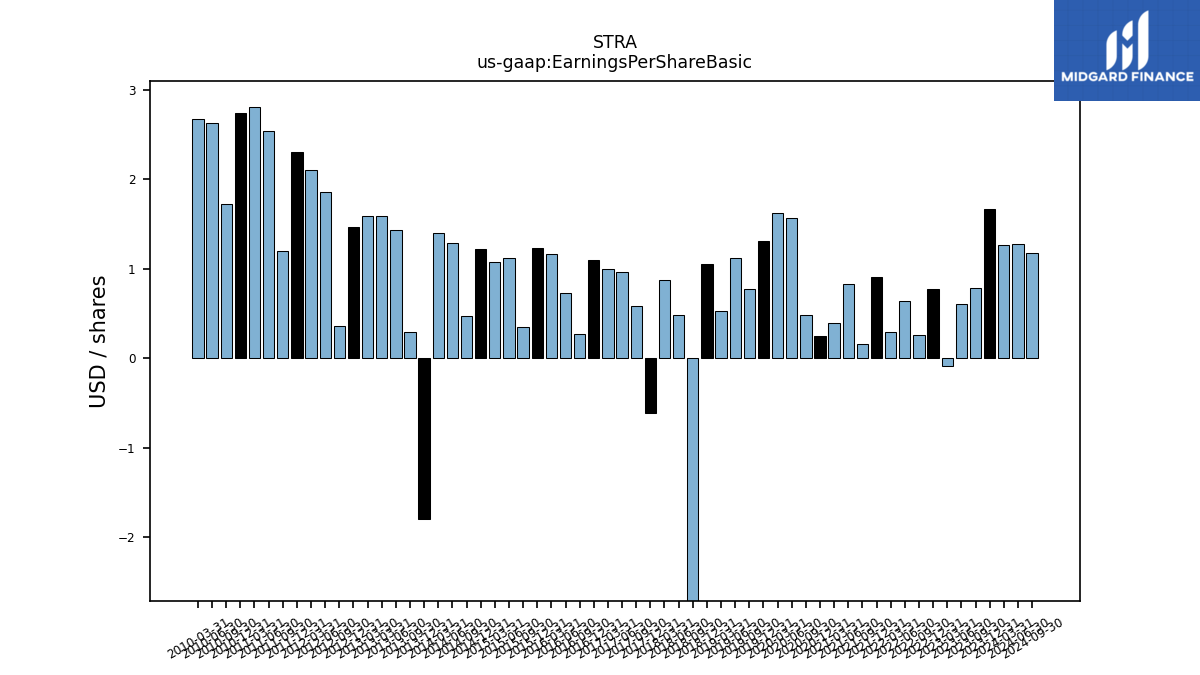
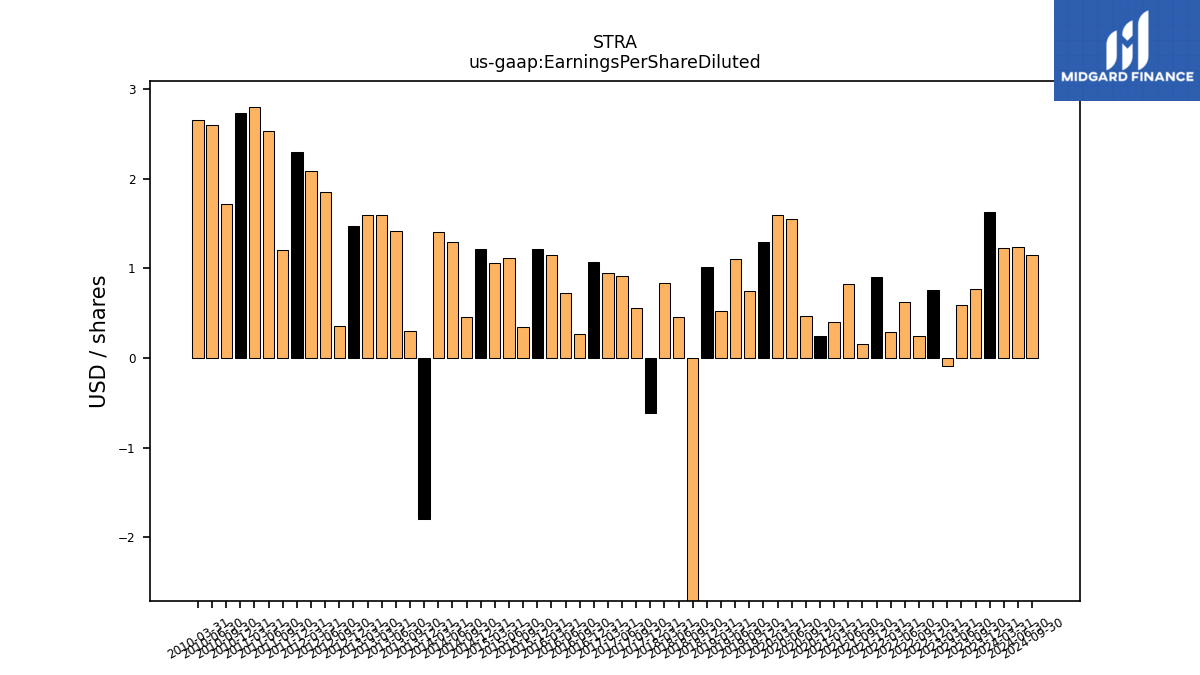
| Earnings Per Share Basic | 1.27 | 1.67 | 0.79 | 0.61 | -0.09 | 0.78 | 0.26 | 0.64 | 0.29 | 0.91 | 0.16 | 0.83 | 0.40 | 0.25 | 0.48 | 1.57 | 1.62 | 1.31 | 0.77 | 1.12 | 0.53 | 1.05 | -2.97 | 0.48 | 0.88 | -0.61 | 0.58 | 0.96 | 1.00 | 1.10 | 0.27 | 0.73 | 1.17 | 1.23 | 0.35 | 1.12 | 1.08 | 1.22 | 0.47 | 1.29 | 1.40 | -1.80 | 0.30 | 1.43 | 1.59 | 1.59 | 1.47 | 0.36 | 1.86 | 2.10 | 2.31 | 1.20 | 2.54 | 2.81 | 2.74 | 1.73 | 2.63 | 2.68 | |
| Earnings Per Share Diluted | 1.23 | 1.63 | 0.77 | 0.59 | -0.09 | 0.76 | 0.25 | 0.63 | 0.29 | 0.90 | 0.16 | 0.83 | 0.40 | 0.25 | 0.47 | 1.55 | 1.60 | 1.29 | 0.75 | 1.10 | 0.52 | 1.02 | -2.97 | 0.46 | 0.84 | -0.61 | 0.56 | 0.92 | 0.95 | 1.07 | 0.27 | 0.72 | 1.15 | 1.21 | 0.35 | 1.11 | 1.06 | 1.21 | 0.46 | 1.29 | 1.40 | -1.80 | 0.30 | 1.42 | 1.59 | 1.59 | 1.47 | 0.36 | 1.85 | 2.09 | 2.30 | 1.20 | 2.53 | 2.80 | 2.73 | 1.72 | 2.60 | 2.65 |
| 2024-03-31 | 2023-12-31 | 2023-09-30 | 2023-06-30 | 2023-03-31 | 2022-12-31 | 2022-09-30 | 2022-06-30 | 2022-03-31 | 2021-12-31 | 2021-09-30 | 2021-06-30 | 2021-03-31 | 2020-12-31 | 2020-09-30 | 2020-06-30 | 2020-03-31 | 2019-12-31 | 2019-09-30 | 2019-06-30 | 2019-03-31 | 2018-12-31 | 2018-09-30 | 2018-06-30 | 2018-03-31 | 2017-12-31 | 2017-09-30 | 2017-06-30 | 2017-03-31 | 2016-12-31 | 2016-09-30 | 2016-06-30 | 2016-03-31 | 2015-12-31 | 2015-09-30 | 2015-06-30 | 2015-03-31 | 2014-12-31 | 2014-09-30 | 2014-06-30 | 2014-03-31 | 2013-12-31 | 2013-09-30 | 2013-06-30 | 2013-03-31 | 2013-03-30 | 2012-12-31 | 2012-09-30 | 2012-06-30 | 2012-03-31 | 2011-12-31 | 2011-09-30 | 2011-06-30 | 2011-03-31 | 2010-12-31 | 2010-09-30 | 2010-06-30 | 2010-03-31 | ||
|---|---|---|---|---|---|---|---|---|---|---|---|---|---|---|---|---|---|---|---|---|---|---|---|---|---|---|---|---|---|---|---|---|---|---|---|---|---|---|---|---|---|---|---|---|---|---|---|---|---|---|---|---|---|---|---|---|---|---|---|
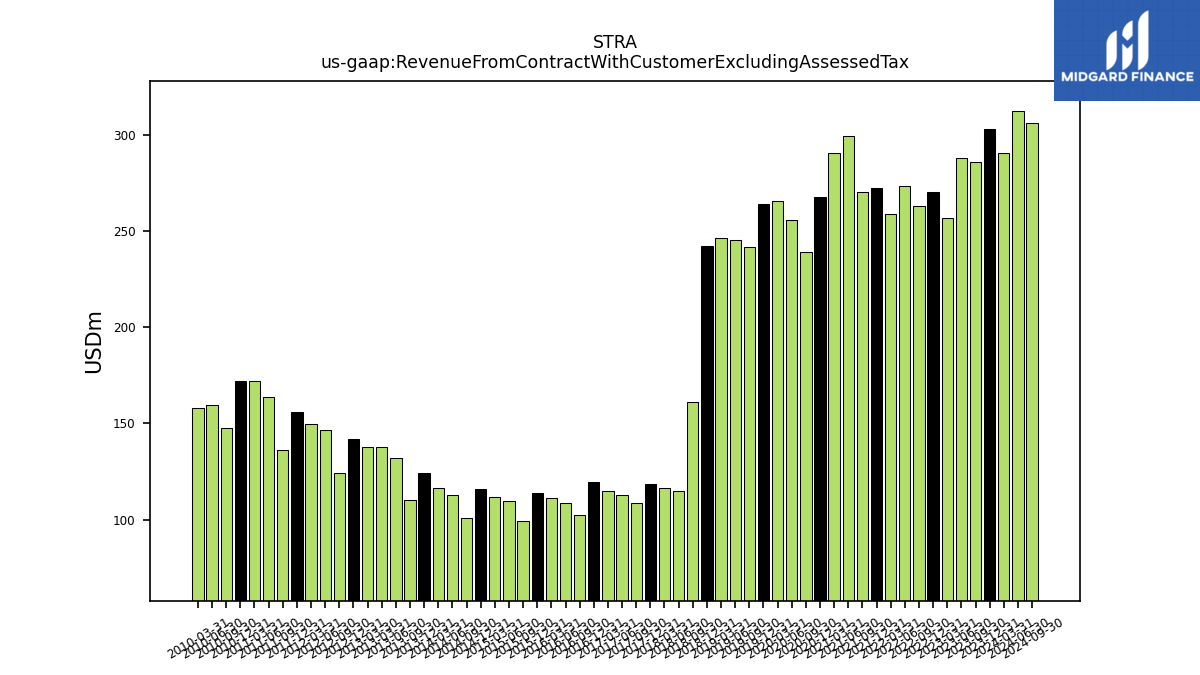
| Revenue From Contract With Customer Excluding Assessed Tax | 290.25 | 302.70 | 285.94 | 287.68 | 256.61 | 269.94 | 263.12 | 273.56 | 258.86 | 272.10 | 270.08 | 299.17 | 290.34 | 267.49 | 239.03 | 255.83 | 265.30 | 263.77 | 241.75 | 245.11 | 246.51 | 242.10 | 160.94 | 114.67 | 116.47 | 118.71 | 108.51 | 112.72 | 114.91 | 119.28 | 102.16 | 108.49 | 111.17 | 113.66 | 99.14 | 109.75 | 111.89 | 116.07 | 100.76 | 112.75 | 116.47 | 124.08 | 110.03 | 131.98 | 137.51 | 137.51 | 141.93 | 124.26 | 146.25 | 149.53 | 155.82 | 135.87 | 163.79 | 171.96 | 171.95 | 147.60 | 159.28 | 157.90 | |
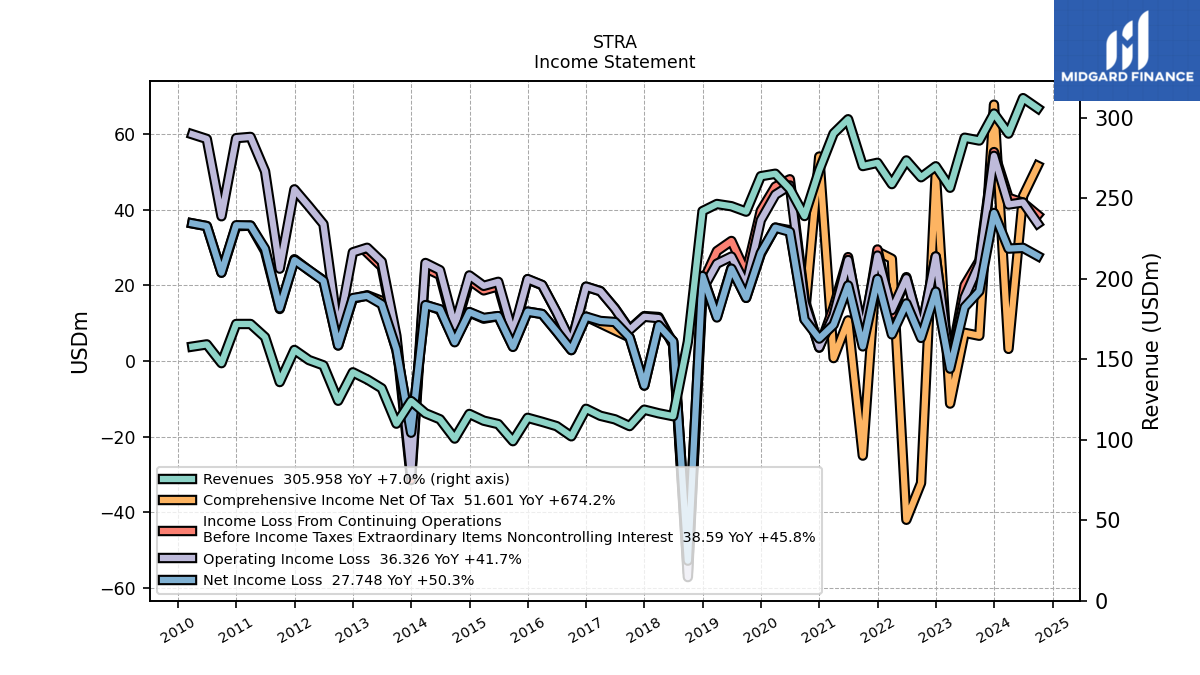
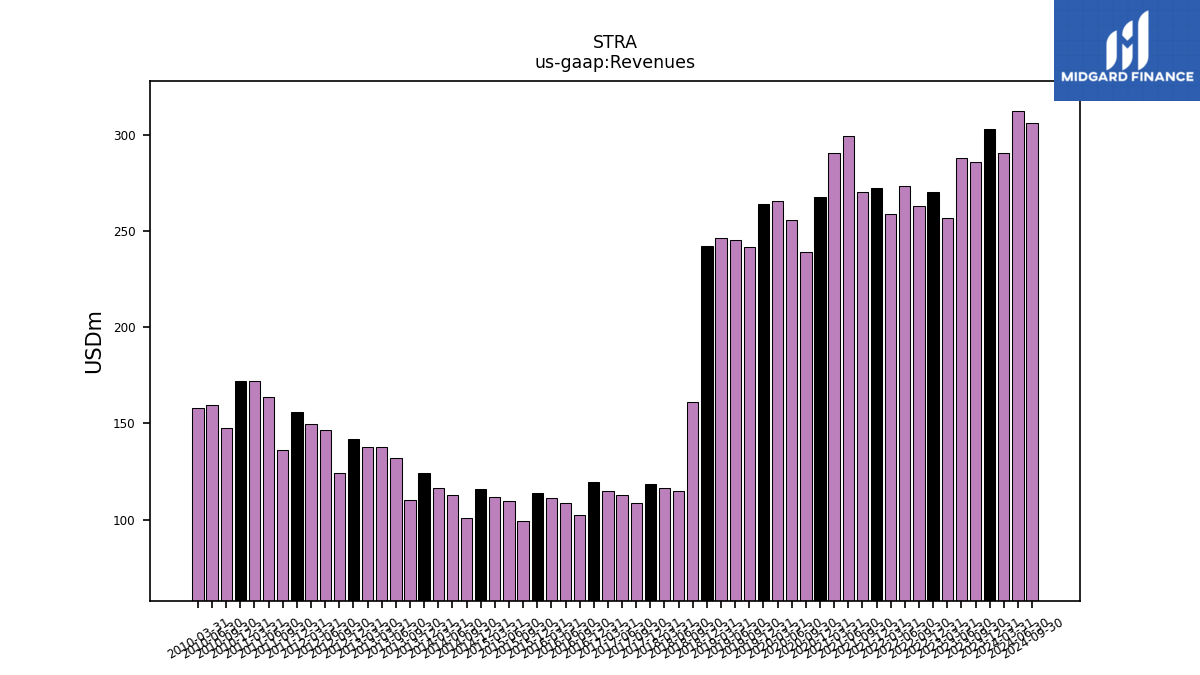
| Revenues | 290.25 | 302.70 | 285.94 | 287.68 | 256.61 | 269.94 | 263.12 | 273.56 | 258.86 | 272.10 | 270.08 | 299.17 | 290.34 | 267.49 | 239.03 | 255.83 | 265.30 | 263.77 | 241.75 | 245.11 | 246.51 | 242.10 | 160.94 | 114.67 | 116.47 | 118.71 | 108.51 | 112.72 | 114.91 | 119.28 | 102.16 | 108.49 | 111.17 | 113.66 | 99.14 | 109.75 | 111.89 | 116.07 | 100.76 | 112.75 | 116.47 | 124.08 | 110.03 | 131.98 | 137.51 | 137.51 | 141.93 | 124.26 | 146.25 | 149.53 | 155.82 | 135.87 | 163.79 | 171.96 | 171.95 | 147.60 | 159.28 | 157.90 | |
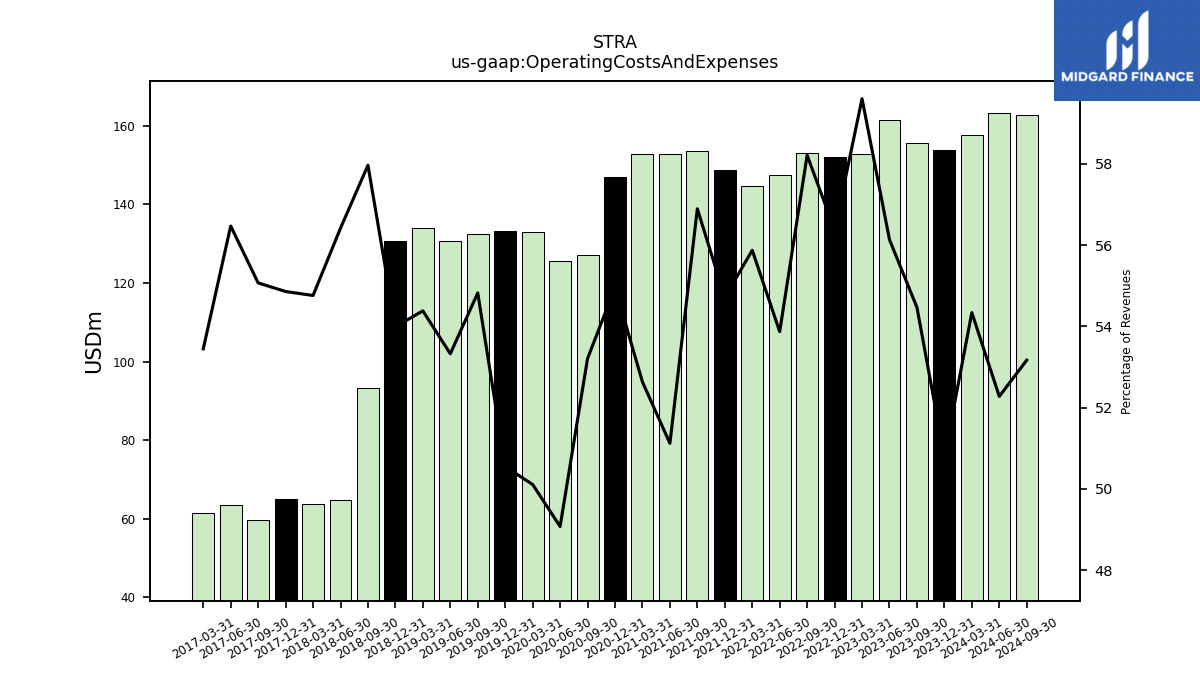
| Operating Costs And Expenses | 157.71 | 153.75 | 155.74 | 161.48 | 152.94 | 152.17 | 153.16 | 147.37 | 144.62 | 148.87 | 153.65 | 152.94 | 152.81 | 147.01 | 127.17 | 125.54 | 132.94 | 133.32 | 132.53 | 130.70 | 134.05 | 130.71 | 93.29 | 64.69 | 63.78 | 65.12 | 59.76 | 63.65 | 61.42 | NA | NA | NA | NA | NA | NA | NA | NA | NA | NA | NA | NA | NA | NA | NA | NA | NA | NA | NA | NA | NA | NA | NA | NA | NA | NA | NA | NA | NA | |
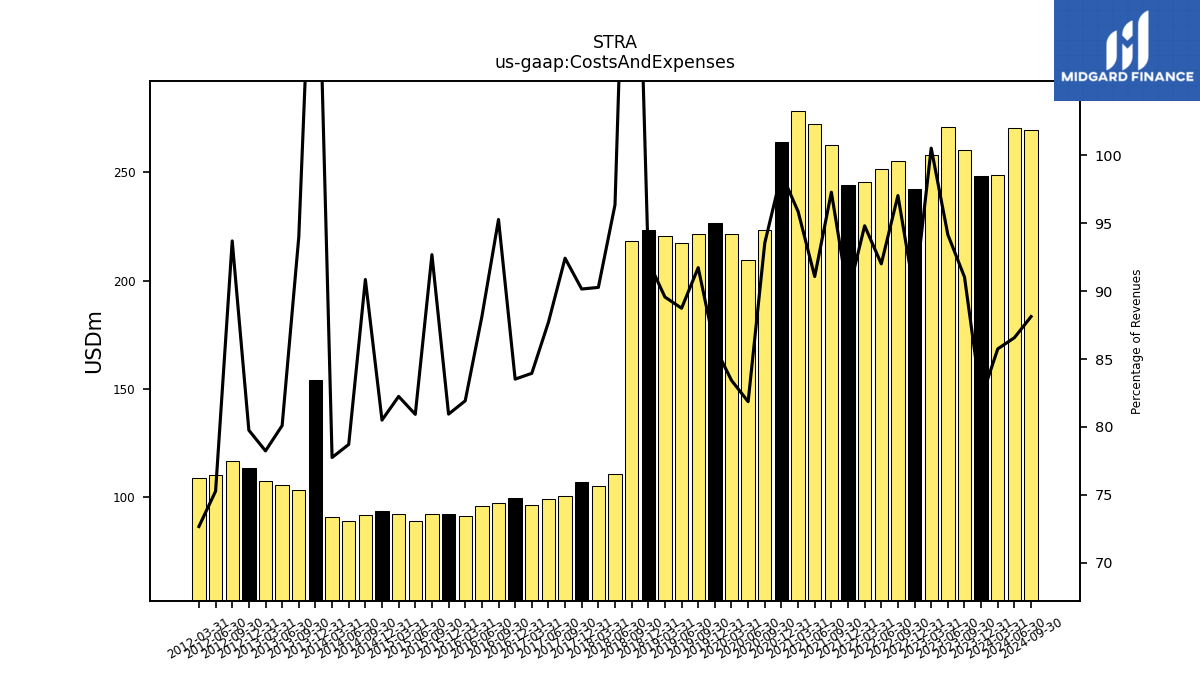
| Costs And Expenses | 248.89 | 248.48 | 260.31 | 270.86 | 257.95 | 242.29 | 255.32 | 251.70 | 245.41 | 244.24 | 262.73 | 272.47 | 278.34 | 263.89 | 223.60 | 209.44 | 221.34 | 226.56 | 221.75 | 217.51 | 220.78 | 223.23 | 218.07 | 110.48 | 105.14 | 107.02 | 100.29 | 98.87 | 96.47 | 99.62 | 97.33 | 95.59 | 91.07 | 92.00 | 91.89 | 88.82 | 92.03 | 93.45 | 91.54 | 88.75 | 90.56 | 154.18 | 103.41 | 105.72 | 107.59 | NA | 113.21 | 116.42 | 110.09 | 108.67 | NA | NA | NA | NA | NA | NA | NA | NA | |
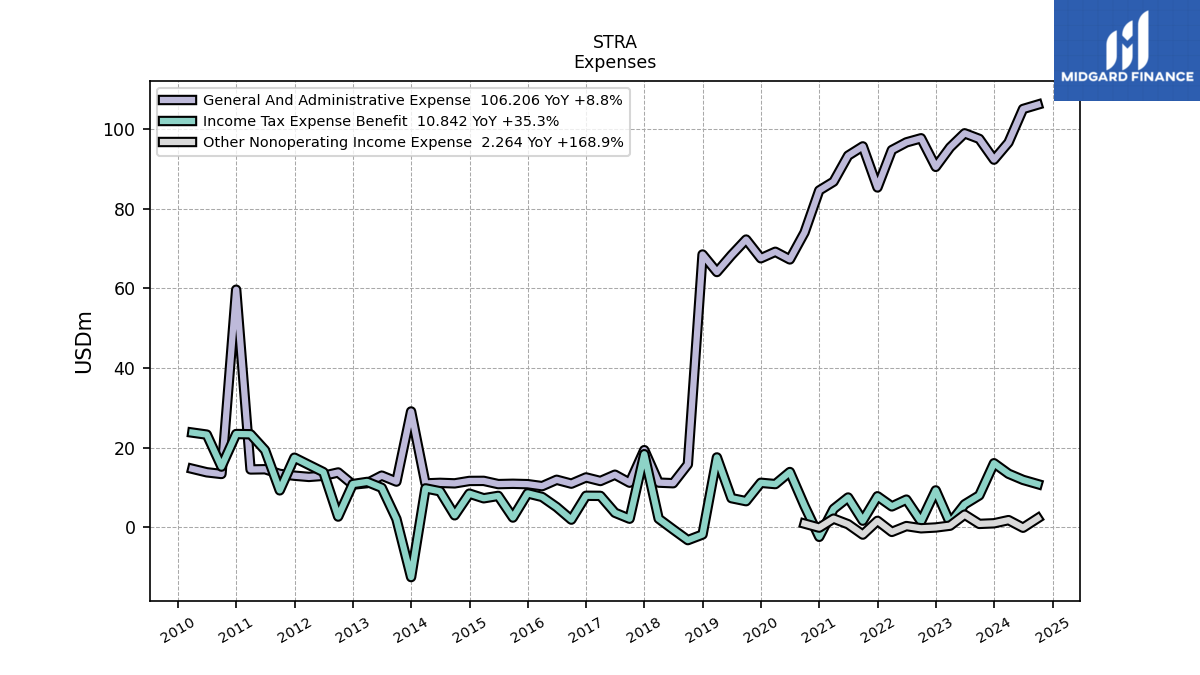
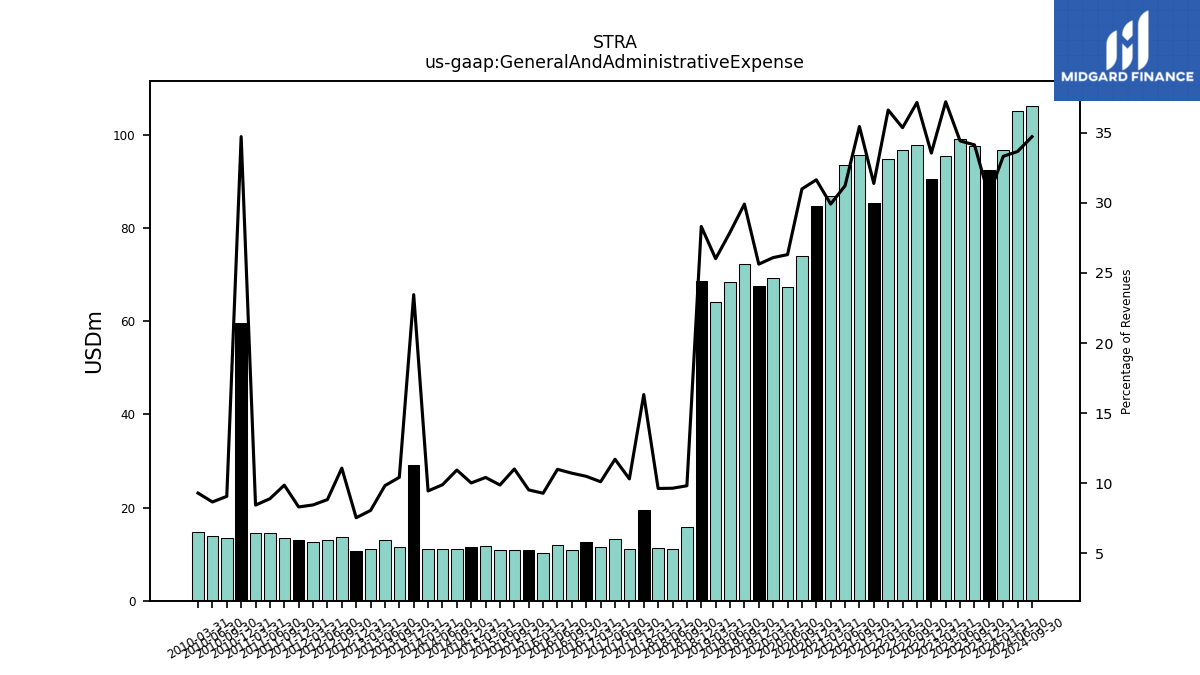
| General And Administrative Expense | 96.69 | 92.38 | 97.60 | 99.00 | 95.47 | 90.56 | 97.75 | 96.72 | 94.78 | 85.39 | 95.71 | 93.39 | 86.84 | 84.64 | 74.07 | 67.30 | 69.23 | 67.59 | 72.30 | 68.37 | 64.14 | 68.54 | 15.81 | 11.06 | 11.22 | 19.38 | 11.19 | 13.21 | 11.62 | 12.52 | 10.95 | 11.93 | 10.33 | 10.83 | 10.93 | 10.84 | 11.65 | 11.64 | 11.03 | 11.16 | 11.01 | 29.10 | 11.47 | 12.98 | 11.09 | NA | 10.71 | 13.77 | 12.93 | 12.65 | 12.96 | 13.41 | 14.58 | 14.52 | 59.70 | 13.38 | 13.81 | 14.69 | |
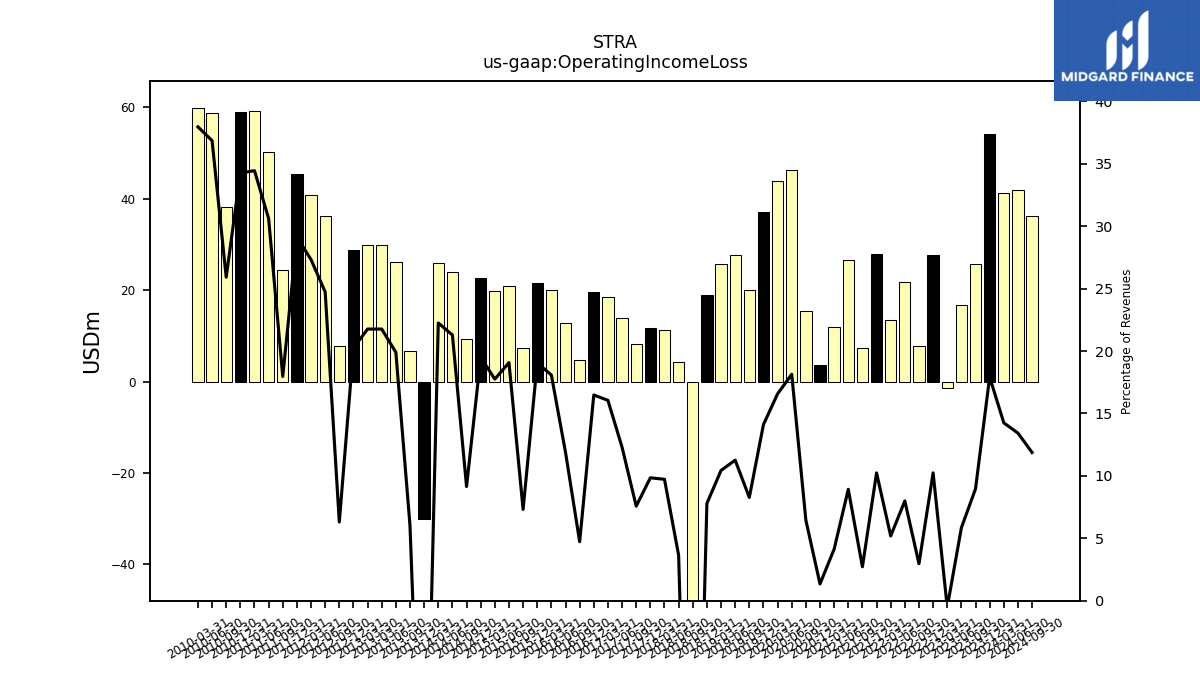
| Operating Income Loss | 41.36 | 54.22 | 25.63 | 16.82 | -1.35 | 27.65 | 7.81 | 21.86 | 13.44 | 27.86 | 7.35 | 26.70 | 12.00 | 3.61 | 15.42 | 46.40 | 43.96 | 37.21 | 20.00 | 27.60 | 25.72 | 18.88 | -57.13 | 4.18 | 11.33 | 11.69 | 8.22 | 13.85 | 18.44 | 19.65 | 4.83 | 12.90 | 20.09 | 21.66 | 7.25 | 20.93 | 19.86 | 22.62 | 9.22 | 24.00 | 25.91 | -30.10 | 6.62 | 26.26 | 29.92 | 29.92 | 28.73 | 7.84 | 36.17 | 40.86 | 45.37 | 24.41 | 50.15 | 59.23 | 58.91 | 38.25 | 58.69 | 59.93 | |
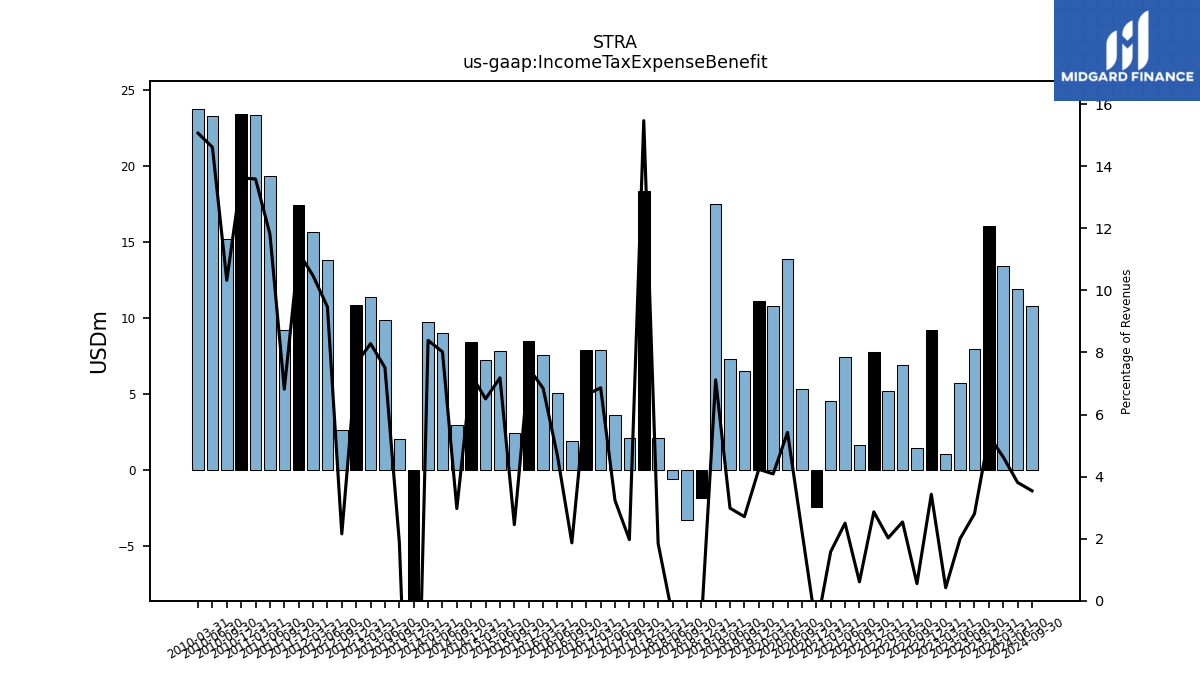
| Income Tax Expense Benefit | 13.45 | 16.09 | 8.01 | 5.76 | 1.08 | 9.26 | 1.45 | 6.95 | 5.24 | 7.79 | 1.65 | 7.48 | 4.59 | -2.41 | 5.37 | 13.88 | 10.84 | 11.17 | 6.55 | 7.31 | 17.55 | -1.82 | -3.24 | -0.56 | 2.15 | 18.36 | 2.14 | 3.65 | 7.89 | 7.91 | 1.91 | 5.06 | 7.61 | 8.52 | 2.43 | 7.88 | 7.28 | 8.45 | 2.99 | 9.04 | 9.77 | -12.53 | 2.08 | 9.92 | 11.39 | NA | 10.86 | 2.68 | 13.85 | 15.66 | 17.49 | 9.27 | 19.36 | 23.37 | 23.43 | 15.24 | 23.28 | 23.79 | |
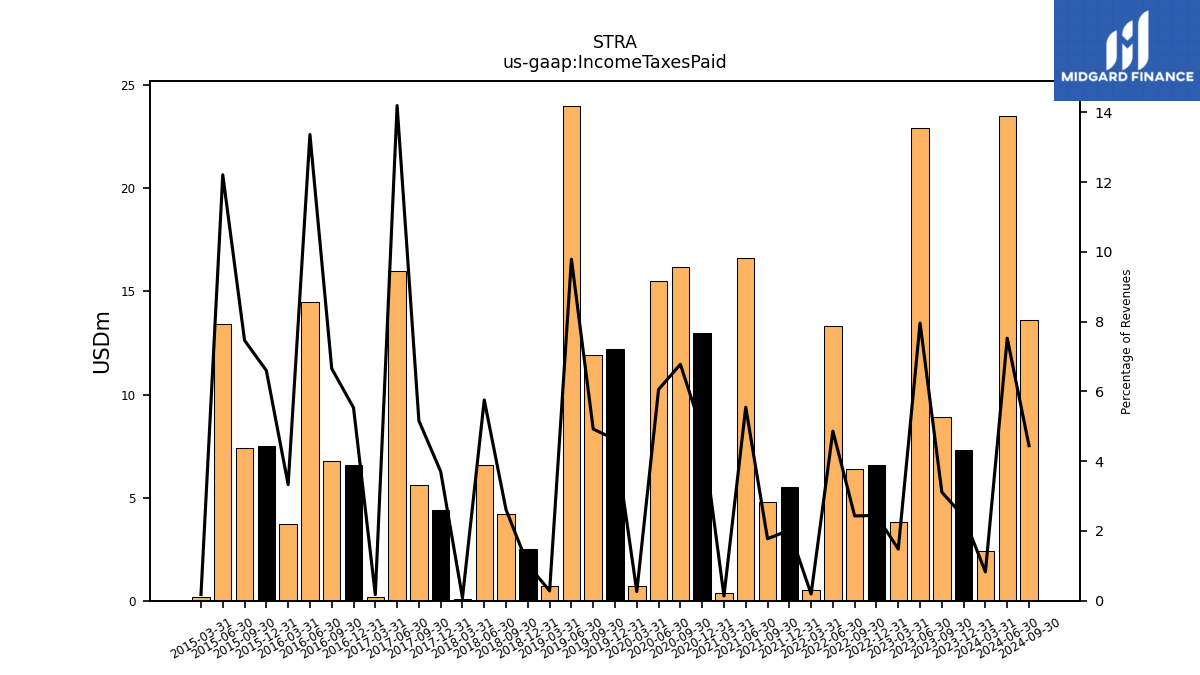
| Income Taxes Paid | 2.40 | 7.30 | 8.90 | 22.90 | 3.80 | 6.60 | 6.40 | 13.30 | 0.50 | 5.50 | 4.80 | 16.60 | 0.40 | 13.00 | 16.20 | 15.50 | 0.70 | 12.20 | 11.90 | 24.00 | 0.70 | 2.50 | 4.20 | 6.60 | 0.10 | 4.40 | 5.60 | 16.00 | 0.20 | 6.60 | 6.80 | 14.50 | 3.70 | 7.50 | 7.40 | 13.40 | 0.20 | NA | NA | NA | NA | NA | NA | NA | NA | NA | NA | NA | NA | NA | NA | NA | NA | NA | NA | NA | NA | NA | |
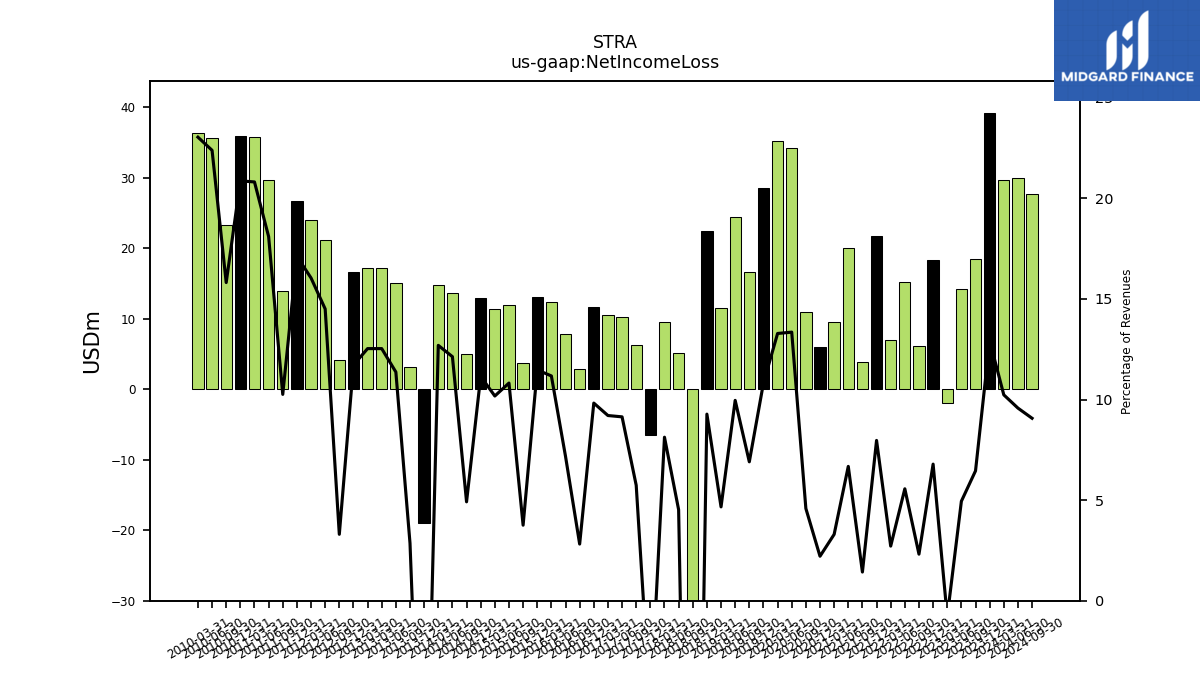
| Net Income Loss | 29.70 | 39.13 | 18.46 | 14.23 | -2.03 | 18.33 | 6.09 | 15.22 | 7.03 | 21.68 | 3.85 | 19.98 | 9.58 | 5.92 | 10.96 | 34.15 | 35.24 | 28.54 | 16.69 | 24.41 | 11.50 | 22.45 | -52.78 | 5.19 | 9.47 | -6.50 | 6.23 | 10.30 | 10.58 | 11.72 | 2.88 | 7.79 | 12.42 | 13.04 | 3.72 | 11.87 | 11.38 | 12.94 | 4.95 | 13.68 | 14.78 | -18.96 | 3.15 | 15.00 | 17.23 | 17.23 | 16.63 | 4.10 | 21.21 | 23.99 | 26.67 | 13.94 | 29.65 | 35.79 | 35.88 | 23.34 | 35.66 | 36.38 | |
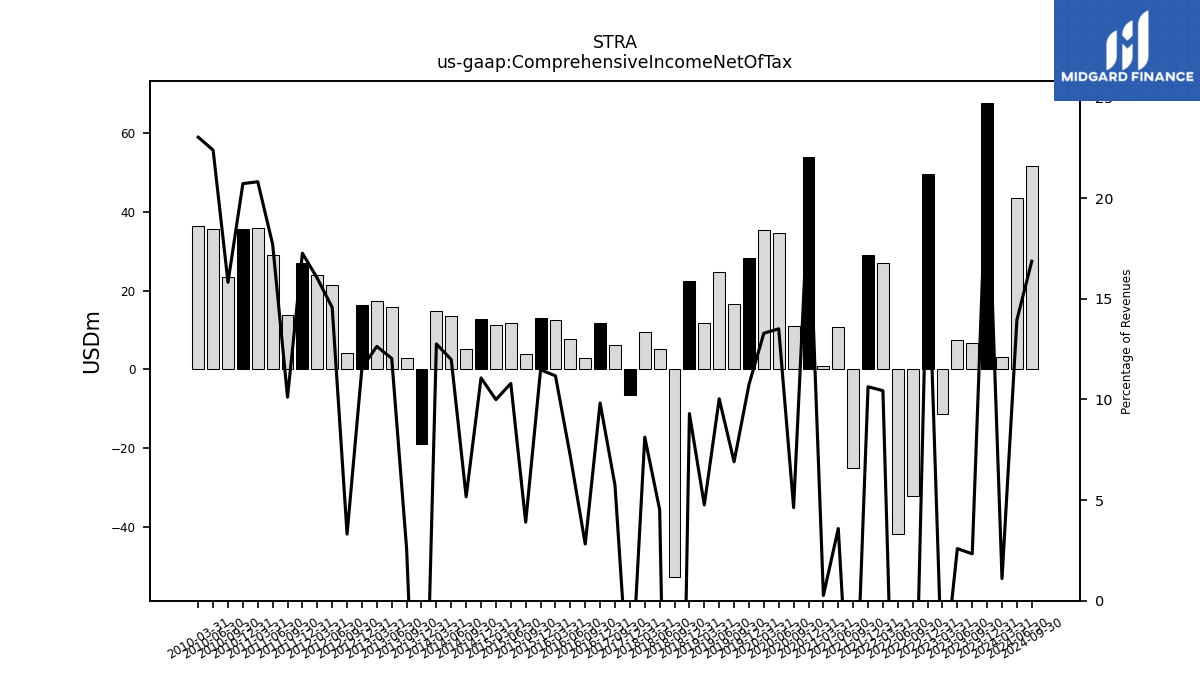
| Comprehensive Income Net Of Tax | 3.19 | 67.76 | 6.67 | 7.45 | -11.26 | 49.63 | -32.27 | -41.97 | 27.01 | 28.93 | -25.01 | 10.73 | 0.76 | 54.04 | 11.06 | 34.56 | 35.26 | 28.32 | 16.69 | 24.59 | 11.73 | 22.51 | -52.80 | 5.19 | 9.47 | -6.50 | 6.23 | NA | NA | 11.72 | 2.88 | 7.79 | 12.42 | 13.04 | 3.87 | 11.85 | 11.18 | 12.85 | 5.20 | 13.51 | 14.86 | -18.91 | 2.84 | 15.88 | 17.37 | NA | 16.44 | 4.12 | 21.31 | 23.95 | 26.90 | 13.74 | 29.00 | 35.79 | 35.63 | 23.35 | 35.66 | 36.36 |
| 2024-03-31 | 2023-12-31 | 2023-09-30 | 2023-06-30 | 2023-03-31 | 2022-12-31 | 2022-09-30 | 2022-06-30 | 2022-03-31 | 2021-12-31 | 2021-09-30 | 2021-06-30 | 2021-03-31 | 2020-12-31 | 2020-09-30 | 2020-06-30 | 2020-03-31 | 2019-12-31 | 2019-09-30 | 2019-06-30 | 2019-03-31 | 2018-12-31 | 2018-09-30 | 2018-06-30 | 2018-03-31 | 2017-12-31 | 2017-09-30 | 2017-06-30 | 2017-03-31 | 2016-12-31 | 2016-09-30 | 2016-06-30 | 2016-03-31 | 2015-12-31 | 2015-09-30 | 2015-06-30 | 2015-03-31 | 2014-12-31 | 2014-09-30 | 2014-06-30 | 2014-03-31 | 2013-12-31 | 2013-09-30 | 2013-06-30 | 2013-03-31 | 2013-03-30 | 2012-12-31 | 2012-09-30 | 2012-06-30 | 2012-03-31 | 2011-12-31 | 2011-09-30 | 2011-06-30 | 2011-03-31 | 2010-12-31 | 2010-09-30 | 2010-06-30 | 2010-03-31 | ||
|---|---|---|---|---|---|---|---|---|---|---|---|---|---|---|---|---|---|---|---|---|---|---|---|---|---|---|---|---|---|---|---|---|---|---|---|---|---|---|---|---|---|---|---|---|---|---|---|---|---|---|---|---|---|---|---|---|---|---|---|
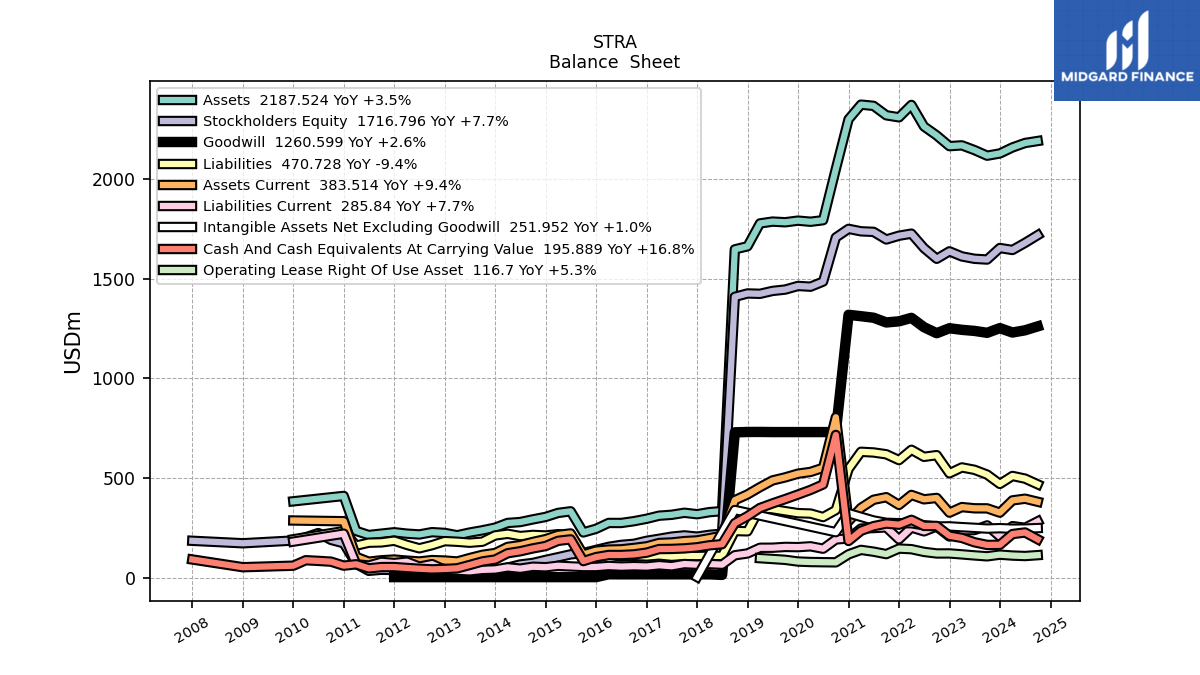
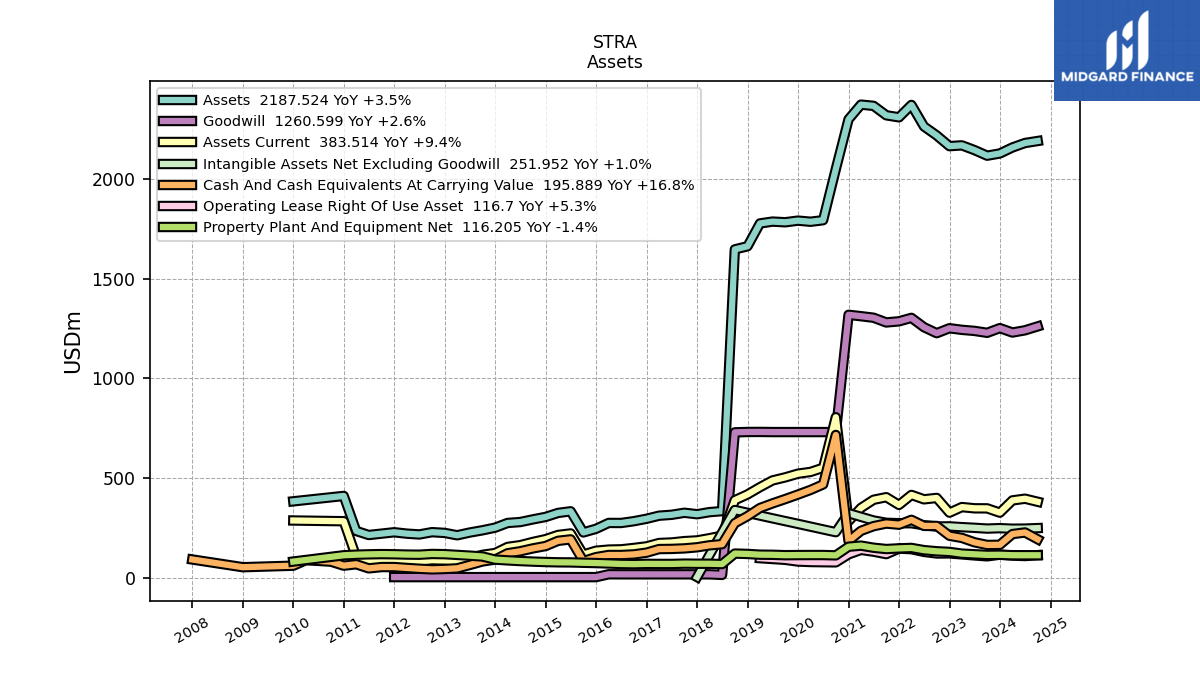
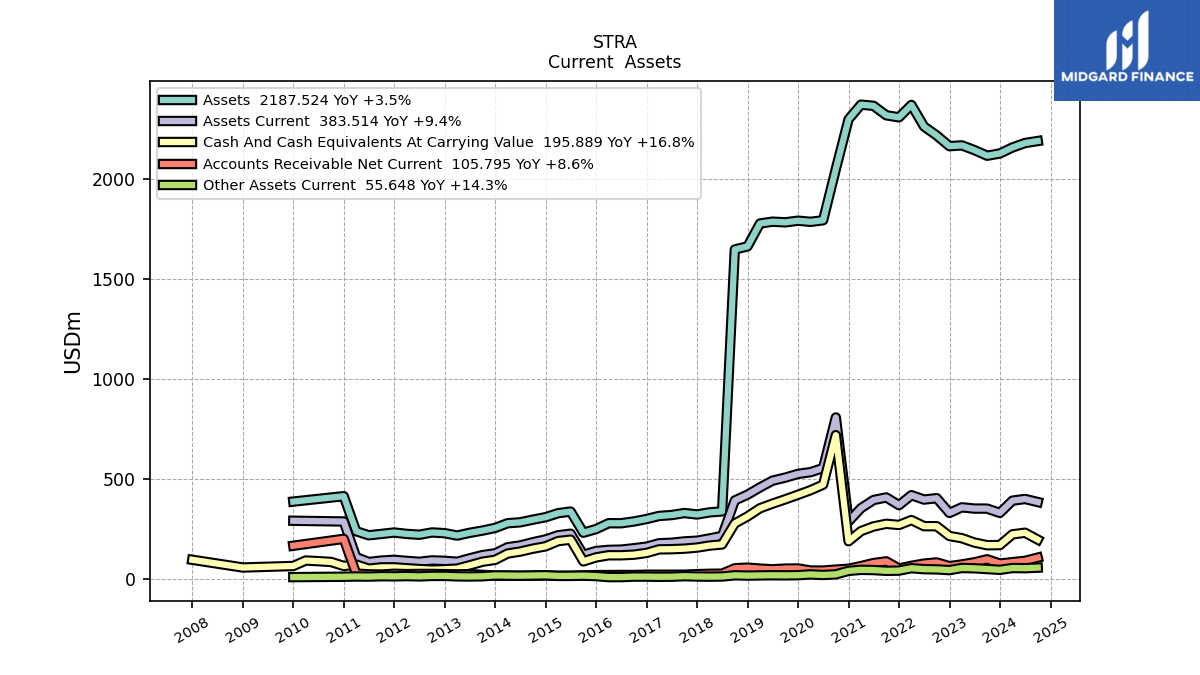
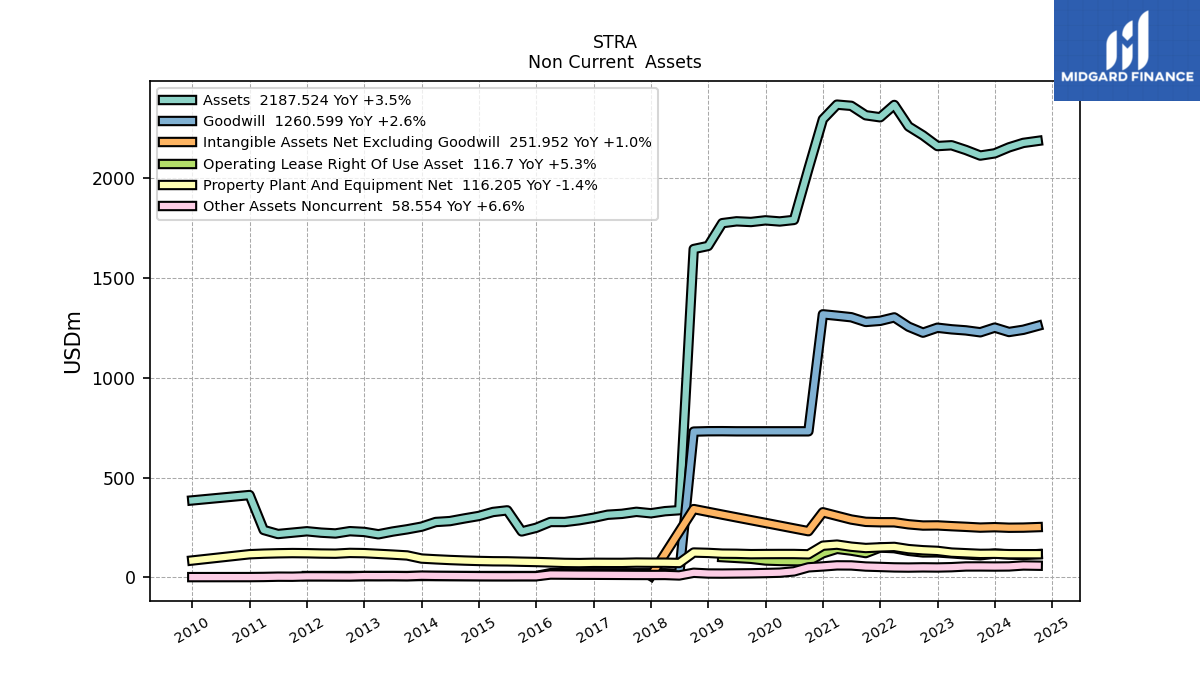
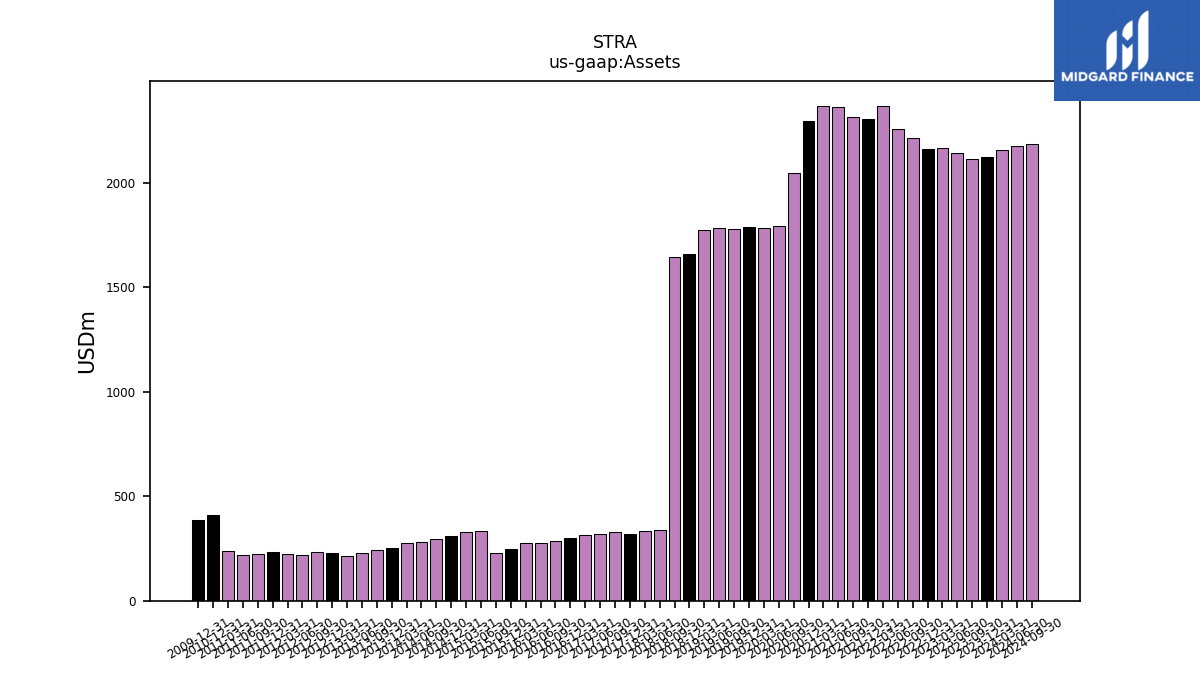
| Assets | 2155.24 | 2125.21 | 2114.10 | 2142.11 | 2165.77 | 2161.75 | 2215.25 | 2260.26 | 2367.88 | 2305.88 | 2316.12 | 2363.31 | 2369.44 | 2295.81 | 2047.32 | 1791.56 | 1783.82 | 1789.41 | 1781.20 | 1784.57 | 1775.39 | 1661.03 | 1645.70 | 336.76 | 331.81 | 321.28 | 328.57 | 318.48 | 313.97 | 298.70 | 286.50 | 277.55 | 277.70 | 248.43 | 230.27 | 336.00 | 327.78 | 307.81 | 295.48 | 282.19 | 277.61 | 254.27 | 240.95 | 229.82 | 216.03 | NA | 227.79 | 231.61 | 220.14 | 224.23 | 231.13 | 224.21 | 217.35 | 237.62 | 412.77 | NA | NA | NA | |
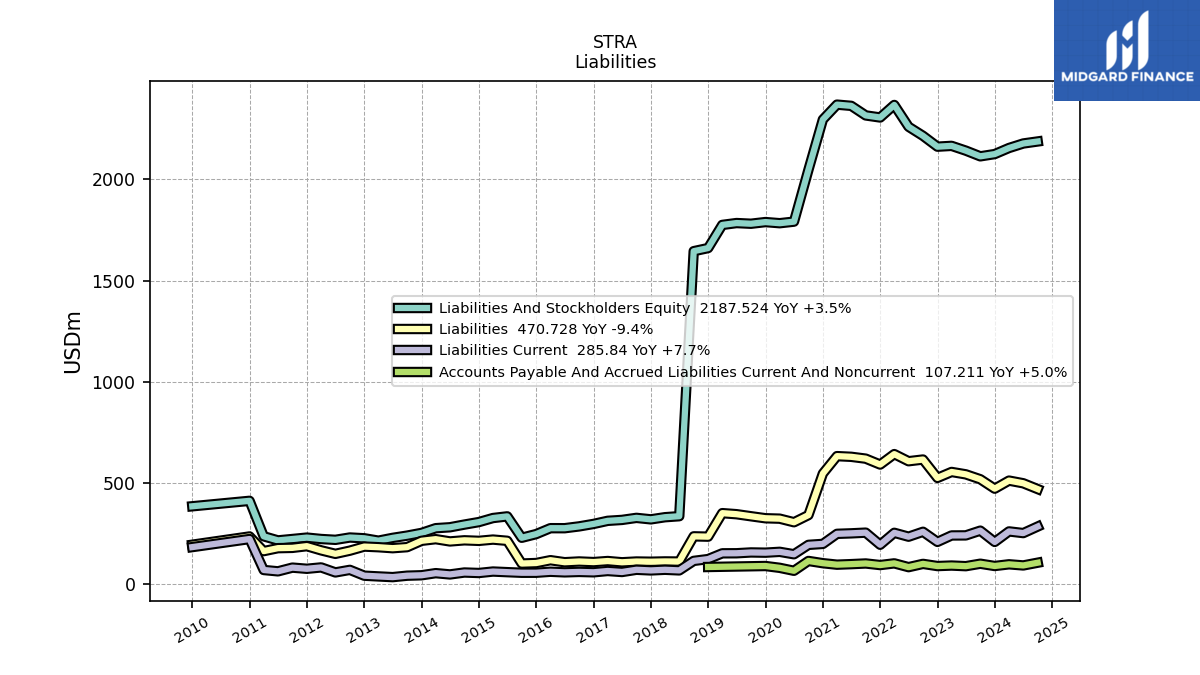
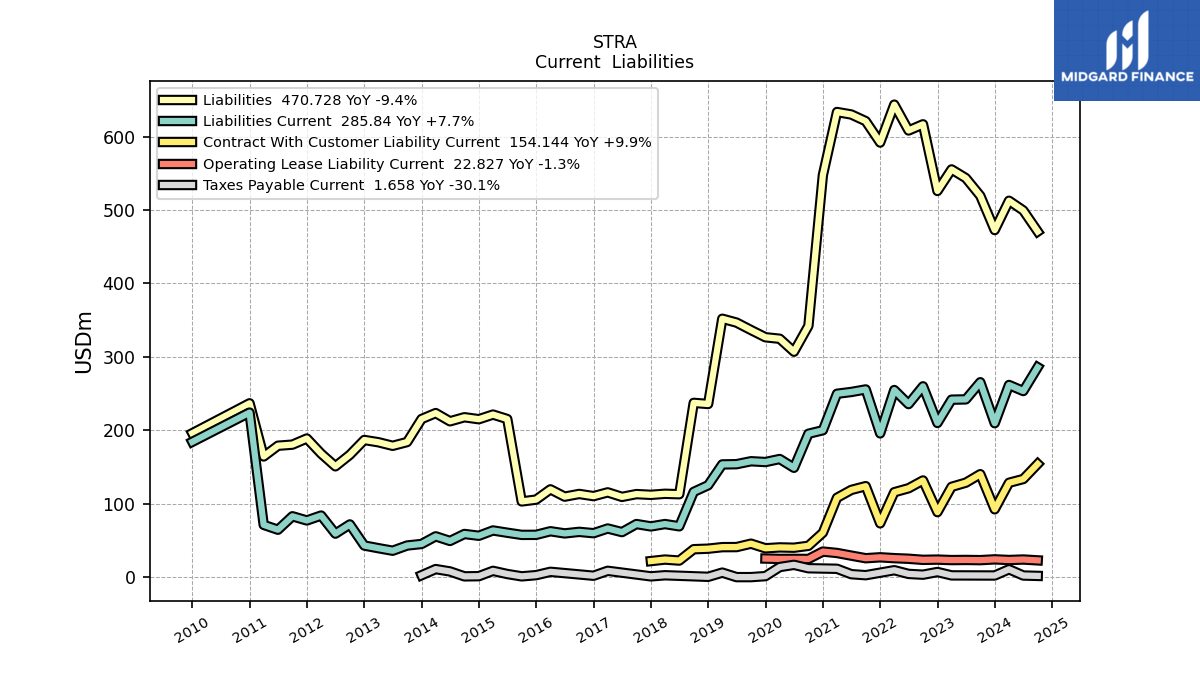
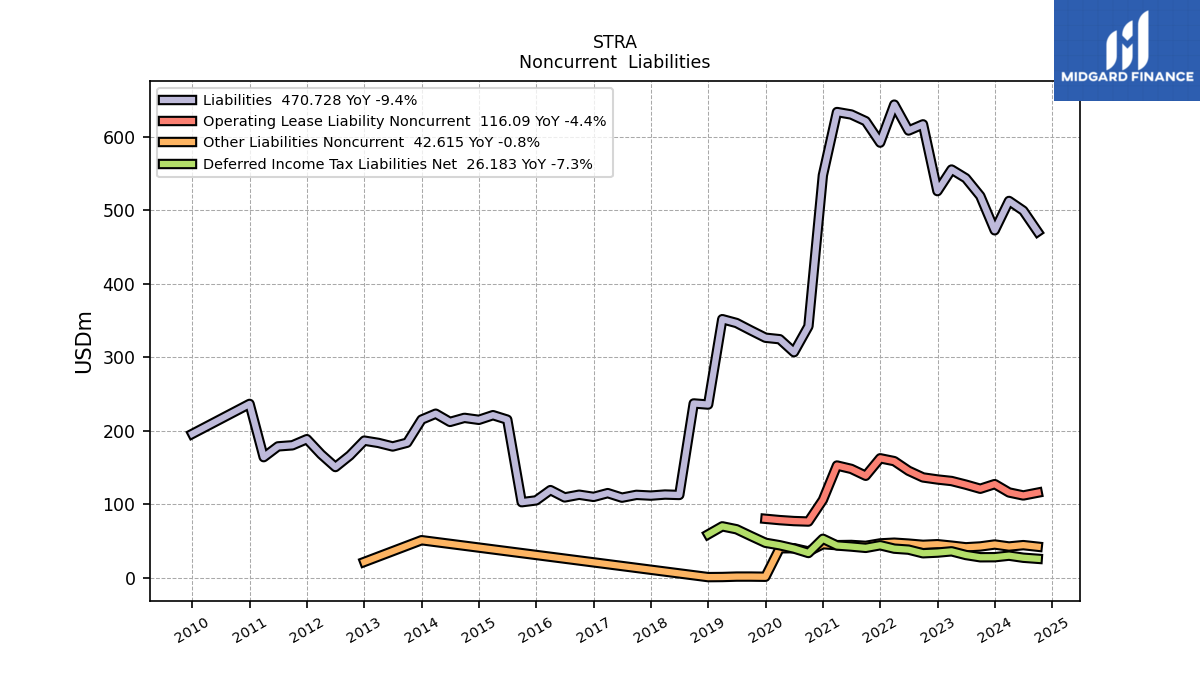
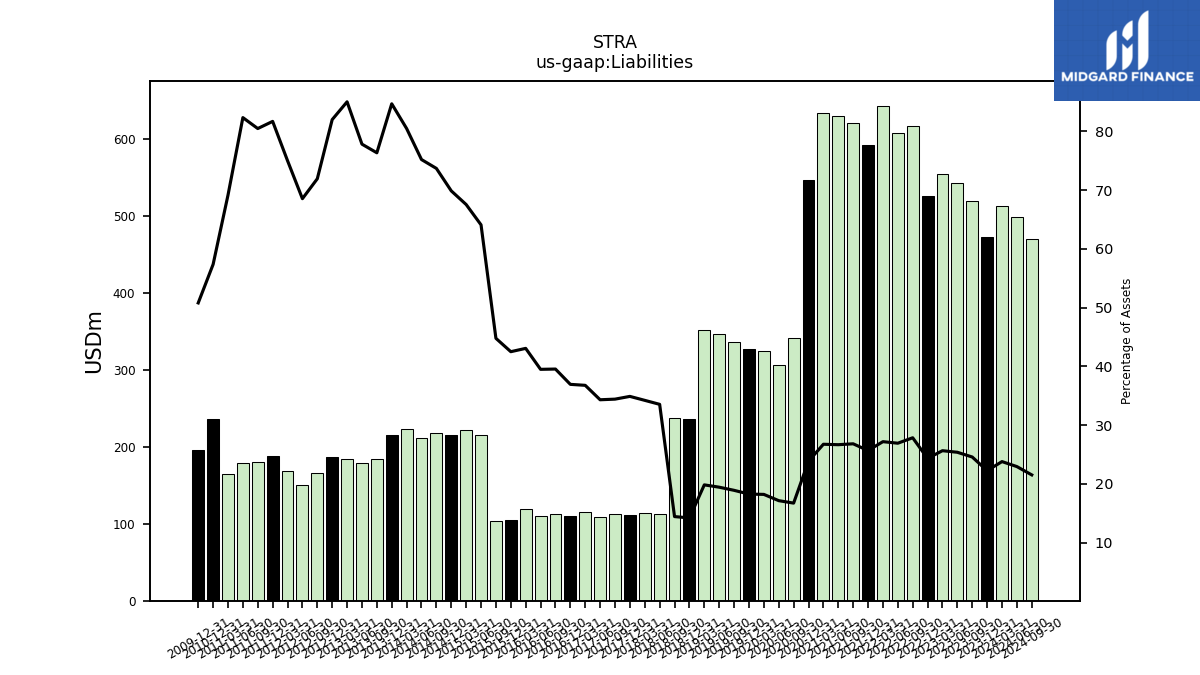
| Liabilities | 512.65 | 472.69 | 519.35 | 543.51 | 555.34 | 525.96 | 616.77 | 608.34 | 643.57 | 591.89 | 621.07 | 630.13 | 633.52 | 547.49 | 342.26 | 307.01 | 324.67 | 326.70 | 336.54 | 346.69 | 351.95 | 235.81 | 237.37 | 112.92 | 113.52 | 112.08 | 113.09 | 109.28 | 115.45 | 110.32 | 113.28 | 109.61 | 119.58 | 105.58 | 103.10 | 215.35 | 221.41 | 215.08 | 217.77 | 212.23 | 223.45 | 215.36 | 183.99 | 178.87 | 183.70 | NA | 186.80 | 166.62 | 150.90 | 168.21 | 188.84 | 180.46 | 178.99 | 164.31 | 236.76 | NA | NA | NA | |
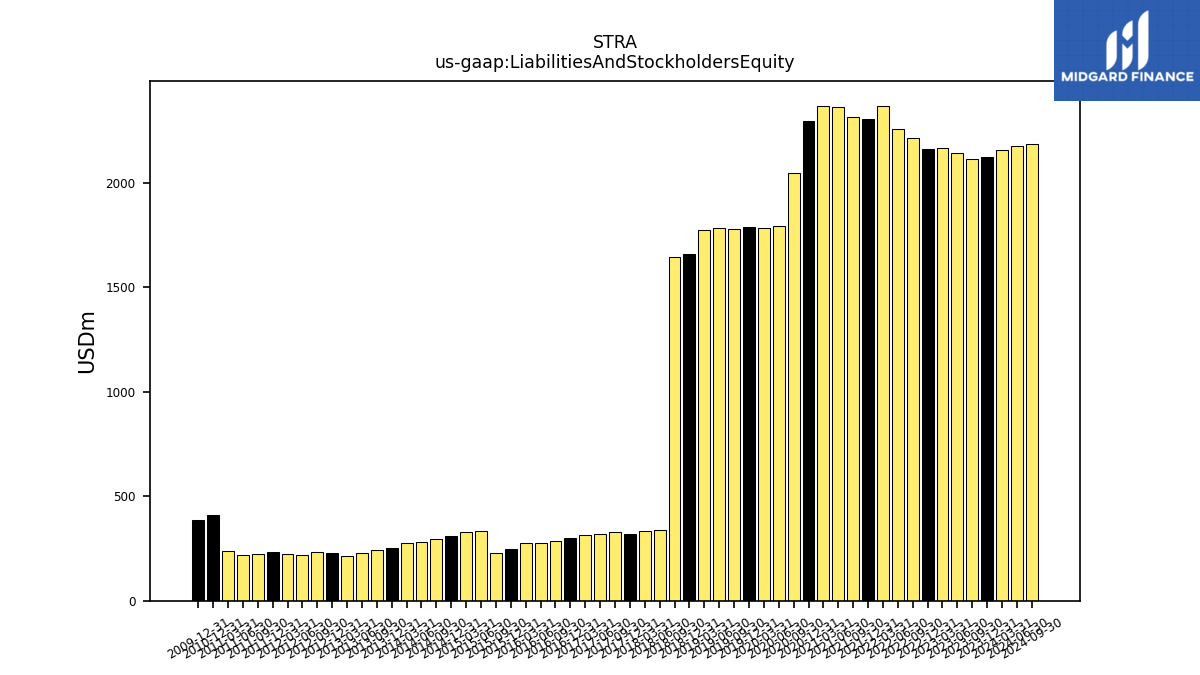
| Liabilities And Stockholders Equity | 2155.24 | 2125.21 | 2114.10 | 2142.11 | 2165.77 | 2161.75 | 2215.25 | 2260.26 | 2367.88 | 2305.88 | 2316.12 | 2363.31 | 2369.44 | 2295.81 | 2047.32 | 1791.56 | 1783.82 | 1789.41 | 1781.20 | 1784.57 | 1775.39 | 1661.03 | 1645.70 | 336.76 | 331.81 | 321.28 | 328.57 | 318.48 | 313.97 | 298.70 | 286.50 | 277.55 | 277.70 | 248.43 | 230.27 | 336.00 | 327.78 | 307.81 | 295.48 | 282.19 | 277.61 | 254.27 | 240.95 | 229.82 | 216.03 | NA | 227.79 | 231.61 | 220.14 | 224.23 | 231.13 | 224.21 | 217.35 | 237.62 | 412.77 | NA | NA | NA | |
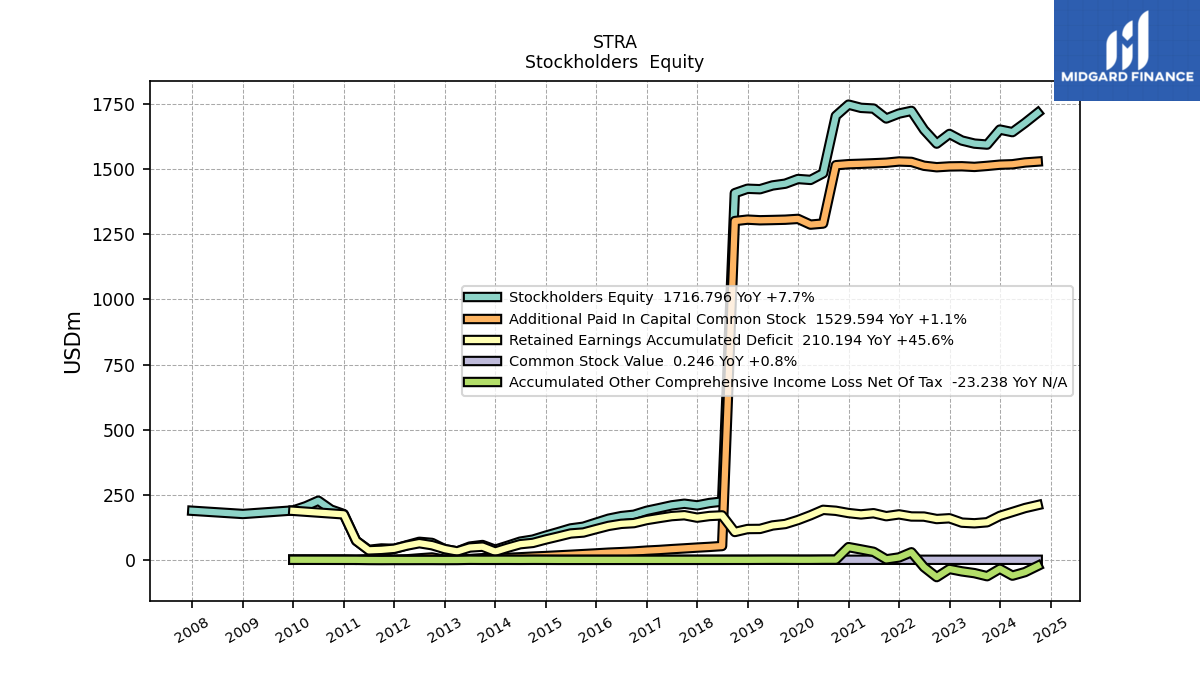
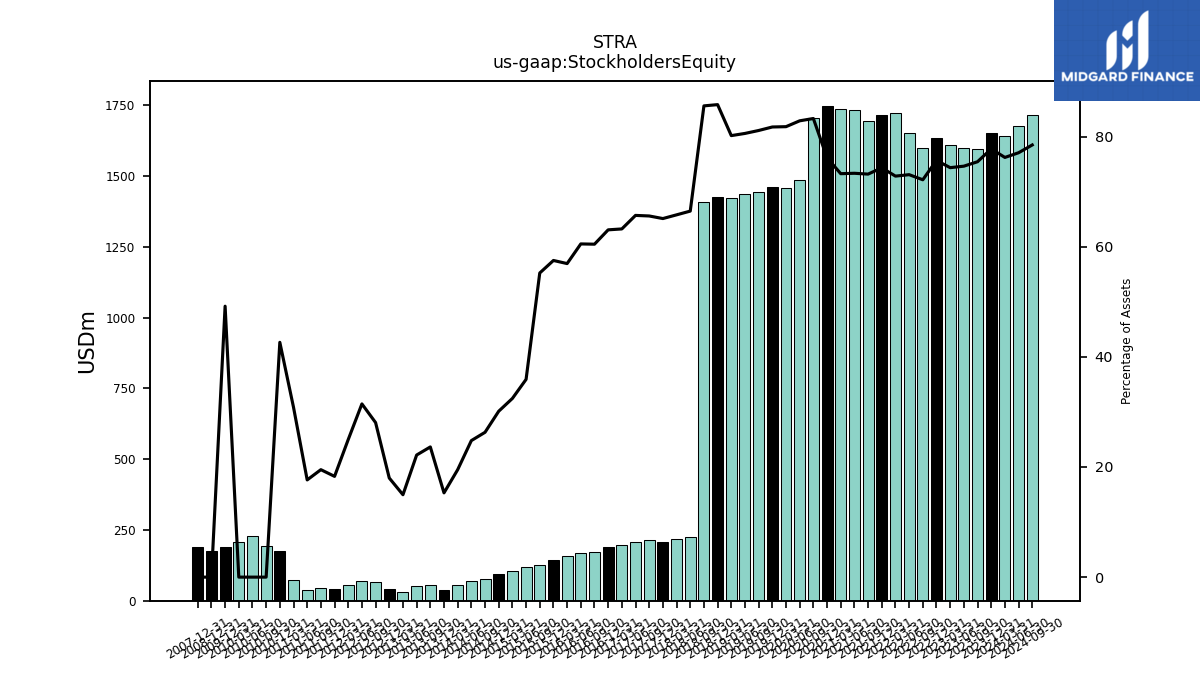
| Stockholders Equity | 1642.58 | 1652.52 | 1594.75 | 1598.61 | 1610.43 | 1635.79 | 1598.48 | 1651.92 | 1724.31 | 1713.99 | 1695.06 | 1733.18 | 1735.92 | 1748.32 | 1705.06 | 1484.55 | 1459.15 | 1462.71 | 1444.66 | 1437.88 | 1423.44 | 1425.22 | 1408.33 | 223.84 | 218.29 | 209.20 | 215.49 | 209.20 | 198.53 | 188.37 | 173.22 | 167.94 | 158.12 | 142.86 | 127.18 | 120.66 | 106.36 | 92.73 | 77.72 | 69.96 | 54.17 | 38.90 | 56.97 | 50.95 | 32.32 | NA | 40.99 | 64.99 | 69.25 | 56.03 | 42.29 | 43.75 | 38.37 | 73.30 | 176.00 | 192.98 | 227.16 | 205.80 |
| 2024-03-31 | 2023-12-31 | 2023-09-30 | 2023-06-30 | 2023-03-31 | 2022-12-31 | 2022-09-30 | 2022-06-30 | 2022-03-31 | 2021-12-31 | 2021-09-30 | 2021-06-30 | 2021-03-31 | 2020-12-31 | 2020-09-30 | 2020-06-30 | 2020-03-31 | 2019-12-31 | 2019-09-30 | 2019-06-30 | 2019-03-31 | 2018-12-31 | 2018-09-30 | 2018-06-30 | 2018-03-31 | 2017-12-31 | 2017-09-30 | 2017-06-30 | 2017-03-31 | 2016-12-31 | 2016-09-30 | 2016-06-30 | 2016-03-31 | 2015-12-31 | 2015-09-30 | 2015-06-30 | 2015-03-31 | 2014-12-31 | 2014-09-30 | 2014-06-30 | 2014-03-31 | 2013-12-31 | 2013-09-30 | 2013-06-30 | 2013-03-31 | 2013-03-30 | 2012-12-31 | 2012-09-30 | 2012-06-30 | 2012-03-31 | 2011-12-31 | 2011-09-30 | 2011-06-30 | 2011-03-31 | 2010-12-31 | 2010-09-30 | 2010-06-30 | 2010-03-31 | ||
|---|---|---|---|---|---|---|---|---|---|---|---|---|---|---|---|---|---|---|---|---|---|---|---|---|---|---|---|---|---|---|---|---|---|---|---|---|---|---|---|---|---|---|---|---|---|---|---|---|---|---|---|---|---|---|---|---|---|---|---|
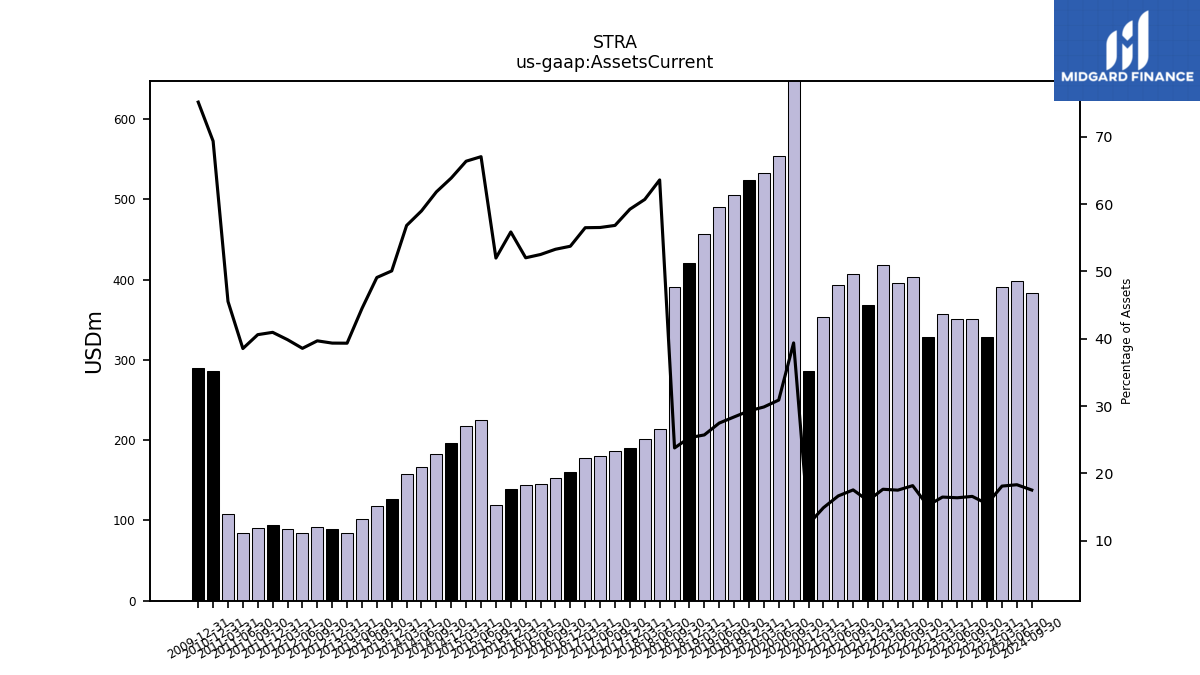
| Assets Current | 390.45 | 329.07 | 350.63 | 350.91 | 357.01 | 329.06 | 402.75 | 395.82 | 417.85 | 367.79 | 406.48 | 393.63 | 352.93 | 286.12 | 806.38 | 553.50 | 532.78 | 524.09 | 505.61 | 490.32 | 456.59 | 420.36 | 391.41 | 214.17 | 201.42 | 190.35 | 186.76 | 180.05 | 177.40 | 160.54 | 152.70 | 145.78 | 144.49 | 138.80 | 119.73 | 225.30 | 217.58 | 196.65 | 182.68 | 166.48 | 157.78 | 127.34 | 118.32 | 102.26 | 85.00 | NA | 89.66 | 91.94 | 84.93 | 89.39 | 94.67 | 91.06 | 83.79 | 108.22 | 286.32 | NA | NA | NA | |
| Cash And Cash Equivalents At Carrying Value | 222.12 | 168.48 | 167.71 | 181.02 | 202.82 | 213.67 | 262.76 | 262.94 | 293.42 | 268.92 | 274.77 | 261.58 | 238.29 | 187.51 | 717.80 | 470.32 | 442.85 | 419.69 | 397.09 | 375.51 | 352.39 | 311.73 | 276.38 | 171.60 | 165.87 | 155.93 | 150.48 | 147.87 | 147.10 | 129.25 | 120.50 | 117.42 | 117.50 | 106.89 | 86.92 | 195.56 | 188.28 | 162.28 | 150.47 | 136.08 | 126.20 | 94.76 | 85.22 | 67.54 | 50.76 | NA | 47.52 | 45.61 | 48.69 | 52.70 | 57.14 | 57.07 | 50.56 | 71.09 | 64.11 | 84.12 | 88.01 | 91.27 | |
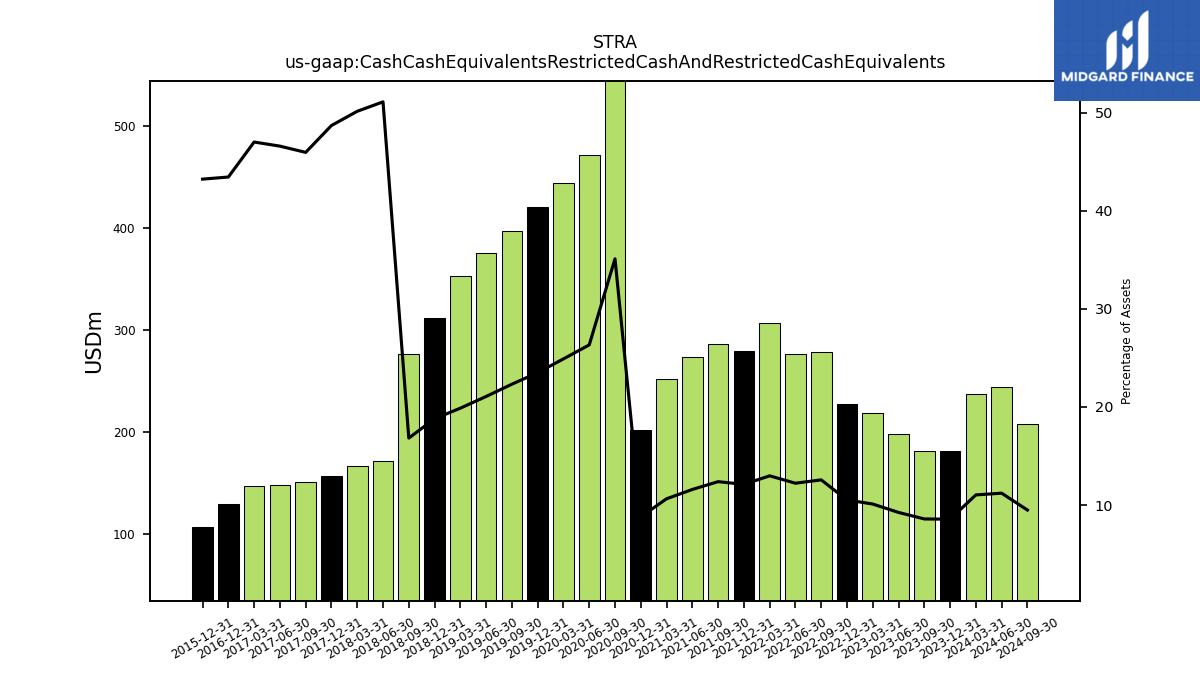
| Cash Cash Equivalents Restricted Cash And Restricted Cash Equivalents | 237.83 | 181.93 | 181.44 | 198.08 | 218.81 | 227.45 | 278.40 | 276.36 | 307.31 | 279.21 | 286.83 | 273.91 | 252.04 | 202.02 | 718.65 | 471.62 | 444.19 | 420.50 | 397.60 | 376.02 | 352.89 | 312.24 | 276.90 | 172.10 | 166.38 | 156.45 | 150.99 | 148.38 | 147.60 | 129.76 | NA | NA | NA | 107.39 | NA | NA | NA | NA | NA | NA | NA | NA | NA | NA | NA | NA | NA | NA | NA | NA | NA | NA | NA | NA | NA | NA | NA | NA | |
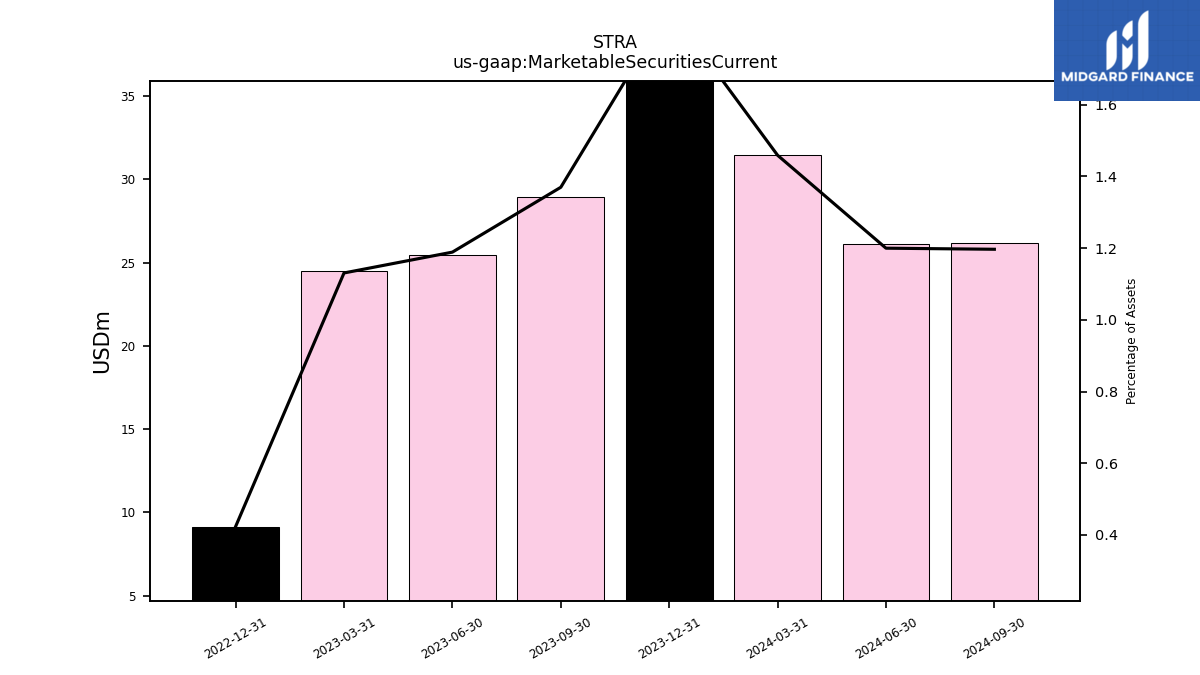
| Marketable Securities Current | 31.45 | 39.73 | 28.96 | 25.47 | 24.49 | 9.16 | NA | NA | NA | NA | NA | NA | NA | NA | NA | NA | NA | NA | NA | NA | NA | NA | NA | NA | NA | NA | NA | NA | NA | NA | NA | NA | NA | NA | NA | NA | NA | NA | NA | NA | NA | NA | NA | NA | NA | NA | NA | NA | NA | NA | NA | NA | NA | NA | NA | NA | NA | NA | |
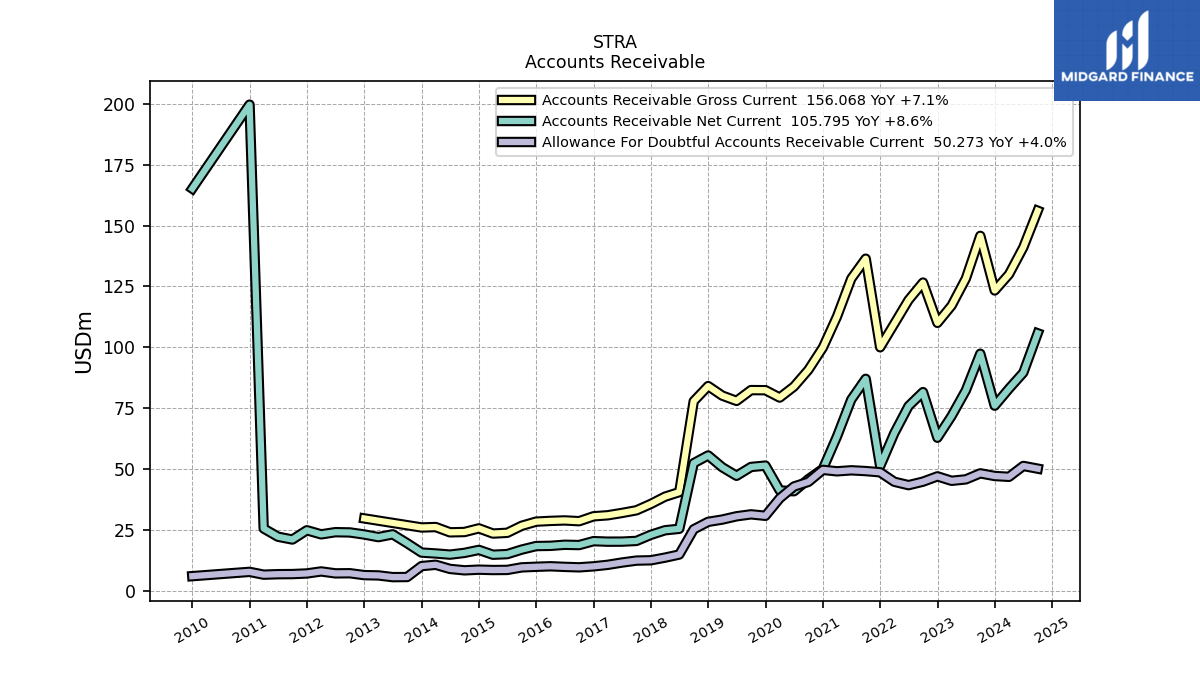
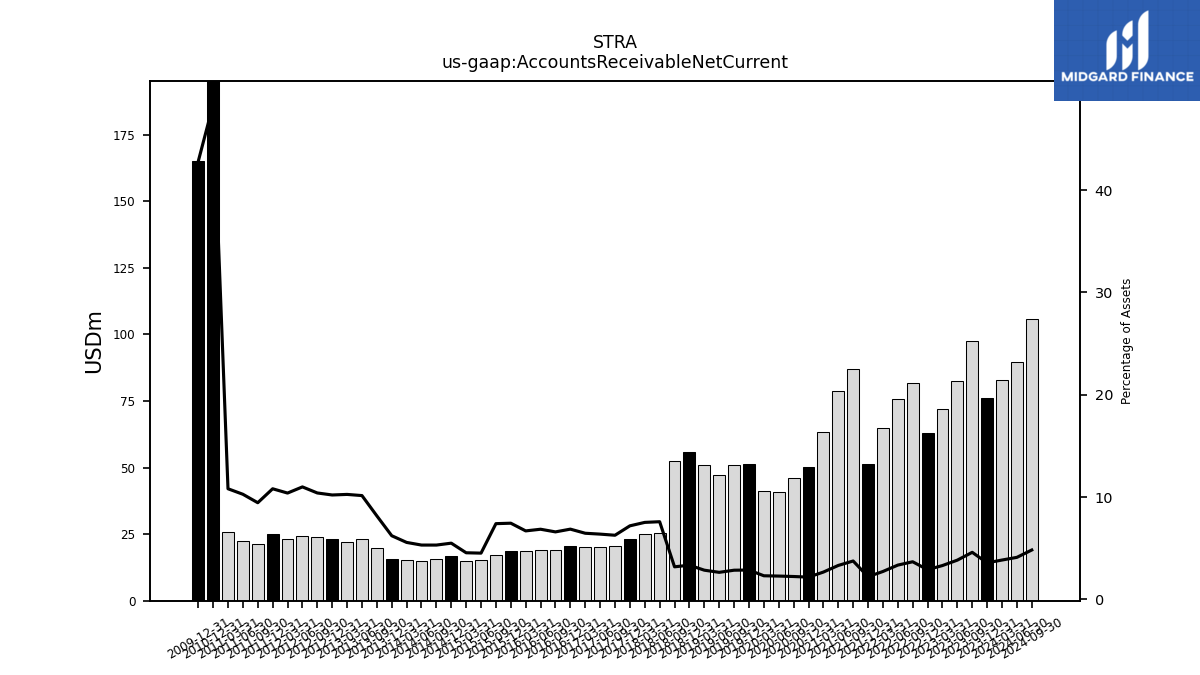
| Accounts Receivable Net Current | 83.08 | 76.10 | 97.43 | 82.37 | 71.86 | 62.95 | 81.68 | 75.94 | 64.80 | 51.28 | 87.12 | 78.61 | 63.47 | 50.17 | 45.96 | 41.00 | 41.34 | 51.52 | 50.96 | 47.34 | 50.84 | 55.69 | 52.53 | 25.59 | 25.00 | 23.12 | 20.63 | 20.34 | 20.32 | 20.53 | 18.93 | 19.05 | 18.61 | 18.52 | 17.06 | 15.22 | 14.96 | 16.94 | 15.71 | 15.01 | 15.48 | 15.84 | 19.69 | 23.34 | 22.18 | NA | 23.26 | 24.11 | 24.22 | 23.32 | 25.01 | 21.20 | 22.35 | 25.71 | 199.60 | NA | NA | NA | |
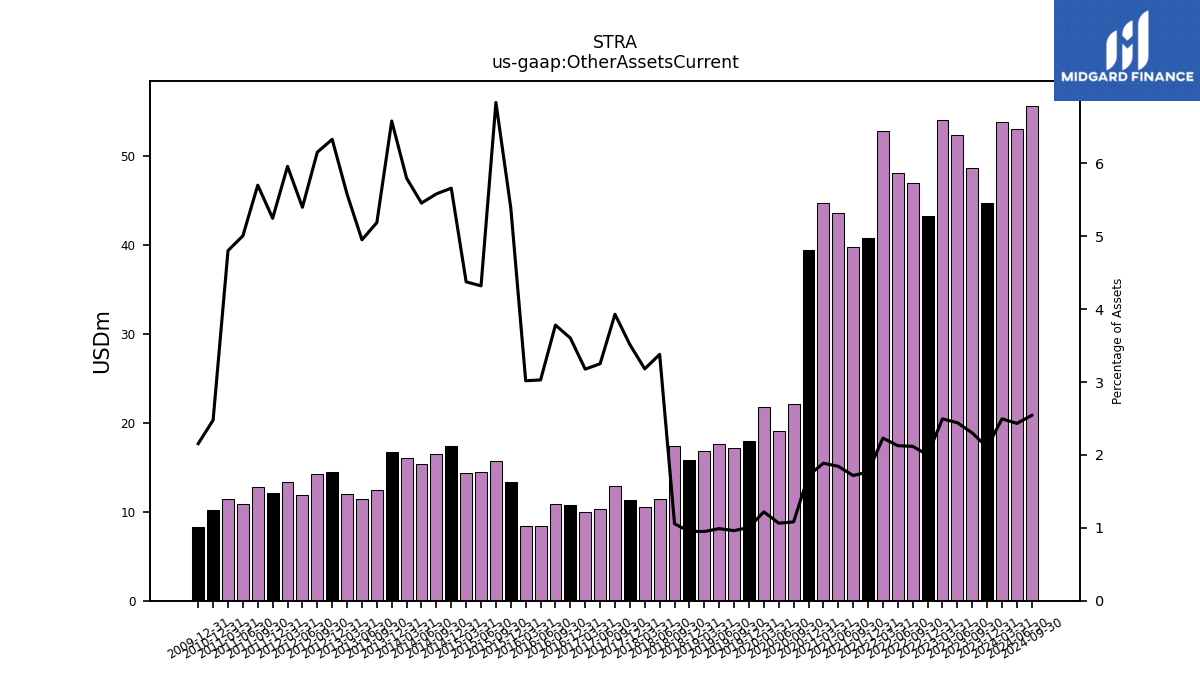
| Other Assets Current | 53.80 | 44.76 | 48.69 | 52.33 | 54.05 | 43.28 | 46.93 | 48.09 | 52.85 | 40.78 | 39.78 | 43.60 | 44.71 | 39.46 | 22.16 | 19.07 | 21.76 | 18.00 | 17.13 | 17.66 | 16.87 | 15.81 | 17.37 | 11.38 | 10.56 | 11.29 | 12.92 | 10.36 | 9.98 | 10.77 | 10.84 | 8.41 | 8.38 | 13.39 | 15.74 | 14.52 | 14.34 | 17.43 | 16.50 | 15.40 | 16.09 | 16.74 | 12.50 | 11.38 | 12.05 | NA | 14.42 | 14.26 | 11.89 | 13.37 | 12.13 | 12.79 | 10.88 | 11.41 | 10.23 | NA | NA | NA | |
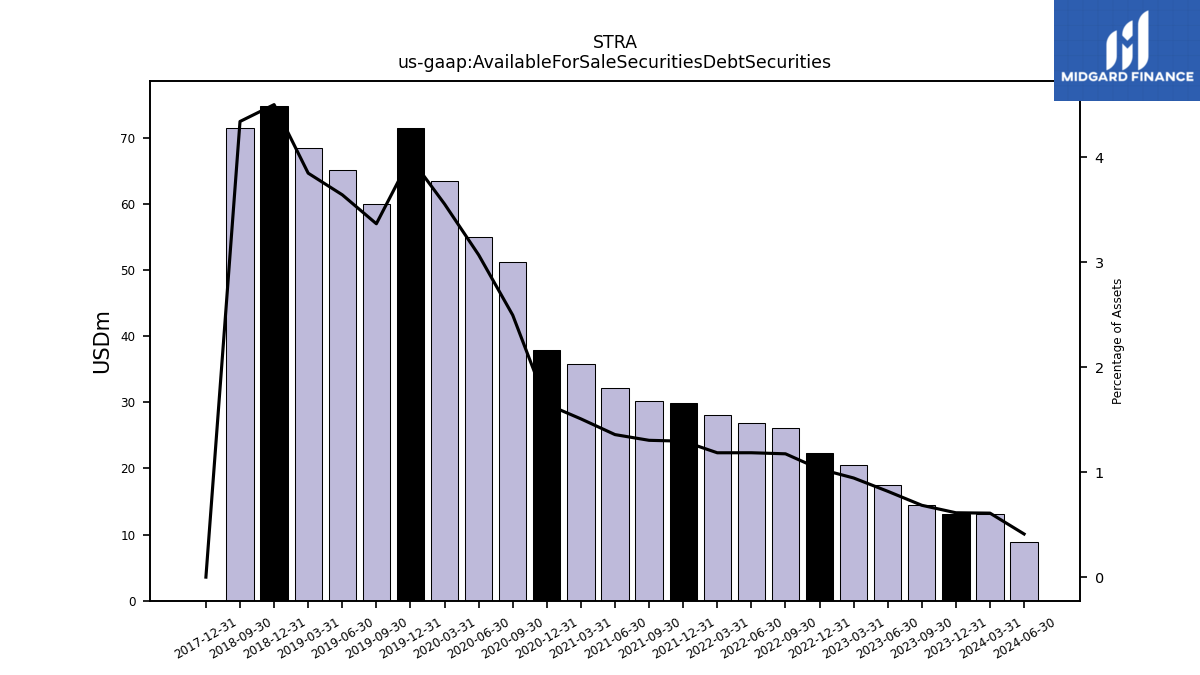
| Available For Sale Securities Debt Securities | 13.14 | 13.04 | 14.47 | 17.52 | 20.46 | 22.28 | 26.04 | 26.79 | 28.06 | 29.88 | 30.20 | 32.10 | 35.73 | 37.83 | 51.12 | 55.02 | 63.43 | 71.51 | 59.99 | 65.03 | 68.35 | 74.80 | 71.46 | NA | NA | 0.00 | NA | NA | NA | NA | NA | NA | NA | NA | NA | NA | NA | NA | NA | NA | NA | NA | NA | NA | NA | NA | NA | NA | NA | NA | NA | NA | NA | NA | NA | NA | NA | NA |
| 2024-03-31 | 2023-12-31 | 2023-09-30 | 2023-06-30 | 2023-03-31 | 2022-12-31 | 2022-09-30 | 2022-06-30 | 2022-03-31 | 2021-12-31 | 2021-09-30 | 2021-06-30 | 2021-03-31 | 2020-12-31 | 2020-09-30 | 2020-06-30 | 2020-03-31 | 2019-12-31 | 2019-09-30 | 2019-06-30 | 2019-03-31 | 2018-12-31 | 2018-09-30 | 2018-06-30 | 2018-03-31 | 2017-12-31 | 2017-09-30 | 2017-06-30 | 2017-03-31 | 2016-12-31 | 2016-09-30 | 2016-06-30 | 2016-03-31 | 2015-12-31 | 2015-09-30 | 2015-06-30 | 2015-03-31 | 2014-12-31 | 2014-09-30 | 2014-06-30 | 2014-03-31 | 2013-12-31 | 2013-09-30 | 2013-06-30 | 2013-03-31 | 2013-03-30 | 2012-12-31 | 2012-09-30 | 2012-06-30 | 2012-03-31 | 2011-12-31 | 2011-09-30 | 2011-06-30 | 2011-03-31 | 2010-12-31 | 2010-09-30 | 2010-06-30 | 2010-03-31 | ||
|---|---|---|---|---|---|---|---|---|---|---|---|---|---|---|---|---|---|---|---|---|---|---|---|---|---|---|---|---|---|---|---|---|---|---|---|---|---|---|---|---|---|---|---|---|---|---|---|---|---|---|---|---|---|---|---|---|---|---|---|
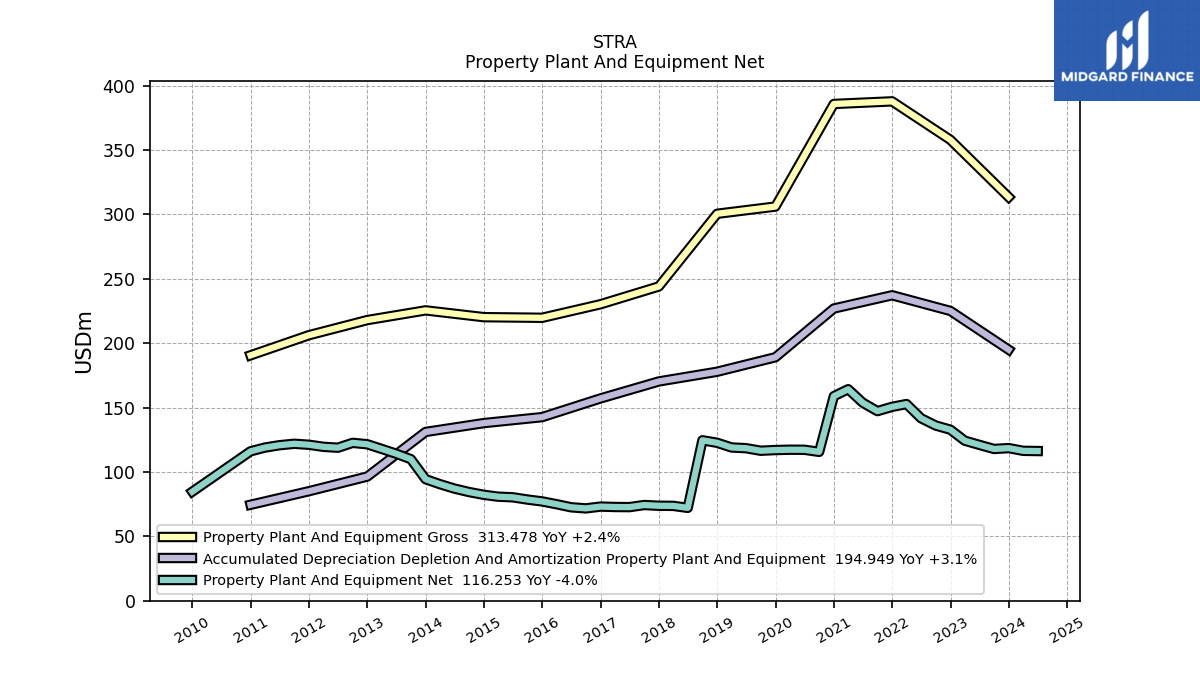
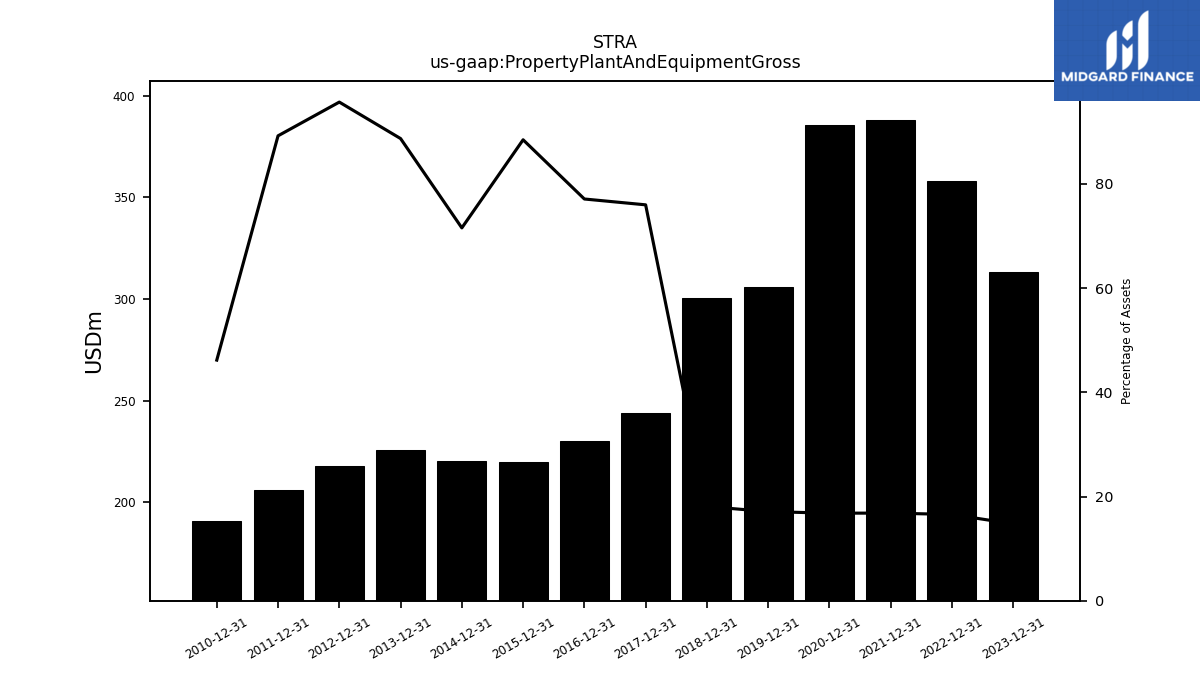
| Property Plant And Equipment Gross | NA | 313.48 | NA | NA | NA | 357.91 | NA | NA | NA | 387.81 | NA | NA | NA | 385.78 | NA | NA | NA | 306.11 | NA | NA | NA | 300.51 | NA | NA | NA | 244.06 | NA | NA | NA | 230.25 | NA | NA | NA | 219.73 | NA | NA | NA | 220.23 | NA | NA | NA | 225.49 | NA | NA | NA | NA | 217.96 | NA | NA | NA | 206.19 | NA | NA | NA | 190.59 | NA | NA | NA | |
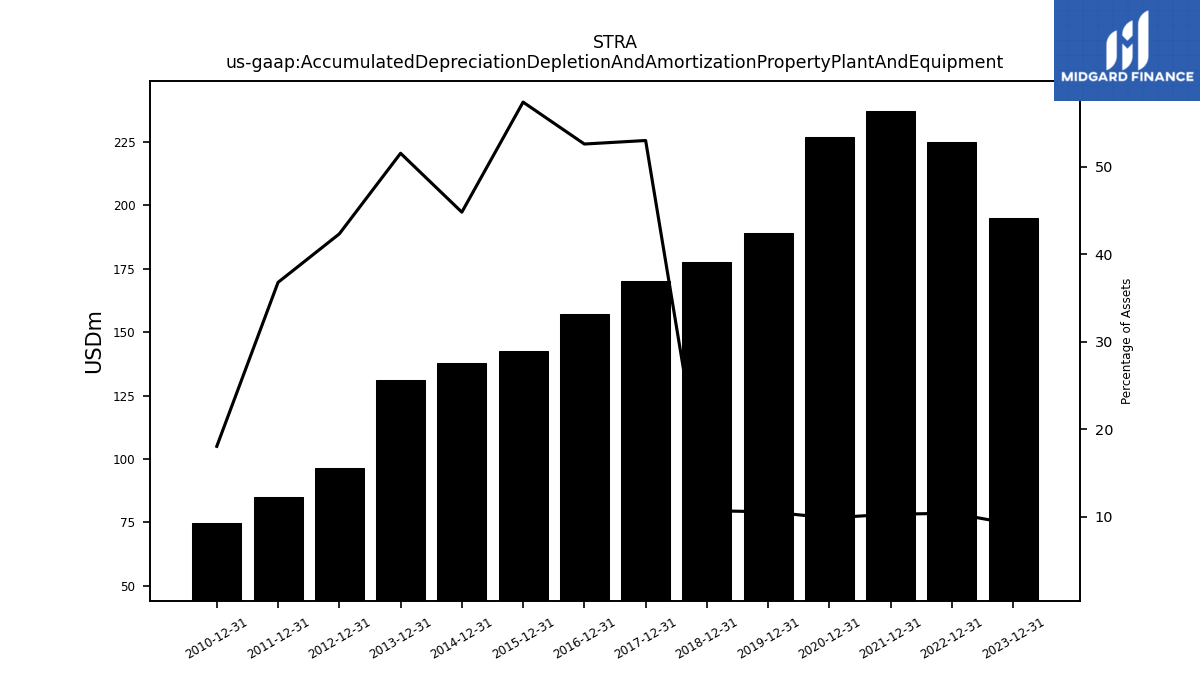
| Accumulated Depreciation Depletion And Amortization Property Plant And Equipment | NA | 194.95 | NA | NA | NA | 225.07 | NA | NA | NA | 237.22 | NA | NA | NA | 226.93 | NA | NA | NA | 189.08 | NA | NA | NA | 177.83 | NA | NA | NA | 170.30 | NA | NA | NA | 157.13 | NA | NA | NA | 142.59 | NA | NA | NA | 137.96 | NA | NA | NA | 131.07 | NA | NA | NA | NA | 96.44 | NA | NA | NA | 85.04 | NA | NA | NA | 74.53 | NA | NA | NA | |
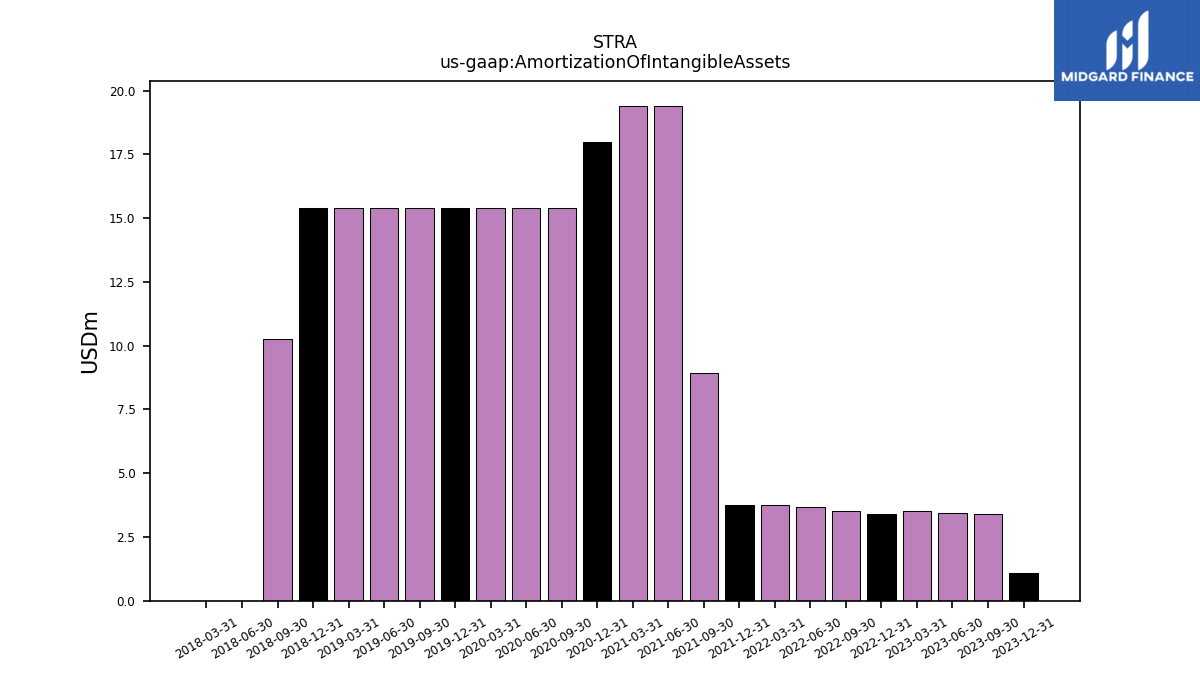
| Amortization Of Intangible Assets | NA | 1.09 | 3.38 | 3.45 | 3.53 | 3.40 | 3.52 | 3.69 | 3.74 | 3.76 | 8.93 | 19.39 | 19.41 | 17.97 | 15.42 | 15.42 | 15.42 | 15.42 | 15.42 | 15.42 | 15.42 | 15.42 | 10.28 | 0.00 | 0.00 | NA | NA | NA | NA | NA | NA | NA | NA | NA | NA | NA | NA | NA | NA | NA | NA | NA | NA | NA | NA | NA | NA | NA | NA | NA | NA | NA | NA | NA | NA | NA | NA | NA | |
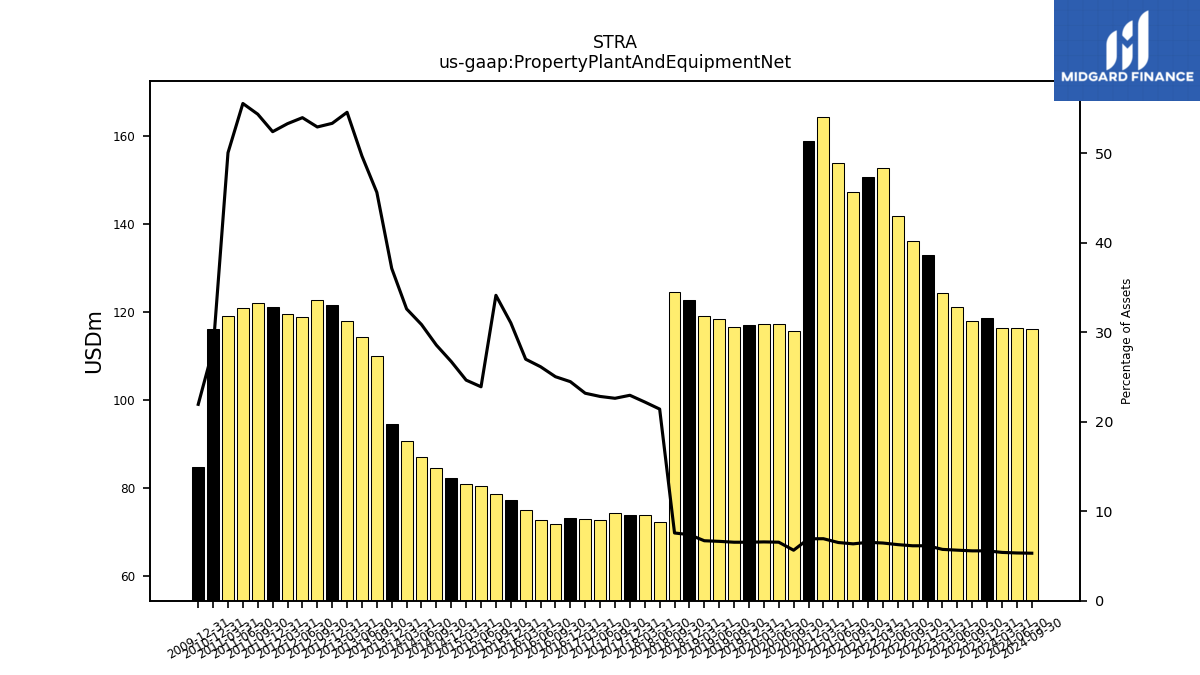
| Property Plant And Equipment Net | 116.42 | 118.53 | 117.87 | 121.07 | 124.30 | 132.84 | 136.07 | 141.74 | 152.74 | 150.59 | 147.25 | 153.81 | 164.28 | 158.85 | 115.61 | 117.25 | 117.28 | 117.03 | 116.49 | 118.46 | 119.04 | 122.68 | 124.61 | 72.12 | 73.69 | 73.76 | 74.33 | 72.71 | 72.80 | 73.12 | 71.72 | 72.58 | 74.95 | 77.14 | 78.59 | 80.34 | 80.80 | 82.27 | 84.40 | 87.10 | 90.53 | 94.42 | 109.96 | 114.20 | 117.91 | NA | 121.52 | 122.62 | 118.84 | 119.54 | 121.15 | 121.90 | 120.77 | 118.96 | 116.06 | NA | NA | NA | |
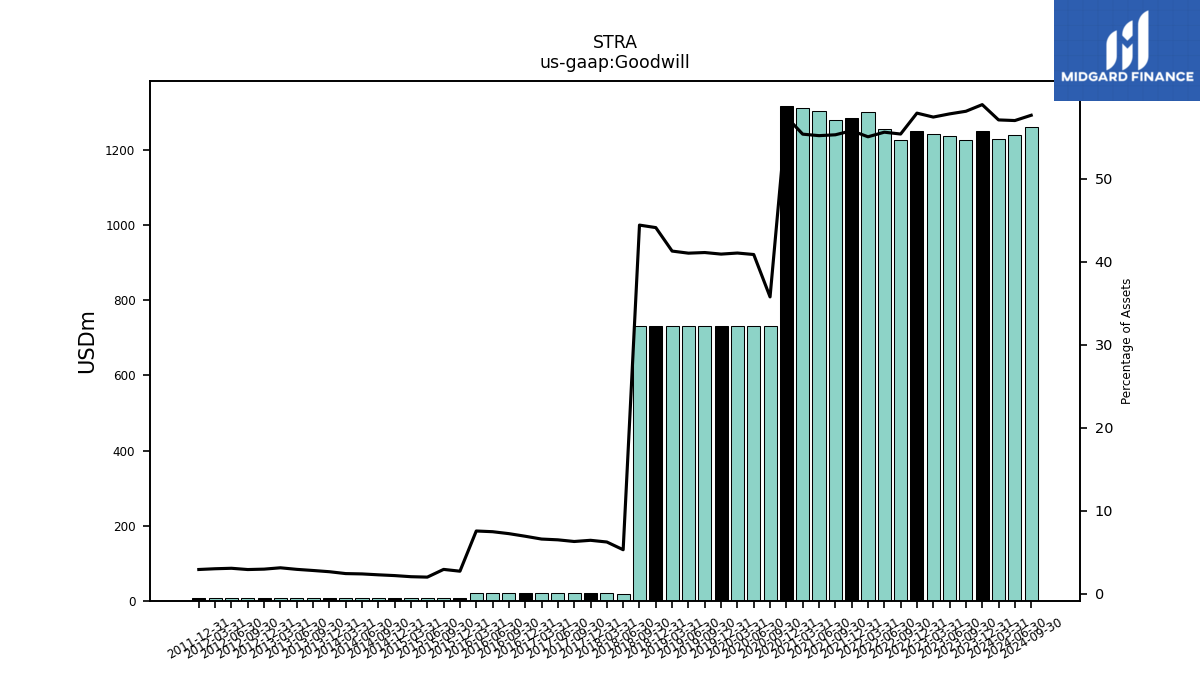
| Goodwill | 1229.88 | 1251.89 | 1228.43 | 1237.98 | 1243.33 | 1251.28 | 1226.50 | 1256.43 | 1303.17 | 1285.86 | 1280.22 | 1303.86 | 1311.49 | 1318.53 | 732.08 | 732.08 | 732.08 | 732.08 | 732.08 | 732.10 | 732.80 | 732.54 | 730.73 | 17.92 | 20.74 | 20.74 | 20.74 | 20.74 | 20.74 | 20.74 | 20.79 | 20.79 | 21.04 | 6.80 | 6.80 | 6.80 | 6.80 | 6.80 | 6.80 | 6.80 | 6.80 | 6.80 | 6.80 | 6.80 | 6.80 | NA | 6.80 | 6.80 | 6.80 | 6.80 | 6.80 | NA | NA | NA | NA | NA | NA | NA | |
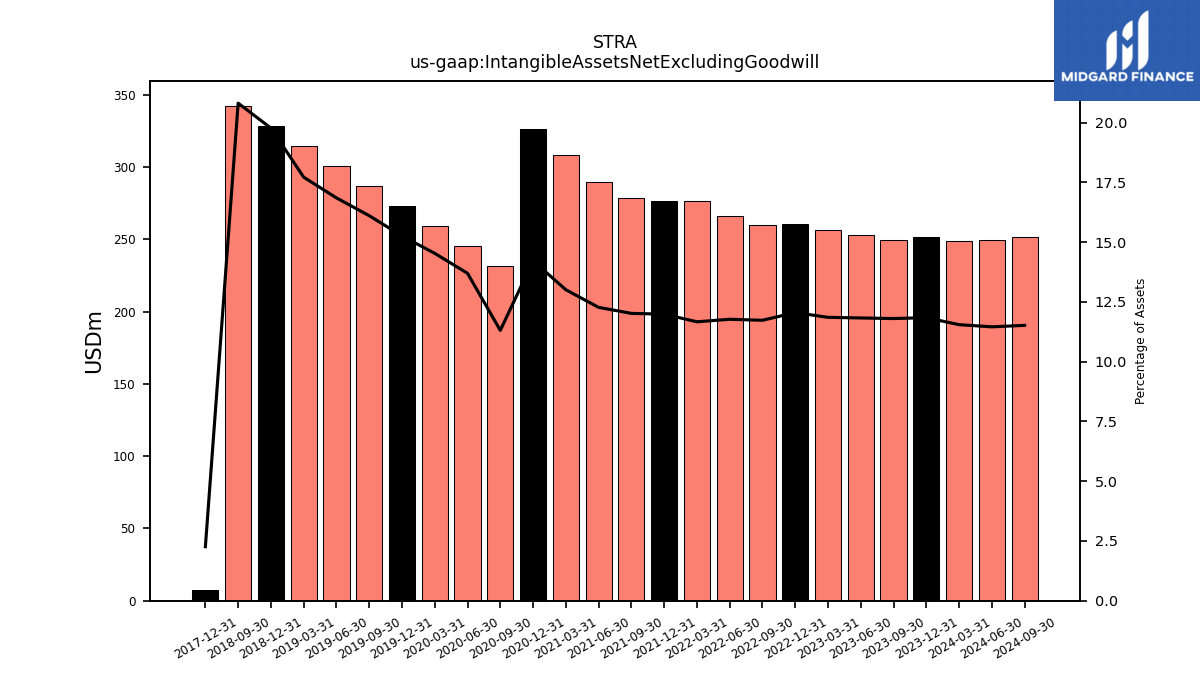
| Intangible Assets Net Excluding Goodwill | 248.85 | 251.62 | 249.51 | 253.35 | 256.71 | 260.54 | 259.86 | 266.08 | 276.27 | 276.38 | 278.37 | 289.99 | 308.19 | 326.42 | 231.51 | 245.34 | 259.18 | 273.01 | 286.84 | 300.68 | 314.51 | 328.34 | 342.48 | NA | NA | 7.26 | NA | NA | NA | NA | NA | NA | NA | NA | NA | NA | NA | NA | NA | NA | NA | NA | NA | NA | NA | NA | NA | NA | NA | NA | NA | NA | NA | NA | NA | NA | NA | NA | |
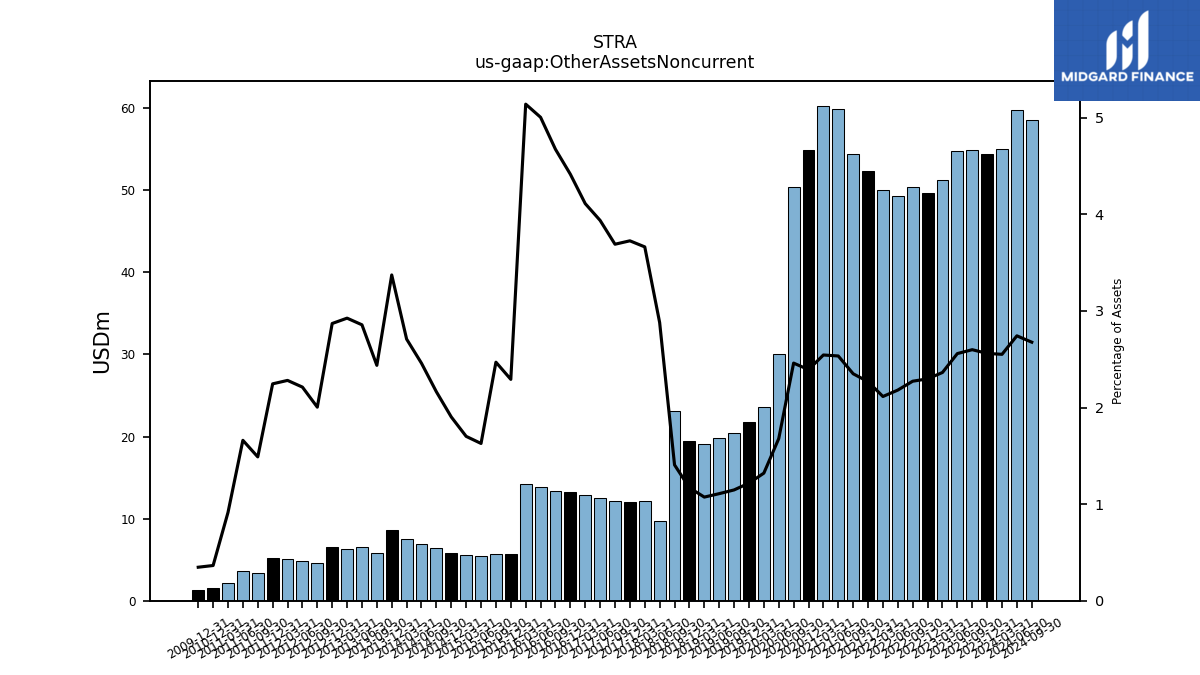
| Other Assets Noncurrent | 54.98 | 54.42 | 54.95 | 54.81 | 51.18 | 49.65 | 50.35 | 49.30 | 50.07 | 52.30 | 54.42 | 59.89 | 60.28 | 54.93 | 50.37 | 30.07 | 23.57 | 21.79 | 20.43 | 19.78 | 19.05 | 19.43 | 23.14 | 9.70 | 12.15 | 11.97 | 12.13 | 12.54 | 12.91 | 13.19 | 13.39 | 13.89 | 14.28 | 5.69 | 5.69 | 5.47 | 5.58 | 5.86 | 6.39 | 6.94 | 7.52 | 8.58 | 5.87 | 6.57 | 6.32 | NA | 6.54 | 4.64 | 4.87 | 5.12 | 5.19 | 3.34 | 3.61 | 2.17 | 1.51 | NA | NA | NA | |
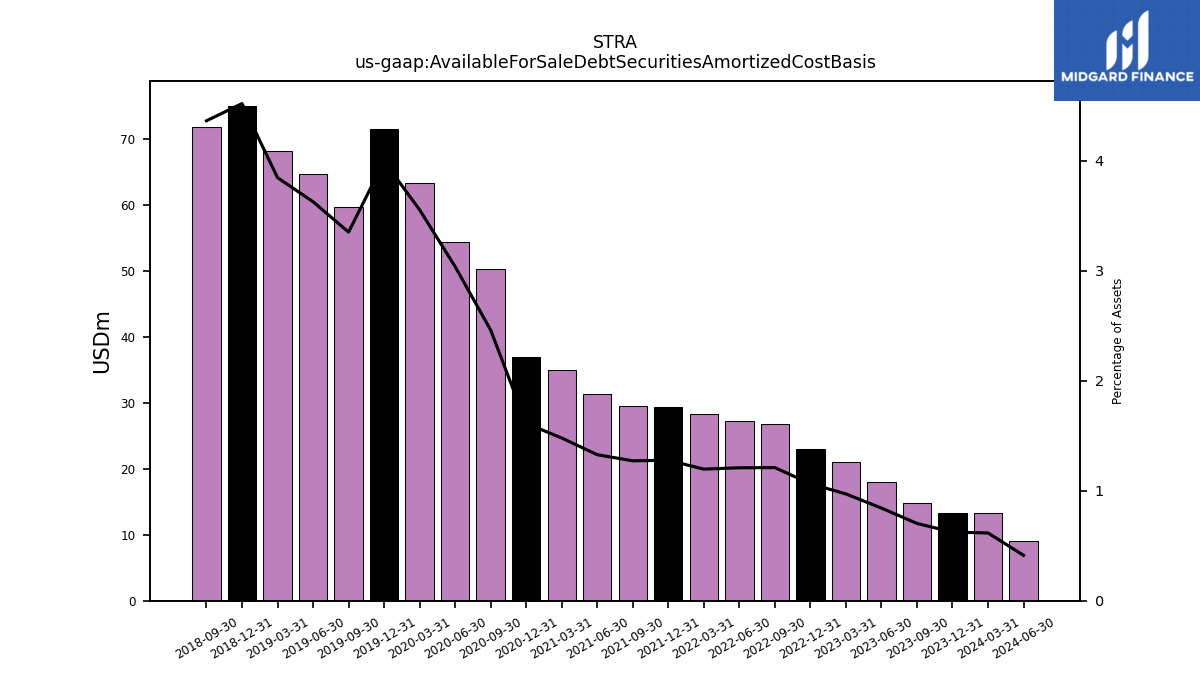
| Available For Sale Debt Securities Amortized Cost Basis | 13.28 | 13.26 | 14.86 | 18.04 | 21.03 | 22.99 | 26.82 | 27.32 | 28.33 | 29.44 | 29.46 | 31.38 | 35.06 | 37.01 | 50.37 | 54.41 | 63.38 | 71.48 | 59.68 | 64.72 | 68.27 | 75.06 | 71.80 | NA | NA | NA | NA | NA | NA | NA | NA | NA | NA | NA | NA | NA | NA | NA | NA | NA | NA | NA | NA | NA | NA | NA | NA | NA | NA | NA | NA | NA | NA | NA | NA | NA | NA | NA | |
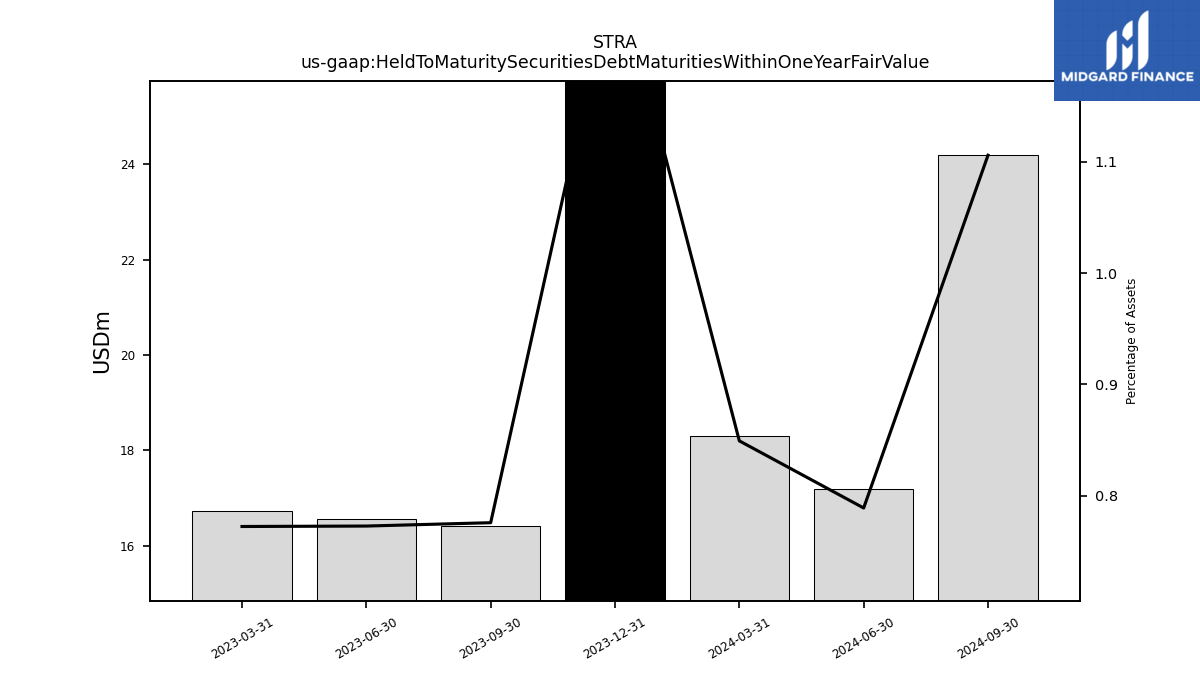
| Held To Maturity Securities Debt Maturities Within One Year Fair Value | 18.30 | 27.18 | 16.40 | 16.55 | 16.73 | NA | NA | NA | NA | NA | NA | NA | NA | NA | NA | NA | NA | NA | NA | NA | NA | NA | NA | NA | NA | NA | NA | NA | NA | NA | NA | NA | NA | NA | NA | NA | NA | NA | NA | NA | NA | NA | NA | NA | NA | NA | NA | NA | NA | NA | NA | NA | NA | NA | NA | NA | NA | NA |
| 2024-03-31 | 2023-12-31 | 2023-09-30 | 2023-06-30 | 2023-03-31 | 2022-12-31 | 2022-09-30 | 2022-06-30 | 2022-03-31 | 2021-12-31 | 2021-09-30 | 2021-06-30 | 2021-03-31 | 2020-12-31 | 2020-09-30 | 2020-06-30 | 2020-03-31 | 2019-12-31 | 2019-09-30 | 2019-06-30 | 2019-03-31 | 2018-12-31 | 2018-09-30 | 2018-06-30 | 2018-03-31 | 2017-12-31 | 2017-09-30 | 2017-06-30 | 2017-03-31 | 2016-12-31 | 2016-09-30 | 2016-06-30 | 2016-03-31 | 2015-12-31 | 2015-09-30 | 2015-06-30 | 2015-03-31 | 2014-12-31 | 2014-09-30 | 2014-06-30 | 2014-03-31 | 2013-12-31 | 2013-09-30 | 2013-06-30 | 2013-03-31 | 2013-03-30 | 2012-12-31 | 2012-09-30 | 2012-06-30 | 2012-03-31 | 2011-12-31 | 2011-09-30 | 2011-06-30 | 2011-03-31 | 2010-12-31 | 2010-09-30 | 2010-06-30 | 2010-03-31 | ||
|---|---|---|---|---|---|---|---|---|---|---|---|---|---|---|---|---|---|---|---|---|---|---|---|---|---|---|---|---|---|---|---|---|---|---|---|---|---|---|---|---|---|---|---|---|---|---|---|---|---|---|---|---|---|---|---|---|---|---|---|
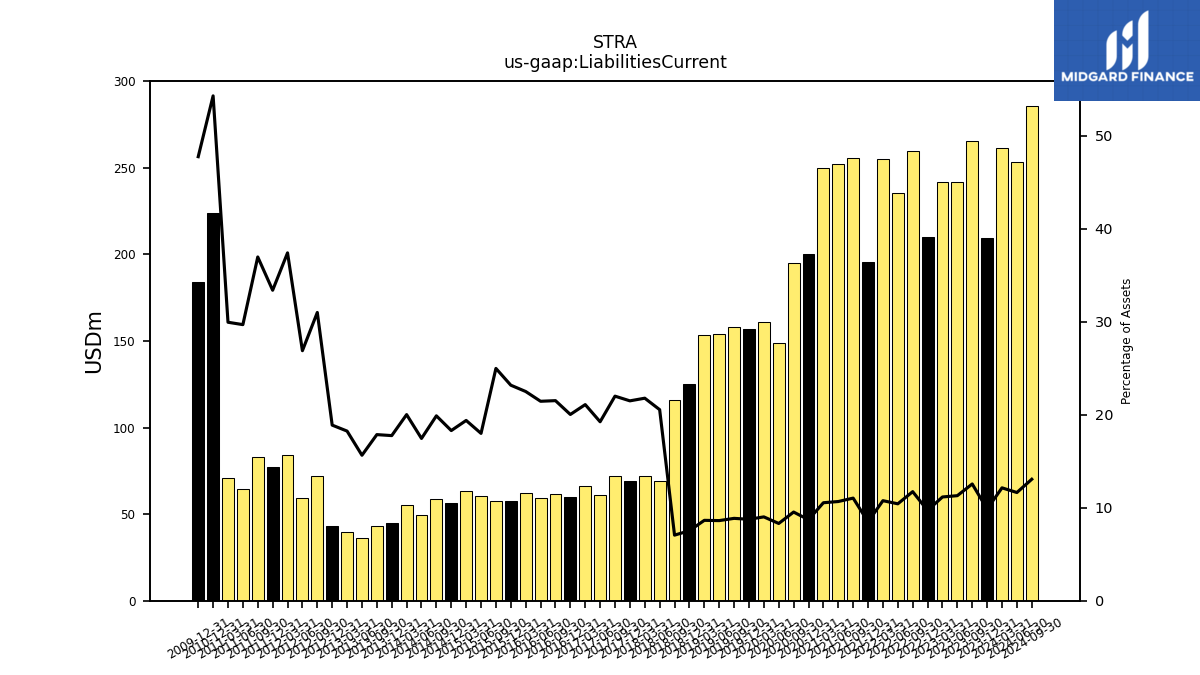
| Liabilities Current | 261.72 | 209.62 | 265.49 | 242.09 | 241.71 | 209.94 | 259.92 | 235.63 | 254.84 | 195.75 | 255.65 | 252.19 | 249.76 | 200.05 | 195.29 | 148.88 | 160.89 | 156.75 | 157.83 | 153.82 | 153.52 | 125.13 | 116.12 | 69.20 | 72.28 | 69.07 | 72.30 | 61.30 | 66.23 | 59.84 | 61.65 | 59.54 | 62.49 | 57.59 | 57.53 | 60.47 | 63.56 | 56.34 | 58.76 | 49.26 | 55.57 | 45.16 | 43.05 | 35.96 | 39.42 | NA | 43.02 | 71.81 | 59.20 | 83.89 | 77.18 | 82.89 | 64.54 | 71.17 | 224.12 | NA | NA | NA | |
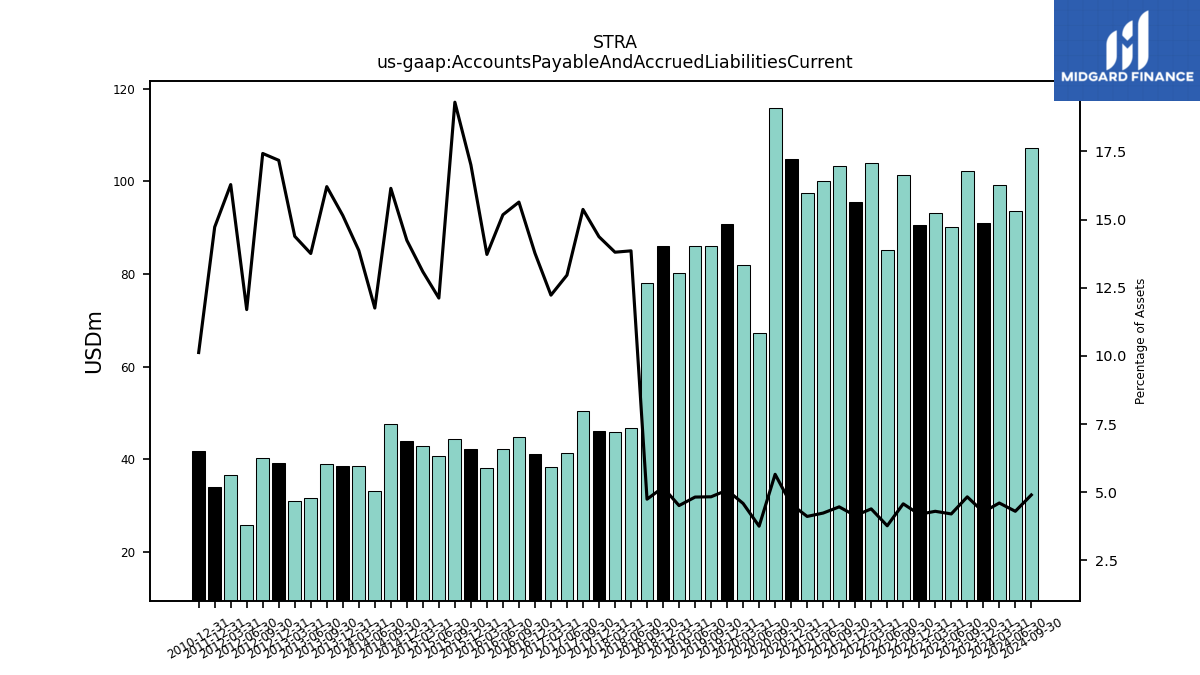
| Accounts Payable And Accrued Liabilities Current | 99.25 | 90.89 | 102.12 | 90.06 | 93.15 | 90.59 | 101.36 | 85.21 | 103.93 | 95.52 | 103.38 | 100.12 | 97.45 | 104.74 | 115.83 | 67.26 | 81.86 | 90.83 | 86.09 | 86.07 | 80.08 | 85.98 | 78.09 | 46.66 | 45.81 | 46.18 | 50.51 | 41.29 | 38.40 | 41.13 | 44.82 | 42.13 | 38.11 | 42.25 | 44.46 | 40.73 | 42.91 | 43.84 | 47.71 | 33.17 | 38.50 | 38.53 | 39.06 | 31.62 | 31.08 | NA | 39.12 | 40.36 | 25.76 | 36.52 | 34.04 | NA | NA | NA | 41.79 | NA | NA | NA | |
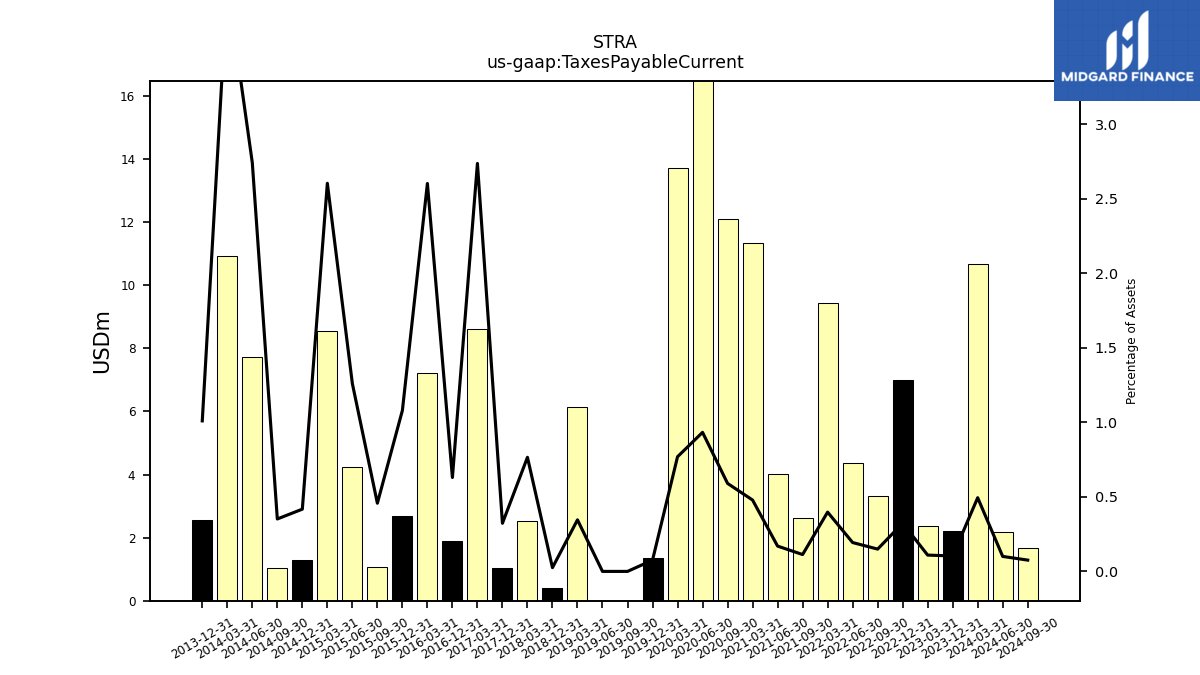
| Taxes Payable Current | 10.66 | 2.20 | NA | NA | 2.37 | 6.99 | 3.32 | 4.38 | 9.42 | NA | 2.62 | 4.01 | 11.35 | NA | 12.09 | 16.72 | 13.73 | 1.35 | 0.00 | 0.00 | 6.14 | 0.42 | NA | NA | 2.54 | 1.04 | NA | NA | 8.60 | 1.88 | NA | NA | 7.23 | 2.68 | 1.05 | 4.24 | 8.54 | 1.29 | 1.04 | 7.74 | 10.94 | 2.57 | NA | NA | NA | NA | NA | NA | NA | NA | NA | NA | NA | NA | NA | NA | NA | NA | |
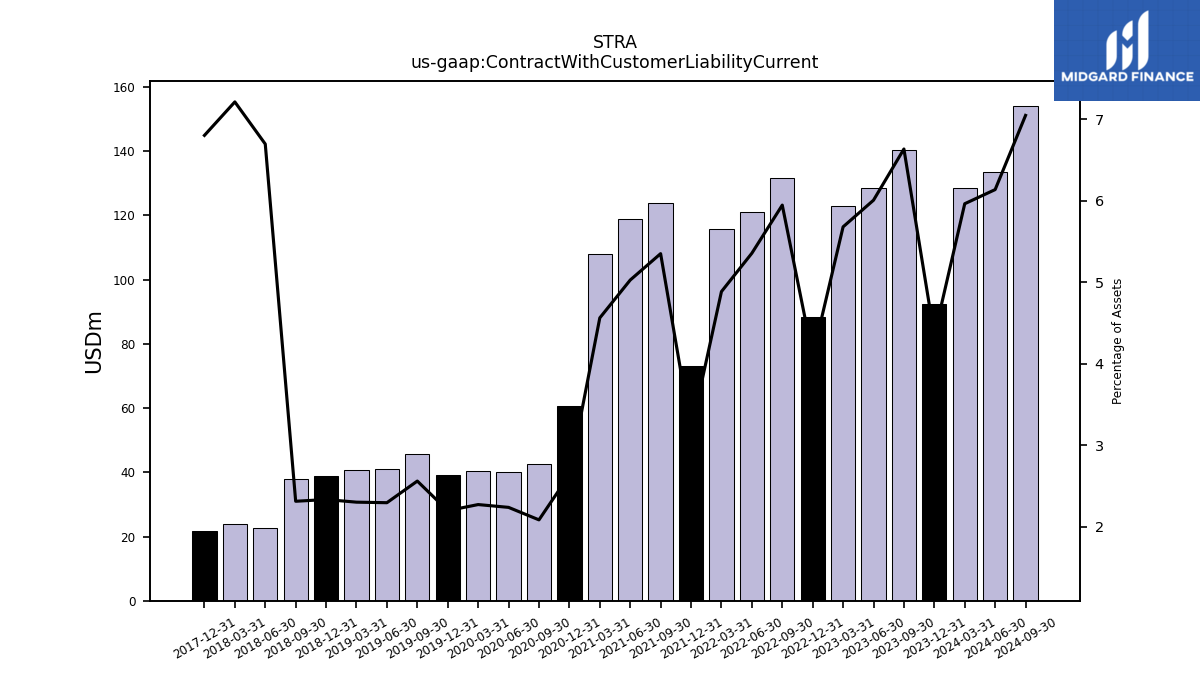
| Contract With Customer Liability Current | 128.50 | 92.34 | 140.25 | 128.65 | 122.98 | 88.49 | 131.71 | 121.03 | 115.65 | 73.23 | 123.91 | 118.77 | 108.07 | 60.50 | 42.63 | 40.05 | 40.49 | 39.28 | 45.57 | 40.92 | 40.83 | 38.73 | 38.02 | 22.55 | 23.93 | 21.85 | NA | NA | NA | NA | NA | NA | NA | NA | NA | NA | NA | NA | NA | NA | NA | NA | NA | NA | NA | NA | NA | NA | NA | NA | NA | NA | NA | NA | NA | NA | NA | NA |
| 2024-03-31 | 2023-12-31 | 2023-09-30 | 2023-06-30 | 2023-03-31 | 2022-12-31 | 2022-09-30 | 2022-06-30 | 2022-03-31 | 2021-12-31 | 2021-09-30 | 2021-06-30 | 2021-03-31 | 2020-12-31 | 2020-09-30 | 2020-06-30 | 2020-03-31 | 2019-12-31 | 2019-09-30 | 2019-06-30 | 2019-03-31 | 2018-12-31 | 2018-09-30 | 2018-06-30 | 2018-03-31 | 2017-12-31 | 2017-09-30 | 2017-06-30 | 2017-03-31 | 2016-12-31 | 2016-09-30 | 2016-06-30 | 2016-03-31 | 2015-12-31 | 2015-09-30 | 2015-06-30 | 2015-03-31 | 2014-12-31 | 2014-09-30 | 2014-06-30 | 2014-03-31 | 2013-12-31 | 2013-09-30 | 2013-06-30 | 2013-03-31 | 2013-03-30 | 2012-12-31 | 2012-09-30 | 2012-06-30 | 2012-03-31 | 2011-12-31 | 2011-09-30 | 2011-06-30 | 2011-03-31 | 2010-12-31 | 2010-09-30 | 2010-06-30 | 2010-03-31 | ||
|---|---|---|---|---|---|---|---|---|---|---|---|---|---|---|---|---|---|---|---|---|---|---|---|---|---|---|---|---|---|---|---|---|---|---|---|---|---|---|---|---|---|---|---|---|---|---|---|---|---|---|---|---|---|---|---|---|---|---|---|
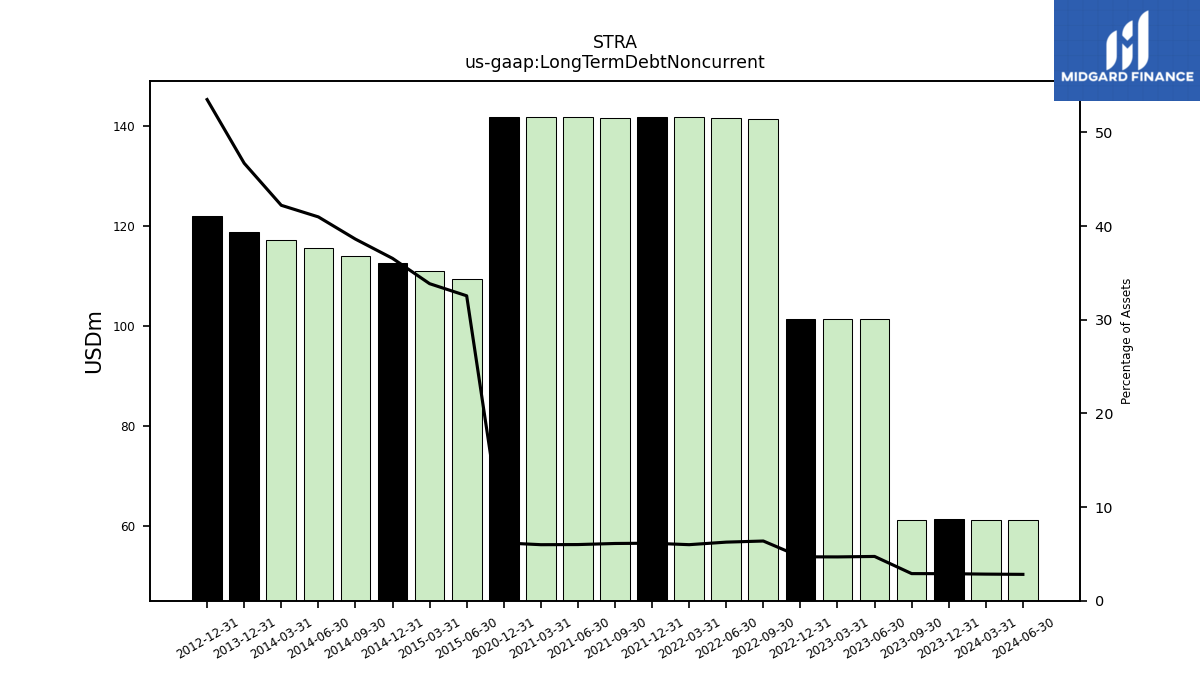
| Long Term Debt Noncurrent | 61.26 | 61.40 | 61.25 | 101.31 | 101.34 | 101.40 | 141.23 | 141.44 | 141.74 | 141.63 | 141.59 | 141.75 | 141.80 | 141.82 | NA | NA | NA | NA | NA | NA | NA | NA | NA | NA | NA | NA | NA | NA | NA | NA | NA | NA | NA | NA | NA | 109.38 | 110.94 | 112.50 | 114.06 | 115.62 | 117.19 | 118.75 | NA | NA | NA | NA | 121.88 | NA | NA | NA | NA | NA | NA | NA | NA | NA | NA | NA | |
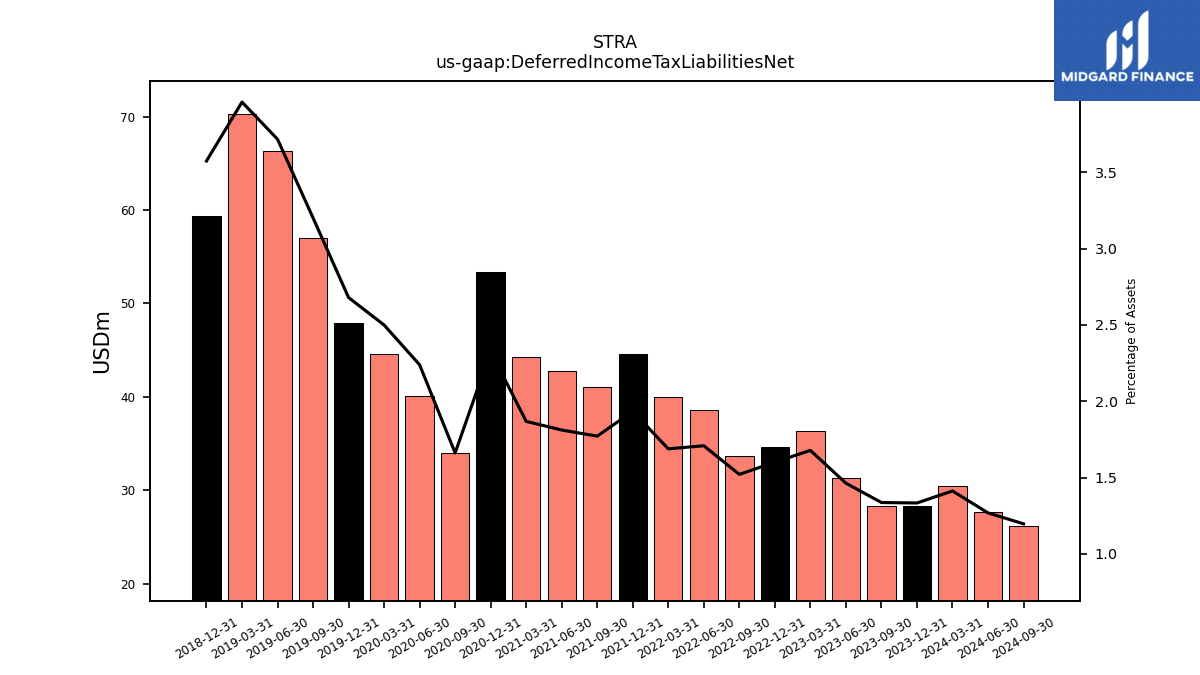
| Deferred Income Tax Liabilities Net | 30.44 | 28.34 | 28.25 | 31.34 | 36.34 | 34.60 | 33.69 | 38.61 | 39.97 | 44.59 | 41.02 | 42.81 | 44.26 | 53.41 | 34.01 | 40.11 | 44.58 | 47.94 | 57.02 | 66.32 | 70.30 | 59.36 | NA | NA | NA | NA | NA | NA | NA | NA | NA | NA | NA | NA | NA | NA | NA | NA | NA | NA | NA | NA | NA | NA | NA | NA | NA | NA | NA | NA | NA | NA | NA | NA | NA | NA | NA | NA | |
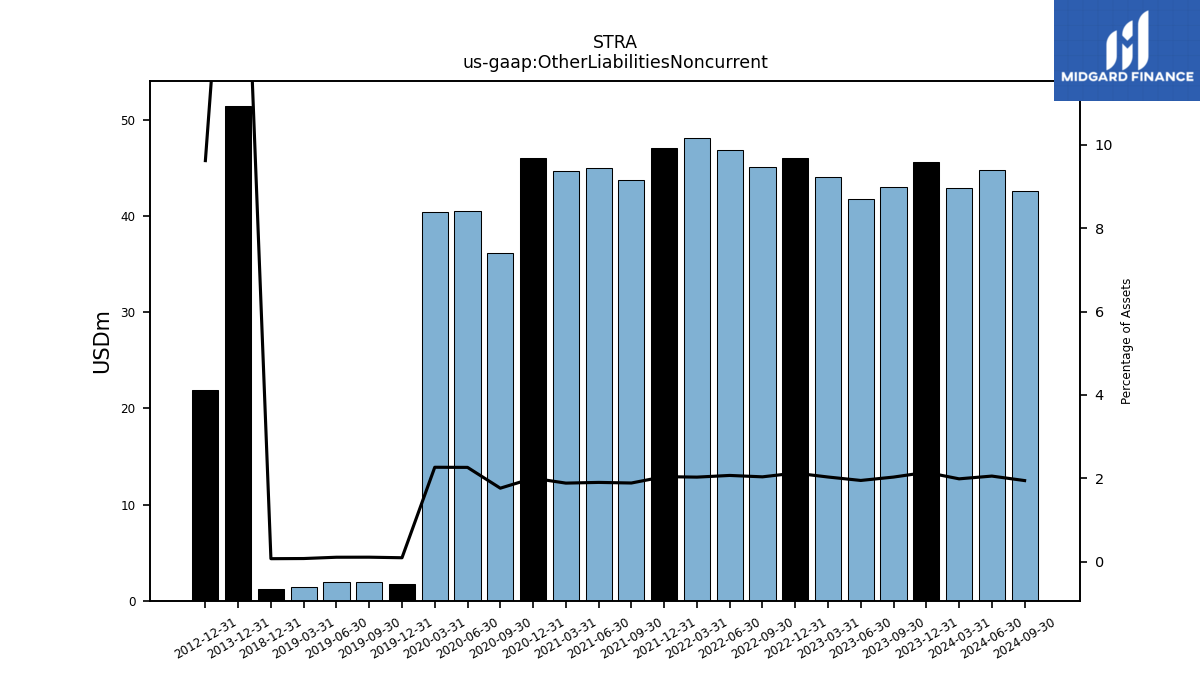
| Other Liabilities Noncurrent | 42.88 | 45.60 | 42.96 | 41.79 | 44.04 | 46.01 | 45.14 | 46.81 | 48.09 | 47.09 | 43.77 | 45.00 | 44.72 | 46.05 | 36.15 | 40.56 | 40.44 | 1.76 | 1.99 | 1.98 | 1.42 | 1.26 | NA | NA | NA | NA | NA | NA | NA | NA | NA | NA | NA | NA | NA | NA | NA | NA | NA | NA | NA | 51.46 | NA | NA | NA | NA | 21.91 | NA | NA | NA | NA | NA | NA | NA | NA | NA | NA | NA | |
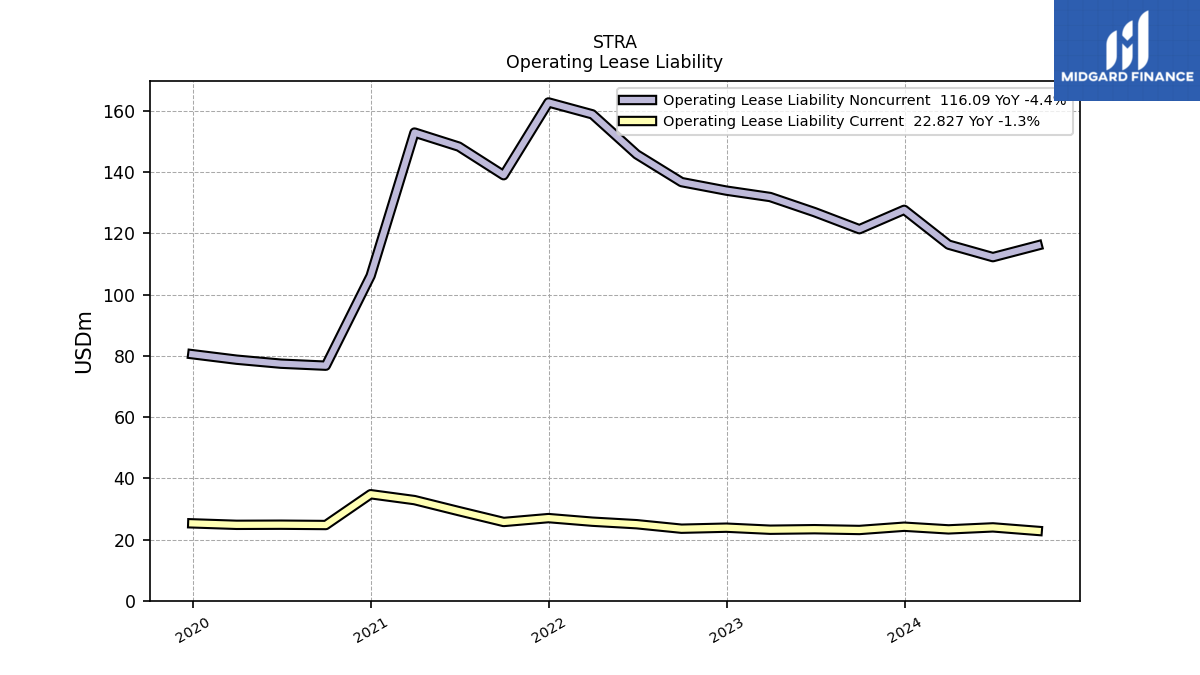
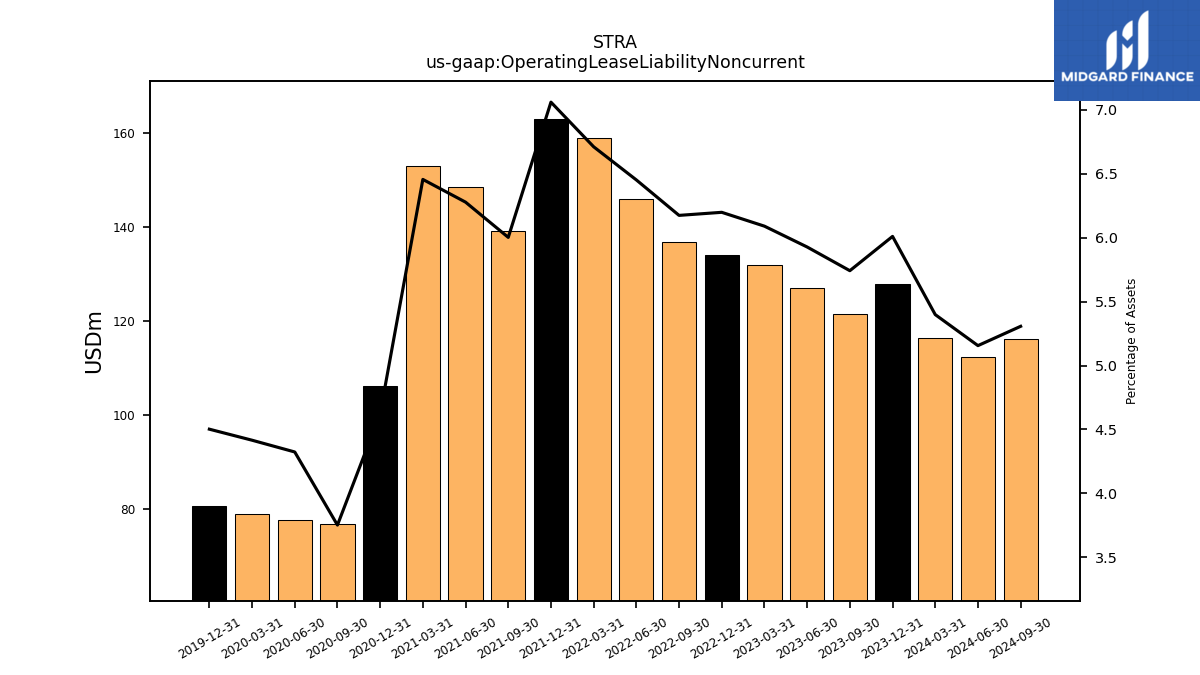
| Operating Lease Liability Noncurrent | 116.35 | 127.73 | 121.39 | 126.97 | 131.91 | 134.01 | 136.79 | 145.84 | 158.93 | 162.82 | 139.03 | 148.38 | 152.98 | 106.15 | 76.80 | 77.46 | 78.77 | 80.56 | NA | NA | NA | NA | NA | NA | NA | NA | NA | NA | NA | NA | NA | NA | NA | NA | NA | NA | NA | NA | NA | NA | NA | NA | NA | NA | NA | NA | NA | NA | NA | NA | NA | NA | NA | NA | NA | NA | NA | NA |
| 2024-03-31 | 2023-12-31 | 2023-09-30 | 2023-06-30 | 2023-03-31 | 2022-12-31 | 2022-09-30 | 2022-06-30 | 2022-03-31 | 2021-12-31 | 2021-09-30 | 2021-06-30 | 2021-03-31 | 2020-12-31 | 2020-09-30 | 2020-06-30 | 2020-03-31 | 2019-12-31 | 2019-09-30 | 2019-06-30 | 2019-03-31 | 2018-12-31 | 2018-09-30 | 2018-06-30 | 2018-03-31 | 2017-12-31 | 2017-09-30 | 2017-06-30 | 2017-03-31 | 2016-12-31 | 2016-09-30 | 2016-06-30 | 2016-03-31 | 2015-12-31 | 2015-09-30 | 2015-06-30 | 2015-03-31 | 2014-12-31 | 2014-09-30 | 2014-06-30 | 2014-03-31 | 2013-12-31 | 2013-09-30 | 2013-06-30 | 2013-03-31 | 2013-03-30 | 2012-12-31 | 2012-09-30 | 2012-06-30 | 2012-03-31 | 2011-12-31 | 2011-09-30 | 2011-06-30 | 2011-03-31 | 2010-12-31 | 2010-09-30 | 2010-06-30 | 2010-03-31 | ||
|---|---|---|---|---|---|---|---|---|---|---|---|---|---|---|---|---|---|---|---|---|---|---|---|---|---|---|---|---|---|---|---|---|---|---|---|---|---|---|---|---|---|---|---|---|---|---|---|---|---|---|---|---|---|---|---|---|---|---|---|
| Stockholders Equity | 1642.58 | 1652.52 | 1594.75 | 1598.61 | 1610.43 | 1635.79 | 1598.48 | 1651.92 | 1724.31 | 1713.99 | 1695.06 | 1733.18 | 1735.92 | 1748.32 | 1705.06 | 1484.55 | 1459.15 | 1462.71 | 1444.66 | 1437.88 | 1423.44 | 1425.22 | 1408.33 | 223.84 | 218.29 | 209.20 | 215.49 | 209.20 | 198.53 | 188.37 | 173.22 | 167.94 | 158.12 | 142.86 | 127.18 | 120.66 | 106.36 | 92.73 | 77.72 | 69.96 | 54.17 | 38.90 | 56.97 | 50.95 | 32.32 | NA | 40.99 | 64.99 | 69.25 | 56.03 | 42.29 | 43.75 | 38.37 | 73.30 | 176.00 | 192.98 | 227.16 | 205.80 | |
| Common Stock Value | 0.25 | 0.24 | 0.24 | 0.24 | 0.25 | 0.24 | 0.24 | 0.25 | 0.25 | 0.25 | 0.25 | 0.25 | 0.25 | 0.24 | 0.24 | 0.22 | 0.22 | 0.22 | 0.22 | 0.22 | 0.22 | 0.22 | 0.22 | 0.11 | 0.11 | 0.11 | 0.11 | 0.11 | 0.11 | 0.11 | 0.11 | 0.11 | 0.11 | 0.11 | 0.11 | 0.11 | 0.11 | 0.11 | 0.11 | 0.11 | 0.11 | 0.11 | 0.11 | 0.11 | 0.11 | NA | 0.11 | 0.12 | 0.12 | 0.12 | 0.12 | 0.12 | 0.12 | 0.12 | 0.13 | NA | NA | NA | |
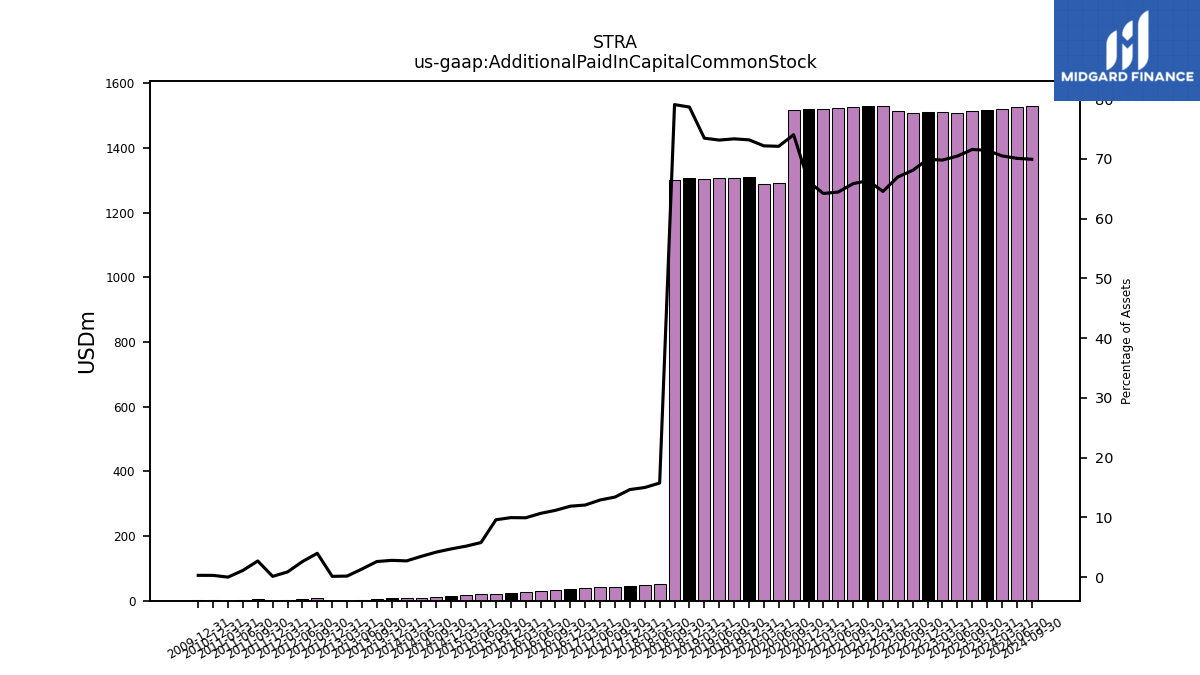
| Additional Paid In Capital Common Stock | 1519.29 | 1517.65 | 1513.02 | 1509.08 | 1511.59 | 1510.92 | 1507.90 | 1513.51 | 1528.33 | 1529.97 | 1525.19 | 1523.02 | 1521.14 | 1519.55 | 1515.66 | 1291.60 | 1287.41 | 1309.44 | 1306.35 | 1305.15 | 1304.17 | 1306.65 | 1301.23 | 53.02 | 49.77 | 47.08 | 44.02 | 41.11 | 37.88 | 35.45 | 32.02 | 29.61 | 27.58 | 24.74 | 22.10 | 19.45 | 17.00 | 14.55 | 12.38 | 9.83 | 7.54 | 7.14 | 6.29 | 3.12 | 0.38 | NA | 0.30 | 9.23 | 5.73 | 1.94 | 0.29 | 6.06 | 2.44 | 0.00 | 1.21 | NA | NA | NA | |
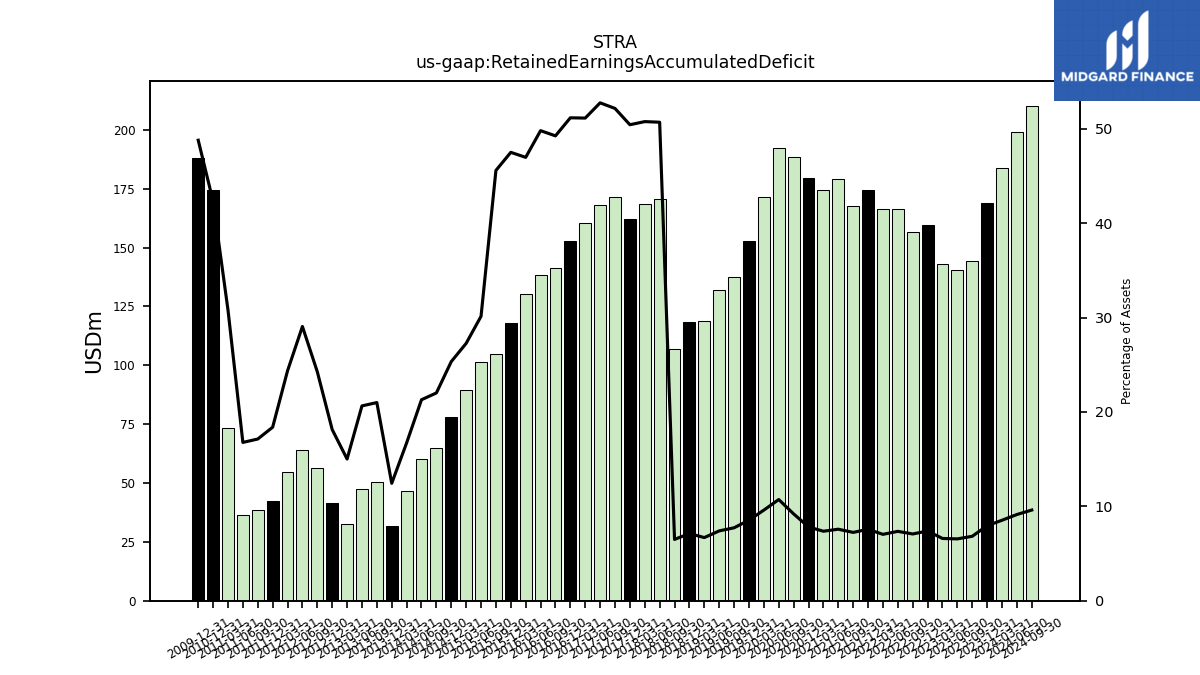
| Retained Earnings Accumulated Deficit | 183.80 | 168.87 | 144.37 | 140.37 | 142.89 | 159.69 | 156.70 | 166.18 | 166.55 | 174.57 | 167.66 | 179.09 | 174.47 | 179.65 | 188.39 | 192.07 | 171.27 | 152.82 | 137.64 | 132.06 | 118.78 | 118.32 | 106.91 | 170.71 | 168.41 | 162.01 | 171.36 | 167.98 | 160.53 | 152.81 | 141.09 | 138.21 | 130.43 | 118.01 | 104.97 | 101.24 | 89.37 | 77.98 | 65.04 | 60.09 | 46.41 | 31.63 | 50.59 | 47.44 | 32.44 | NA | 41.31 | 56.19 | 63.95 | 54.62 | 42.49 | 38.41 | 36.45 | 73.18 | 174.62 | NA | NA | NA | |
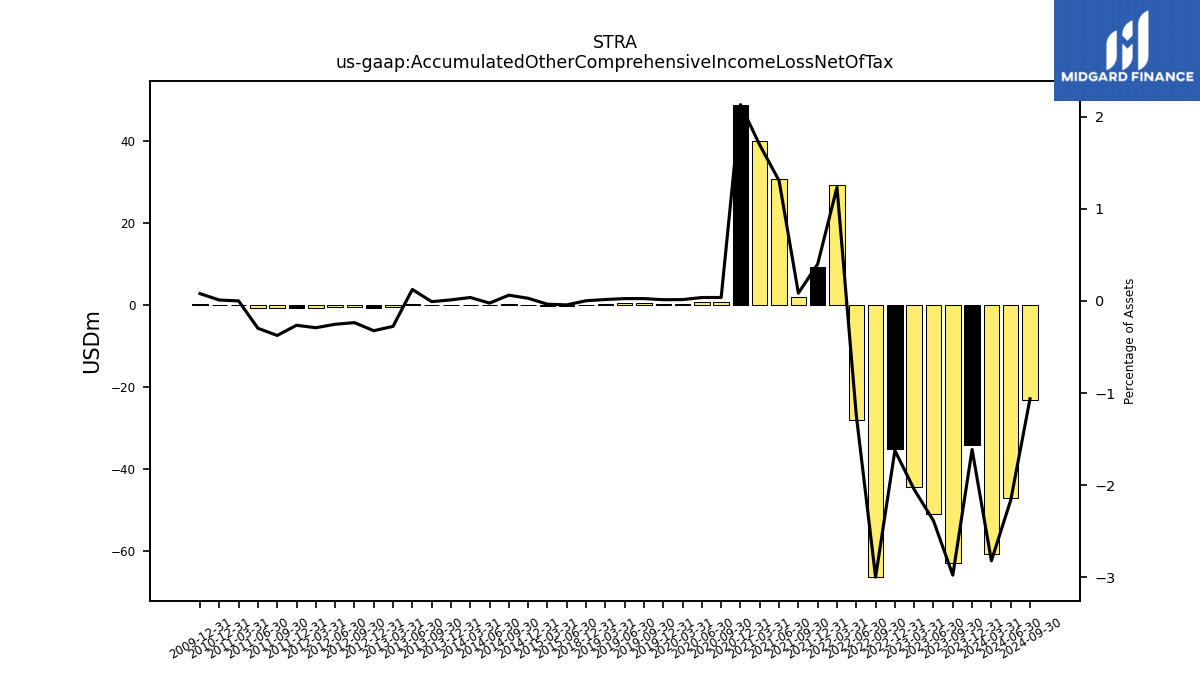
| Accumulated Other Comprehensive Income Loss Net Of Tax | -60.75 | -34.25 | -62.88 | -51.08 | -44.30 | -35.07 | -66.37 | -28.01 | 29.18 | 9.20 | 1.96 | 30.82 | 40.06 | 48.88 | 0.76 | 0.66 | 0.25 | 0.23 | 0.45 | 0.45 | 0.27 | 0.03 | NA | NA | NA | NA | NA | NA | NA | NA | NA | NA | NA | NA | NA | -0.14 | -0.12 | 0.09 | 0.18 | -0.07 | 0.10 | 0.03 | -0.02 | 0.29 | -0.60 | NA | -0.74 | -0.55 | -0.56 | -0.65 | -0.61 | -0.84 | -0.65 | 0.00 | 0.04 | NA | NA | NA | |
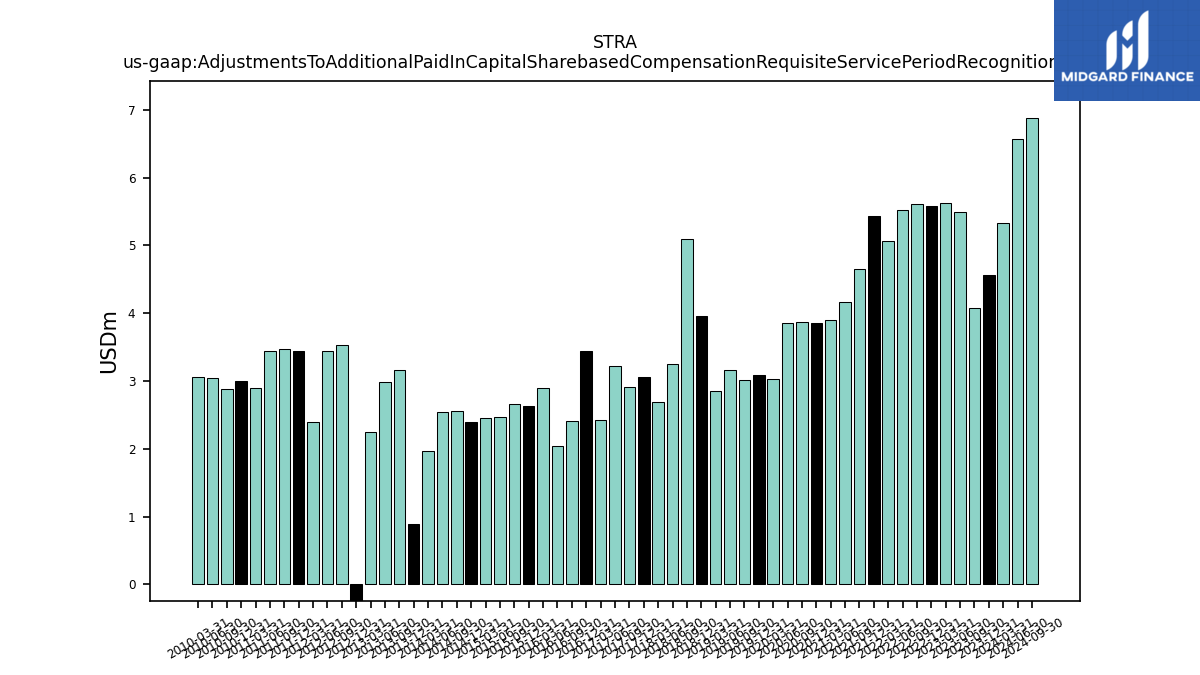
| Adjustments To Additional Paid In Capital Sharebased Compensation Requisite Service Period Recognition Value | 5.33 | 4.57 | 4.08 | 5.49 | 5.63 | 5.58 | 5.61 | 5.53 | 5.07 | 5.43 | 4.65 | 4.17 | 3.90 | 3.85 | 3.88 | 3.86 | 3.02 | 3.09 | 3.02 | 3.15 | 2.85 | 3.96 | 5.10 | 3.25 | 2.69 | 3.06 | 2.92 | 3.23 | 2.43 | 3.44 | 2.40 | 2.04 | 2.89 | 2.64 | 2.65 | 2.47 | 2.45 | 2.40 | 2.55 | 2.55 | 1.96 | 0.89 | 3.17 | 2.98 | 2.25 | NA | -3.89 | 3.53 | 3.44 | 2.39 | 3.44 | 3.47 | 3.44 | 2.89 | 3.00 | 2.89 | 3.04 | 3.06 |
| 2024-03-31 | 2023-12-31 | 2023-09-30 | 2023-06-30 | 2023-03-31 | 2022-12-31 | 2022-09-30 | 2022-06-30 | 2022-03-31 | 2021-12-31 | 2021-09-30 | 2021-06-30 | 2021-03-31 | 2020-12-31 | 2020-09-30 | 2020-06-30 | 2020-03-31 | 2019-12-31 | 2019-09-30 | 2019-06-30 | 2019-03-31 | 2018-12-31 | 2018-09-30 | 2018-06-30 | 2018-03-31 | 2017-12-31 | 2017-09-30 | 2017-06-30 | 2017-03-31 | 2016-12-31 | 2016-09-30 | 2016-06-30 | 2016-03-31 | 2015-12-31 | 2015-09-30 | 2015-06-30 | 2015-03-31 | 2014-12-31 | 2014-09-30 | 2014-06-30 | 2014-03-31 | 2013-12-31 | 2013-09-30 | 2013-06-30 | 2013-03-31 | 2013-03-30 | 2012-12-31 | 2012-09-30 | 2012-06-30 | 2012-03-31 | 2011-12-31 | 2011-09-30 | 2011-06-30 | 2011-03-31 | 2010-12-31 | 2010-09-30 | 2010-06-30 | 2010-03-31 | ||
|---|---|---|---|---|---|---|---|---|---|---|---|---|---|---|---|---|---|---|---|---|---|---|---|---|---|---|---|---|---|---|---|---|---|---|---|---|---|---|---|---|---|---|---|---|---|---|---|---|---|---|---|---|---|---|---|---|---|---|---|
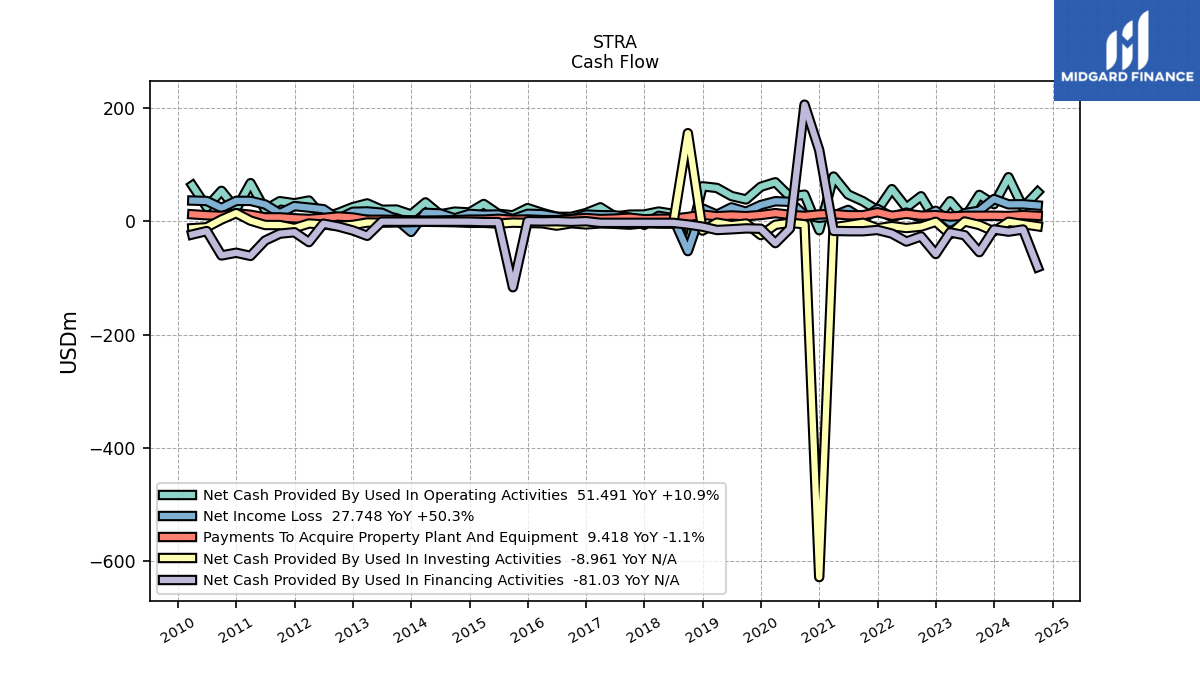
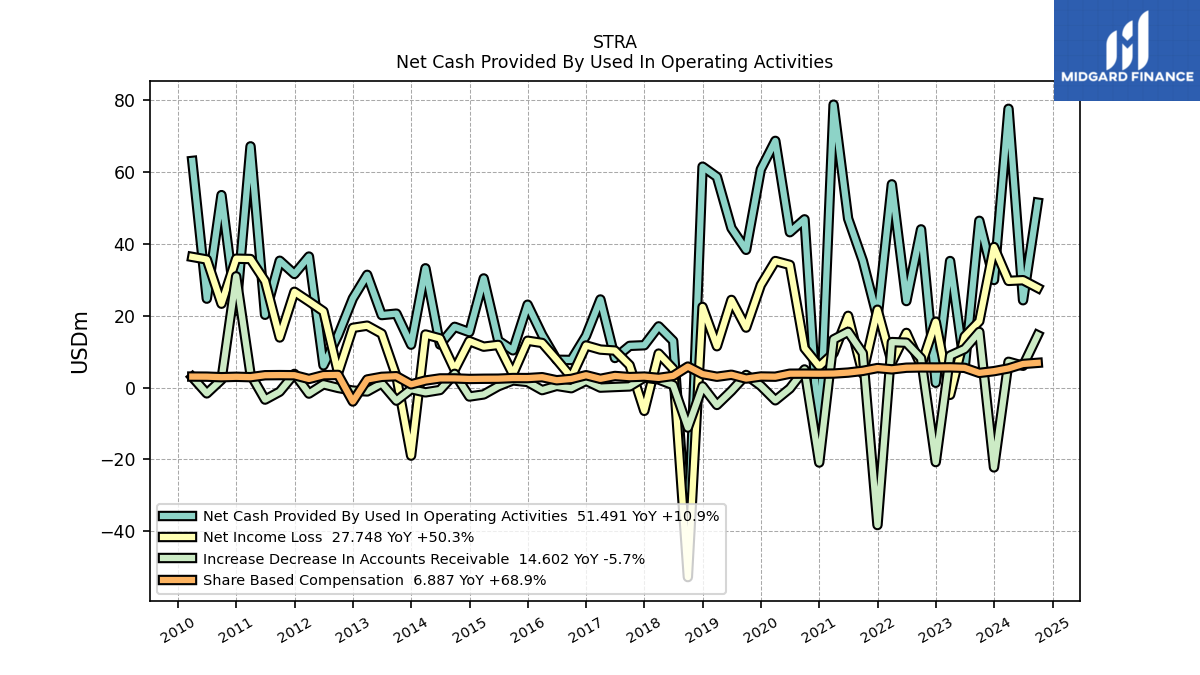
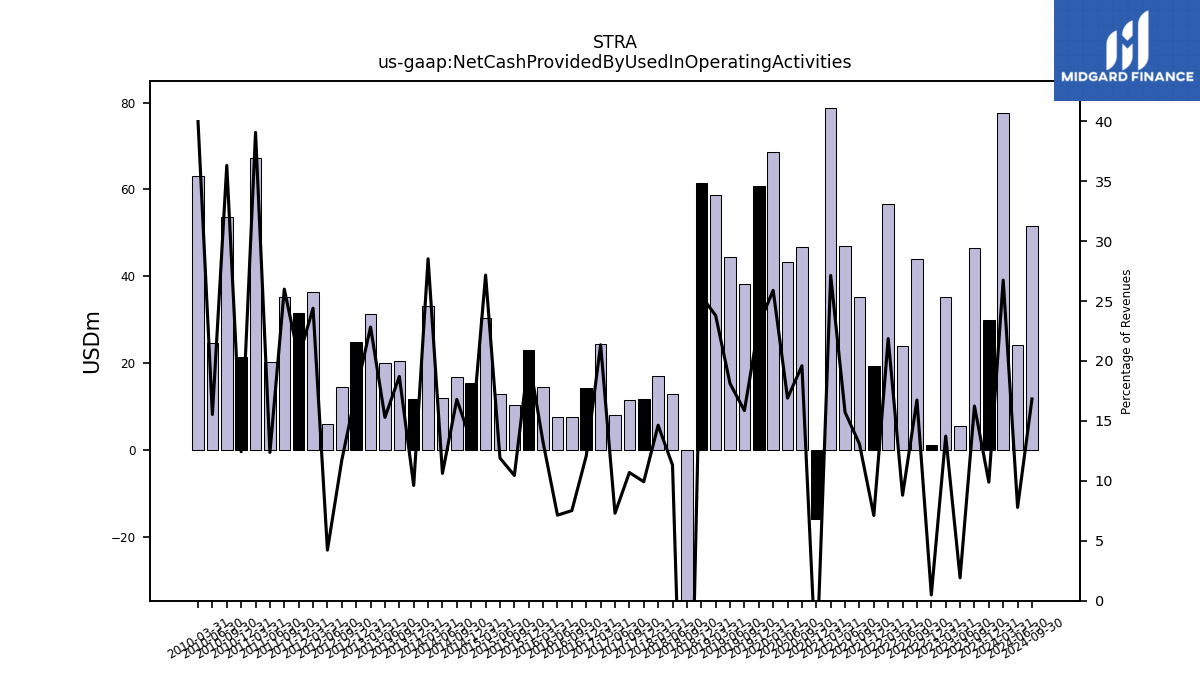
| Net Cash Provided By Used In Operating Activities | 77.63 | 29.95 | 46.44 | 5.50 | 35.24 | 1.32 | 44.06 | 24.08 | 56.59 | 19.36 | 35.33 | 47.05 | 78.78 | -15.88 | 46.84 | 43.25 | 68.69 | 60.74 | 38.34 | 44.41 | 58.66 | 61.51 | -44.67 | 12.98 | 17.05 | 11.78 | 11.61 | 8.23 | 24.54 | 14.40 | 7.68 | 7.75 | 14.68 | 23.08 | 10.37 | 13.06 | 30.39 | 15.44 | 16.92 | 11.98 | 33.22 | 11.93 | 20.58 | 20.18 | 31.39 | NA | 24.82 | 14.59 | 6.18 | 36.48 | 31.61 | 35.32 | 20.26 | 67.17 | 21.38 | 53.59 | 24.75 | 63.11 | |
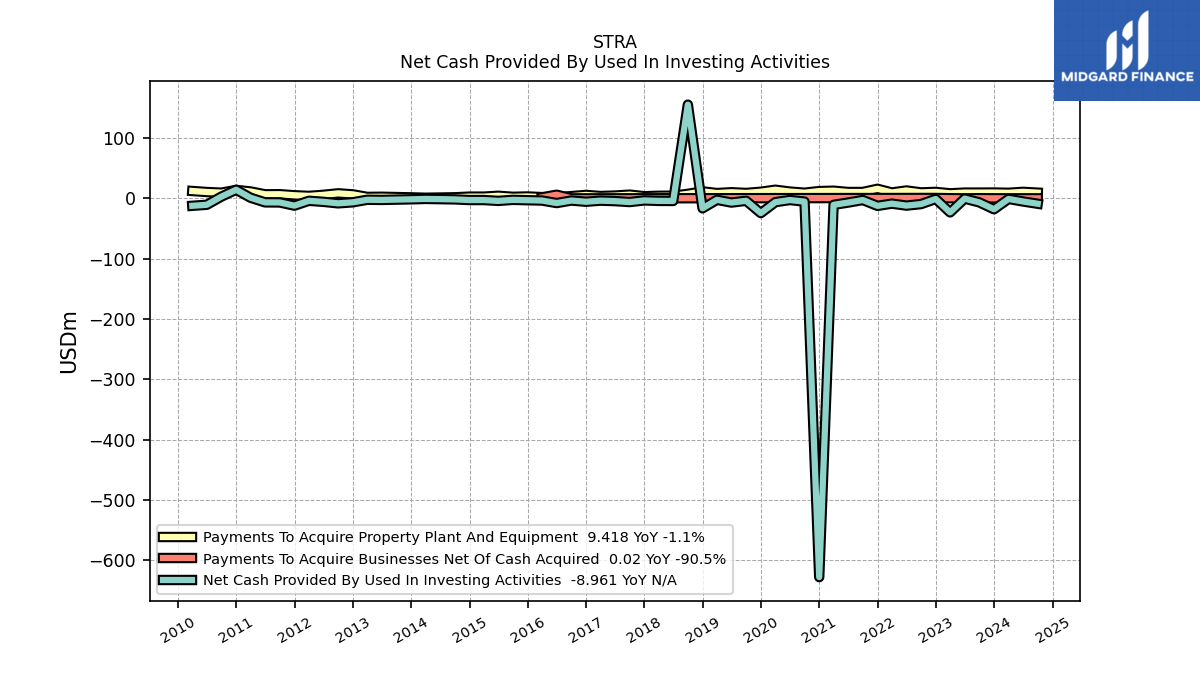
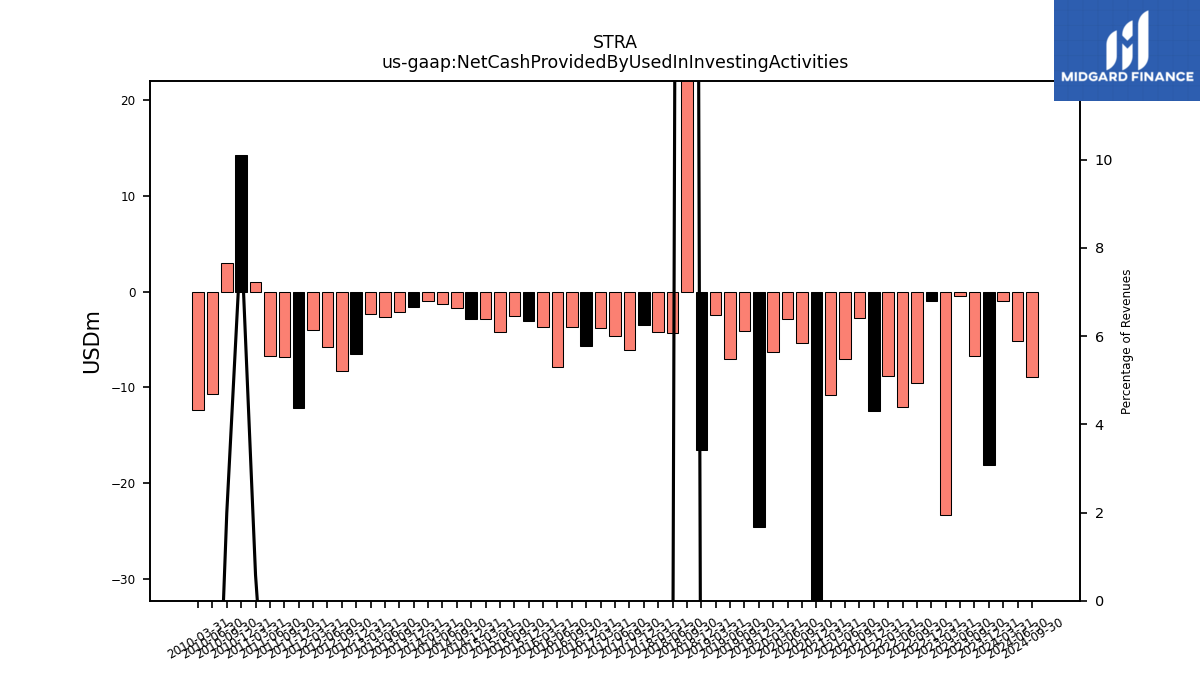
| Net Cash Provided By Used In Investing Activities | -1.00 | -18.08 | -6.71 | -0.47 | -23.29 | -1.04 | -9.51 | -12.05 | -8.76 | -12.50 | -2.79 | -7.01 | -10.79 | -627.64 | -5.40 | -2.82 | -6.33 | -24.51 | -4.07 | -7.01 | -2.47 | -16.55 | 155.28 | -4.36 | -4.23 | -3.48 | -6.14 | -4.59 | -3.84 | -5.66 | -3.65 | -7.82 | -3.67 | -3.10 | -2.53 | -4.22 | -2.83 | -2.84 | -1.74 | -1.32 | -1.00 | -1.61 | -2.12 | -2.63 | -2.37 | NA | -6.57 | -8.29 | -5.82 | -4.05 | -12.10 | -6.83 | -6.68 | 1.00 | 14.22 | 2.94 | -10.67 | -12.36 | |
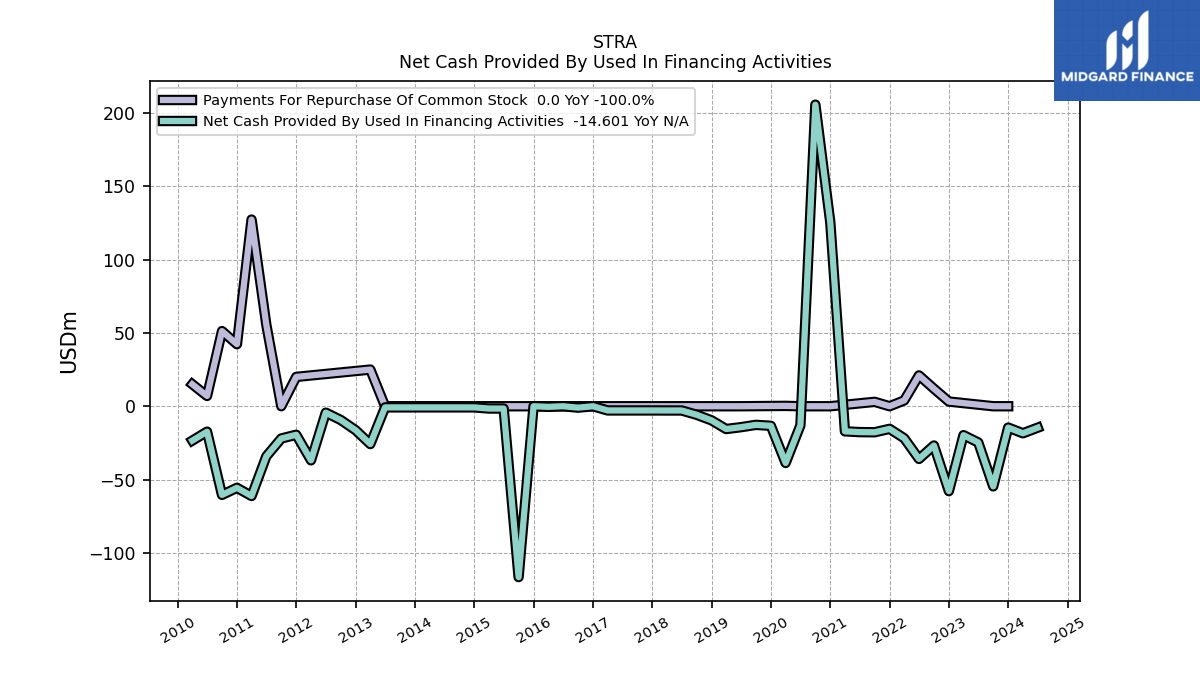
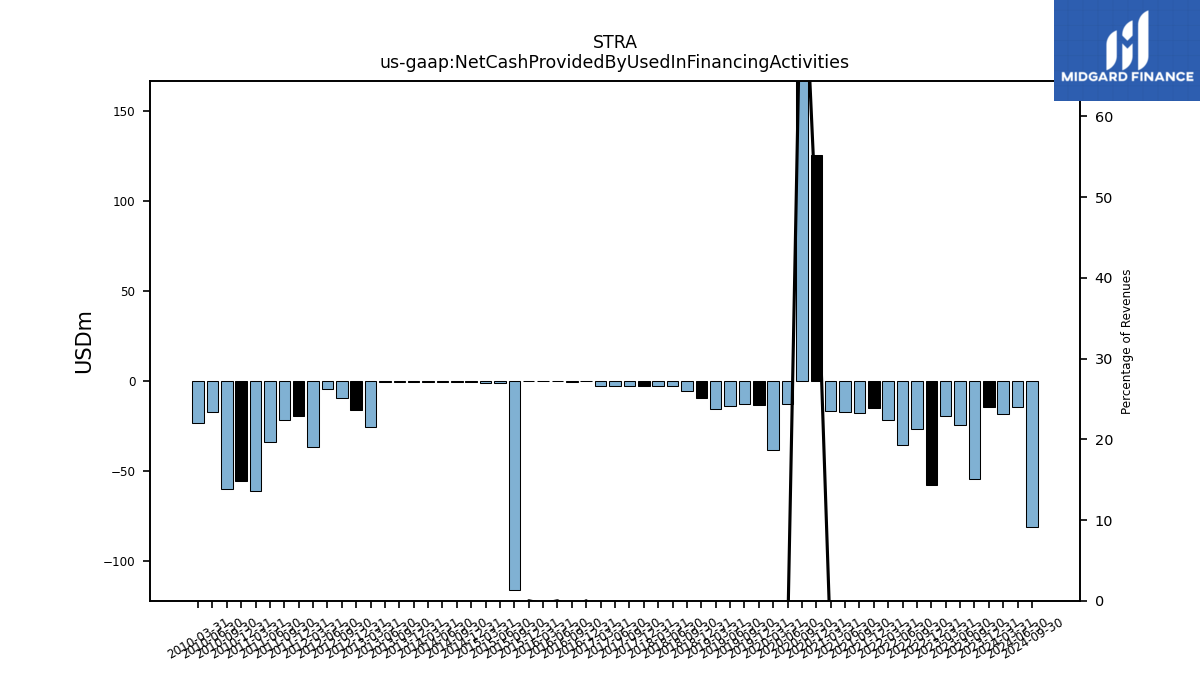
| Net Cash Provided By Used In Financing Activities | -18.42 | -14.54 | -54.63 | -24.71 | -19.72 | -57.87 | -26.75 | -35.91 | -21.83 | -15.41 | -17.74 | -17.63 | -17.10 | 125.27 | 205.59 | -13.00 | -38.66 | -13.33 | -12.69 | -14.27 | -15.53 | -9.62 | -5.81 | -2.89 | -2.89 | -2.85 | -2.85 | -2.85 | -2.85 | 0.00 | -0.95 | 0.00 | -0.41 | 0.00 | -116.47 | -1.56 | -1.56 | -0.78 | -0.78 | -0.78 | -0.78 | -0.78 | -0.78 | -0.78 | -25.78 | NA | -16.34 | -9.37 | -4.37 | -36.87 | -19.44 | -21.98 | -34.12 | -61.19 | -55.61 | -60.42 | -17.33 | -23.44 |
| 2024-03-31 | 2023-12-31 | 2023-09-30 | 2023-06-30 | 2023-03-31 | 2022-12-31 | 2022-09-30 | 2022-06-30 | 2022-03-31 | 2021-12-31 | 2021-09-30 | 2021-06-30 | 2021-03-31 | 2020-12-31 | 2020-09-30 | 2020-06-30 | 2020-03-31 | 2019-12-31 | 2019-09-30 | 2019-06-30 | 2019-03-31 | 2018-12-31 | 2018-09-30 | 2018-06-30 | 2018-03-31 | 2017-12-31 | 2017-09-30 | 2017-06-30 | 2017-03-31 | 2016-12-31 | 2016-09-30 | 2016-06-30 | 2016-03-31 | 2015-12-31 | 2015-09-30 | 2015-06-30 | 2015-03-31 | 2014-12-31 | 2014-09-30 | 2014-06-30 | 2014-03-31 | 2013-12-31 | 2013-09-30 | 2013-06-30 | 2013-03-31 | 2013-03-30 | 2012-12-31 | 2012-09-30 | 2012-06-30 | 2012-03-31 | 2011-12-31 | 2011-09-30 | 2011-06-30 | 2011-03-31 | 2010-12-31 | 2010-09-30 | 2010-06-30 | 2010-03-31 | ||
|---|---|---|---|---|---|---|---|---|---|---|---|---|---|---|---|---|---|---|---|---|---|---|---|---|---|---|---|---|---|---|---|---|---|---|---|---|---|---|---|---|---|---|---|---|---|---|---|---|---|---|---|---|---|---|---|---|---|---|---|
| Net Cash Provided By Used In Operating Activities | 77.63 | 29.95 | 46.44 | 5.50 | 35.24 | 1.32 | 44.06 | 24.08 | 56.59 | 19.36 | 35.33 | 47.05 | 78.78 | -15.88 | 46.84 | 43.25 | 68.69 | 60.74 | 38.34 | 44.41 | 58.66 | 61.51 | -44.67 | 12.98 | 17.05 | 11.78 | 11.61 | 8.23 | 24.54 | 14.40 | 7.68 | 7.75 | 14.68 | 23.08 | 10.37 | 13.06 | 30.39 | 15.44 | 16.92 | 11.98 | 33.22 | 11.93 | 20.58 | 20.18 | 31.39 | NA | 24.82 | 14.59 | 6.18 | 36.48 | 31.61 | 35.32 | 20.26 | 67.17 | 21.38 | 53.59 | 24.75 | 63.11 | |
| Net Income Loss | 29.70 | 39.13 | 18.46 | 14.23 | -2.03 | 18.33 | 6.09 | 15.22 | 7.03 | 21.68 | 3.85 | 19.98 | 9.58 | 5.92 | 10.96 | 34.15 | 35.24 | 28.54 | 16.69 | 24.41 | 11.50 | 22.45 | -52.78 | 5.19 | 9.47 | -6.50 | 6.23 | 10.30 | 10.58 | 11.72 | 2.88 | 7.79 | 12.42 | 13.04 | 3.72 | 11.87 | 11.38 | 12.94 | 4.95 | 13.68 | 14.78 | -18.96 | 3.15 | 15.00 | 17.23 | 17.23 | 16.63 | 4.10 | 21.21 | 23.99 | 26.67 | 13.94 | 29.65 | 35.79 | 35.88 | 23.34 | 35.66 | 36.38 | |
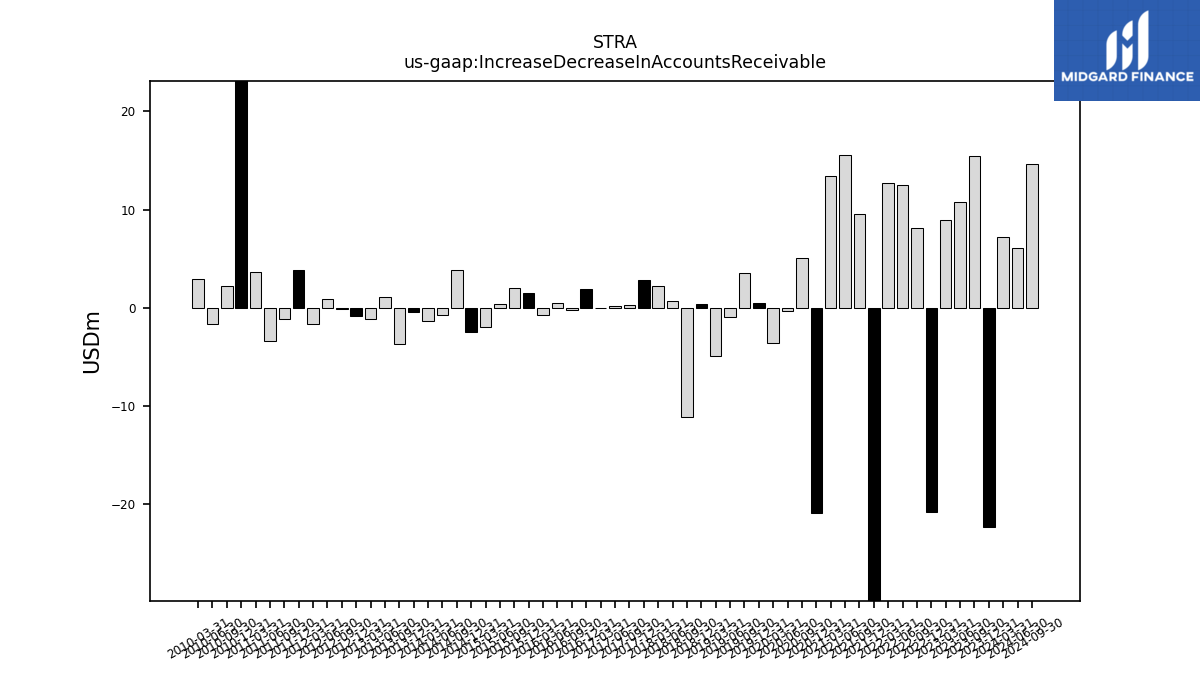
| Increase Decrease In Accounts Receivable | 7.18 | -22.24 | 15.49 | 10.73 | 8.89 | -20.76 | 8.16 | 12.49 | 12.67 | -38.29 | 9.54 | 15.53 | 13.42 | -20.88 | 5.04 | -0.27 | -3.55 | 0.49 | 3.52 | -0.93 | -4.85 | 0.35 | -11.14 | 0.67 | 2.25 | 2.80 | 0.32 | 0.16 | -0.02 | 1.88 | -0.18 | 0.47 | -0.72 | 1.56 | 1.99 | 0.36 | -1.91 | -2.50 | 3.83 | -0.68 | -1.34 | -0.45 | -3.65 | 1.16 | -1.08 | NA | -0.85 | -0.11 | 0.90 | -1.69 | 3.81 | -1.15 | -3.36 | 3.70 | 30.98 | 2.19 | -1.63 | 2.91 | |
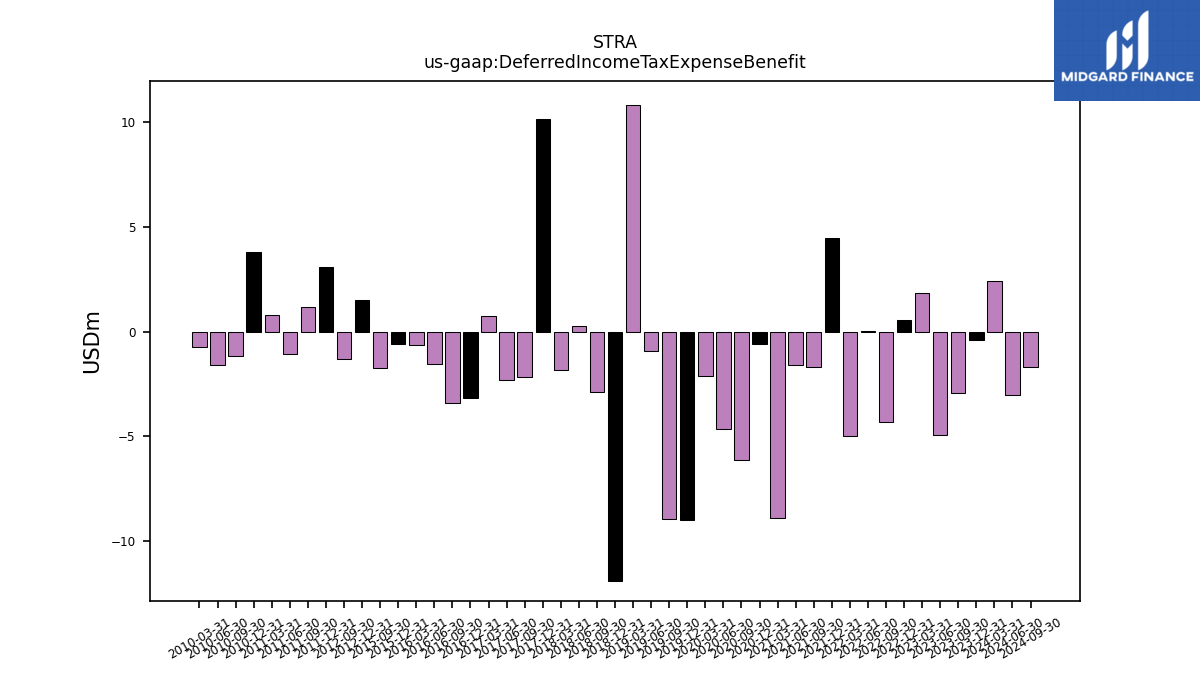
| Deferred Income Tax Expense Benefit | 2.41 | -0.38 | -2.91 | -4.91 | 1.87 | 0.55 | -4.30 | 0.05 | -4.96 | 4.49 | -1.70 | -1.60 | -8.90 | -0.56 | -6.13 | -4.63 | -2.11 | -9.01 | -8.94 | -0.93 | 10.83 | -11.88 | -2.86 | 0.26 | -1.84 | 10.16 | -2.17 | -2.32 | 0.76 | -3.15 | -3.38 | -1.52 | -0.63 | -0.59 | -1.74 | NA | NA | NA | NA | NA | NA | NA | NA | NA | NA | NA | 1.51 | -1.30 | NA | NA | 3.11 | 1.20 | -1.07 | 0.82 | 3.83 | -1.13 | -1.60 | -0.74 | |
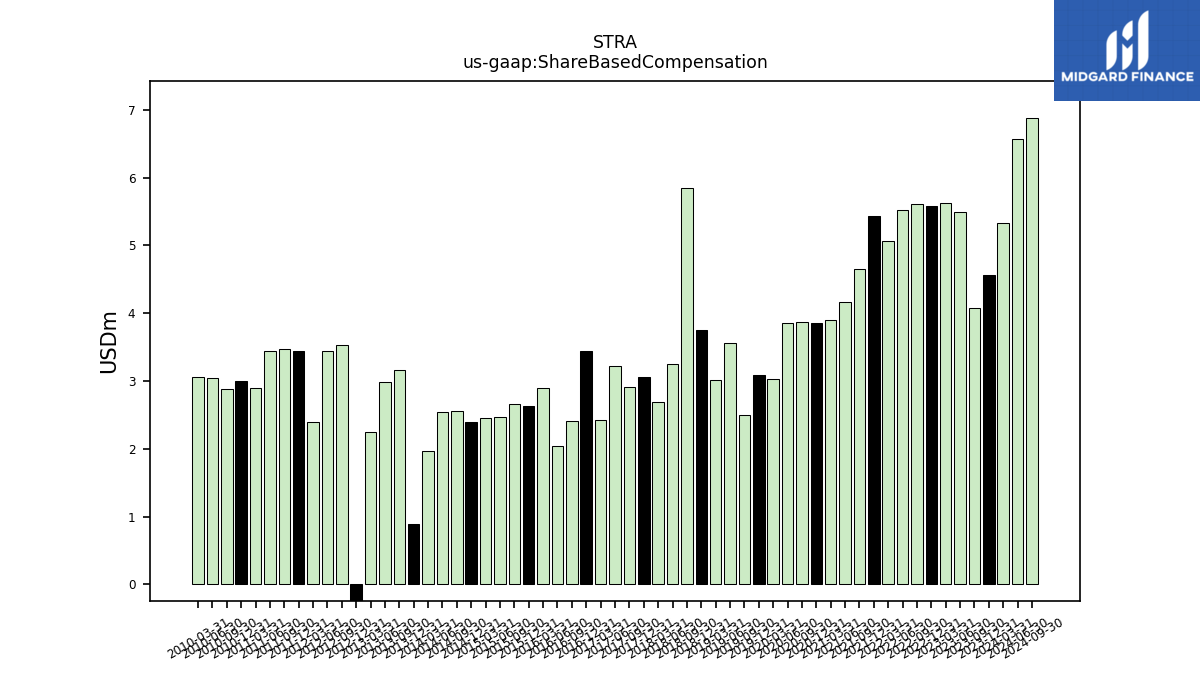
| Share Based Compensation | 5.33 | 4.57 | 4.08 | 5.49 | 5.63 | 5.58 | 5.61 | 5.53 | 5.07 | 5.43 | 4.65 | 4.17 | 3.90 | 3.85 | 3.88 | 3.86 | 3.02 | 3.08 | 2.50 | 3.57 | 3.01 | 3.75 | 5.84 | 3.25 | 2.69 | 3.06 | 2.91 | 3.23 | 2.43 | 3.44 | 2.40 | 2.04 | 2.89 | 2.64 | 2.65 | 2.47 | 2.45 | 2.40 | 2.55 | 2.55 | 1.96 | 0.89 | 3.17 | 2.98 | 2.25 | NA | -3.89 | 3.53 | 3.44 | 2.39 | 3.44 | 3.47 | 3.44 | 2.89 | 3.00 | 2.89 | 3.04 | 3.06 | |
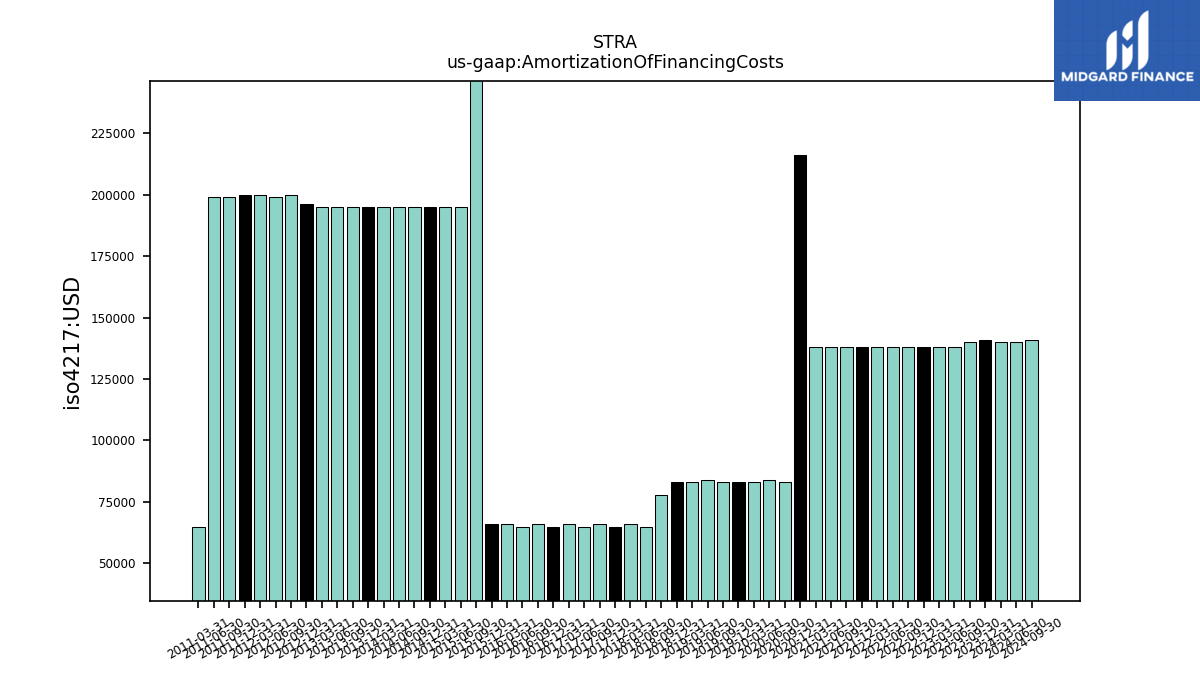
| Amortization Of Financing Costs | 0.14 | 0.14 | 0.14 | 0.14 | 0.14 | 0.14 | 0.14 | 0.14 | 0.14 | 0.14 | 0.14 | 0.14 | 0.14 | 0.22 | 0.08 | 0.08 | 0.08 | 0.08 | 0.08 | 0.08 | 0.08 | 0.08 | 0.08 | 0.07 | 0.07 | 0.07 | 0.07 | 0.07 | 0.07 | 0.07 | 0.07 | 0.07 | 0.07 | 0.07 | 0.77 | 0.20 | 0.20 | 0.20 | 0.20 | 0.20 | 0.20 | 0.20 | 0.20 | 0.20 | 0.20 | NA | 0.20 | 0.20 | 0.20 | 0.20 | 0.20 | 0.20 | 0.20 | 0.07 | NA | NA | NA | NA |
| 2024-03-31 | 2023-12-31 | 2023-09-30 | 2023-06-30 | 2023-03-31 | 2022-12-31 | 2022-09-30 | 2022-06-30 | 2022-03-31 | 2021-12-31 | 2021-09-30 | 2021-06-30 | 2021-03-31 | 2020-12-31 | 2020-09-30 | 2020-06-30 | 2020-03-31 | 2019-12-31 | 2019-09-30 | 2019-06-30 | 2019-03-31 | 2018-12-31 | 2018-09-30 | 2018-06-30 | 2018-03-31 | 2017-12-31 | 2017-09-30 | 2017-06-30 | 2017-03-31 | 2016-12-31 | 2016-09-30 | 2016-06-30 | 2016-03-31 | 2015-12-31 | 2015-09-30 | 2015-06-30 | 2015-03-31 | 2014-12-31 | 2014-09-30 | 2014-06-30 | 2014-03-31 | 2013-12-31 | 2013-09-30 | 2013-06-30 | 2013-03-31 | 2013-03-30 | 2012-12-31 | 2012-09-30 | 2012-06-30 | 2012-03-31 | 2011-12-31 | 2011-09-30 | 2011-06-30 | 2011-03-31 | 2010-12-31 | 2010-09-30 | 2010-06-30 | 2010-03-31 | ||
|---|---|---|---|---|---|---|---|---|---|---|---|---|---|---|---|---|---|---|---|---|---|---|---|---|---|---|---|---|---|---|---|---|---|---|---|---|---|---|---|---|---|---|---|---|---|---|---|---|---|---|---|---|---|---|---|---|---|---|---|
| Net Cash Provided By Used In Investing Activities | -1.00 | -18.08 | -6.71 | -0.47 | -23.29 | -1.04 | -9.51 | -12.05 | -8.76 | -12.50 | -2.79 | -7.01 | -10.79 | -627.64 | -5.40 | -2.82 | -6.33 | -24.51 | -4.07 | -7.01 | -2.47 | -16.55 | 155.28 | -4.36 | -4.23 | -3.48 | -6.14 | -4.59 | -3.84 | -5.66 | -3.65 | -7.82 | -3.67 | -3.10 | -2.53 | -4.22 | -2.83 | -2.84 | -1.74 | -1.32 | -1.00 | -1.61 | -2.12 | -2.63 | -2.37 | NA | -6.57 | -8.29 | -5.82 | -4.05 | -12.10 | -6.83 | -6.68 | 1.00 | 14.22 | 2.94 | -10.67 | -12.36 | |
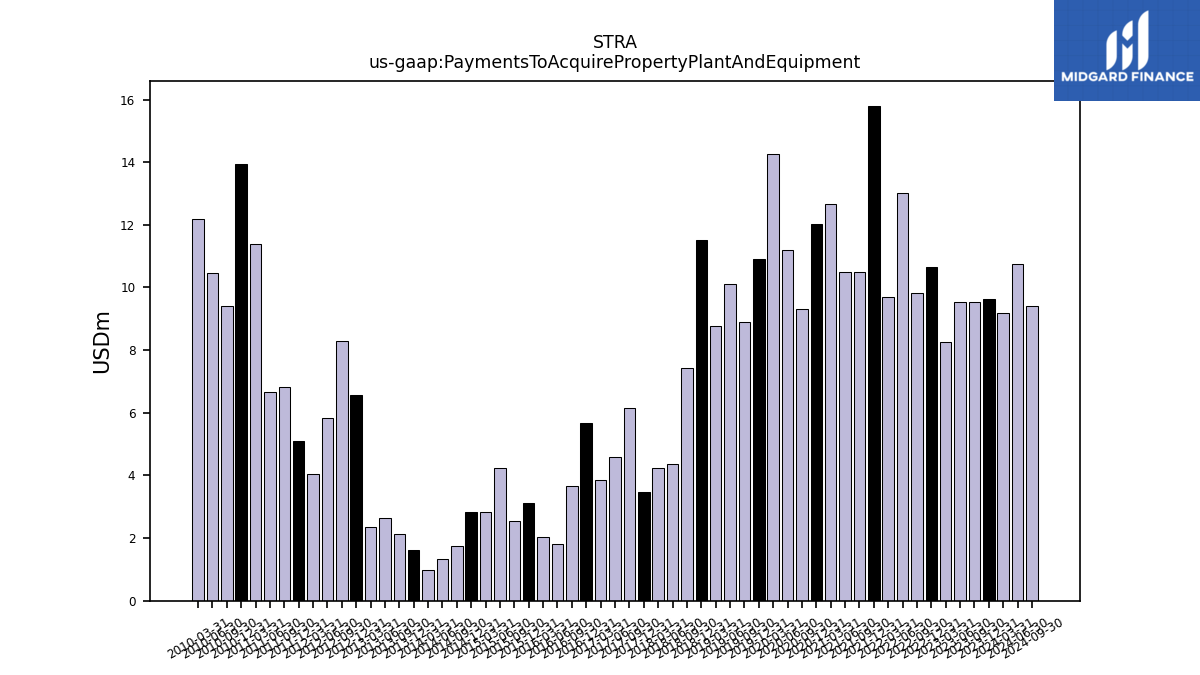
| Payments To Acquire Property Plant And Equipment | 9.19 | 9.62 | 9.52 | 9.52 | 8.27 | 10.66 | 9.82 | 13.00 | 9.69 | 15.80 | 10.49 | 10.49 | 12.65 | 12.03 | 9.32 | 11.21 | 14.26 | 10.92 | 8.91 | 10.10 | 8.76 | 11.52 | 7.43 | 4.36 | 4.23 | 3.48 | 6.14 | 4.59 | 3.84 | 5.66 | 3.65 | 1.82 | 2.03 | 3.10 | 2.53 | 4.22 | 2.83 | 2.84 | 1.74 | 1.32 | 1.00 | 1.61 | 2.12 | 2.63 | 2.37 | NA | 6.57 | 8.29 | 5.82 | 4.05 | 5.10 | 6.83 | 6.68 | 11.38 | 13.95 | 9.42 | 10.48 | 12.17 |
| 2024-03-31 | 2023-12-31 | 2023-09-30 | 2023-06-30 | 2023-03-31 | 2022-12-31 | 2022-09-30 | 2022-06-30 | 2022-03-31 | 2021-12-31 | 2021-09-30 | 2021-06-30 | 2021-03-31 | 2020-12-31 | 2020-09-30 | 2020-06-30 | 2020-03-31 | 2019-12-31 | 2019-09-30 | 2019-06-30 | 2019-03-31 | 2018-12-31 | 2018-09-30 | 2018-06-30 | 2018-03-31 | 2017-12-31 | 2017-09-30 | 2017-06-30 | 2017-03-31 | 2016-12-31 | 2016-09-30 | 2016-06-30 | 2016-03-31 | 2015-12-31 | 2015-09-30 | 2015-06-30 | 2015-03-31 | 2014-12-31 | 2014-09-30 | 2014-06-30 | 2014-03-31 | 2013-12-31 | 2013-09-30 | 2013-06-30 | 2013-03-31 | 2013-03-30 | 2012-12-31 | 2012-09-30 | 2012-06-30 | 2012-03-31 | 2011-12-31 | 2011-09-30 | 2011-06-30 | 2011-03-31 | 2010-12-31 | 2010-09-30 | 2010-06-30 | 2010-03-31 | ||
|---|---|---|---|---|---|---|---|---|---|---|---|---|---|---|---|---|---|---|---|---|---|---|---|---|---|---|---|---|---|---|---|---|---|---|---|---|---|---|---|---|---|---|---|---|---|---|---|---|---|---|---|---|---|---|---|---|---|---|---|
| Net Cash Provided By Used In Financing Activities | -18.42 | -14.54 | -54.63 | -24.71 | -19.72 | -57.87 | -26.75 | -35.91 | -21.83 | -15.41 | -17.74 | -17.63 | -17.10 | 125.27 | 205.59 | -13.00 | -38.66 | -13.33 | -12.69 | -14.27 | -15.53 | -9.62 | -5.81 | -2.89 | -2.89 | -2.85 | -2.85 | -2.85 | -2.85 | 0.00 | -0.95 | 0.00 | -0.41 | 0.00 | -116.47 | -1.56 | -1.56 | -0.78 | -0.78 | -0.78 | -0.78 | -0.78 | -0.78 | -0.78 | -25.78 | NA | -16.34 | -9.37 | -4.37 | -36.87 | -19.44 | -21.98 | -34.12 | -61.19 | -55.61 | -60.42 | -17.33 | -23.44 | |
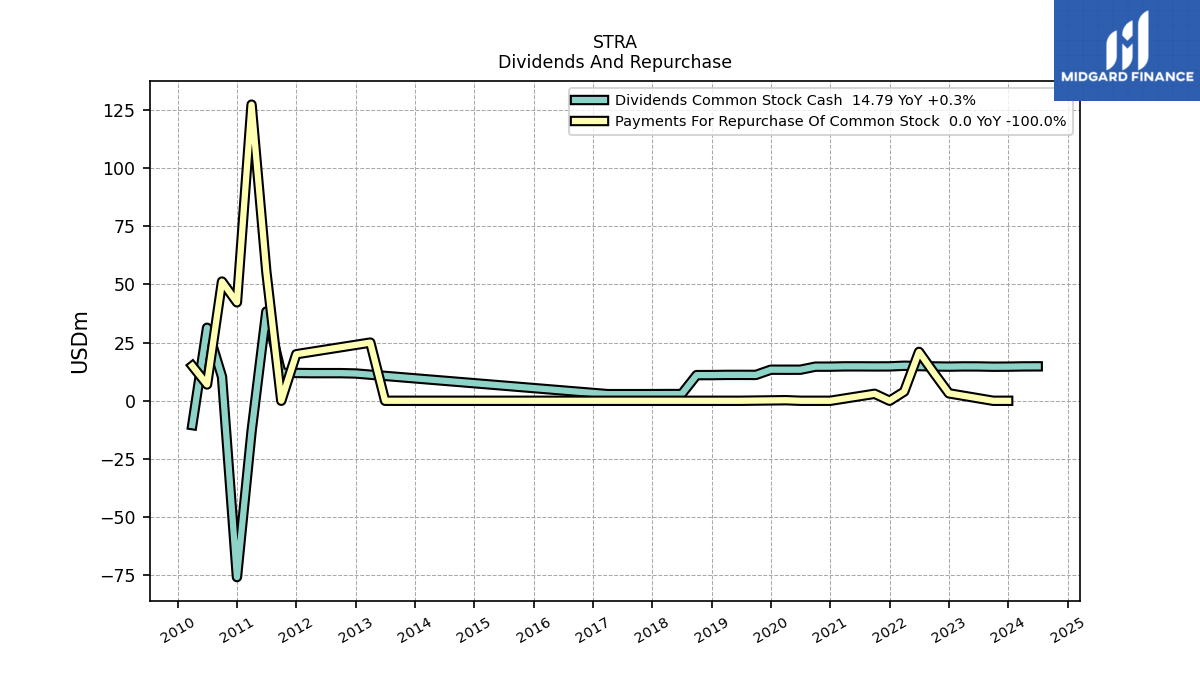
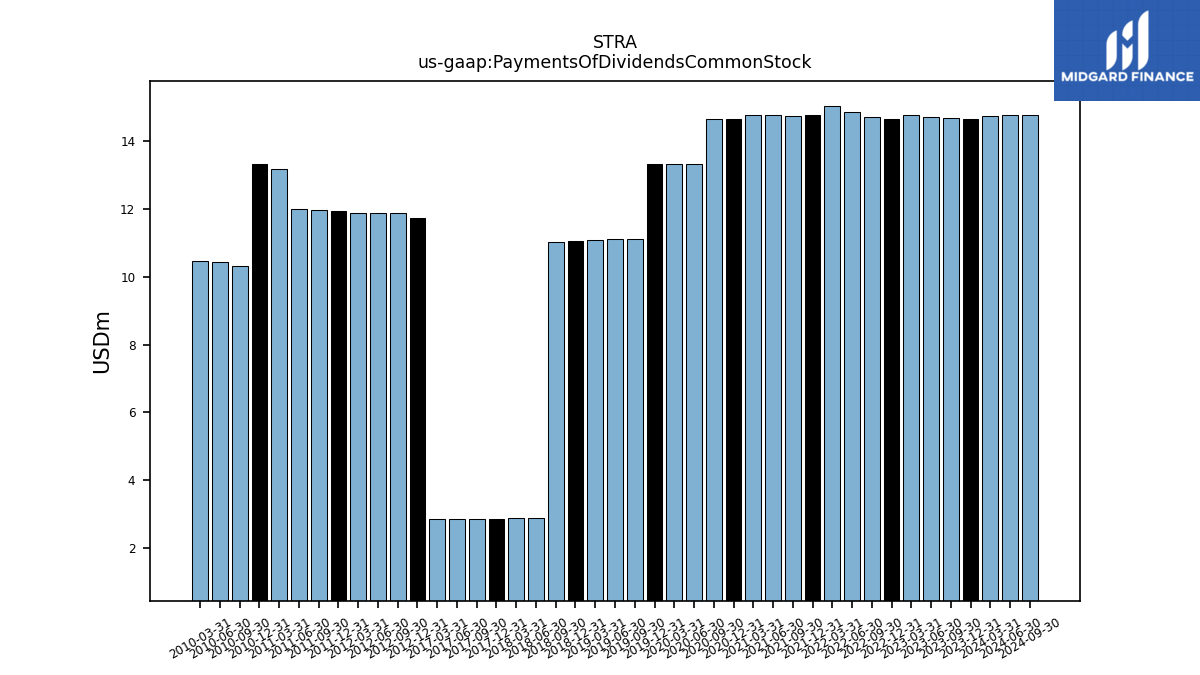
| Payments Of Dividends Common Stock | 14.73 | 14.64 | 14.67 | 14.71 | 14.76 | 14.64 | 14.71 | 14.87 | 15.02 | 14.76 | 14.74 | 14.77 | 14.78 | 14.65 | 14.64 | 13.34 | 13.33 | 13.33 | 11.10 | 11.10 | 11.09 | 11.04 | 11.02 | 2.89 | 2.89 | 2.85 | 2.85 | 2.85 | 2.85 | NA | NA | NA | NA | NA | NA | NA | NA | NA | NA | NA | NA | NA | NA | NA | NA | NA | 11.72 | 11.87 | 11.87 | 11.87 | 11.94 | 11.98 | 12.01 | 13.17 | 13.32 | 10.33 | 10.43 | 10.47 | |
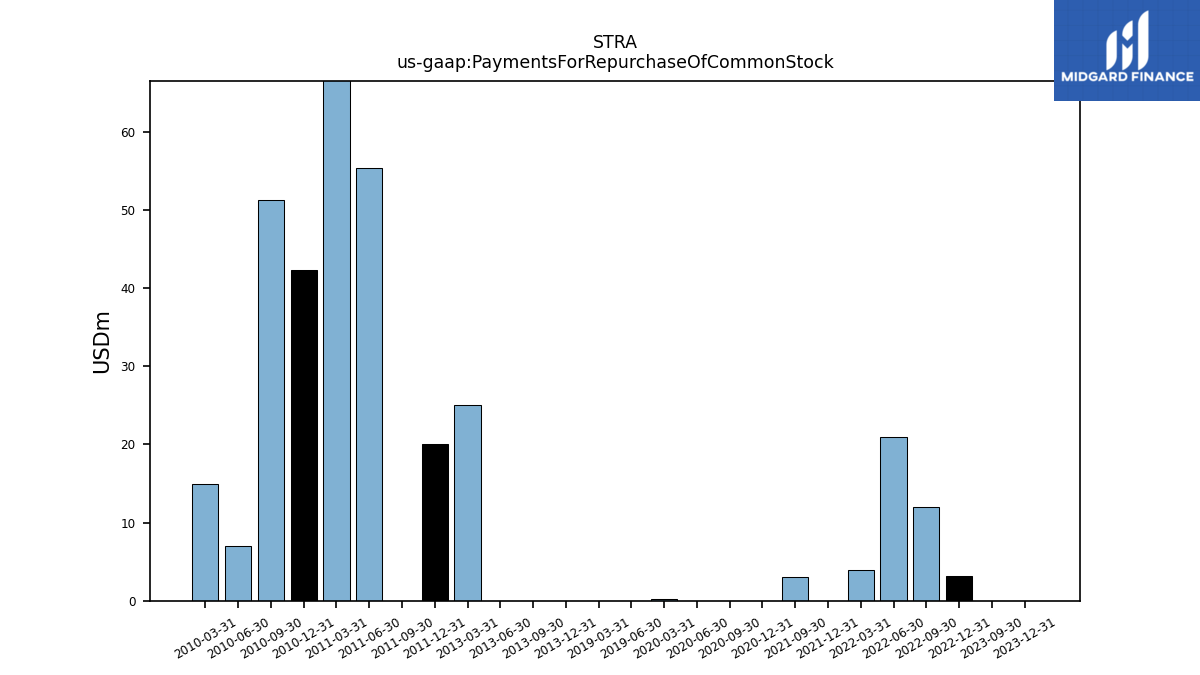
| Payments For Repurchase Of Common Stock | NA | 0.00 | 0.00 | NA | NA | 3.20 | 11.94 | 21.01 | 3.96 | 0.00 | 3.00 | NA | NA | 0.00 | 0.00 | 0.00 | 0.25 | NA | NA | 0.00 | 0.00 | NA | NA | NA | NA | NA | NA | NA | NA | NA | NA | NA | NA | NA | NA | NA | NA | NA | NA | NA | NA | 0.00 | 0.00 | 0.00 | 25.00 | NA | NA | NA | NA | NA | 20.00 | 0.00 | 55.43 | 127.24 | 42.29 | 51.23 | 7.00 | 15.00 |
| 2024-03-31 | 2023-12-31 | 2023-09-30 | 2023-06-30 | 2023-03-31 | 2022-12-31 | 2022-09-30 | 2022-06-30 | 2022-03-31 | 2021-12-31 | 2021-09-30 | 2021-06-30 | 2021-03-31 | 2020-12-31 | 2020-09-30 | 2020-06-30 | 2020-03-31 | 2019-12-31 | 2019-09-30 | 2019-06-30 | 2019-03-31 | 2018-12-31 | 2018-09-30 | 2018-06-30 | 2018-03-31 | 2017-12-31 | 2017-09-30 | 2017-06-30 | 2017-03-31 | 2016-12-31 | 2016-09-30 | 2016-06-30 | 2016-03-31 | 2015-12-31 | 2015-09-30 | 2015-06-30 | 2015-03-31 | 2014-12-31 | 2014-09-30 | 2014-06-30 | 2014-03-31 | 2013-12-31 | 2013-09-30 | 2013-06-30 | 2013-03-31 | 2013-03-30 | 2012-12-31 | 2012-09-30 | 2012-06-30 | 2012-03-31 | 2011-12-31 | 2011-09-30 | 2011-06-30 | 2011-03-31 | 2010-12-31 | 2010-09-30 | 2010-06-30 | 2010-03-31 | ||
|---|---|---|---|---|---|---|---|---|---|---|---|---|---|---|---|---|---|---|---|---|---|---|---|---|---|---|---|---|---|---|---|---|---|---|---|---|---|---|---|---|---|---|---|---|---|---|---|---|---|---|---|---|---|---|---|---|---|---|---|
| Revenues | 290.25 | 302.70 | 285.94 | 287.68 | 256.61 | 269.94 | 263.12 | 273.56 | 258.86 | 272.10 | 270.08 | 299.17 | 290.34 | 267.49 | 239.03 | 255.83 | 265.30 | 263.77 | 241.75 | 245.11 | 246.51 | 242.10 | 160.94 | 114.67 | 116.47 | 118.71 | 108.51 | 112.72 | 114.91 | 119.28 | 102.16 | 108.49 | 111.17 | 113.66 | 99.14 | 109.75 | 111.89 | 116.07 | 100.76 | 112.75 | 116.47 | 124.08 | 110.03 | 131.98 | 137.51 | 137.51 | 141.93 | 124.26 | 146.25 | 149.53 | 155.82 | 135.87 | 163.79 | 171.96 | 171.95 | 147.60 | 159.28 | 157.90 | |
| Revenue From Contract With Customer Excluding Assessed Tax | 290.25 | 302.70 | 285.94 | 287.68 | 256.61 | 269.94 | 263.12 | 273.56 | 258.86 | 272.10 | 270.08 | 299.17 | 290.34 | 267.49 | 239.03 | 255.83 | 265.30 | 263.77 | 241.75 | 245.11 | 246.51 | 242.10 | 160.94 | 114.67 | 116.47 | 118.71 | 108.51 | 112.72 | 114.91 | 119.28 | 102.16 | 108.49 | 111.17 | 113.66 | 99.14 | 109.75 | 111.89 | 116.07 | 100.76 | 112.75 | 116.47 | 124.08 | 110.03 | 131.98 | 137.51 | 137.51 | 141.93 | 124.26 | 146.25 | 149.53 | 155.82 | 135.87 | 163.79 | 171.96 | 171.95 | 147.60 | 159.28 | 157.90 | |
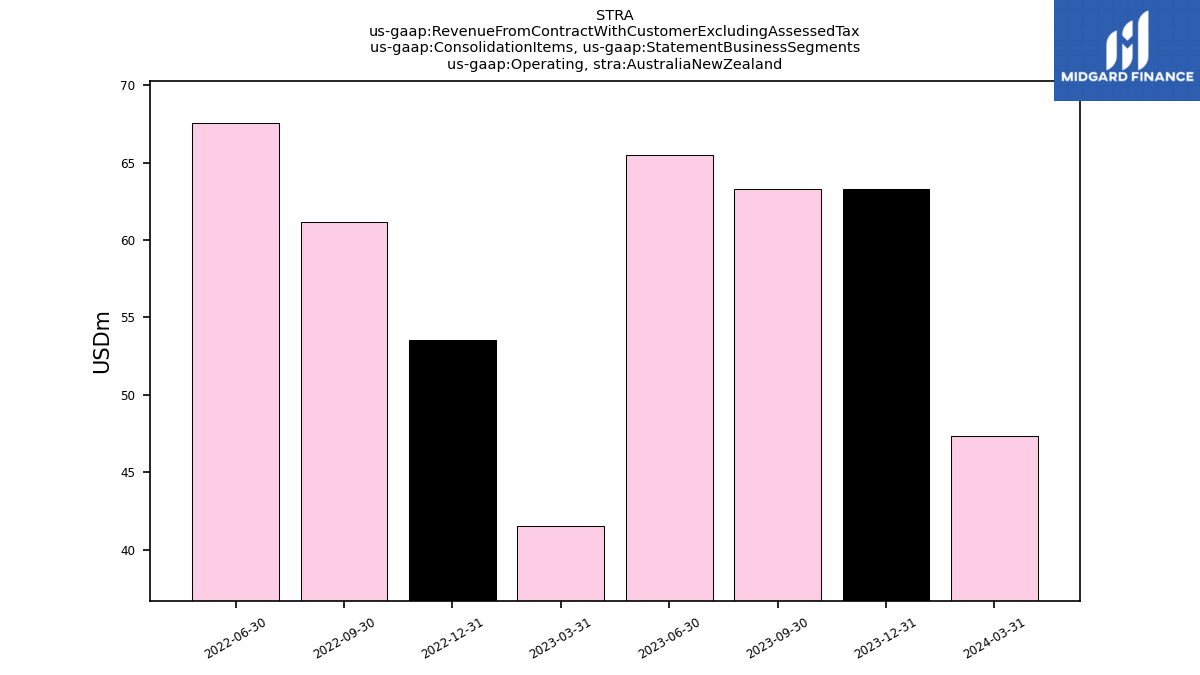
| Operating, Australia New Zealand | 47.38 | 63.28 | 63.26 | 65.47 | 41.50 | 53.52 | 61.18 | 67.54 | NA | NA | NA | NA | NA | NA | NA | NA | NA | NA | NA | NA | NA | NA | NA | NA | NA | NA | NA | NA | NA | NA | NA | NA | NA | NA | NA | NA | NA | NA | NA | NA | NA | NA | NA | NA | NA | NA | NA | NA | NA | NA | NA | NA | NA | NA | NA | NA | NA | NA | |
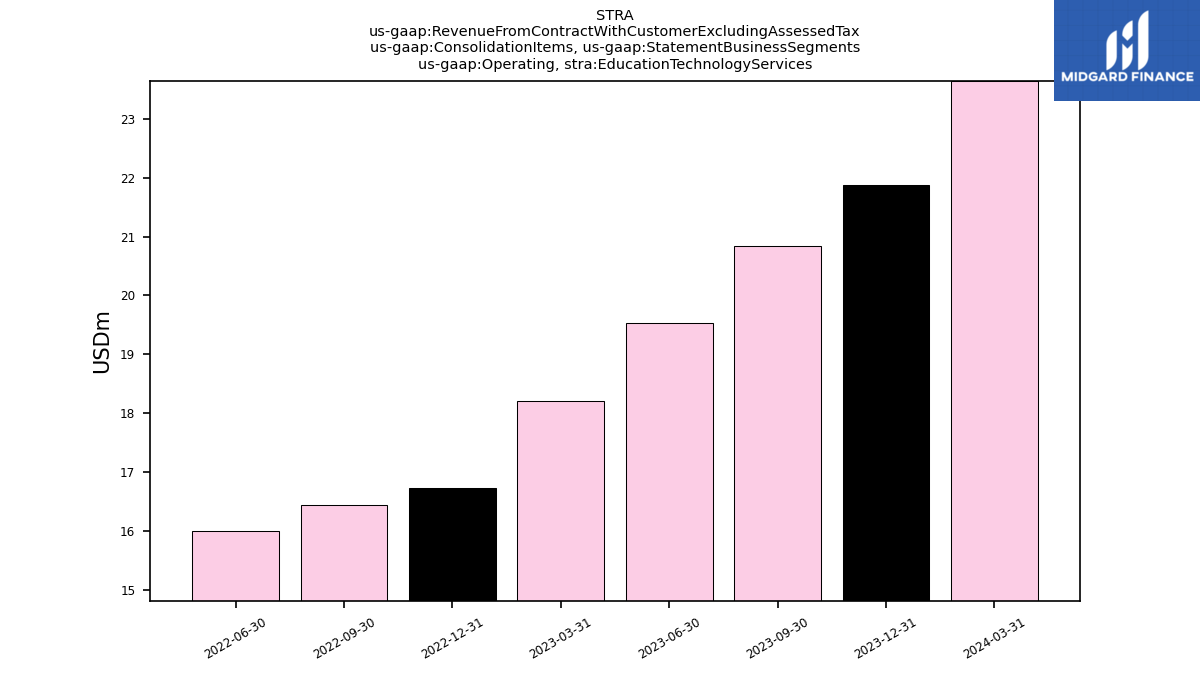
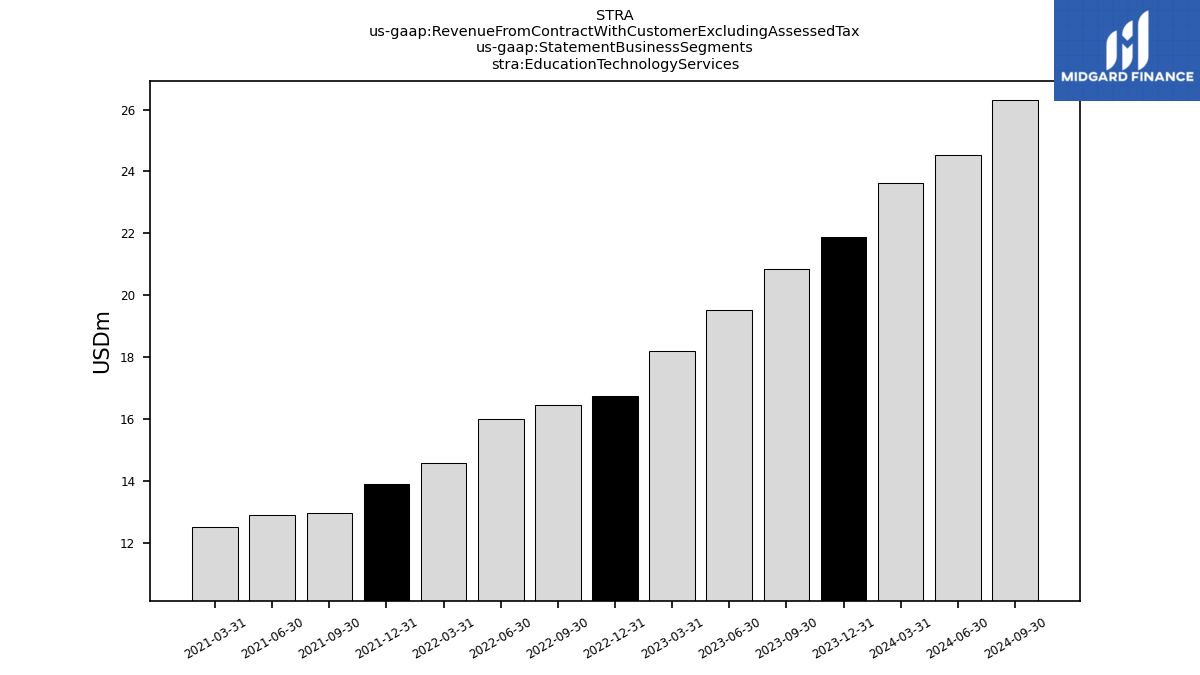
| Operating, Education Technology Services | 23.64 | 21.87 | 20.84 | 19.53 | 18.21 | 16.73 | 16.45 | 15.99 | NA | NA | NA | NA | NA | NA | NA | NA | NA | NA | NA | NA | NA | NA | NA | NA | NA | NA | NA | NA | NA | NA | NA | NA | NA | NA | NA | NA | NA | NA | NA | NA | NA | NA | NA | NA | NA | NA | NA | NA | NA | NA | NA | NA | NA | NA | NA | NA | NA | NA | |
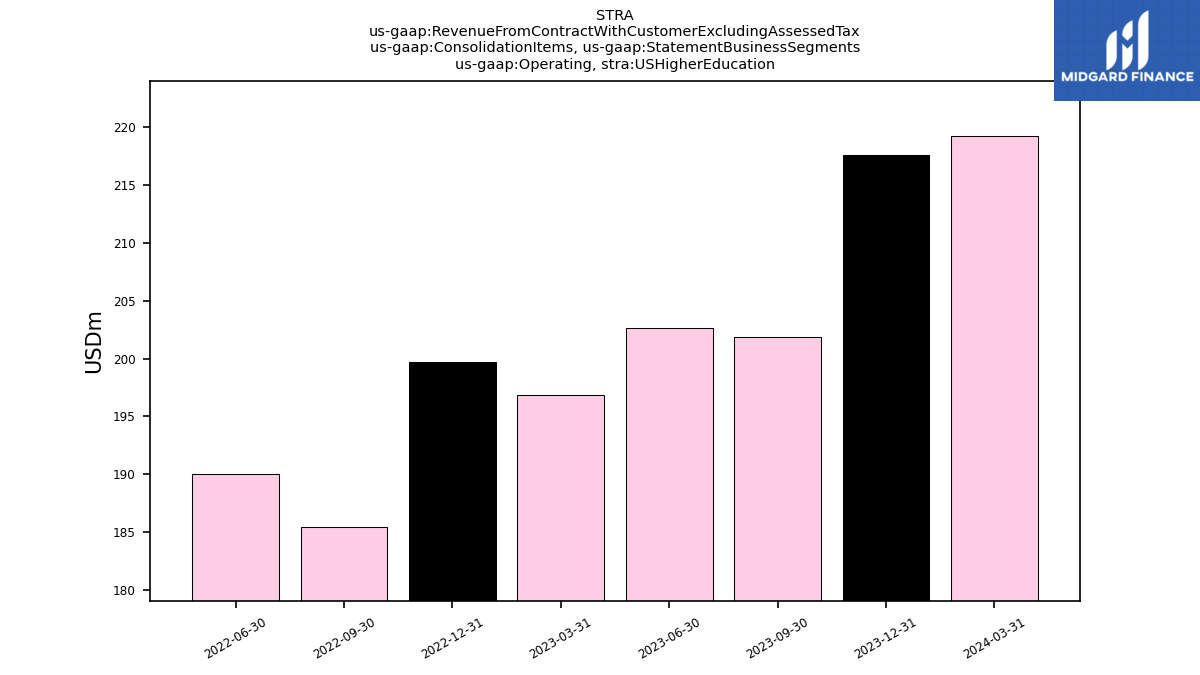
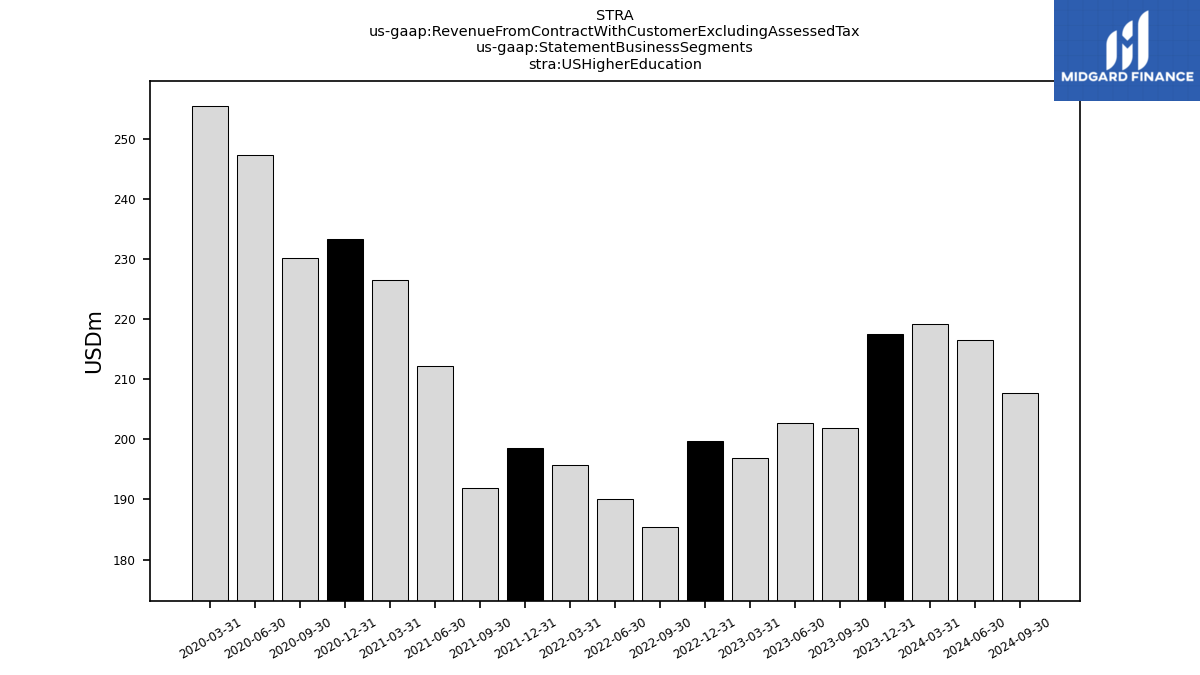
| Operating, U S Higher Education | 219.24 | 217.55 | 201.83 | 202.68 | 196.90 | 199.69 | 185.50 | 190.03 | NA | NA | NA | NA | NA | NA | NA | NA | NA | NA | NA | NA | NA | NA | NA | NA | NA | NA | NA | NA | NA | NA | NA | NA | NA | NA | NA | NA | NA | NA | NA | NA | NA | NA | NA | NA | NA | NA | NA | NA | NA | NA | NA | NA | NA | NA | NA | NA | NA | NA | |
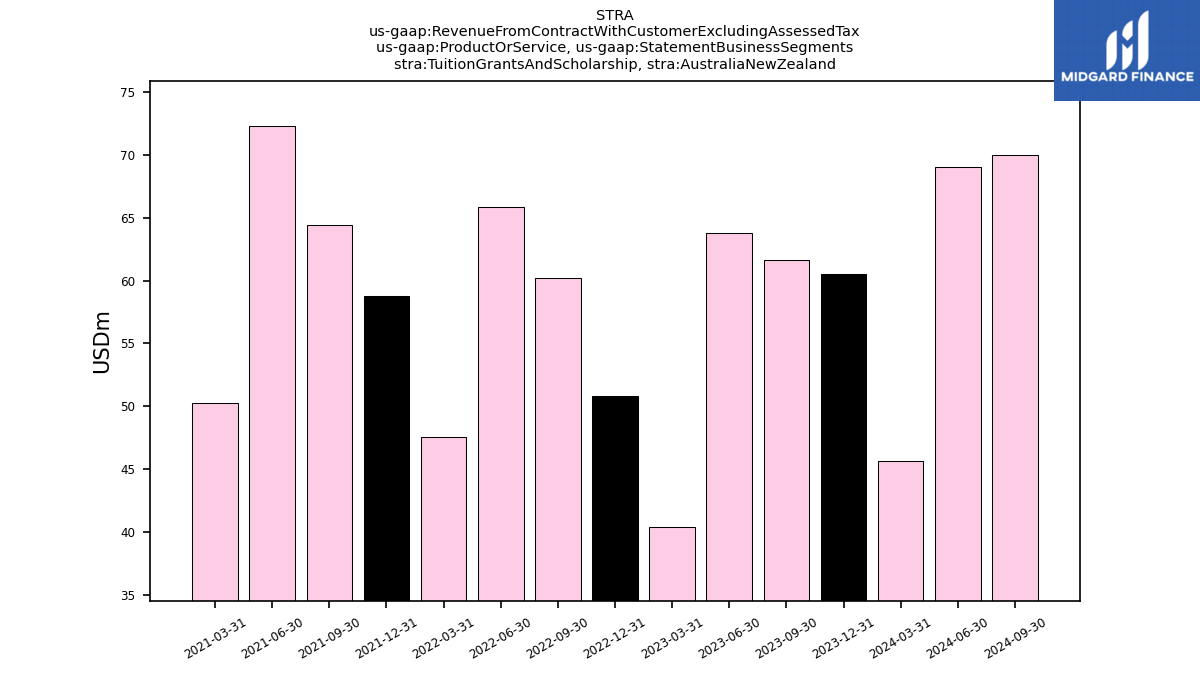
| Tuition Grants And Scholarship, Australia New Zealand | 45.63 | 60.54 | 61.67 | 63.77 | 40.42 | 50.78 | 60.24 | 65.85 | 47.54 | 58.77 | 64.46 | 72.34 | 50.22 | NA | NA | NA | NA | NA | NA | NA | NA | NA | NA | NA | NA | NA | NA | NA | NA | NA | NA | NA | NA | NA | NA | NA | NA | NA | NA | NA | NA | NA | NA | NA | NA | NA | NA | NA | NA | NA | NA | NA | NA | NA | NA | NA | NA | NA | |
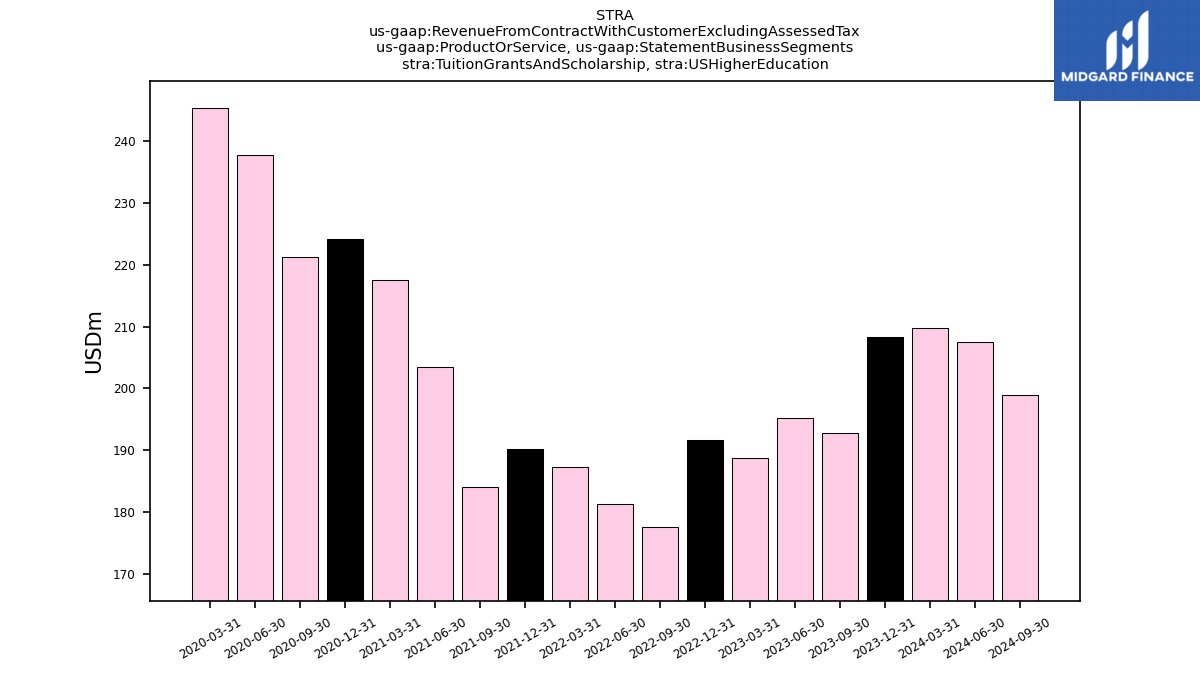
| Tuition Grants And Scholarship, U S Higher Education | 209.73 | 208.34 | 192.85 | 195.14 | 188.78 | 191.64 | 177.68 | 181.37 | 187.35 | 190.23 | 184.13 | 203.43 | 217.48 | 224.22 | 221.24 | 237.70 | 245.32 | NA | NA | NA | NA | NA | NA | NA | NA | NA | NA | NA | NA | NA | NA | NA | NA | NA | NA | NA | NA | NA | NA | NA | NA | NA | NA | NA | NA | NA | NA | NA | NA | NA | NA | NA | NA | NA | NA | NA | NA | NA | |
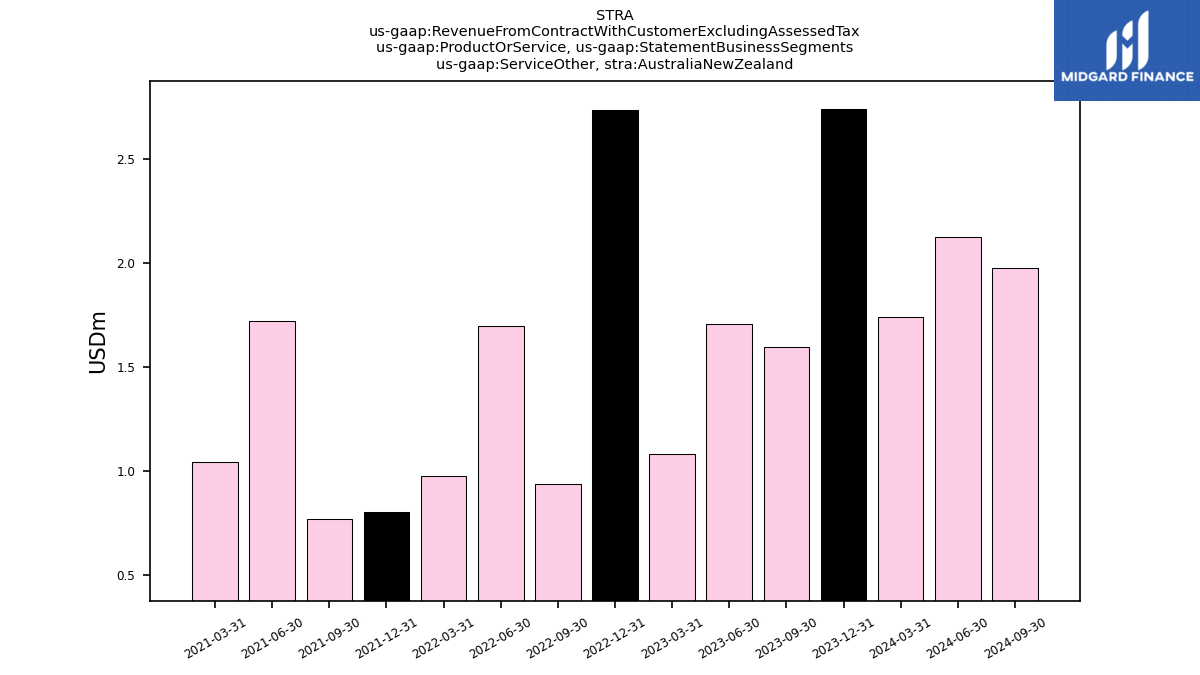
| Service Other, Australia New Zealand | 1.74 | 2.74 | 1.60 | 1.71 | 1.08 | 2.74 | 0.94 | 1.70 | 0.98 | 0.80 | 0.77 | 1.72 | 1.04 | NA | NA | NA | NA | NA | NA | NA | NA | NA | NA | NA | NA | NA | NA | NA | NA | NA | NA | NA | NA | NA | NA | NA | NA | NA | NA | NA | NA | NA | NA | NA | NA | NA | NA | NA | NA | NA | NA | NA | NA | NA | NA | NA | NA | NA | |
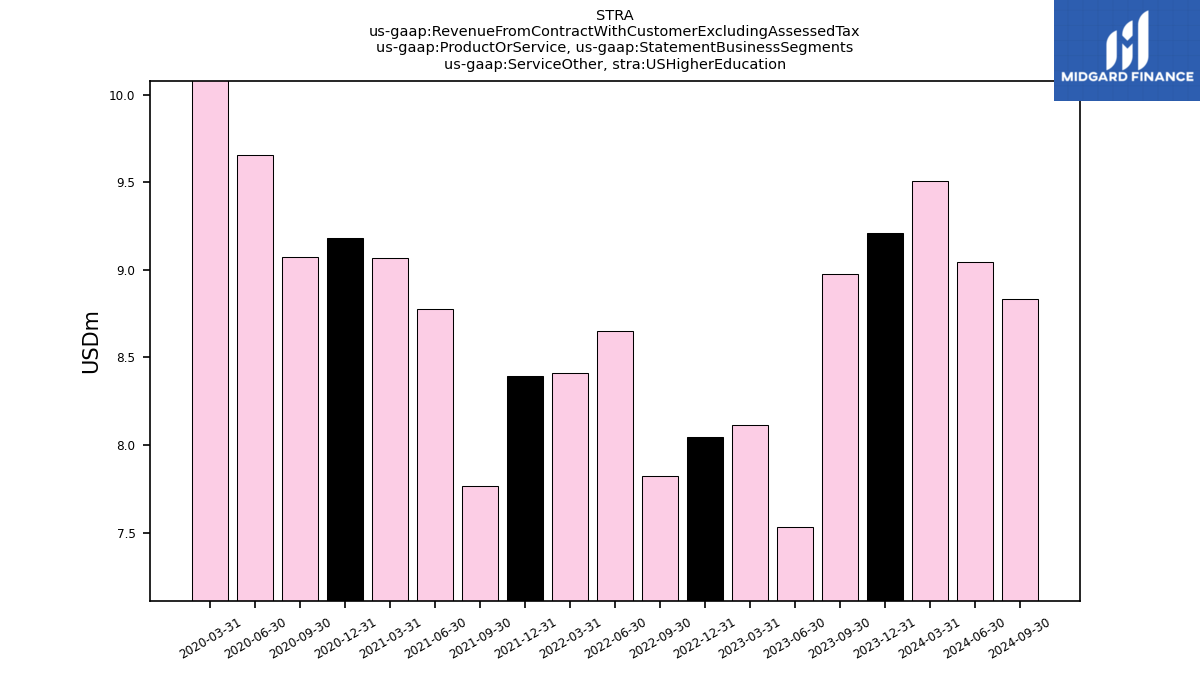
| Service Other, U S Higher Education | 9.51 | 9.21 | 8.98 | 7.54 | 8.12 | 8.04 | 7.82 | 8.65 | 8.41 | 8.39 | 7.77 | 8.77 | 9.07 | 9.18 | 9.08 | 9.65 | 10.19 | NA | NA | NA | NA | NA | NA | NA | NA | NA | NA | NA | NA | NA | NA | NA | NA | NA | NA | NA | NA | NA | NA | NA | NA | NA | NA | NA | NA | NA | NA | NA | NA | NA | NA | NA | NA | NA | NA | NA | NA | NA | |
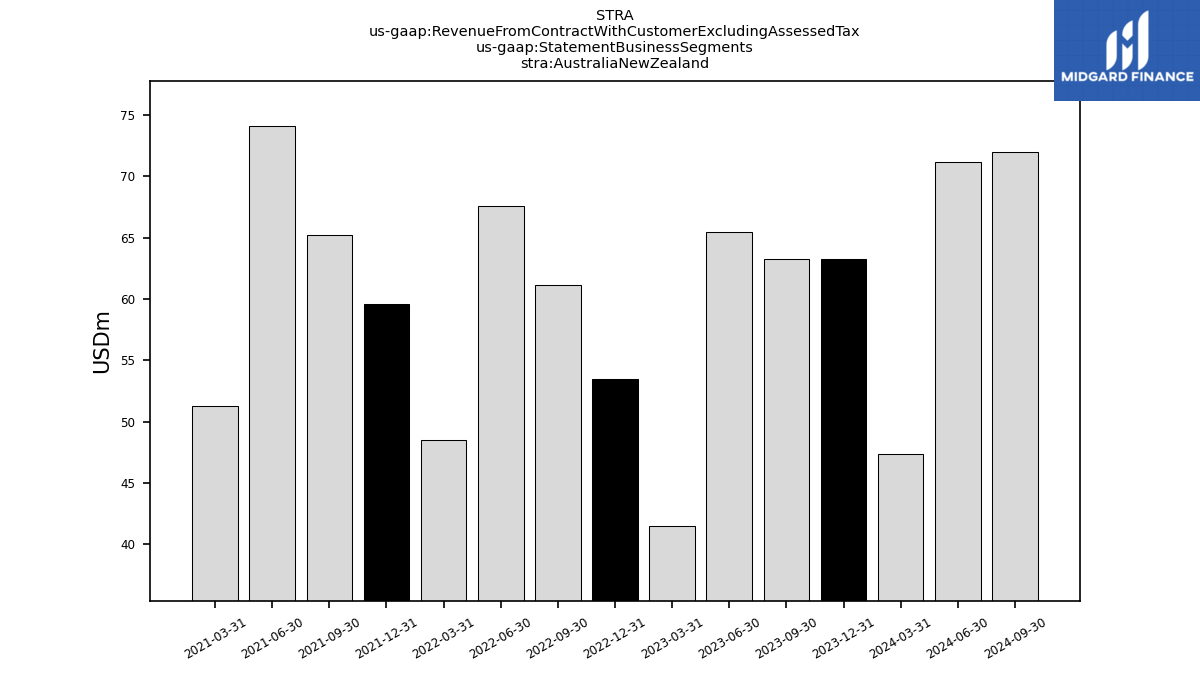
| Australia New Zealand | 47.38 | 63.28 | 63.26 | 65.47 | 41.50 | 53.52 | 61.18 | 67.54 | 48.51 | 59.58 | 65.22 | 74.06 | 51.27 | NA | NA | NA | NA | NA | NA | NA | NA | NA | NA | NA | NA | NA | NA | NA | NA | NA | NA | NA | NA | NA | NA | NA | NA | NA | NA | NA | NA | NA | NA | NA | NA | NA | NA | NA | NA | NA | NA | NA | NA | NA | NA | NA | NA | NA | |
| Education Technology Services | 23.64 | 21.87 | 20.84 | 19.53 | 18.21 | 16.73 | 16.45 | 15.99 | 14.58 | 13.90 | 12.96 | 12.91 | 12.52 | NA | NA | NA | NA | NA | NA | NA | NA | NA | NA | NA | NA | NA | NA | NA | NA | NA | NA | NA | NA | NA | NA | NA | NA | NA | NA | NA | NA | NA | NA | NA | NA | NA | NA | NA | NA | NA | NA | NA | NA | NA | NA | NA | NA | NA | |
| U S Higher Education | 219.24 | 217.55 | 201.83 | 202.68 | 196.90 | 199.69 | 185.50 | 190.03 | 195.77 | 198.62 | 191.89 | 212.21 | 226.55 | 233.41 | 230.31 | 247.35 | 255.51 | NA | NA | NA | NA | NA | NA | NA | NA | NA | NA | NA | NA | NA | NA | NA | NA | NA | NA | NA | NA | NA | NA | NA | NA | NA | NA | NA | NA | NA | NA | NA | NA | NA | NA | NA | NA | NA | NA | NA | NA | NA |