
| 2024-03-31 | 2023-12-31 | 2023-09-30 | 2023-06-30 | 2023-03-31 | 2022-12-31 | 2022-09-30 | 2022-06-30 | 2022-03-31 | 2021-12-31 | 2021-09-30 | 2021-06-30 | 2021-03-31 | 2020-12-31 | 2020-09-30 | 2020-06-30 | 2020-03-31 | 2019-12-31 | 2019-09-30 | 2019-06-30 | 2019-03-31 | 2018-12-31 | 2018-09-30 | 2018-06-30 | 2018-03-31 | 2017-12-31 | 2017-09-30 | 2017-06-30 | 2017-03-31 | 2016-12-31 | 2016-09-30 | 2016-06-30 | 2016-03-31 | 2015-12-31 | 2015-09-30 | 2015-06-30 | 2015-03-31 | 2014-12-31 | 2014-09-30 | 2014-06-30 | 2014-03-31 | 2013-12-31 | 2013-09-30 | 2013-06-30 | 2013-03-31 | 2012-12-31 | 2012-09-30 | 2012-06-30 | 2012-03-31 | 2011-12-31 | 2011-09-30 | 2011-06-30 | 2011-03-31 | 2010-12-31 | 2010-09-30 | 2010-06-30 | 2010-03-31 | 2009-12-31 | 2009-09-30 | ||
|---|---|---|---|---|---|---|---|---|---|---|---|---|---|---|---|---|---|---|---|---|---|---|---|---|---|---|---|---|---|---|---|---|---|---|---|---|---|---|---|---|---|---|---|---|---|---|---|---|---|---|---|---|---|---|---|---|---|---|---|---|
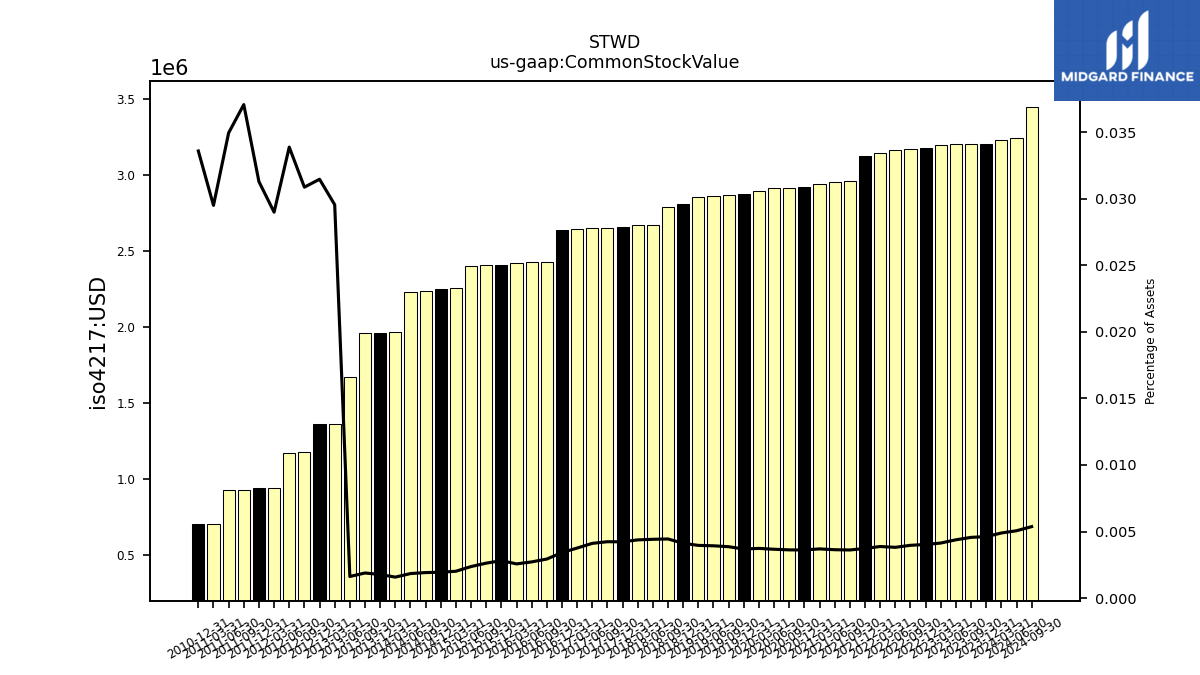
| Common Stock Value | 3.23 | 3.21 | 3.21 | 3.20 | 3.20 | 3.18 | 3.17 | 3.17 | 3.14 | 3.12 | 2.96 | 2.95 | 2.94 | 2.92 | 2.92 | 2.92 | 2.89 | 2.87 | 2.87 | 2.86 | 2.85 | 2.81 | 2.79 | 2.67 | 2.67 | 2.66 | 2.65 | 2.65 | 2.65 | 2.64 | 2.43 | 2.43 | 2.42 | 2.41 | 2.41 | 2.40 | 2.25 | 2.25 | 2.24 | 2.23 | 1.97 | 1.96 | 1.96 | 1.67 | 1.36 | 1.36 | 1.18 | 1.17 | 0.94 | 0.94 | 0.93 | 0.93 | 0.71 | 0.71 | NA | NA | NA | NA | NA | |
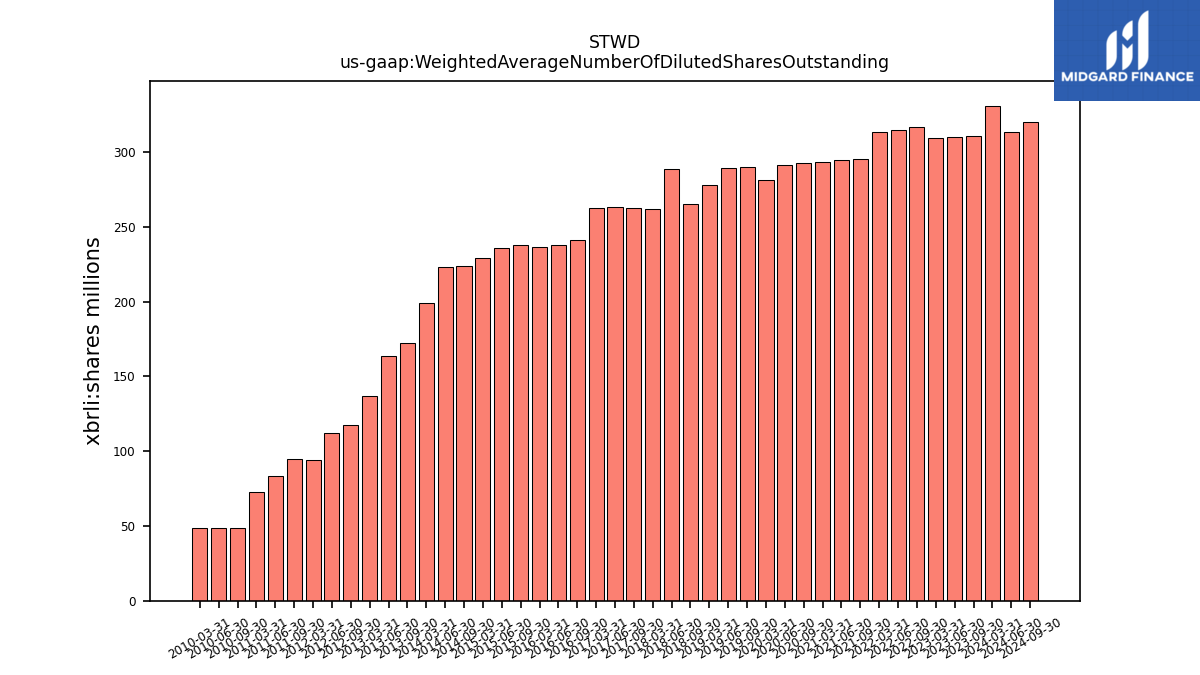
| Weighted Average Number Of Diluted Shares Outstanding | 330.84 | NA | 310.57 | 310.06 | 309.00 | NA | 316.57 | 314.96 | 313.33 | NA | 295.45 | 294.57 | 293.23 | NA | 292.46 | 291.29 | 280.99 | NA | 289.91 | 289.07 | 277.70 | NA | 265.46 | 288.31 | 262.12 | NA | 262.44 | 262.85 | 262.44 | NA | 241.09 | 237.60 | 236.76 | NA | 237.93 | 235.83 | 229.03 | NA | 223.54 | 222.89 | 198.88 | NA | 172.39 | 163.49 | 136.67 | NA | 117.38 | 112.18 | 94.23 | NA | 94.60 | 83.64 | 72.74 | NA | 48.63 | 48.63 | 48.63 | NA | NA | |
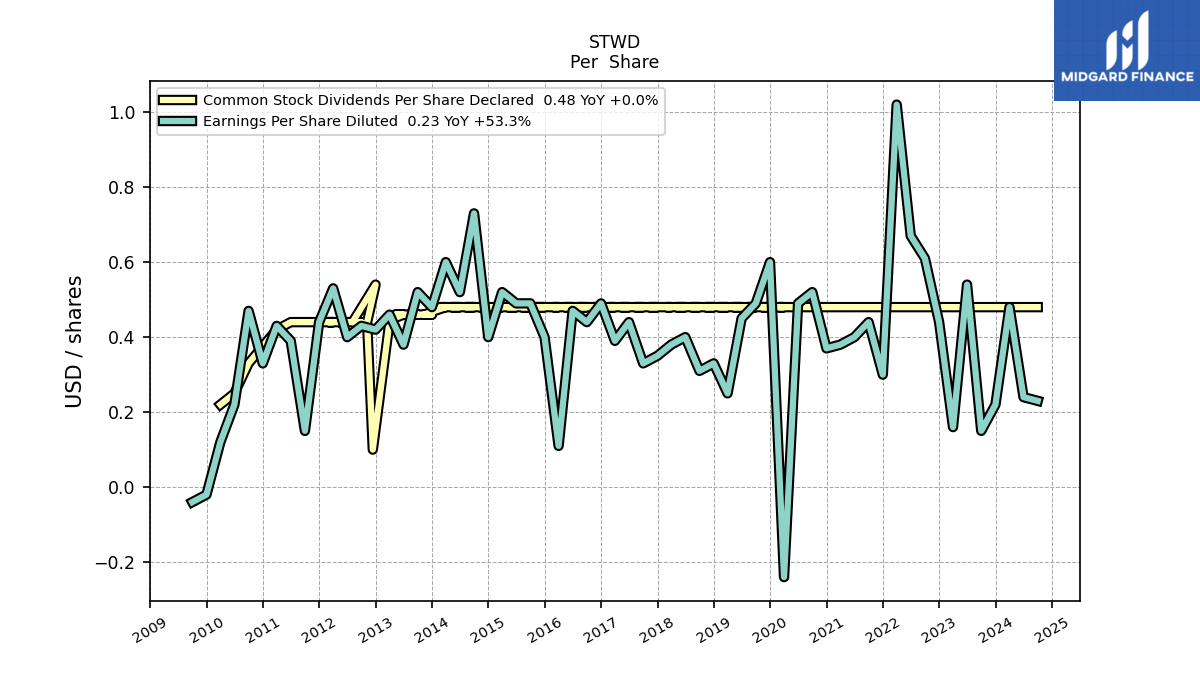
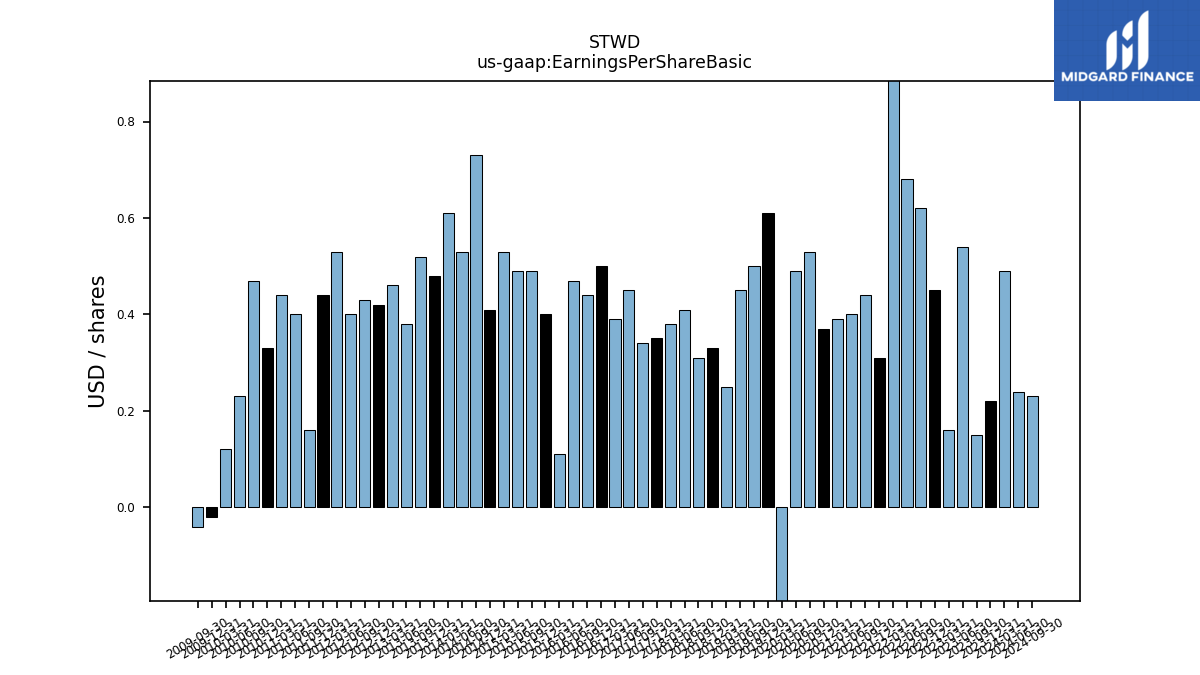
| Earnings Per Share Basic | 0.49 | 0.22 | 0.15 | 0.54 | 0.16 | 0.45 | 0.62 | 0.68 | 1.04 | 0.31 | 0.44 | 0.40 | 0.39 | 0.37 | 0.53 | 0.49 | -0.24 | 0.61 | 0.50 | 0.45 | 0.25 | 0.33 | 0.31 | 0.41 | 0.38 | 0.35 | 0.34 | 0.45 | 0.39 | 0.50 | 0.44 | 0.47 | 0.11 | 0.40 | 0.49 | 0.49 | 0.53 | 0.41 | 0.73 | 0.53 | 0.61 | 0.48 | 0.52 | 0.38 | 0.46 | 0.42 | 0.43 | 0.40 | 0.53 | 0.44 | 0.16 | 0.40 | 0.44 | 0.33 | 0.47 | 0.23 | 0.12 | -0.02 | -0.04 | |
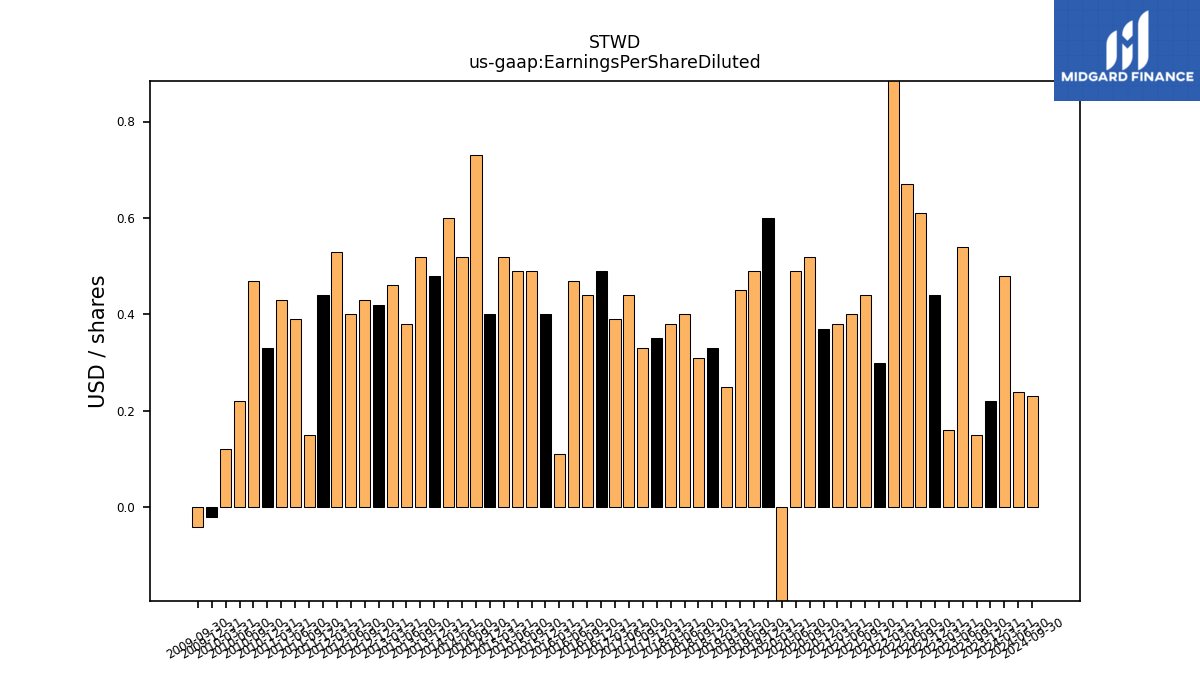
| Earnings Per Share Diluted | 0.48 | 0.22 | 0.15 | 0.54 | 0.16 | 0.44 | 0.61 | 0.67 | 1.02 | 0.30 | 0.44 | 0.40 | 0.38 | 0.37 | 0.52 | 0.49 | -0.24 | 0.60 | 0.49 | 0.45 | 0.25 | 0.33 | 0.31 | 0.40 | 0.38 | 0.35 | 0.33 | 0.44 | 0.39 | 0.49 | 0.44 | 0.47 | 0.11 | 0.40 | 0.49 | 0.49 | 0.52 | 0.40 | 0.73 | 0.52 | 0.60 | 0.48 | 0.52 | 0.38 | 0.46 | 0.42 | 0.43 | 0.40 | 0.53 | 0.44 | 0.15 | 0.39 | 0.43 | 0.33 | 0.47 | 0.22 | 0.12 | -0.02 | -0.04 |
| 2024-03-31 | 2023-12-31 | 2023-09-30 | 2023-06-30 | 2023-03-31 | 2022-12-31 | 2022-09-30 | 2022-06-30 | 2022-03-31 | 2021-12-31 | 2021-09-30 | 2021-06-30 | 2021-03-31 | 2020-12-31 | 2020-09-30 | 2020-06-30 | 2020-03-31 | 2019-12-31 | 2019-09-30 | 2019-06-30 | 2019-03-31 | 2018-12-31 | 2018-09-30 | 2018-06-30 | 2018-03-31 | 2017-12-31 | 2017-09-30 | 2017-06-30 | 2017-03-31 | 2016-12-31 | 2016-09-30 | 2016-06-30 | 2016-03-31 | 2015-12-31 | 2015-09-30 | 2015-06-30 | 2015-03-31 | 2014-12-31 | 2014-09-30 | 2014-06-30 | 2014-03-31 | 2013-12-31 | 2013-09-30 | 2013-06-30 | 2013-03-31 | 2012-12-31 | 2012-09-30 | 2012-06-30 | 2012-03-31 | 2011-12-31 | 2011-09-30 | 2011-06-30 | 2011-03-31 | 2010-12-31 | 2010-09-30 | 2010-06-30 | 2010-03-31 | 2009-12-31 | 2009-09-30 | ||
|---|---|---|---|---|---|---|---|---|---|---|---|---|---|---|---|---|---|---|---|---|---|---|---|---|---|---|---|---|---|---|---|---|---|---|---|---|---|---|---|---|---|---|---|---|---|---|---|---|---|---|---|---|---|---|---|---|---|---|---|---|
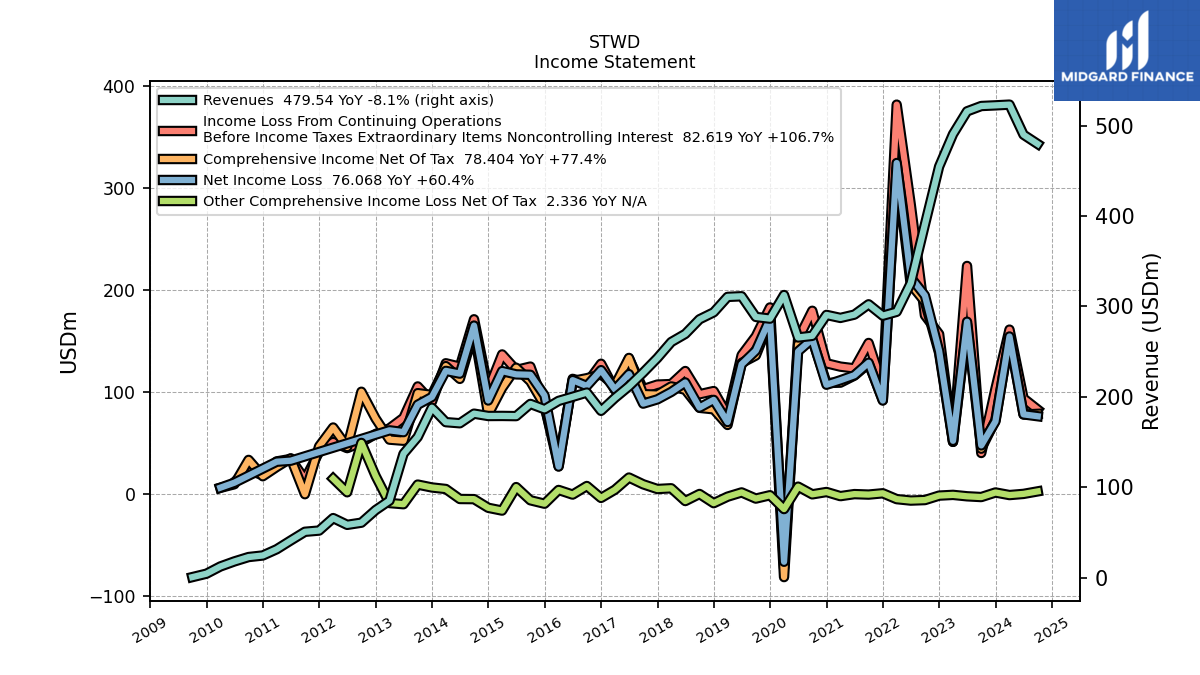
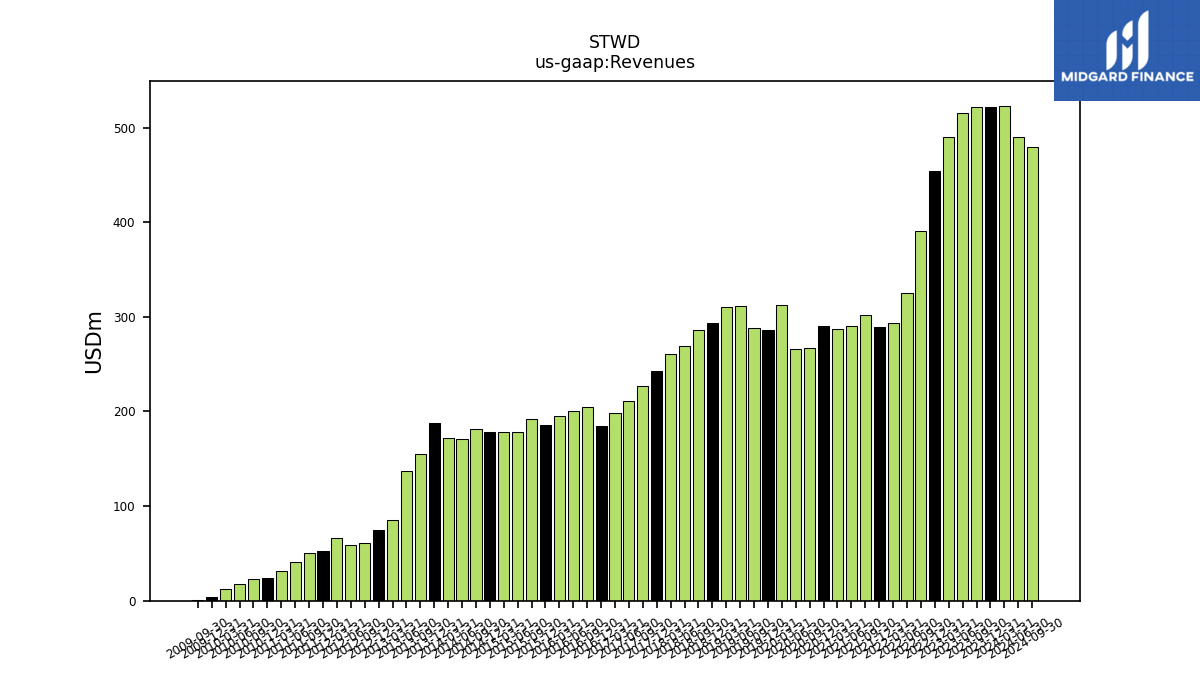
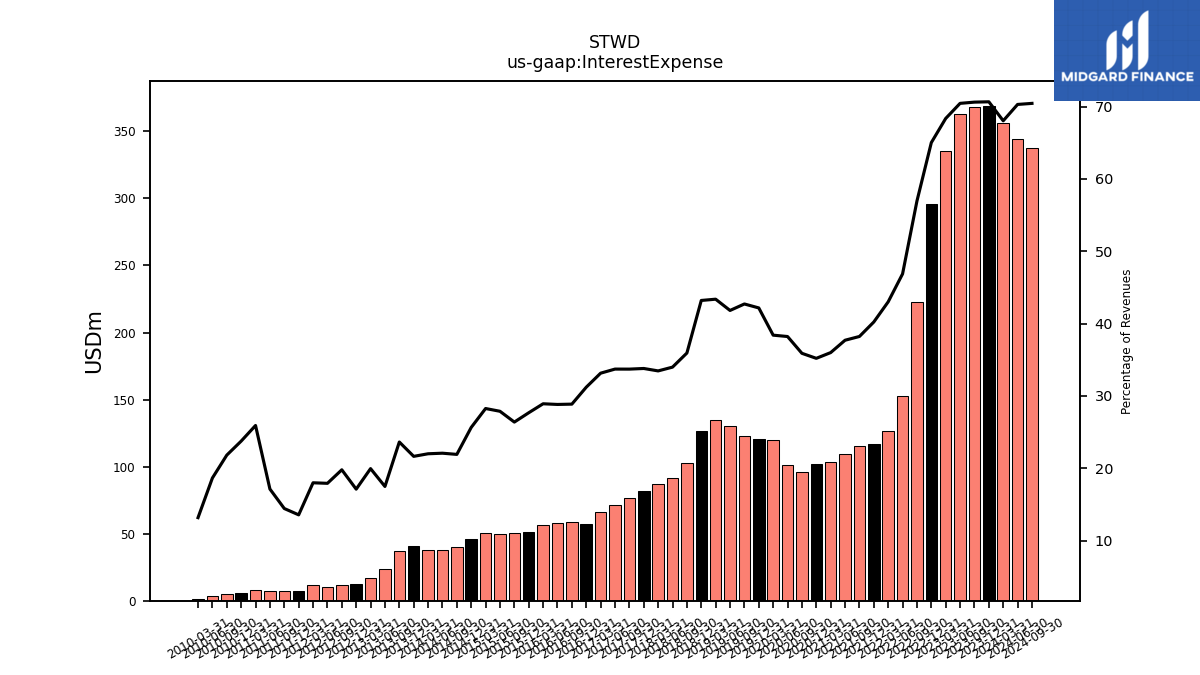
| Revenues | 523.09 | 522.28 | 521.55 | 515.67 | 490.41 | 454.60 | 390.54 | 325.59 | 293.99 | 289.70 | 302.29 | 290.87 | 287.23 | 290.56 | 267.43 | 265.61 | 312.56 | 286.43 | 288.33 | 311.18 | 310.48 | 293.42 | 285.72 | 269.56 | 260.59 | 242.83 | 226.77 | 211.57 | 198.72 | 184.48 | 204.71 | 199.99 | 195.49 | 186.22 | 192.15 | 178.66 | 178.85 | 178.78 | 181.37 | 170.75 | 171.98 | 187.95 | 155.54 | 137.04 | 85.17 | 74.72 | 60.82 | 58.42 | 65.90 | 52.09 | 50.75 | 41.13 | 31.43 | 24.54 | 22.82 | 17.98 | 12.40 | 4.41 | 0.61 | |
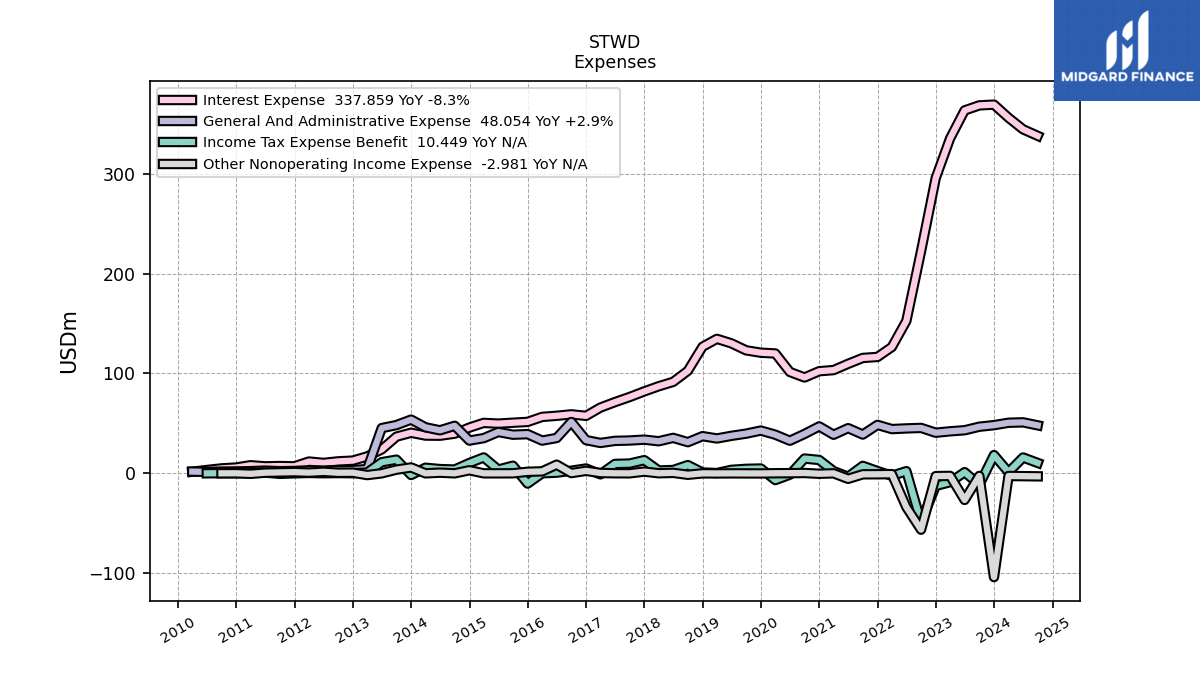
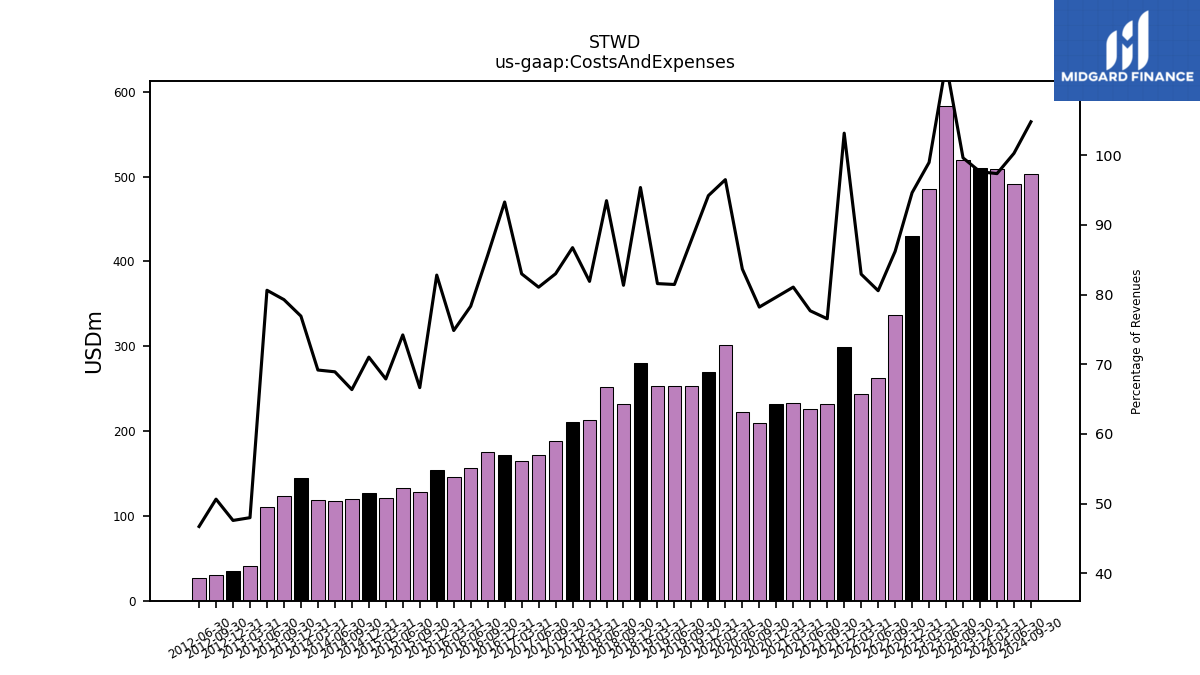
| Costs And Expenses | 509.31 | 509.92 | 519.60 | 583.45 | 485.34 | 430.18 | 336.65 | 262.30 | 243.82 | 298.89 | 231.35 | 225.94 | 232.88 | 231.40 | 209.16 | 222.23 | 301.62 | 269.82 | 253.24 | 253.47 | 253.29 | 279.83 | 232.40 | 251.98 | 213.42 | 210.63 | 188.20 | 171.51 | 164.90 | 172.09 | 175.33 | 156.65 | 146.32 | 154.19 | 128.07 | 132.59 | 121.43 | 126.98 | 120.37 | 117.69 | 118.97 | 144.56 | 123.31 | 110.48 | 40.87 | 35.56 | 30.80 | 27.30 | NA | NA | NA | NA | NA | NA | NA | NA | NA | NA | NA | |
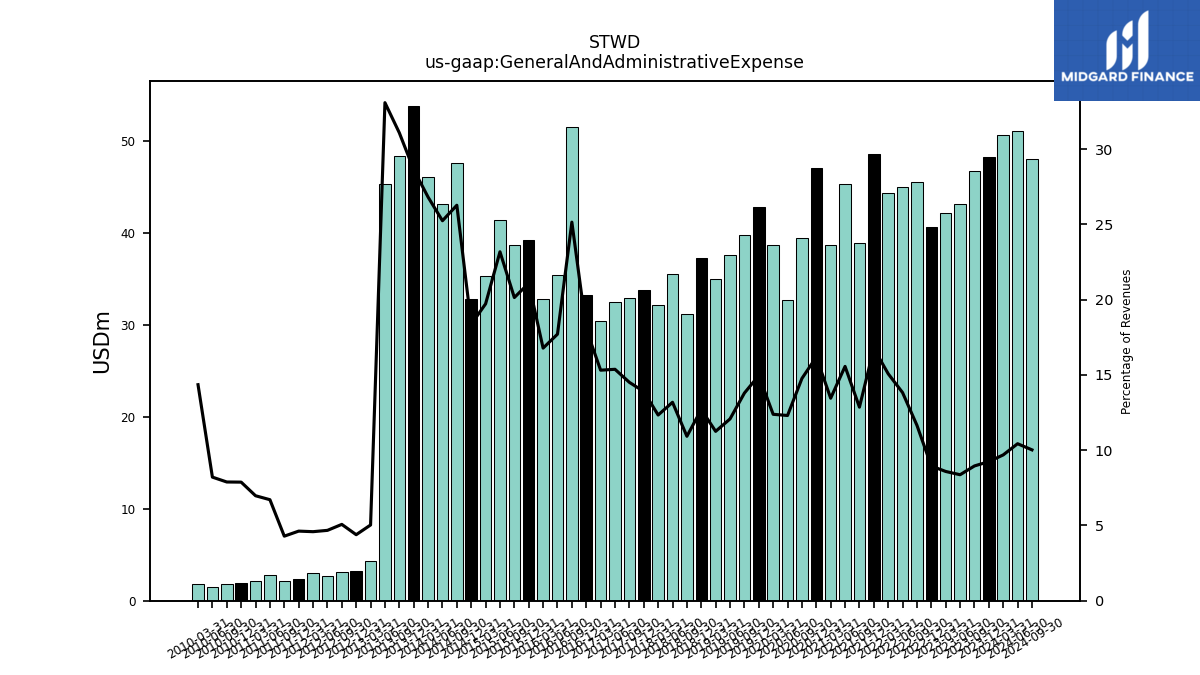
| General And Administrative Expense | 50.66 | 48.26 | 46.69 | 43.16 | 42.11 | 40.68 | 45.49 | 45.01 | 44.32 | 48.54 | 38.86 | 45.27 | 38.64 | 47.02 | 39.48 | 32.68 | 38.70 | 42.84 | 39.77 | 37.58 | 34.93 | 37.26 | 31.20 | 35.53 | 32.14 | 33.75 | 32.89 | 32.52 | 30.43 | 33.26 | 51.47 | 35.41 | 32.80 | 39.27 | 38.69 | 41.40 | 35.26 | 32.83 | 47.64 | 43.09 | 46.10 | 53.81 | 48.34 | 45.33 | 4.29 | 3.28 | 3.08 | 2.73 | 3.02 | 2.41 | 2.18 | 2.76 | 2.19 | 1.93 | 1.80 | 1.48 | 1.78 | NA | NA | |
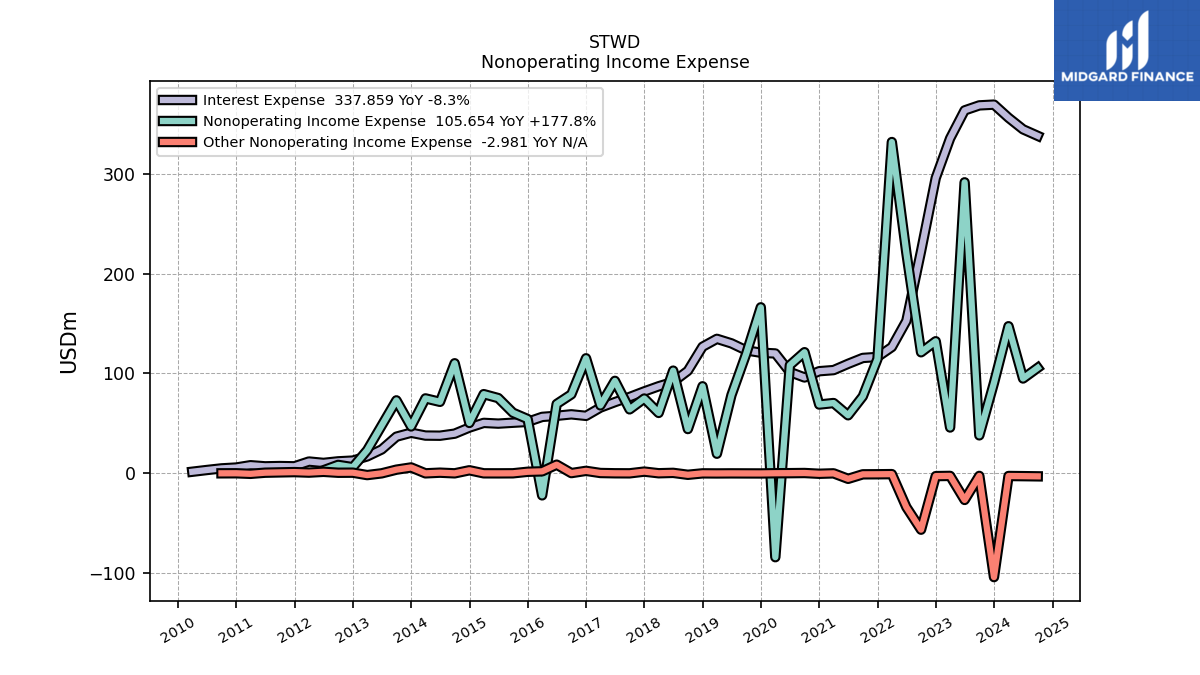
| Interest Expense | 355.96 | 369.12 | 368.36 | 363.33 | 335.30 | 295.63 | 222.42 | 152.62 | 126.45 | 116.53 | 115.53 | 109.65 | 103.37 | 102.26 | 95.98 | 101.49 | 120.03 | 120.78 | 123.16 | 130.13 | 134.67 | 126.75 | 102.66 | 91.59 | 87.18 | 82.06 | 76.43 | 71.32 | 65.86 | 57.56 | 59.08 | 57.63 | 56.52 | 51.53 | 50.69 | 49.80 | 50.53 | 45.84 | 39.74 | 37.70 | 37.83 | 40.67 | 36.74 | 23.95 | 16.99 | 12.78 | 12.03 | 10.46 | 11.85 | 7.06 | 7.32 | 7.04 | 8.14 | 5.83 | 4.98 | 3.35 | 1.63 | NA | NA | |
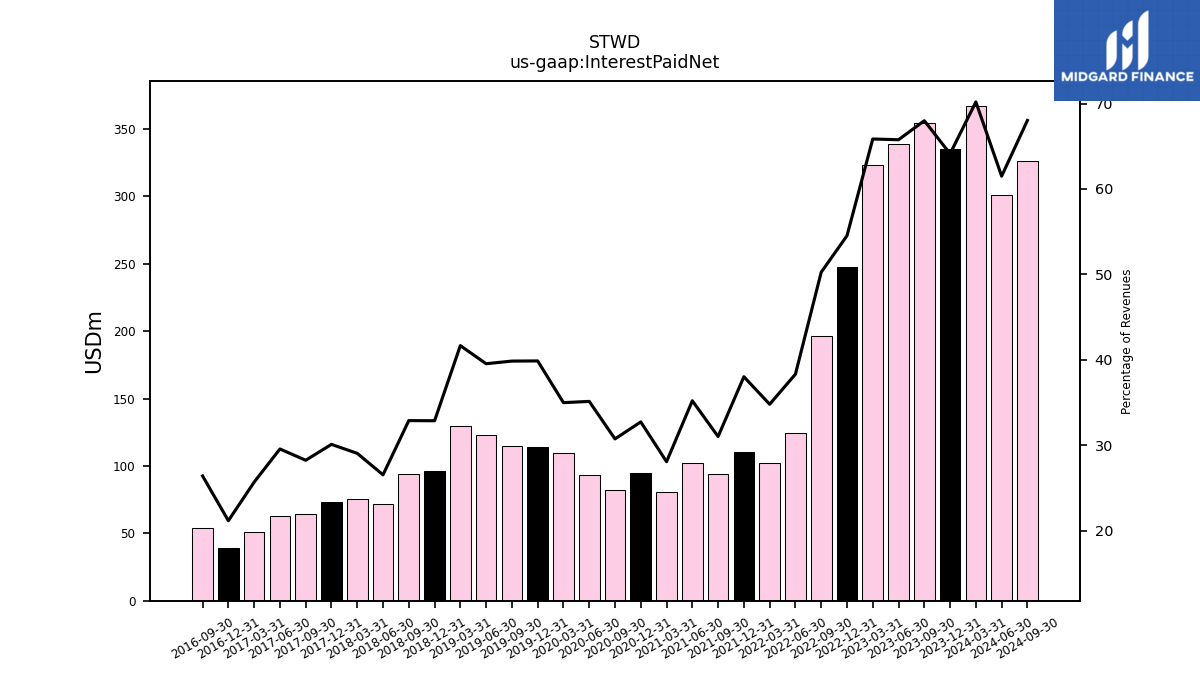
| Interest Paid Net | 367.14 | 334.90 | 354.59 | 339.12 | 322.93 | 247.86 | 196.28 | 124.75 | 102.30 | 110.14 | 93.77 | 102.39 | 80.62 | 95.09 | 82.21 | 93.31 | 109.34 | 114.19 | 114.90 | 123.04 | 129.35 | 96.43 | 93.94 | 71.53 | 75.70 | 73.09 | 64.04 | 62.54 | 51.02 | 39.04 | 54.05 | NA | NA | NA | NA | NA | NA | NA | NA | NA | NA | NA | NA | NA | NA | NA | NA | NA | NA | NA | NA | NA | NA | NA | NA | NA | NA | NA | NA | |
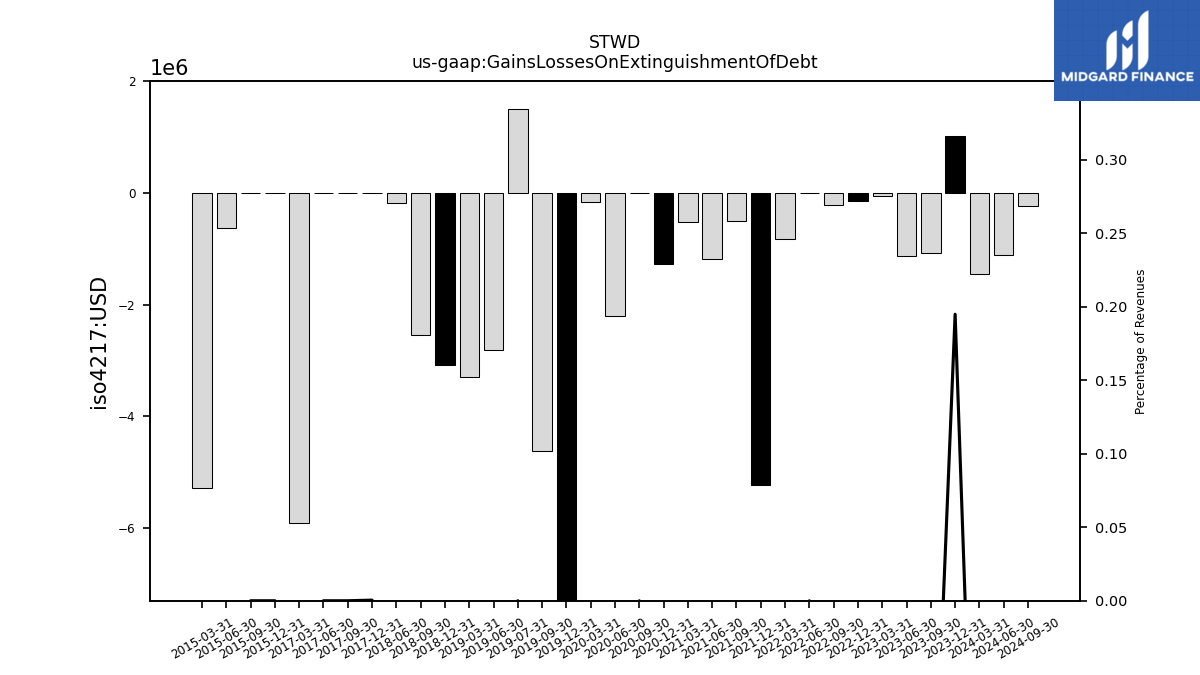
| Gains Losses On Extinguishment Of Debt | -1.45 | 1.02 | -1.07 | -1.12 | -0.06 | -0.15 | -0.21 | 0.00 | -0.82 | -5.23 | -0.50 | -1.18 | -0.52 | -1.28 | 0.00 | -2.21 | -0.17 | -8.53 | -4.62 | -2.82 | -3.30 | -3.08 | -2.54 | -0.19 | NA | 0.00 | 0.00 | 0.00 | -5.92 | NA | NA | NA | NA | 0.00 | 0.00 | -0.63 | -5.29 | NA | NA | NA | NA | NA | NA | NA | NA | NA | NA | NA | NA | NA | NA | NA | NA | NA | NA | NA | NA | NA | NA | |
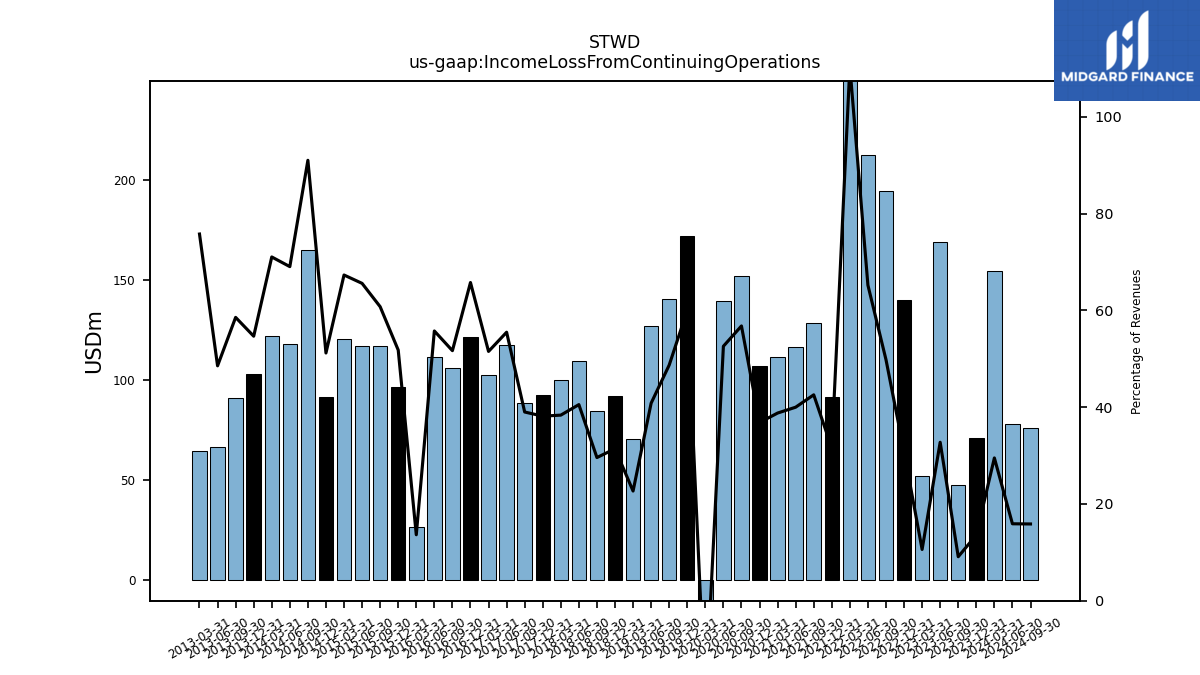
| Income Loss From Continuing Operations | 154.33 | 70.96 | 47.44 | 168.84 | 51.97 | 140.03 | 194.56 | 212.29 | 324.60 | 91.45 | 128.60 | 116.31 | 111.38 | 106.97 | 151.83 | 139.66 | -66.77 | 171.87 | 140.40 | 127.02 | 70.38 | 92.13 | 84.54 | 109.23 | 99.93 | 92.60 | 88.43 | 117.38 | 102.36 | 121.29 | 105.77 | 111.47 | 26.66 | 96.45 | 116.73 | 117.15 | 120.36 | 91.51 | 165.04 | 117.87 | 122.15 | 102.72 | 91.06 | 66.51 | 64.53 | NA | NA | NA | NA | NA | NA | NA | NA | NA | NA | NA | NA | NA | NA | |
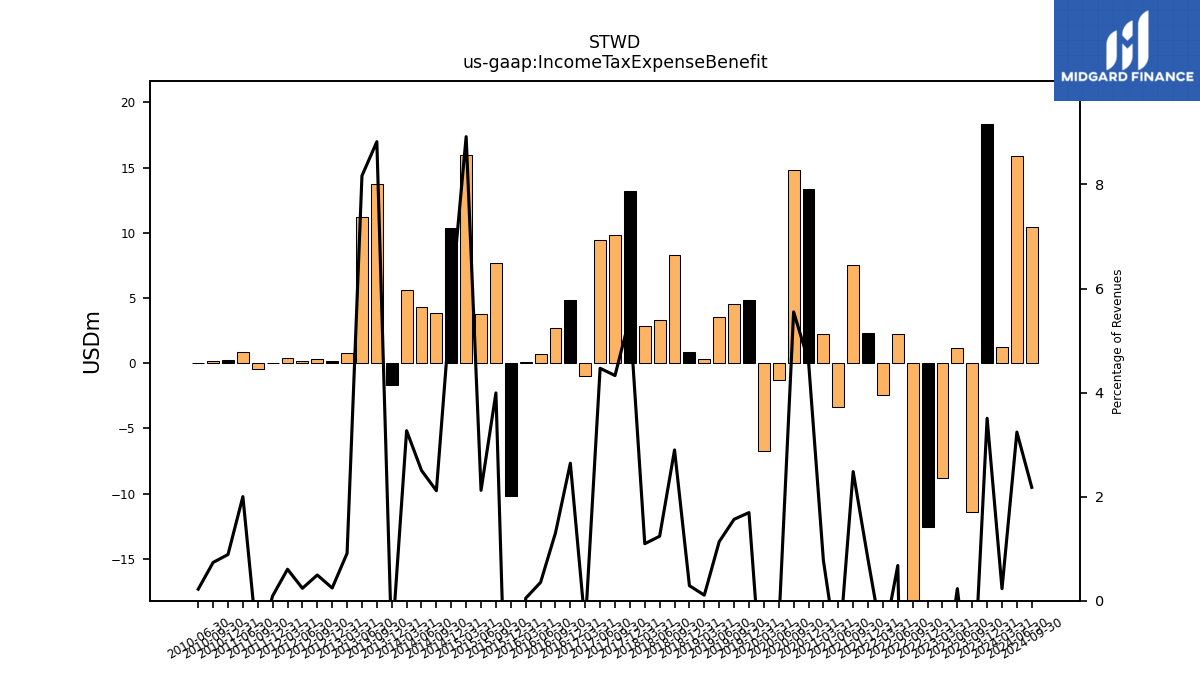
| Income Tax Expense Benefit | 1.21 | 18.32 | -11.40 | 1.20 | -8.79 | -12.52 | -48.76 | 2.21 | -2.45 | 2.29 | 7.50 | -3.35 | 2.23 | 13.38 | 14.84 | -1.30 | -6.73 | 4.85 | 4.51 | 3.53 | 0.33 | 0.85 | 8.28 | 3.34 | 2.86 | 13.24 | 9.82 | 9.45 | -0.98 | 4.88 | 2.67 | 0.71 | 0.09 | -10.21 | 7.67 | 3.79 | 15.95 | 10.36 | 3.84 | 4.28 | 5.62 | -1.64 | 13.72 | 11.19 | 0.78 | 0.18 | 0.30 | 0.14 | 0.40 | 0.05 | -0.46 | 0.82 | NA | 0.22 | 0.17 | 0.04 | NA | NA | NA | |
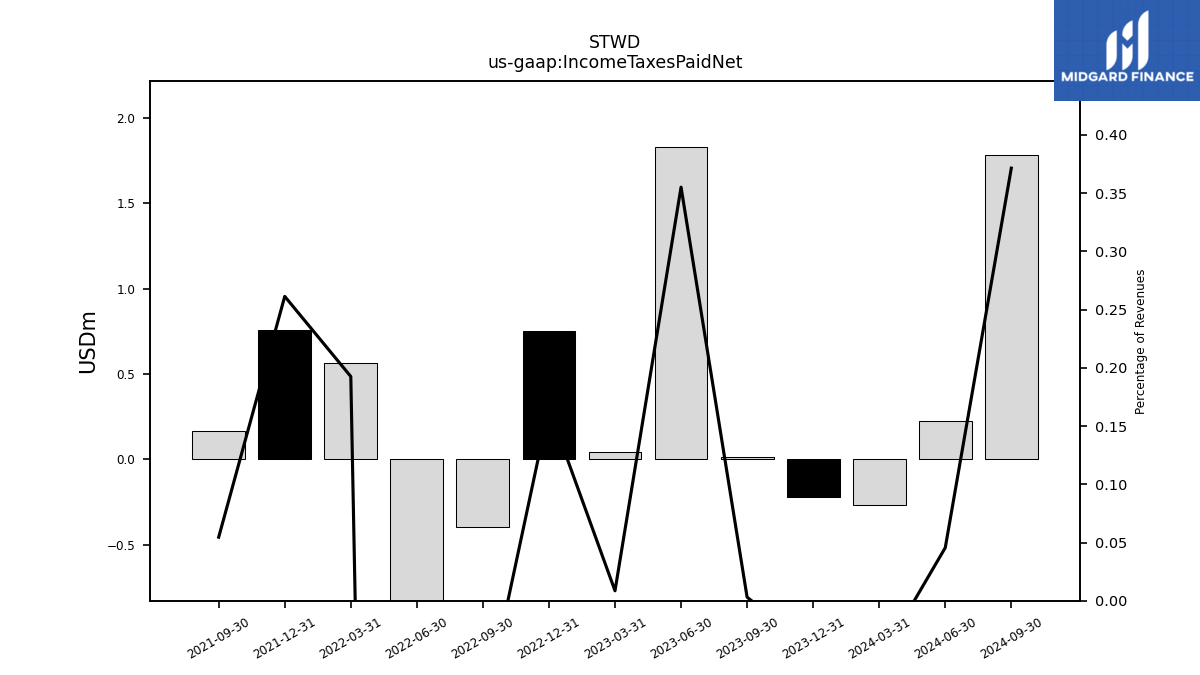
| Income Taxes Paid Net | -0.27 | -0.22 | 0.02 | 1.83 | 0.04 | 0.75 | -0.39 | -8.79 | 0.57 | 0.76 | 0.17 | NA | NA | NA | NA | NA | NA | NA | NA | NA | NA | NA | NA | NA | NA | NA | NA | NA | NA | NA | NA | NA | NA | NA | NA | NA | NA | NA | NA | NA | NA | NA | NA | NA | NA | NA | NA | NA | NA | NA | NA | NA | NA | NA | NA | NA | NA | NA | NA | |
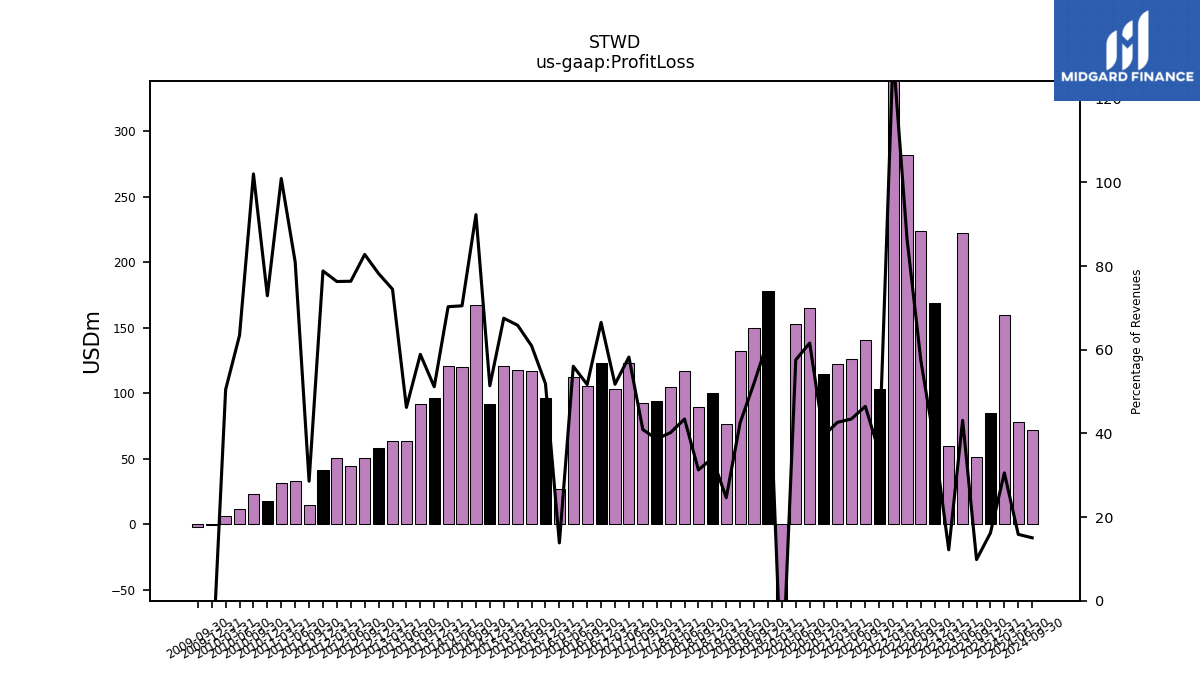
| Profit Loss | 159.86 | 84.64 | 51.38 | 222.38 | 59.76 | 169.20 | 223.84 | 281.70 | 384.31 | 103.03 | 140.49 | 126.38 | 122.53 | 114.66 | 164.73 | 152.96 | -66.27 | 177.98 | 150.00 | 132.45 | 76.51 | 99.93 | 89.38 | 117.09 | 104.79 | 93.88 | 92.80 | 123.23 | 102.85 | 122.72 | 105.81 | 112.07 | 27.05 | 96.65 | 117.12 | 117.64 | 120.78 | 91.89 | 167.39 | 120.38 | 120.88 | 96.15 | 91.60 | 63.34 | 63.42 | 58.43 | 50.34 | 44.62 | 50.29 | 41.07 | 14.50 | 33.31 | 31.73 | 17.89 | 23.28 | 11.41 | 6.26 | -0.81 | -1.77 | |
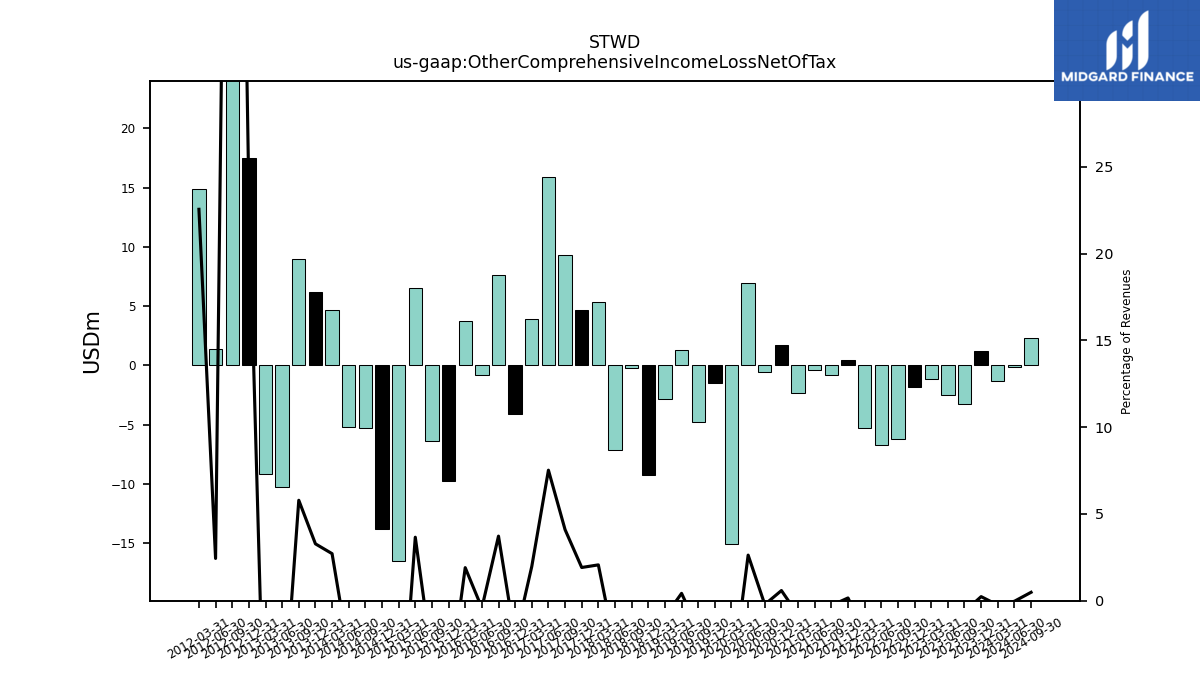
| Other Comprehensive Income Loss Net Of Tax | -1.29 | 1.24 | -3.24 | -2.50 | -1.10 | -1.82 | -6.19 | -6.70 | -5.28 | 0.47 | -0.82 | -0.34 | -2.34 | 1.71 | -0.58 | 6.98 | -15.05 | -1.45 | -4.75 | 1.33 | -2.86 | -9.26 | -0.21 | -7.18 | 5.39 | 4.65 | 9.29 | 15.91 | 3.93 | -4.11 | 7.62 | -0.83 | 3.73 | -9.78 | -6.39 | 6.54 | -16.53 | -13.79 | -5.28 | -5.15 | 4.67 | 6.16 | 9.00 | -10.26 | -9.13 | 17.49 | 49.90 | 1.42 | 14.86 | NA | NA | NA | NA | NA | NA | NA | NA | NA | NA | |
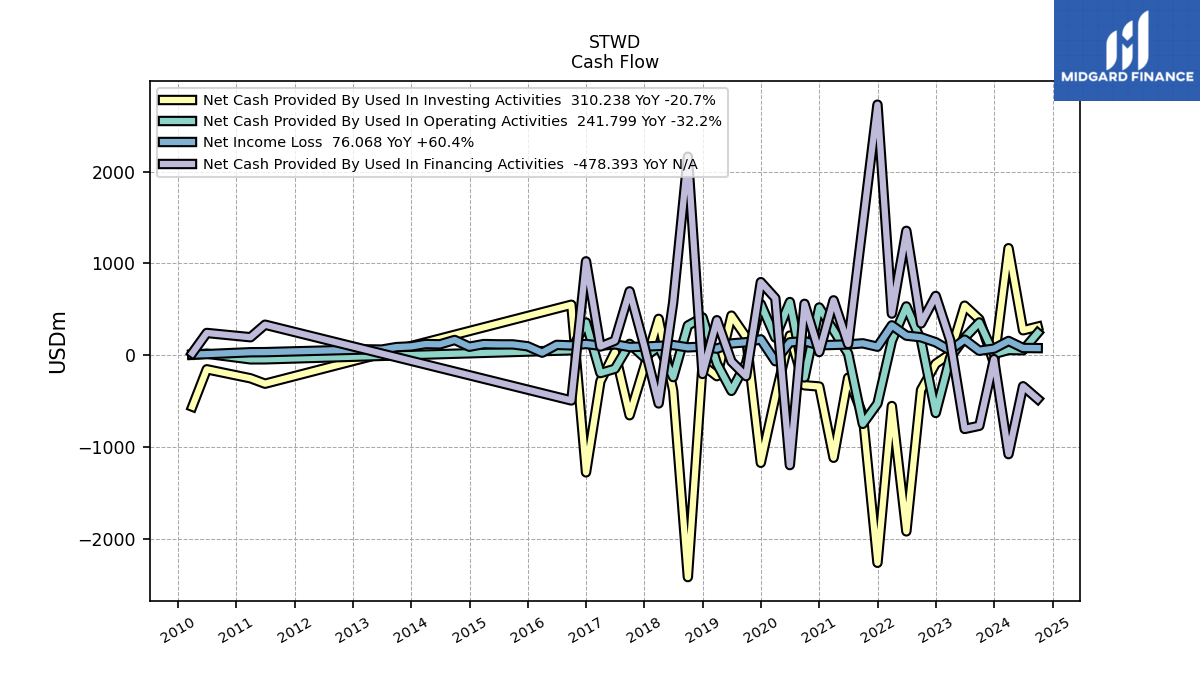
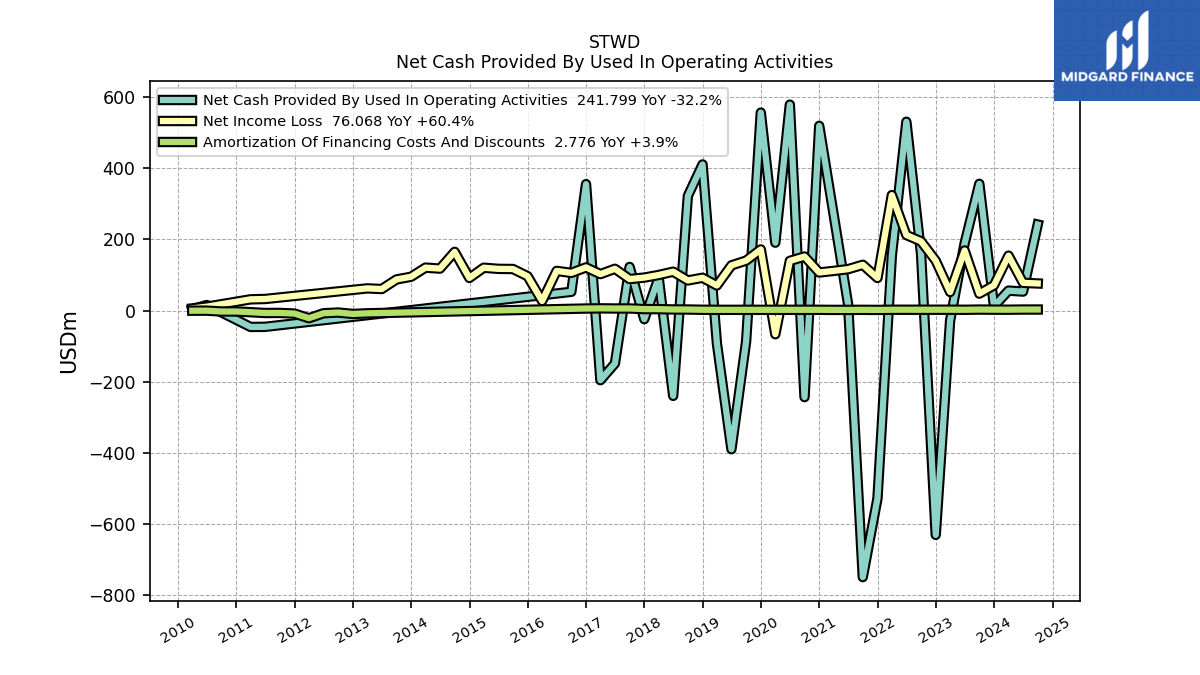
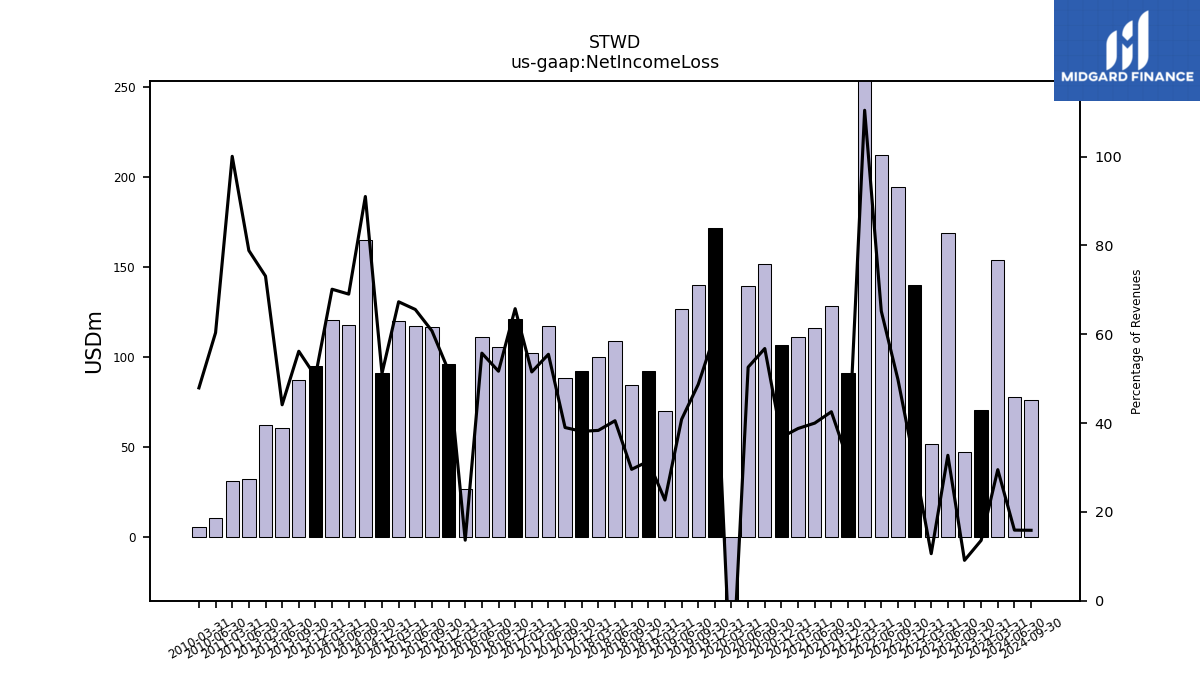
| Net Income Loss | 154.33 | 70.96 | 47.44 | 168.84 | 51.97 | 140.03 | 194.56 | 212.29 | 324.60 | 91.45 | 128.60 | 116.31 | 111.38 | 106.97 | 151.83 | 139.66 | -66.77 | 171.87 | 140.40 | 127.02 | 70.38 | 92.13 | 84.54 | 109.23 | 99.93 | 92.60 | 88.43 | 117.38 | 102.36 | 121.29 | 105.77 | 111.47 | 26.66 | 96.45 | 116.73 | 117.15 | 120.36 | 91.51 | 165.04 | 117.87 | 120.60 | 94.97 | 87.36 | 60.45 | 62.24 | NA | NA | NA | NA | NA | NA | 32.42 | 31.45 | NA | NA | 10.85 | 5.94 | NA | NA | |
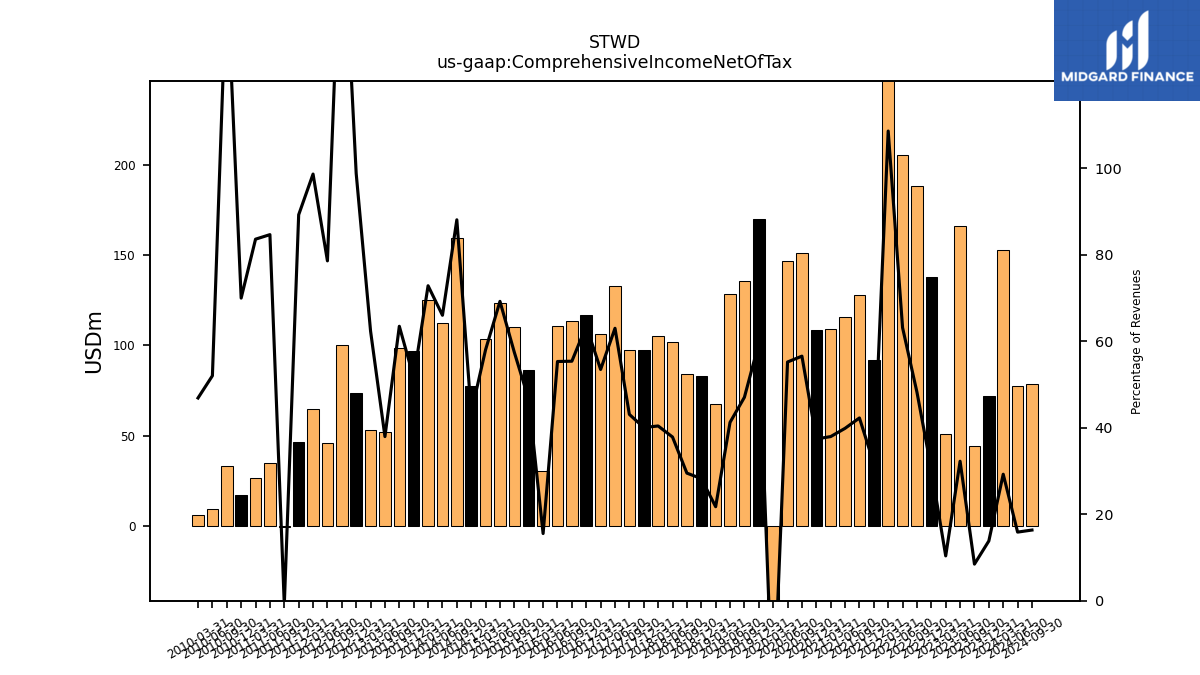
| Comprehensive Income Net Of Tax | 153.04 | 72.20 | 44.19 | 166.35 | 50.87 | 138.21 | 188.37 | 205.59 | 319.31 | 91.92 | 127.78 | 115.97 | 109.04 | 108.68 | 151.25 | 146.64 | -81.82 | 170.42 | 135.65 | 128.34 | 67.52 | 82.87 | 84.32 | 102.05 | 105.32 | 97.26 | 97.72 | 133.29 | 106.29 | 117.18 | 113.39 | 110.64 | 30.39 | 86.67 | 110.34 | 123.69 | 103.83 | 77.72 | 159.76 | 112.72 | 125.27 | 96.95 | 98.72 | 52.02 | 53.11 | 73.83 | 100.11 | 45.91 | 65.02 | 46.49 | -0.47 | 34.82 | 26.28 | 17.17 | 33.23 | 9.35 | 5.81 | NA | NA |
| 2024-03-31 | 2023-12-31 | 2023-09-30 | 2023-06-30 | 2023-03-31 | 2022-12-31 | 2022-09-30 | 2022-06-30 | 2022-03-31 | 2021-12-31 | 2021-09-30 | 2021-06-30 | 2021-03-31 | 2020-12-31 | 2020-09-30 | 2020-06-30 | 2020-03-31 | 2019-12-31 | 2019-09-30 | 2019-06-30 | 2019-03-31 | 2018-12-31 | 2018-09-30 | 2018-06-30 | 2018-03-31 | 2017-12-31 | 2017-09-30 | 2017-06-30 | 2017-03-31 | 2016-12-31 | 2016-09-30 | 2016-06-30 | 2016-03-31 | 2015-12-31 | 2015-09-30 | 2015-06-30 | 2015-03-31 | 2014-12-31 | 2014-09-30 | 2014-06-30 | 2014-03-31 | 2013-12-31 | 2013-09-30 | 2013-06-30 | 2013-03-31 | 2012-12-31 | 2012-09-30 | 2012-06-30 | 2012-03-31 | 2011-12-31 | 2011-09-30 | 2011-06-30 | 2011-03-31 | 2010-12-31 | 2010-09-30 | 2010-06-30 | 2010-03-31 | 2009-12-31 | 2009-09-30 | ||
|---|---|---|---|---|---|---|---|---|---|---|---|---|---|---|---|---|---|---|---|---|---|---|---|---|---|---|---|---|---|---|---|---|---|---|---|---|---|---|---|---|---|---|---|---|---|---|---|---|---|---|---|---|---|---|---|---|---|---|---|---|
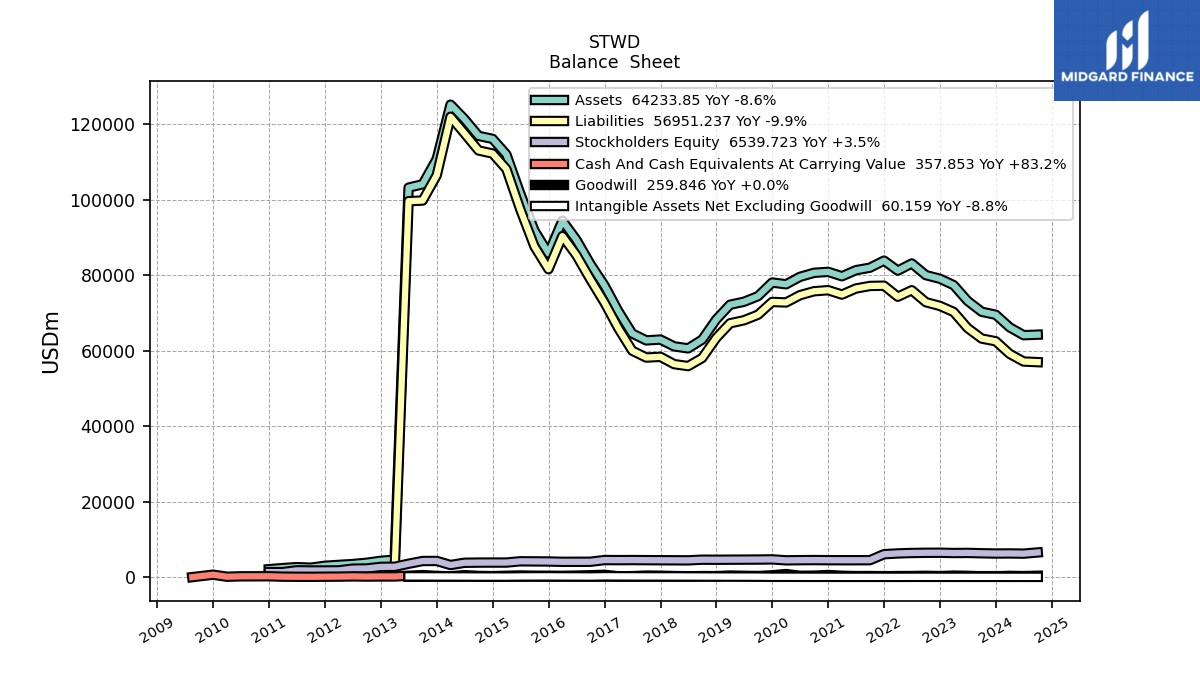
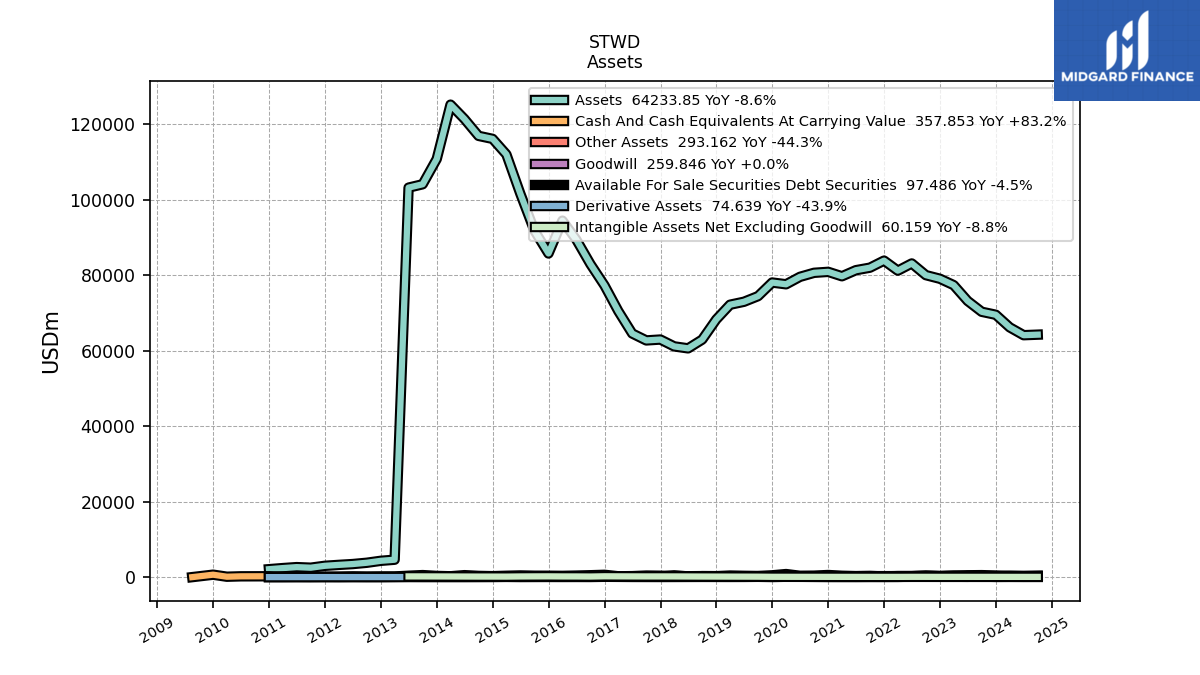
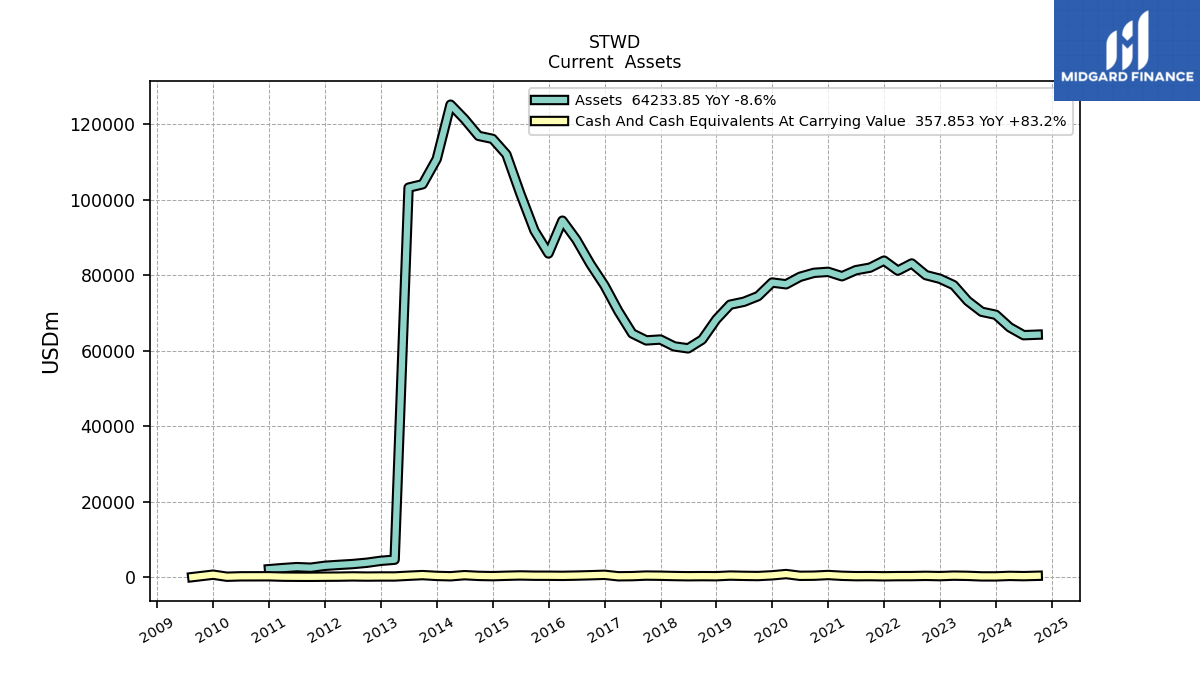
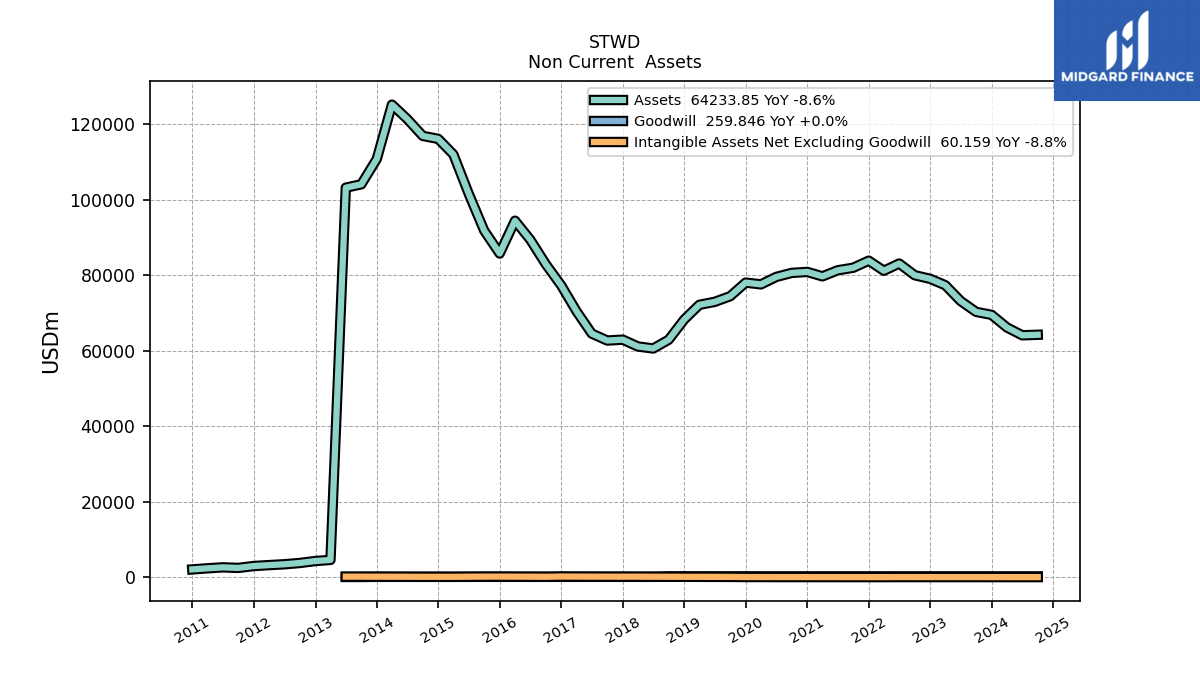
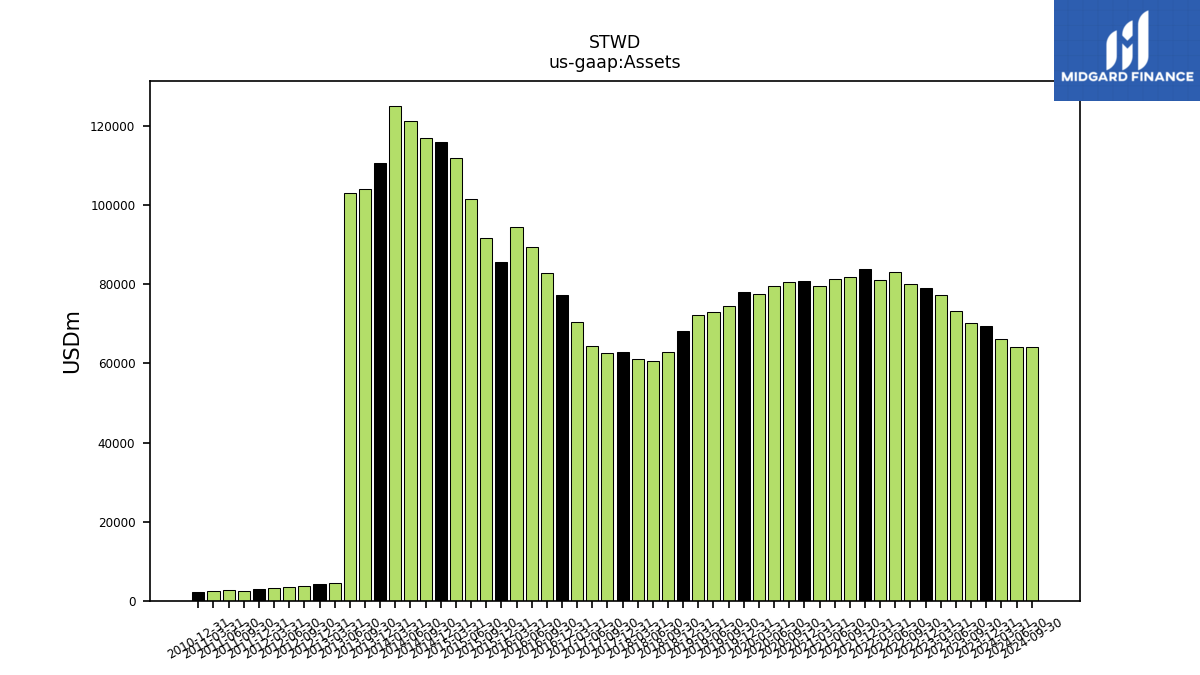
| Assets | 66169.67 | 69504.20 | 70293.69 | 73170.37 | 77354.38 | 79043.13 | 80002.86 | 83098.89 | 81187.90 | 83850.40 | 81980.86 | 81309.30 | 79702.32 | 80873.51 | 80617.64 | 79556.28 | 77577.19 | 78042.34 | 74434.10 | 72947.36 | 72165.59 | 68262.45 | 62921.48 | 60600.76 | 61126.86 | 62941.29 | 62706.27 | 64542.94 | 70478.74 | 77256.27 | 82921.16 | 89386.36 | 94436.31 | 85738.14 | 91819.41 | 101585.24 | 111980.81 | 116099.30 | 116893.94 | 121363.50 | 125172.36 | 110770.57 | 104074.57 | 103185.40 | 4610.97 | 4324.37 | 3805.35 | 3461.53 | 3241.51 | 2997.45 | 2497.27 | 2648.96 | 2392.40 | 2101.41 | NA | NA | NA | NA | NA | |
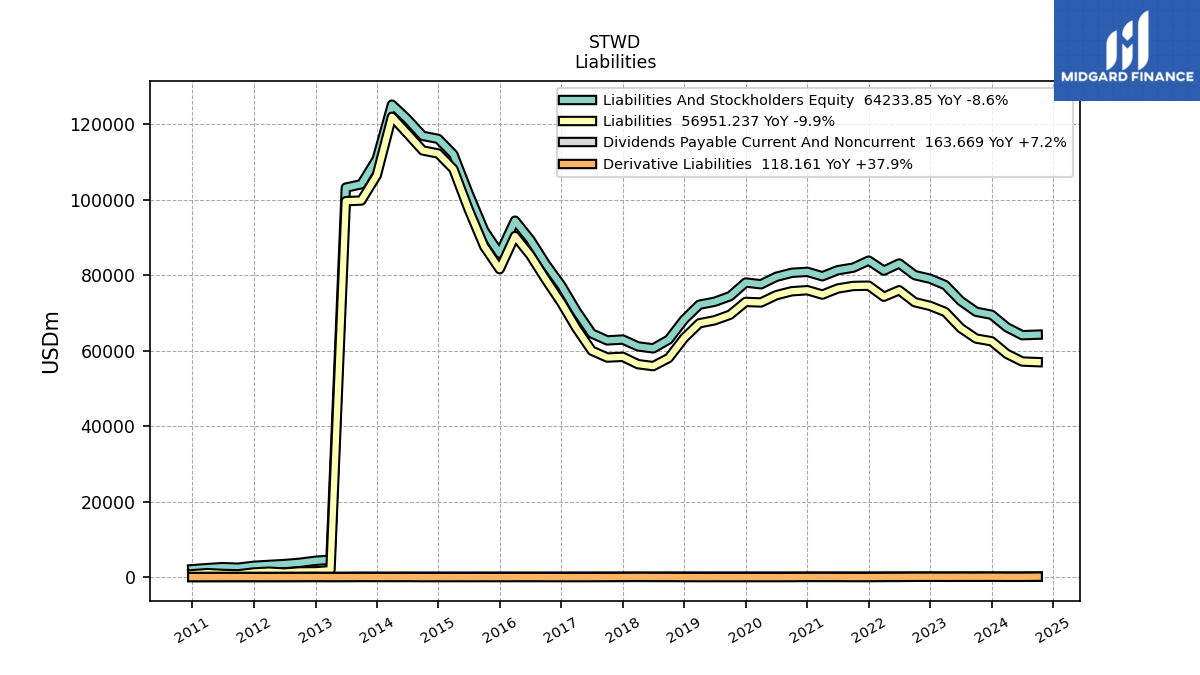
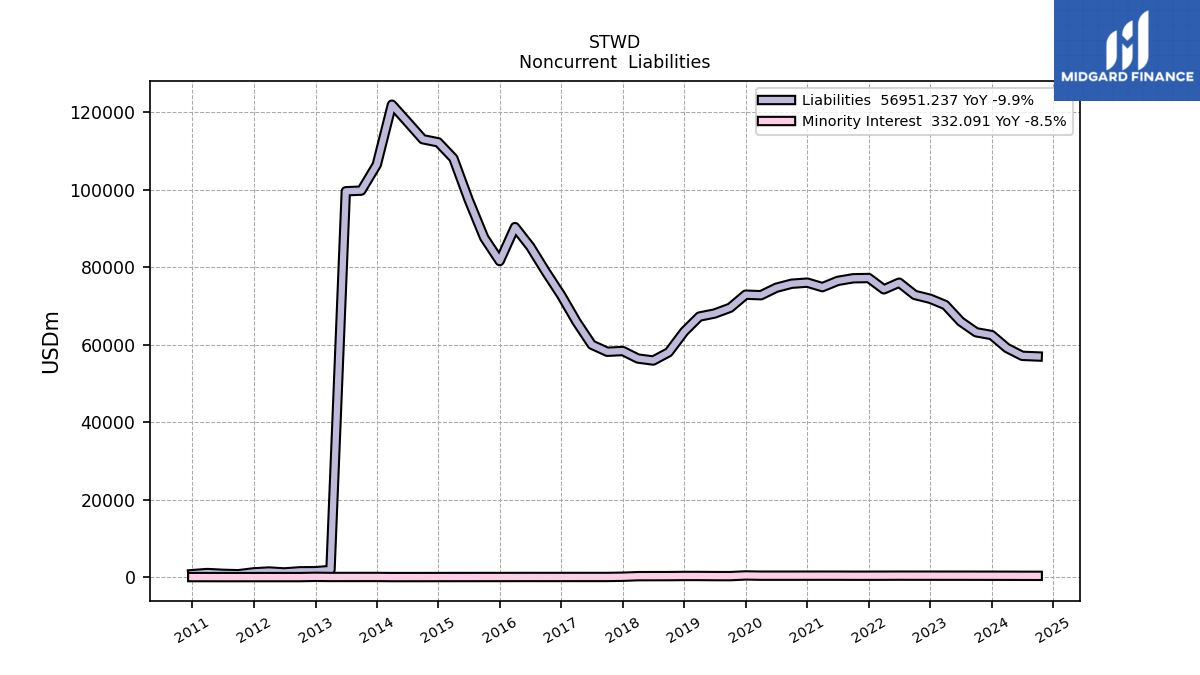
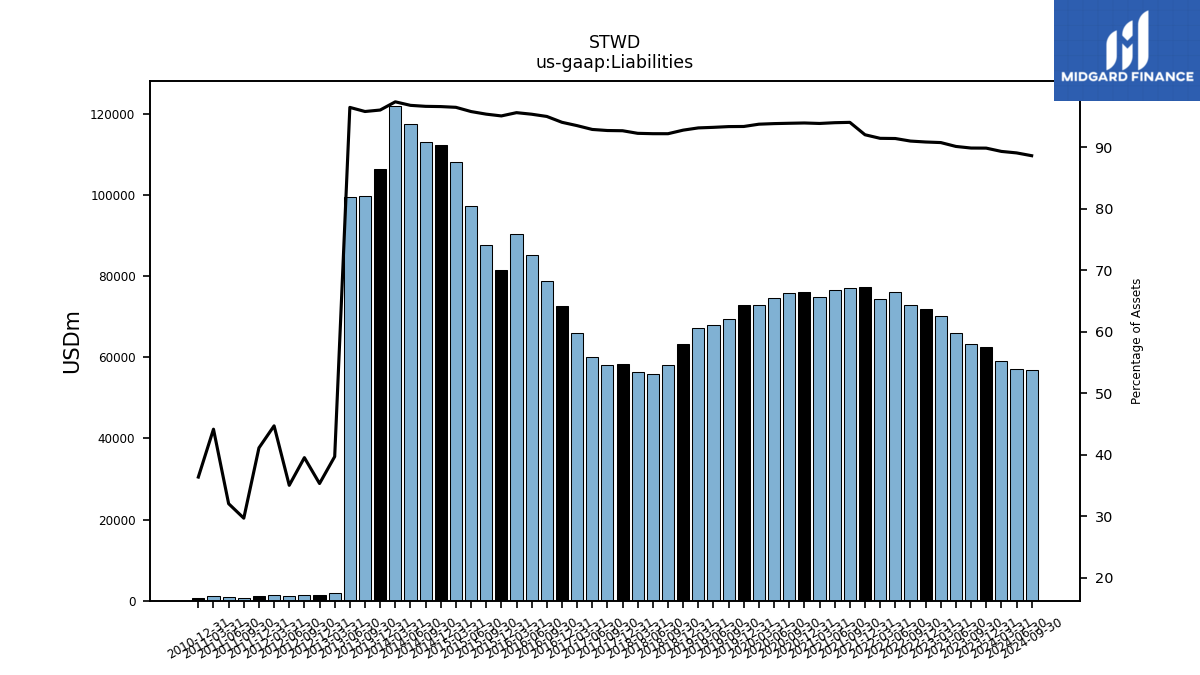
| Liabilities | 59129.49 | 62481.21 | 63200.23 | 65977.39 | 70237.49 | 71844.42 | 72837.30 | 76001.75 | 74278.24 | 77201.59 | 77133.75 | 76457.60 | 74847.54 | 76010.93 | 75731.95 | 74691.48 | 72759.84 | 72905.32 | 69521.09 | 68044.11 | 67248.62 | 63362.26 | 58039.20 | 55901.07 | 56422.17 | 58362.09 | 58166.53 | 59982.50 | 65935.39 | 72696.19 | 78815.78 | 85286.27 | 90345.44 | 81567.20 | 87618.23 | 97366.11 | 108100.70 | 112216.38 | 113029.97 | 117548.67 | 121956.71 | 106443.44 | 99761.15 | 99597.06 | 1830.57 | 1527.17 | 1504.11 | 1212.47 | 1449.08 | 1232.30 | 741.04 | 848.52 | 1056.37 | 764.18 | NA | NA | NA | NA | NA | |
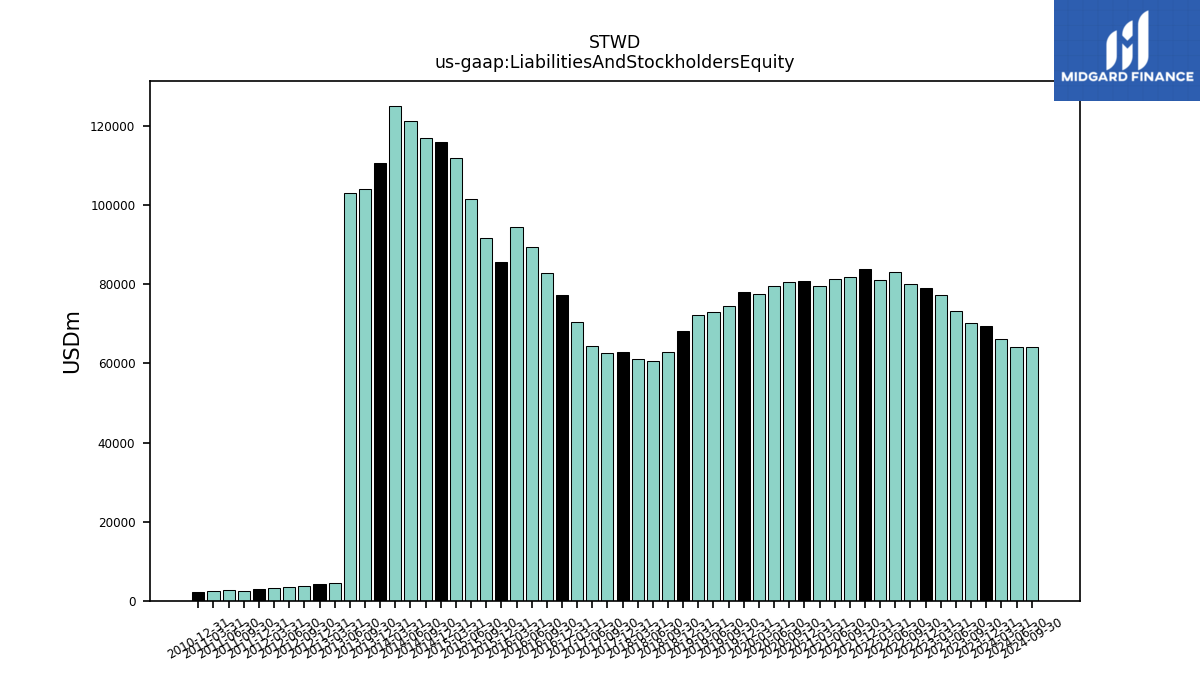
| Liabilities And Stockholders Equity | 66169.67 | 69504.20 | 70293.69 | 73170.37 | 77354.38 | 79043.13 | 80002.86 | 83098.89 | 81187.90 | 83850.40 | 81980.86 | 81309.30 | 79702.32 | 80873.51 | 80617.64 | 79556.28 | 77577.19 | 78042.34 | 74434.10 | 72947.36 | 72165.59 | 68262.45 | 62921.48 | 60600.76 | 61126.86 | 62941.29 | 62706.27 | 64542.94 | 70478.74 | 77256.27 | 82921.16 | 89386.36 | 94436.31 | 85738.14 | 91819.41 | 101585.24 | 111980.81 | 116099.30 | 116893.94 | 121363.50 | 125172.36 | 110770.57 | 104074.57 | 103185.40 | 4610.97 | 4324.37 | 3805.35 | 3461.53 | 3241.51 | 2997.45 | 2497.27 | 2648.96 | 2392.40 | 2101.41 | NA | NA | NA | NA | NA | |
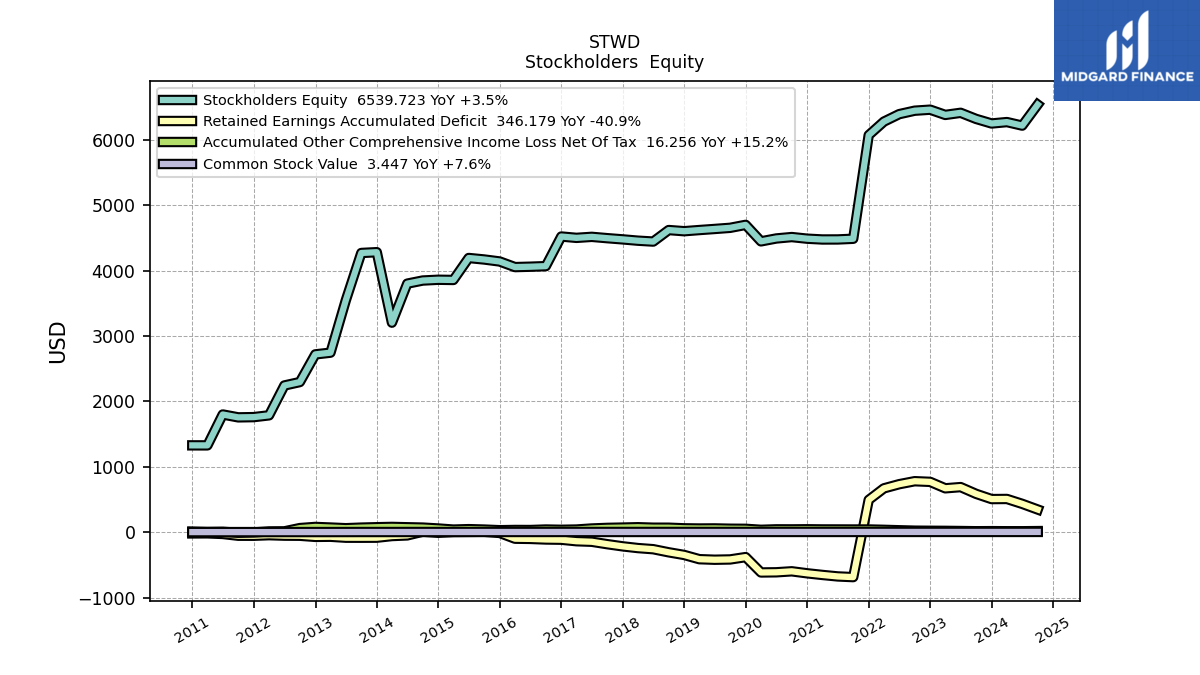
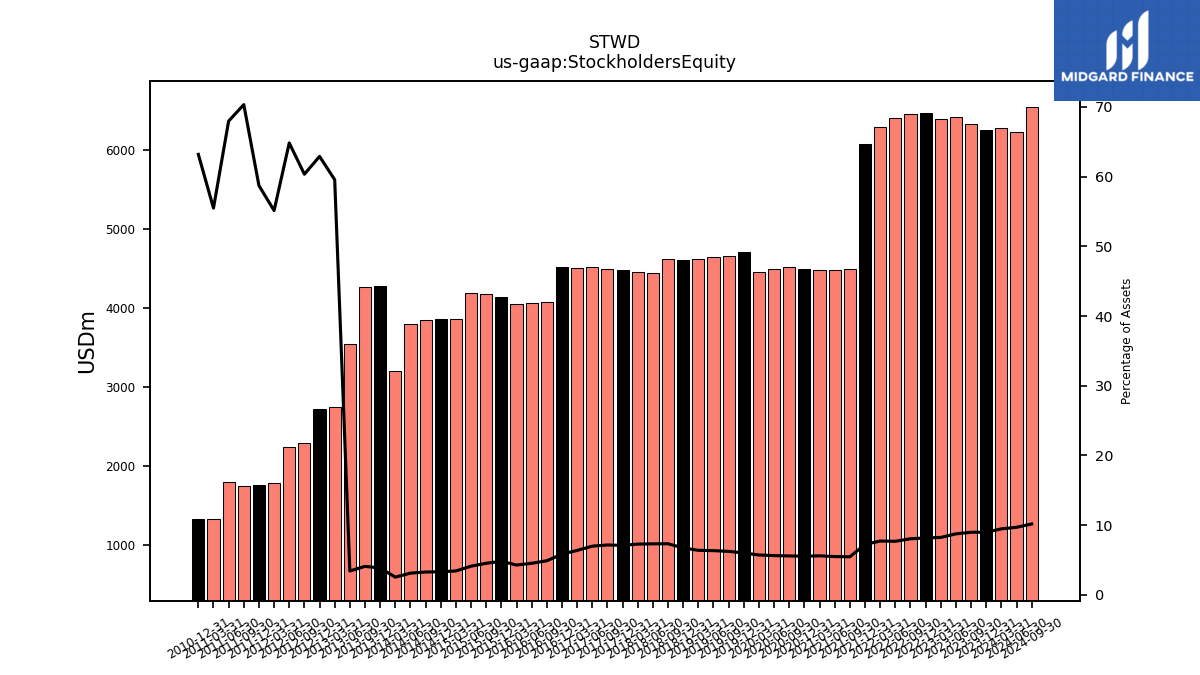
| Stockholders Equity | 6272.75 | 6251.09 | 6321.02 | 6414.49 | 6382.23 | 6462.44 | 6446.80 | 6394.00 | 6279.69 | 6072.54 | 4487.71 | 4477.35 | 4476.86 | 4488.90 | 4513.88 | 4492.24 | 4448.06 | 4700.43 | 4655.20 | 4637.71 | 4621.08 | 4603.43 | 4621.24 | 4444.82 | 4458.53 | 4478.41 | 4496.79 | 4517.16 | 4501.61 | 4522.27 | 4068.85 | 4060.46 | 4054.48 | 4140.32 | 4170.77 | 4193.83 | 3857.57 | 3860.86 | 3849.01 | 3801.44 | 3204.14 | 4282.53 | 4270.32 | 3546.49 | 2745.45 | 2719.35 | 2295.75 | 2243.51 | 1786.83 | 1759.49 | 1755.77 | 1799.99 | 1327.23 | 1327.56 | NA | NA | NA | NA | NA |
| 2024-03-31 | 2023-12-31 | 2023-09-30 | 2023-06-30 | 2023-03-31 | 2022-12-31 | 2022-09-30 | 2022-06-30 | 2022-03-31 | 2021-12-31 | 2021-09-30 | 2021-06-30 | 2021-03-31 | 2020-12-31 | 2020-09-30 | 2020-06-30 | 2020-03-31 | 2019-12-31 | 2019-09-30 | 2019-06-30 | 2019-03-31 | 2018-12-31 | 2018-09-30 | 2018-06-30 | 2018-03-31 | 2017-12-31 | 2017-09-30 | 2017-06-30 | 2017-03-31 | 2016-12-31 | 2016-09-30 | 2016-06-30 | 2016-03-31 | 2015-12-31 | 2015-09-30 | 2015-06-30 | 2015-03-31 | 2014-12-31 | 2014-09-30 | 2014-06-30 | 2014-03-31 | 2013-12-31 | 2013-09-30 | 2013-06-30 | 2013-03-31 | 2012-12-31 | 2012-09-30 | 2012-06-30 | 2012-03-31 | 2011-12-31 | 2011-09-30 | 2011-06-30 | 2011-03-31 | 2010-12-31 | 2010-09-30 | 2010-06-30 | 2010-03-31 | 2009-12-31 | 2009-09-30 | ||
|---|---|---|---|---|---|---|---|---|---|---|---|---|---|---|---|---|---|---|---|---|---|---|---|---|---|---|---|---|---|---|---|---|---|---|---|---|---|---|---|---|---|---|---|---|---|---|---|---|---|---|---|---|---|---|---|---|---|---|---|---|
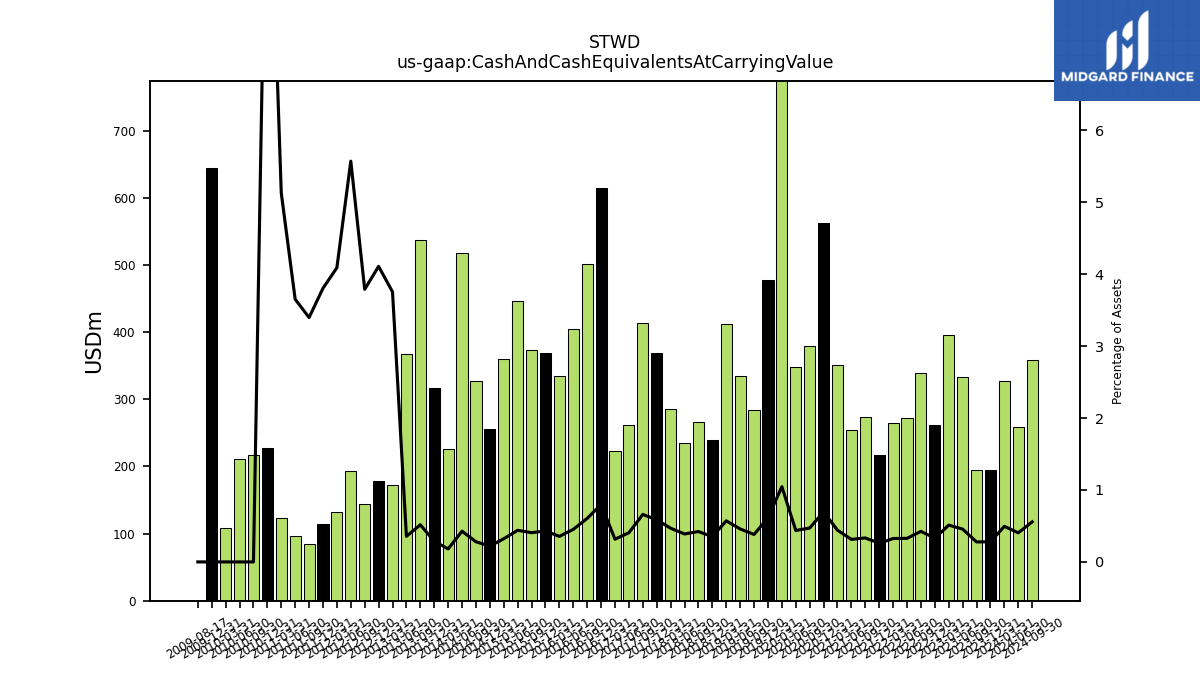
| Cash And Cash Equivalents At Carrying Value | 327.36 | 194.66 | 195.32 | 333.93 | 395.80 | 261.06 | 339.71 | 272.17 | 264.21 | 217.36 | 273.32 | 254.57 | 351.19 | 563.22 | 379.87 | 347.73 | 811.66 | 478.39 | 284.12 | 334.29 | 412.27 | 239.82 | 265.76 | 235.42 | 286.15 | 369.45 | 413.85 | 261.89 | 222.52 | 615.52 | 501.56 | 404.82 | 335.22 | 368.81 | 372.77 | 446.48 | 360.72 | 255.19 | 327.32 | 518.63 | 226.47 | 317.63 | 536.83 | 366.79 | 173.07 | 177.67 | 144.20 | 192.84 | 132.56 | 114.03 | 84.83 | 96.73 | 122.69 | 226.85 | 216.97 | 210.47 | 107.99 | 645.13 | NA | |
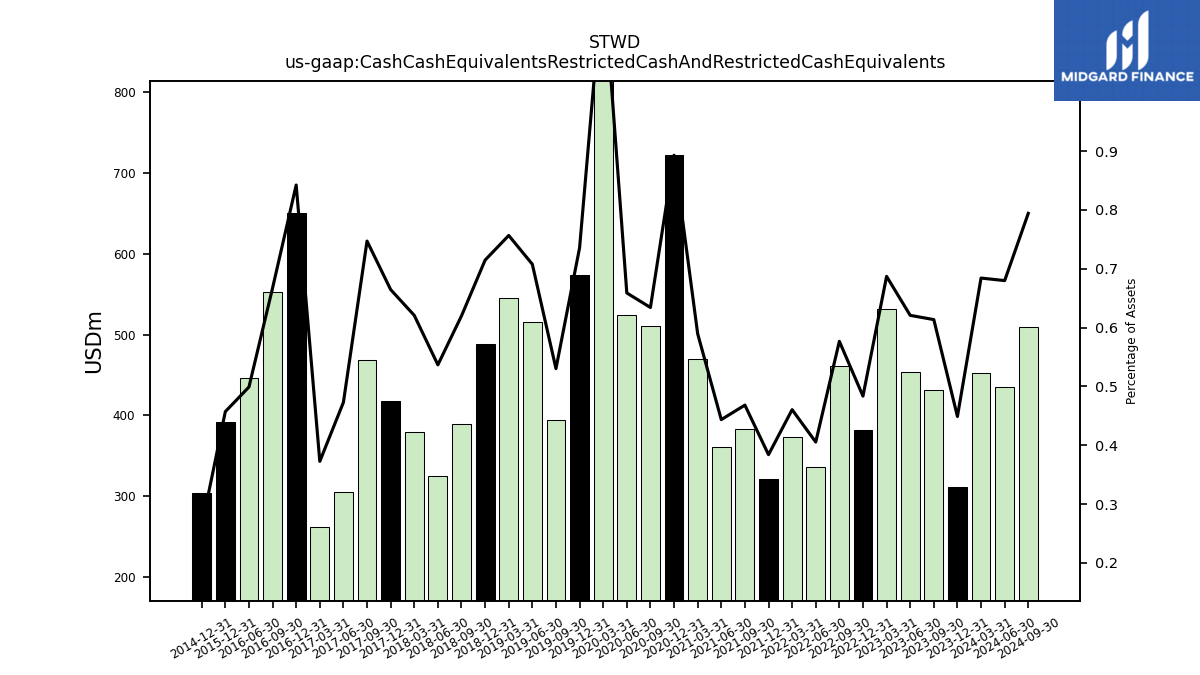
| Cash Cash Equivalents Restricted Cash And Restricted Cash Equivalents | 452.70 | 311.97 | 431.27 | 454.21 | 531.44 | 382.13 | 461.28 | 336.81 | 373.77 | 321.91 | 383.79 | 360.58 | 469.91 | 722.16 | 511.21 | 524.13 | 931.39 | 574.03 | 394.66 | 516.20 | 545.98 | 487.87 | 390.02 | 325.21 | 379.42 | 418.27 | 468.44 | 305.19 | 262.53 | 650.75 | 553.29 | 445.95 | NA | 391.88 | NA | NA | NA | 303.89 | NA | NA | NA | NA | NA | NA | NA | NA | NA | NA | NA | NA | NA | NA | NA | NA | NA | NA | NA | NA | NA | |
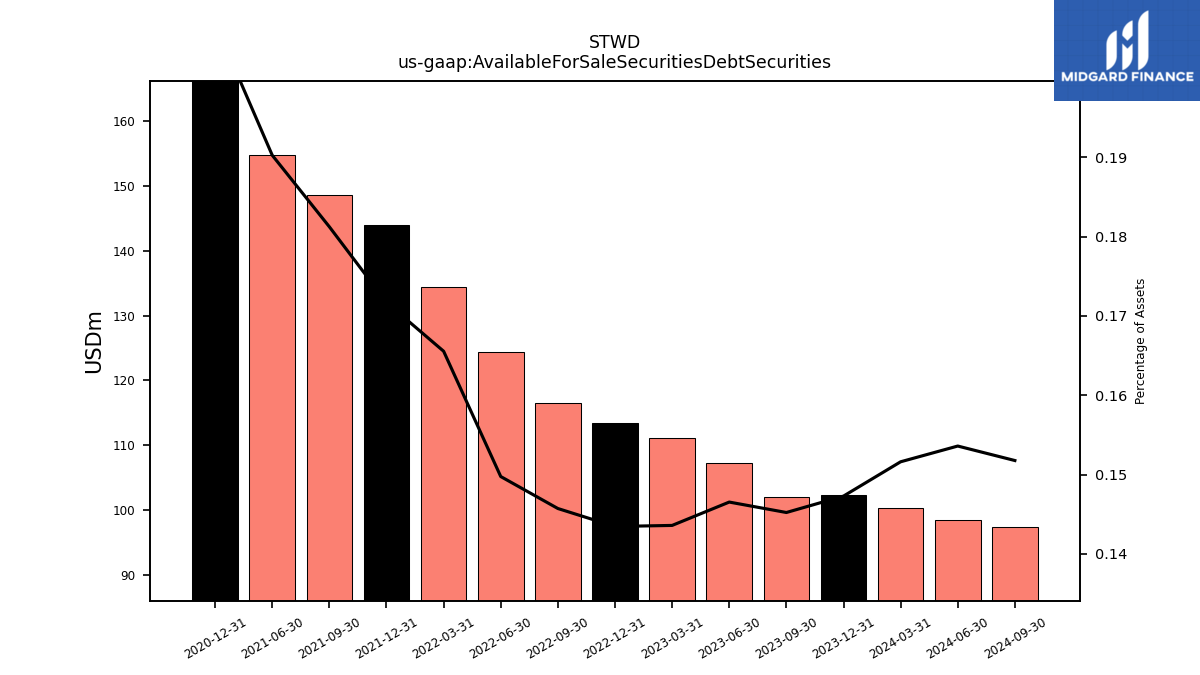
| Available For Sale Securities Debt Securities | 100.32 | 102.37 | 102.08 | 107.22 | 111.07 | 113.39 | 116.58 | 124.44 | 134.41 | 143.98 | 148.58 | 154.70 | NA | 167.35 | NA | NA | NA | NA | NA | NA | NA | NA | NA | NA | NA | NA | NA | NA | NA | NA | NA | NA | NA | NA | NA | NA | NA | NA | NA | NA | NA | NA | NA | NA | NA | NA | NA | NA | NA | NA | NA | NA | NA | NA | NA | NA | NA | NA | NA |
| 2024-03-31 | 2023-12-31 | 2023-09-30 | 2023-06-30 | 2023-03-31 | 2022-12-31 | 2022-09-30 | 2022-06-30 | 2022-03-31 | 2021-12-31 | 2021-09-30 | 2021-06-30 | 2021-03-31 | 2020-12-31 | 2020-09-30 | 2020-06-30 | 2020-03-31 | 2019-12-31 | 2019-09-30 | 2019-06-30 | 2019-03-31 | 2018-12-31 | 2018-09-30 | 2018-06-30 | 2018-03-31 | 2017-12-31 | 2017-09-30 | 2017-06-30 | 2017-03-31 | 2016-12-31 | 2016-09-30 | 2016-06-30 | 2016-03-31 | 2015-12-31 | 2015-09-30 | 2015-06-30 | 2015-03-31 | 2014-12-31 | 2014-09-30 | 2014-06-30 | 2014-03-31 | 2013-12-31 | 2013-09-30 | 2013-06-30 | 2013-03-31 | 2012-12-31 | 2012-09-30 | 2012-06-30 | 2012-03-31 | 2011-12-31 | 2011-09-30 | 2011-06-30 | 2011-03-31 | 2010-12-31 | 2010-09-30 | 2010-06-30 | 2010-03-31 | 2009-12-31 | 2009-09-30 | ||
|---|---|---|---|---|---|---|---|---|---|---|---|---|---|---|---|---|---|---|---|---|---|---|---|---|---|---|---|---|---|---|---|---|---|---|---|---|---|---|---|---|---|---|---|---|---|---|---|---|---|---|---|---|---|---|---|---|---|---|---|---|
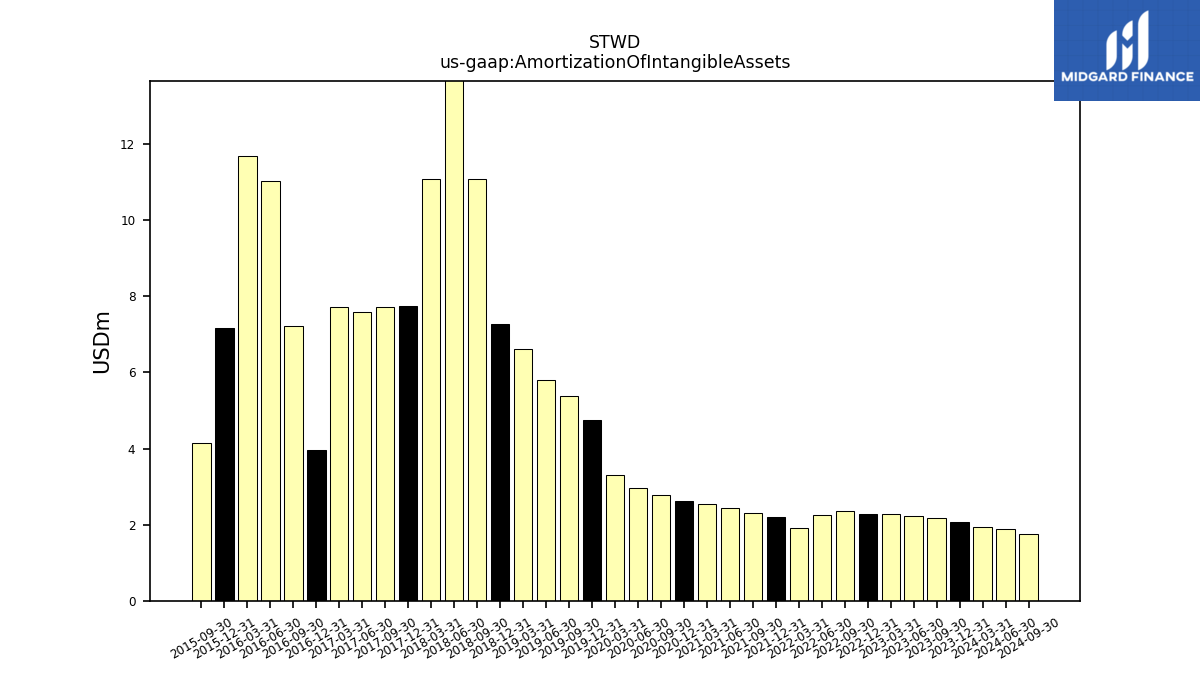
| Amortization Of Intangible Assets | 1.93 | 2.06 | 2.17 | 2.22 | 2.28 | 2.27 | 2.36 | 2.25 | 1.91 | 2.20 | 2.31 | 2.45 | 2.55 | 2.63 | 2.79 | 2.97 | 3.30 | 4.75 | 5.39 | 5.80 | 6.61 | 7.28 | 11.10 | 14.42 | 11.08 | 7.74 | 7.73 | 7.60 | 7.72 | 3.97 | 7.23 | 11.03 | 11.68 | 7.18 | 4.15 | NA | NA | NA | NA | NA | NA | NA | NA | NA | NA | NA | NA | NA | NA | NA | NA | NA | NA | NA | NA | NA | NA | NA | NA | |
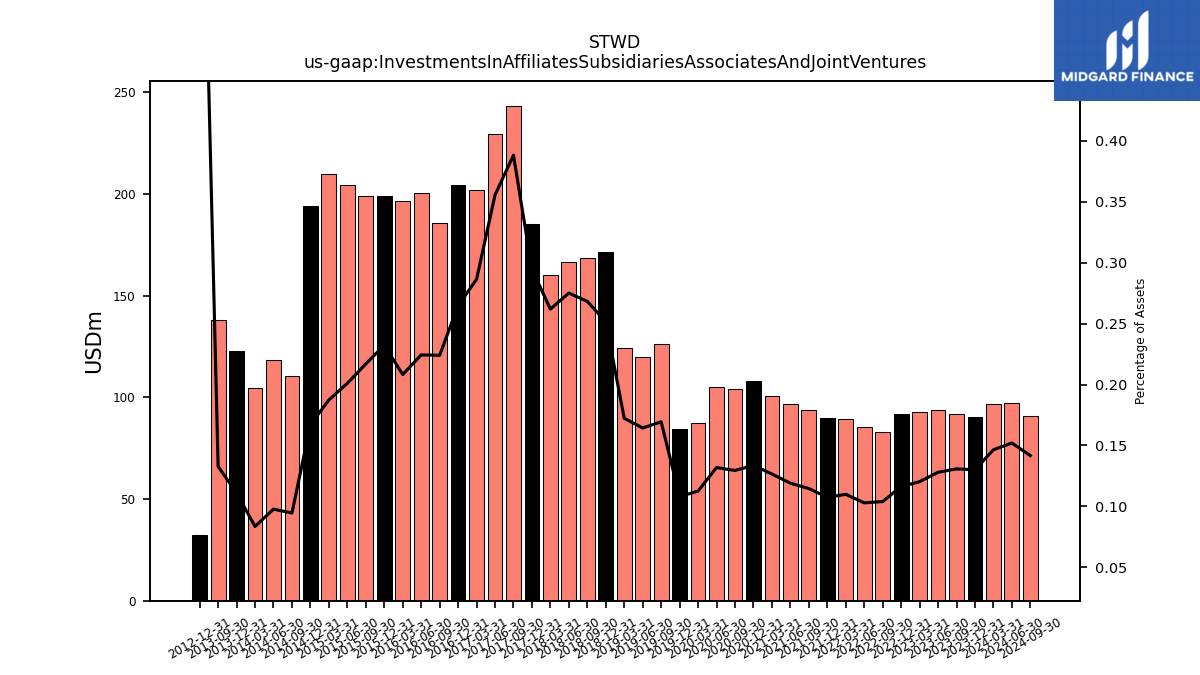
| Investments In Affiliates Subsidiaries Associates And Joint Ventures | 96.93 | 90.38 | 91.92 | 93.65 | 93.07 | 91.89 | 83.16 | 85.51 | 89.25 | 90.10 | 94.00 | 96.79 | 100.91 | 108.05 | 104.38 | 104.91 | 87.33 | 84.33 | 126.11 | 119.88 | 124.36 | 171.76 | 168.79 | 166.72 | 160.11 | 185.50 | 243.45 | 229.54 | 201.82 | 204.60 | 185.75 | 200.54 | 196.64 | 199.20 | 199.17 | 204.25 | 209.83 | 193.98 | 110.57 | 118.62 | 104.52 | 122.95 | 138.17 | NA | NA | 32.32 | NA | NA | NA | NA | NA | NA | NA | NA | NA | NA | NA | NA | NA | |
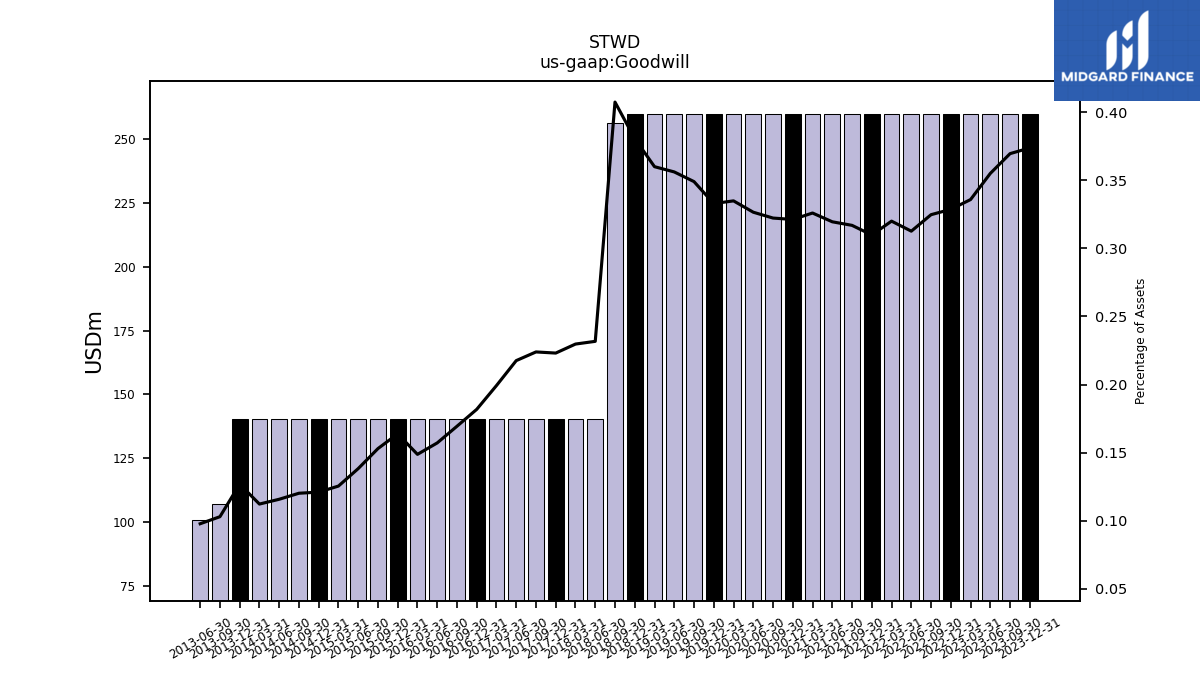
| Goodwill | 259.85 | 259.85 | 259.85 | 259.85 | 259.85 | 259.85 | 259.85 | 259.85 | 259.85 | 259.85 | 259.85 | 259.85 | 259.85 | 259.85 | 259.85 | 259.85 | 259.85 | 259.85 | 259.85 | 259.85 | 259.85 | 259.85 | 256.43 | 140.44 | 140.44 | 140.44 | 140.44 | 140.44 | 140.44 | 140.44 | 140.44 | 140.44 | 140.44 | 140.44 | 140.44 | 140.44 | 140.44 | 140.44 | 140.44 | 140.44 | 140.44 | 140.44 | 107.10 | 100.85 | NA | NA | NA | NA | NA | NA | NA | NA | NA | NA | NA | NA | NA | NA | NA | |
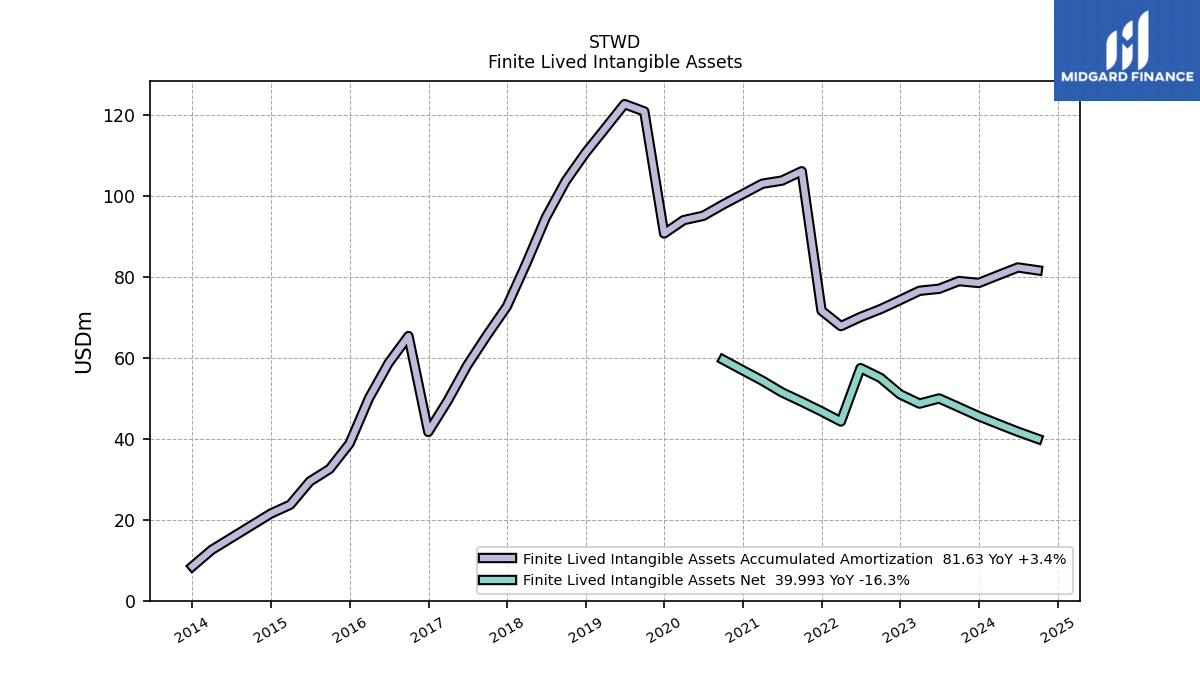
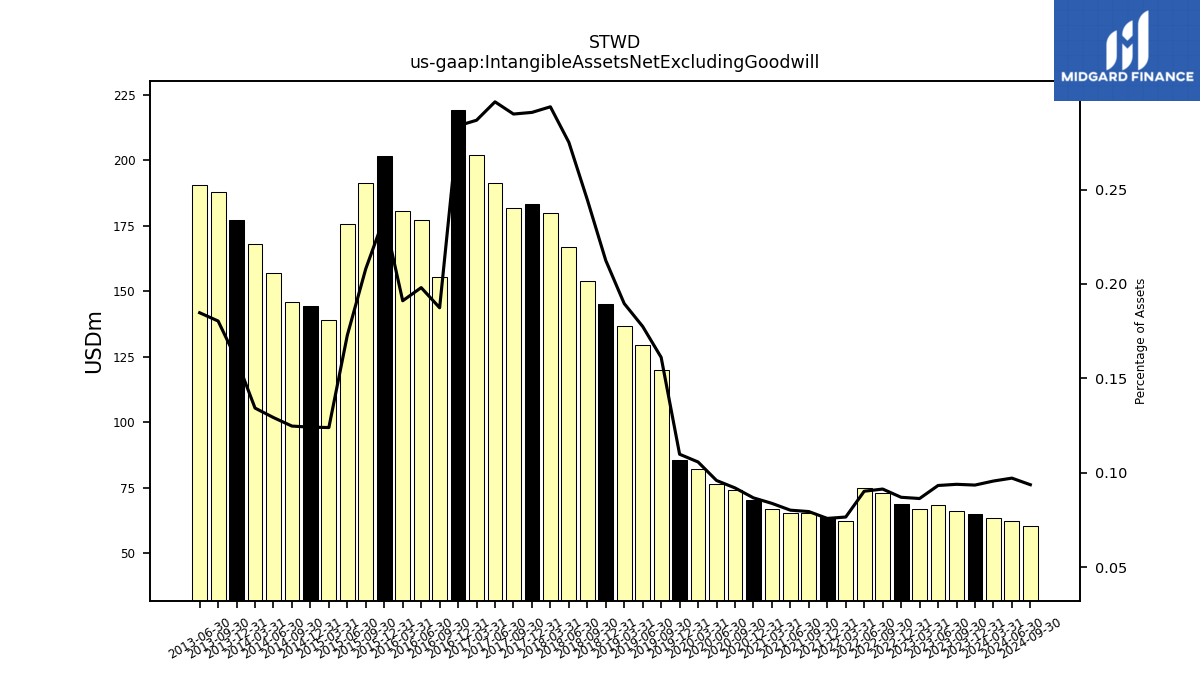
| Intangible Assets Net Excluding Goodwill | 63.27 | 64.97 | 65.99 | 68.23 | 66.80 | 68.77 | 73.10 | 74.96 | 62.15 | 63.56 | 65.12 | 65.19 | 66.77 | 70.12 | 74.14 | 76.29 | 82.00 | 85.70 | 119.95 | 129.48 | 136.84 | 145.03 | 153.95 | 166.69 | 179.63 | 183.09 | 181.87 | 191.37 | 202.09 | 219.25 | 155.39 | 177.05 | 180.48 | 201.57 | 191.08 | 175.61 | 138.80 | 144.15 | 145.79 | 156.85 | 168.06 | 177.17 | 187.73 | 190.65 | NA | NA | NA | NA | NA | NA | NA | NA | NA | NA | NA | NA | NA | NA | NA | |
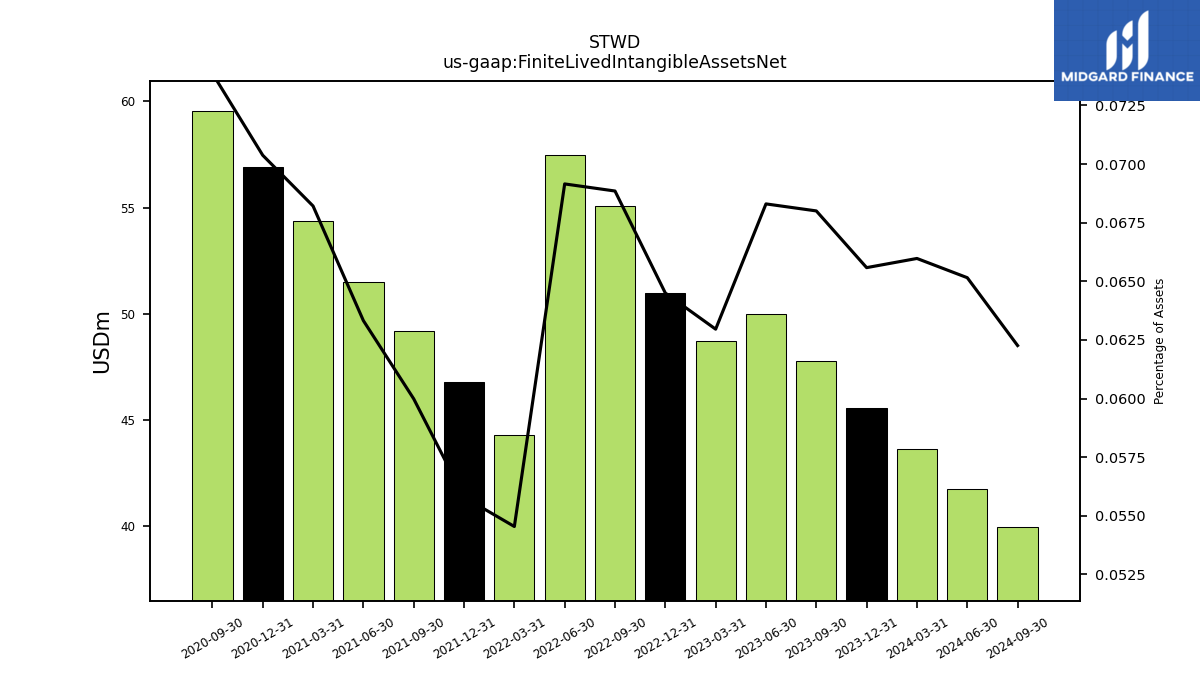
| Finite Lived Intangible Assets Net | 43.66 | 45.58 | 47.80 | 49.98 | 48.70 | 50.98 | 55.08 | 57.47 | 44.28 | 46.78 | 49.18 | 51.49 | 54.37 | 56.91 | 59.55 | NA | NA | NA | NA | NA | NA | NA | NA | NA | NA | NA | NA | NA | NA | NA | NA | NA | NA | NA | NA | NA | NA | NA | NA | NA | NA | NA | NA | NA | NA | NA | NA | NA | NA | NA | NA | NA | NA | NA | NA | NA | NA | NA | NA | |
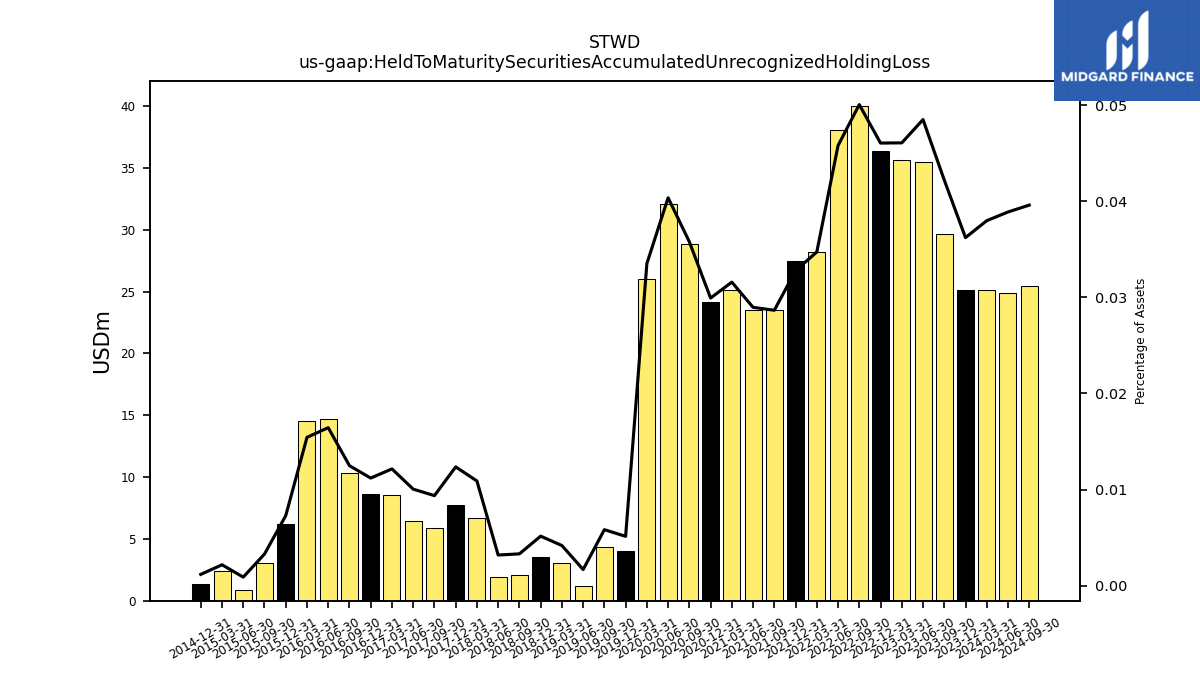
| Held To Maturity Securities Accumulated Unrecognized Holding Loss | 25.13 | 25.17 | 29.66 | 35.48 | 35.64 | 36.40 | 40.04 | 38.05 | 28.19 | 27.48 | 23.49 | 23.54 | 25.17 | 24.20 | 28.84 | 32.10 | 25.99 | 4.00 | 4.34 | 1.22 | 3.02 | 3.52 | 2.08 | 1.93 | 6.66 | 7.78 | 5.88 | 6.48 | 8.56 | 8.65 | 10.35 | 14.69 | 14.57 | 6.25 | 3.02 | 0.90 | 2.44 | 1.37 | NA | NA | NA | NA | NA | NA | NA | NA | NA | NA | NA | NA | NA | NA | NA | NA | NA | NA | NA | NA | NA | |
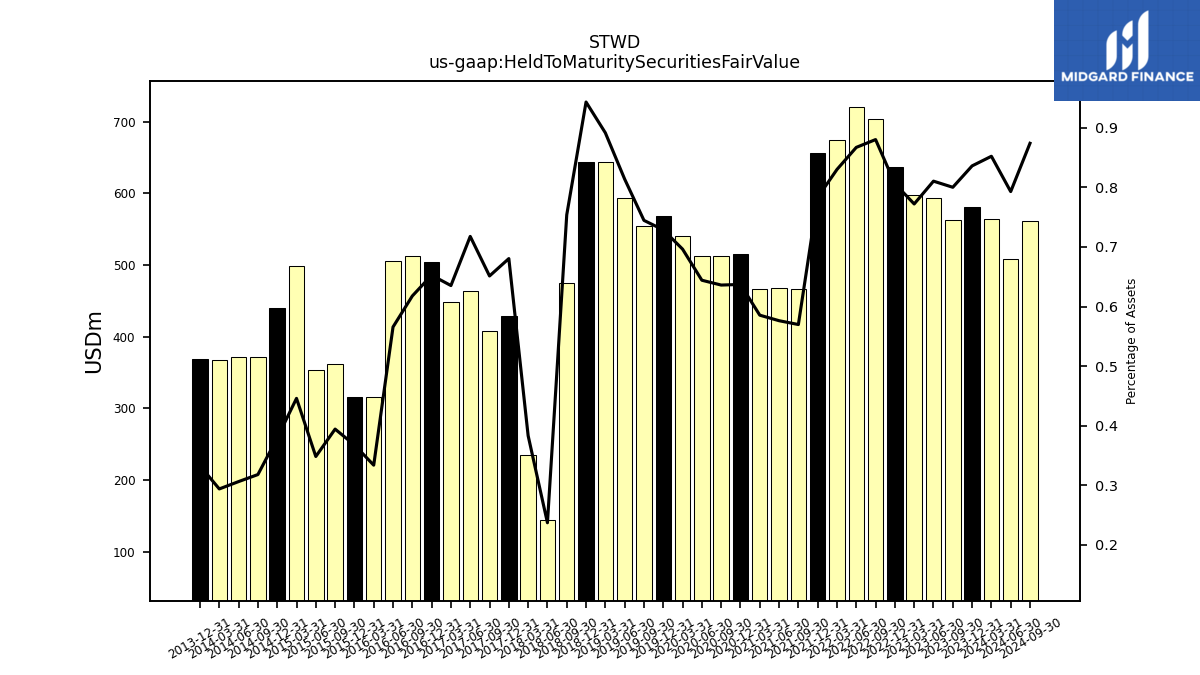
| Held To Maturity Securities Fair Value | 563.96 | 581.16 | 562.52 | 593.06 | 597.36 | 637.27 | 704.28 | 720.64 | 674.00 | 656.86 | 467.16 | 468.56 | 466.69 | 515.25 | 512.81 | 512.49 | 540.27 | 568.73 | 554.30 | 593.77 | 643.46 | 643.95 | 474.39 | 143.66 | 234.23 | 428.34 | 408.44 | 463.28 | 447.72 | 504.17 | 512.27 | 505.65 | 315.17 | 315.25 | 362.03 | 353.81 | 499.25 | 440.63 | 371.70 | 371.60 | 367.81 | 368.45 | NA | NA | NA | NA | NA | NA | NA | NA | NA | NA | NA | NA | NA | NA | NA | NA | NA | |
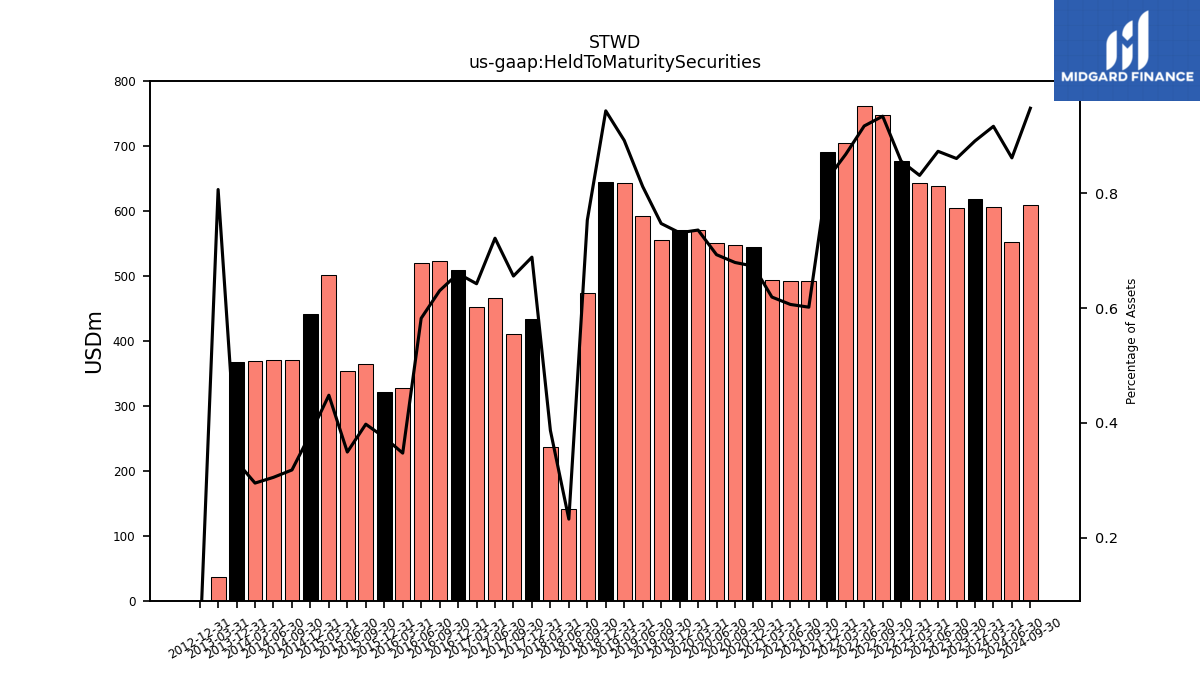
| Held To Maturity Securities | 606.59 | 619.40 | 604.94 | 638.88 | 642.98 | 676.65 | 747.48 | 762.27 | 704.69 | 691.75 | 493.12 | 492.95 | 493.46 | 544.28 | 547.72 | 551.31 | 570.89 | 570.64 | 556.25 | 592.16 | 643.79 | 644.15 | 473.90 | 140.68 | 236.32 | 433.47 | 411.20 | 465.80 | 452.73 | 509.98 | 522.62 | 520.34 | 327.83 | 321.24 | 365.00 | 354.53 | 501.69 | 442.00 | 371.47 | 370.10 | 369.15 | 368.32 | NA | NA | 37.19 | 0.00 | NA | NA | NA | NA | NA | NA | NA | NA | NA | NA | NA | NA | NA | |
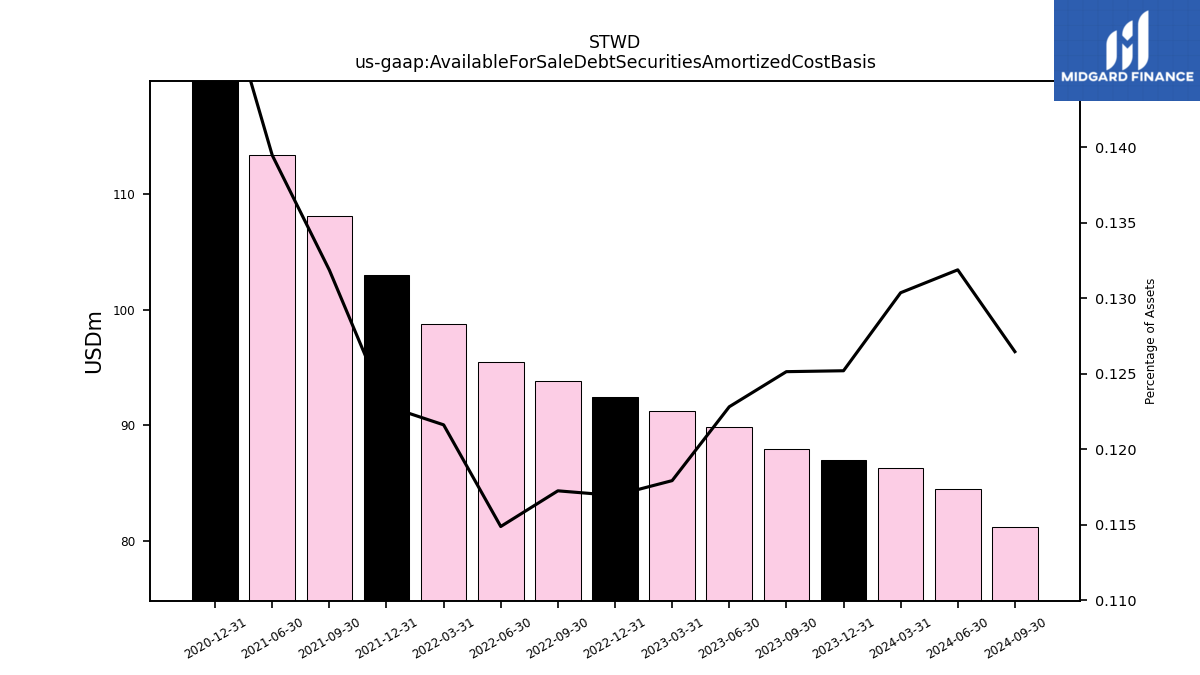
| Available For Sale Debt Securities Amortized Cost Basis | 86.26 | 87.02 | 87.96 | 89.86 | 91.22 | 92.43 | 93.80 | 95.47 | 98.74 | 103.03 | 108.10 | 113.39 | NA | 123.29 | NA | NA | NA | NA | NA | NA | NA | NA | NA | NA | NA | NA | NA | NA | NA | NA | NA | NA | NA | NA | NA | NA | NA | NA | NA | NA | NA | NA | NA | NA | NA | NA | NA | NA | NA | NA | NA | NA | NA | NA | NA | NA | NA | NA | NA | |
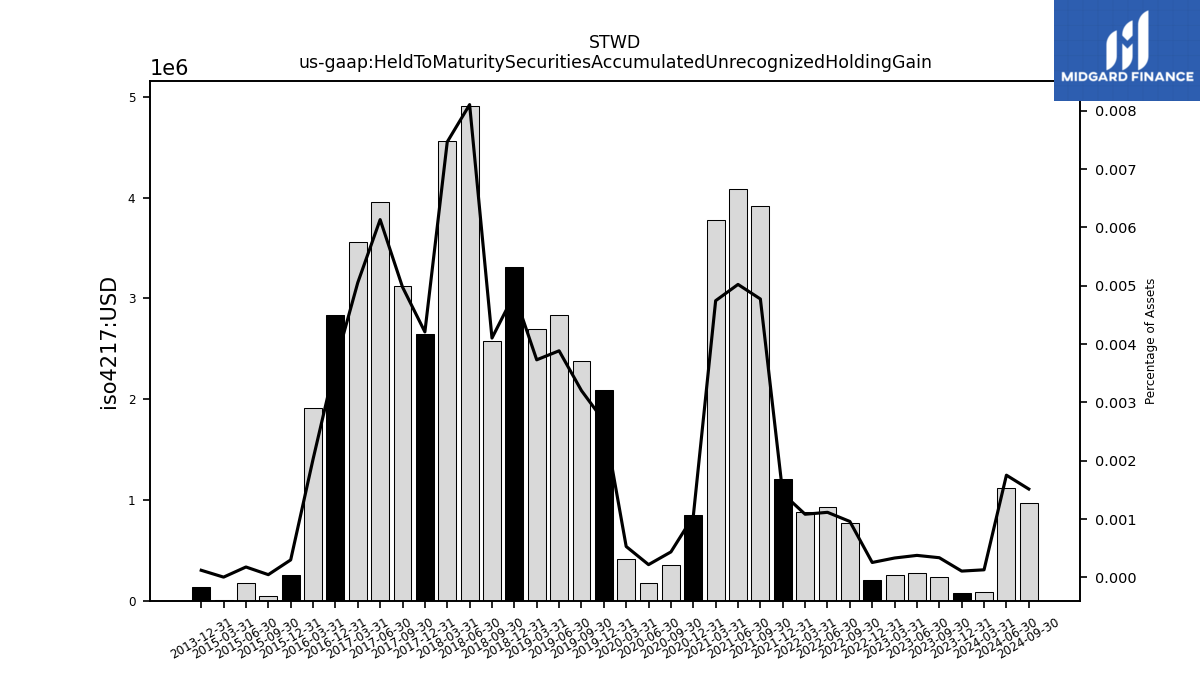
| Held To Maturity Securities Accumulated Unrecognized Holding Gain | 0.09 | 0.07 | 0.24 | 0.28 | 0.26 | 0.20 | 0.77 | 0.93 | 0.88 | 1.21 | 3.91 | 4.08 | 3.78 | 0.85 | 0.35 | 0.17 | 0.41 | 2.09 | 2.38 | 2.83 | 2.69 | 3.32 | 2.58 | 4.91 | 4.56 | 2.65 | 3.12 | 3.96 | 3.56 | 2.83 | NA | NA | 1.91 | 0.26 | 0.04 | 0.18 | 0.01 | NA | NA | NA | NA | 0.14 | NA | NA | NA | NA | NA | NA | NA | NA | NA | NA | NA | NA | NA | NA | NA | NA | NA | |
| Held To Maturity Securities Accumulated Unrecognized Holding Loss | 25.13 | 25.17 | 29.66 | 35.48 | 35.64 | 36.40 | 40.04 | 38.05 | 28.19 | 27.48 | 23.49 | 23.54 | 25.17 | 24.20 | 28.84 | 32.10 | 25.99 | 4.00 | 4.34 | 1.22 | 3.02 | 3.52 | 2.08 | 1.93 | 6.66 | 7.78 | 5.88 | 6.48 | 8.56 | 8.65 | 10.35 | 14.69 | 14.57 | 6.25 | 3.02 | 0.90 | 2.44 | 1.37 | NA | NA | NA | NA | NA | NA | NA | NA | NA | NA | NA | NA | NA | NA | NA | NA | NA | NA | NA | NA | NA |
| 2024-03-31 | 2023-12-31 | 2023-09-30 | 2023-06-30 | 2023-03-31 | 2022-12-31 | 2022-09-30 | 2022-06-30 | 2022-03-31 | 2021-12-31 | 2021-09-30 | 2021-06-30 | 2021-03-31 | 2020-12-31 | 2020-09-30 | 2020-06-30 | 2020-03-31 | 2019-12-31 | 2019-09-30 | 2019-06-30 | 2019-03-31 | 2018-12-31 | 2018-09-30 | 2018-06-30 | 2018-03-31 | 2017-12-31 | 2017-09-30 | 2017-06-30 | 2017-03-31 | 2016-12-31 | 2016-09-30 | 2016-06-30 | 2016-03-31 | 2015-12-31 | 2015-09-30 | 2015-06-30 | 2015-03-31 | 2014-12-31 | 2014-09-30 | 2014-06-30 | 2014-03-31 | 2013-12-31 | 2013-09-30 | 2013-06-30 | 2013-03-31 | 2012-12-31 | 2012-09-30 | 2012-06-30 | 2012-03-31 | 2011-12-31 | 2011-09-30 | 2011-06-30 | 2011-03-31 | 2010-12-31 | 2010-09-30 | 2010-06-30 | 2010-03-31 | 2009-12-31 | 2009-09-30 | ||
|---|---|---|---|---|---|---|---|---|---|---|---|---|---|---|---|---|---|---|---|---|---|---|---|---|---|---|---|---|---|---|---|---|---|---|---|---|---|---|---|---|---|---|---|---|---|---|---|---|---|---|---|---|---|---|---|---|---|---|---|---|
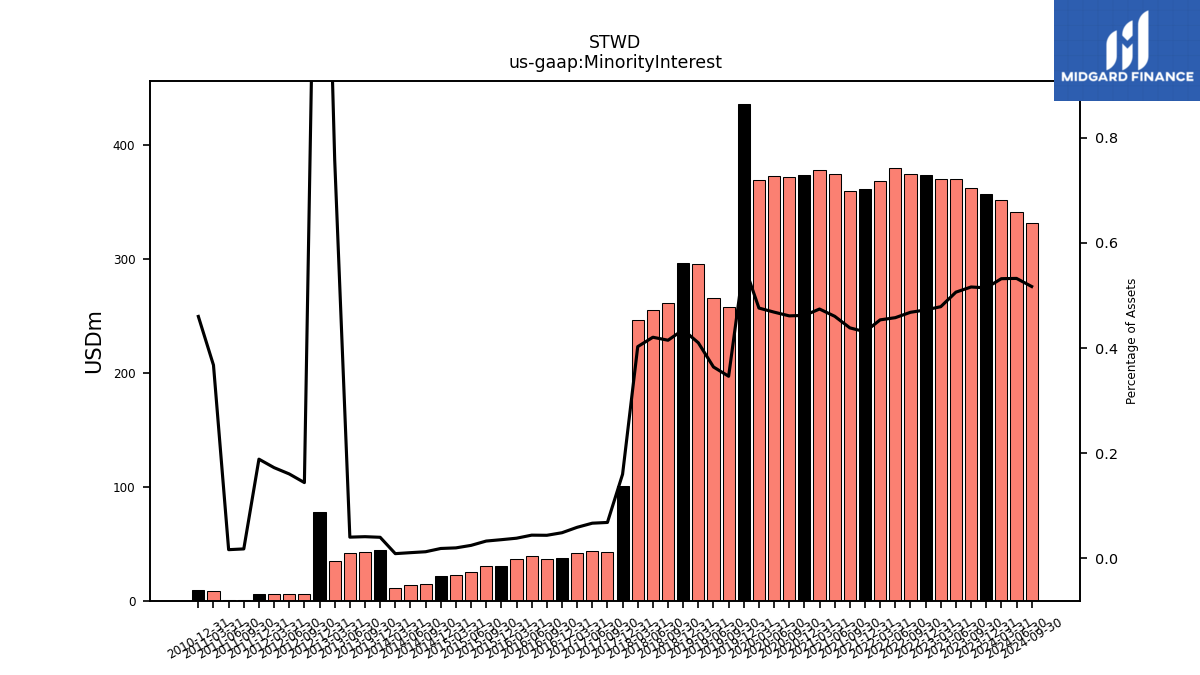
| Minority Interest | 351.95 | 357.55 | 362.78 | 370.45 | 370.25 | 373.48 | 374.39 | 380.39 | 368.27 | 361.36 | 359.40 | 374.35 | 377.92 | 373.68 | 371.81 | 372.56 | 369.29 | 436.59 | 257.82 | 265.54 | 295.89 | 296.76 | 261.04 | 254.87 | 246.16 | 100.79 | 42.94 | 43.29 | 41.75 | 37.80 | 36.53 | 39.63 | 36.38 | 30.63 | 30.41 | 25.29 | 22.54 | 22.06 | 14.95 | 13.39 | 11.50 | 44.60 | 43.11 | 41.85 | 34.95 | 77.86 | 5.49 | 5.56 | 5.60 | 5.66 | 0.45 | 0.44 | 8.79 | 9.67 | NA | NA | NA | NA | NA |
| 2024-03-31 | 2023-12-31 | 2023-09-30 | 2023-06-30 | 2023-03-31 | 2022-12-31 | 2022-09-30 | 2022-06-30 | 2022-03-31 | 2021-12-31 | 2021-09-30 | 2021-06-30 | 2021-03-31 | 2020-12-31 | 2020-09-30 | 2020-06-30 | 2020-03-31 | 2019-12-31 | 2019-09-30 | 2019-06-30 | 2019-03-31 | 2018-12-31 | 2018-09-30 | 2018-06-30 | 2018-03-31 | 2017-12-31 | 2017-09-30 | 2017-06-30 | 2017-03-31 | 2016-12-31 | 2016-09-30 | 2016-06-30 | 2016-03-31 | 2015-12-31 | 2015-09-30 | 2015-06-30 | 2015-03-31 | 2014-12-31 | 2014-09-30 | 2014-06-30 | 2014-03-31 | 2013-12-31 | 2013-09-30 | 2013-06-30 | 2013-03-31 | 2012-12-31 | 2012-09-30 | 2012-06-30 | 2012-03-31 | 2011-12-31 | 2011-09-30 | 2011-06-30 | 2011-03-31 | 2010-12-31 | 2010-09-30 | 2010-06-30 | 2010-03-31 | 2009-12-31 | 2009-09-30 | ||
|---|---|---|---|---|---|---|---|---|---|---|---|---|---|---|---|---|---|---|---|---|---|---|---|---|---|---|---|---|---|---|---|---|---|---|---|---|---|---|---|---|---|---|---|---|---|---|---|---|---|---|---|---|---|---|---|---|---|---|---|---|
| Stockholders Equity | 6272.75 | 6251.09 | 6321.02 | 6414.49 | 6382.23 | 6462.44 | 6446.80 | 6394.00 | 6279.69 | 6072.54 | 4487.71 | 4477.35 | 4476.86 | 4488.90 | 4513.88 | 4492.24 | 4448.06 | 4700.43 | 4655.20 | 4637.71 | 4621.08 | 4603.43 | 4621.24 | 4444.82 | 4458.53 | 4478.41 | 4496.79 | 4517.16 | 4501.61 | 4522.27 | 4068.85 | 4060.46 | 4054.48 | 4140.32 | 4170.77 | 4193.83 | 3857.57 | 3860.86 | 3849.01 | 3801.44 | 3204.14 | 4282.53 | 4270.32 | 3546.49 | 2745.45 | 2719.35 | 2295.75 | 2243.51 | 1786.83 | 1759.49 | 1755.77 | 1799.99 | 1327.23 | 1327.56 | NA | NA | NA | NA | NA | |
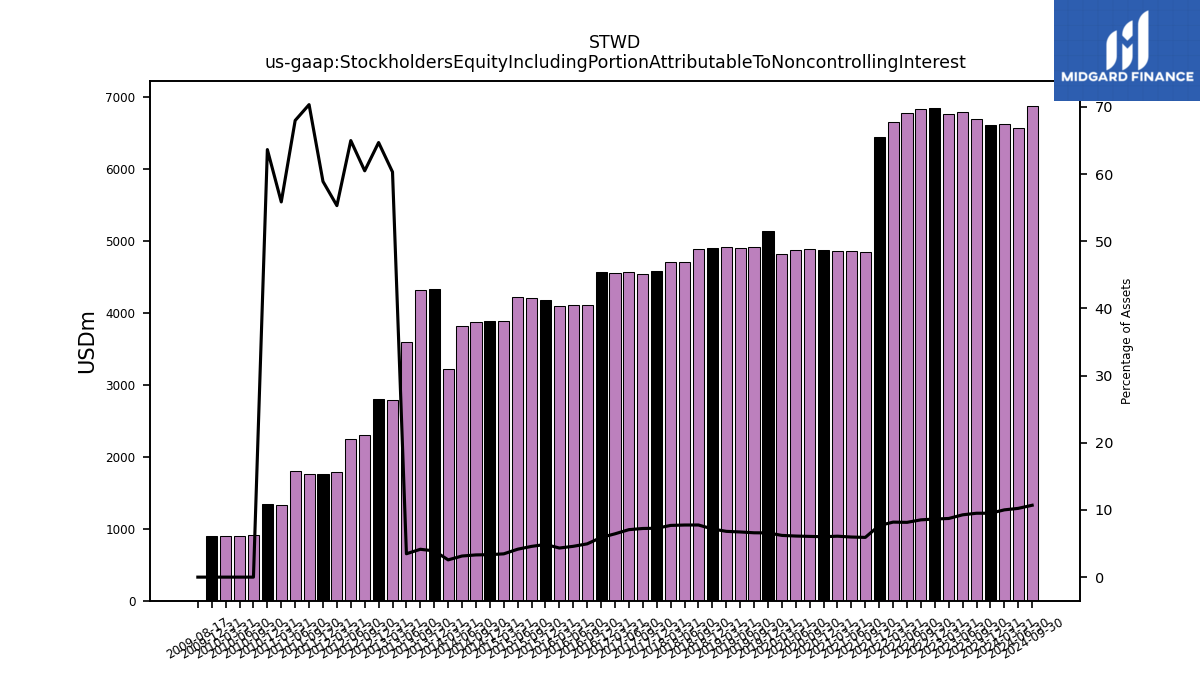
| Stockholders Equity Including Portion Attributable To Noncontrolling Interest | 6624.70 | 6608.63 | 6683.80 | 6784.94 | 6752.47 | 6835.92 | 6821.19 | 6774.39 | 6647.97 | 6433.89 | 4847.11 | 4851.70 | 4854.78 | 4862.58 | 4885.69 | 4864.80 | 4817.35 | 5137.01 | 4913.01 | 4903.25 | 4916.97 | 4900.19 | 4882.28 | 4699.69 | 4704.69 | 4579.20 | 4539.73 | 4560.45 | 4543.35 | 4560.07 | 4105.38 | 4100.09 | 4090.86 | 4170.94 | 4201.18 | 4219.12 | 3880.12 | 3882.91 | 3863.96 | 3814.83 | 3215.65 | 4327.13 | 4313.43 | 3588.33 | 2780.40 | 2797.20 | 2301.24 | 2249.07 | 1792.43 | 1765.15 | 1756.23 | 1800.43 | 1336.03 | 1337.23 | 914.65 | 893.79 | 894.99 | 896.03 | NA | |
| Common Stock Value | 3.23 | 3.21 | 3.21 | 3.20 | 3.20 | 3.18 | 3.17 | 3.17 | 3.14 | 3.12 | 2.96 | 2.95 | 2.94 | 2.92 | 2.92 | 2.92 | 2.89 | 2.87 | 2.87 | 2.86 | 2.85 | 2.81 | 2.79 | 2.67 | 2.67 | 2.66 | 2.65 | 2.65 | 2.65 | 2.64 | 2.43 | 2.43 | 2.42 | 2.41 | 2.41 | 2.40 | 2.25 | 2.25 | 2.24 | 2.23 | 1.97 | 1.96 | 1.96 | 1.67 | 1.36 | 1.36 | 1.18 | 1.17 | 0.94 | 0.94 | 0.93 | 0.93 | 0.71 | 0.71 | NA | NA | NA | NA | NA | |
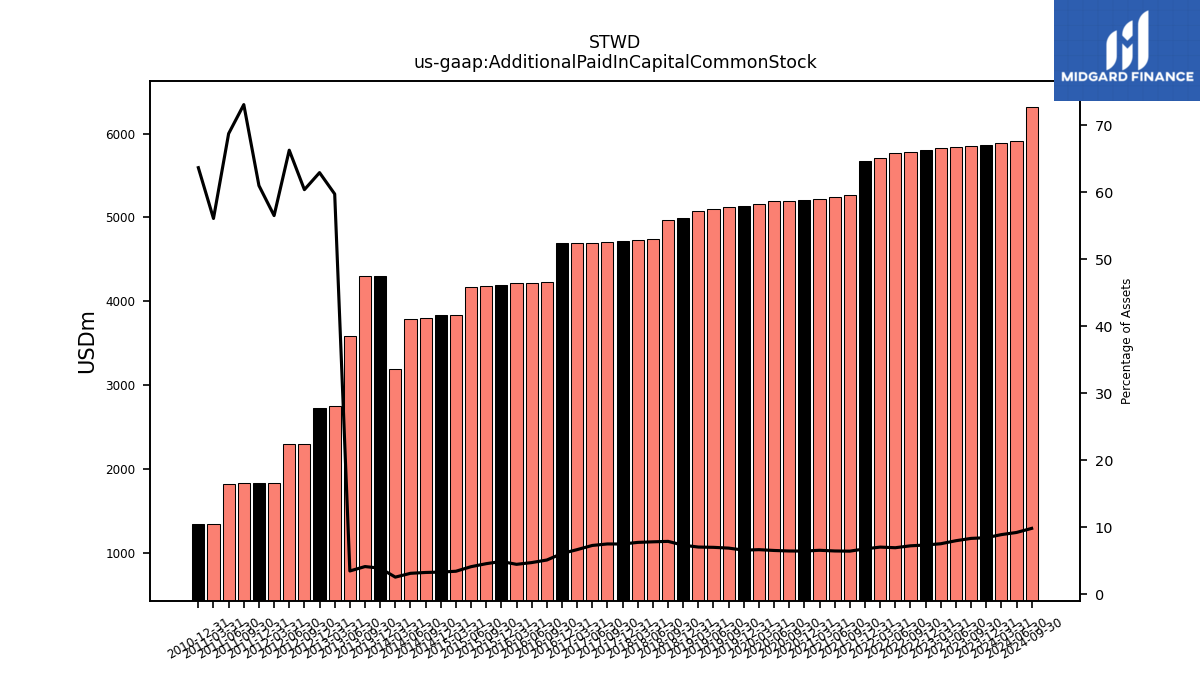
| Additional Paid In Capital Common Stock | 5885.85 | 5864.67 | 5855.96 | 5842.81 | 5826.51 | 5807.09 | 5779.69 | 5766.53 | 5709.03 | 5673.38 | 5270.27 | 5248.49 | 5225.04 | 5209.74 | 5200.72 | 5193.57 | 5159.07 | 5132.53 | 5121.67 | 5103.77 | 5080.17 | 4995.16 | 4963.06 | 4738.97 | 4728.18 | 4715.25 | 4705.04 | 4697.50 | 4689.70 | 4691.18 | 4230.58 | 4220.89 | 4210.90 | 4192.84 | 4184.54 | 4173.87 | 3837.04 | 3835.72 | 3793.43 | 3784.57 | 3192.24 | 4300.48 | 4295.06 | 3580.10 | 2754.49 | 2721.35 | 2297.97 | 2294.21 | 1832.08 | 1828.32 | 1825.02 | 1821.23 | 1341.84 | 1337.95 | NA | NA | NA | NA | NA | |
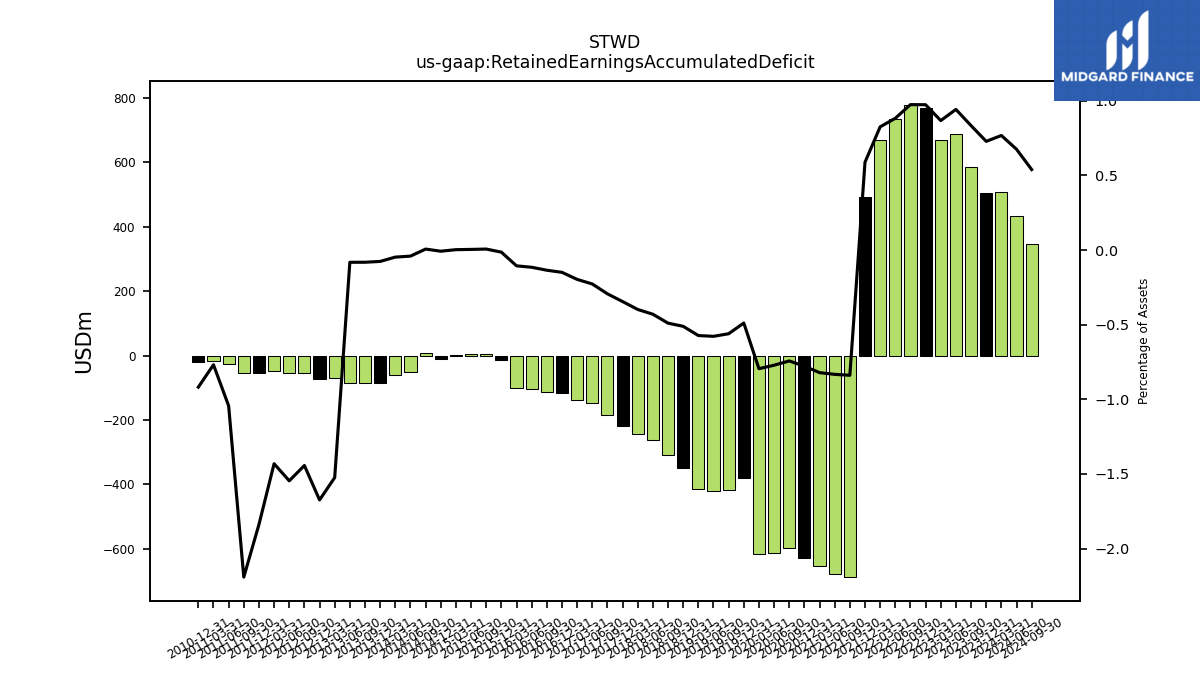
| Retained Earnings Accumulated Deficit | 507.62 | 505.88 | 585.76 | 689.15 | 670.69 | 769.24 | 779.19 | 733.35 | 669.88 | 493.11 | -687.98 | -677.38 | -654.75 | -629.73 | -599.01 | -614.09 | -616.76 | -381.72 | -417.53 | -421.86 | -413.55 | -349.00 | -308.34 | -260.76 | -243.44 | -217.31 | -184.07 | -146.86 | -138.70 | -115.58 | -112.30 | -103.37 | -100.20 | -12.29 | 5.84 | 4.12 | 2.55 | -9.38 | 7.30 | -49.69 | -59.54 | -84.72 | -85.34 | -84.92 | -70.31 | -72.40 | -54.94 | -53.52 | -46.41 | -55.13 | -54.73 | -27.65 | -18.39 | -19.30 | NA | NA | NA | NA | NA | |
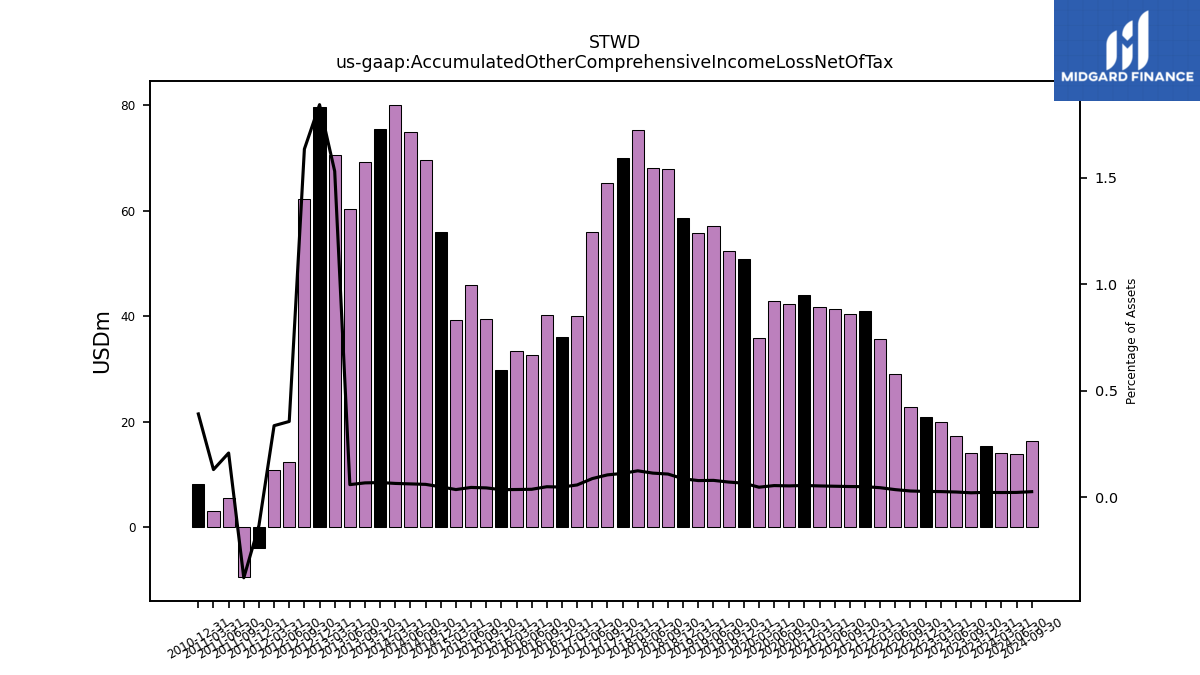
| Accumulated Other Comprehensive Income Loss Net Of Tax | 14.06 | 15.35 | 14.11 | 17.36 | 19.85 | 20.95 | 22.78 | 28.97 | 35.67 | 40.95 | 40.49 | 41.31 | 41.65 | 43.99 | 42.28 | 42.87 | 35.88 | 50.93 | 52.38 | 57.12 | 55.80 | 58.66 | 67.92 | 68.13 | 75.31 | 69.92 | 65.27 | 55.98 | 40.07 | 36.14 | 40.25 | 32.63 | 33.46 | 29.73 | 39.51 | 45.90 | 39.36 | 55.90 | 69.68 | 74.96 | 80.11 | 75.45 | 69.29 | 60.28 | 70.54 | 79.67 | 62.18 | 12.29 | 10.86 | -4.00 | -9.46 | 5.48 | 3.09 | 8.20 | NA | NA | NA | NA | NA | |
| Minority Interest | 351.95 | 357.55 | 362.78 | 370.45 | 370.25 | 373.48 | 374.39 | 380.39 | 368.27 | 361.36 | 359.40 | 374.35 | 377.92 | 373.68 | 371.81 | 372.56 | 369.29 | 436.59 | 257.82 | 265.54 | 295.89 | 296.76 | 261.04 | 254.87 | 246.16 | 100.79 | 42.94 | 43.29 | 41.75 | 37.80 | 36.53 | 39.63 | 36.38 | 30.63 | 30.41 | 25.29 | 22.54 | 22.06 | 14.95 | 13.39 | 11.50 | 44.60 | 43.11 | 41.85 | 34.95 | 77.86 | 5.49 | 5.56 | 5.60 | 5.66 | 0.45 | 0.44 | 8.79 | 9.67 | NA | NA | NA | NA | NA | |
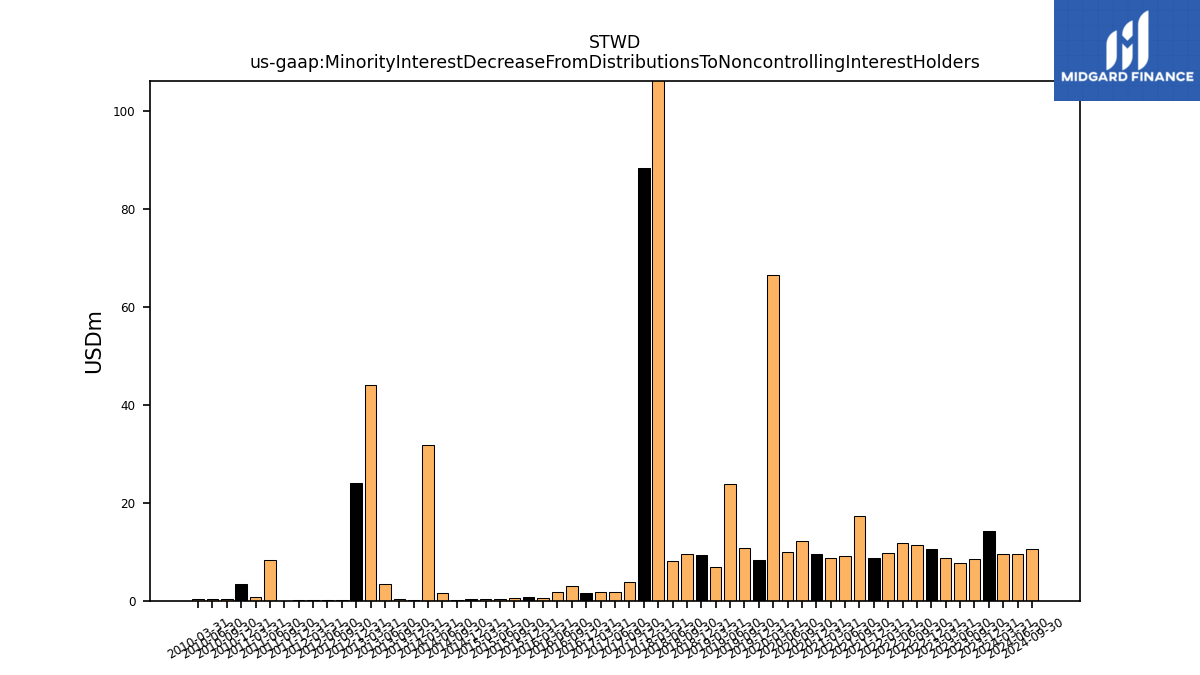
| Minority Interest Decrease From Distributions To Noncontrolling Interest Holders | 9.56 | 14.25 | 8.49 | 7.67 | 8.73 | 10.56 | 11.49 | 11.75 | 9.77 | 8.71 | 17.26 | 9.14 | 8.83 | 9.48 | 12.21 | 10.04 | 66.48 | 8.43 | 10.68 | 23.90 | 6.95 | 9.26 | 9.60 | 8.15 | 229.40 | 88.49 | 3.92 | 1.87 | 1.73 | 1.53 | 3.05 | 1.77 | 0.58 | 0.86 | 0.47 | 0.43 | 0.36 | 0.30 | 0.17 | 1.62 | 31.79 | 0.19 | 0.38 | 3.44 | 44.10 | 23.98 | 0.20 | 0.16 | 0.19 | 0.07 | 0.01 | 8.40 | 0.85 | 3.44 | 0.30 | 0.30 | 0.30 | NA | NA |
| 2024-03-31 | 2023-12-31 | 2023-09-30 | 2023-06-30 | 2023-03-31 | 2022-12-31 | 2022-09-30 | 2022-06-30 | 2022-03-31 | 2021-12-31 | 2021-09-30 | 2021-06-30 | 2021-03-31 | 2020-12-31 | 2020-09-30 | 2020-06-30 | 2020-03-31 | 2019-12-31 | 2019-09-30 | 2019-06-30 | 2019-03-31 | 2018-12-31 | 2018-09-30 | 2018-06-30 | 2018-03-31 | 2017-12-31 | 2017-09-30 | 2017-06-30 | 2017-03-31 | 2016-12-31 | 2016-09-30 | 2016-06-30 | 2016-03-31 | 2015-12-31 | 2015-09-30 | 2015-06-30 | 2015-03-31 | 2014-12-31 | 2014-09-30 | 2014-06-30 | 2014-03-31 | 2013-12-31 | 2013-09-30 | 2013-06-30 | 2013-03-31 | 2012-12-31 | 2012-09-30 | 2012-06-30 | 2012-03-31 | 2011-12-31 | 2011-09-30 | 2011-06-30 | 2011-03-31 | 2010-12-31 | 2010-09-30 | 2010-06-30 | 2010-03-31 | 2009-12-31 | 2009-09-30 | ||
|---|---|---|---|---|---|---|---|---|---|---|---|---|---|---|---|---|---|---|---|---|---|---|---|---|---|---|---|---|---|---|---|---|---|---|---|---|---|---|---|---|---|---|---|---|---|---|---|---|---|---|---|---|---|---|---|---|---|---|---|---|
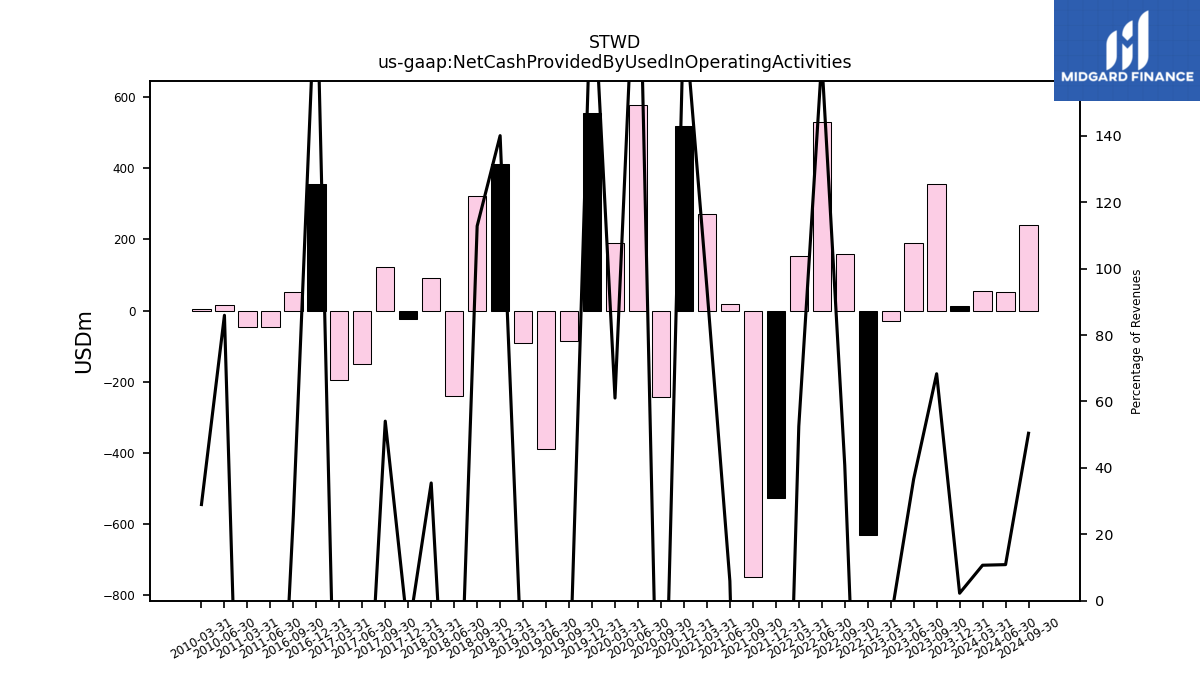
| Net Cash Provided By Used In Operating Activities | 55.95 | 11.85 | 356.39 | 188.91 | -28.56 | -630.99 | 159.49 | 530.87 | 154.37 | -528.22 | -749.74 | 17.22 | 270.77 | 519.40 | -243.59 | 579.01 | 190.73 | 556.59 | -86.94 | -390.13 | -92.72 | 410.82 | 322.31 | -240.06 | 92.40 | -24.41 | 122.61 | -149.02 | -196.02 | 355.46 | 52.62 | NA | NA | NA | NA | NA | NA | NA | NA | NA | NA | NA | NA | NA | NA | NA | NA | NA | NA | NA | NA | -45.89 | -46.22 | NA | NA | 15.45 | 3.59 | NA | NA | |
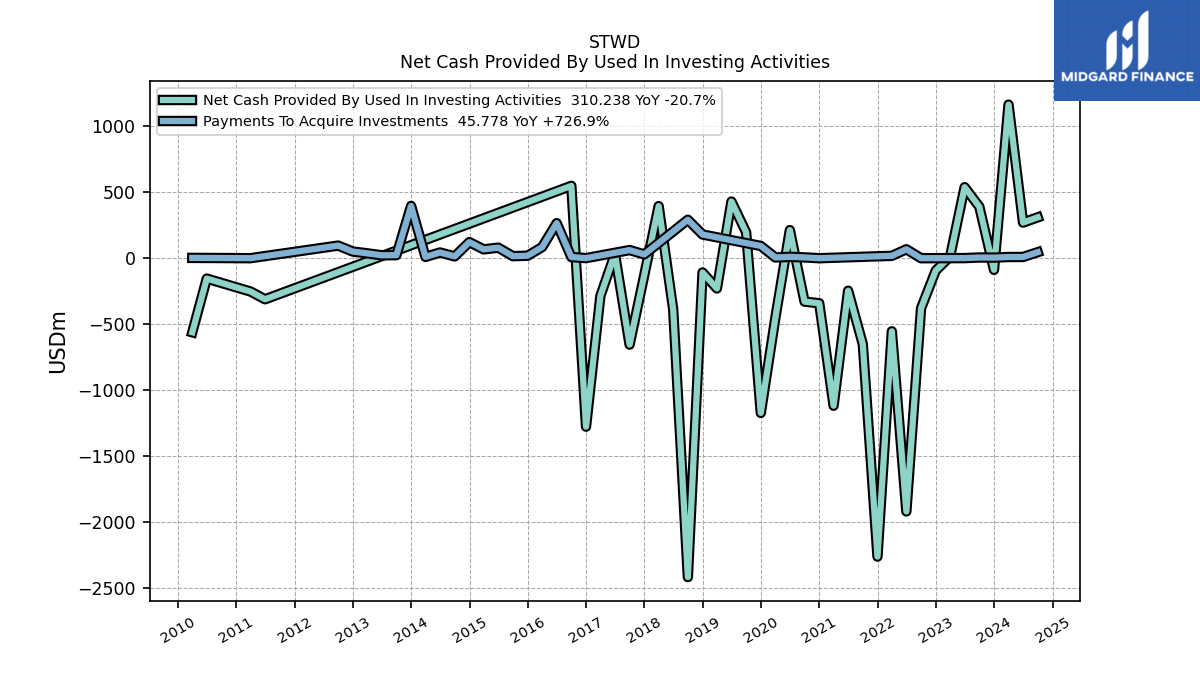
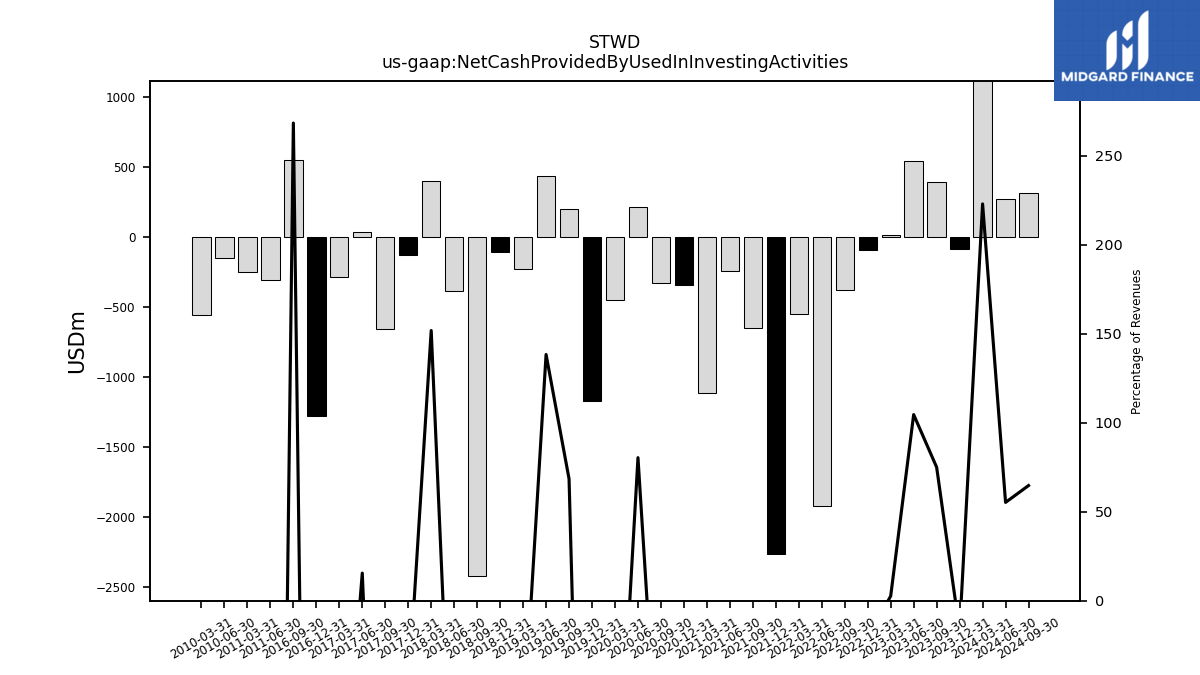
| Net Cash Provided By Used In Investing Activities | 1165.66 | -88.08 | 391.08 | 539.07 | 13.02 | -93.91 | -379.90 | -1921.73 | -554.76 | -2264.22 | -651.70 | -246.53 | -1119.20 | -341.85 | -329.20 | 213.43 | -454.18 | -1174.01 | 197.38 | 430.35 | -229.58 | -108.27 | -2420.09 | -387.88 | 395.43 | -127.56 | -655.72 | 32.87 | -286.15 | -1278.46 | 549.13 | NA | NA | NA | NA | NA | NA | NA | NA | NA | NA | NA | NA | NA | NA | NA | NA | NA | NA | NA | NA | -311.56 | -252.73 | NA | NA | -154.50 | -561.95 | NA | NA | |
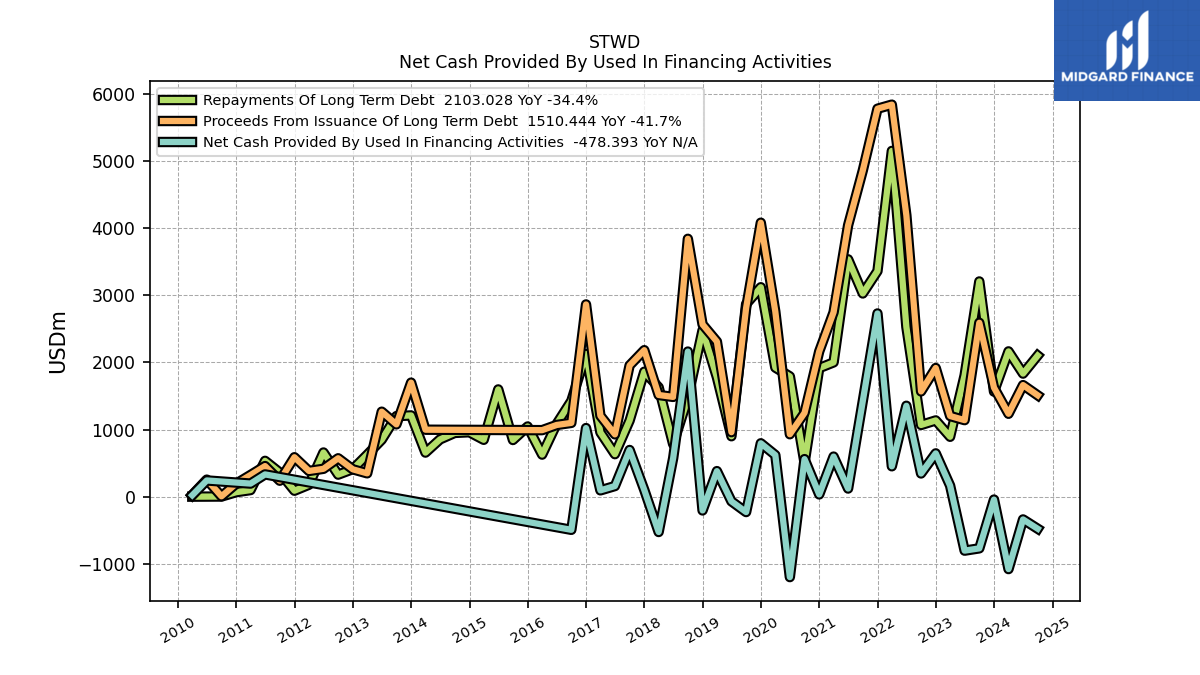
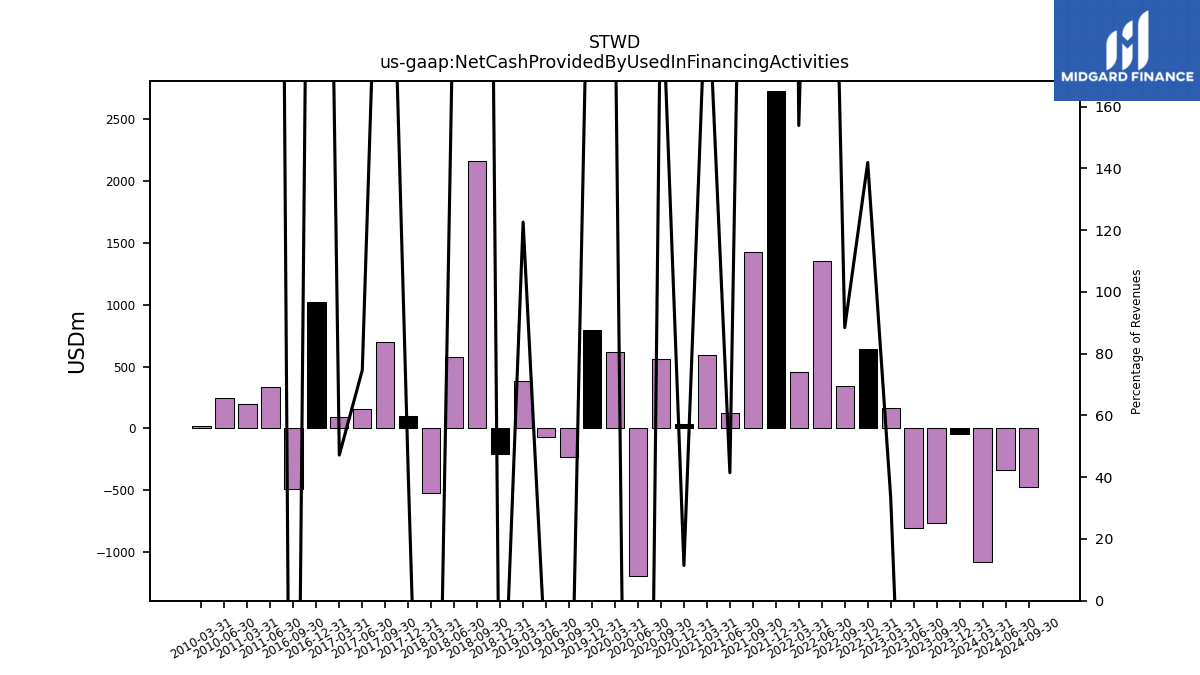
| Net Cash Provided By Used In Financing Activities | -1079.83 | -43.42 | -770.62 | -804.78 | 164.25 | 645.21 | 345.45 | 1354.71 | 452.51 | 2730.51 | 1424.75 | 120.61 | 597.23 | 33.20 | 559.45 | -1199.45 | 620.08 | 795.58 | -229.88 | -69.65 | 380.67 | -205.67 | 2162.81 | 574.66 | -527.07 | 100.25 | 695.70 | 157.97 | 93.77 | 1022.57 | -494.53 | NA | NA | NA | NA | NA | NA | NA | NA | NA | NA | NA | NA | NA | NA | NA | NA | NA | NA | NA | NA | 331.49 | 194.79 | NA | NA | 241.53 | 21.22 | NA | NA |
| 2024-03-31 | 2023-12-31 | 2023-09-30 | 2023-06-30 | 2023-03-31 | 2022-12-31 | 2022-09-30 | 2022-06-30 | 2022-03-31 | 2021-12-31 | 2021-09-30 | 2021-06-30 | 2021-03-31 | 2020-12-31 | 2020-09-30 | 2020-06-30 | 2020-03-31 | 2019-12-31 | 2019-09-30 | 2019-06-30 | 2019-03-31 | 2018-12-31 | 2018-09-30 | 2018-06-30 | 2018-03-31 | 2017-12-31 | 2017-09-30 | 2017-06-30 | 2017-03-31 | 2016-12-31 | 2016-09-30 | 2016-06-30 | 2016-03-31 | 2015-12-31 | 2015-09-30 | 2015-06-30 | 2015-03-31 | 2014-12-31 | 2014-09-30 | 2014-06-30 | 2014-03-31 | 2013-12-31 | 2013-09-30 | 2013-06-30 | 2013-03-31 | 2012-12-31 | 2012-09-30 | 2012-06-30 | 2012-03-31 | 2011-12-31 | 2011-09-30 | 2011-06-30 | 2011-03-31 | 2010-12-31 | 2010-09-30 | 2010-06-30 | 2010-03-31 | 2009-12-31 | 2009-09-30 | ||
|---|---|---|---|---|---|---|---|---|---|---|---|---|---|---|---|---|---|---|---|---|---|---|---|---|---|---|---|---|---|---|---|---|---|---|---|---|---|---|---|---|---|---|---|---|---|---|---|---|---|---|---|---|---|---|---|---|---|---|---|---|
| Net Cash Provided By Used In Operating Activities | 55.95 | 11.85 | 356.39 | 188.91 | -28.56 | -630.99 | 159.49 | 530.87 | 154.37 | -528.22 | -749.74 | 17.22 | 270.77 | 519.40 | -243.59 | 579.01 | 190.73 | 556.59 | -86.94 | -390.13 | -92.72 | 410.82 | 322.31 | -240.06 | 92.40 | -24.41 | 122.61 | -149.02 | -196.02 | 355.46 | 52.62 | NA | NA | NA | NA | NA | NA | NA | NA | NA | NA | NA | NA | NA | NA | NA | NA | NA | NA | NA | NA | -45.89 | -46.22 | NA | NA | 15.45 | 3.59 | NA | NA | |
| Net Income Loss | 154.33 | 70.96 | 47.44 | 168.84 | 51.97 | 140.03 | 194.56 | 212.29 | 324.60 | 91.45 | 128.60 | 116.31 | 111.38 | 106.97 | 151.83 | 139.66 | -66.77 | 171.87 | 140.40 | 127.02 | 70.38 | 92.13 | 84.54 | 109.23 | 99.93 | 92.60 | 88.43 | 117.38 | 102.36 | 121.29 | 105.77 | 111.47 | 26.66 | 96.45 | 116.73 | 117.15 | 120.36 | 91.51 | 165.04 | 117.87 | 120.60 | 94.97 | 87.36 | 60.45 | 62.24 | NA | NA | NA | NA | NA | NA | 32.42 | 31.45 | NA | NA | 10.85 | 5.94 | NA | NA | |
| Profit Loss | 159.86 | 84.64 | 51.38 | 222.38 | 59.76 | 169.20 | 223.84 | 281.70 | 384.31 | 103.03 | 140.49 | 126.38 | 122.53 | 114.66 | 164.73 | 152.96 | -66.27 | 177.98 | 150.00 | 132.45 | 76.51 | 99.93 | 89.38 | 117.09 | 104.79 | 93.88 | 92.80 | 123.23 | 102.85 | 122.72 | 105.81 | 112.07 | 27.05 | 96.65 | 117.12 | 117.64 | 120.78 | 91.89 | 167.39 | 120.38 | 120.88 | 96.15 | 91.60 | 63.34 | 63.42 | 58.43 | 50.34 | 44.62 | 50.29 | 41.07 | 14.50 | 33.31 | 31.73 | 17.89 | 23.28 | 11.41 | 6.26 | -0.81 | -1.77 |
| 2024-03-31 | 2023-12-31 | 2023-09-30 | 2023-06-30 | 2023-03-31 | 2022-12-31 | 2022-09-30 | 2022-06-30 | 2022-03-31 | 2021-12-31 | 2021-09-30 | 2021-06-30 | 2021-03-31 | 2020-12-31 | 2020-09-30 | 2020-06-30 | 2020-03-31 | 2019-12-31 | 2019-09-30 | 2019-06-30 | 2019-03-31 | 2018-12-31 | 2018-09-30 | 2018-06-30 | 2018-03-31 | 2017-12-31 | 2017-09-30 | 2017-06-30 | 2017-03-31 | 2016-12-31 | 2016-09-30 | 2016-06-30 | 2016-03-31 | 2015-12-31 | 2015-09-30 | 2015-06-30 | 2015-03-31 | 2014-12-31 | 2014-09-30 | 2014-06-30 | 2014-03-31 | 2013-12-31 | 2013-09-30 | 2013-06-30 | 2013-03-31 | 2012-12-31 | 2012-09-30 | 2012-06-30 | 2012-03-31 | 2011-12-31 | 2011-09-30 | 2011-06-30 | 2011-03-31 | 2010-12-31 | 2010-09-30 | 2010-06-30 | 2010-03-31 | 2009-12-31 | 2009-09-30 | ||
|---|---|---|---|---|---|---|---|---|---|---|---|---|---|---|---|---|---|---|---|---|---|---|---|---|---|---|---|---|---|---|---|---|---|---|---|---|---|---|---|---|---|---|---|---|---|---|---|---|---|---|---|---|---|---|---|---|---|---|---|---|
| Net Cash Provided By Used In Investing Activities | 1165.66 | -88.08 | 391.08 | 539.07 | 13.02 | -93.91 | -379.90 | -1921.73 | -554.76 | -2264.22 | -651.70 | -246.53 | -1119.20 | -341.85 | -329.20 | 213.43 | -454.18 | -1174.01 | 197.38 | 430.35 | -229.58 | -108.27 | -2420.09 | -387.88 | 395.43 | -127.56 | -655.72 | 32.87 | -286.15 | -1278.46 | 549.13 | NA | NA | NA | NA | NA | NA | NA | NA | NA | NA | NA | NA | NA | NA | NA | NA | NA | NA | NA | NA | -311.56 | -252.73 | NA | NA | -154.50 | -561.95 | NA | NA | |
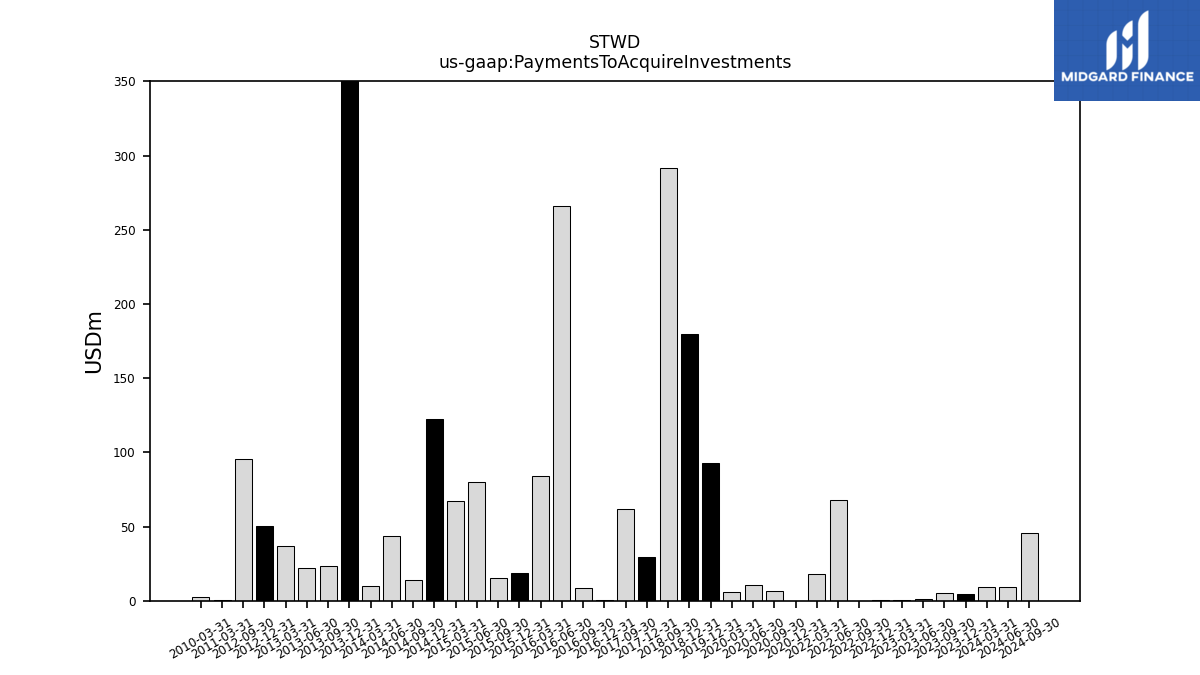
| Payments To Acquire Investments | 9.22 | 4.59 | 5.54 | 0.86 | 0.59 | 0.45 | 0.00 | 67.92 | 18.14 | NA | NA | NA | NA | 0.00 | 6.29 | 10.39 | 5.73 | 93.09 | NA | NA | NA | 180.06 | 291.87 | NA | NA | 29.16 | 61.80 | NA | NA | 0.83 | 8.87 | 266.31 | 84.34 | 19.00 | 15.60 | 80.18 | 67.25 | 122.19 | 13.78 | 43.56 | 9.89 | 397.09 | 23.28 | 22.30 | 37.17 | 50.60 | 95.82 | NA | NA | NA | NA | NA | 0.29 | NA | NA | NA | 2.57 | NA | NA |
| 2024-03-31 | 2023-12-31 | 2023-09-30 | 2023-06-30 | 2023-03-31 | 2022-12-31 | 2022-09-30 | 2022-06-30 | 2022-03-31 | 2021-12-31 | 2021-09-30 | 2021-06-30 | 2021-03-31 | 2020-12-31 | 2020-09-30 | 2020-06-30 | 2020-03-31 | 2019-12-31 | 2019-09-30 | 2019-06-30 | 2019-03-31 | 2018-12-31 | 2018-09-30 | 2018-06-30 | 2018-03-31 | 2017-12-31 | 2017-09-30 | 2017-06-30 | 2017-03-31 | 2016-12-31 | 2016-09-30 | 2016-06-30 | 2016-03-31 | 2015-12-31 | 2015-09-30 | 2015-06-30 | 2015-03-31 | 2014-12-31 | 2014-09-30 | 2014-06-30 | 2014-03-31 | 2013-12-31 | 2013-09-30 | 2013-06-30 | 2013-03-31 | 2012-12-31 | 2012-09-30 | 2012-06-30 | 2012-03-31 | 2011-12-31 | 2011-09-30 | 2011-06-30 | 2011-03-31 | 2010-12-31 | 2010-09-30 | 2010-06-30 | 2010-03-31 | 2009-12-31 | 2009-09-30 | ||
|---|---|---|---|---|---|---|---|---|---|---|---|---|---|---|---|---|---|---|---|---|---|---|---|---|---|---|---|---|---|---|---|---|---|---|---|---|---|---|---|---|---|---|---|---|---|---|---|---|---|---|---|---|---|---|---|---|---|---|---|---|
| Net Cash Provided By Used In Financing Activities | -1079.83 | -43.42 | -770.62 | -804.78 | 164.25 | 645.21 | 345.45 | 1354.71 | 452.51 | 2730.51 | 1424.75 | 120.61 | 597.23 | 33.20 | 559.45 | -1199.45 | 620.08 | 795.58 | -229.88 | -69.65 | 380.67 | -205.67 | 2162.81 | 574.66 | -527.07 | 100.25 | 695.70 | 157.97 | 93.77 | 1022.57 | -494.53 | NA | NA | NA | NA | NA | NA | NA | NA | NA | NA | NA | NA | NA | NA | NA | NA | NA | NA | NA | NA | 331.49 | 194.79 | NA | NA | 241.53 | 21.22 | NA | NA | |
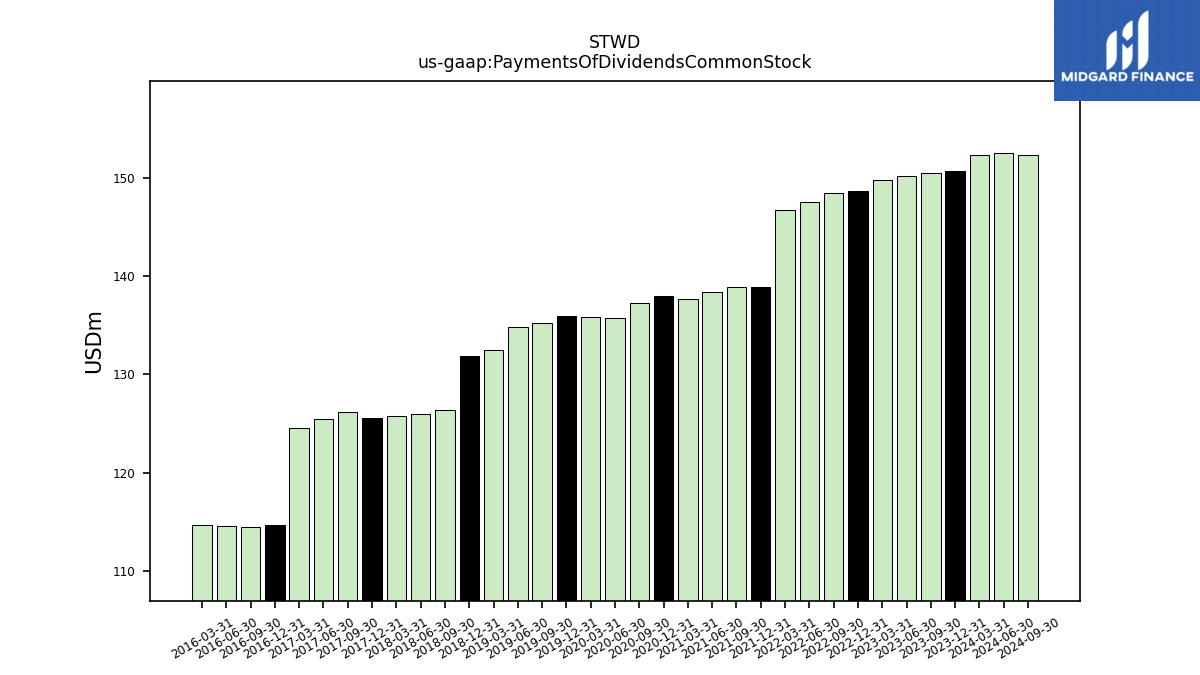
| Payments Of Dividends Common Stock | 152.31 | 150.69 | 150.51 | 150.24 | 149.76 | 148.66 | 148.52 | 147.57 | 146.71 | 138.95 | 138.93 | 138.38 | 137.67 | 137.99 | 137.27 | 135.74 | 135.89 | 135.91 | 135.22 | 134.79 | 132.51 | 131.87 | 126.42 | 125.94 | 125.73 | 125.60 | 126.14 | 125.42 | 124.51 | 114.68 | 114.52 | 114.53 | 114.62 | NA | NA | NA | NA | NA | NA | NA | NA | NA | NA | NA | NA | NA | NA | NA | NA | NA | NA | NA | NA | NA | NA | NA | NA | NA | NA |
| 2024-03-31 | 2023-12-31 | 2023-09-30 | 2023-06-30 | 2023-03-31 | 2022-12-31 | 2022-09-30 | 2022-06-30 | 2022-03-31 | 2021-12-31 | 2021-09-30 | 2021-06-30 | 2021-03-31 | 2020-12-31 | 2020-09-30 | 2020-06-30 | 2020-03-31 | 2019-12-31 | 2019-09-30 | 2019-06-30 | 2019-03-31 | 2018-12-31 | 2018-09-30 | 2018-06-30 | 2018-03-31 | 2017-12-31 | 2017-09-30 | 2017-06-30 | 2017-03-31 | 2016-12-31 | 2016-09-30 | 2016-06-30 | 2016-03-31 | 2015-12-31 | 2015-09-30 | 2015-06-30 | 2015-03-31 | 2014-12-31 | 2014-09-30 | 2014-06-30 | 2014-03-31 | 2013-12-31 | 2013-09-30 | 2013-06-30 | 2013-03-31 | 2012-12-31 | 2012-09-30 | 2012-06-30 | 2012-03-31 | 2011-12-31 | 2011-09-30 | 2011-06-30 | 2011-03-31 | 2010-12-31 | 2010-09-30 | 2010-06-30 | 2010-03-31 | 2009-12-31 | 2009-09-30 | ||
|---|---|---|---|---|---|---|---|---|---|---|---|---|---|---|---|---|---|---|---|---|---|---|---|---|---|---|---|---|---|---|---|---|---|---|---|---|---|---|---|---|---|---|---|---|---|---|---|---|---|---|---|---|---|---|---|---|---|---|---|---|
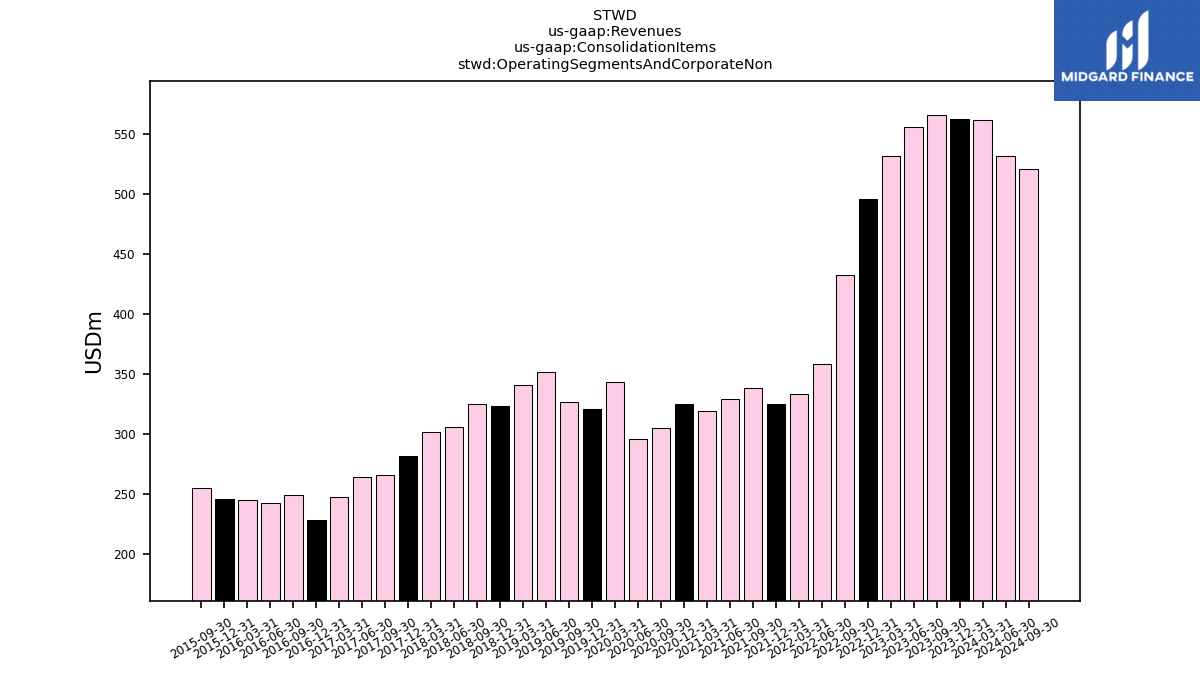
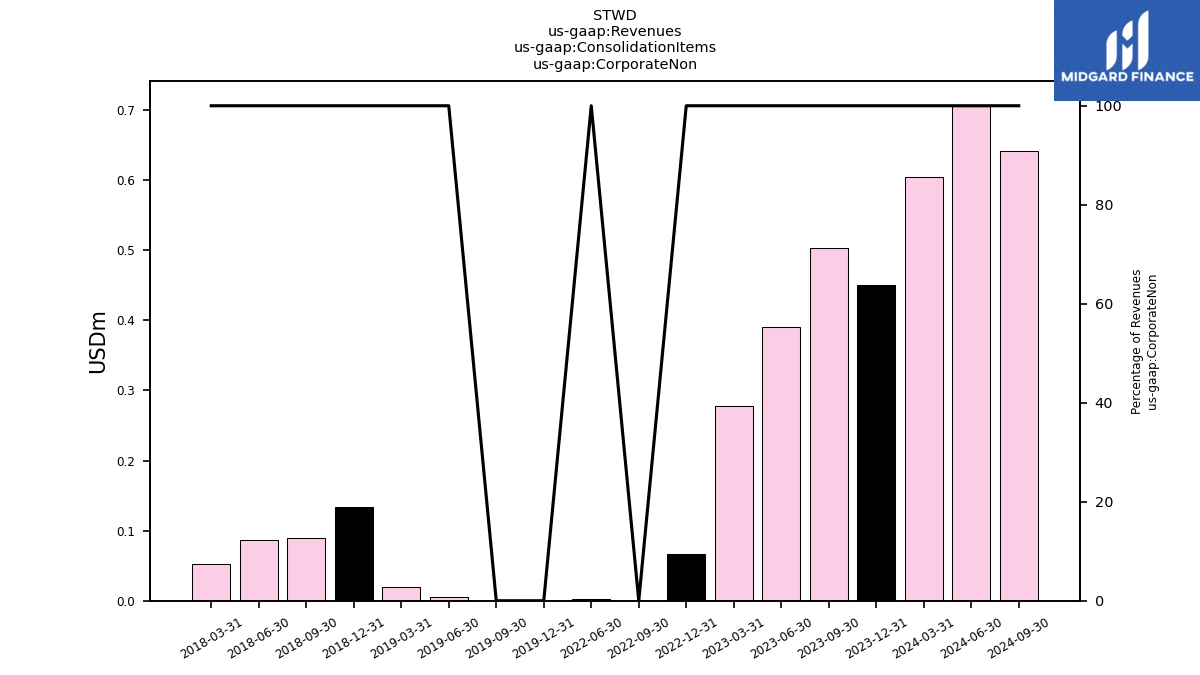
| Revenues | 523.09 | 522.28 | 521.55 | 515.67 | 490.41 | 454.60 | 390.54 | 325.59 | 293.99 | 289.70 | 302.29 | 290.87 | 287.23 | 290.56 | 267.43 | 265.61 | 312.56 | 286.43 | 288.33 | 311.18 | 310.48 | 293.42 | 285.72 | 269.56 | 260.59 | 242.83 | 226.77 | 211.57 | 198.72 | 184.48 | 204.71 | 199.99 | 195.49 | 186.22 | 192.15 | 178.66 | 178.85 | 178.78 | 181.37 | 170.75 | 171.98 | 187.95 | 155.54 | 137.04 | 85.17 | 74.72 | 60.82 | 58.42 | 65.90 | 52.09 | 50.75 | 41.13 | 31.43 | 24.54 | 22.82 | 17.98 | 12.40 | 4.41 | 0.61 | |
| Operating Segments And Corporate Non | 561.05 | 562.53 | 565.62 | 555.48 | 531.16 | 495.69 | 432.42 | 358.24 | 333.20 | 324.77 | 338.38 | 329.24 | 319.69 | 325.00 | 305.16 | 295.99 | 343.27 | 321.06 | 327.19 | 352.00 | 340.88 | 323.48 | 325.53 | 305.64 | 301.74 | 281.53 | 266.05 | 264.32 | 247.36 | 228.25 | 249.22 | 242.49 | 245.21 | 246.43 | 255.43 | NA | NA | NA | NA | NA | NA | NA | NA | NA | NA | NA | NA | NA | NA | NA | NA | NA | NA | NA | NA | NA | NA | NA | NA | |
| Corporate Non | 0.60 | 0.45 | 0.50 | 0.39 | 0.28 | 0.07 | 0.00 | 0.00 | NA | NA | NA | NA | NA | NA | NA | NA | NA | 0.00 | 0.00 | 0.01 | 0.02 | 0.13 | 0.09 | 0.09 | 0.05 | NA | NA | NA | NA | NA | NA | NA | NA | NA | NA | NA | NA | NA | NA | NA | NA | NA | NA | NA | NA | NA | NA | NA | NA | NA | NA | NA | NA | NA | NA | NA | NA | NA | NA | |
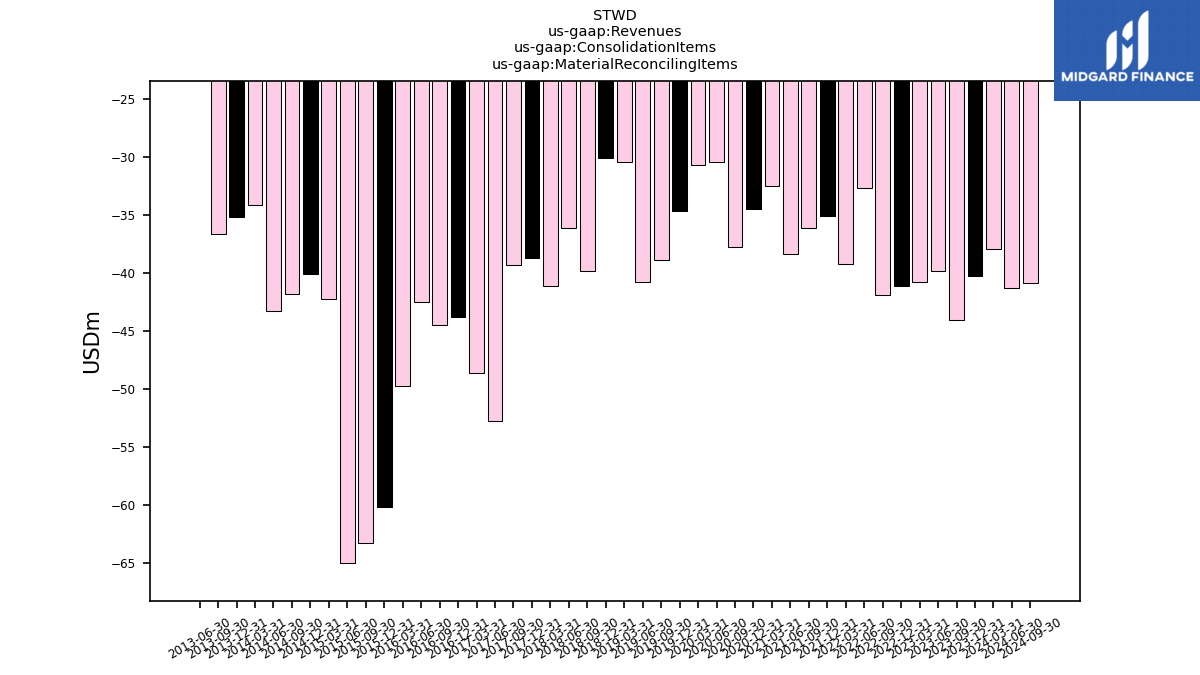
| Material Reconciling Items | -37.96 | -40.25 | -44.08 | -39.81 | -40.74 | -41.09 | -41.88 | -32.66 | -39.21 | -35.06 | -36.10 | -38.38 | -32.46 | -34.43 | -37.73 | -30.38 | -30.71 | -34.64 | -38.86 | -40.82 | -30.41 | -30.06 | -39.81 | -36.09 | -41.16 | -38.70 | -39.29 | -52.75 | -48.64 | -43.78 | -44.51 | -42.50 | -49.72 | -60.20 | -63.28 | -65.05 | -42.28 | -40.07 | -41.79 | -43.30 | -34.13 | -35.21 | -36.67 | -20.82 | NA | NA | NA | NA | NA | NA | NA | NA | NA | NA | NA | NA | NA | NA | NA | |
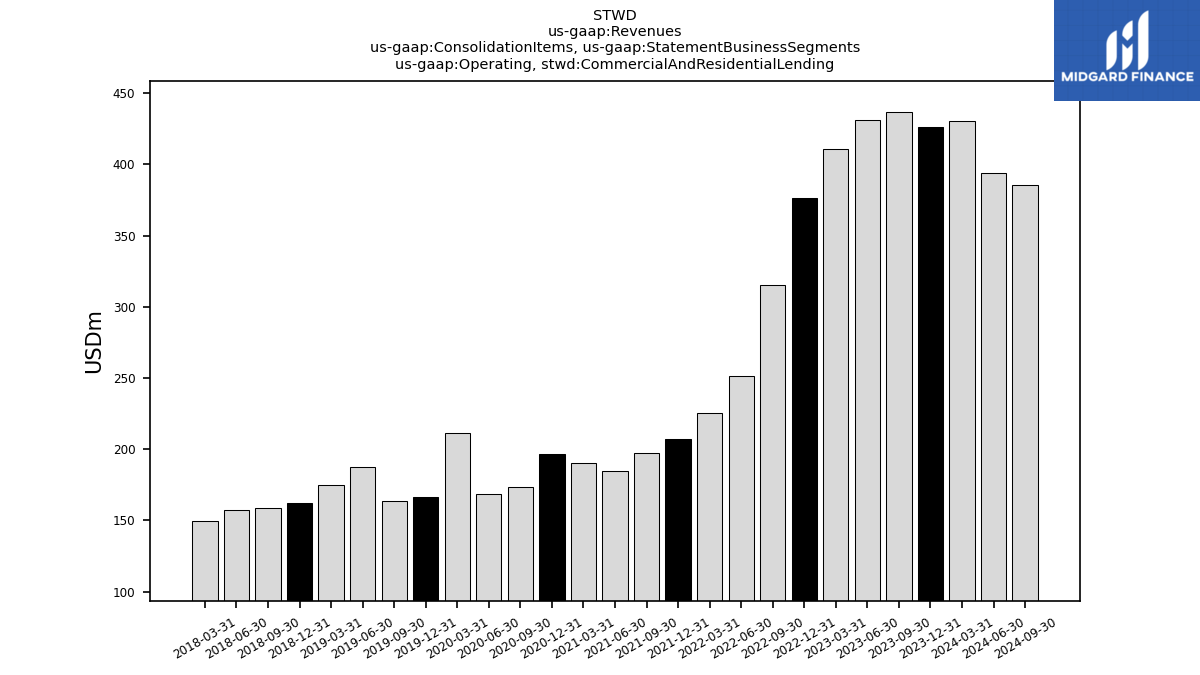
| Operating, Commercial And Residential Lending | 430.55 | 426.13 | 436.66 | 430.81 | 410.61 | 376.43 | 314.98 | 251.39 | 225.18 | 207.25 | 197.04 | 184.49 | 190.53 | 196.31 | 173.55 | 168.37 | 211.44 | 166.61 | 163.81 | 187.78 | 174.83 | 162.11 | 158.60 | 157.47 | 149.77 | NA | NA | NA | NA | NA | NA | NA | NA | NA | NA | NA | NA | NA | NA | NA | NA | NA | NA | NA | NA | NA | NA | NA | NA | NA | NA | NA | NA | NA | NA | NA | NA | NA | NA | |
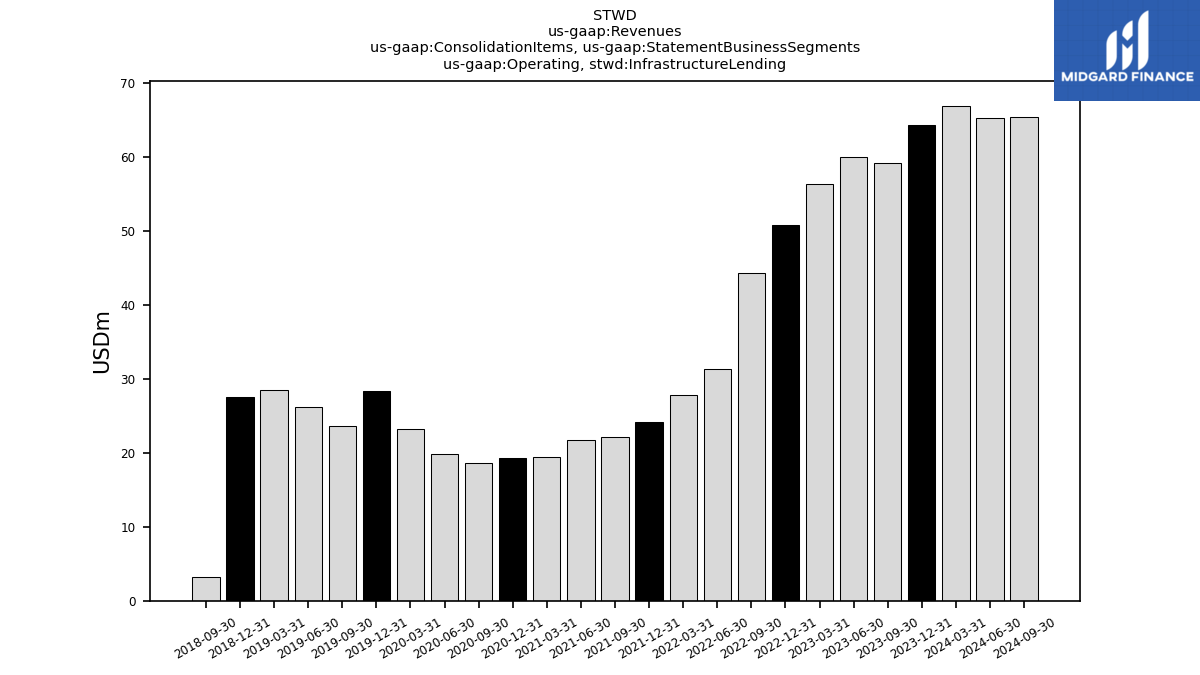
| Operating, Infrastructure Lending | 66.93 | 64.36 | 59.25 | 60.06 | 56.31 | 50.85 | 44.35 | 31.36 | 27.80 | 24.11 | 22.17 | 21.80 | 19.46 | 19.25 | 18.57 | 19.91 | 23.26 | 28.39 | 23.61 | 26.17 | 28.49 | 27.50 | 3.20 | NA | NA | NA | NA | NA | NA | NA | NA | NA | NA | NA | NA | NA | NA | NA | NA | NA | NA | NA | NA | NA | NA | NA | NA | NA | NA | NA | NA | NA | NA | NA | NA | NA | NA | NA | NA | |
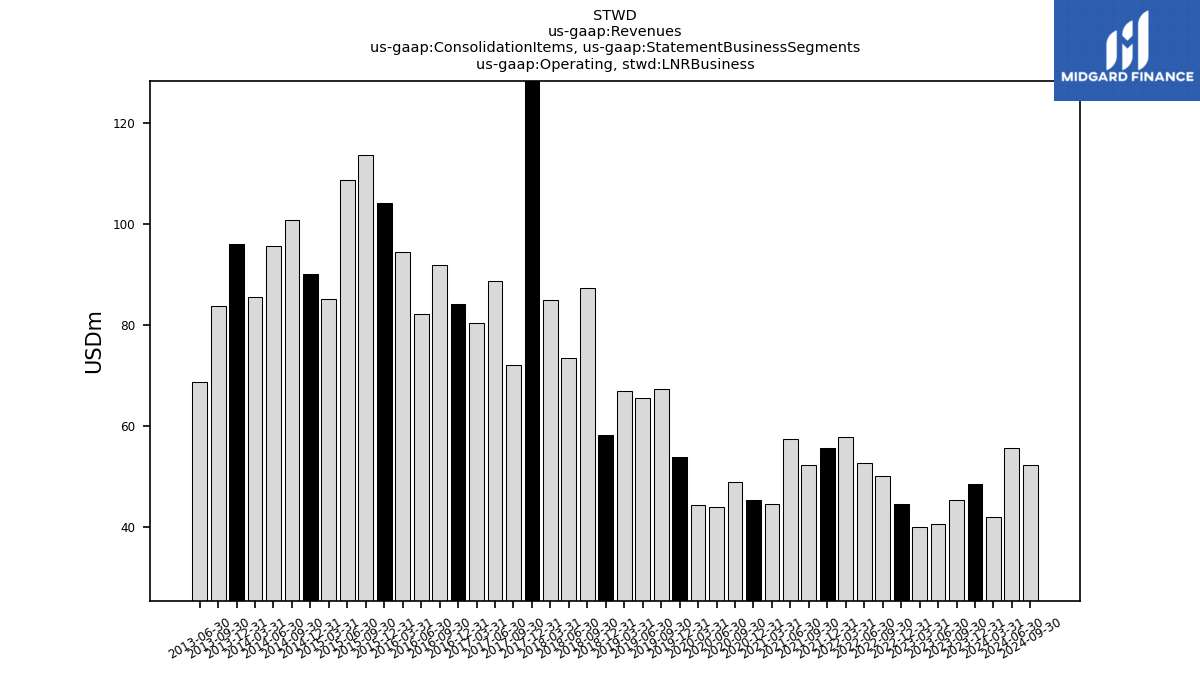
| Operating, L N R Business | 42.06 | 48.49 | 45.45 | 40.70 | 40.16 | 44.54 | 50.15 | 52.81 | 57.81 | 55.69 | 52.44 | 57.50 | 44.55 | 45.37 | 49.07 | 44.09 | 44.49 | 53.95 | 67.40 | 65.63 | 66.95 | 58.36 | 87.41 | 73.60 | 85.11 | 173.01 | 72.21 | 88.71 | 80.41 | 84.18 | 91.88 | 82.24 | 94.53 | 104.15 | 113.69 | 108.76 | 85.20 | 90.20 | 100.87 | 95.71 | 85.61 | 96.05 | 83.81 | 68.85 | NA | NA | NA | NA | NA | NA | NA | NA | NA | NA | NA | NA | NA | NA | NA | |
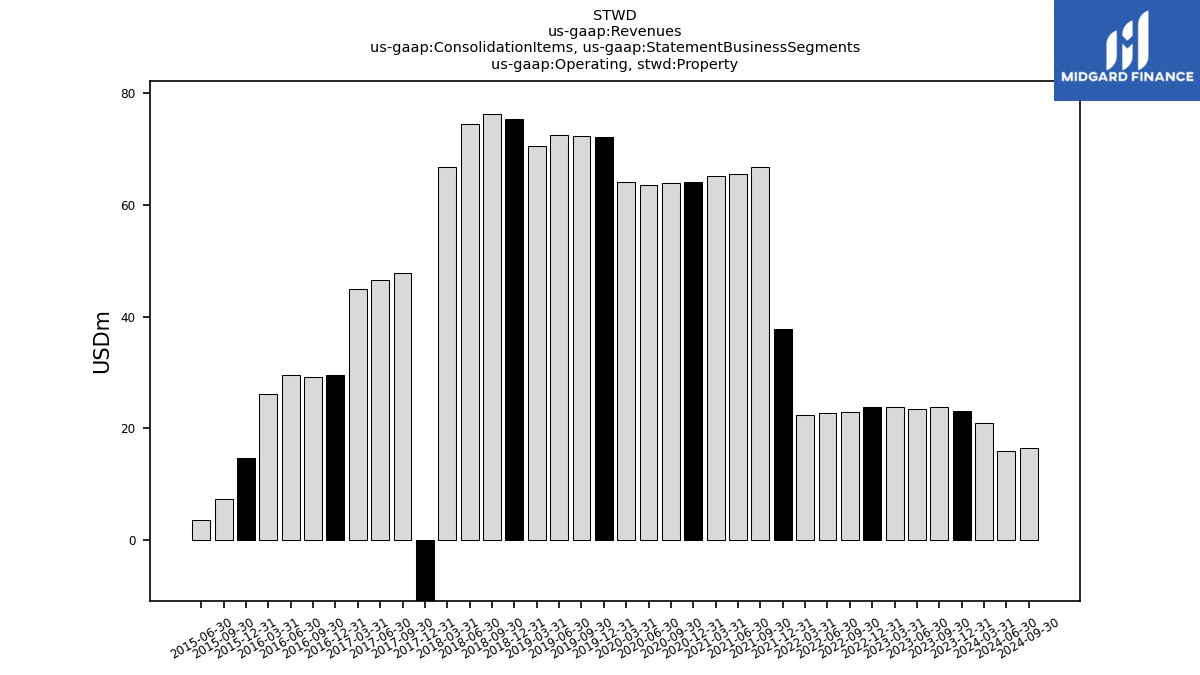
| Operating, Property | 20.90 | 23.09 | 23.76 | 23.52 | 23.80 | 23.80 | 22.94 | 22.68 | 22.41 | 37.71 | 66.73 | 65.45 | 65.14 | 64.06 | 63.97 | 63.62 | 64.08 | 72.11 | 72.38 | 72.41 | 70.60 | 75.37 | 76.24 | 74.48 | 66.81 | -42.22 | 47.83 | 46.50 | 44.90 | 29.52 | 29.24 | 29.64 | 26.21 | 14.62 | 7.29 | 3.54 | NA | NA | NA | NA | NA | NA | NA | NA | NA | NA | NA | NA | NA | NA | NA | NA | NA | NA | NA | NA | NA | NA | NA |