
| 2024-03-31 | 2023-12-31 | 2023-09-30 | 2023-06-30 | 2023-03-31 | 2022-12-31 | 2022-09-30 | 2022-06-30 | 2022-03-31 | 2021-12-31 | 2021-09-30 | ||
|---|---|---|---|---|---|---|---|---|---|---|---|---|
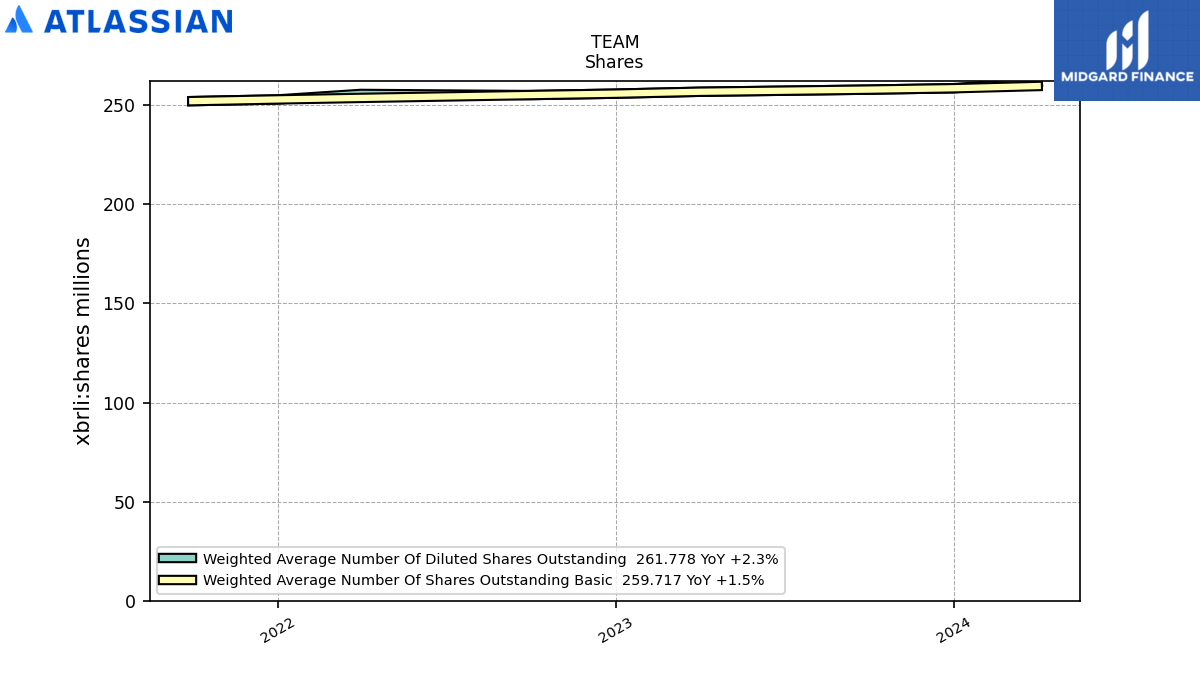
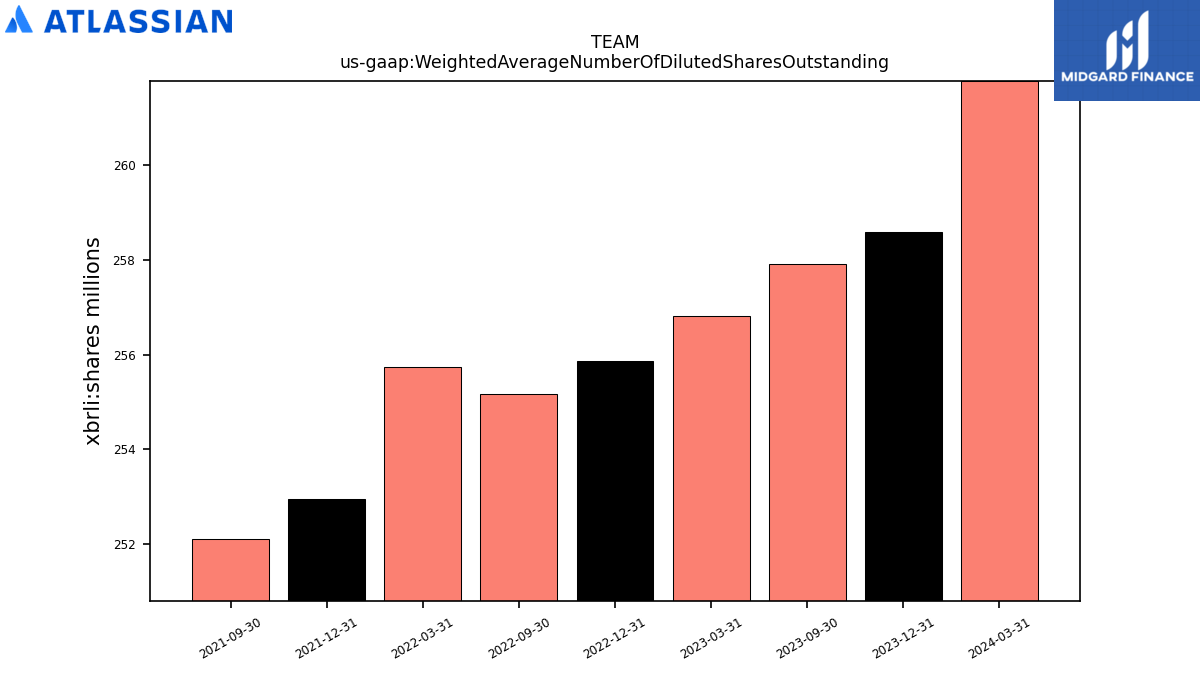
| Weighted Average Number Of Diluted Shares Outstanding | 261.78 | 258.60 | 257.91 | NA | 256.82 | 255.87 | 255.17 | NA | 255.74 | 252.96 | 252.11 | |
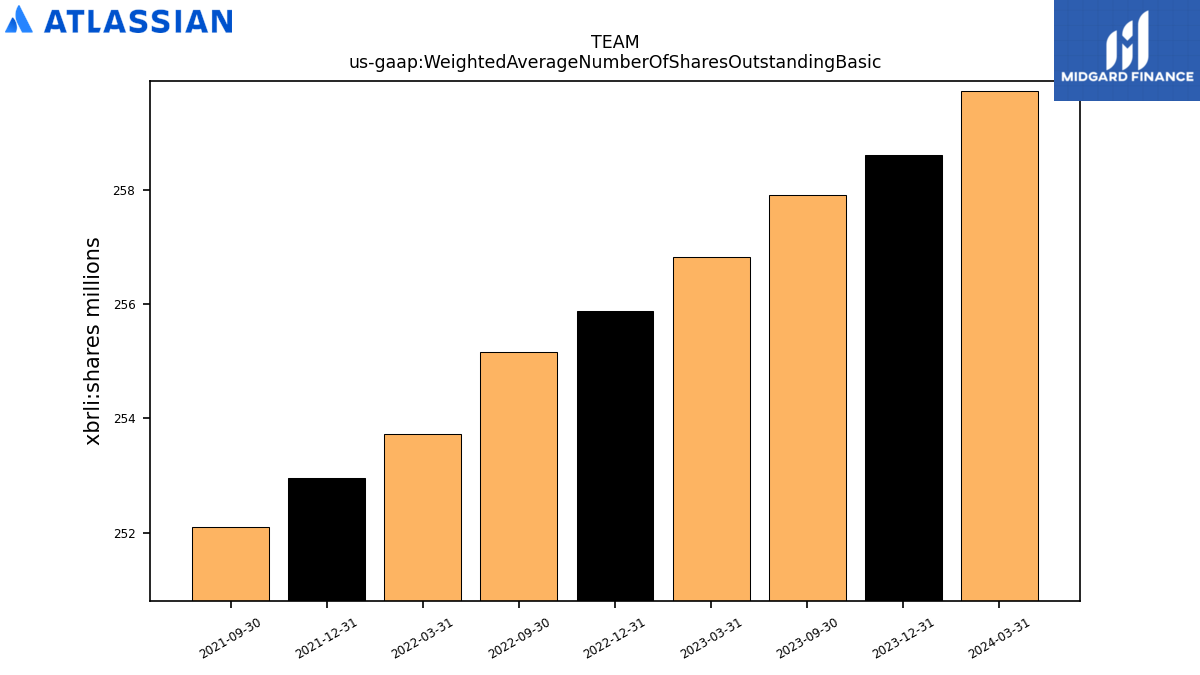
| Weighted Average Number Of Shares Outstanding Basic | 259.72 | 258.60 | 257.91 | NA | 256.82 | 255.87 | 255.17 | NA | 253.72 | 252.96 | 252.11 | |
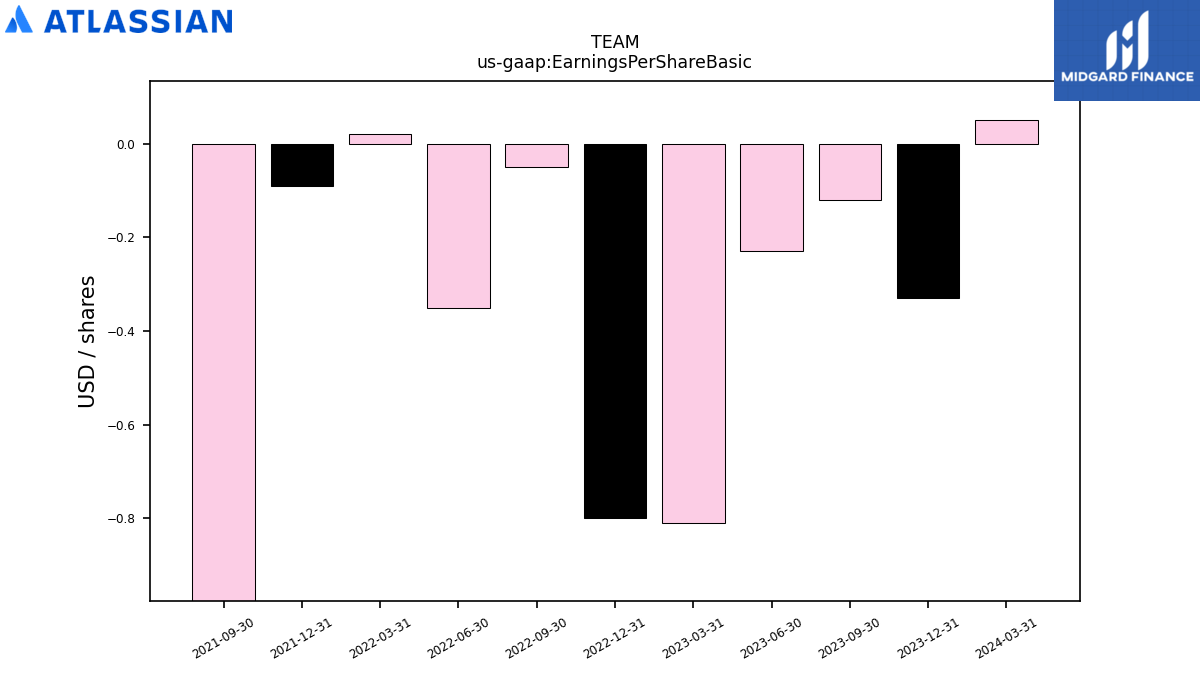
| Earnings Per Share Basic | 0.05 | -0.33 | -0.12 | -0.23 | -0.81 | -0.80 | -0.05 | -0.35 | 0.02 | -0.09 | -1.63 | |
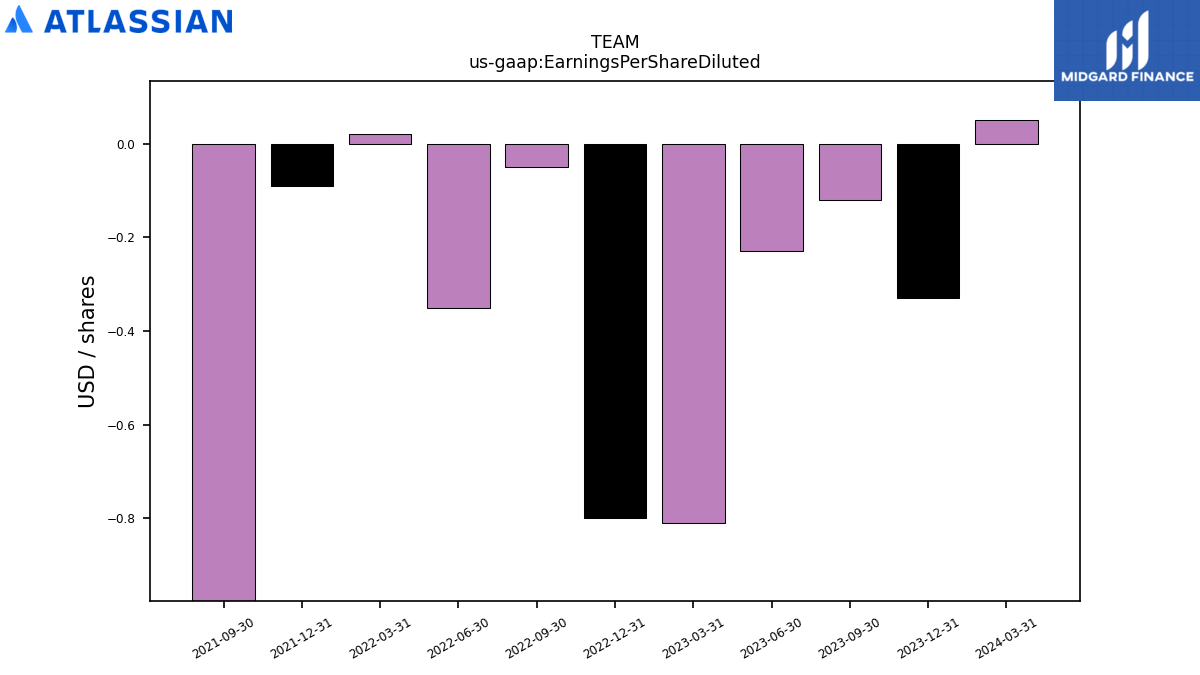
| Earnings Per Share Diluted | 0.05 | -0.33 | -0.12 | -0.23 | -0.81 | -0.80 | -0.05 | -0.35 | 0.02 | -0.09 | -1.63 |
| 2024-03-31 | 2023-12-31 | 2023-09-30 | 2023-06-30 | 2023-03-31 | 2022-12-31 | 2022-09-30 | 2022-06-30 | 2022-03-31 | 2021-12-31 | 2021-09-30 | ||
|---|---|---|---|---|---|---|---|---|---|---|---|---|
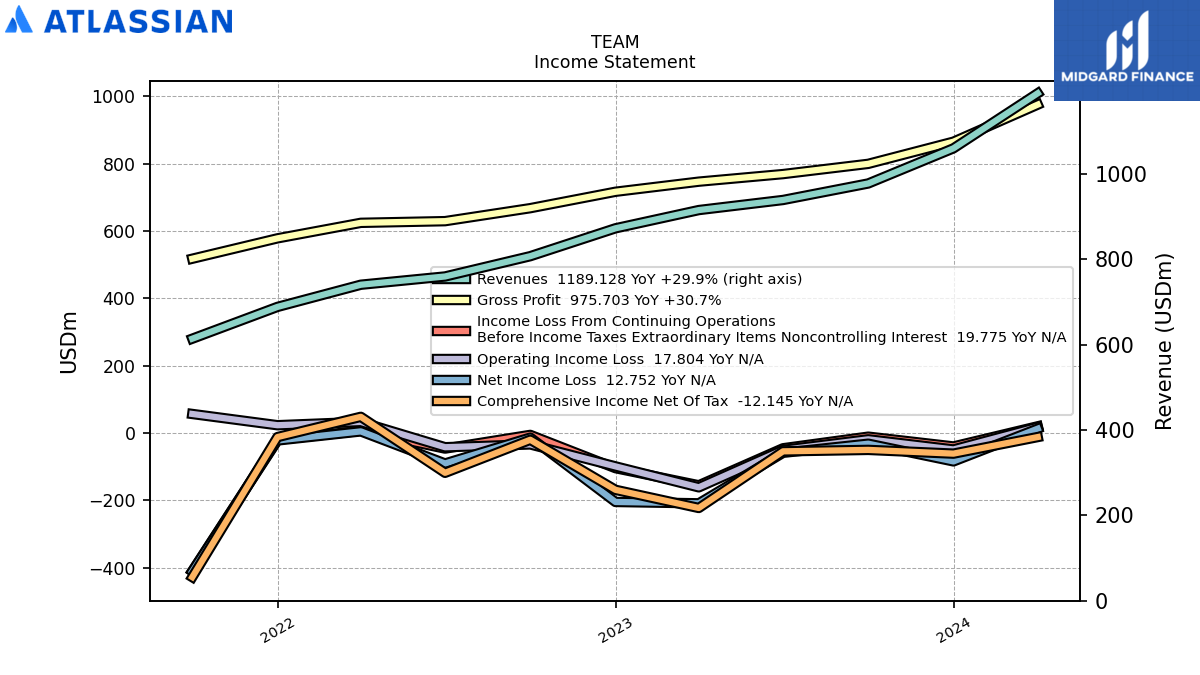
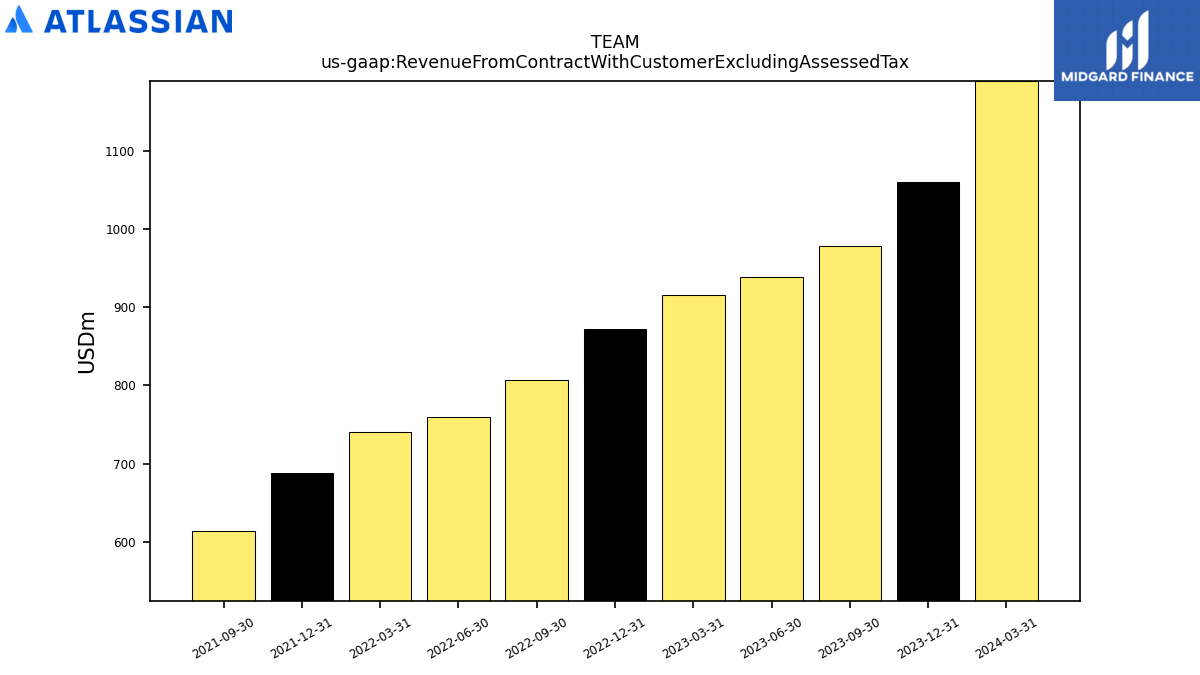
| Revenue From Contract With Customer Excluding Assessed Tax | 1189.13 | 1060.11 | 977.77 | 939.10 | 915.45 | 872.70 | 807.39 | 759.84 | 740.49 | 688.53 | 614.02 | |
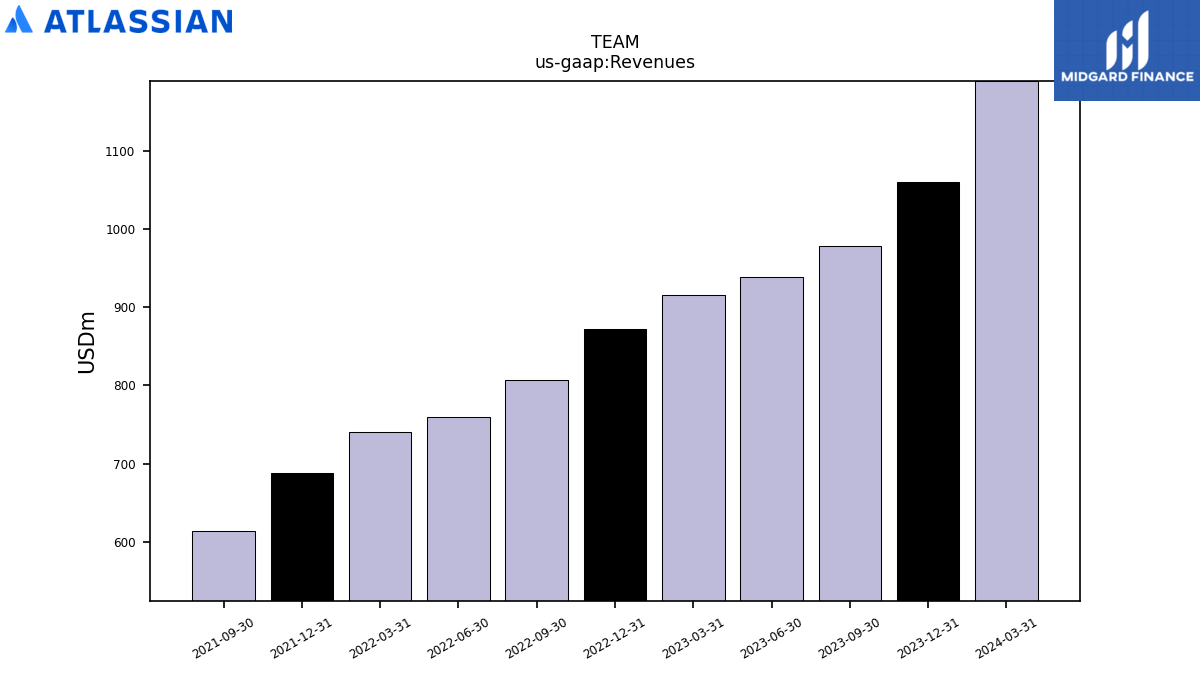
| Revenues | 1189.13 | 1060.11 | 977.77 | 939.10 | 915.45 | 872.70 | 807.39 | 759.84 | 740.49 | 688.53 | 614.02 | |
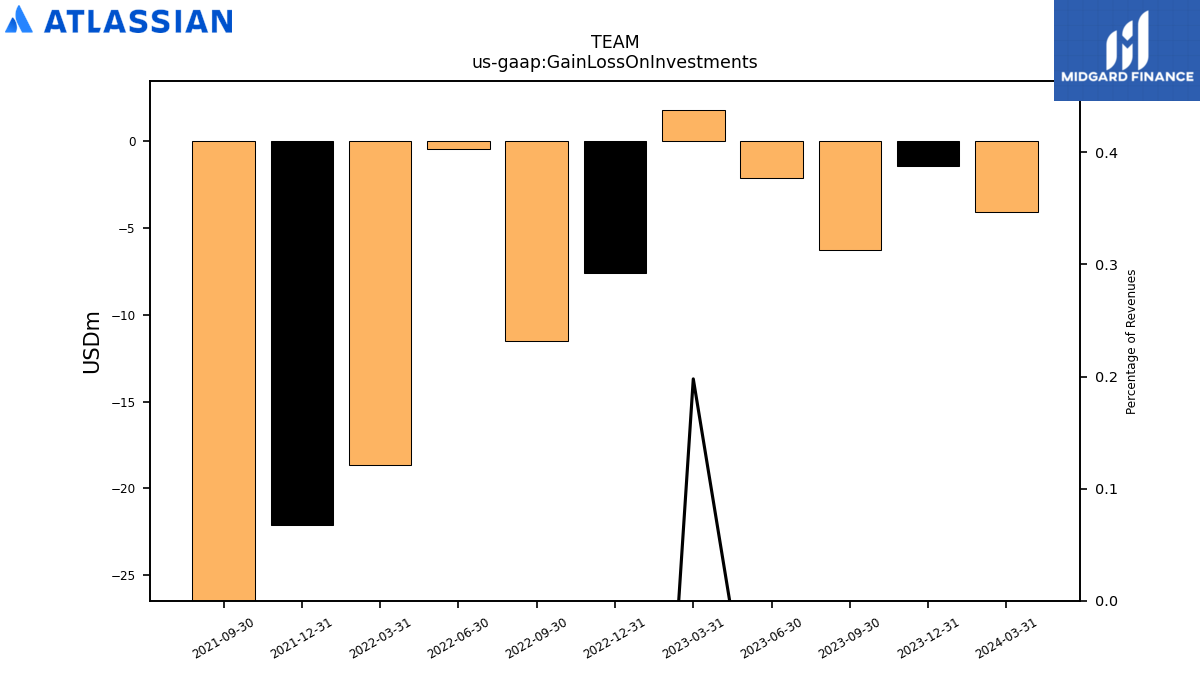
| Gain Loss On Investments | -4.06 | -1.44 | -6.25 | -2.14 | 1.81 | -7.56 | -11.51 | -0.44 | -18.66 | -22.14 | -31.42 | |
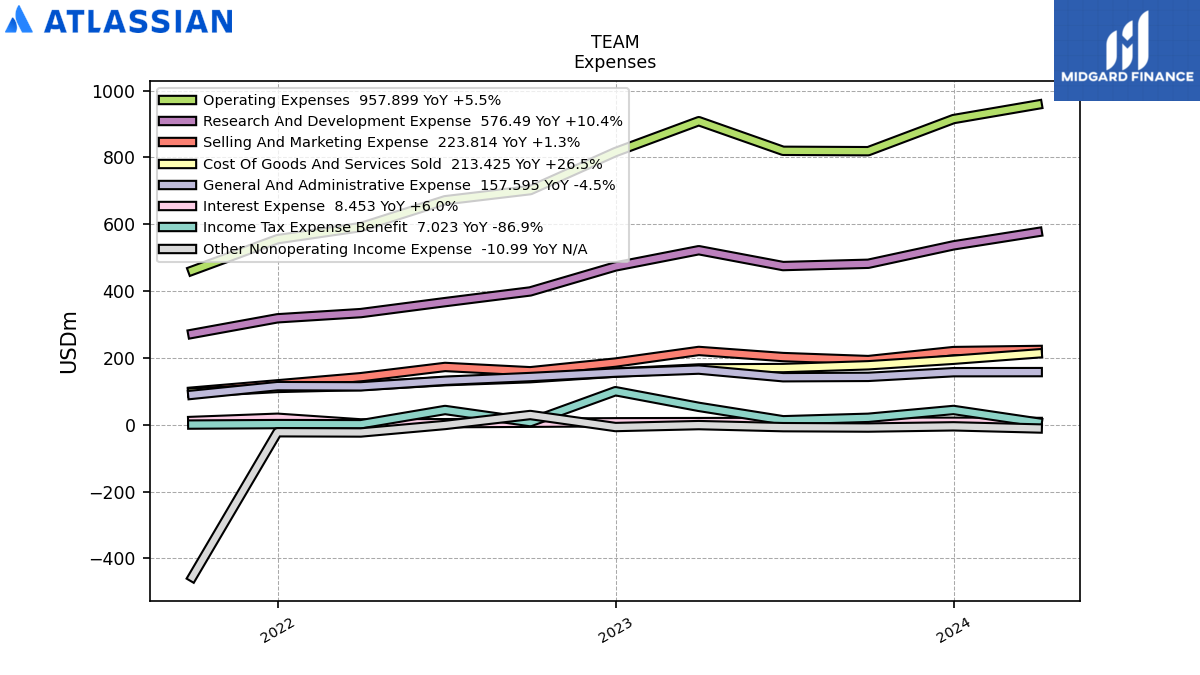
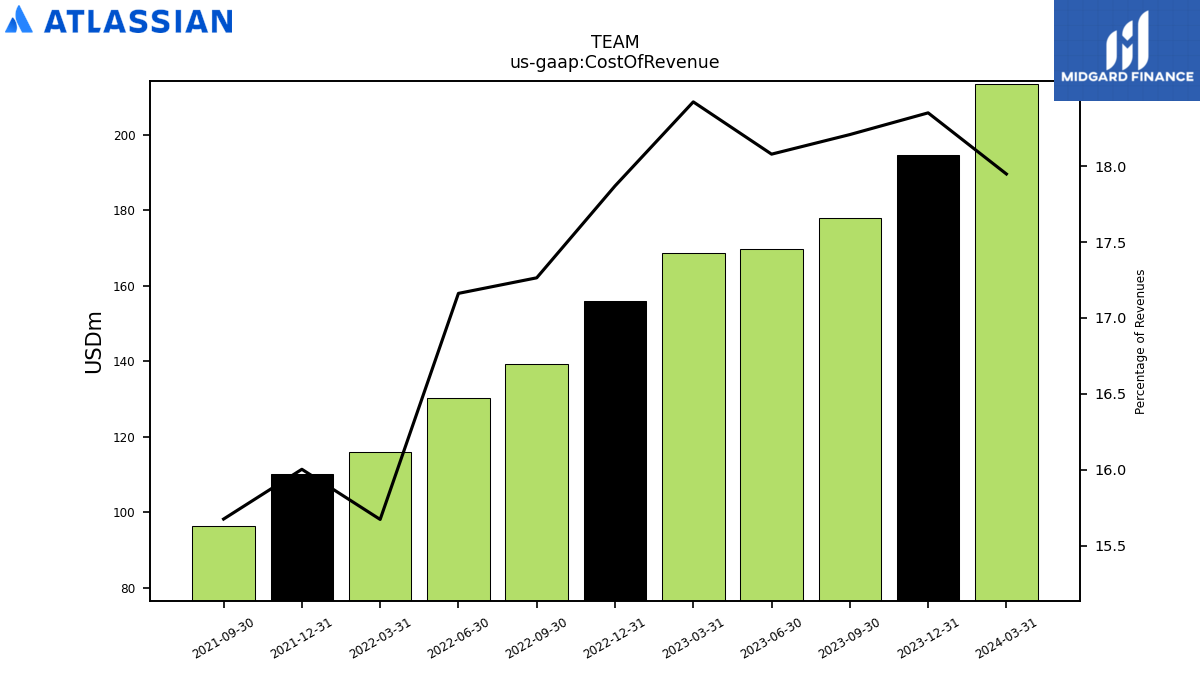
| Cost Of Revenue | 213.43 | 194.54 | 178.03 | 169.78 | 168.65 | 155.94 | 139.39 | 130.40 | 116.06 | 110.19 | 96.26 | |
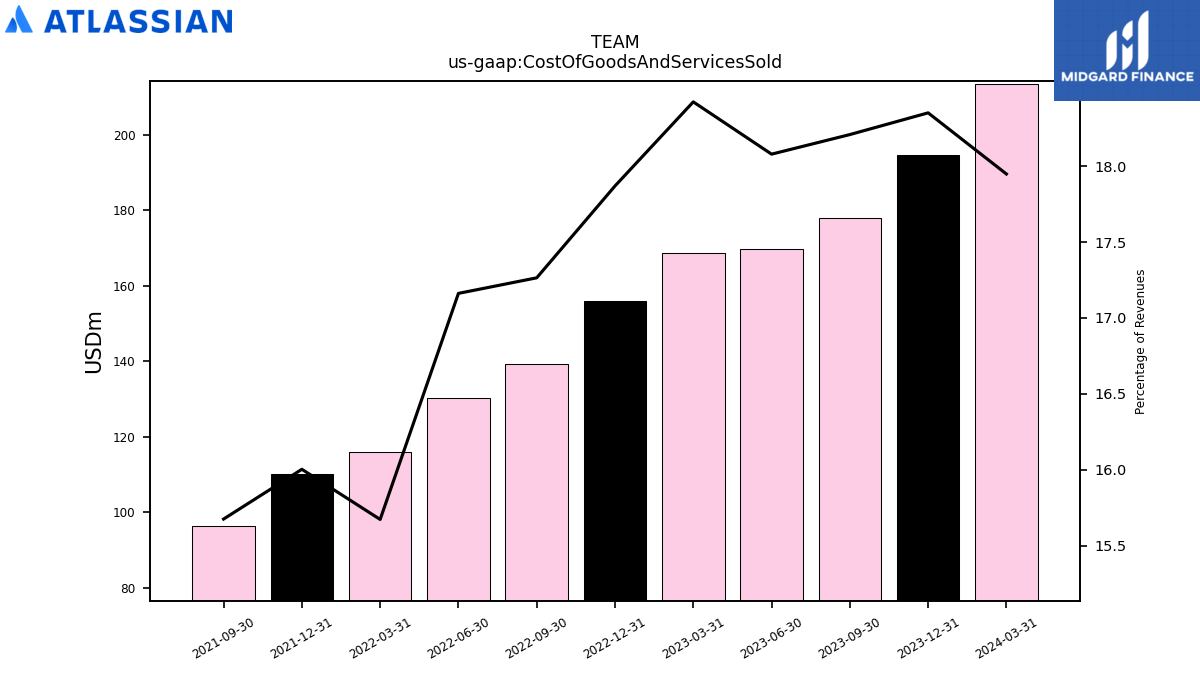
| Cost Of Goods And Services Sold | 213.43 | 194.54 | 178.03 | 169.78 | 168.65 | 155.94 | 139.39 | 130.40 | 116.06 | 110.19 | 96.26 | |
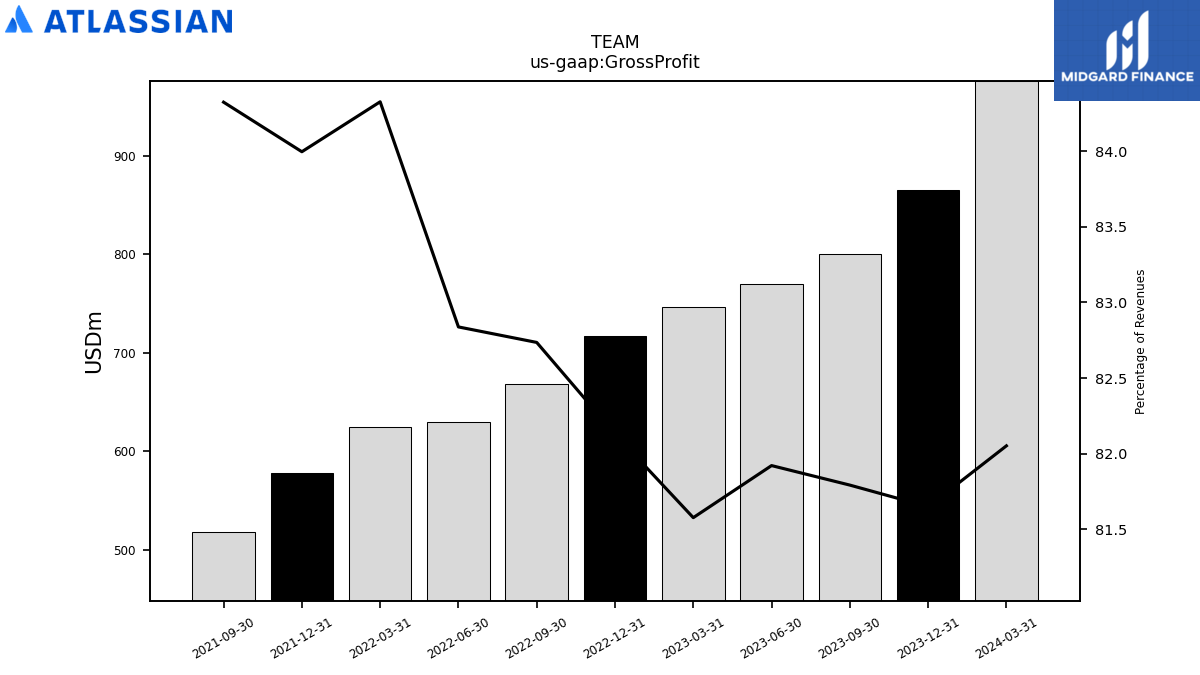
| Gross Profit | 975.70 | 865.57 | 799.75 | 769.32 | 746.80 | 716.76 | 668.00 | 629.44 | 624.43 | 578.34 | 517.77 | |
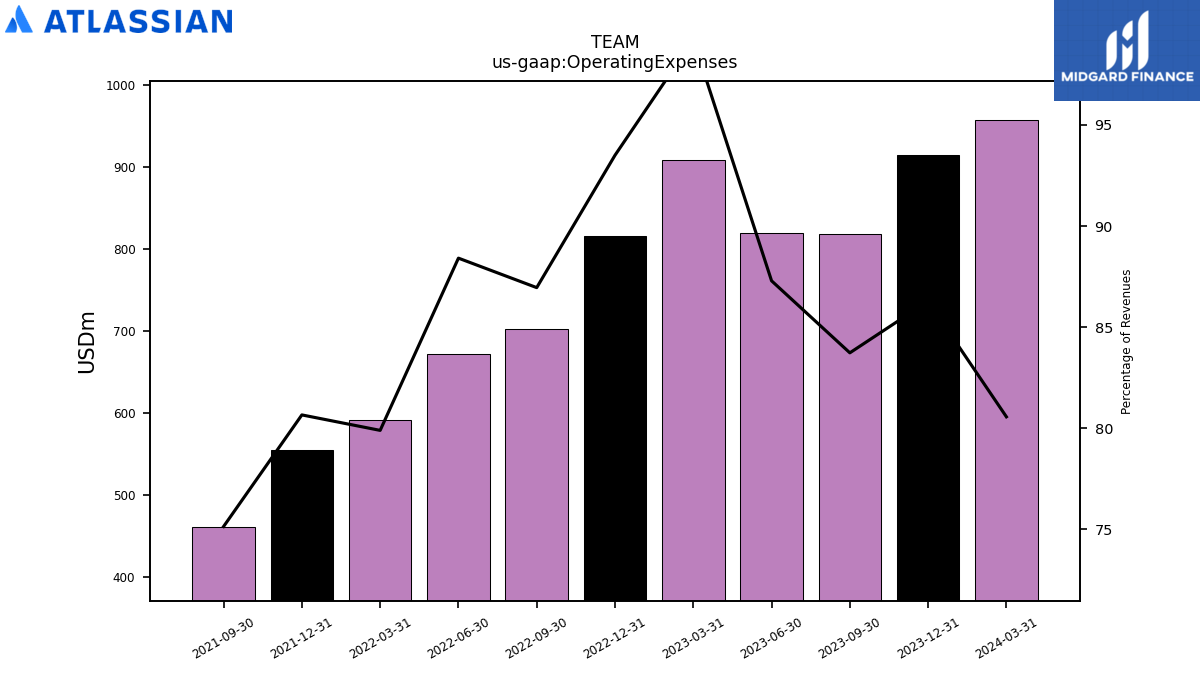
| Operating Expenses | 957.90 | 914.64 | 818.62 | 819.71 | 908.37 | 816.00 | 702.03 | 671.77 | 591.53 | 555.29 | 461.29 | |
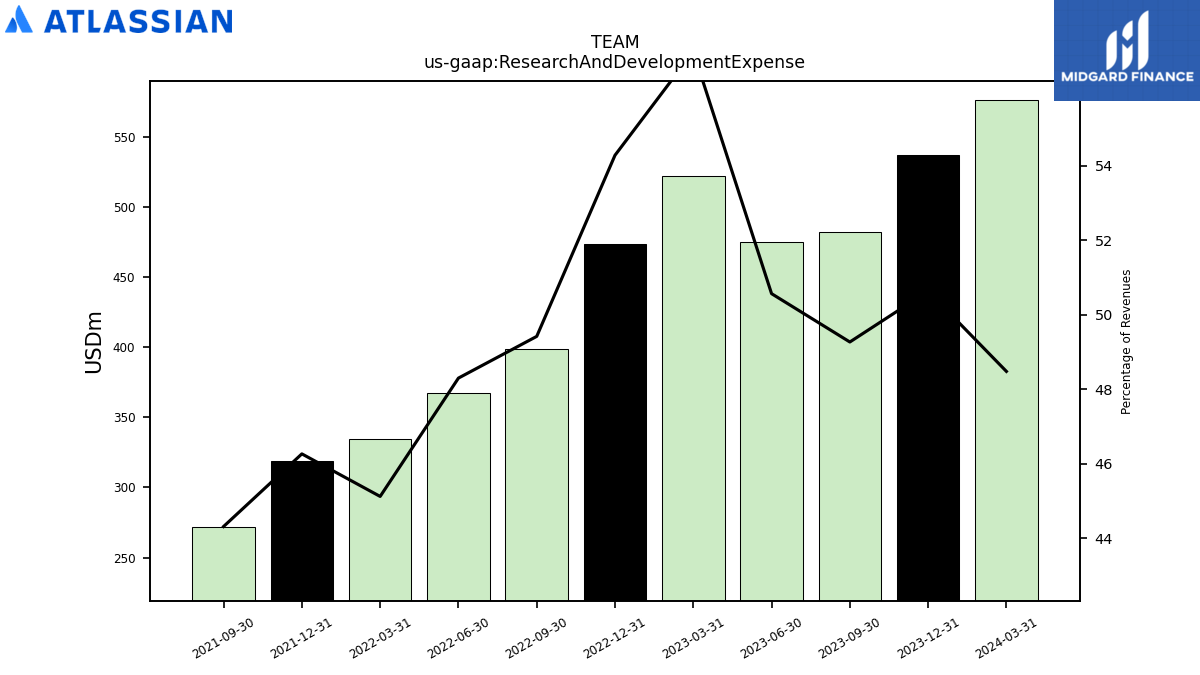
| Research And Development Expense | 576.49 | 536.78 | 481.74 | 474.86 | 522.34 | 473.68 | 399.01 | 367.01 | 334.16 | 318.57 | 272.14 | |
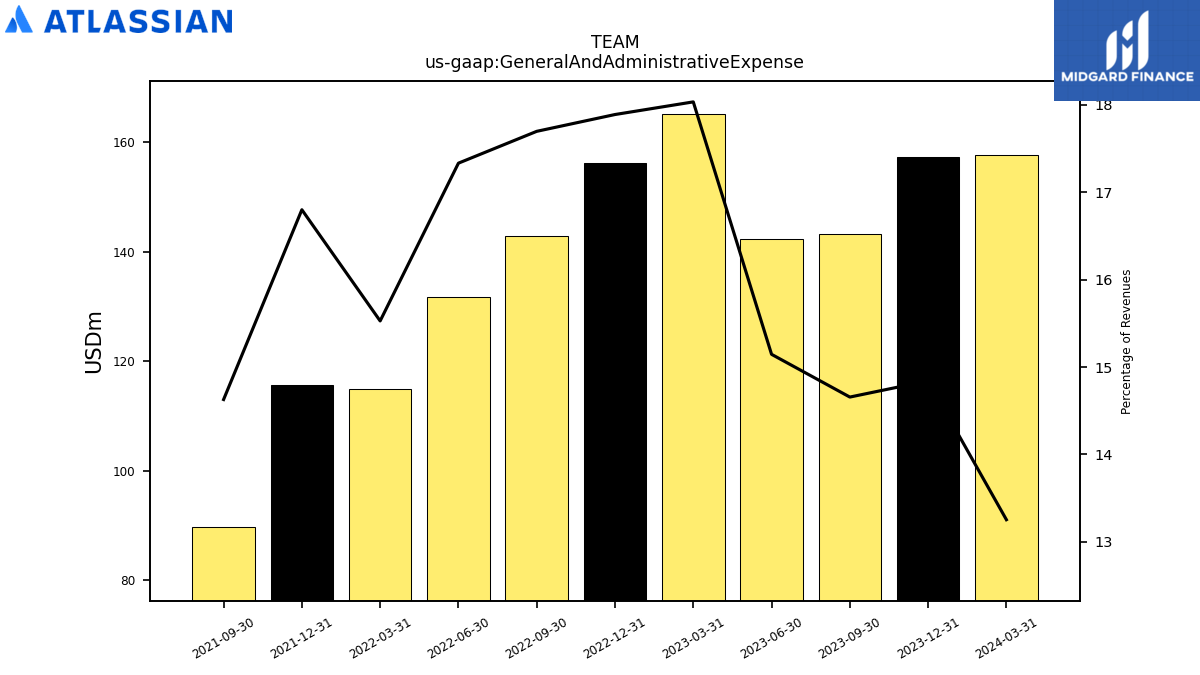
| General And Administrative Expense | 157.59 | 157.34 | 143.31 | 142.24 | 165.10 | 156.13 | 142.89 | 131.71 | 114.98 | 115.68 | 89.82 | |
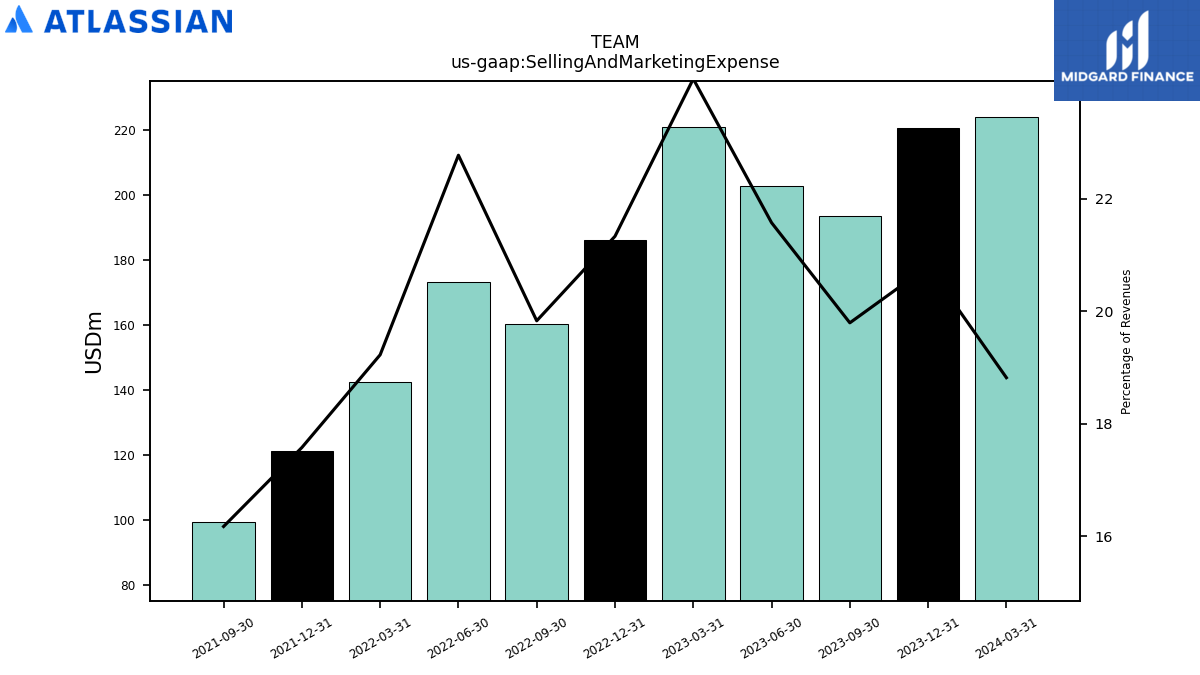
| Selling And Marketing Expense | 223.81 | 220.51 | 193.57 | 202.62 | 220.92 | 186.19 | 160.13 | 173.05 | 142.39 | 121.05 | 99.33 | |
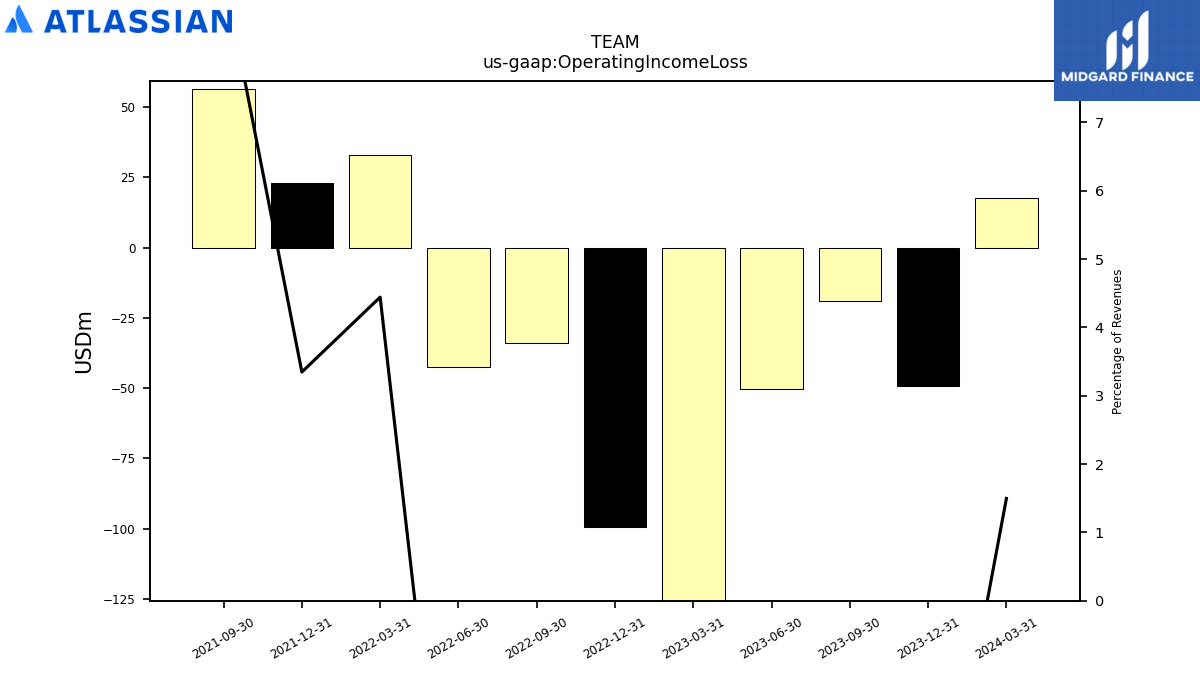
| Operating Income Loss | 17.80 | -49.06 | -18.87 | -50.39 | -161.57 | -99.24 | -34.03 | -42.33 | 32.90 | 23.04 | 56.48 | |
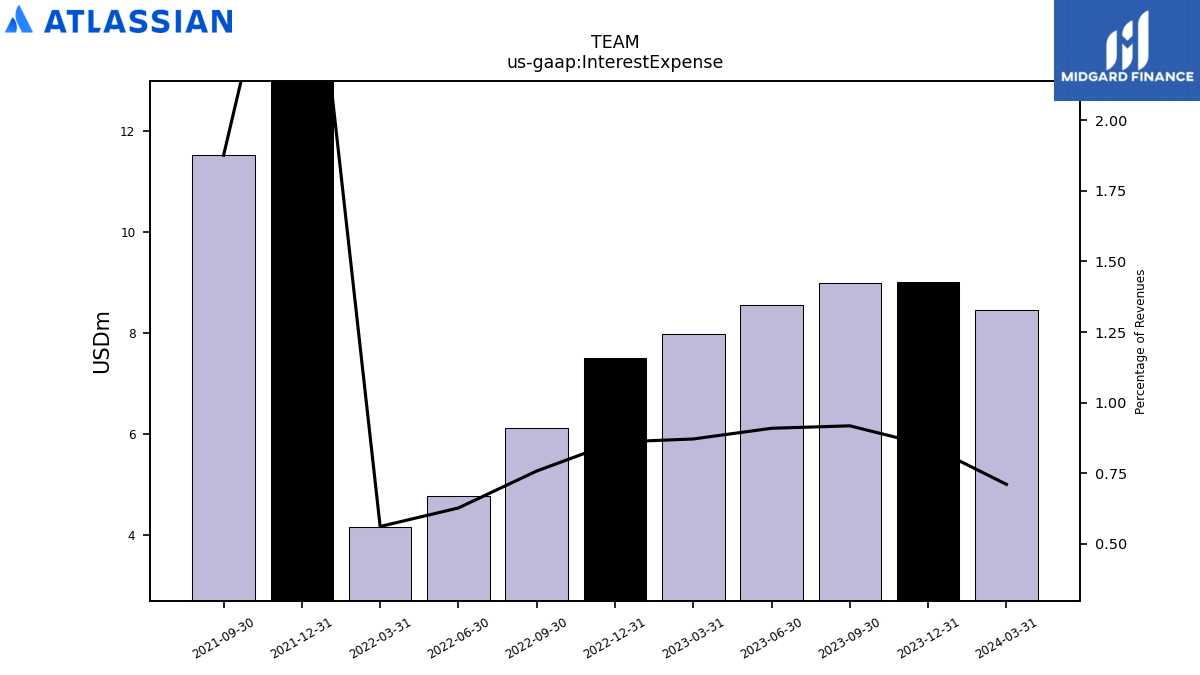
| Interest Expense | 8.45 | 9.00 | 8.98 | 8.54 | 7.98 | 7.51 | 6.12 | 4.77 | 4.16 | 21.02 | 11.52 | |
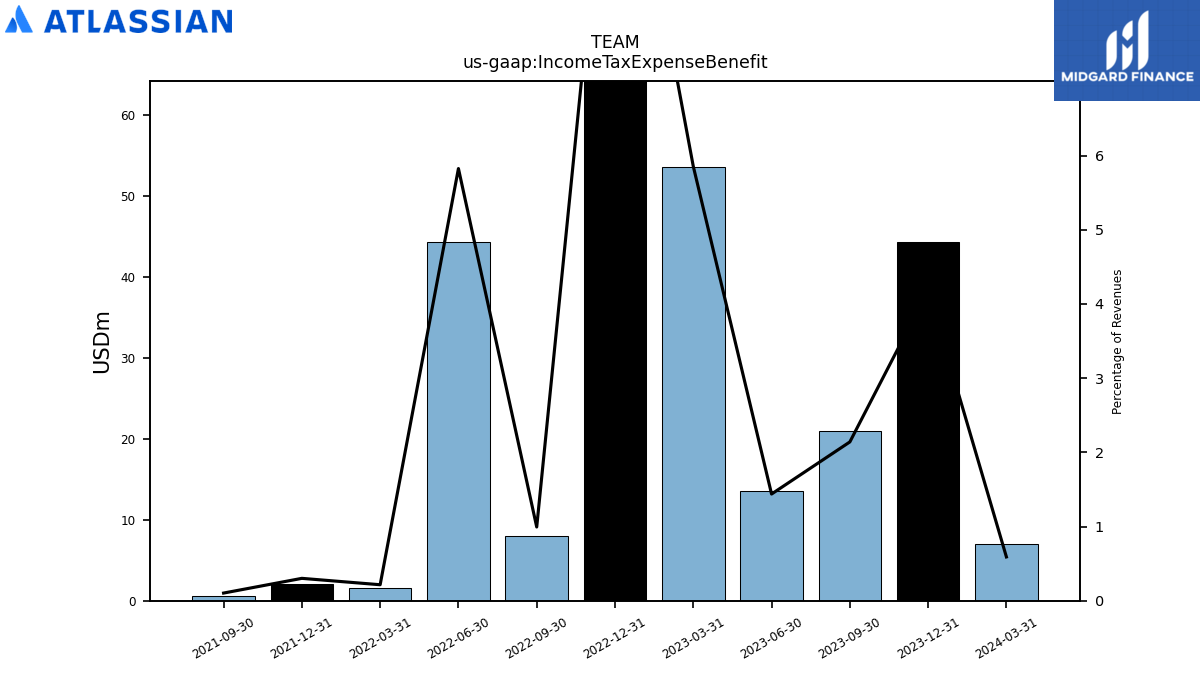
| Income Tax Expense Benefit | 7.02 | 44.36 | 20.93 | 13.51 | 53.60 | 100.50 | 8.03 | 44.26 | 1.60 | 2.08 | 0.64 | |
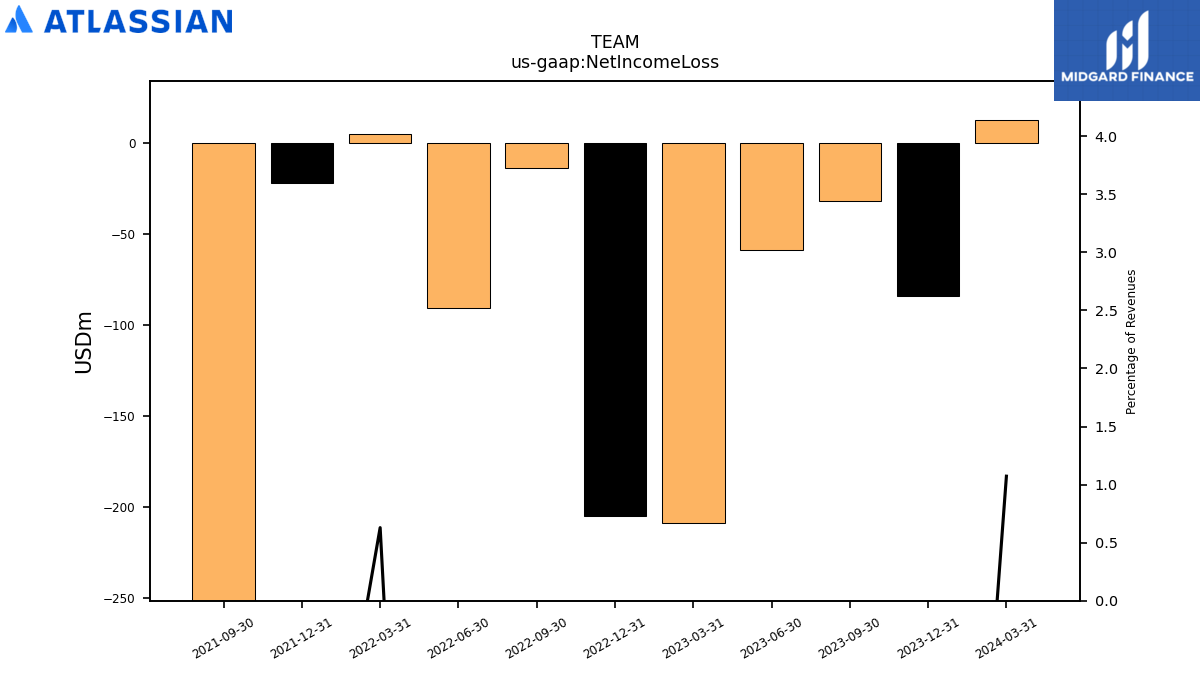
| Net Income Loss | 12.75 | -84.47 | -31.88 | -58.95 | -209.04 | -205.03 | -13.74 | -90.64 | 4.66 | -22.33 | -411.20 | |
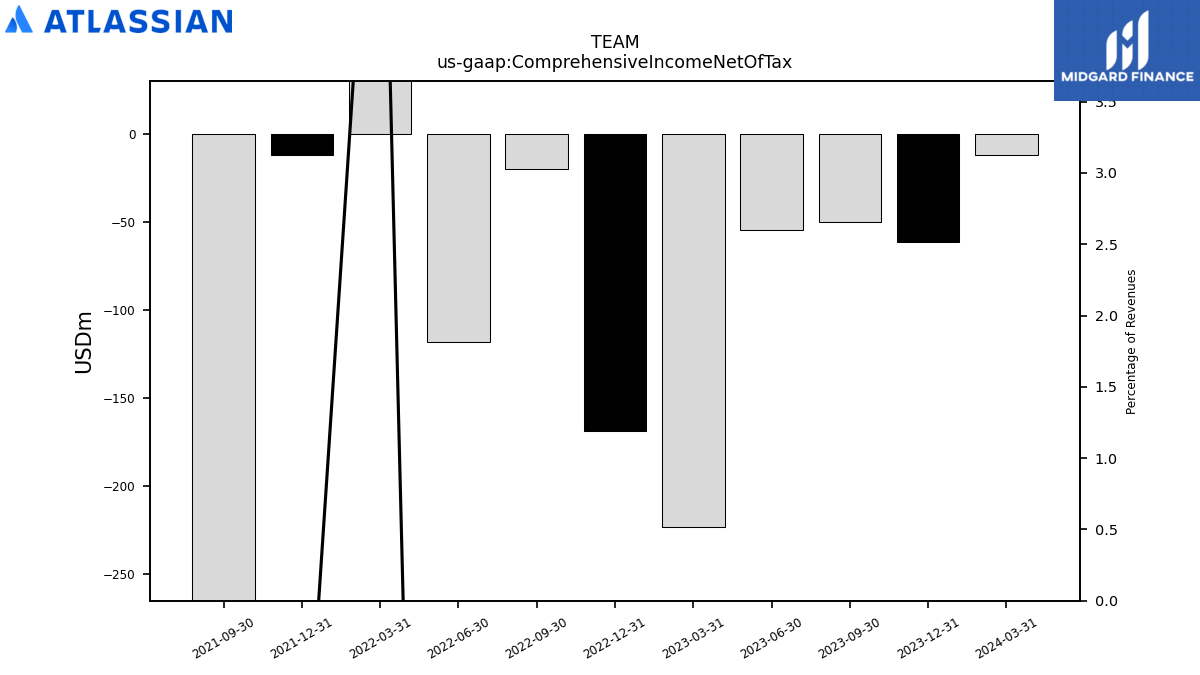
| Comprehensive Income Net Of Tax | -12.14 | -61.40 | -50.29 | -54.56 | -222.94 | -168.91 | -20.21 | -118.43 | 47.99 | -12.21 | -428.36 |
| 2024-03-31 | 2023-12-31 | 2023-09-30 | 2023-06-30 | 2023-03-31 | 2022-12-31 | 2022-09-30 | 2022-06-30 | 2022-03-31 | 2021-12-31 | 2021-09-30 | ||
|---|---|---|---|---|---|---|---|---|---|---|---|---|
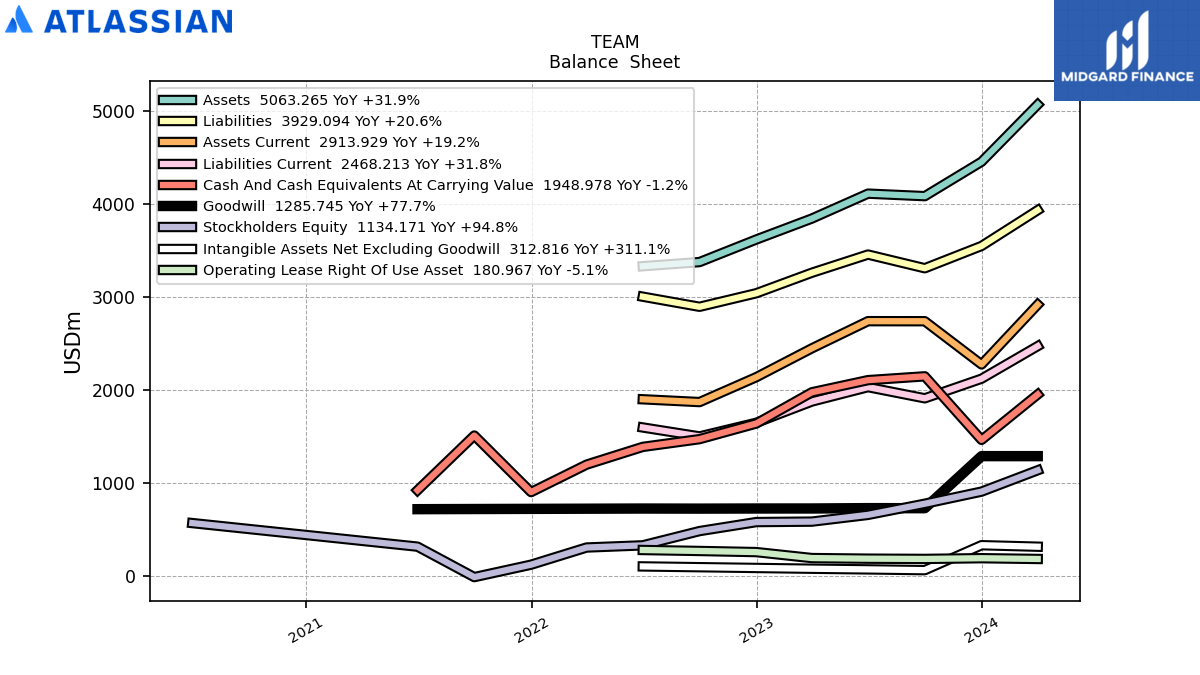
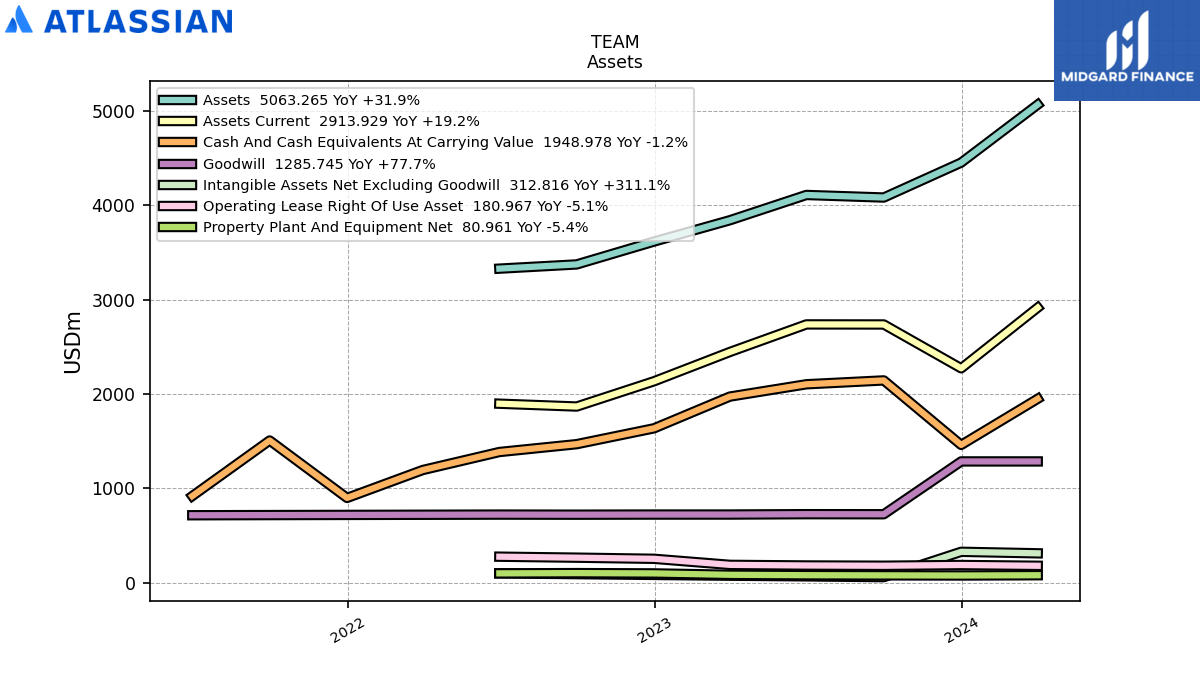
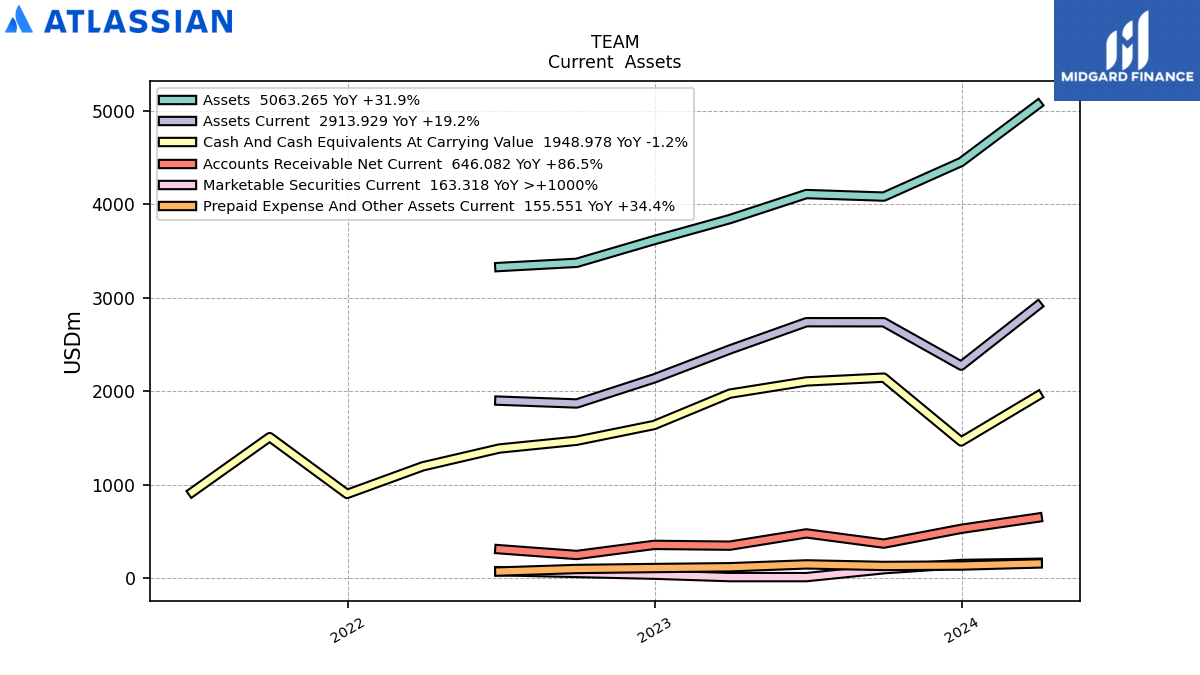
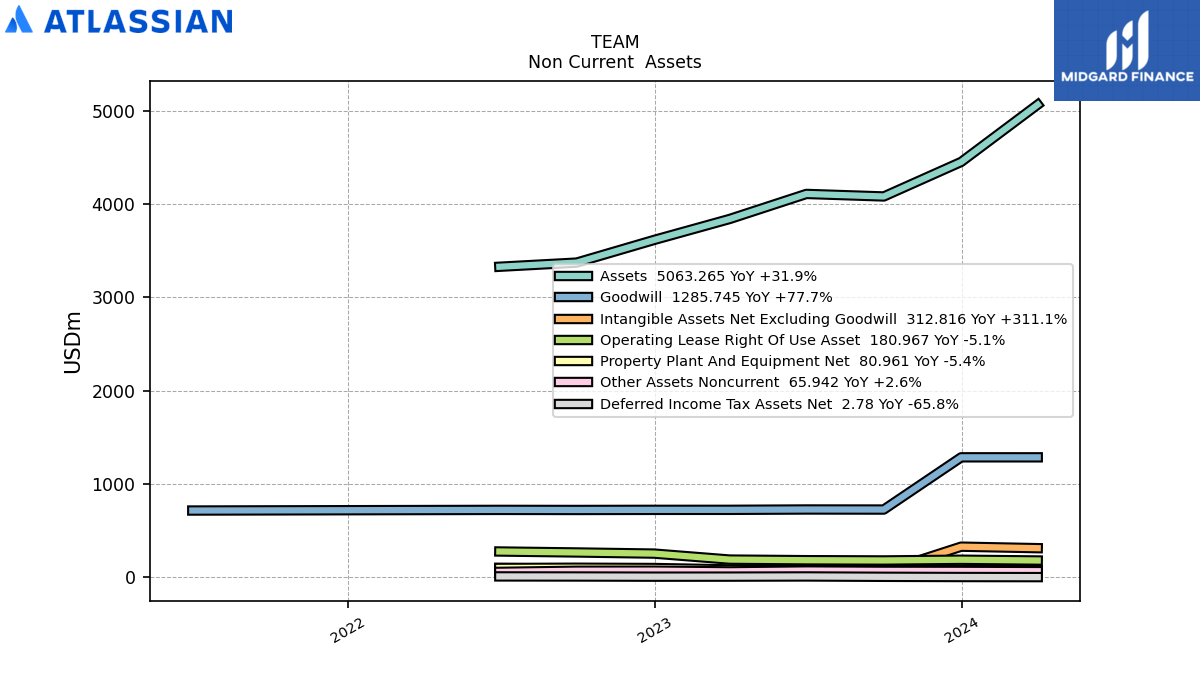
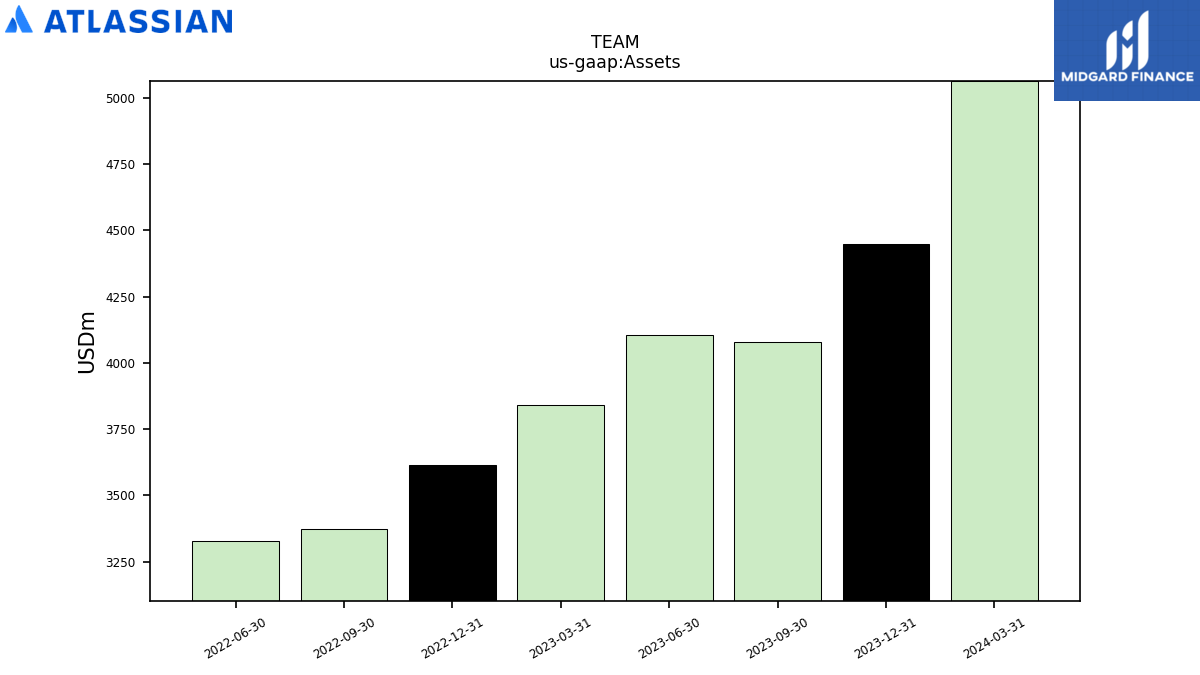
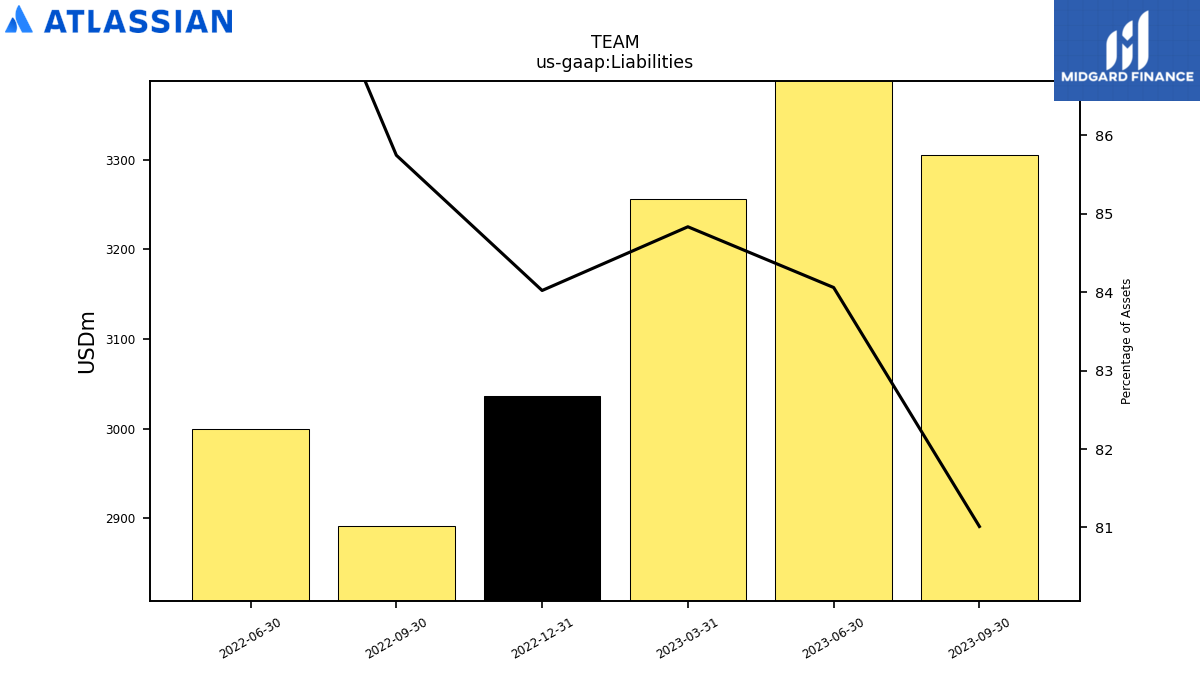
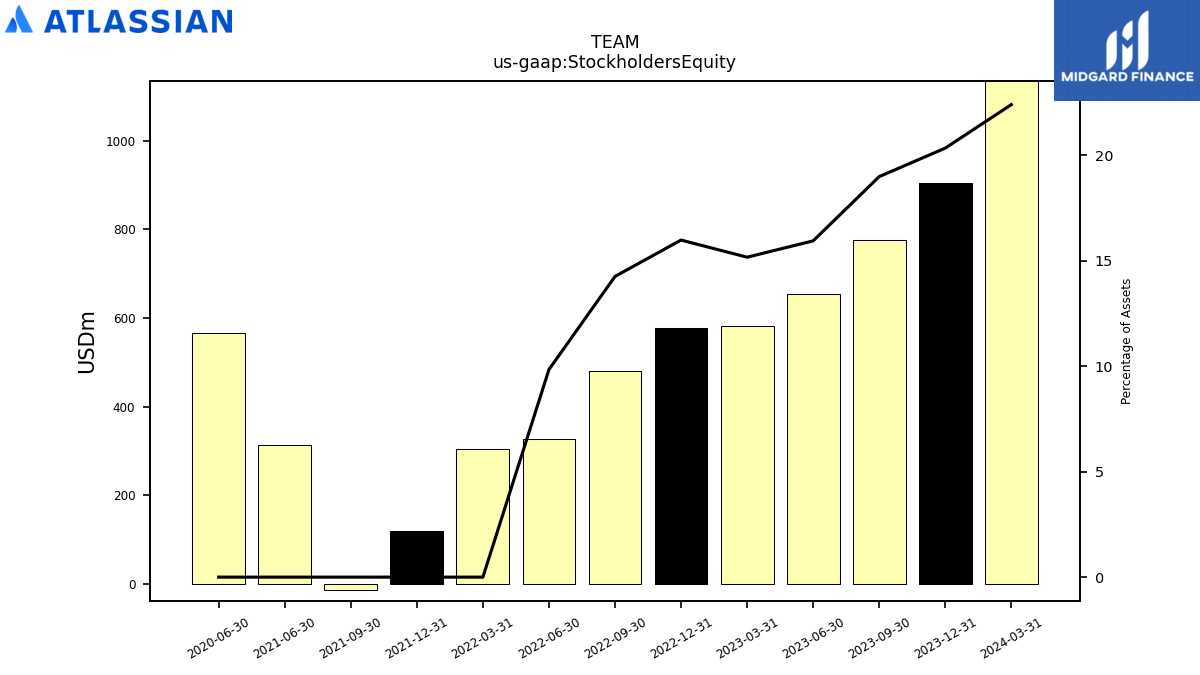
| Assets | 5063.27 | 4449.50 | 4079.64 | 4106.78 | 3839.01 | 3614.01 | 3371.43 | 3326.83 | NA | NA | NA | |
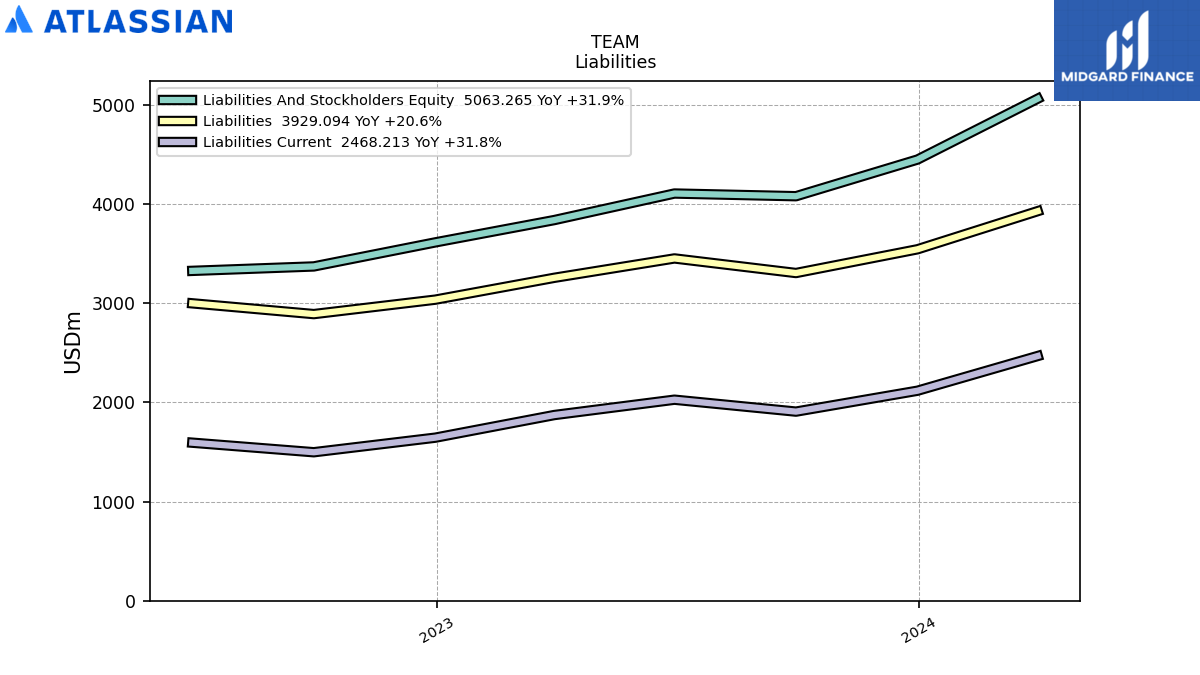
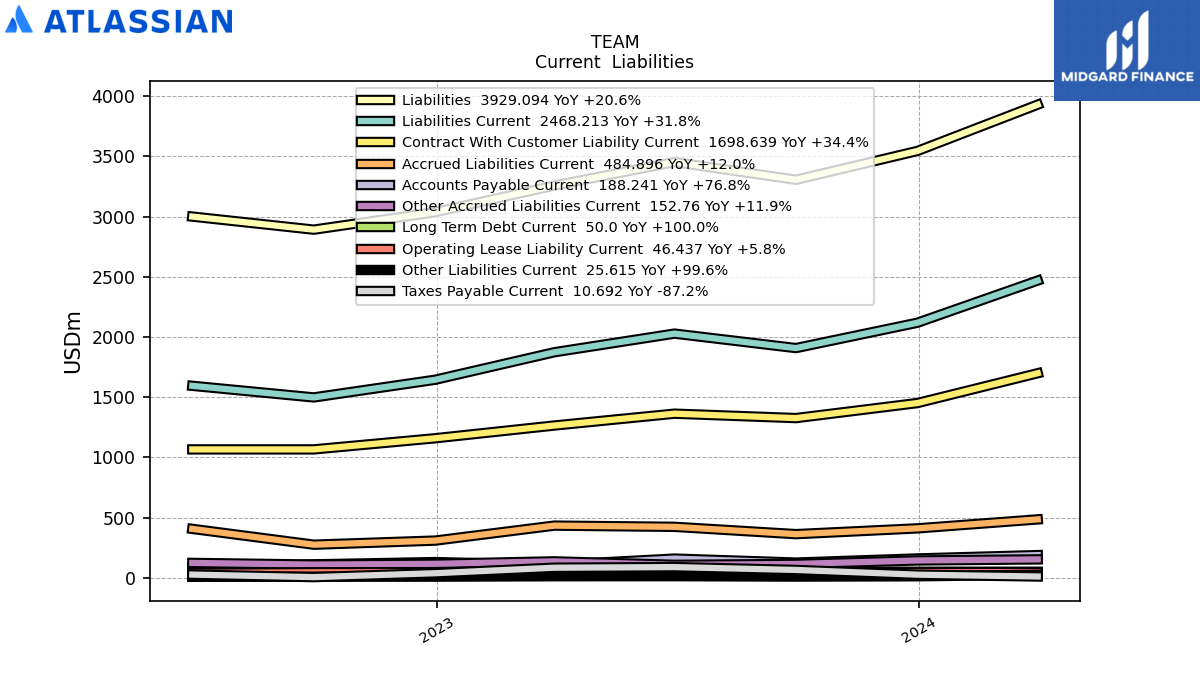
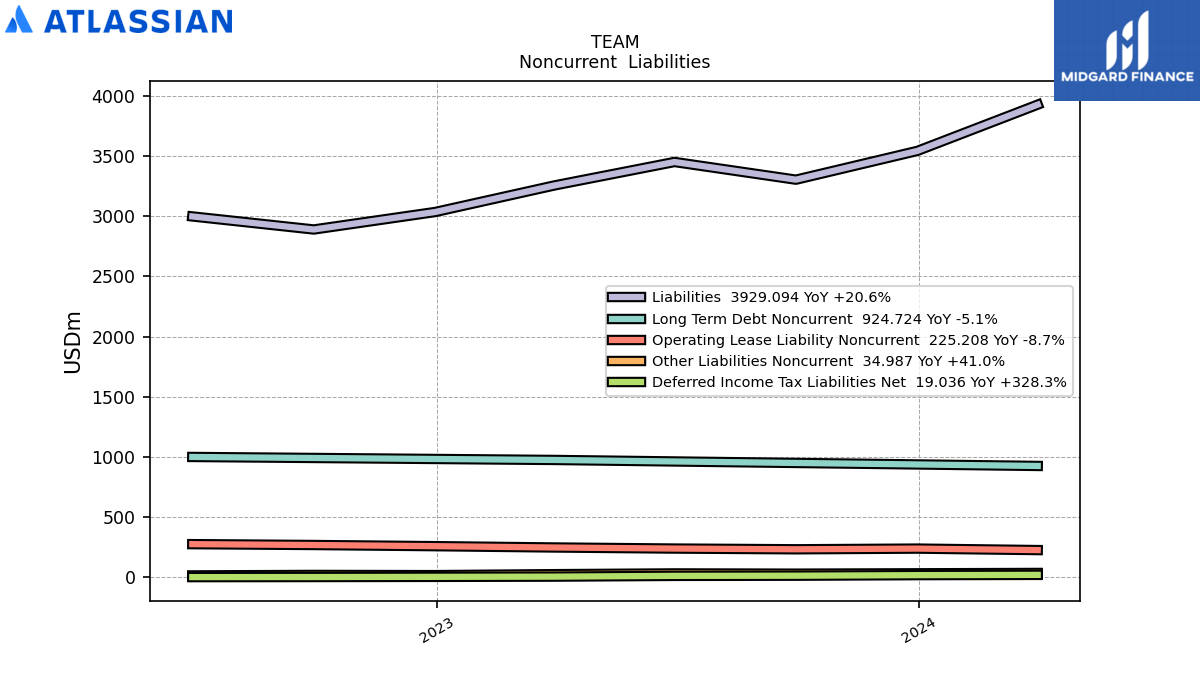
| Liabilities | 3929.09 | 3544.57 | 3305.01 | 3452.11 | 3256.74 | 3036.52 | 2890.82 | 2999.46 | NA | NA | NA | |
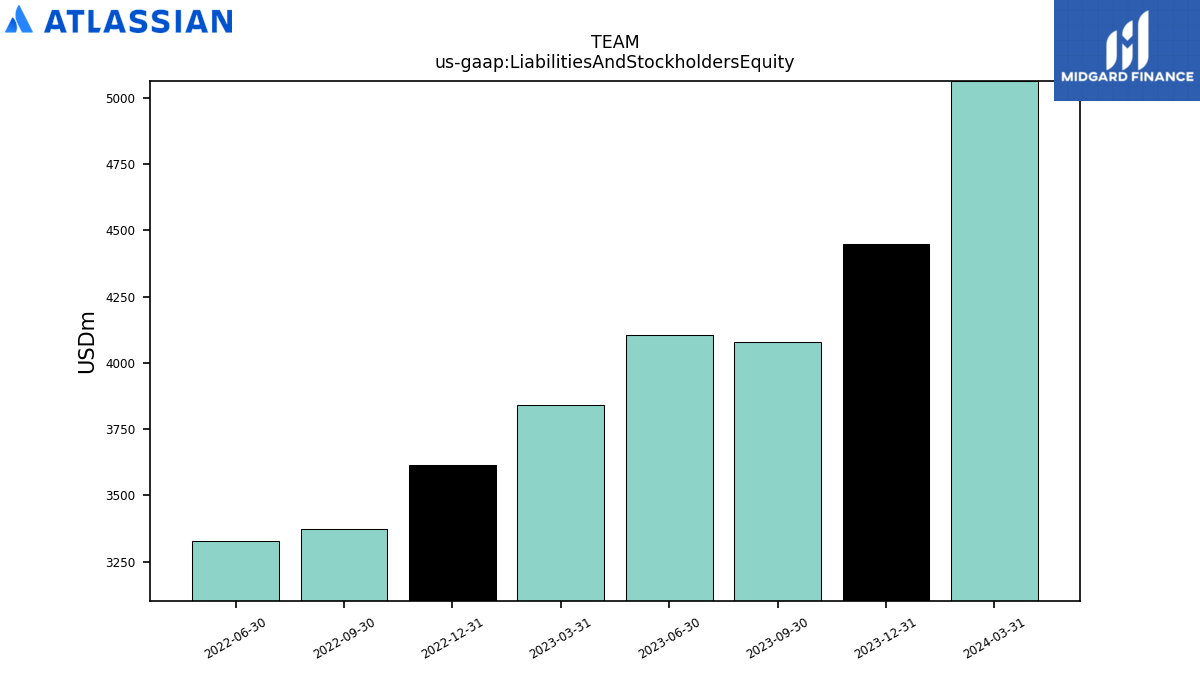
| Liabilities And Stockholders Equity | 5063.27 | 4449.50 | 4079.64 | 4106.78 | 3839.01 | 3614.01 | 3371.43 | 3326.83 | NA | NA | NA | |
| Stockholders Equity | 1134.17 | 904.92 | 774.62 | 654.67 | 582.27 | 577.49 | 480.61 | 327.37 | 304.02 | 119.53 | -14.15 |
| 2024-03-31 | 2023-12-31 | 2023-09-30 | 2023-06-30 | 2023-03-31 | 2022-12-31 | 2022-09-30 | 2022-06-30 | 2022-03-31 | 2021-12-31 | 2021-09-30 | ||
|---|---|---|---|---|---|---|---|---|---|---|---|---|
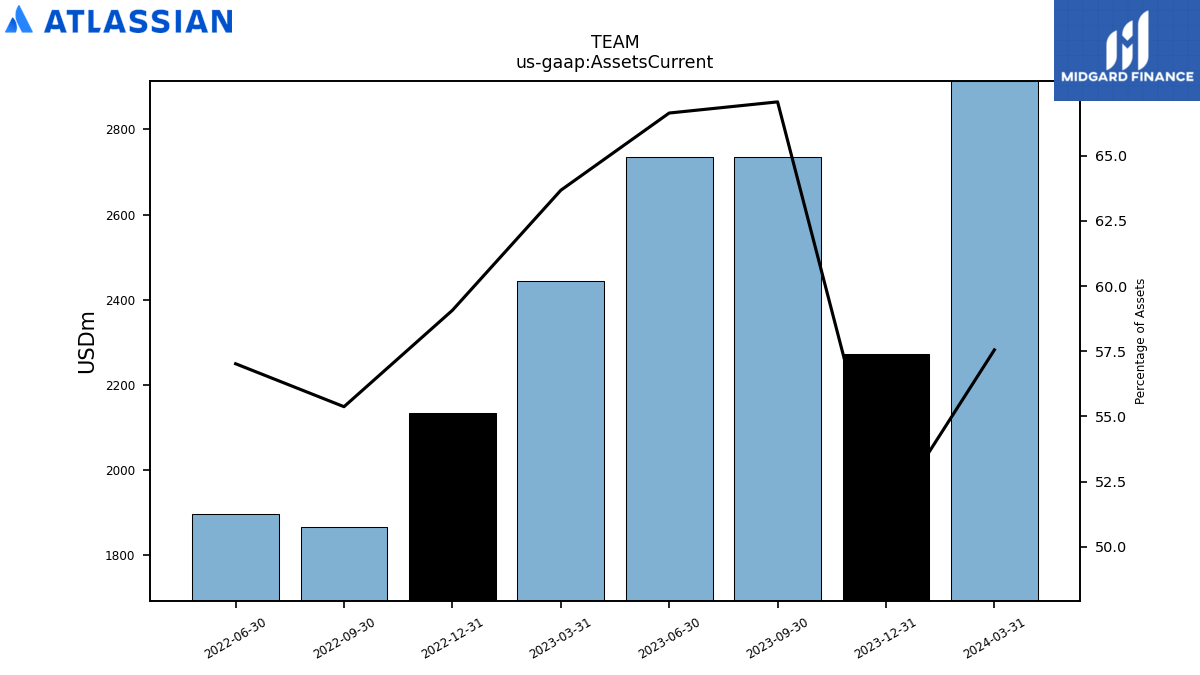
| Assets Current | 2913.93 | 2271.54 | 2735.70 | 2736.36 | 2444.29 | 2134.76 | 1866.89 | 1896.95 | NA | NA | NA | |
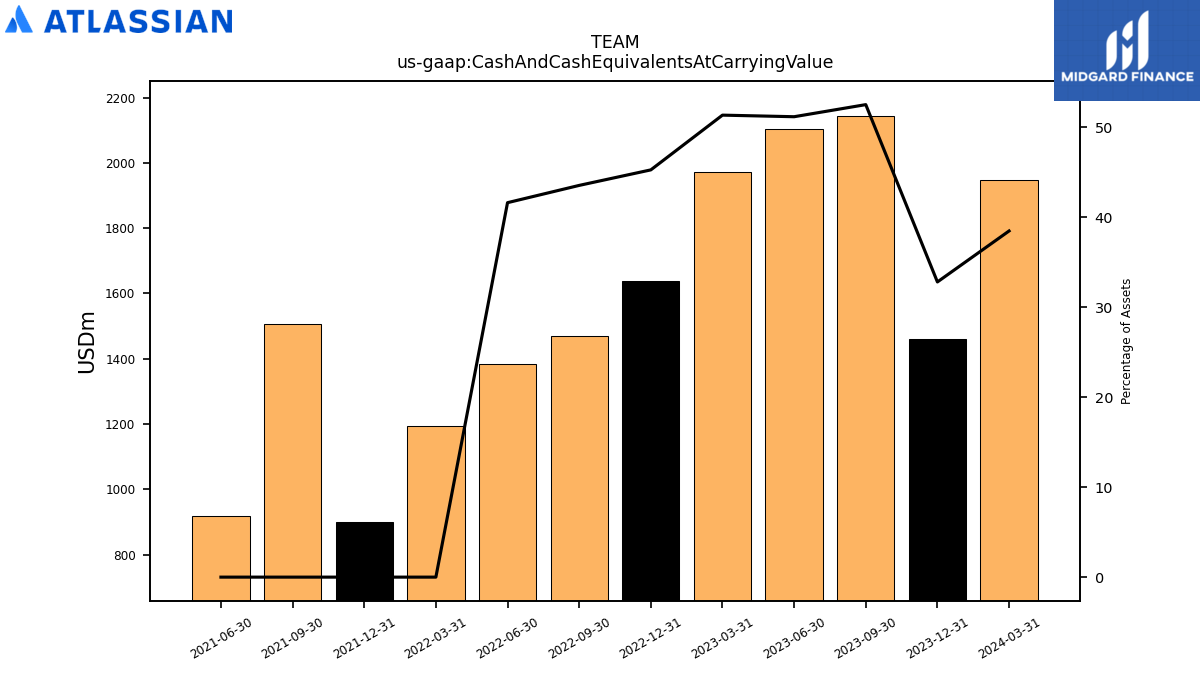
| Cash And Cash Equivalents At Carrying Value | 1948.98 | 1460.50 | 2143.53 | 2102.55 | 1972.22 | 1636.62 | 1468.57 | 1385.27 | 1194.80 | 899.39 | 1507.42 | |
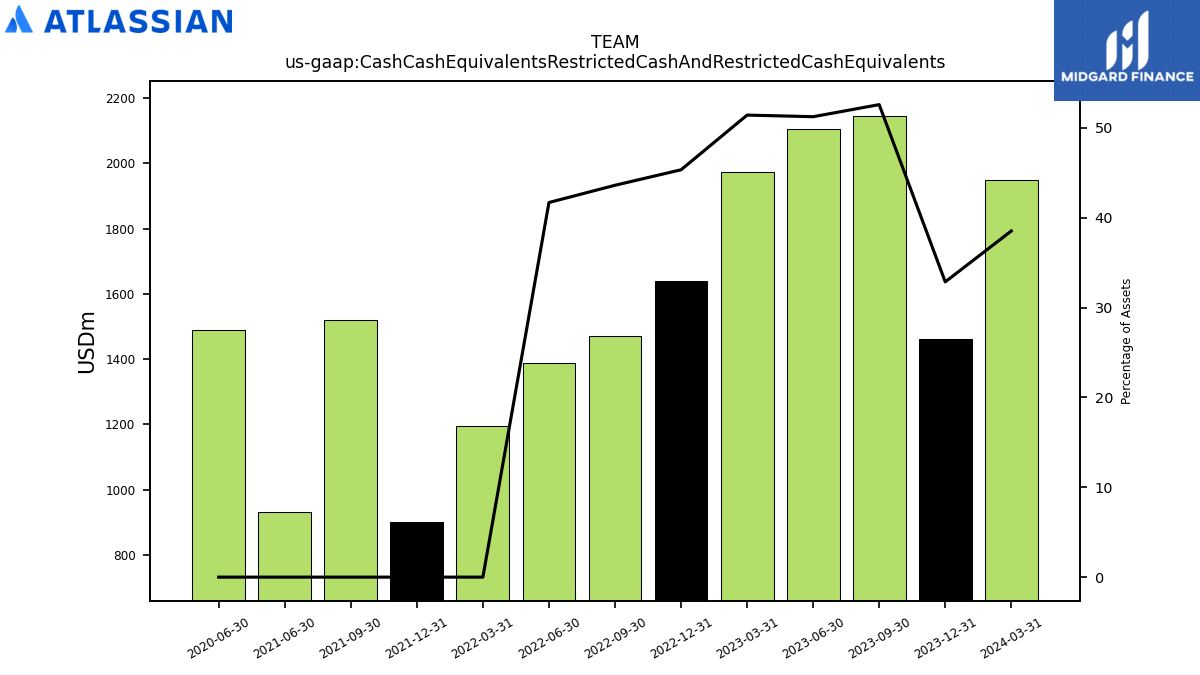
| Cash Cash Equivalents Restricted Cash And Restricted Cash Equivalents | 1950.19 | 1461.76 | 2144.81 | 2103.91 | 1973.58 | 1637.97 | 1469.95 | 1386.69 | 1195.46 | 900.07 | 1519.21 | |
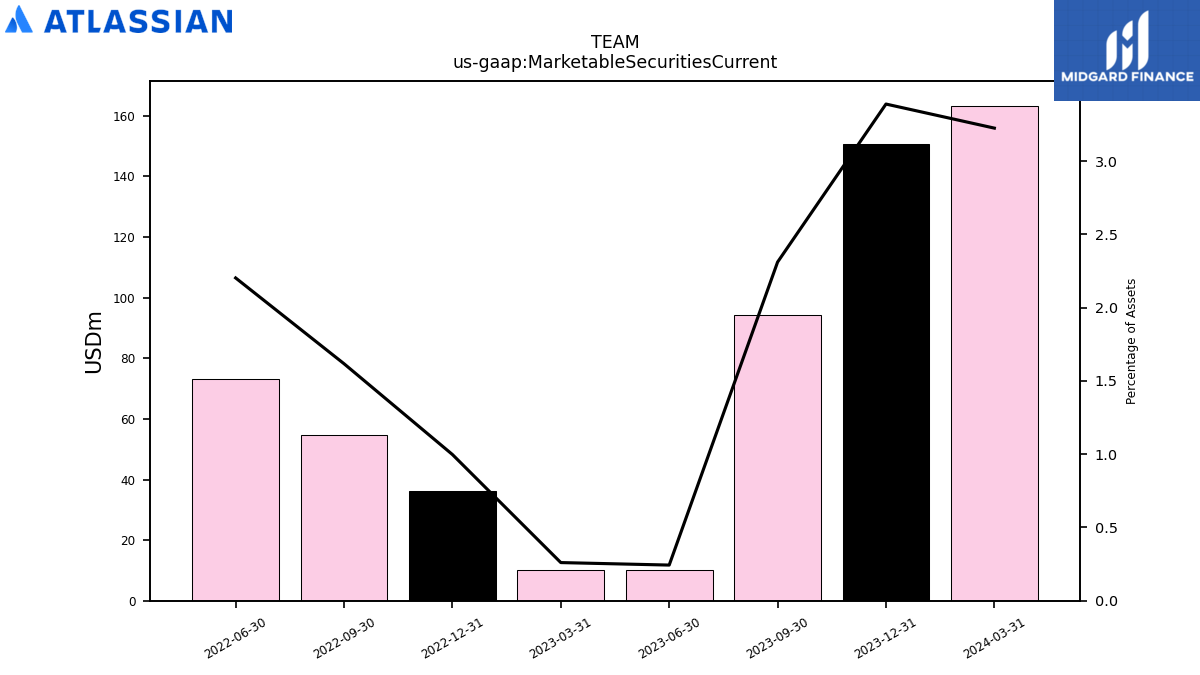
| Marketable Securities Current | 163.32 | 150.83 | 94.30 | 10.00 | 10.00 | 36.07 | 54.54 | 73.29 | NA | NA | NA | |
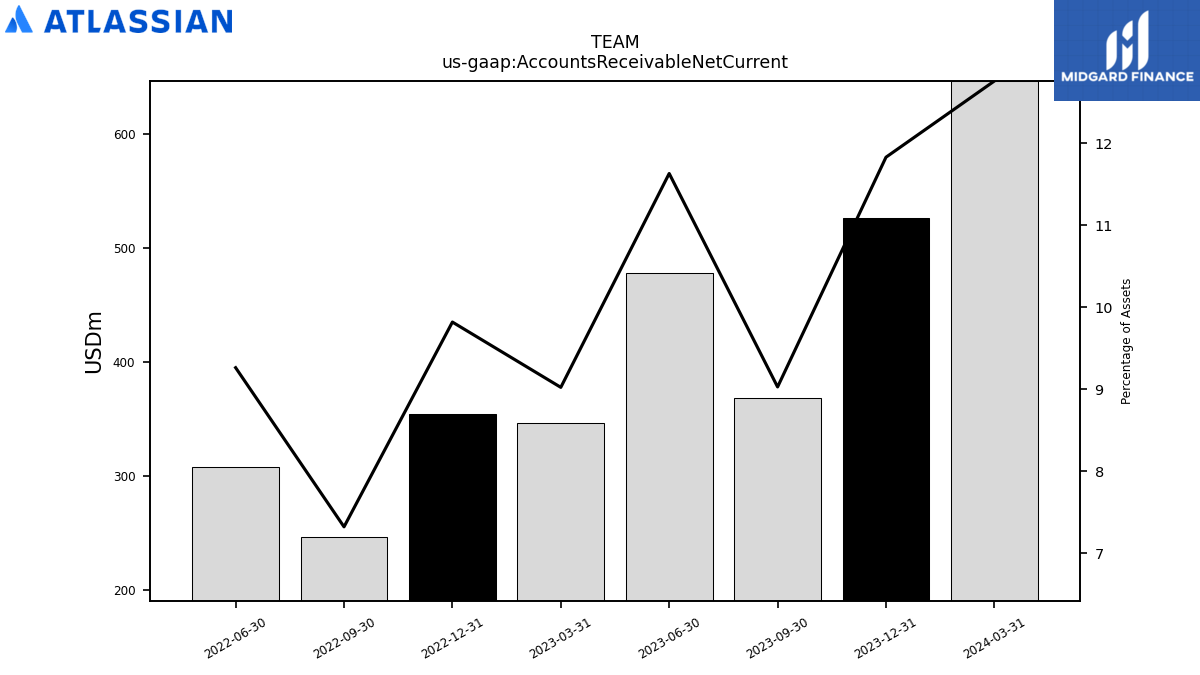
| Accounts Receivable Net Current | 646.08 | 526.38 | 368.26 | 477.68 | 346.35 | 354.84 | 246.78 | 308.13 | NA | NA | NA | |
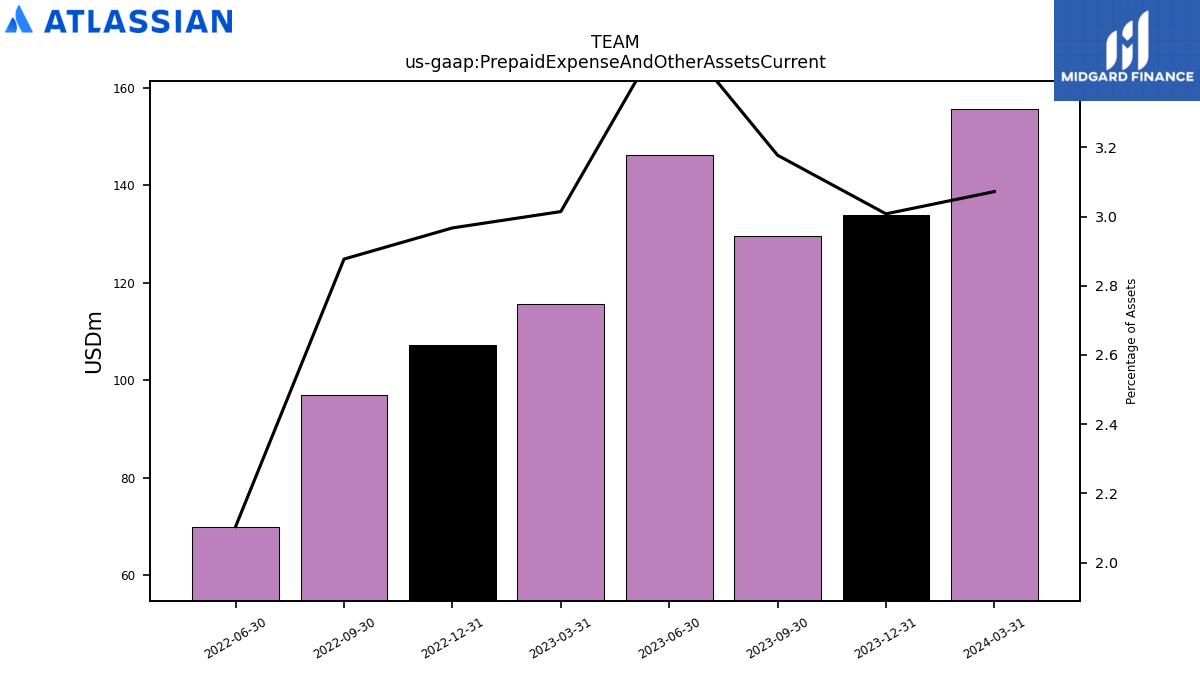
| Prepaid Expense And Other Assets Current | 155.55 | 133.83 | 129.62 | 146.14 | 115.72 | 107.23 | 97.00 | 70.00 | NA | NA | NA |
| 2024-03-31 | 2023-12-31 | 2023-09-30 | 2023-06-30 | 2023-03-31 | 2022-12-31 | 2022-09-30 | 2022-06-30 | 2022-03-31 | 2021-12-31 | 2021-09-30 | ||
|---|---|---|---|---|---|---|---|---|---|---|---|---|
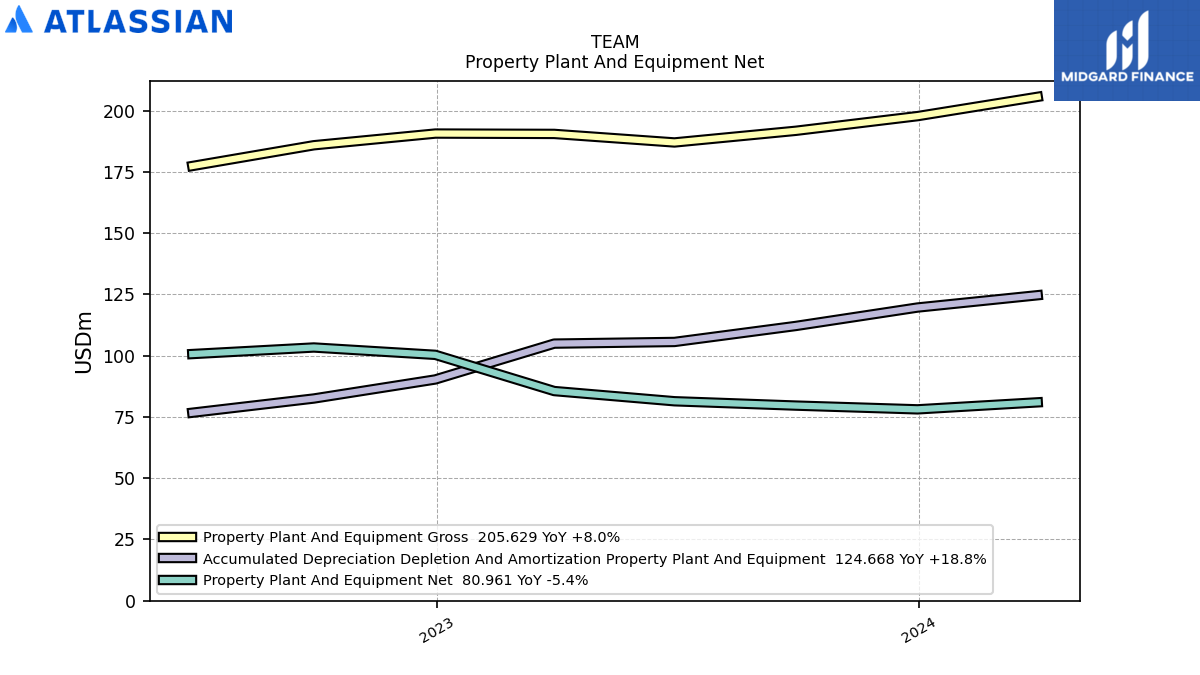
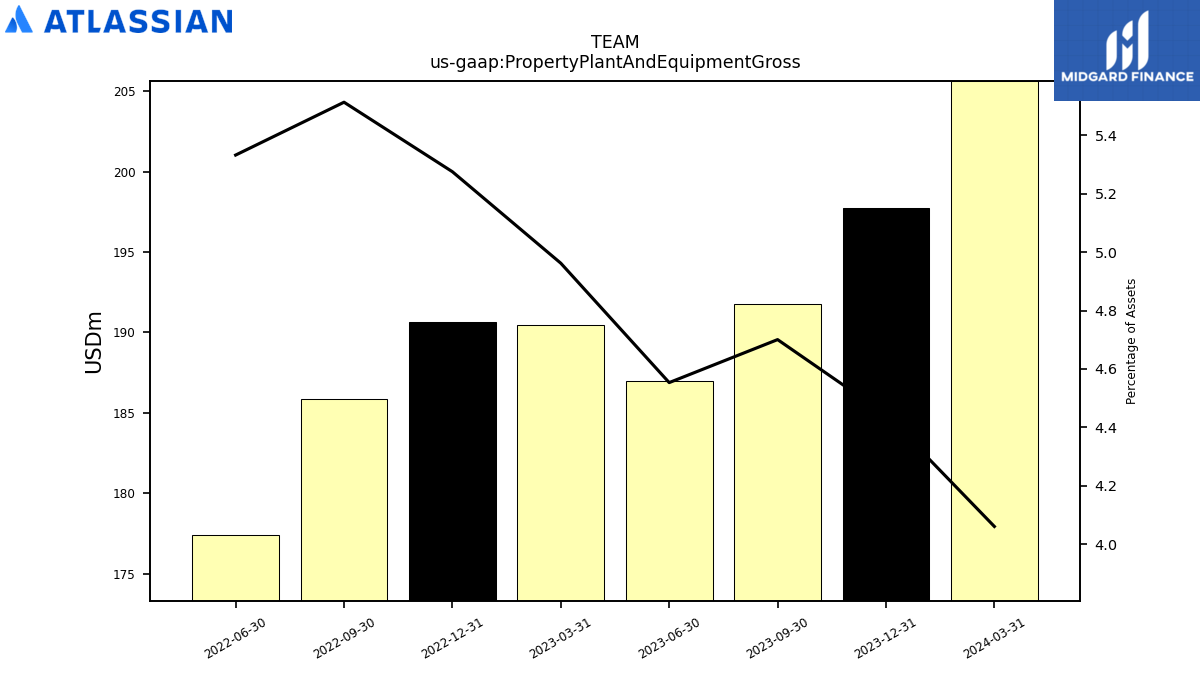
| Property Plant And Equipment Gross | 205.63 | 197.74 | 191.76 | 187.00 | 190.48 | 190.63 | 185.85 | 177.38 | NA | NA | NA | |
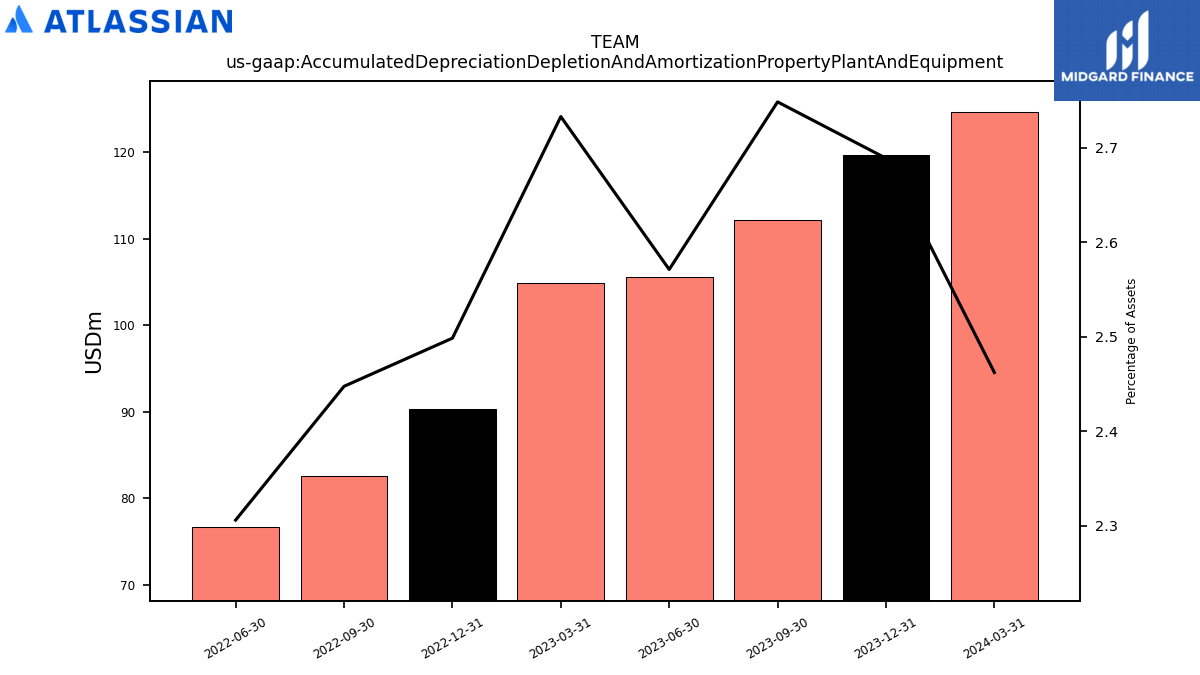
| Accumulated Depreciation Depletion And Amortization Property Plant And Equipment | 124.67 | 119.64 | 112.13 | 105.59 | 104.92 | 90.30 | 82.52 | 76.72 | NA | NA | NA | |
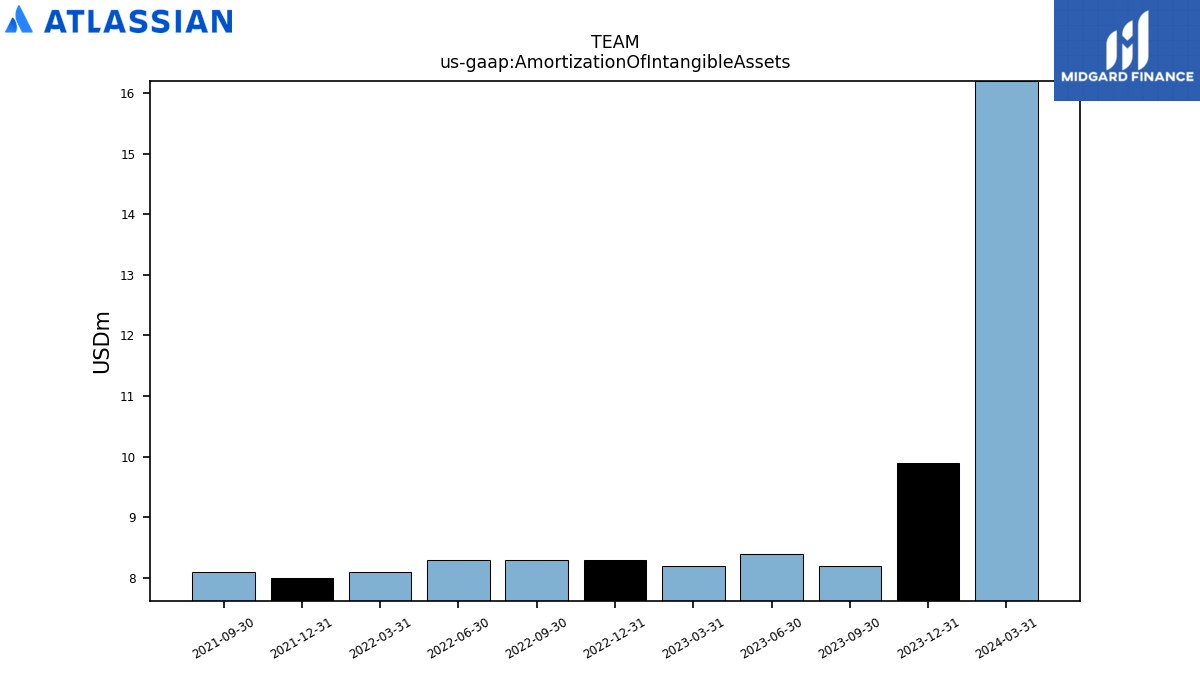
| Amortization Of Intangible Assets | 16.20 | 9.90 | 8.20 | 8.40 | 8.20 | 8.30 | 8.30 | 8.30 | 8.10 | 8.00 | 8.10 | |
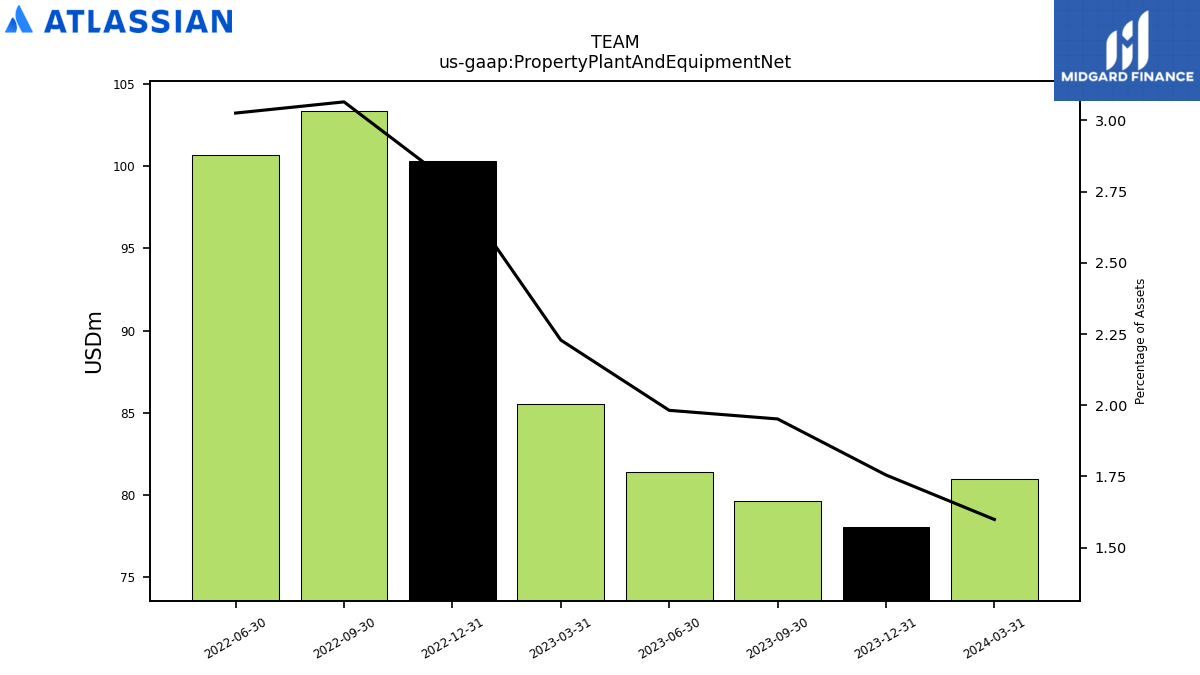
| Property Plant And Equipment Net | 80.96 | 78.09 | 79.63 | 81.40 | 85.56 | 100.33 | 103.34 | 100.66 | NA | NA | NA | |
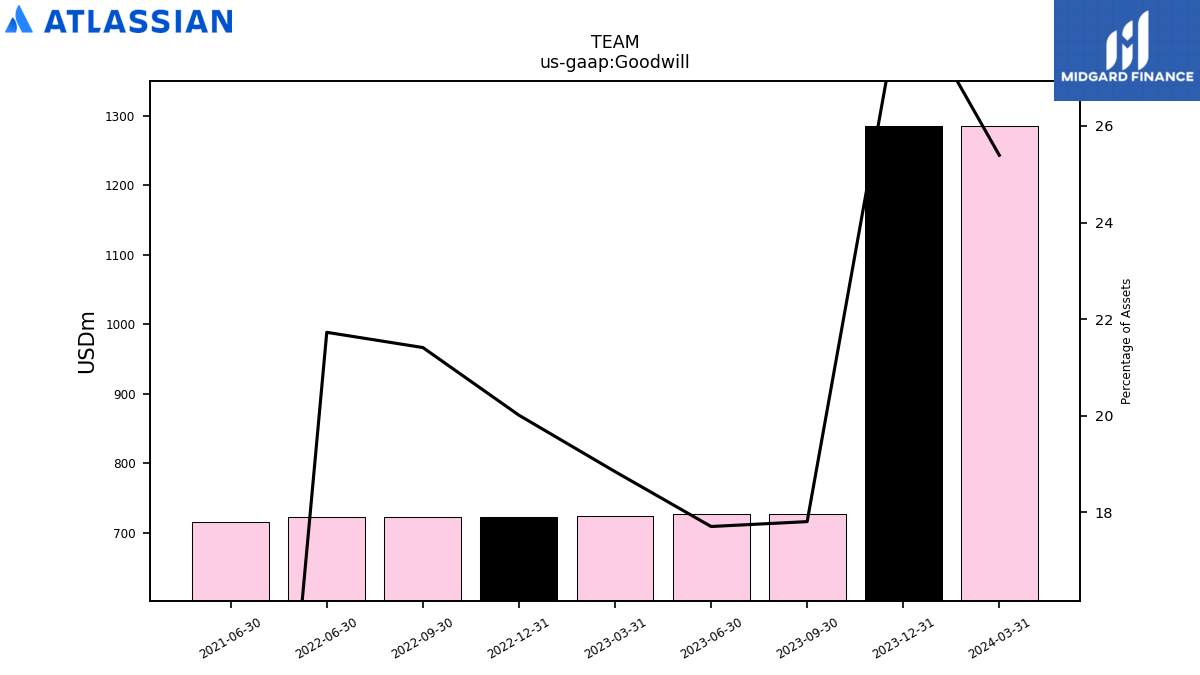
| Goodwill | 1285.74 | 1285.90 | 726.52 | 727.21 | 723.44 | 723.23 | 721.91 | 722.84 | NA | NA | NA | |
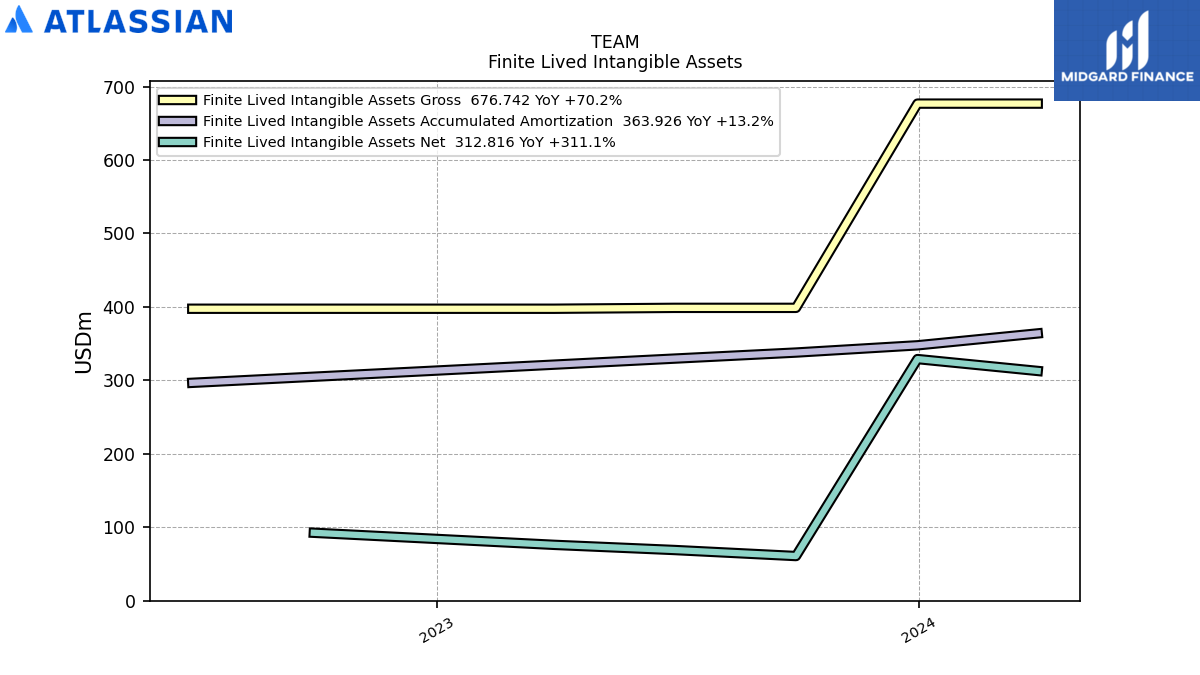
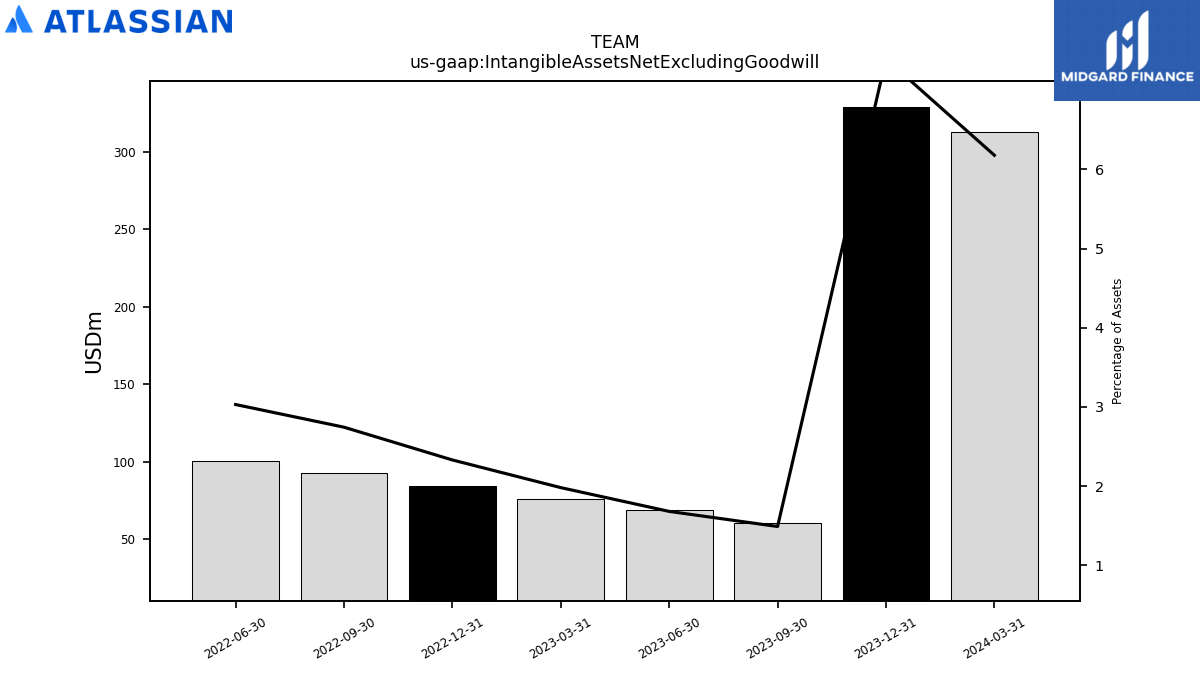
| Intangible Assets Net Excluding Goodwill | 312.82 | 329.01 | 60.84 | 69.07 | 76.09 | 84.25 | 92.54 | 100.84 | NA | NA | NA | |
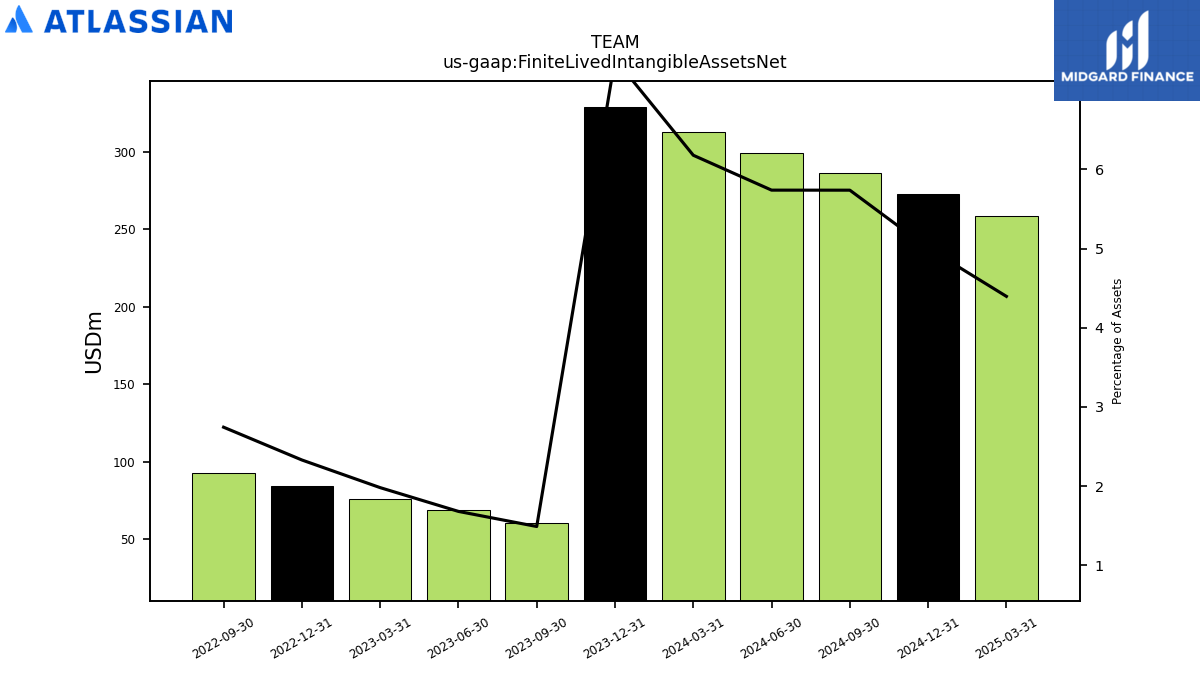
| Finite Lived Intangible Assets Net | 312.82 | 329.01 | 60.84 | 69.07 | 76.09 | 84.25 | 92.54 | NA | NA | NA | NA | |
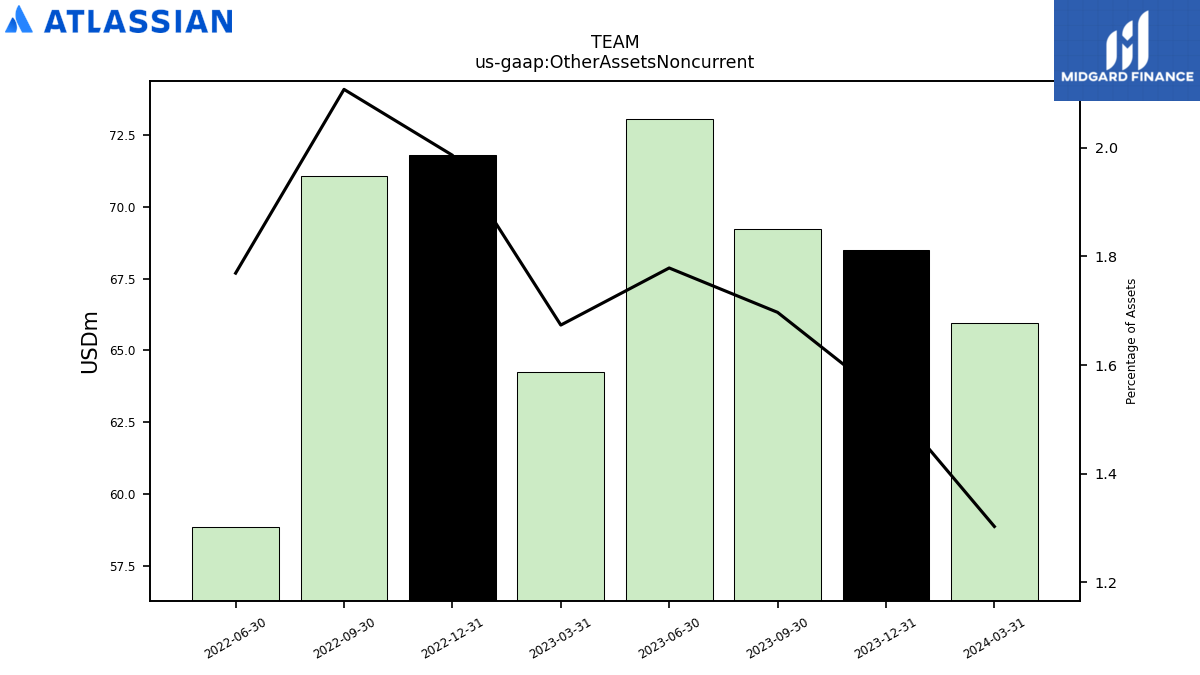
| Other Assets Noncurrent | 65.94 | 68.50 | 69.23 | 73.05 | 64.25 | 71.80 | 71.07 | 58.86 | NA | NA | NA |
| 2024-03-31 | 2023-12-31 | 2023-09-30 | 2023-06-30 | 2023-03-31 | 2022-12-31 | 2022-09-30 | 2022-06-30 | 2022-03-31 | 2021-12-31 | 2021-09-30 | ||
|---|---|---|---|---|---|---|---|---|---|---|---|---|
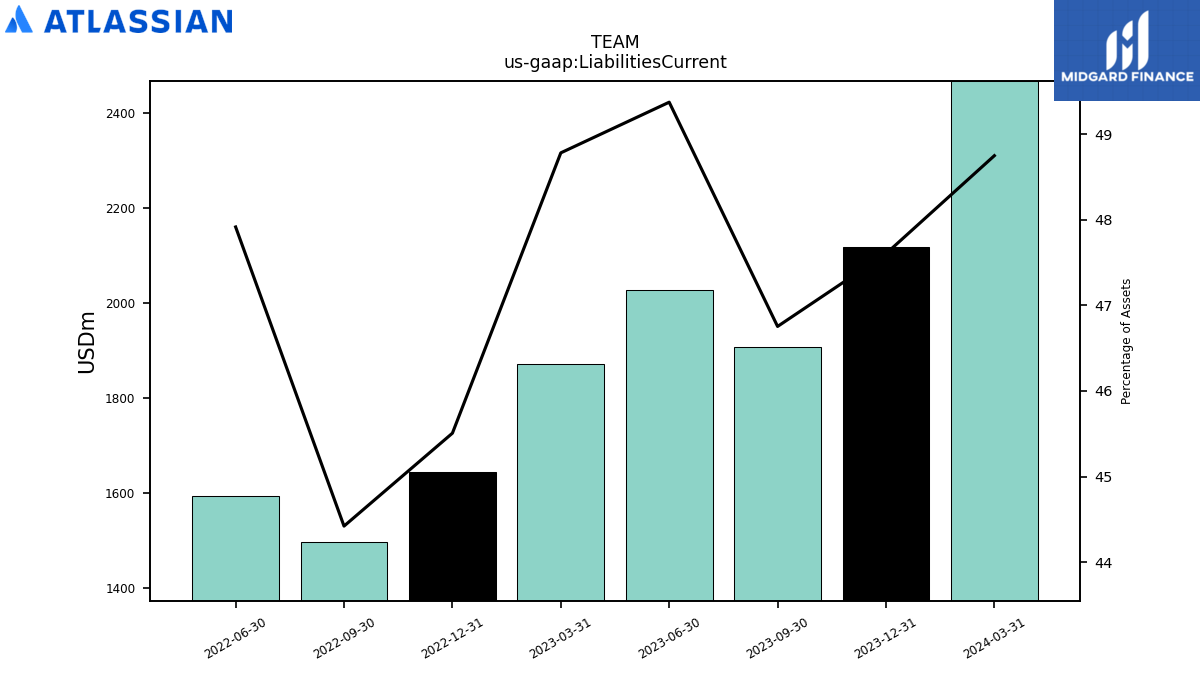
| Liabilities Current | 2468.21 | 2118.10 | 1907.38 | 2027.59 | 1872.68 | 1644.65 | 1497.68 | 1594.06 | NA | NA | NA | |
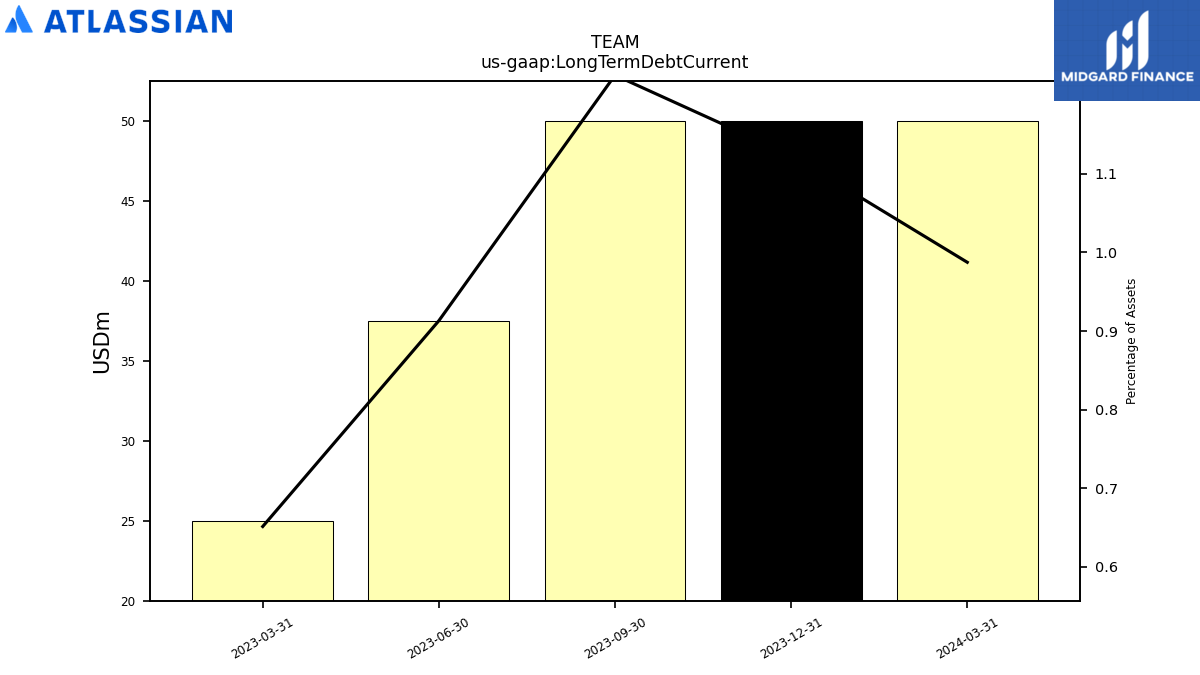
| Long Term Debt Current | 50.00 | 50.00 | 50.00 | 37.50 | 25.00 | NA | NA | NA | NA | NA | NA | |
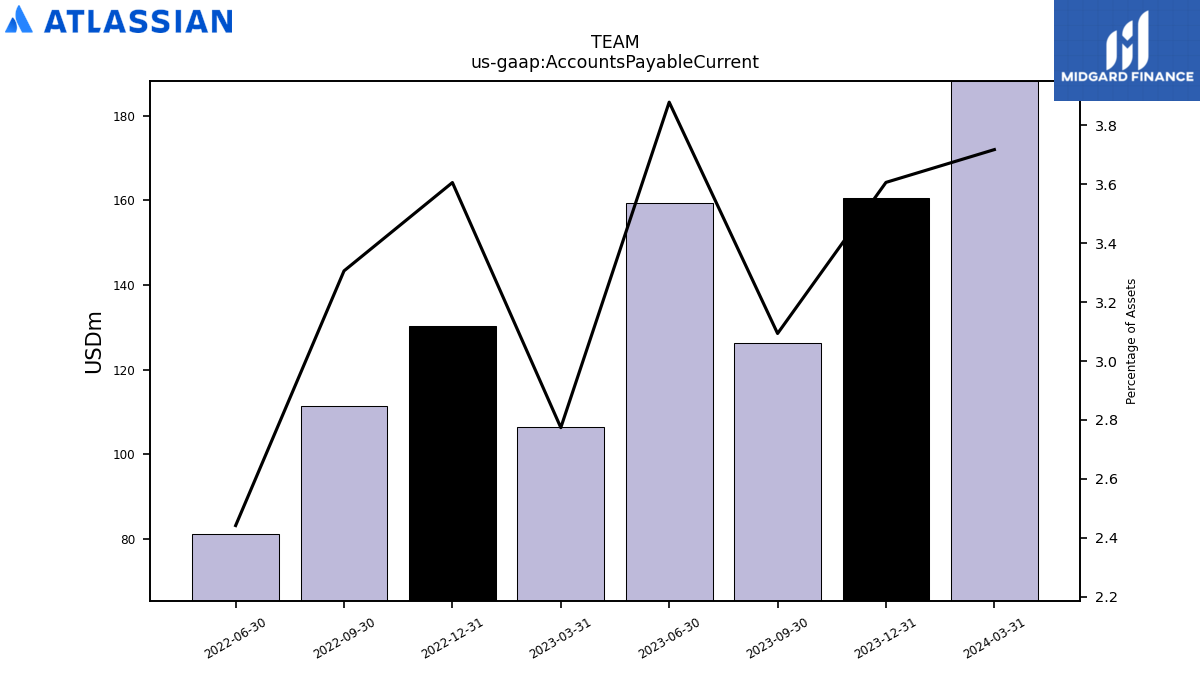
| Accounts Payable Current | 188.24 | 160.47 | 126.20 | 159.29 | 106.49 | 130.32 | 111.46 | 81.22 | NA | NA | NA | |
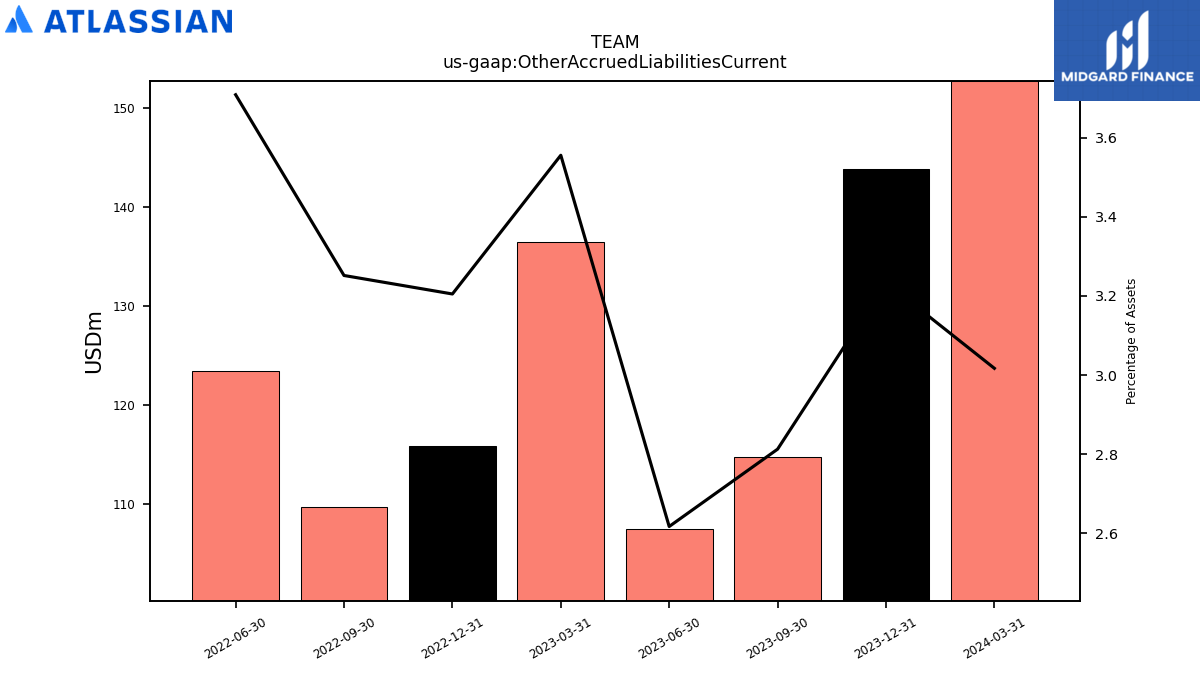
| Other Accrued Liabilities Current | 152.76 | 143.91 | 114.75 | 107.48 | 136.50 | 115.83 | 109.63 | 123.38 | NA | NA | NA | |
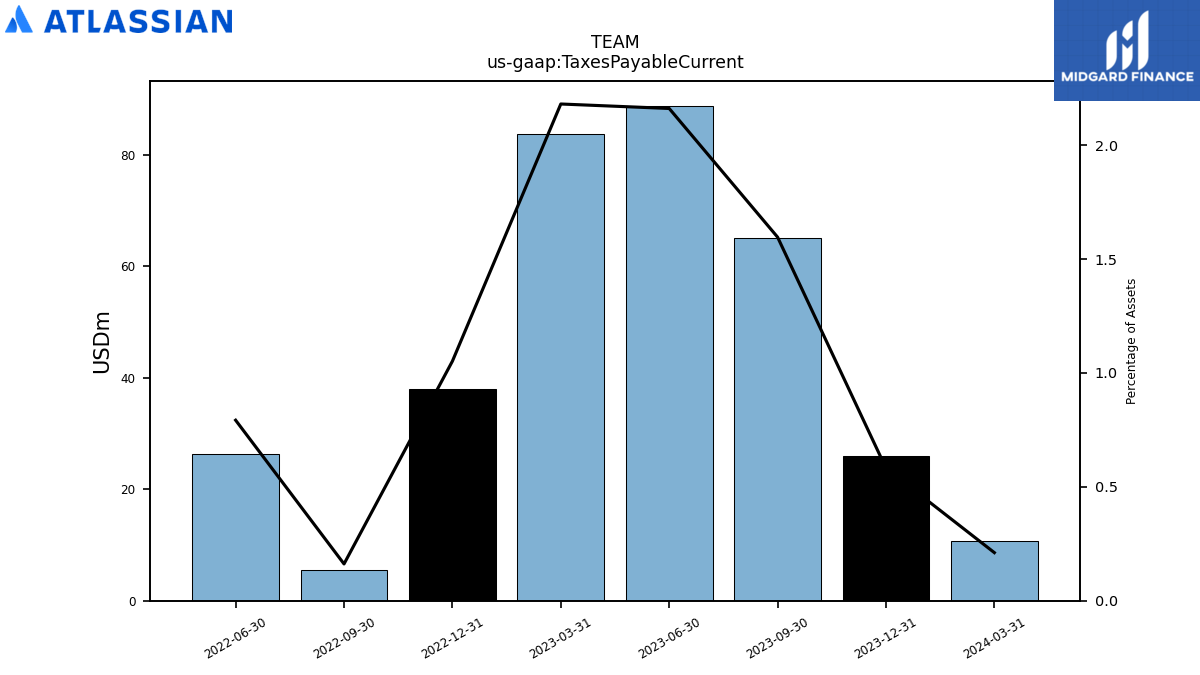
| Taxes Payable Current | 10.69 | 25.89 | 65.12 | 88.75 | 83.72 | 38.01 | 5.45 | 26.37 | NA | NA | NA | |
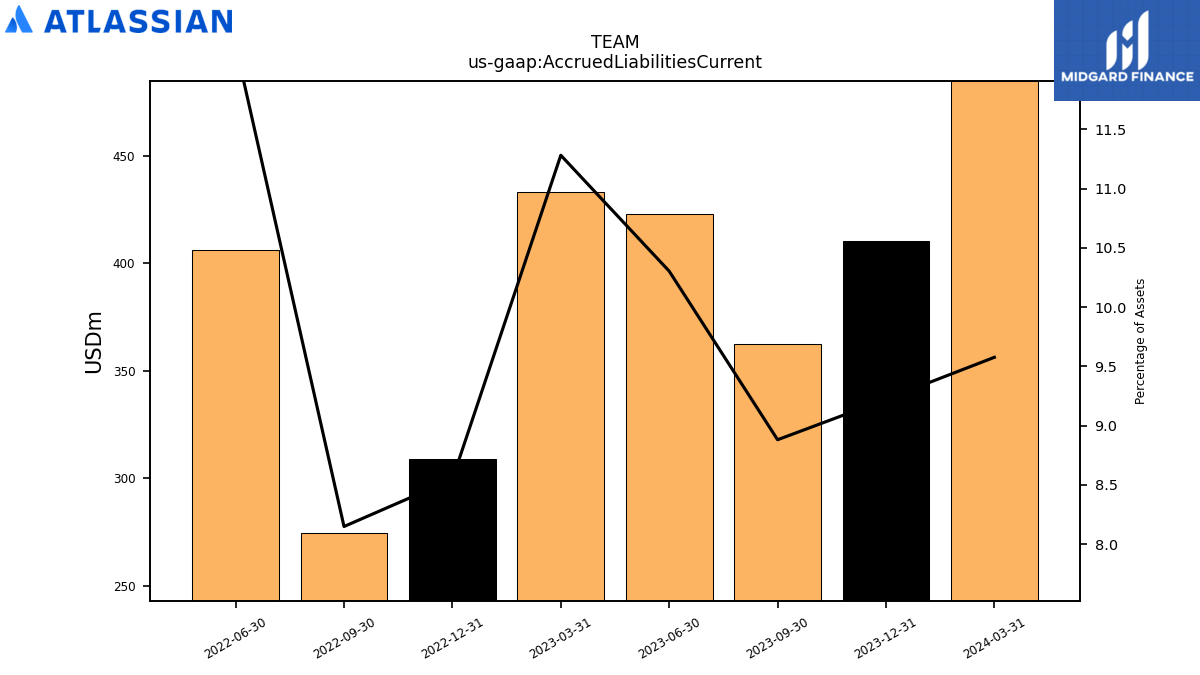
| Accrued Liabilities Current | 484.90 | 410.38 | 362.34 | 423.13 | 433.07 | 308.93 | 274.77 | 406.14 | NA | NA | NA | |
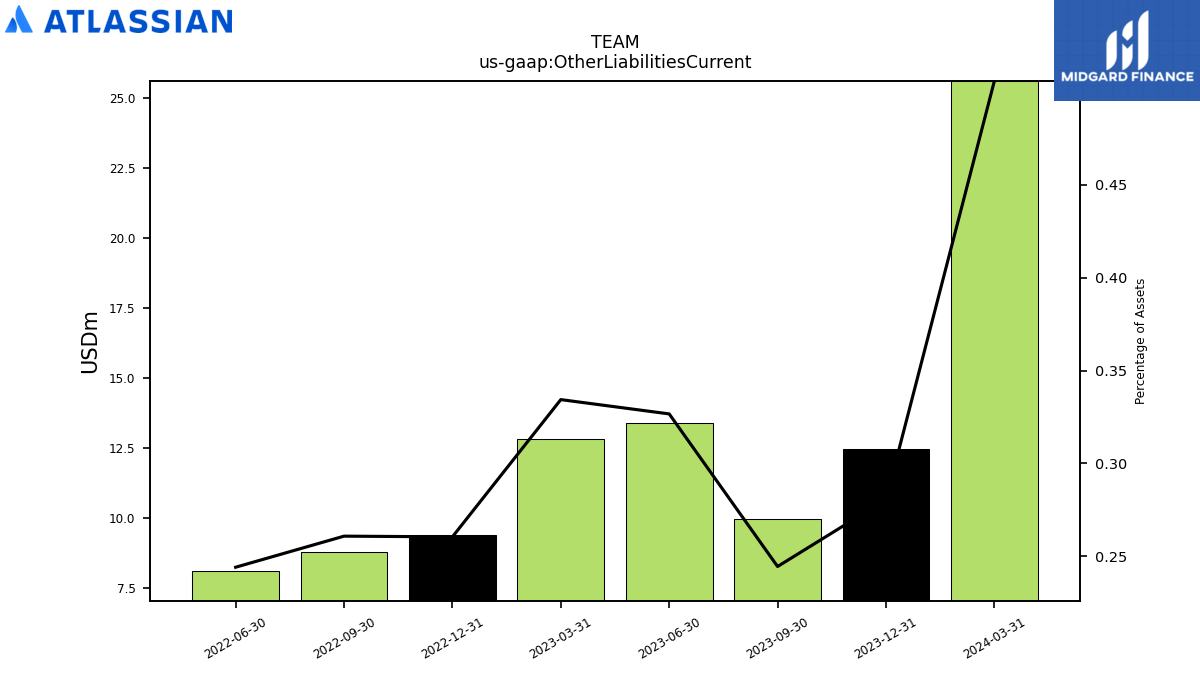
| Other Liabilities Current | 25.61 | 12.48 | 9.97 | 13.41 | 12.84 | 9.41 | 8.79 | 8.12 | NA | NA | NA | |
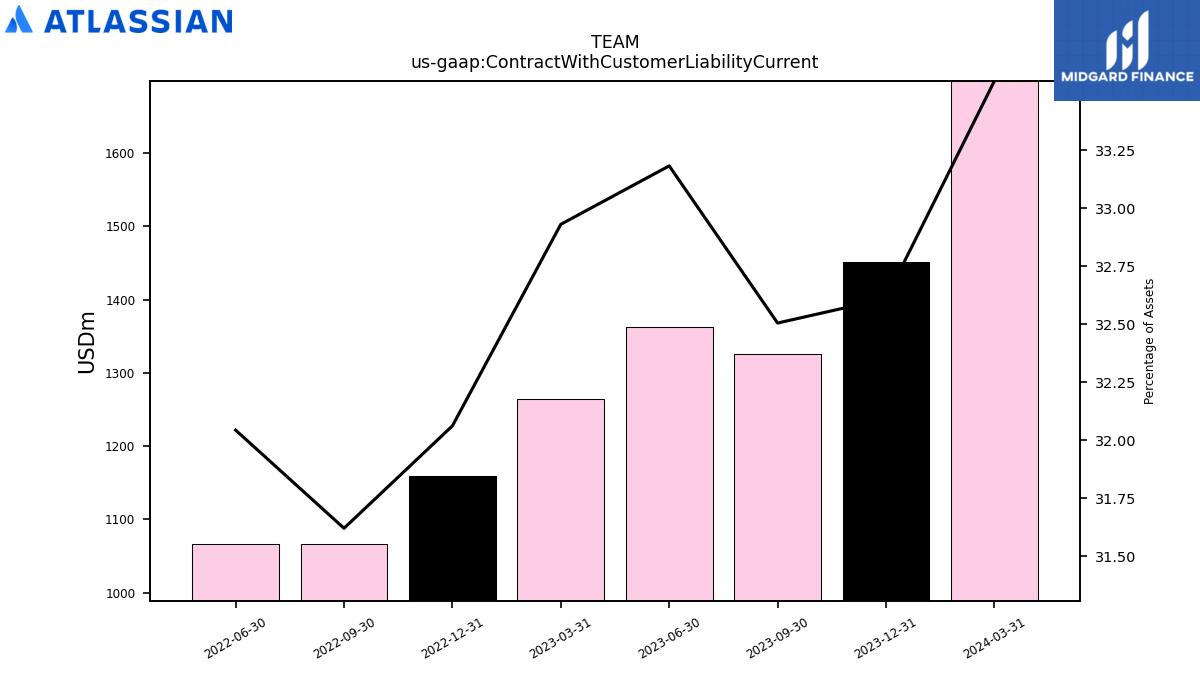
| Contract With Customer Liability Current | 1698.64 | 1451.02 | 1326.11 | 1362.74 | 1264.22 | 1158.74 | 1066.09 | 1066.06 | NA | NA | NA |
| 2024-03-31 | 2023-12-31 | 2023-09-30 | 2023-06-30 | 2023-03-31 | 2022-12-31 | 2022-09-30 | 2022-06-30 | 2022-03-31 | 2021-12-31 | 2021-09-30 | ||
|---|---|---|---|---|---|---|---|---|---|---|---|---|
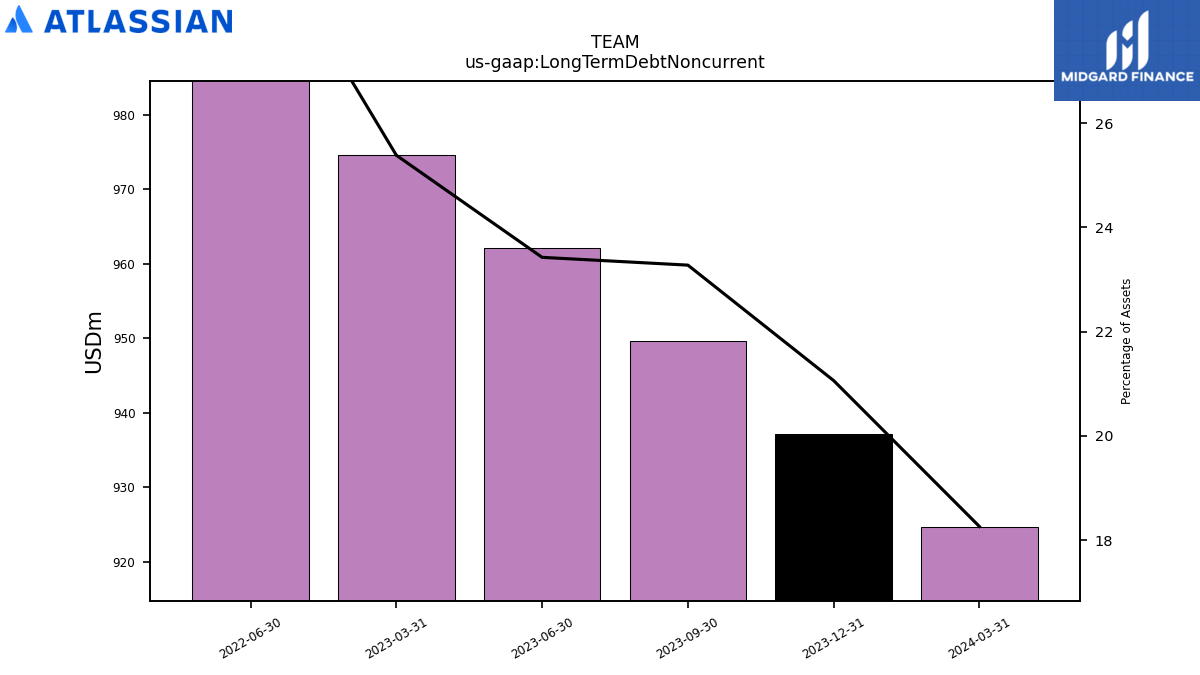
| Long Term Debt Noncurrent | 924.72 | 937.18 | 949.64 | 962.09 | 974.55 | NA | NA | 999.42 | NA | NA | NA | |
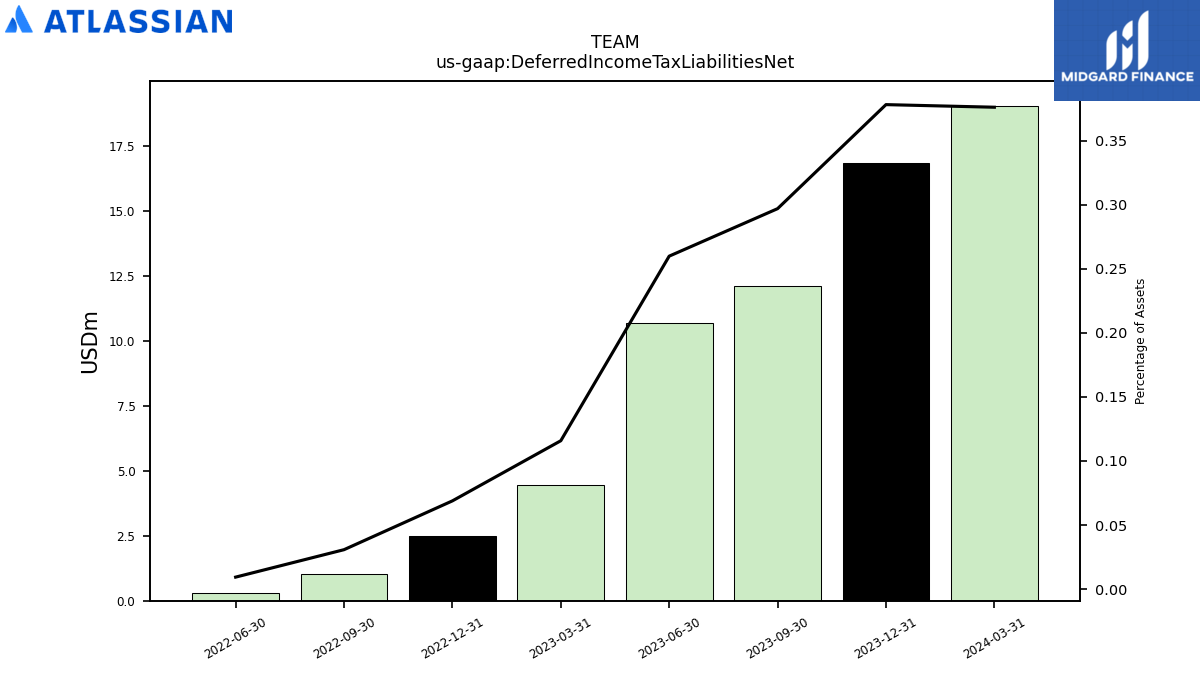
| Deferred Income Tax Liabilities Net | 19.04 | 16.82 | 12.11 | 10.67 | 4.45 | 2.49 | 1.04 | 0.31 | NA | NA | NA | |
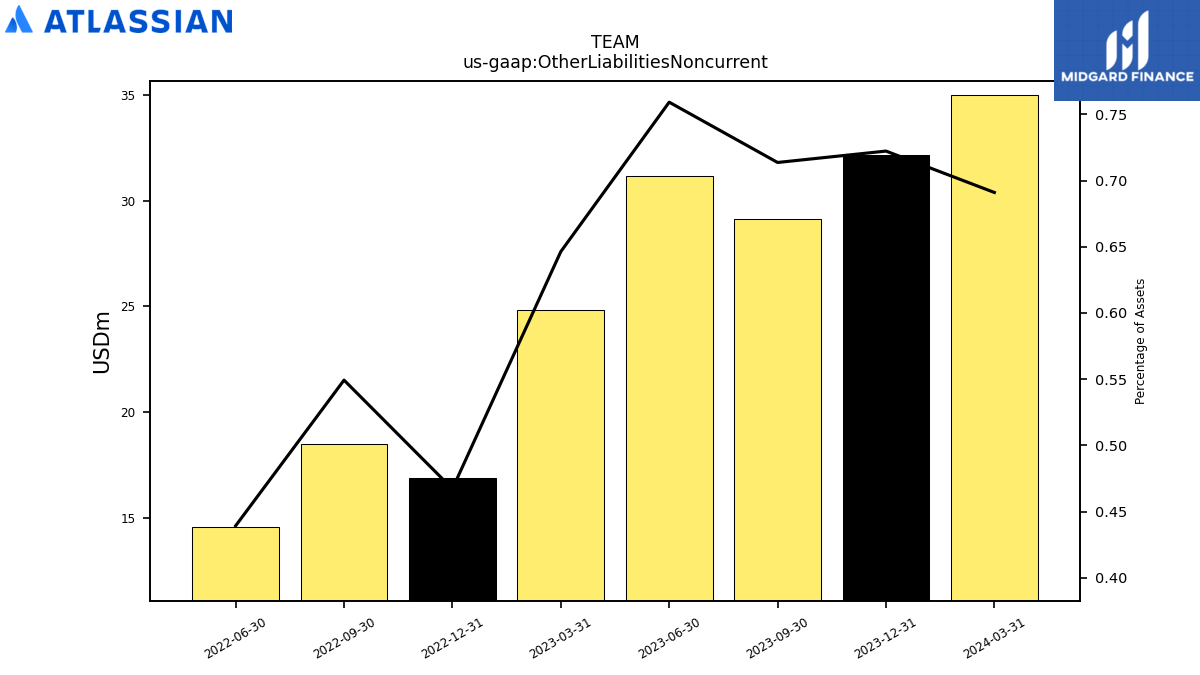
| Other Liabilities Noncurrent | 34.99 | 32.14 | 29.11 | 31.18 | 24.81 | 16.89 | 18.52 | 14.62 | NA | NA | NA | |
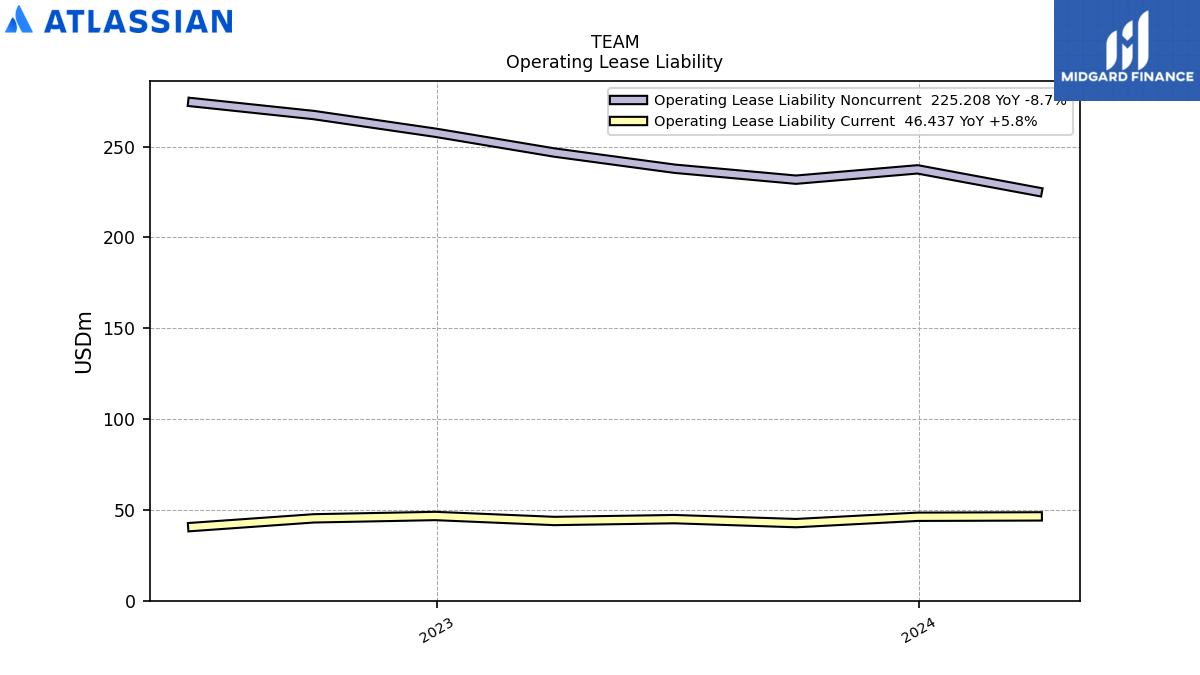
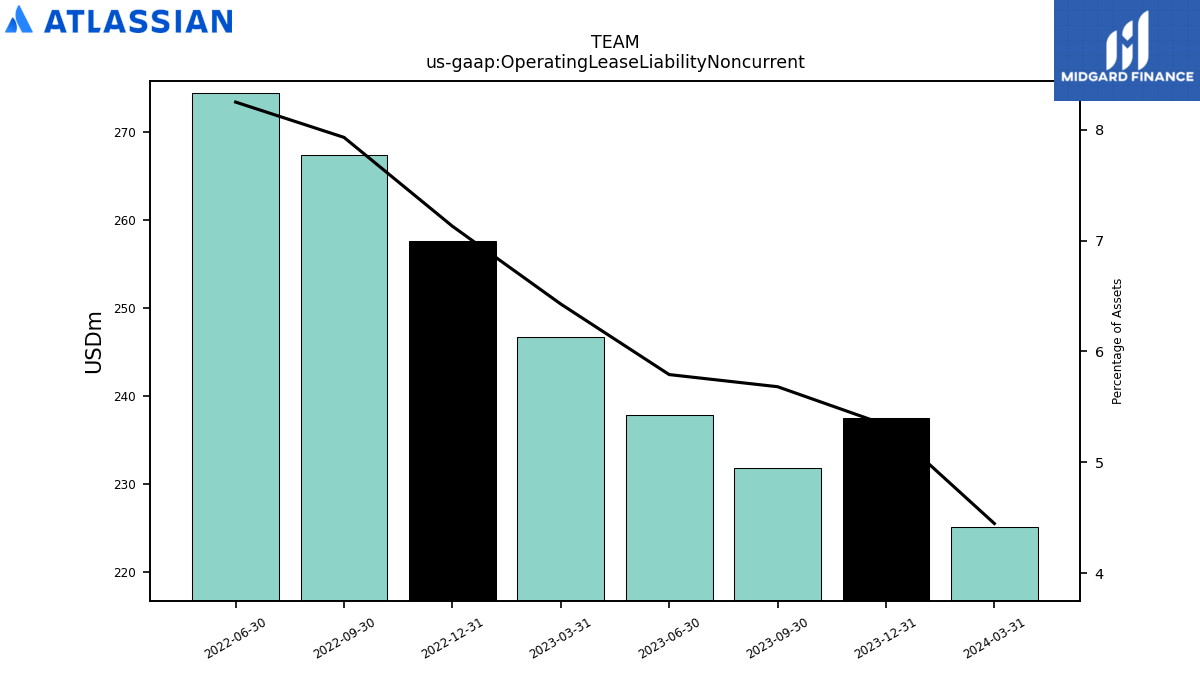
| Operating Lease Liability Noncurrent | 225.21 | 237.48 | 231.80 | 237.84 | 246.75 | 257.65 | 267.37 | 274.43 | NA | NA | NA |
| 2024-03-31 | 2023-12-31 | 2023-09-30 | 2023-06-30 | 2023-03-31 | 2022-12-31 | 2022-09-30 | 2022-06-30 | 2022-03-31 | 2021-12-31 | 2021-09-30 | ||
|---|---|---|---|---|---|---|---|---|---|---|---|---|
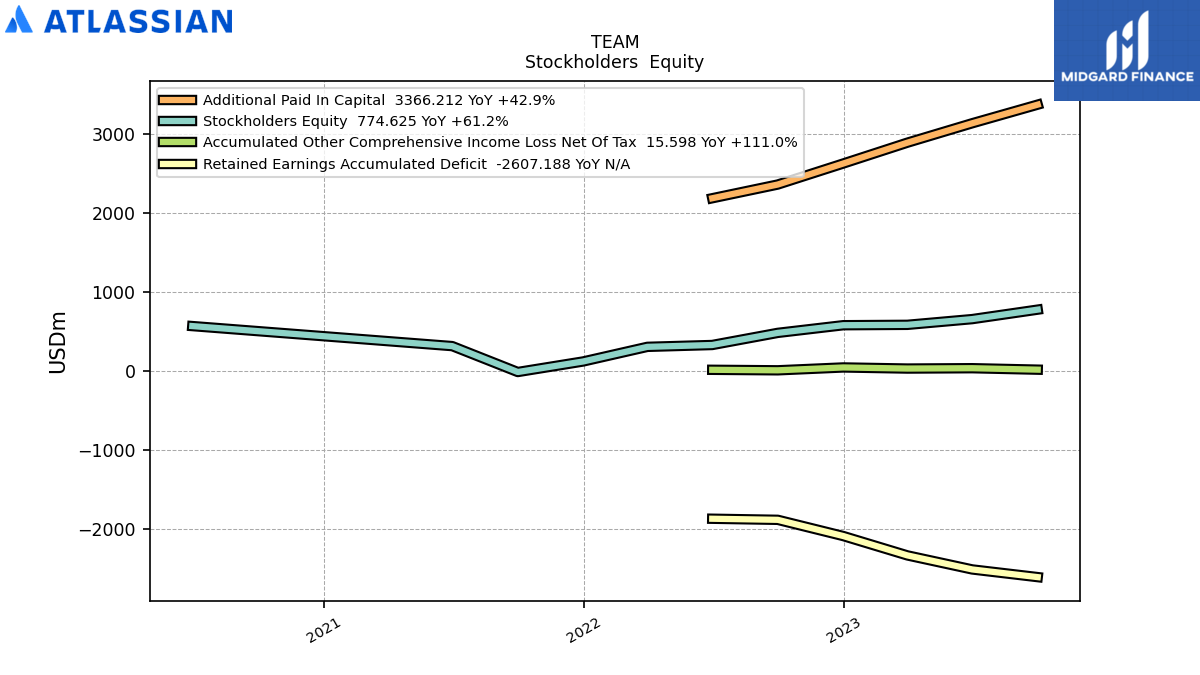
| Stockholders Equity | 1134.17 | 904.92 | 774.62 | 654.67 | 582.27 | 577.49 | 480.61 | 327.37 | 304.02 | 119.53 | -14.15 | |
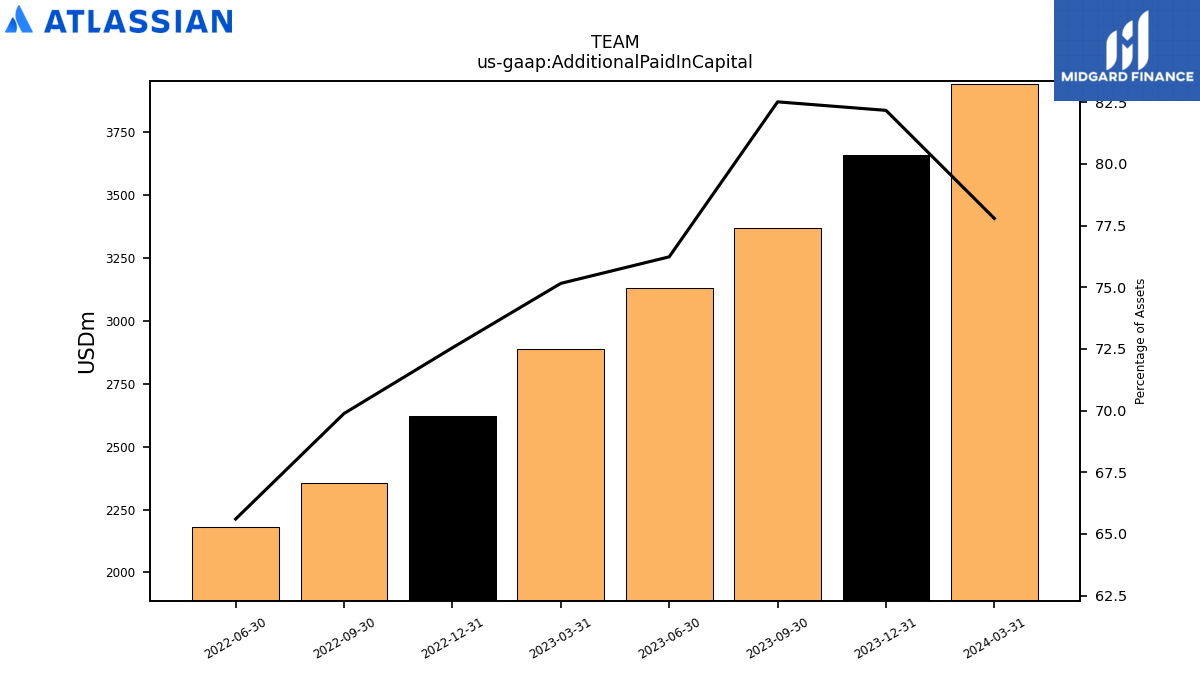
| Additional Paid In Capital | 3938.58 | 3656.06 | 3366.21 | 3130.63 | 2885.21 | 2621.78 | 2355.99 | 2182.54 | NA | NA | NA | |
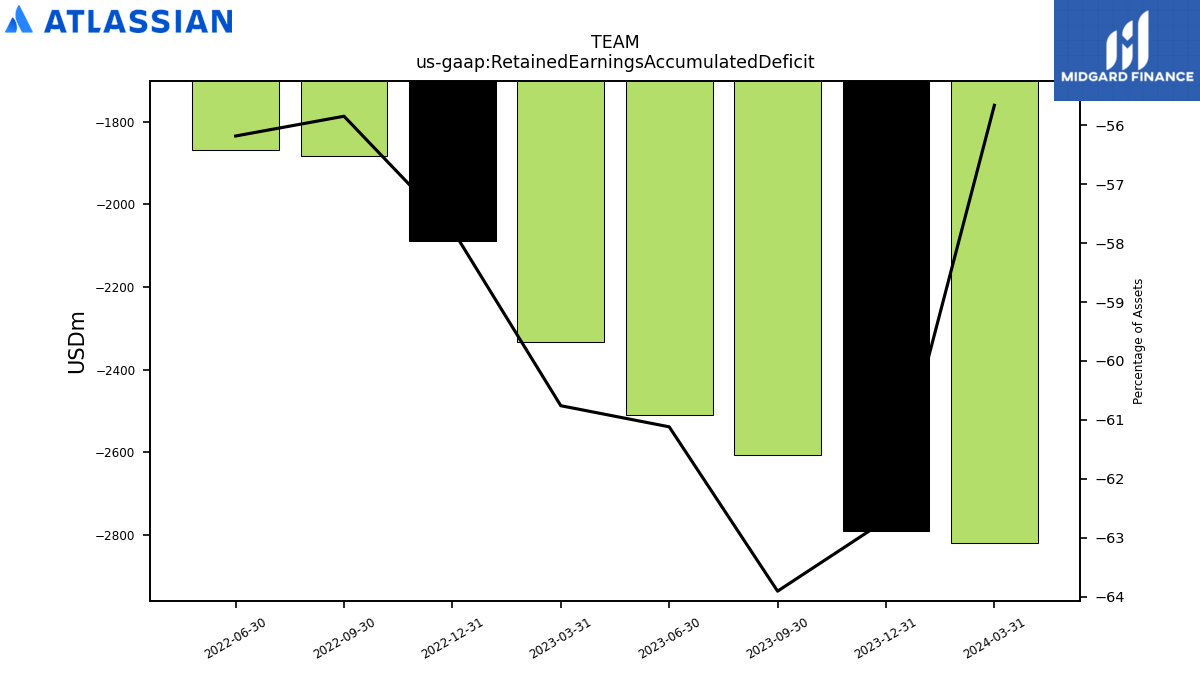
| Retained Earnings Accumulated Deficit | -2818.18 | -2789.80 | -2607.19 | -2509.96 | -2332.55 | -2087.80 | -1882.77 | -1869.03 | NA | NA | NA | |
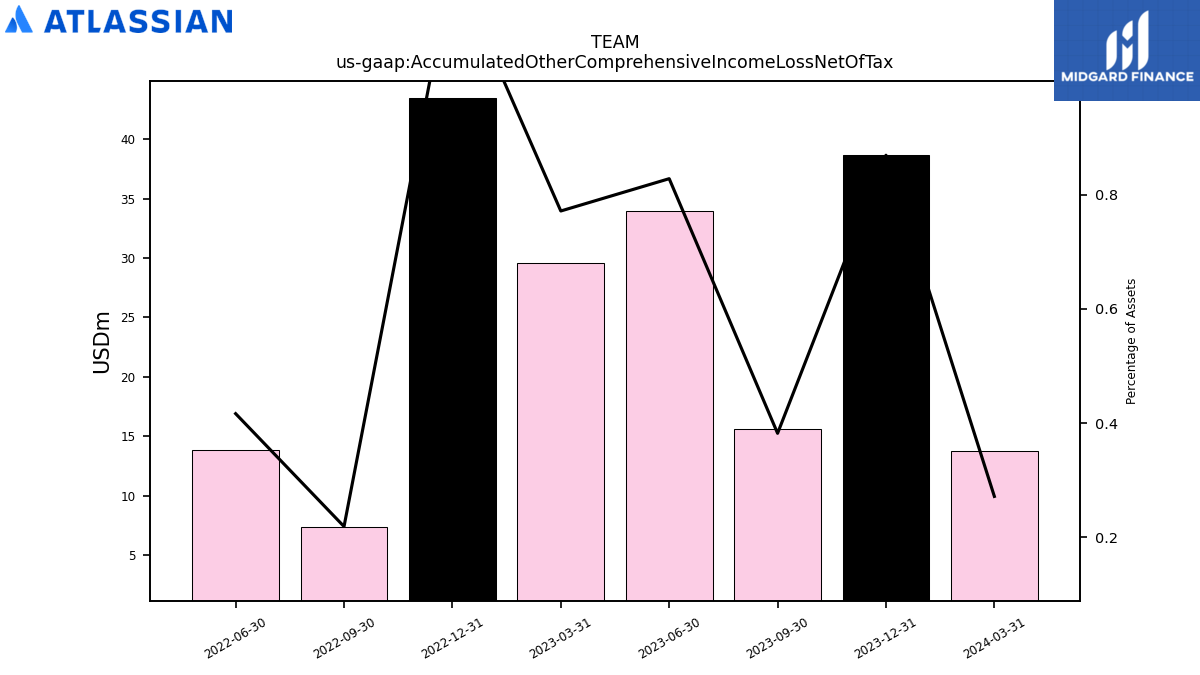
| Accumulated Other Comprehensive Income Loss Net Of Tax | 13.77 | 38.66 | 15.60 | 34.00 | 29.61 | 43.52 | 7.39 | 13.86 | NA | NA | NA | |
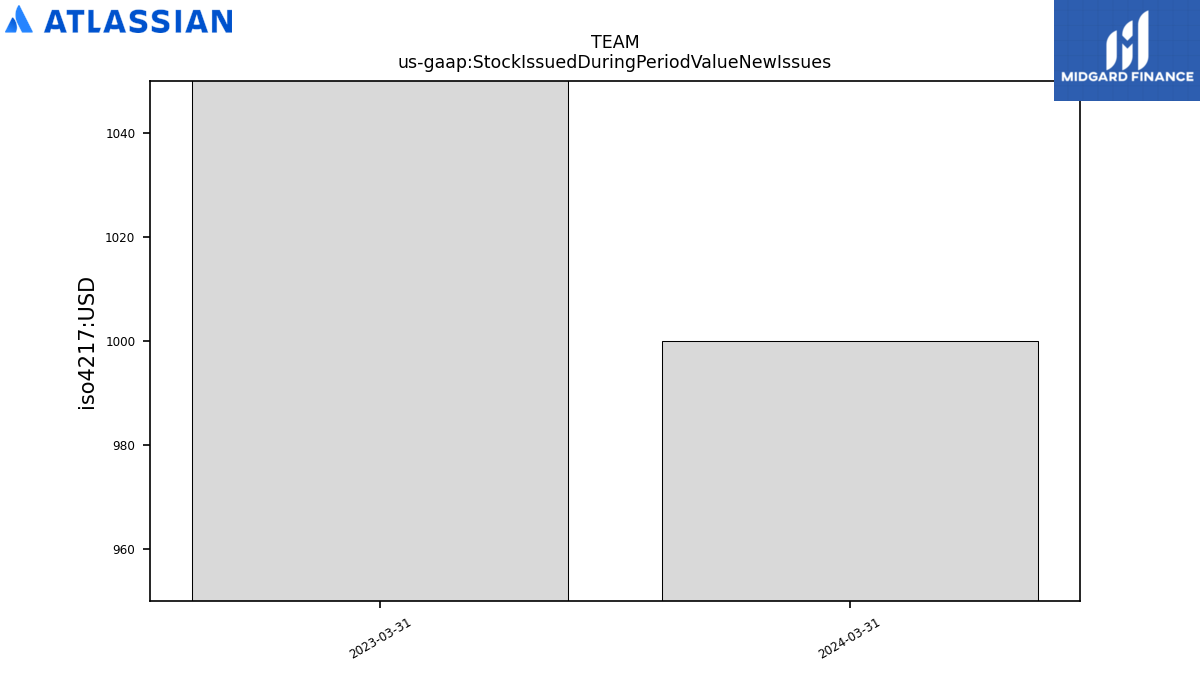
| Stock Issued During Period Value New Issues | 0.00 | NA | NA | NA | 0.00 | NA | NA | NA | NA | NA | NA | |
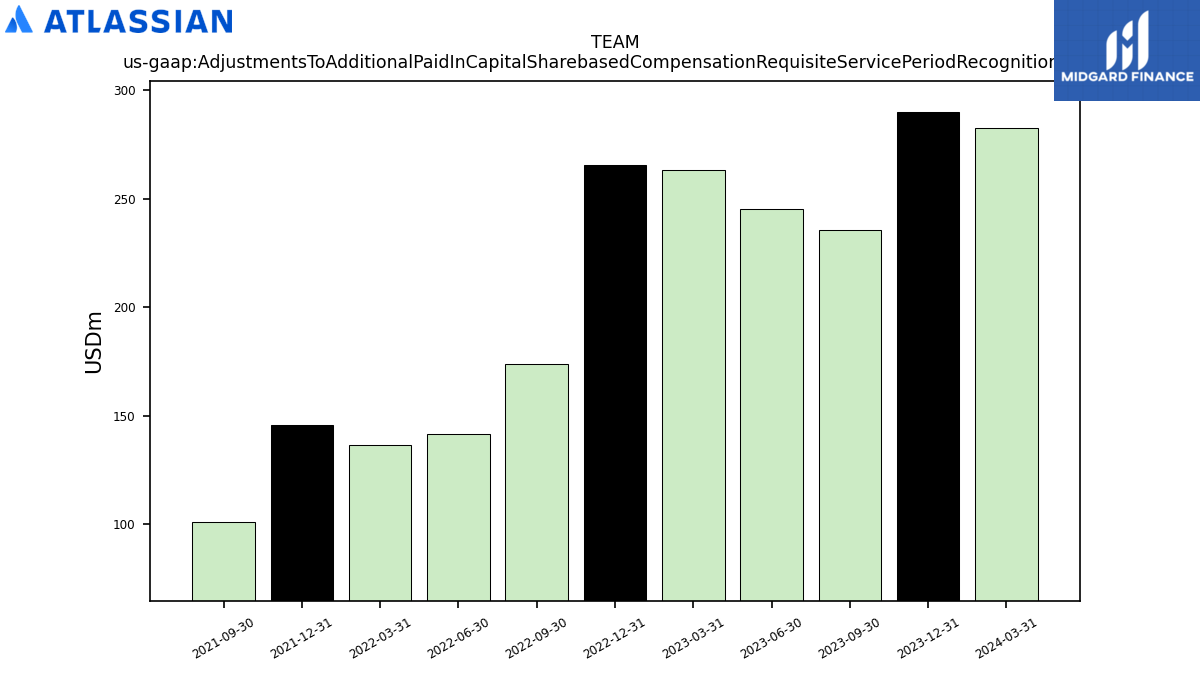
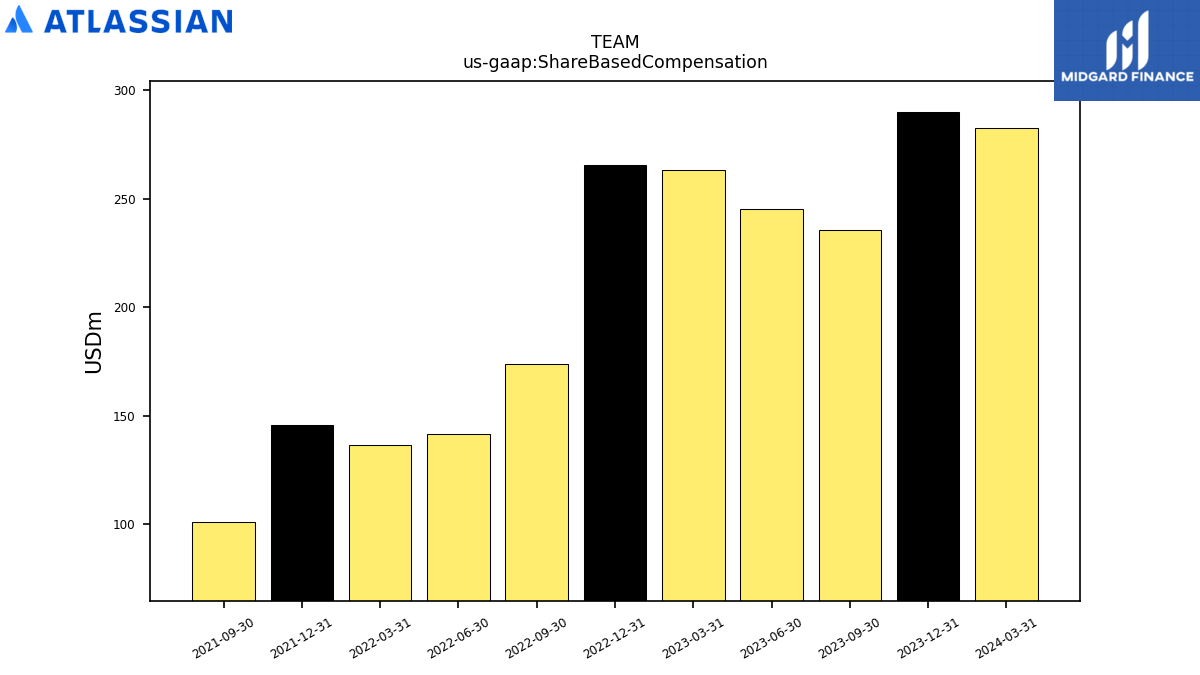
| Adjustments To Additional Paid In Capital Sharebased Compensation Requisite Service Period Recognition Value | 282.52 | 289.85 | 235.58 | 245.24 | 263.43 | 265.79 | 173.63 | 141.76 | 136.49 | 145.88 | 100.94 |
| 2024-03-31 | 2023-12-31 | 2023-09-30 | 2023-06-30 | 2023-03-31 | 2022-12-31 | 2022-09-30 | 2022-06-30 | 2022-03-31 | 2021-12-31 | 2021-09-30 | ||
|---|---|---|---|---|---|---|---|---|---|---|---|---|
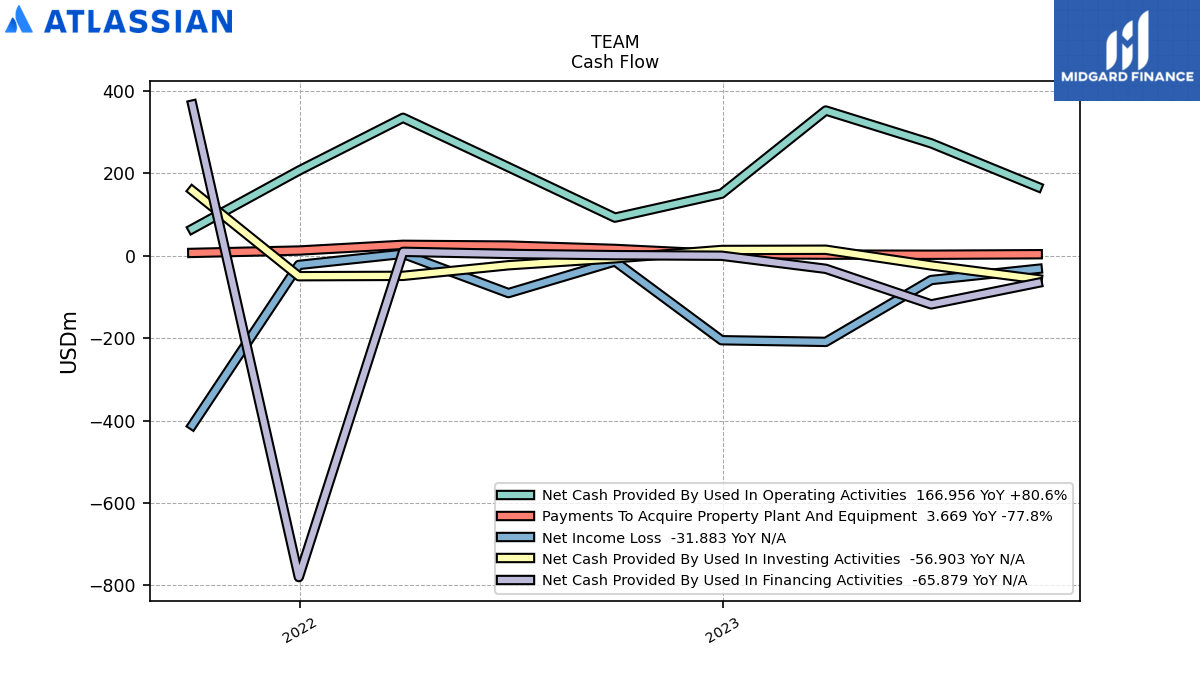
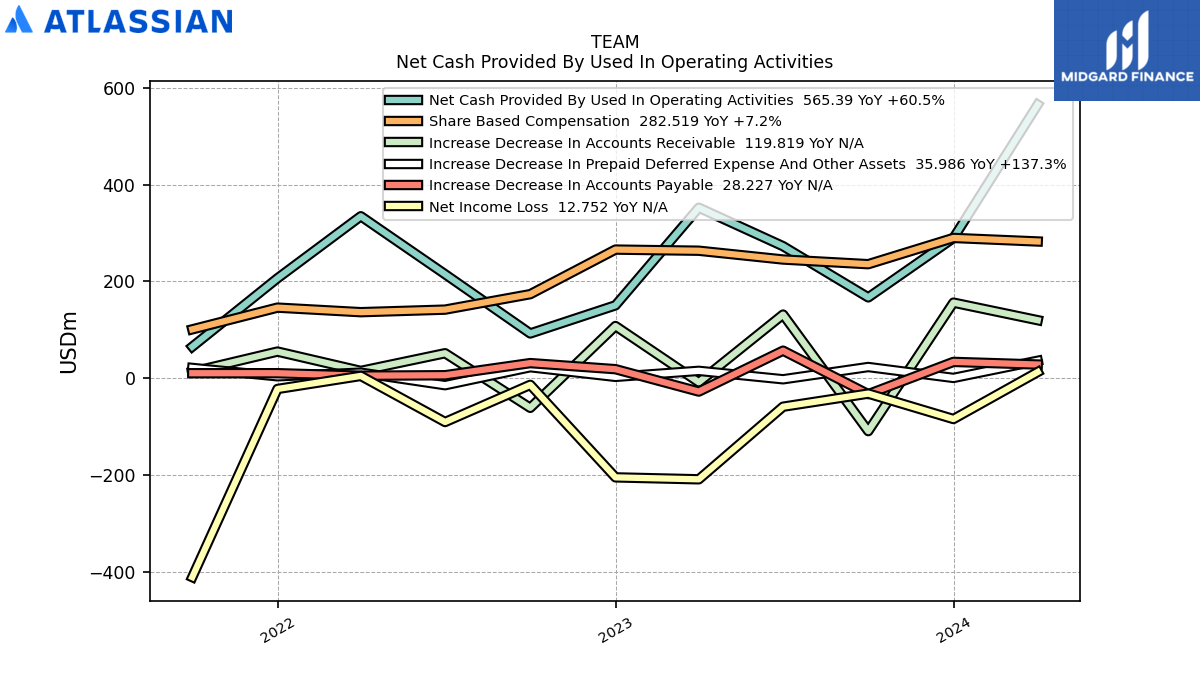
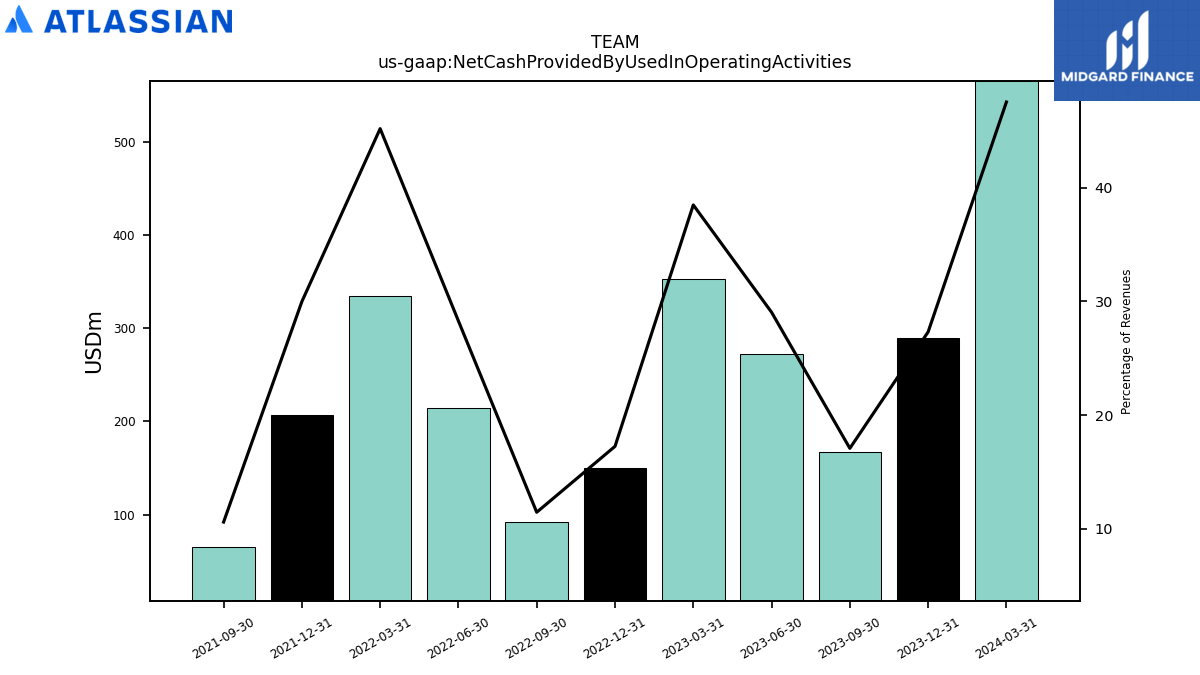
| Net Cash Provided By Used In Operating Activities | 565.39 | 289.59 | 166.96 | 272.77 | 352.37 | 150.53 | 92.44 | 214.88 | 334.71 | 206.46 | 65.00 | |
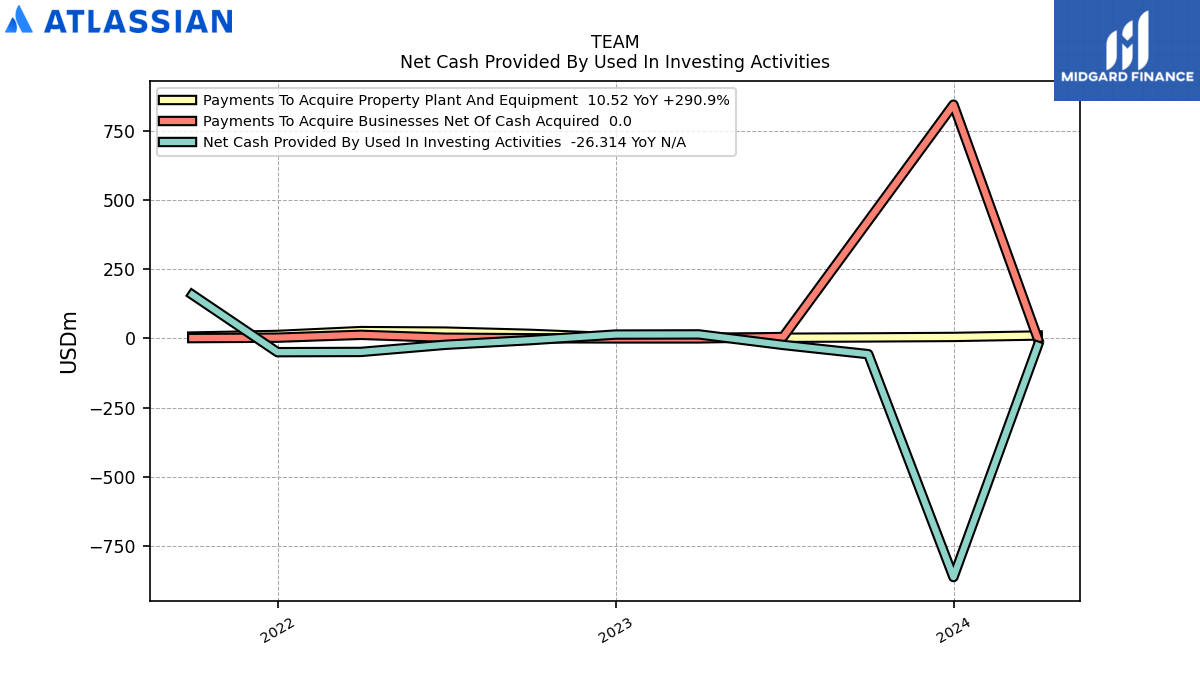
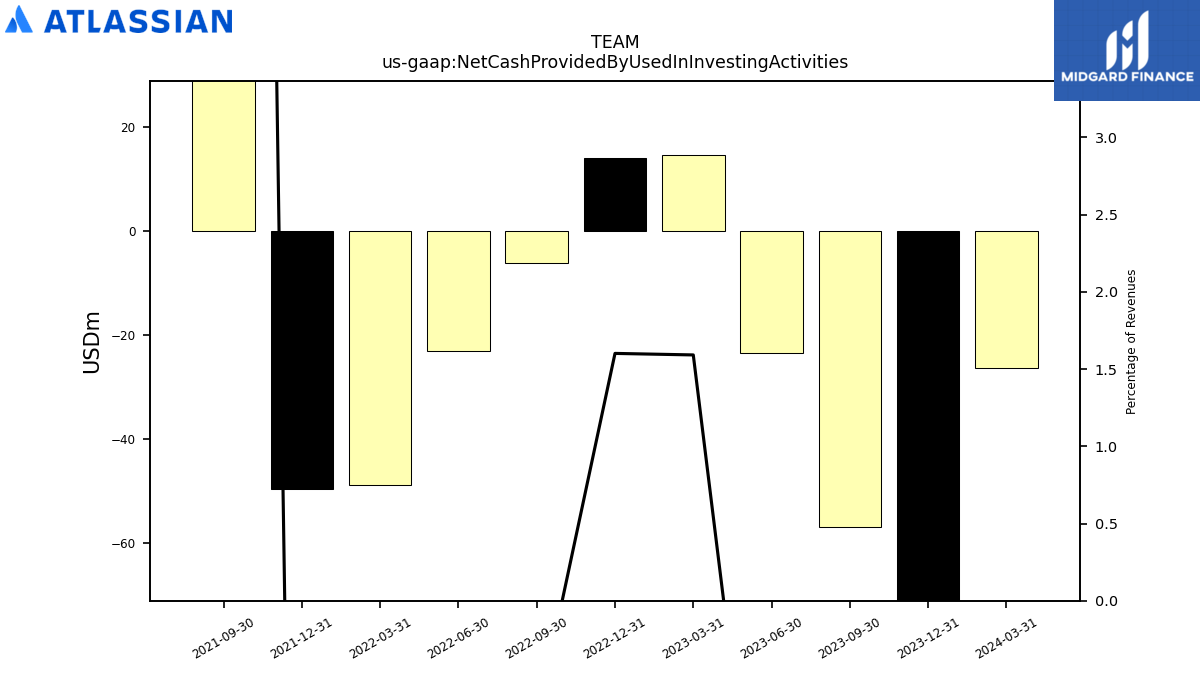
| Net Cash Provided By Used In Investing Activities | -26.31 | -862.43 | -56.90 | -23.56 | 14.57 | 13.97 | -6.24 | -23.10 | -48.83 | -49.68 | 158.13 | |
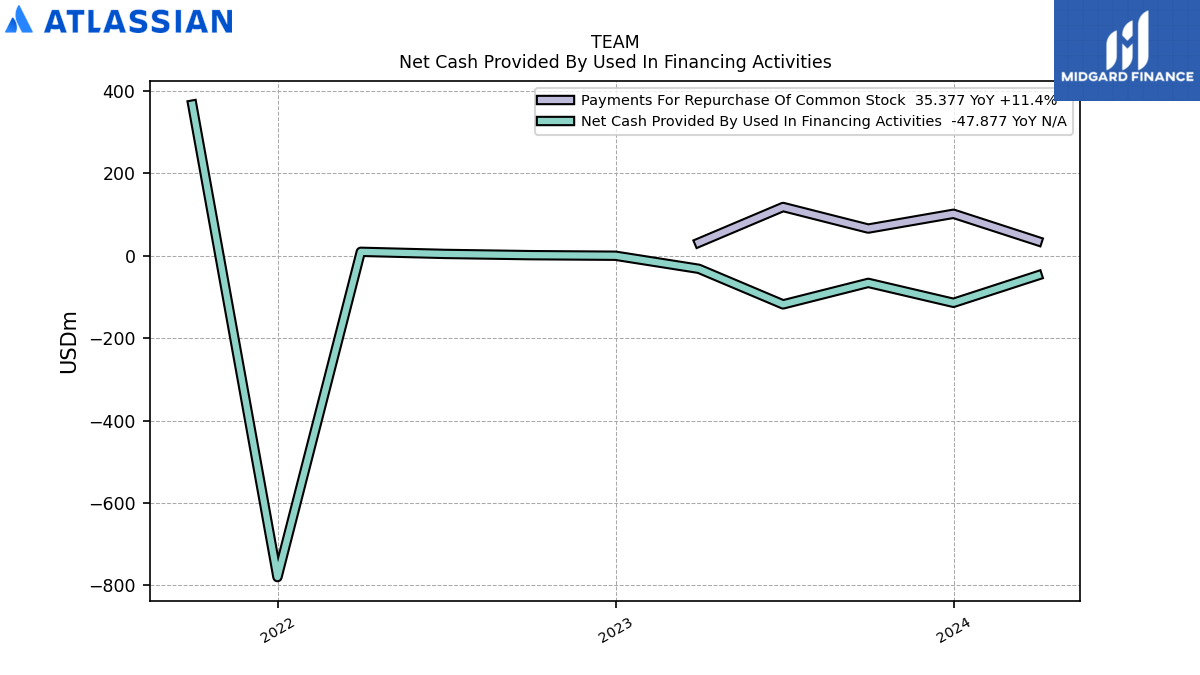
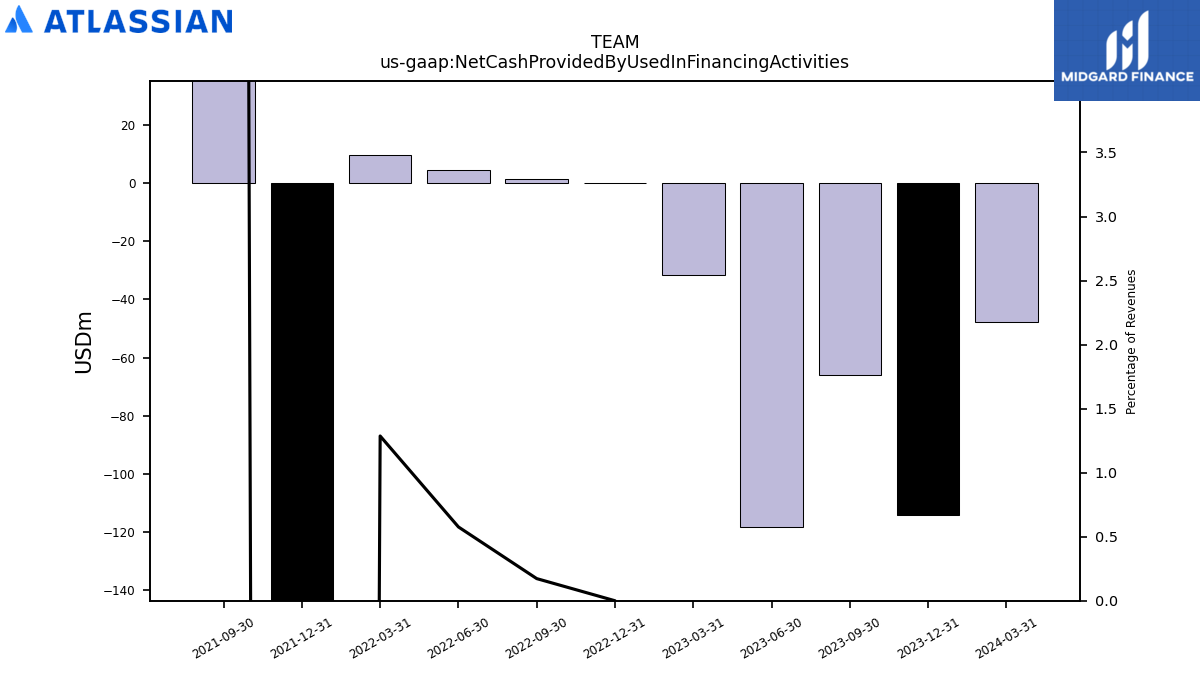
| Net Cash Provided By Used In Financing Activities | -47.88 | -114.27 | -65.88 | -118.07 | -31.75 | 0.00 | 1.40 | 4.38 | 9.53 | -779.85 | 366.67 |
| 2024-03-31 | 2023-12-31 | 2023-09-30 | 2023-06-30 | 2023-03-31 | 2022-12-31 | 2022-09-30 | 2022-06-30 | 2022-03-31 | 2021-12-31 | 2021-09-30 | ||
|---|---|---|---|---|---|---|---|---|---|---|---|---|
| Net Cash Provided By Used In Operating Activities | 565.39 | 289.59 | 166.96 | 272.77 | 352.37 | 150.53 | 92.44 | 214.88 | 334.71 | 206.46 | 65.00 | |
| Net Income Loss | 12.75 | -84.47 | -31.88 | -58.95 | -209.04 | -205.03 | -13.74 | -90.64 | 4.66 | -22.33 | -411.20 | |
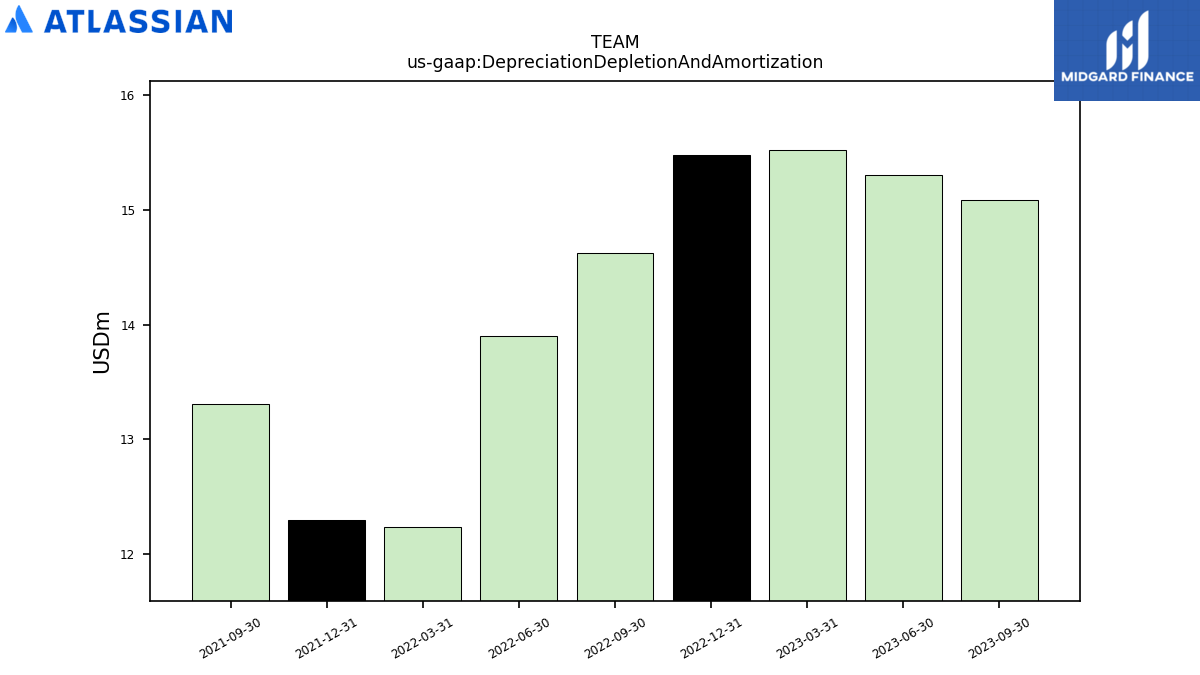
| Depreciation Depletion And Amortization | 23.46 | 17.01 | 15.08 | 15.30 | 15.52 | 15.48 | 14.62 | 13.90 | 12.24 | 12.30 | 13.30 | |
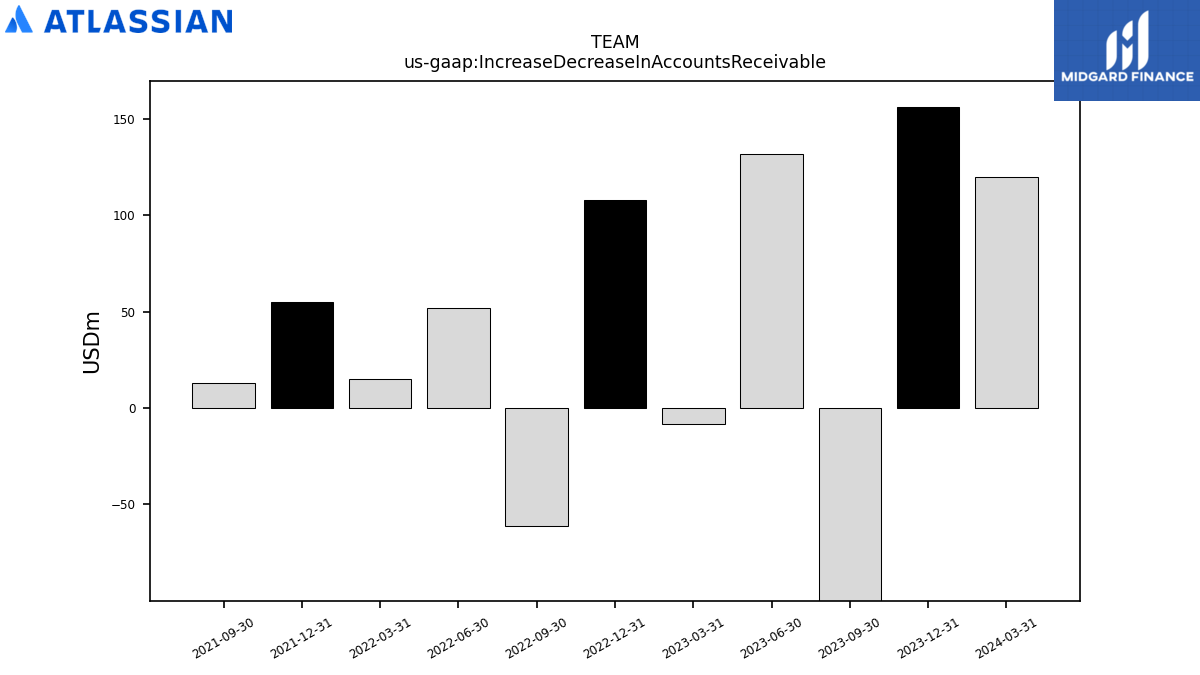
| Increase Decrease In Accounts Receivable | 119.82 | 156.16 | -109.49 | 131.50 | -8.46 | 107.81 | -61.31 | 51.58 | 14.98 | 54.99 | 13.21 | |
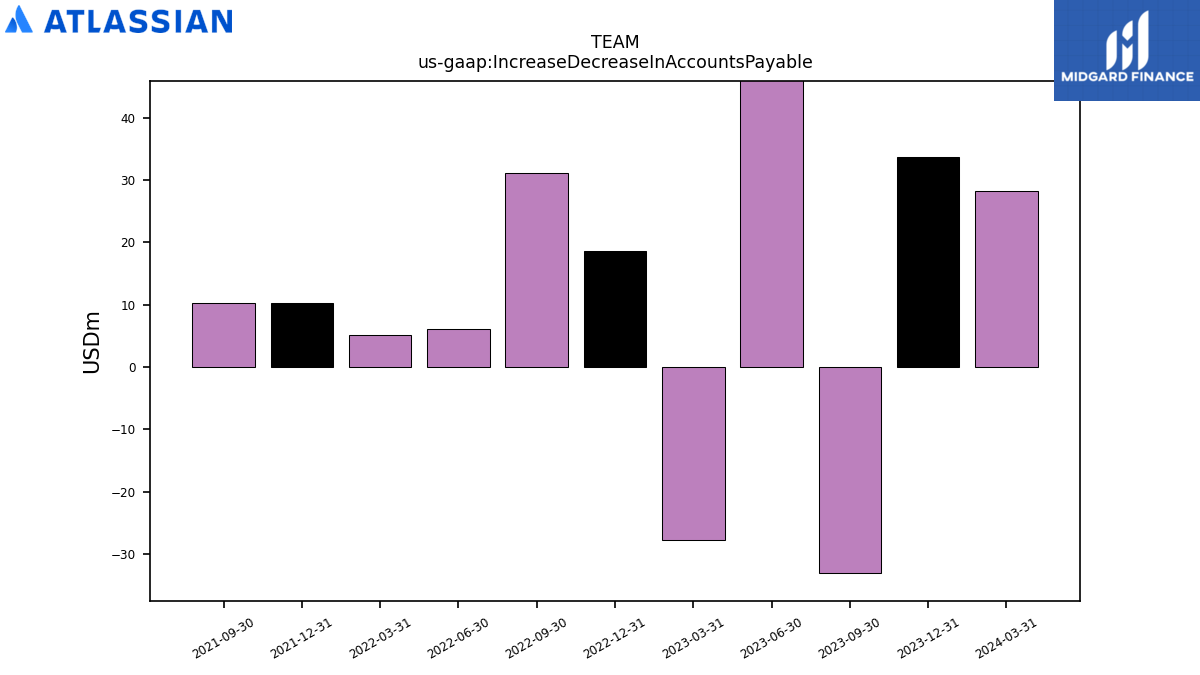
| Increase Decrease In Accounts Payable | 28.23 | 33.65 | -33.02 | 56.87 | -27.70 | 18.59 | 31.15 | 6.09 | 5.15 | 10.28 | 10.22 | |
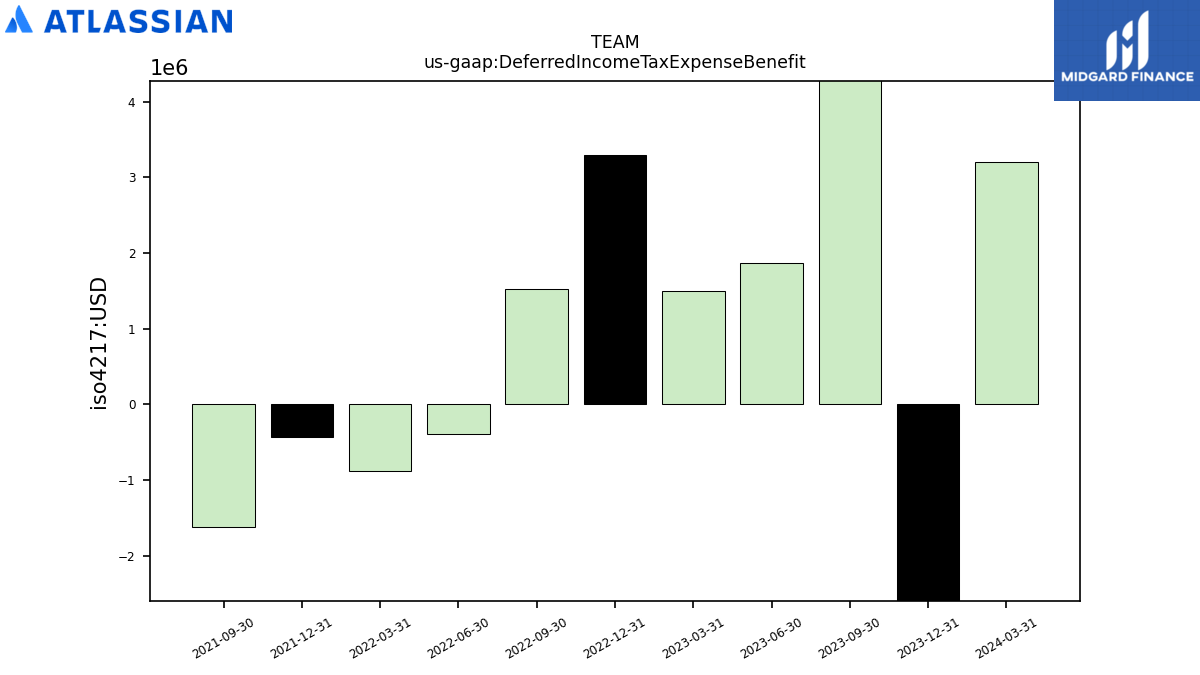
| Deferred Income Tax Expense Benefit | 3.21 | -8.62 | 5.31 | 1.87 | 1.50 | 3.29 | 1.52 | -0.40 | -0.88 | -0.43 | -1.61 | |
| Share Based Compensation | 282.52 | 289.85 | 235.58 | 245.24 | 263.43 | 265.79 | 173.63 | 141.67 | 136.40 | 145.82 | 100.91 |
| 2024-03-31 | 2023-12-31 | 2023-09-30 | 2023-06-30 | 2023-03-31 | 2022-12-31 | 2022-09-30 | 2022-06-30 | 2022-03-31 | 2021-12-31 | 2021-09-30 | ||
|---|---|---|---|---|---|---|---|---|---|---|---|---|
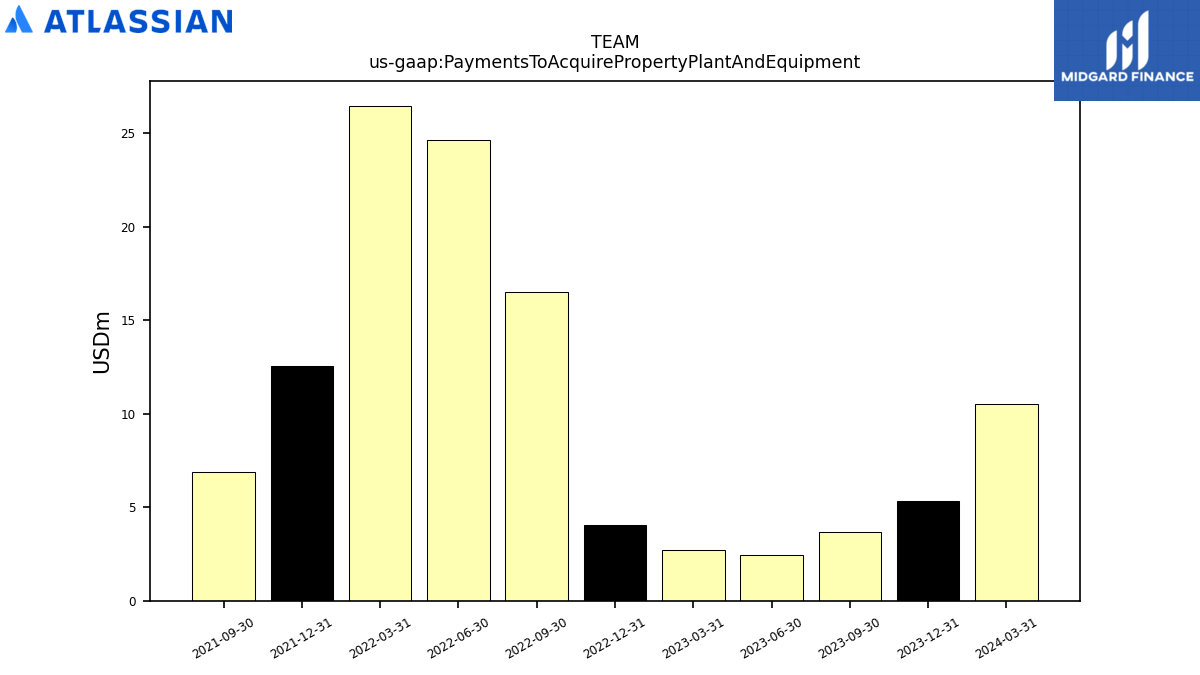
| Net Cash Provided By Used In Investing Activities | -26.31 | -862.43 | -56.90 | -23.56 | 14.57 | 13.97 | -6.24 | -23.10 | -48.83 | -49.68 | 158.13 | |
| Payments To Acquire Property Plant And Equipment | 10.52 | 5.33 | 3.67 | 2.42 | 2.69 | 4.04 | 16.50 | 24.65 | 26.47 | 12.58 | 6.88 |
| 2024-03-31 | 2023-12-31 | 2023-09-30 | 2023-06-30 | 2023-03-31 | 2022-12-31 | 2022-09-30 | 2022-06-30 | 2022-03-31 | 2021-12-31 | 2021-09-30 | ||
|---|---|---|---|---|---|---|---|---|---|---|---|---|
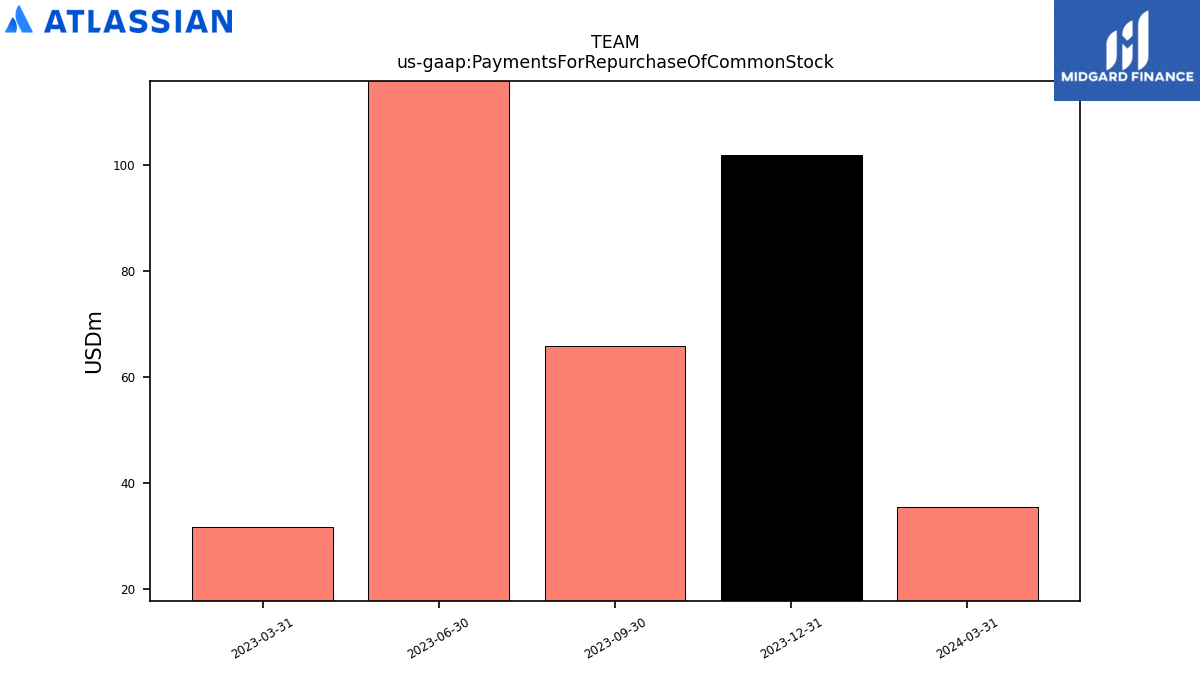
| Net Cash Provided By Used In Financing Activities | -47.88 | -114.27 | -65.88 | -118.07 | -31.75 | 0.00 | 1.40 | 4.38 | 9.53 | -779.85 | 366.67 | |
| Payments For Repurchase Of Common Stock | 35.38 | 101.77 | 65.88 | 118.26 | 31.75 | NA | NA | NA | NA | NA | NA |
| 2024-03-31 | 2023-12-31 | 2023-09-30 | 2023-06-30 | 2023-03-31 | 2022-12-31 | 2022-09-30 | 2022-06-30 | 2022-03-31 | 2021-12-31 | 2021-09-30 | ||
|---|---|---|---|---|---|---|---|---|---|---|---|---|
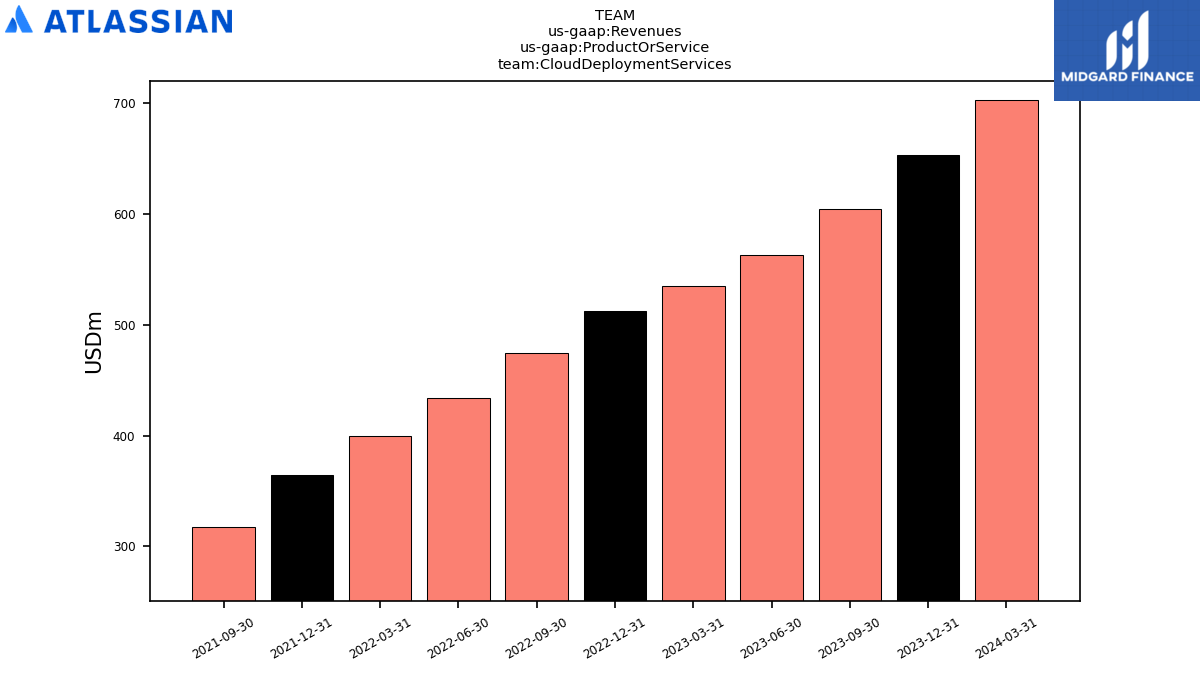
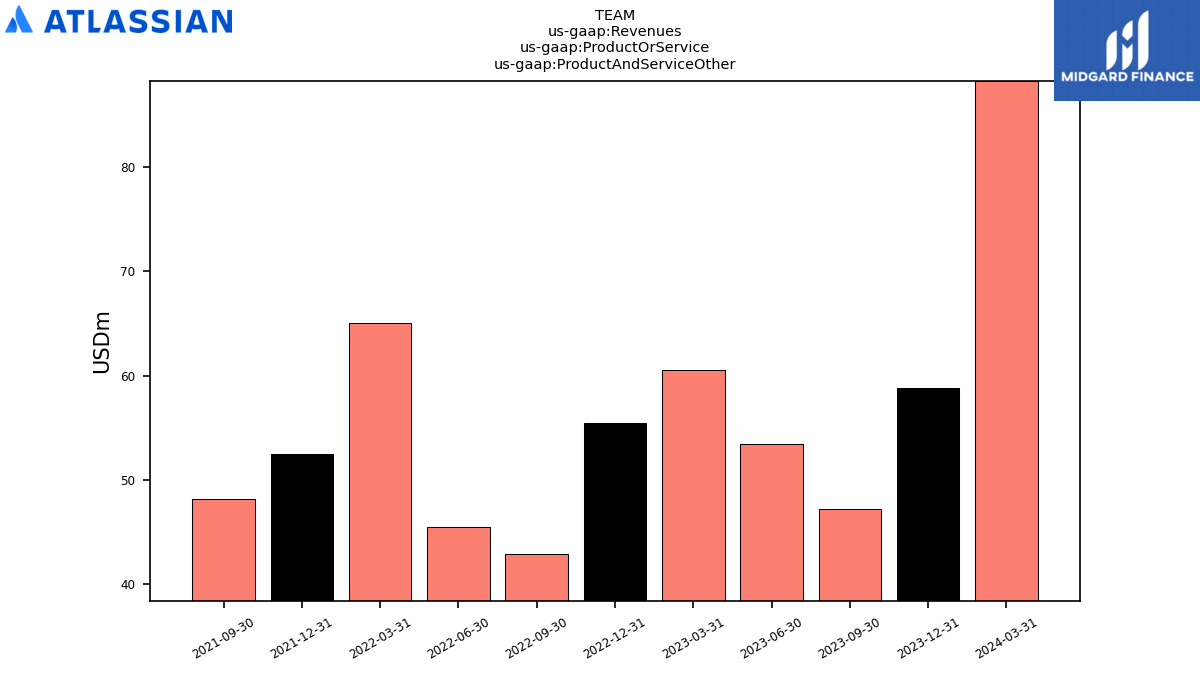
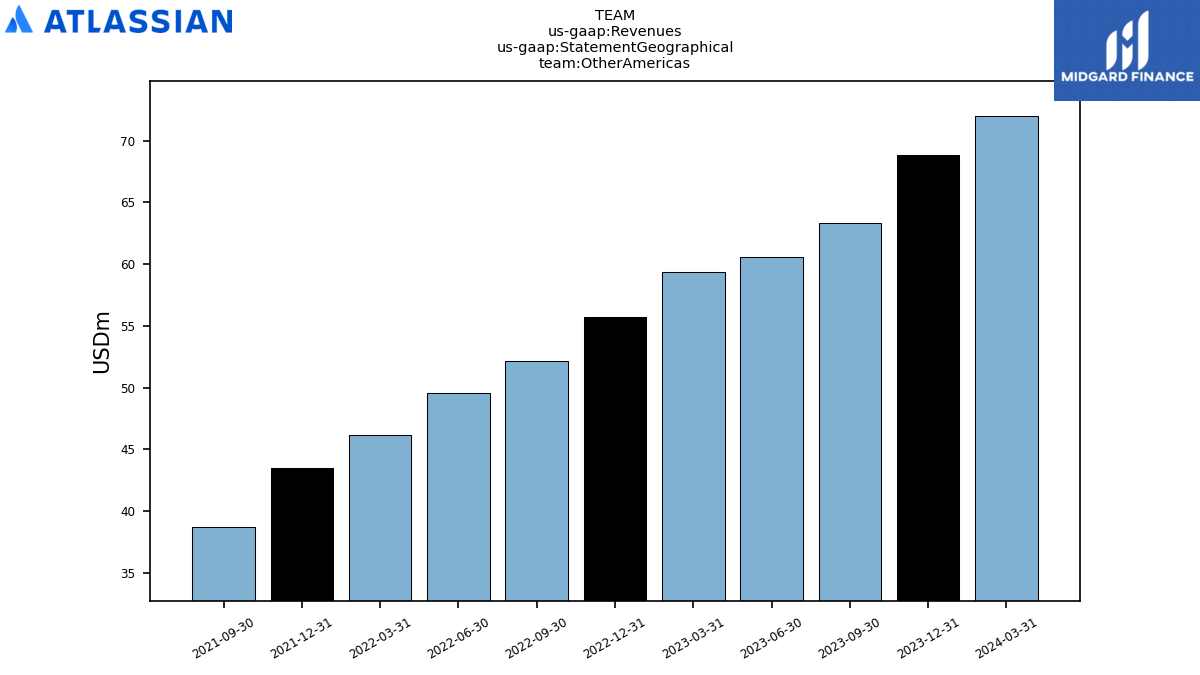
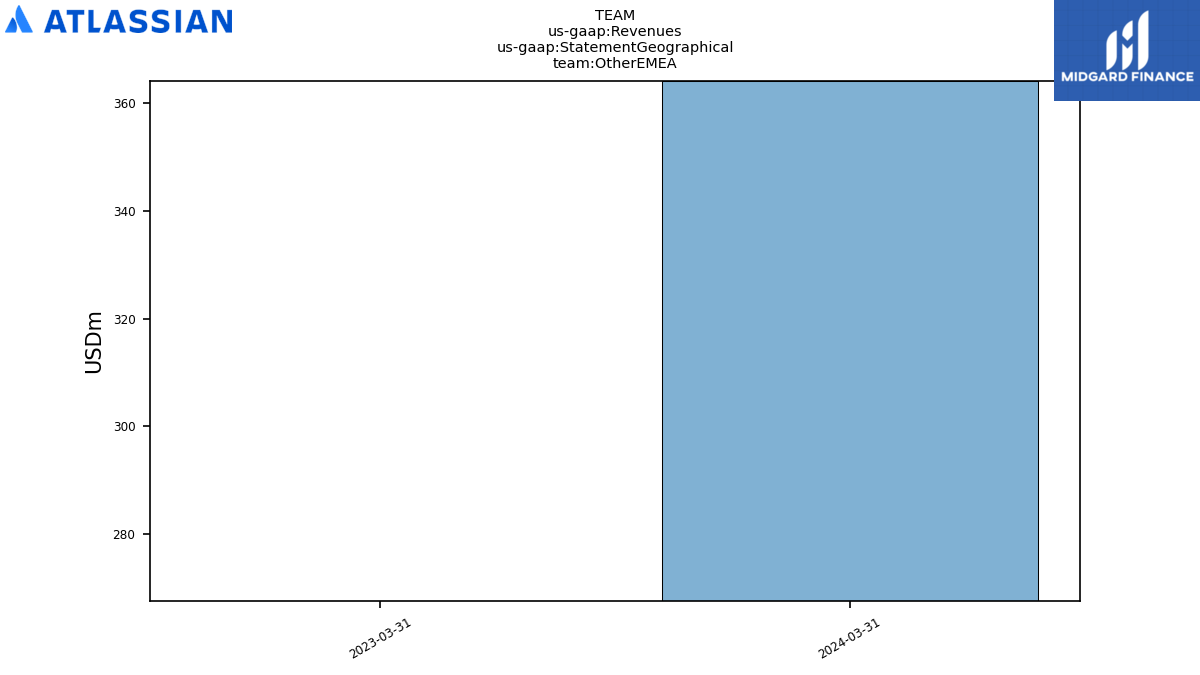
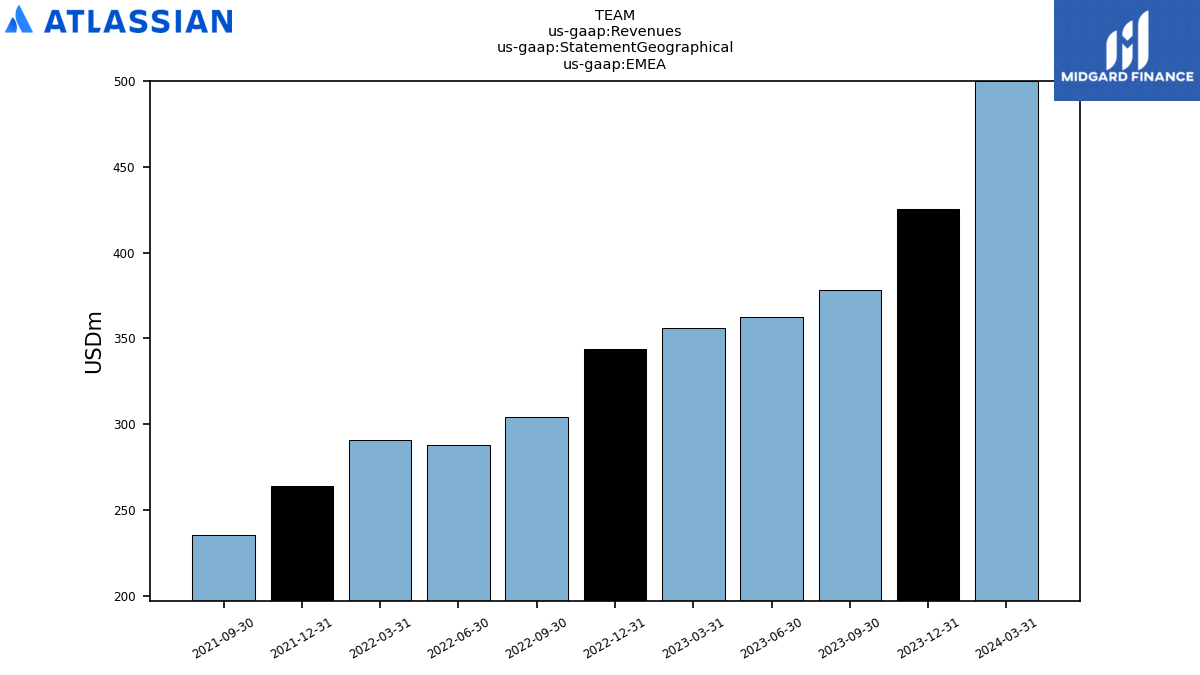
| Revenues | 1189.13 | 1060.11 | 977.77 | 939.10 | 915.45 | 872.70 | 807.39 | 759.84 | 740.49 | 688.53 | 614.02 | |
| Cloud Deployment Services | 703.04 | 653.21 | 604.65 | 563.23 | 534.89 | 512.34 | 475.04 | 433.97 | 399.45 | 364.10 | 317.90 | |
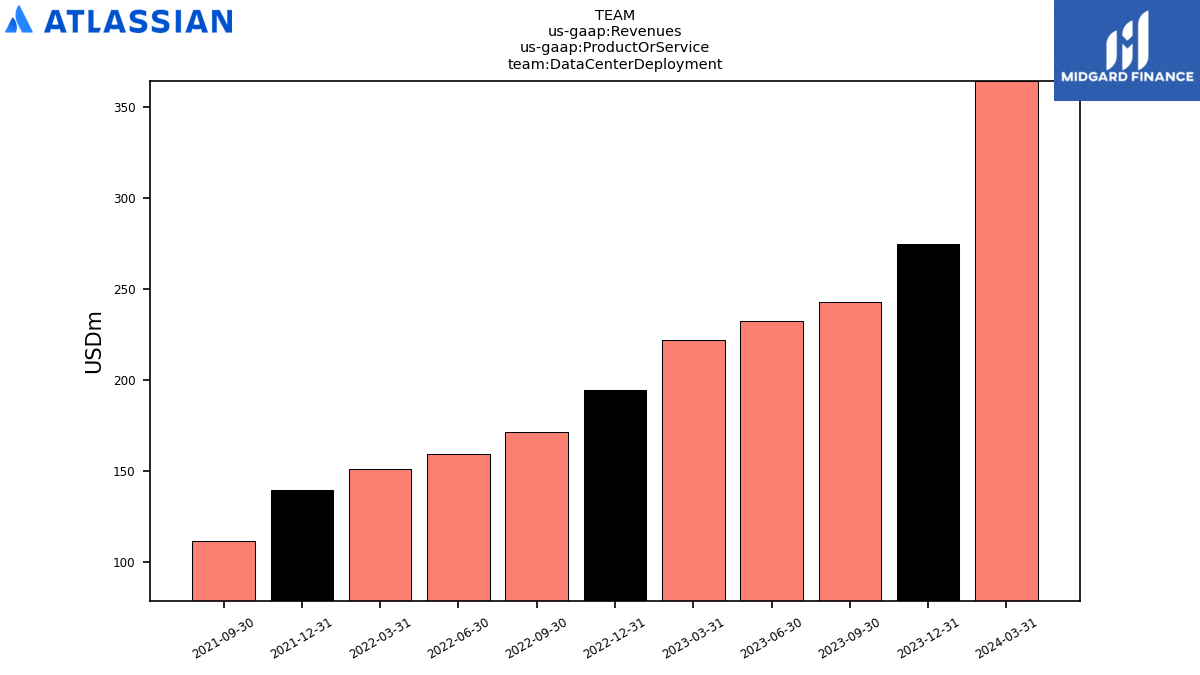
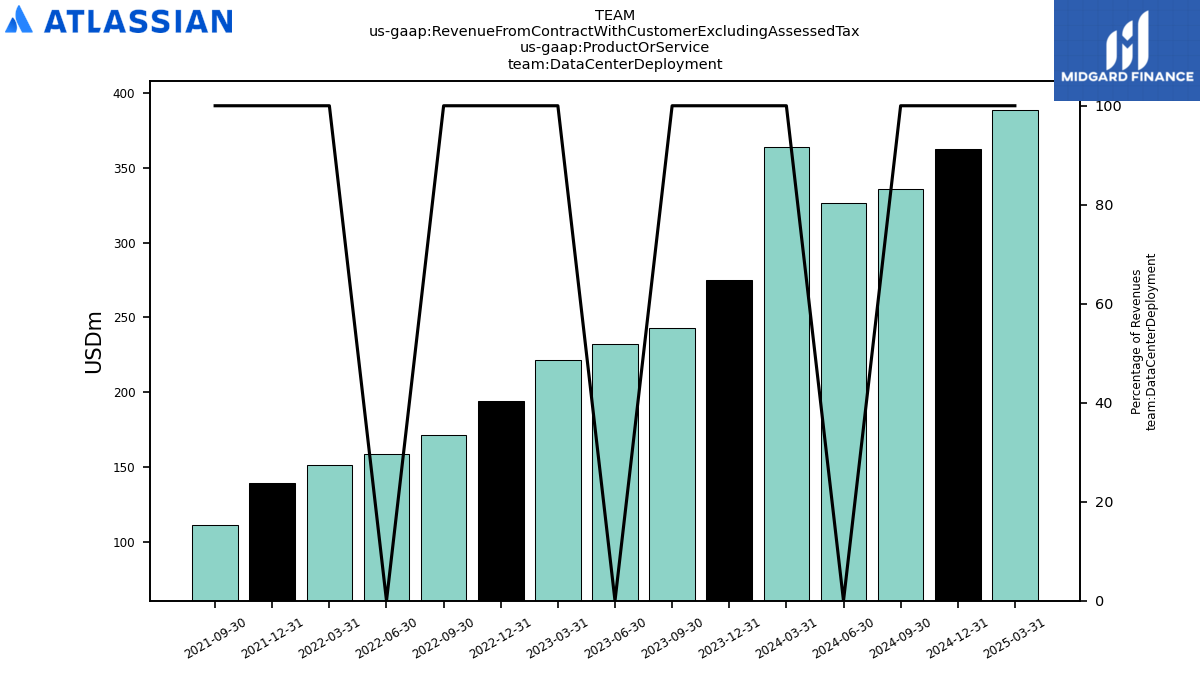
| Data Center Deployment | 364.13 | 274.76 | 242.94 | 232.21 | 221.55 | 194.26 | 171.23 | 158.92 | 151.09 | 139.11 | 111.19 | |
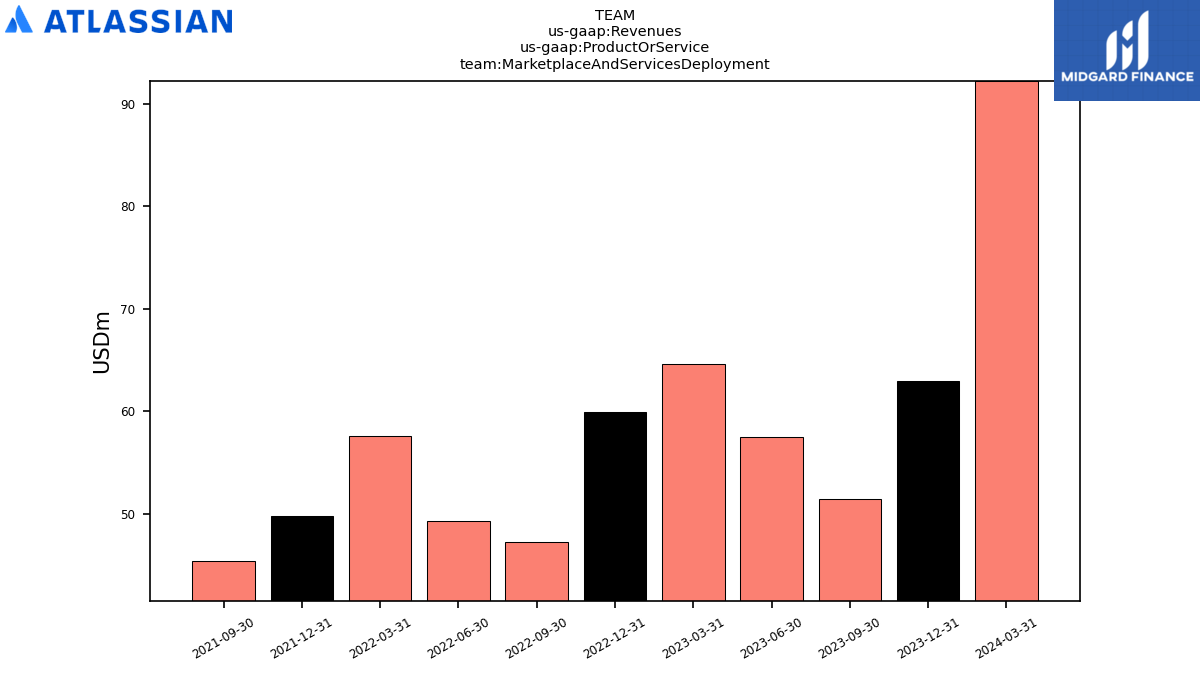
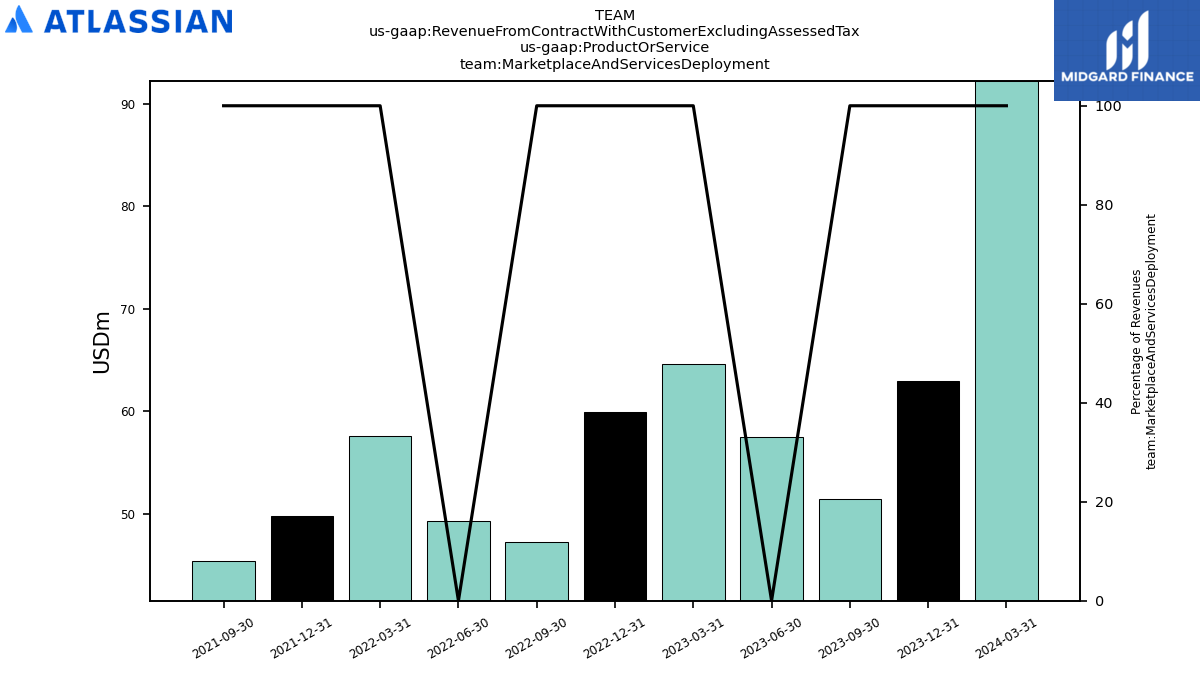
| Marketplace And Services Deployment | 92.24 | 62.97 | 51.43 | 57.51 | 64.62 | 59.94 | 47.31 | 49.32 | 57.61 | 49.80 | 45.38 | |
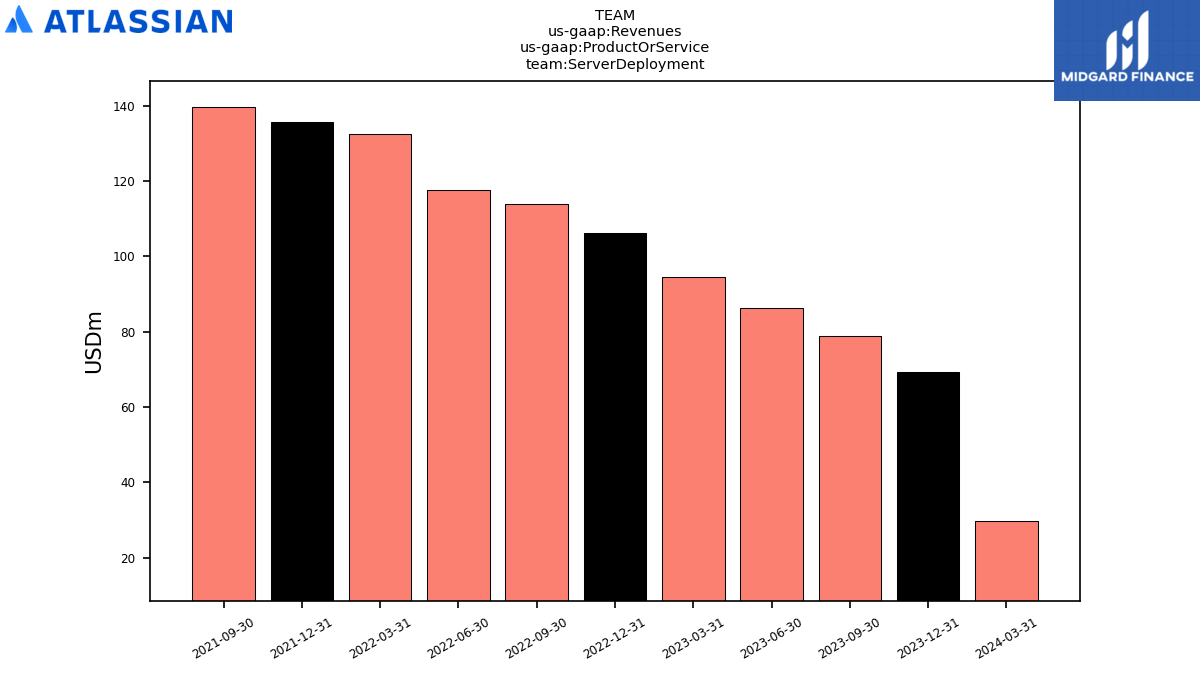
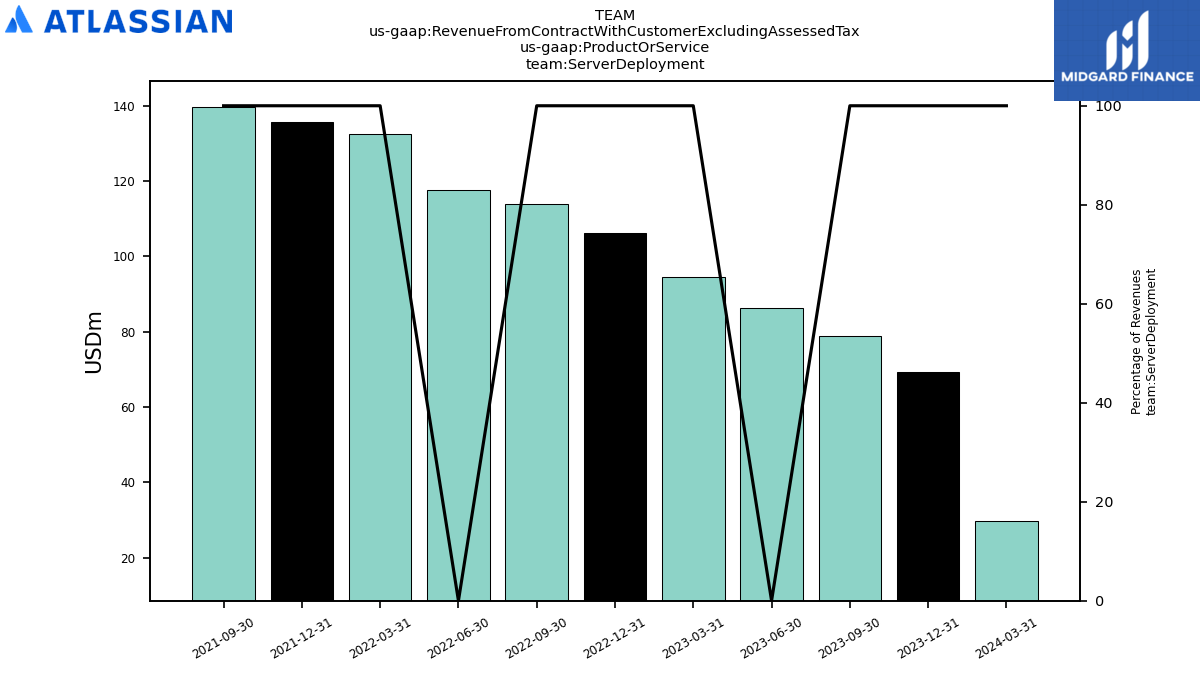
| Server Deployment | 29.72 | 69.17 | 78.75 | 86.15 | 94.39 | 106.17 | 113.81 | 117.63 | 132.33 | 135.52 | 139.55 | |
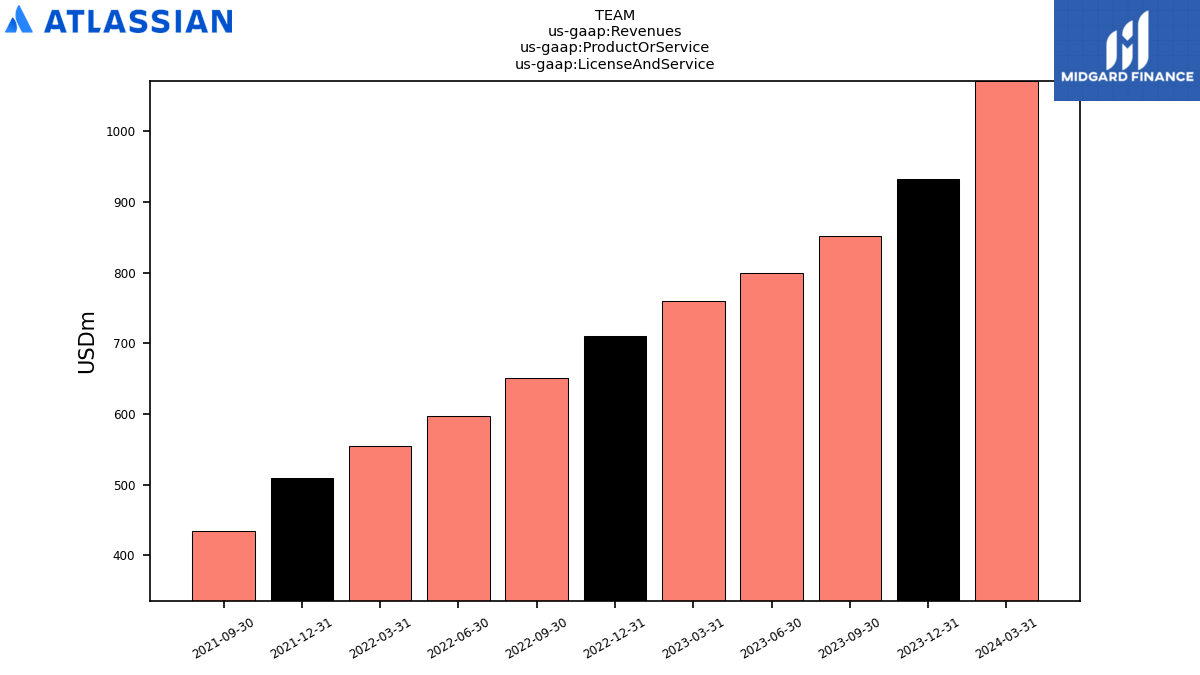
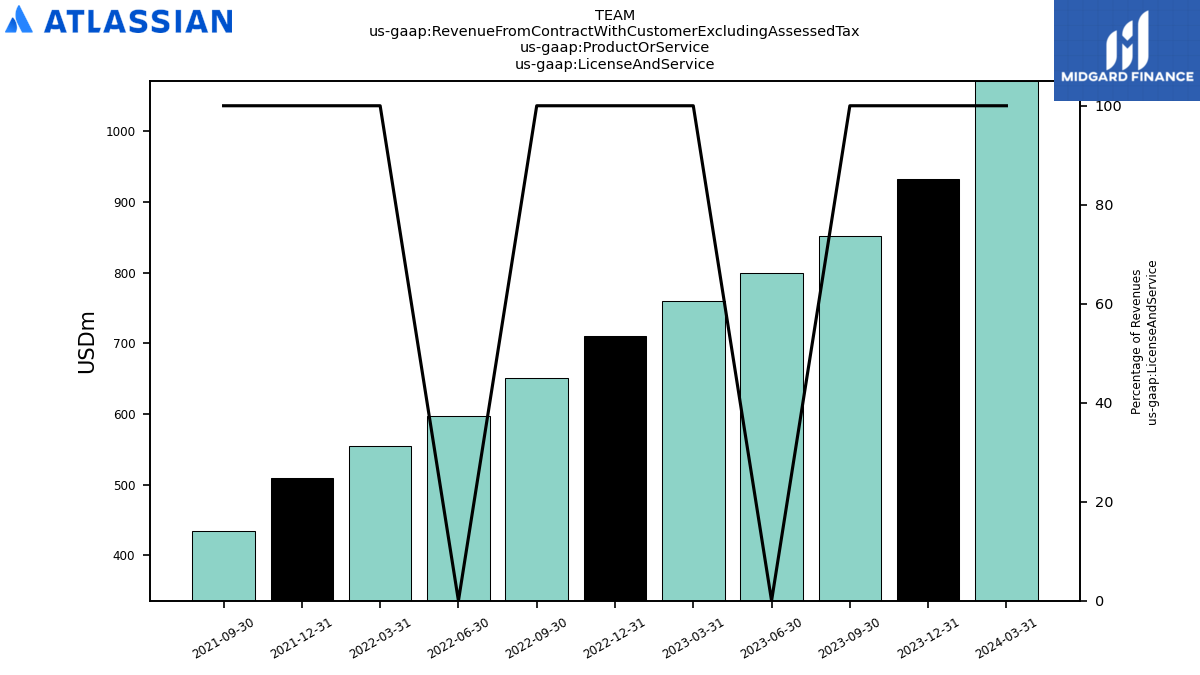
| License And Service | 1071.36 | 932.18 | 851.98 | 799.71 | 760.68 | 711.20 | 650.98 | 597.30 | 555.13 | 508.99 | 435.30 | |
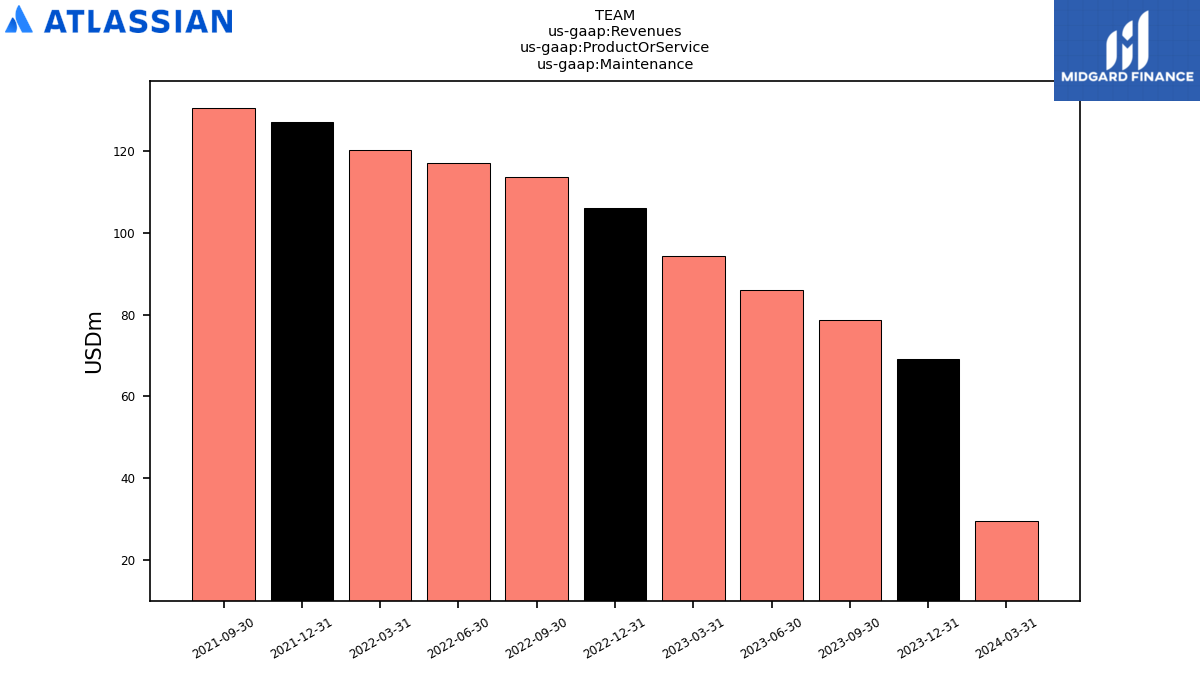
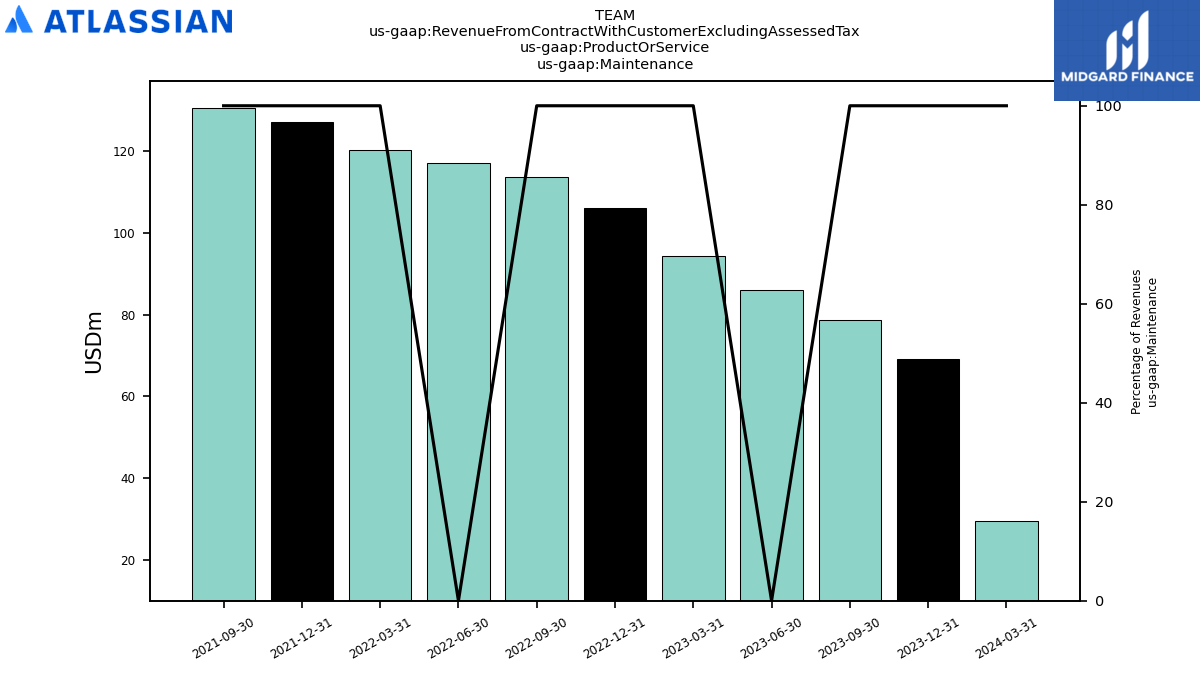
| Maintenance | 29.53 | 69.10 | 78.60 | 85.92 | 94.22 | 106.02 | 113.56 | 117.09 | 120.33 | 127.06 | 130.59 | |
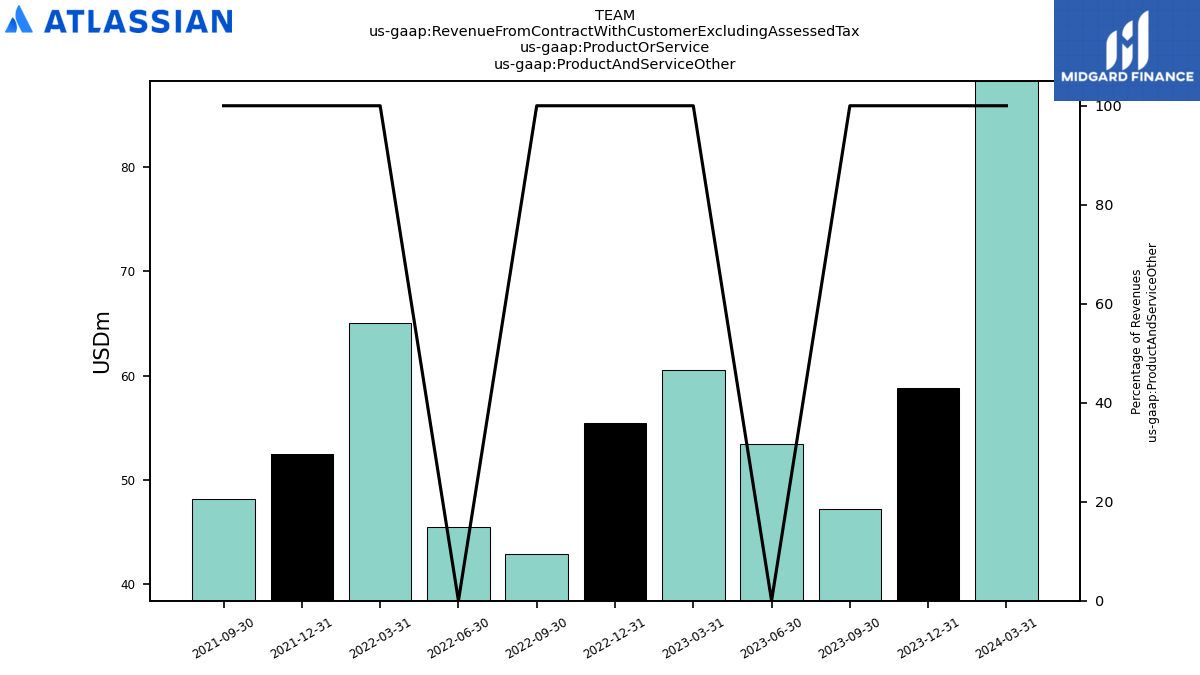
| Product And Service Other | 88.24 | 58.83 | 47.20 | 53.46 | 60.55 | 55.48 | 42.84 | 45.45 | 65.03 | 52.48 | 48.14 | |
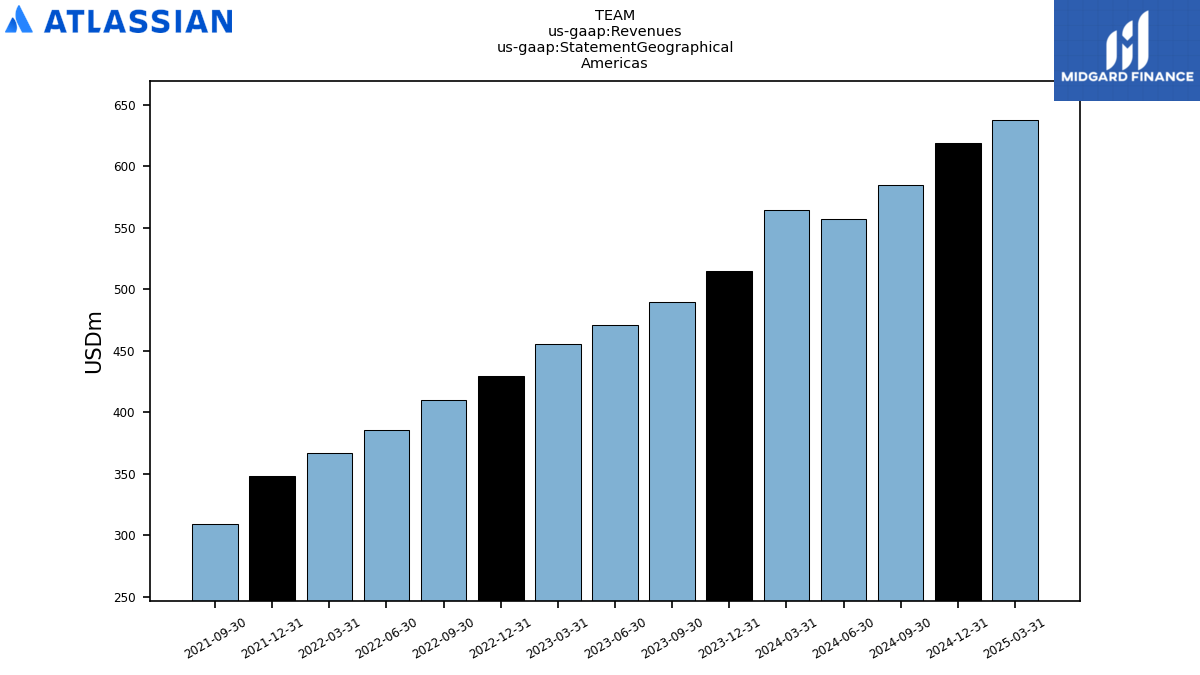
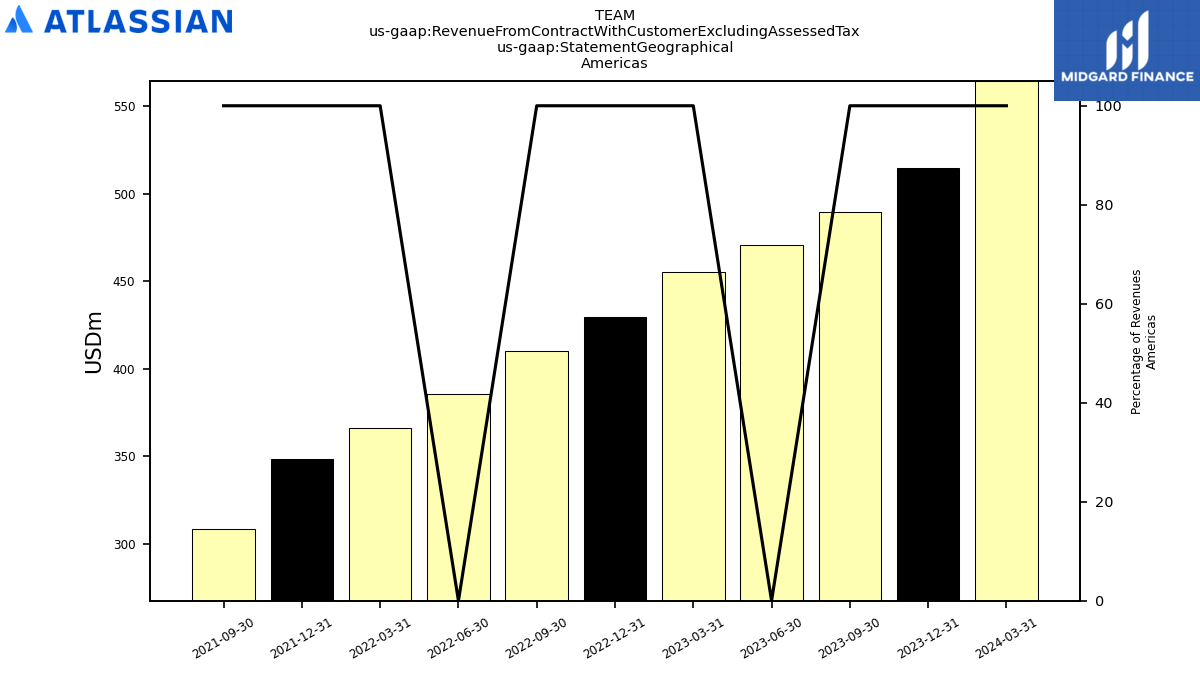
| 564.39 | 514.43 | 489.53 | 470.49 | 455.04 | 429.71 | 409.92 | 385.50 | 366.39 | 348.26 | 308.72 | ||
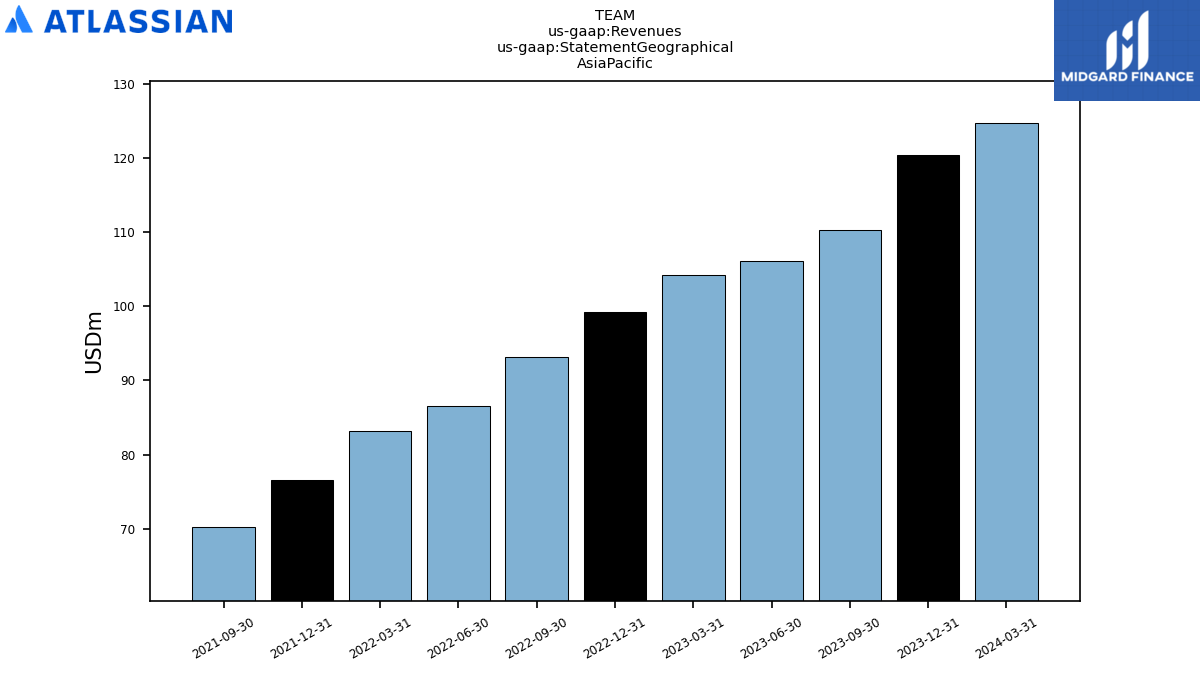
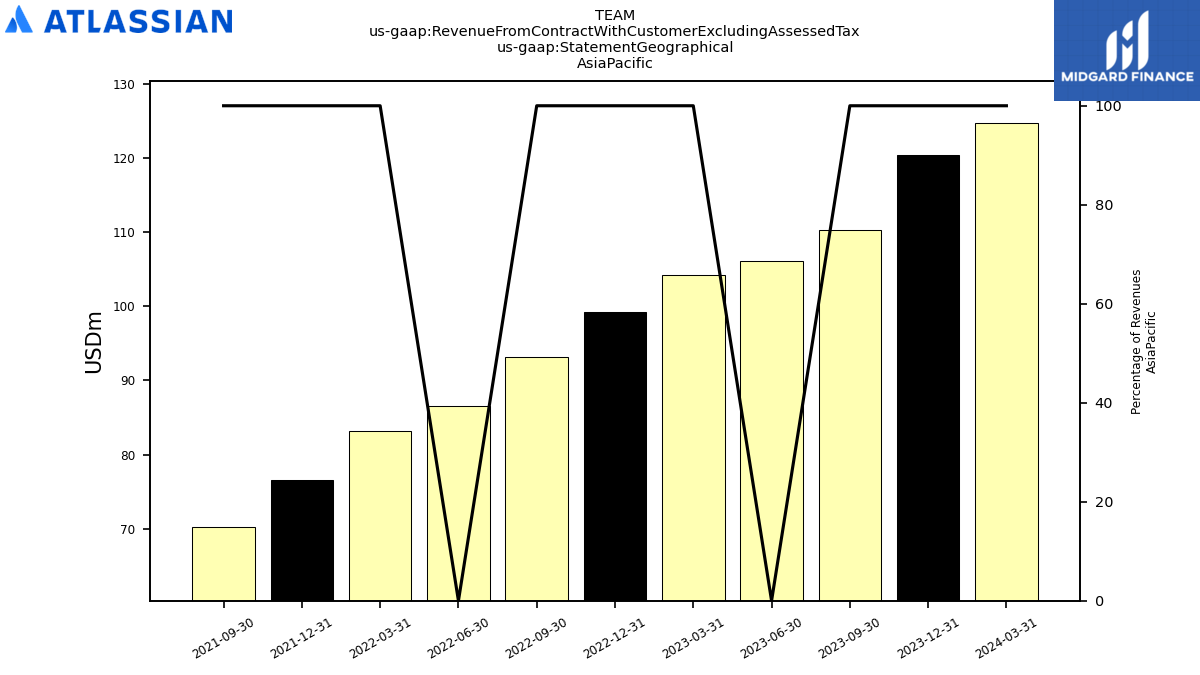
| 124.74 | 120.38 | 110.24 | 106.16 | 104.17 | 99.22 | 93.19 | 86.58 | 83.24 | 76.58 | 70.29 | ||
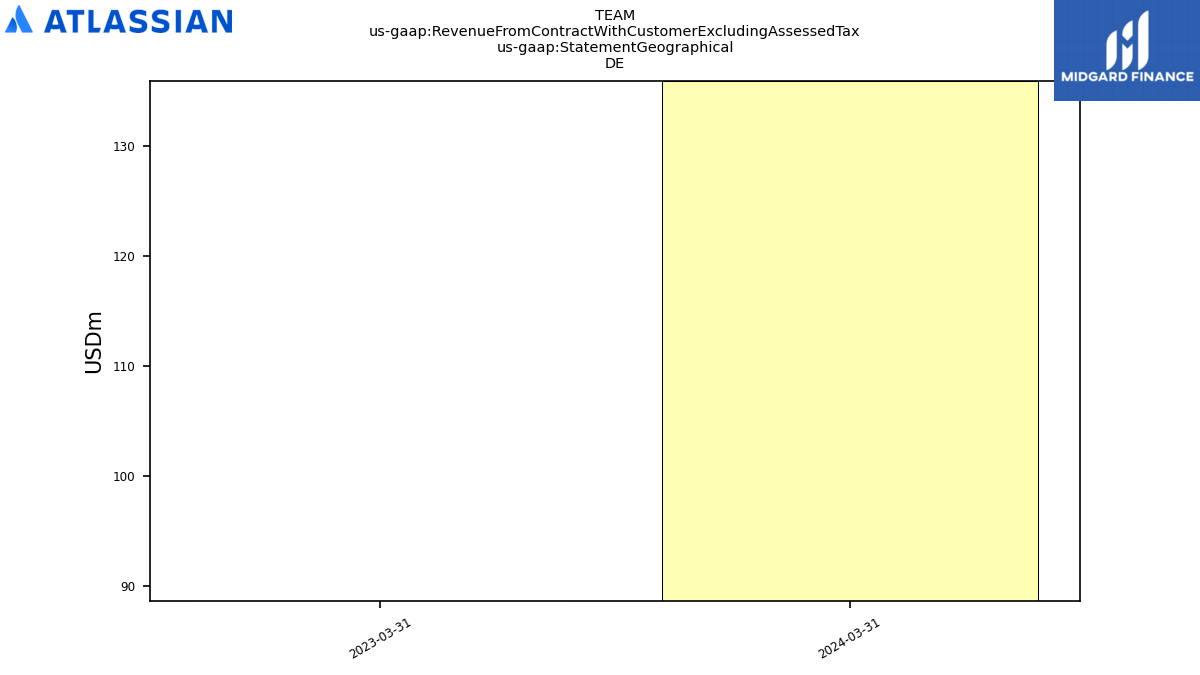
| 135.86 | NA | NA | NA | 88.68 | NA | NA | NA | NA | NA | NA | ||
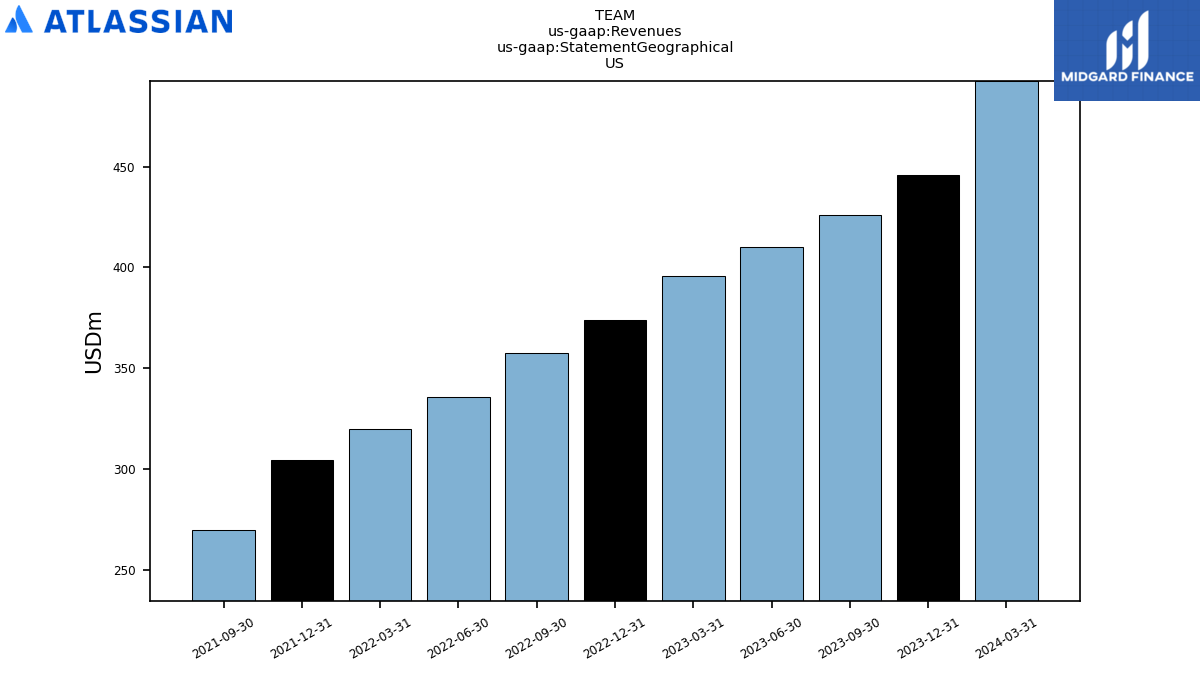
| US | 492.38 | 445.62 | 426.19 | 409.94 | 395.67 | 373.98 | 357.75 | 335.90 | 320.19 | 304.75 | 269.96 | |
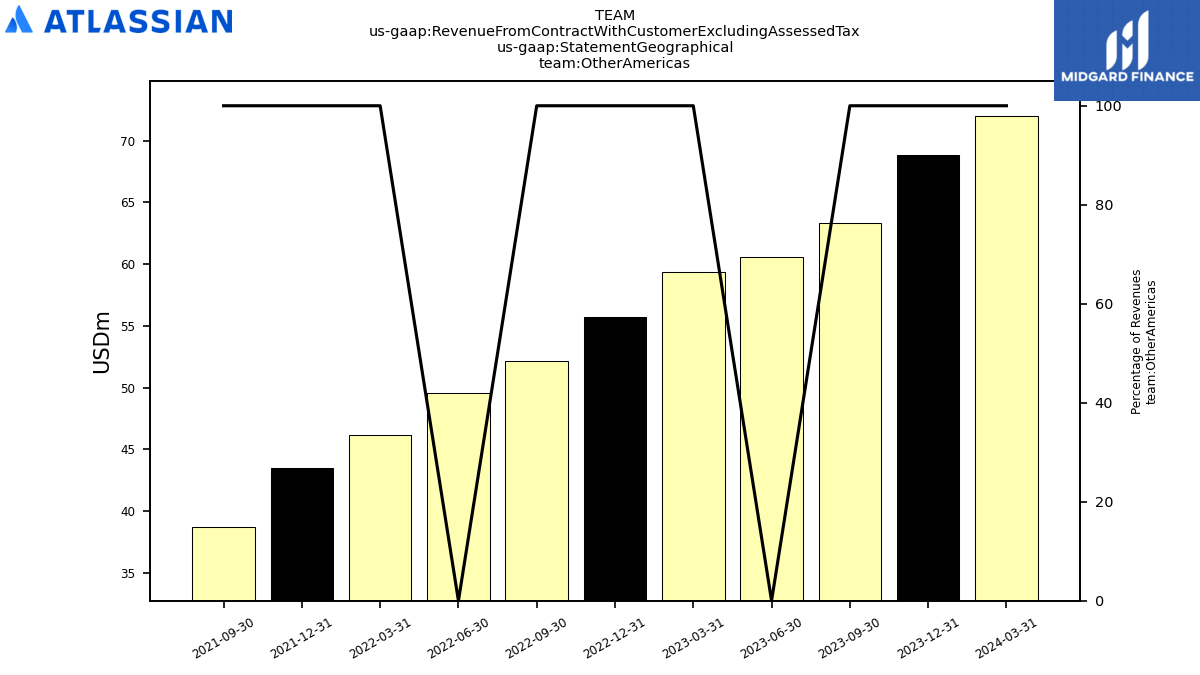
| Other Americas | 72.00 | 68.81 | 63.34 | 60.55 | 59.38 | 55.73 | 52.17 | 49.60 | 46.20 | 43.50 | 38.76 | |
| Other E M E A | 364.14 | NA | NA | NA | 267.56 | NA | NA | NA | NA | NA | NA | |
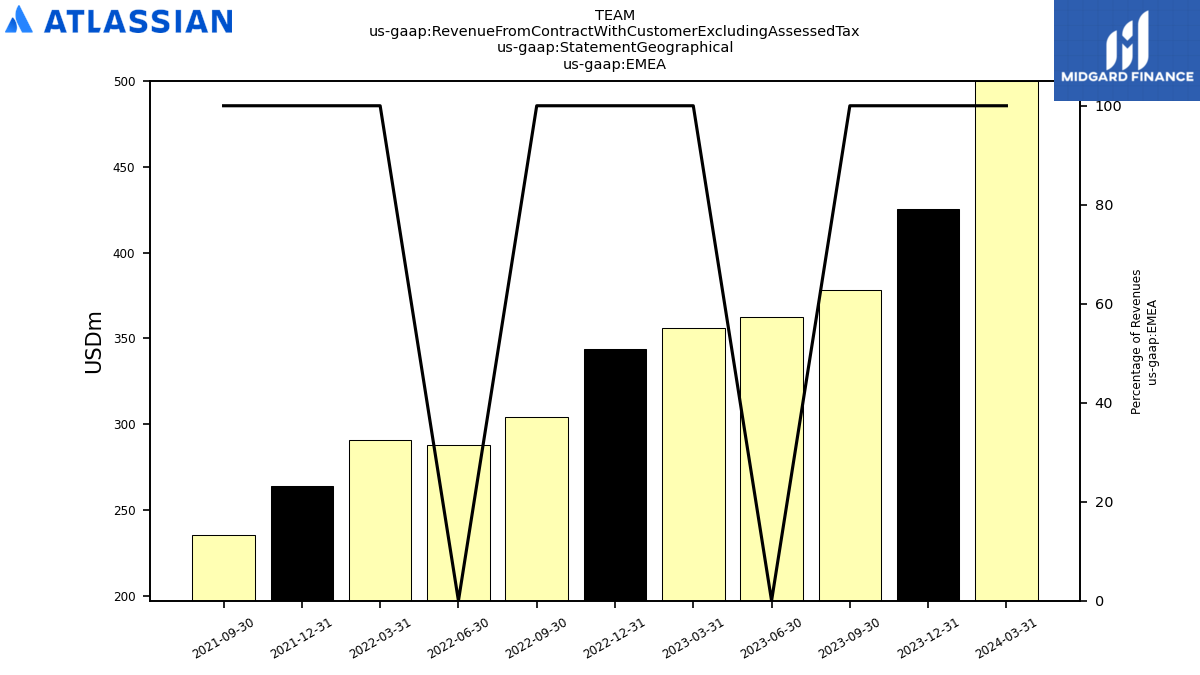
| EMEA | 500.00 | 425.29 | 378.01 | 362.45 | 356.24 | 343.77 | 304.28 | 287.76 | 290.87 | 263.69 | 235.01 | |
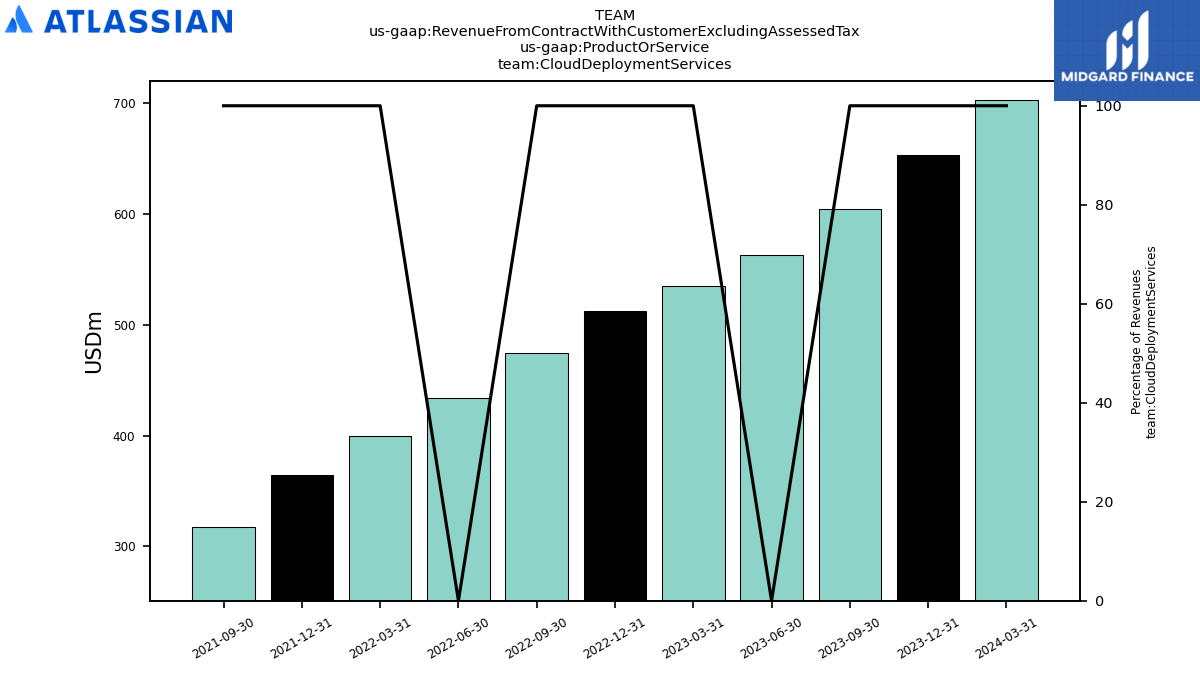
| Revenue From Contract With Customer Excluding Assessed Tax | 1189.13 | 1060.11 | 977.77 | 939.10 | 915.45 | 872.70 | 807.39 | 759.84 | 740.49 | 688.53 | 614.02 | |
| Cloud Deployment Services | 703.04 | 653.21 | 604.65 | 563.23 | 534.89 | 512.34 | 475.04 | 433.97 | 399.45 | 364.10 | 317.90 | |
| Data Center Deployment | 364.13 | 274.76 | 242.94 | 232.21 | 221.55 | 194.26 | 171.23 | 158.92 | 151.09 | 139.11 | 111.19 | |
| Marketplace And Services Deployment | 92.24 | 62.97 | 51.43 | 57.51 | 64.62 | 59.94 | 47.31 | 49.32 | 57.61 | 49.80 | 45.38 | |
| Server Deployment | 29.72 | 69.17 | 78.75 | 86.15 | 94.39 | 106.17 | 113.81 | 117.63 | 132.33 | 135.52 | 139.55 | |
| License And Service | 1071.36 | 932.18 | 851.98 | 799.71 | 760.68 | 711.20 | 650.98 | 597.30 | 555.13 | 508.99 | 435.30 | |
| Maintenance | 29.53 | 69.10 | 78.60 | 85.92 | 94.22 | 106.02 | 113.56 | 117.09 | 120.33 | 127.06 | 130.59 | |
| Product And Service Other | 88.24 | 58.83 | 47.20 | 53.46 | 60.55 | 55.48 | 42.84 | 45.45 | 65.03 | 52.48 | 48.14 | |
| 564.39 | 514.43 | 489.53 | 470.49 | 455.04 | 429.71 | 409.92 | 385.50 | 366.39 | 348.26 | 308.72 | ||
| 124.74 | 120.38 | 110.24 | 106.16 | 104.17 | 99.22 | 93.19 | 86.58 | 83.24 | 76.58 | 70.29 | ||
| 135.86 | NA | NA | NA | 88.68 | NA | NA | NA | NA | NA | NA | ||
| US | 492.38 | 445.62 | 426.19 | 409.94 | 395.67 | 373.98 | 357.75 | 335.90 | 320.19 | 304.75 | 269.96 | |
| Other Americas | 72.00 | 68.81 | 63.34 | 60.55 | 59.38 | 55.73 | 52.17 | 49.60 | 46.20 | 43.50 | 38.76 | |
| Other E M E A | 364.14 | NA | NA | NA | 267.56 | NA | NA | NA | NA | NA | NA | |
| EMEA | 500.00 | 425.29 | 378.01 | 362.45 | 356.24 | 343.77 | 304.28 | 287.76 | 290.87 | 263.69 | 235.01 |