
| 2024-03-31 | 2023-12-31 | 2023-09-30 | 2023-06-30 | 2023-03-31 | 2022-12-31 | 2022-09-30 | 2022-06-30 | 2022-03-31 | 2021-12-31 | 2021-09-30 | 2021-06-30 | 2021-03-31 | 2020-12-31 | 2020-09-30 | 2020-06-30 | 2020-03-31 | 2019-12-31 | 2019-09-30 | 2019-06-30 | 2019-03-31 | 2018-12-31 | 2018-09-30 | 2018-06-30 | 2018-03-31 | 2017-12-31 | 2017-09-30 | ||
|---|---|---|---|---|---|---|---|---|---|---|---|---|---|---|---|---|---|---|---|---|---|---|---|---|---|---|---|---|
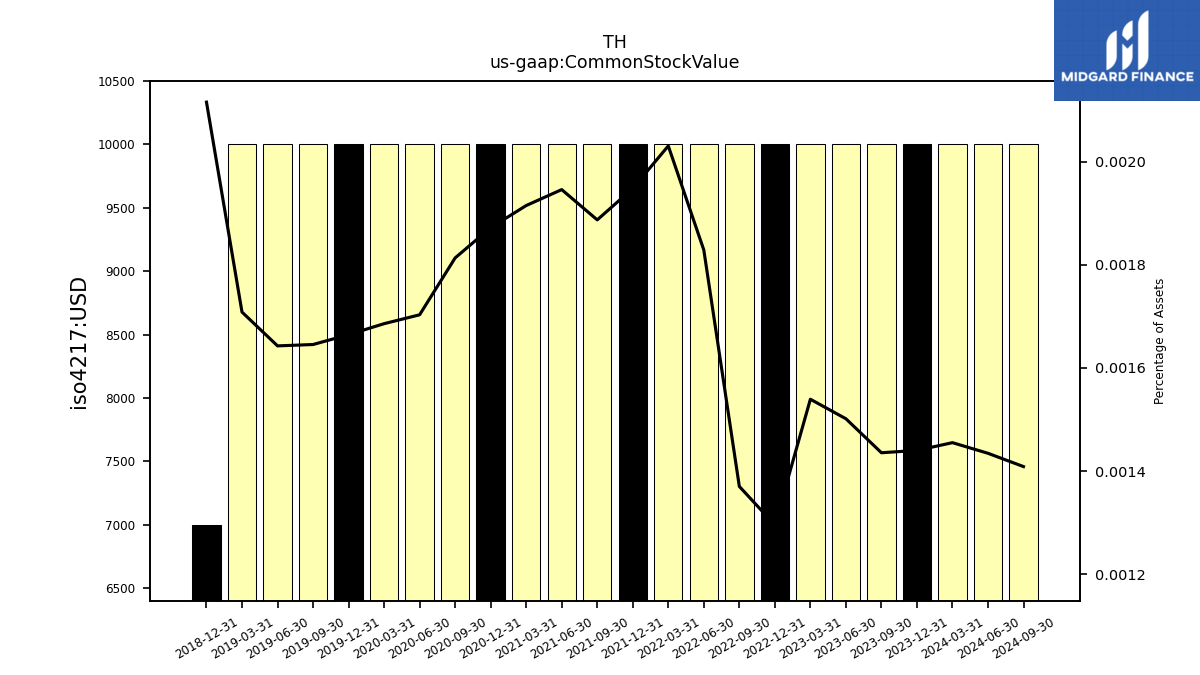
| Common Stock Value | 0.01 | 0.01 | 0.01 | 0.01 | 0.01 | 0.01 | 0.01 | 0.01 | 0.01 | 0.01 | 0.01 | 0.01 | 0.01 | 0.01 | 0.01 | 0.01 | 0.01 | 0.01 | 0.01 | 0.01 | 0.01 | 0.01 | NA | NA | NA | NA | NA | |
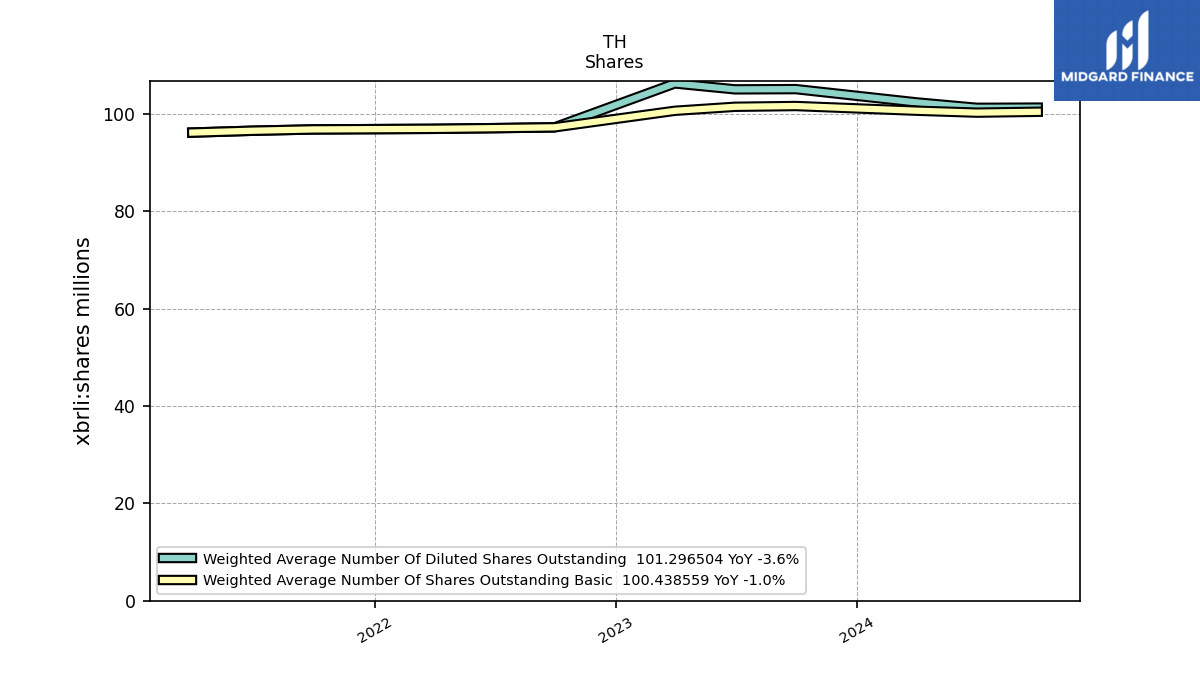
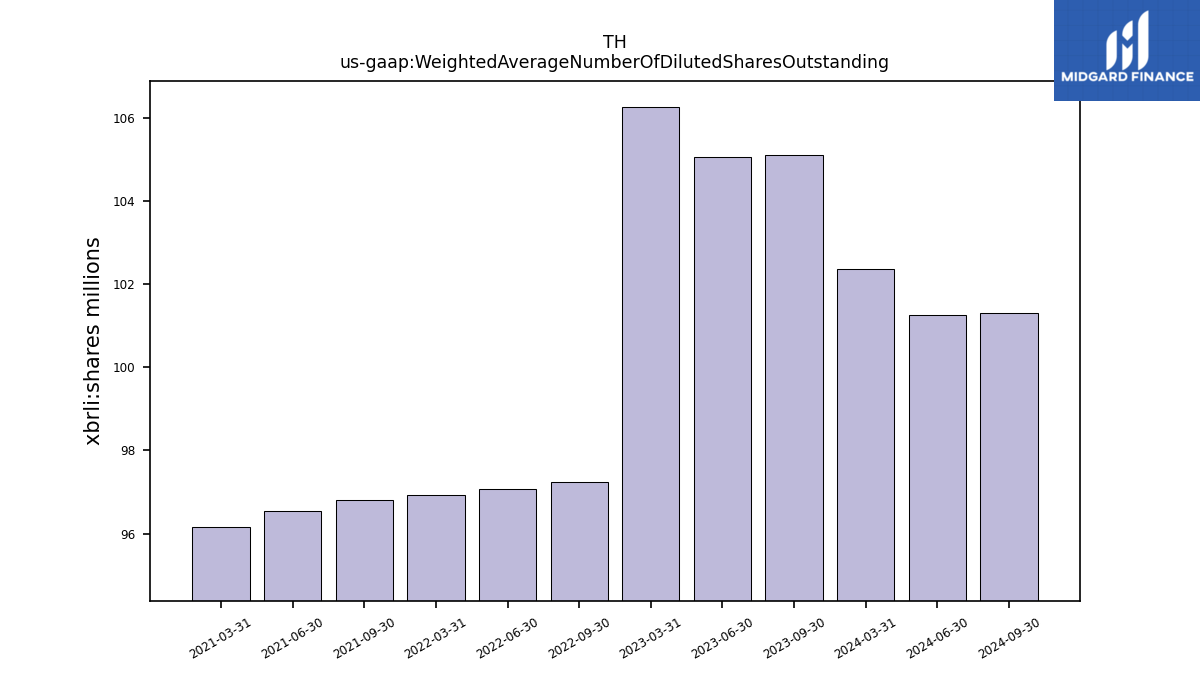
| Weighted Average Number Of Diluted Shares Outstanding | 102.36 | NA | 105.09 | 105.05 | 106.26 | NA | 97.24 | 97.08 | 96.94 | NA | 96.81 | 96.55 | 96.17 | NA | NA | NA | NA | NA | NA | NA | NA | NA | NA | NA | NA | NA | NA | |
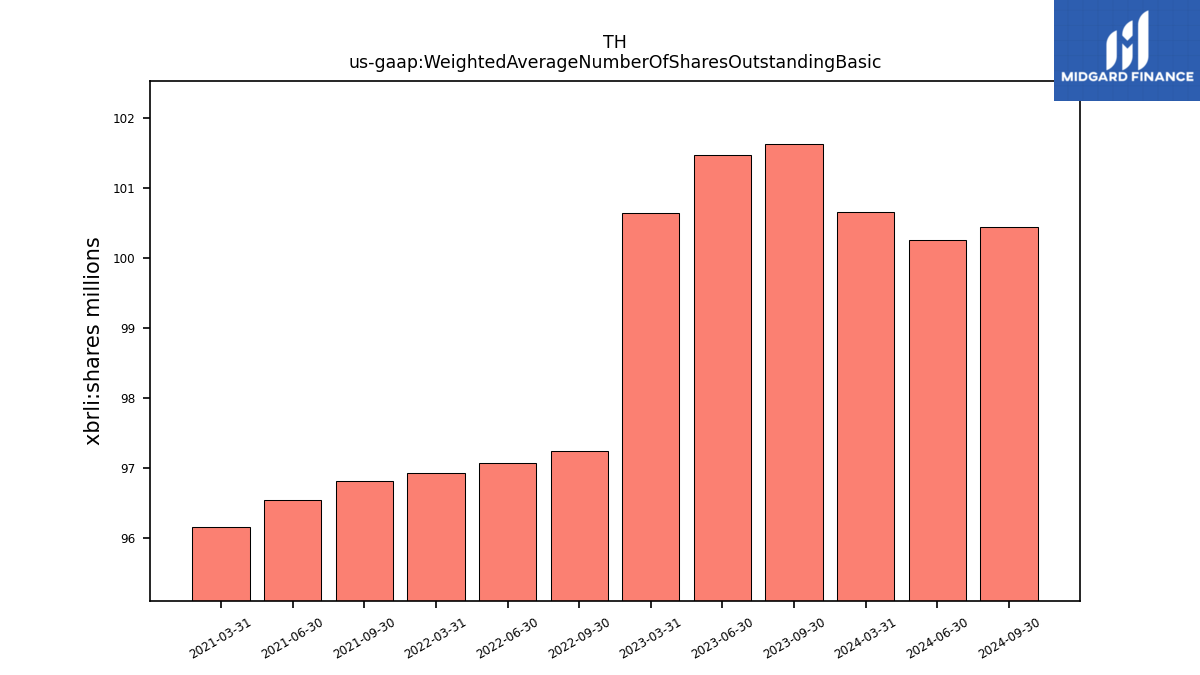
| Weighted Average Number Of Shares Outstanding Basic | 100.66 | NA | 101.62 | 101.47 | 100.64 | NA | 97.24 | 97.08 | 96.94 | NA | 96.81 | 96.55 | 96.17 | NA | NA | NA | NA | NA | NA | NA | NA | NA | NA | NA | NA | NA | NA | |
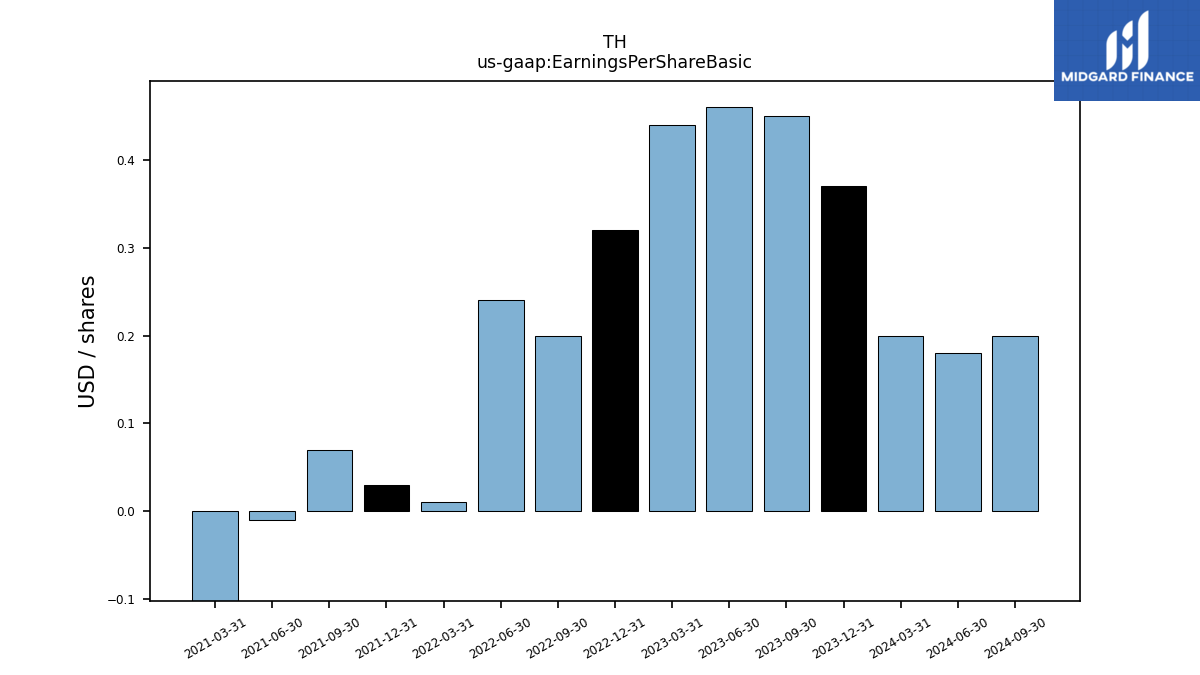
| Earnings Per Share Basic | 0.20 | 0.37 | 0.45 | 0.46 | 0.44 | 0.32 | 0.20 | 0.24 | 0.01 | 0.03 | 0.07 | -0.01 | -0.14 | NA | NA | NA | NA | NA | NA | NA | NA | NA | NA | NA | NA | NA | NA | |
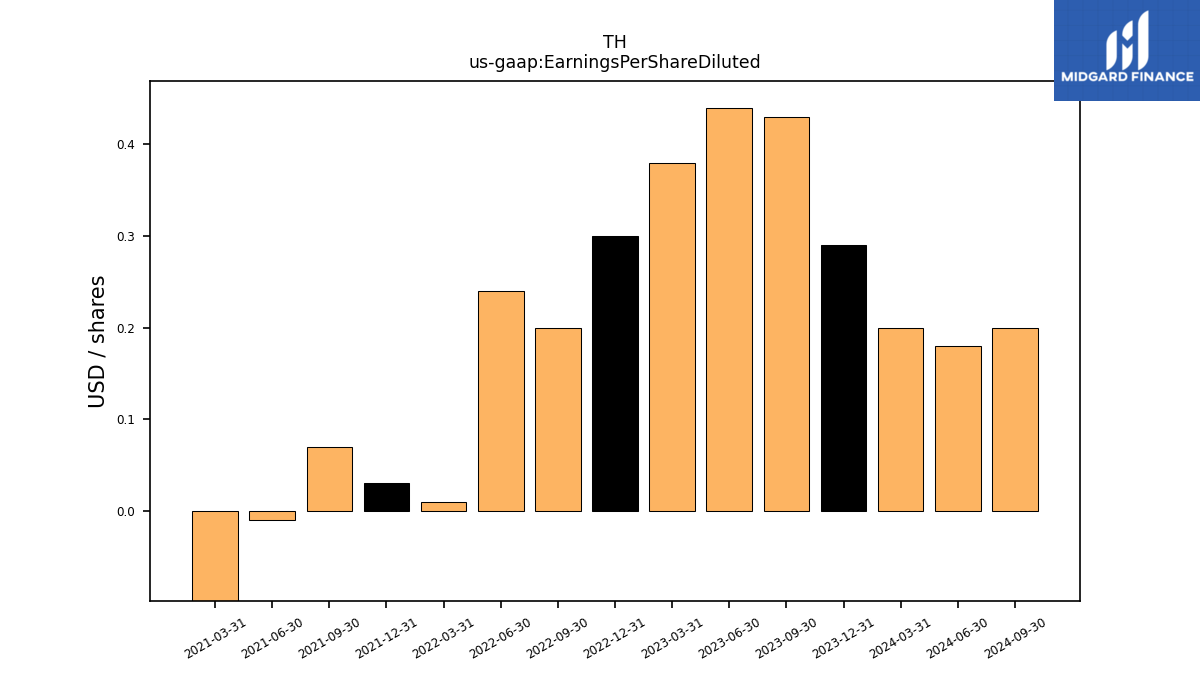
| Earnings Per Share Diluted | 0.20 | 0.29 | 0.43 | 0.44 | 0.38 | 0.30 | 0.20 | 0.24 | 0.01 | 0.03 | 0.07 | -0.01 | -0.14 | NA | NA | NA | NA | NA | NA | NA | NA | NA | NA | NA | NA | NA | NA |
| 2024-03-31 | 2023-12-31 | 2023-09-30 | 2023-06-30 | 2023-03-31 | 2022-12-31 | 2022-09-30 | 2022-06-30 | 2022-03-31 | 2021-12-31 | 2021-09-30 | 2021-06-30 | 2021-03-31 | 2020-12-31 | 2020-09-30 | 2020-06-30 | 2020-03-31 | 2019-12-31 | 2019-09-30 | 2019-06-30 | 2019-03-31 | 2018-12-31 | 2018-09-30 | 2018-06-30 | 2018-03-31 | 2017-12-31 | 2017-09-30 | ||
|---|---|---|---|---|---|---|---|---|---|---|---|---|---|---|---|---|---|---|---|---|---|---|---|---|---|---|---|---|
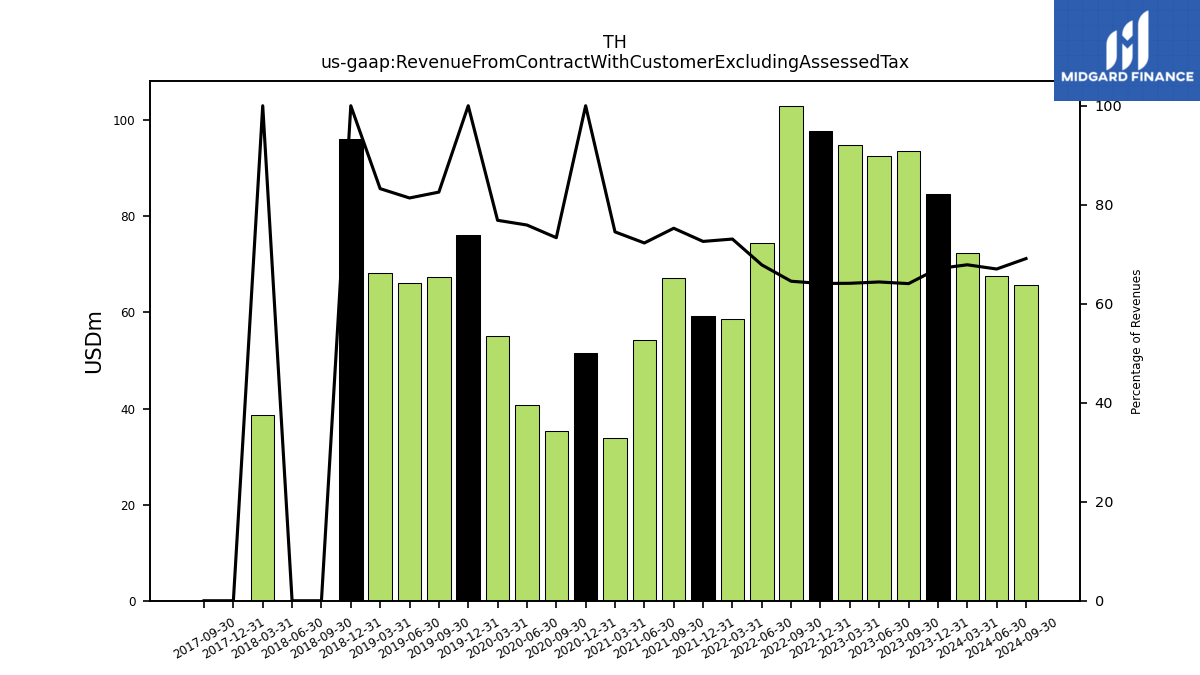
| Revenue From Contract With Customer Excluding Assessed Tax | 72.40 | 84.70 | 93.50 | 92.50 | 94.80 | 97.70 | 103.00 | 74.40 | 58.70 | 59.30 | 67.10 | 54.20 | 33.90 | 51.61 | 35.40 | 40.70 | 55.07 | 76.11 | 67.40 | 66.20 | 68.25 | 96.15 | 0.00 | 0.00 | 38.65 | 0.00 | 0.00 | |
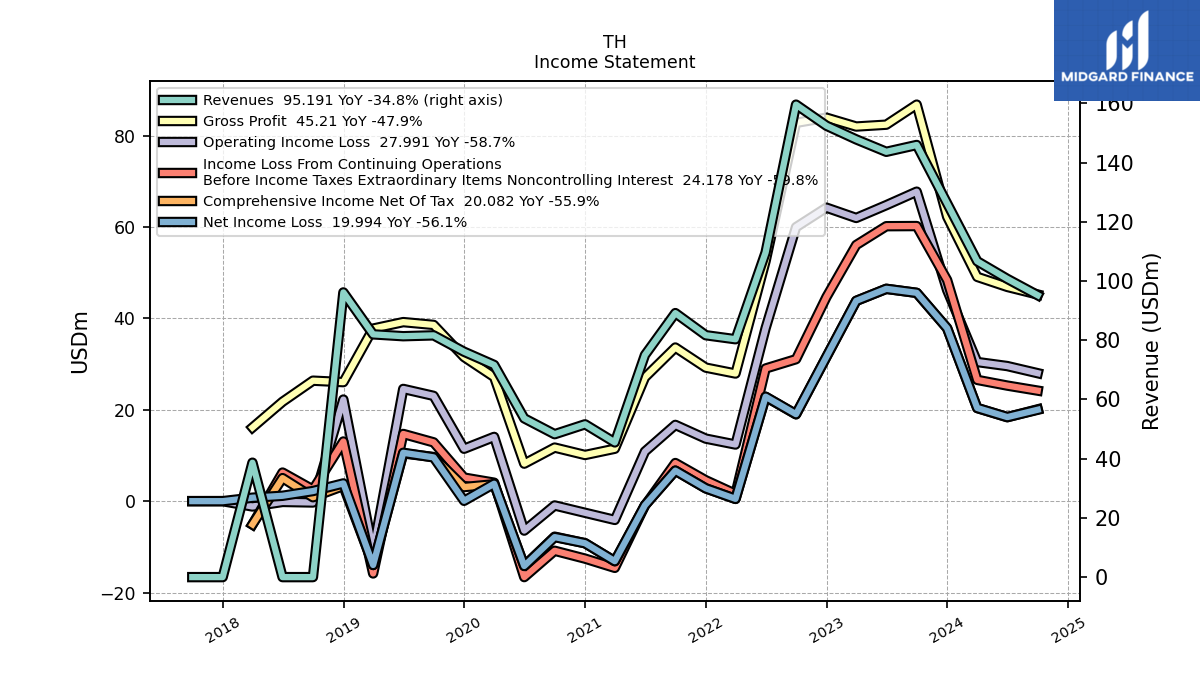
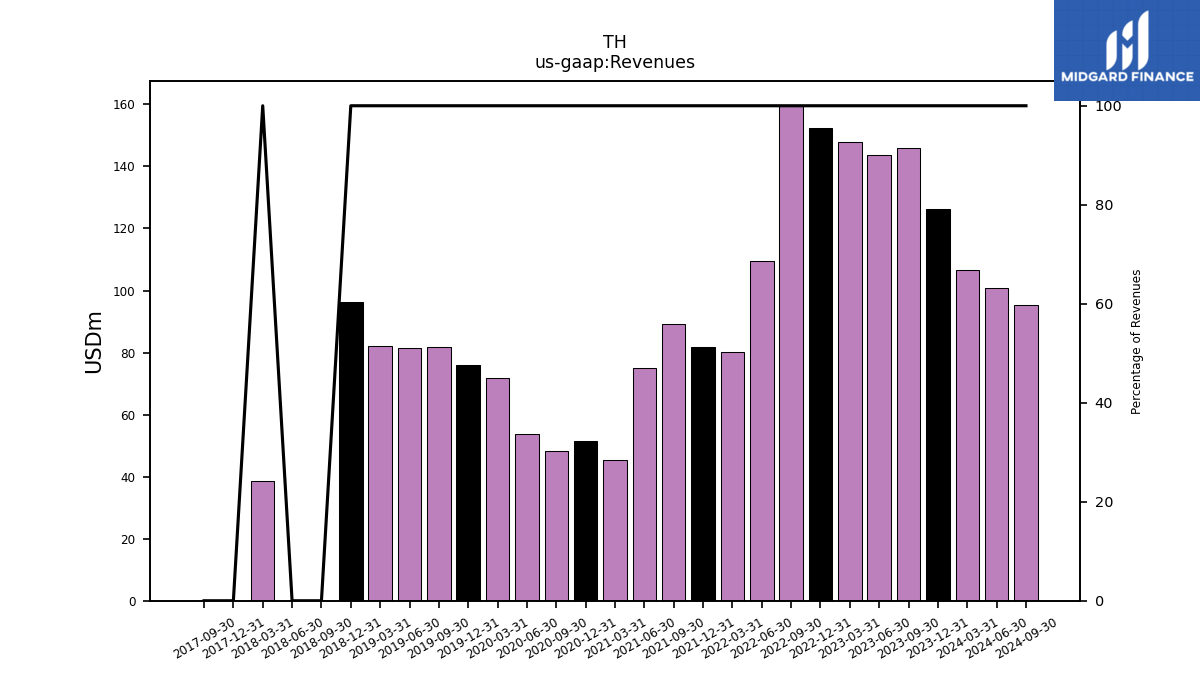
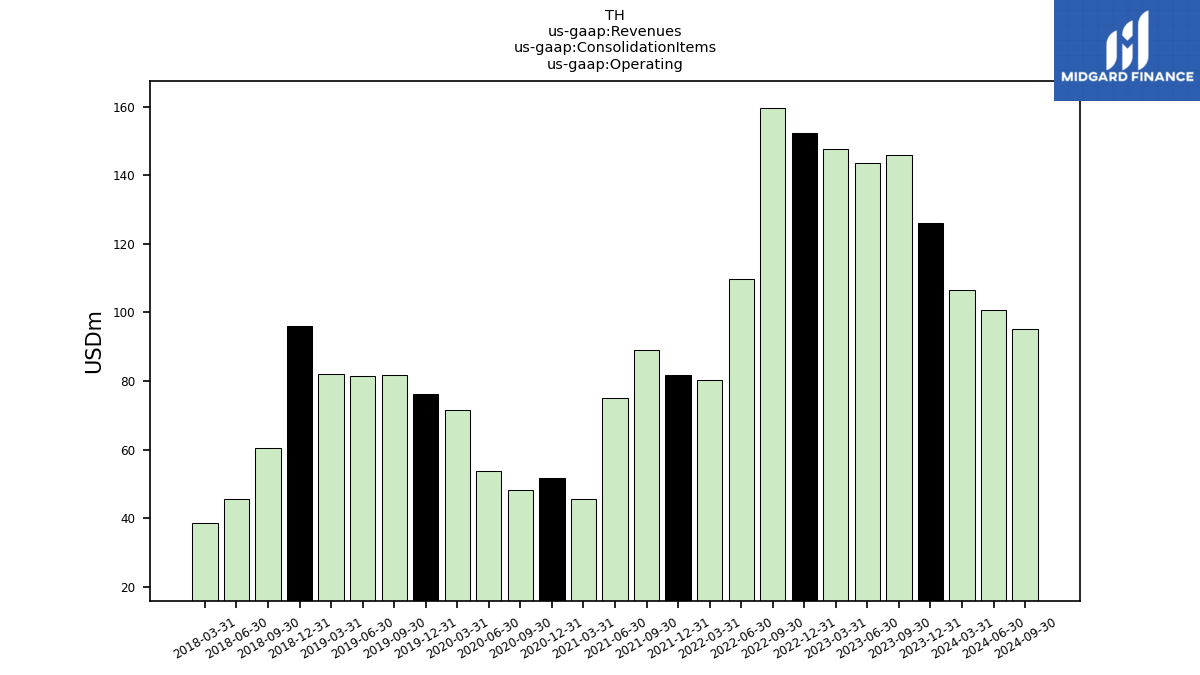
| Revenues | 106.67 | 126.22 | 145.94 | 143.63 | 147.82 | 152.44 | 159.56 | 109.65 | 80.33 | 81.69 | 89.17 | 74.99 | 45.49 | 51.61 | 48.26 | 53.62 | 71.66 | 76.11 | 81.64 | 81.36 | 81.98 | 96.15 | 0.00 | 0.00 | 38.65 | 0.00 | 0.00 | |
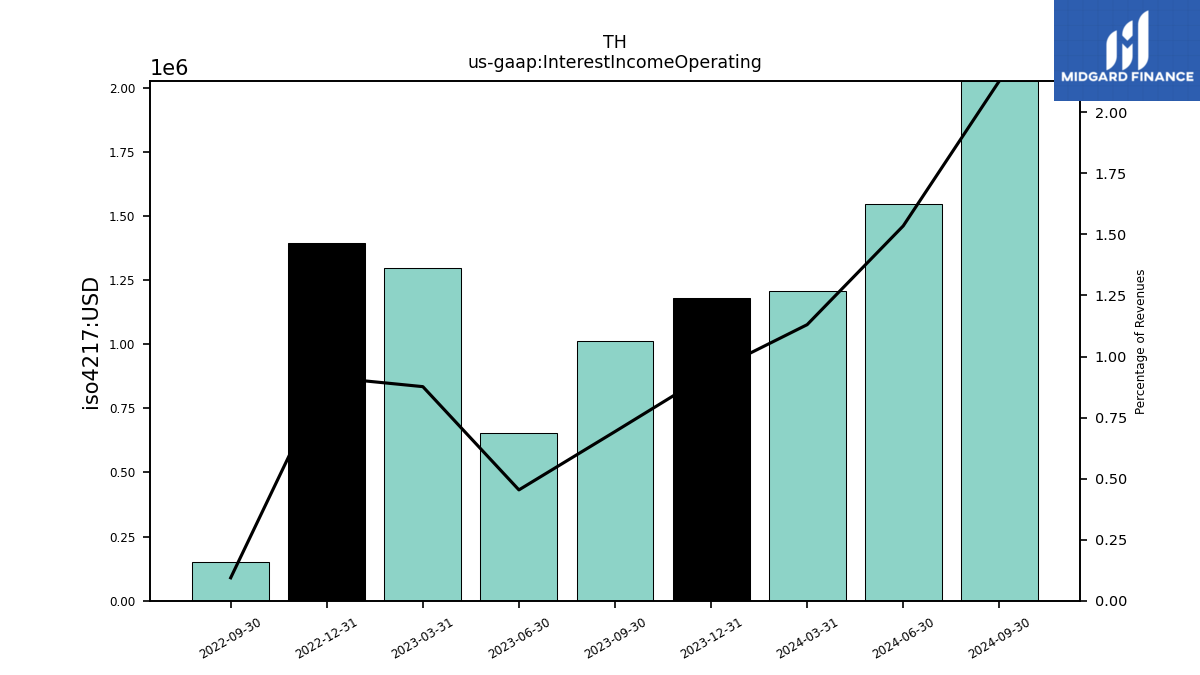
| Interest Income Operating | 1.21 | 1.18 | 1.01 | 0.65 | 1.30 | 1.40 | 0.15 | NA | NA | NA | NA | NA | NA | NA | NA | NA | NA | NA | NA | NA | NA | NA | NA | NA | NA | NA | NA | |
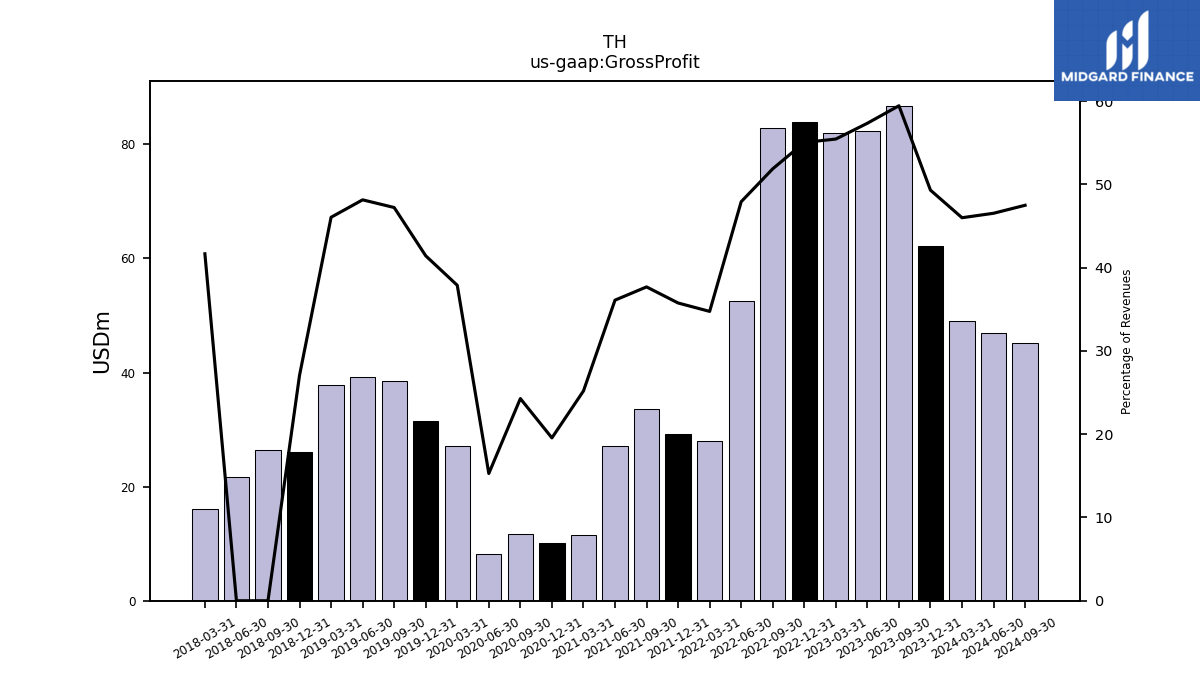
| Gross Profit | 49.07 | 62.24 | 86.76 | 82.37 | 81.96 | 83.90 | 82.77 | 52.55 | 27.92 | 29.21 | 33.61 | 27.07 | 11.46 | 10.09 | 11.72 | 8.19 | 27.15 | 31.53 | 38.56 | 39.17 | 37.75 | 26.04 | 26.35 | 21.74 | 16.10 | NA | NA | |
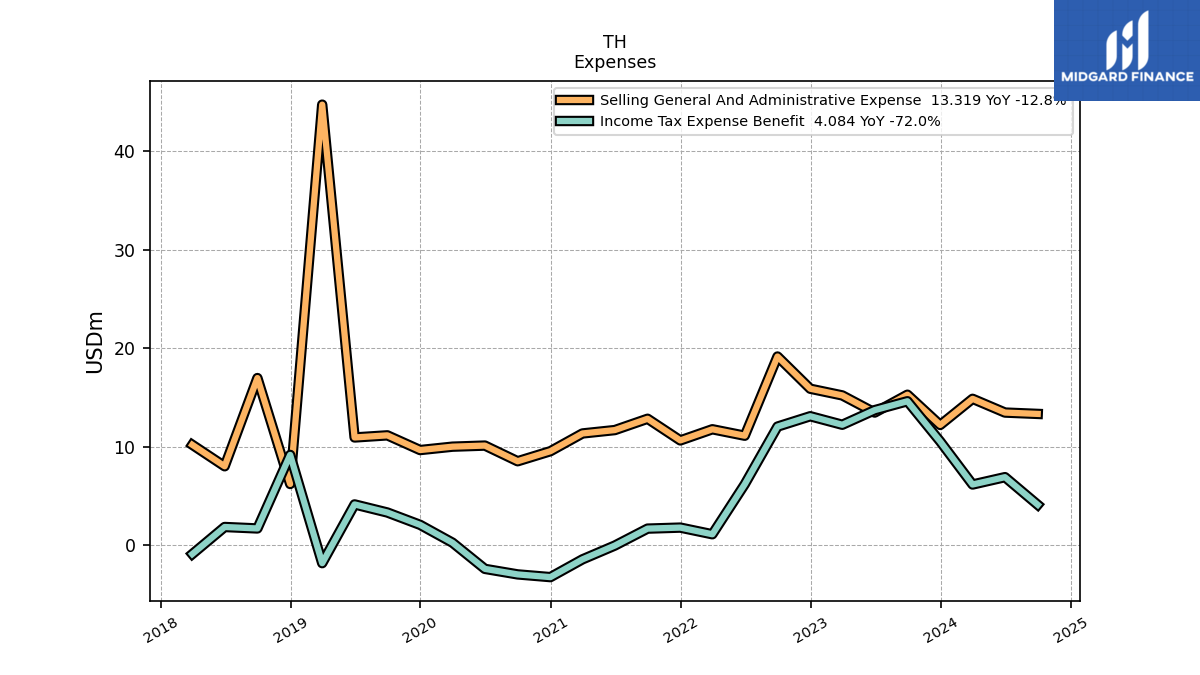
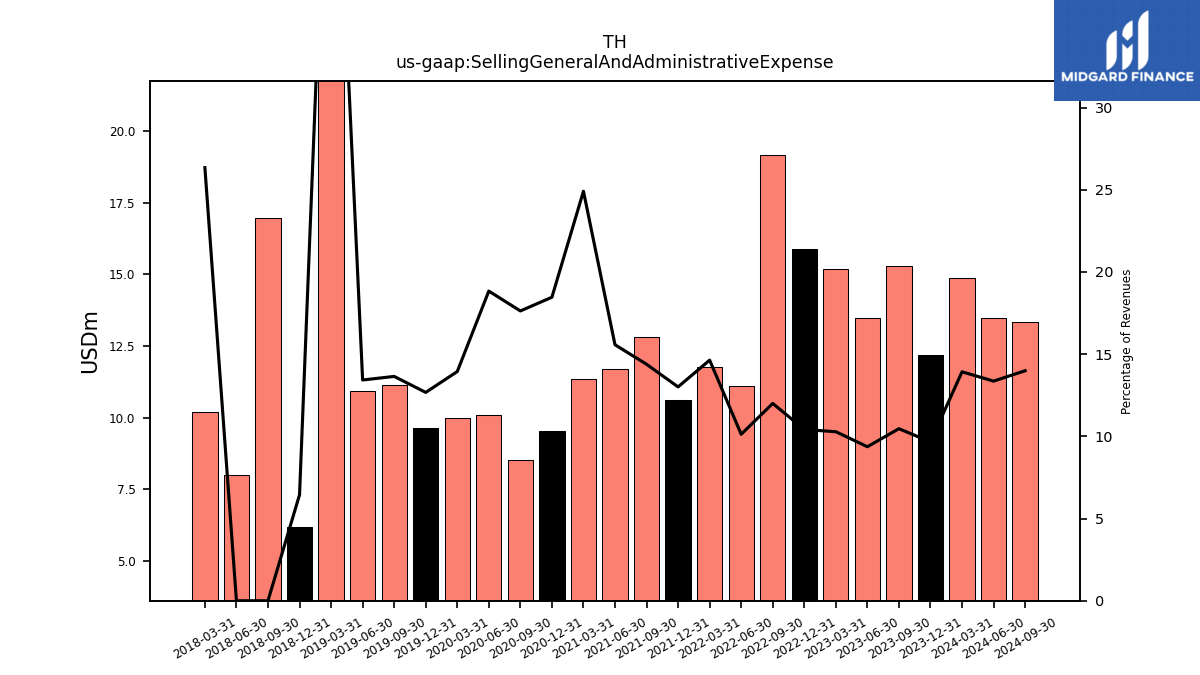
| Selling General And Administrative Expense | 14.86 | 12.20 | 15.27 | 13.46 | 15.20 | 15.88 | 19.15 | 11.10 | 11.76 | 10.63 | 12.83 | 11.68 | 11.33 | 9.53 | 8.51 | 10.10 | 9.99 | 9.65 | 11.14 | 10.93 | 44.75 | 6.20 | 16.96 | 8.00 | 10.18 | NA | NA | |
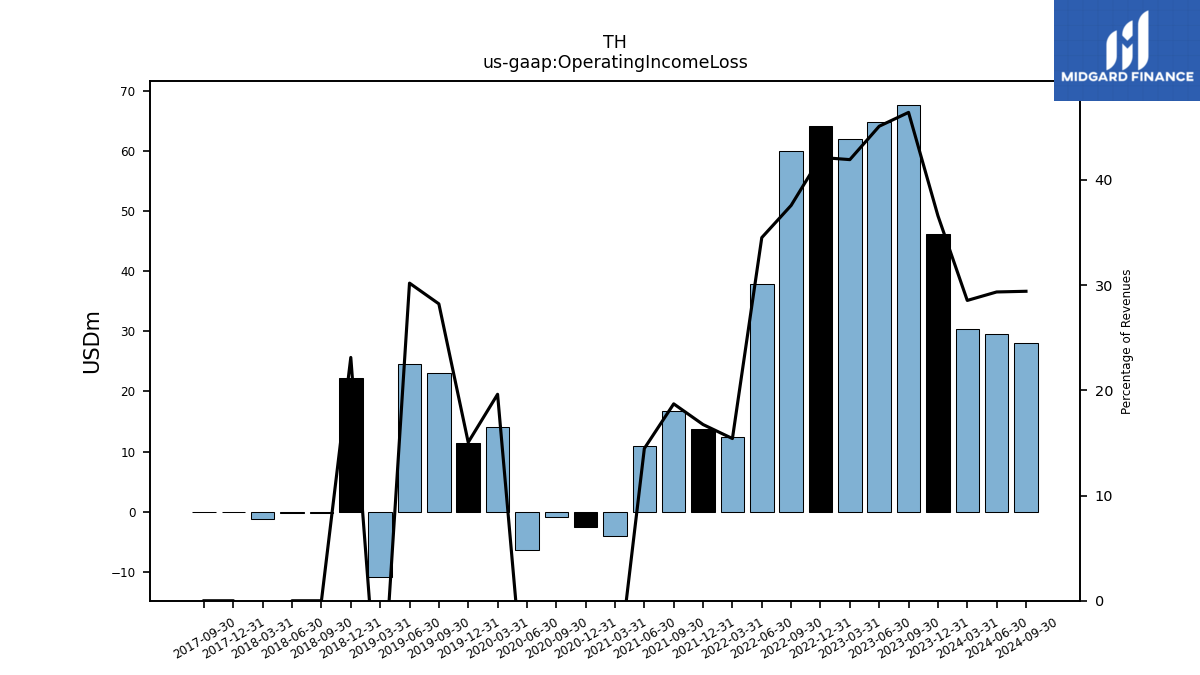
| Operating Income Loss | 30.44 | 46.18 | 67.72 | 64.76 | 61.96 | 64.21 | 59.94 | 37.83 | 12.38 | 13.68 | 16.68 | 10.85 | -4.11 | -2.56 | -0.95 | -6.45 | 14.06 | 11.46 | 23.03 | 24.55 | -10.89 | 22.23 | -0.30 | -0.18 | -1.18 | -0.00 | -0.01 | |
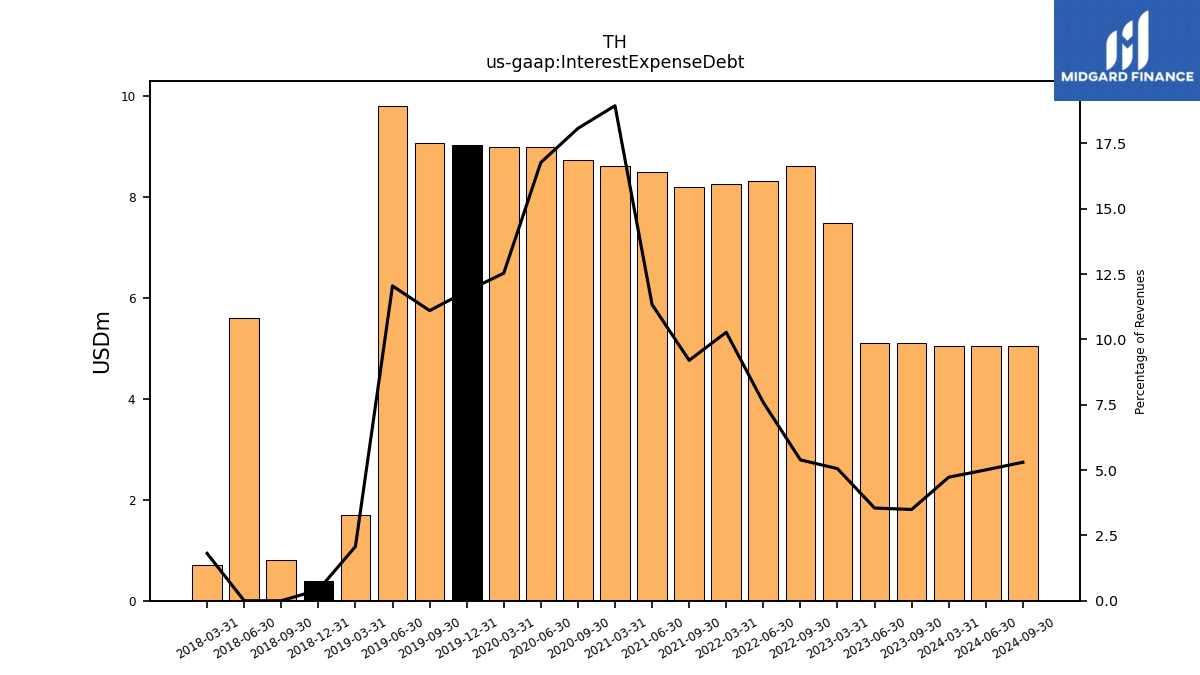
| Interest Expense Debt | 5.04 | NA | 5.10 | 5.09 | 7.47 | NA | 8.60 | 8.32 | 8.25 | NA | 8.20 | 8.50 | 8.62 | NA | 8.72 | 8.99 | 8.98 | 9.01 | 9.06 | 9.80 | 1.70 | 0.40 | 0.80 | 5.60 | 0.70 | NA | NA | |
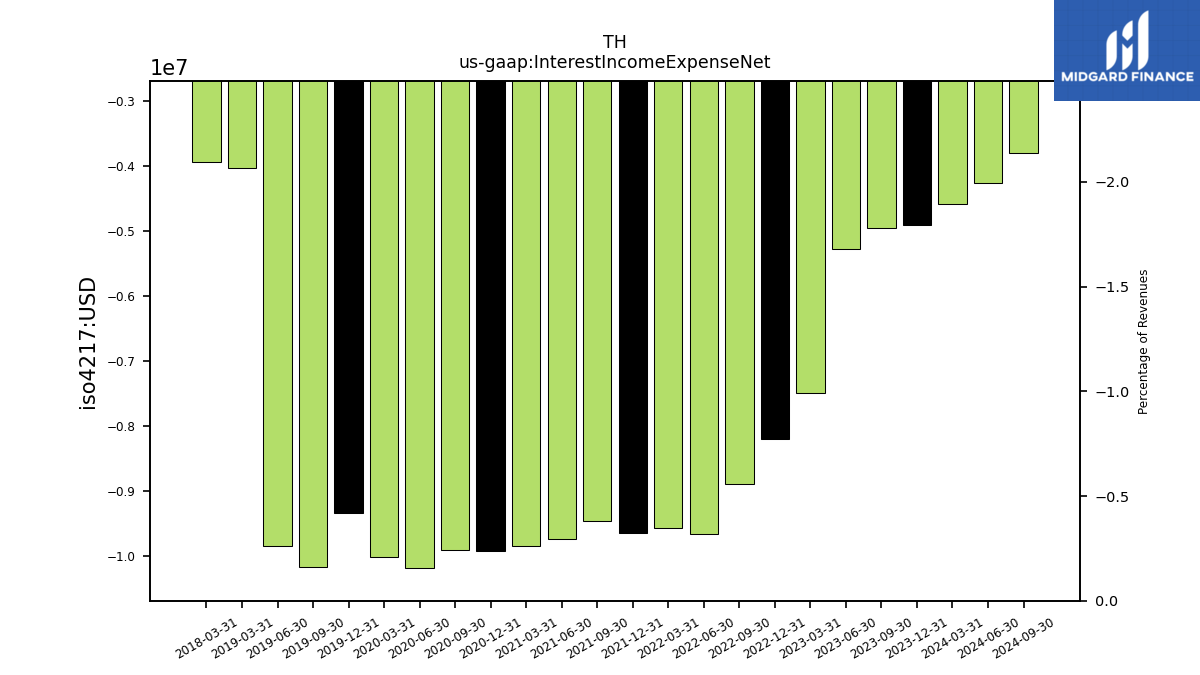
| Interest Income Expense Net | -4.59 | -4.91 | -4.95 | -5.28 | -7.50 | -8.20 | -8.89 | -9.67 | -9.57 | -9.65 | -9.46 | -9.74 | -9.85 | -9.92 | -9.91 | -10.18 | -10.02 | -9.35 | -10.17 | -9.85 | -4.03 | NA | NA | NA | -3.94 | NA | NA | |
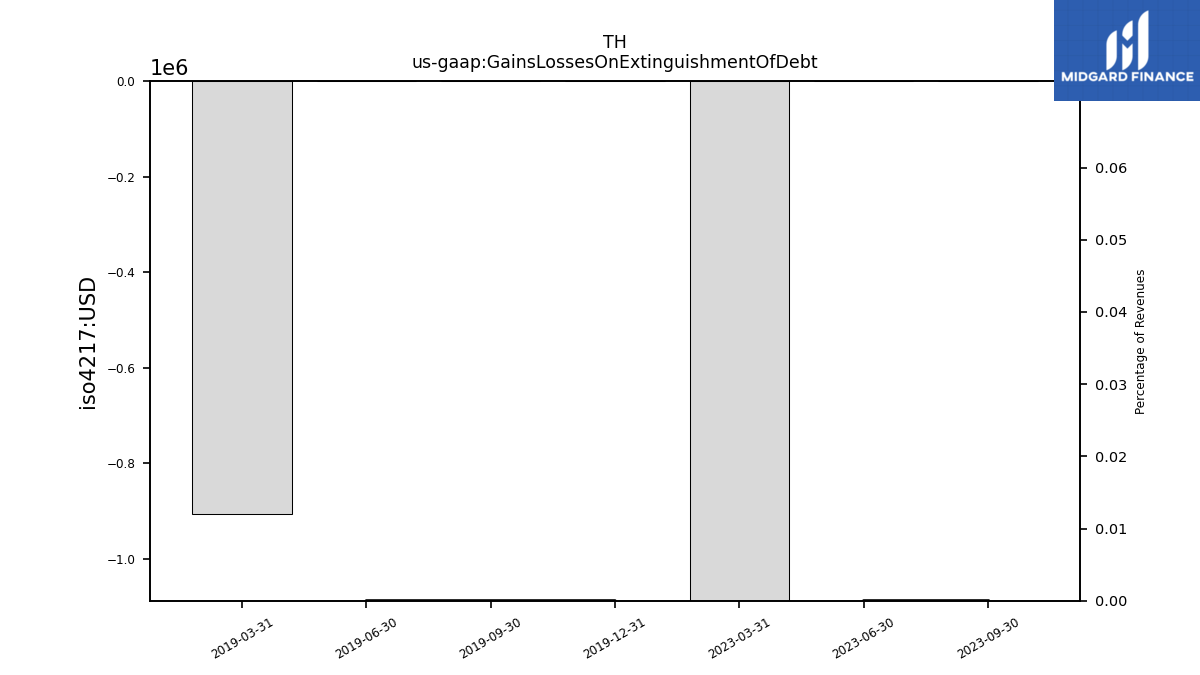
| Gains Losses On Extinguishment Of Debt | NA | -0.15 | 0.00 | 0.00 | -2.13 | NA | NA | NA | NA | NA | NA | NA | NA | NA | NA | NA | NA | 0.00 | 0.00 | 0.00 | -0.91 | NA | NA | NA | NA | NA | NA | |
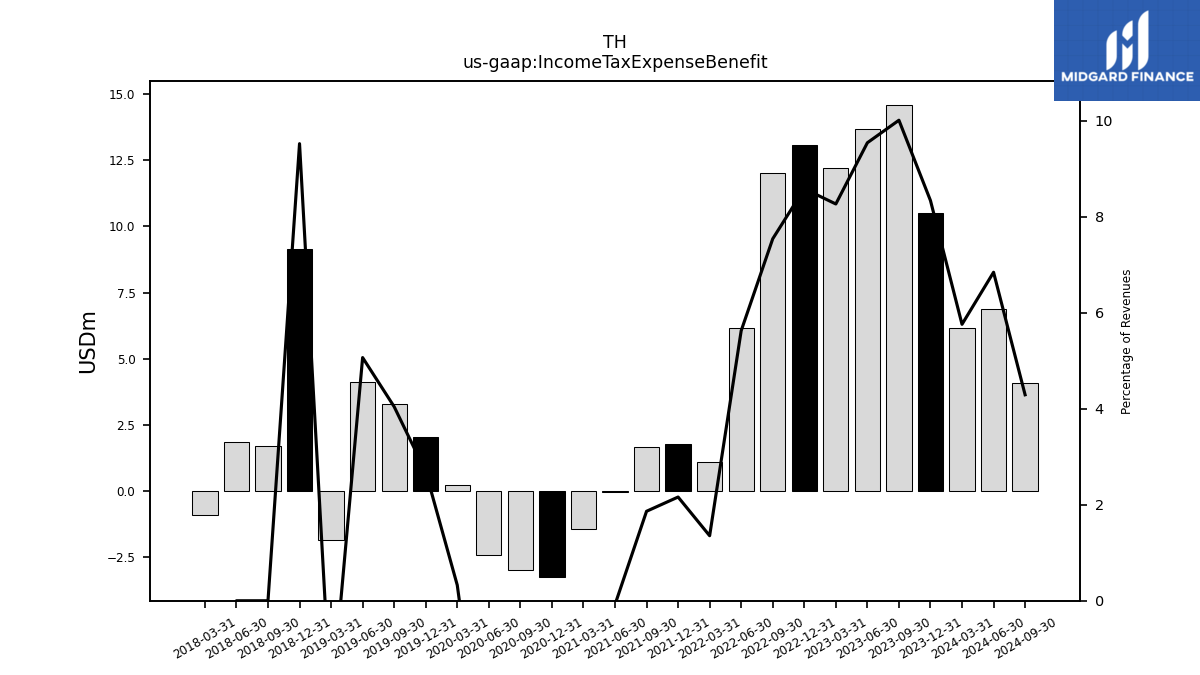
| Income Tax Expense Benefit | 6.14 | 10.52 | 14.61 | 13.70 | 12.22 | 13.08 | 12.03 | 6.17 | 1.09 | 1.76 | 1.66 | -0.06 | -1.46 | -3.27 | -2.99 | -2.43 | 0.23 | 2.04 | 3.30 | 4.12 | -1.85 | 9.15 | 1.68 | 1.83 | -0.93 | NA | NA | |
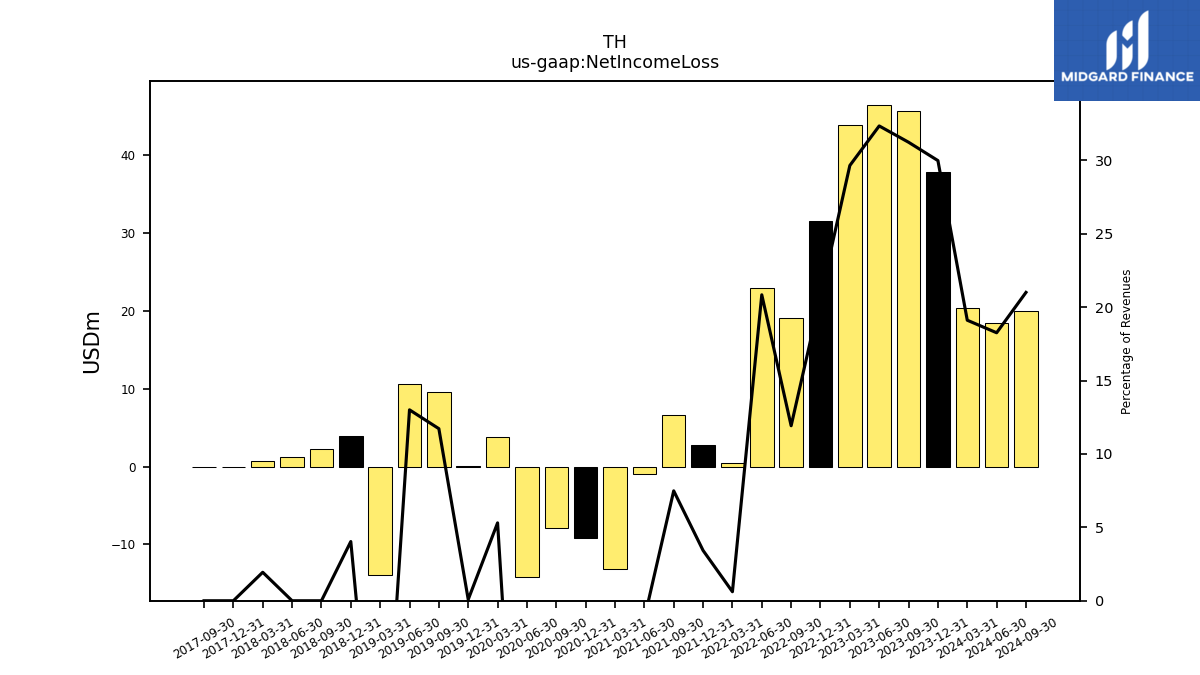
| Net Income Loss | 20.38 | 37.84 | 45.58 | 46.45 | 43.83 | 31.57 | 19.02 | 22.85 | 0.49 | 2.80 | 6.67 | -0.91 | -13.14 | -9.21 | -7.87 | -14.20 | 3.80 | 0.07 | 9.57 | 10.58 | -13.98 | 3.88 | 2.21 | 1.17 | 0.75 | -0.00 | -0.01 | |
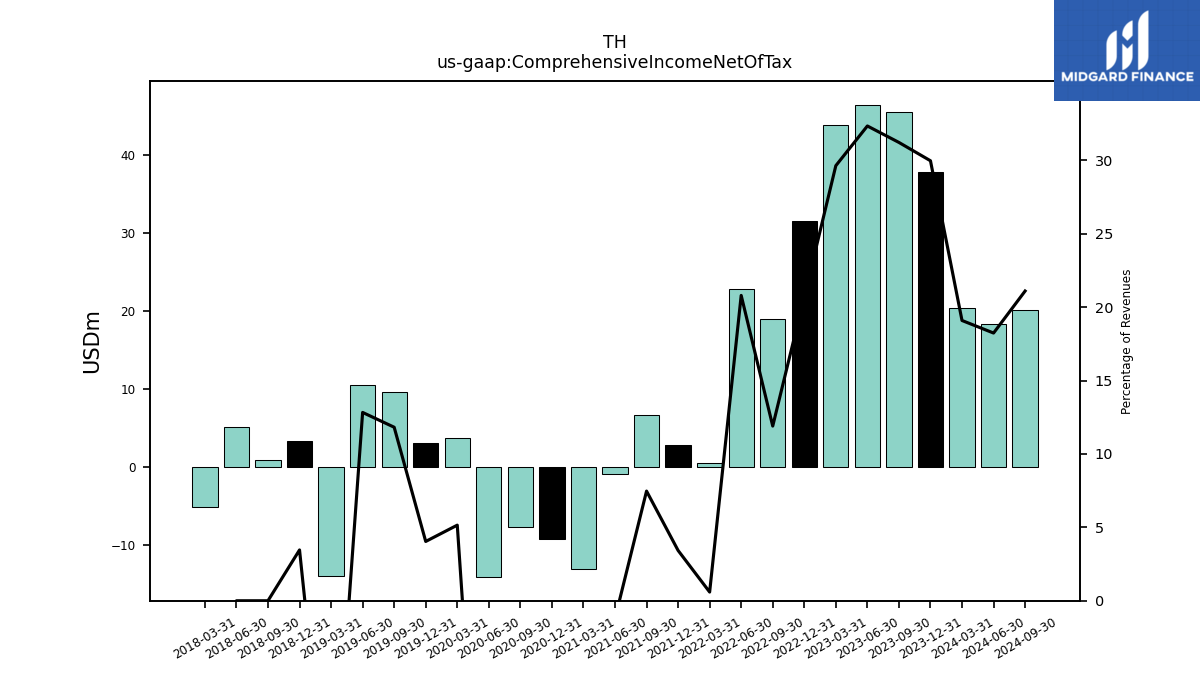
| Comprehensive Income Net Of Tax | 20.36 | 37.83 | 45.56 | 46.45 | 43.80 | 31.56 | 18.98 | 22.80 | 0.48 | 2.80 | 6.66 | -0.91 | -13.16 | -9.21 | -7.78 | -14.15 | 3.69 | 3.07 | 9.65 | 10.44 | -13.98 | 3.33 | 0.85 | 5.04 | -5.10 | NA | NA | |
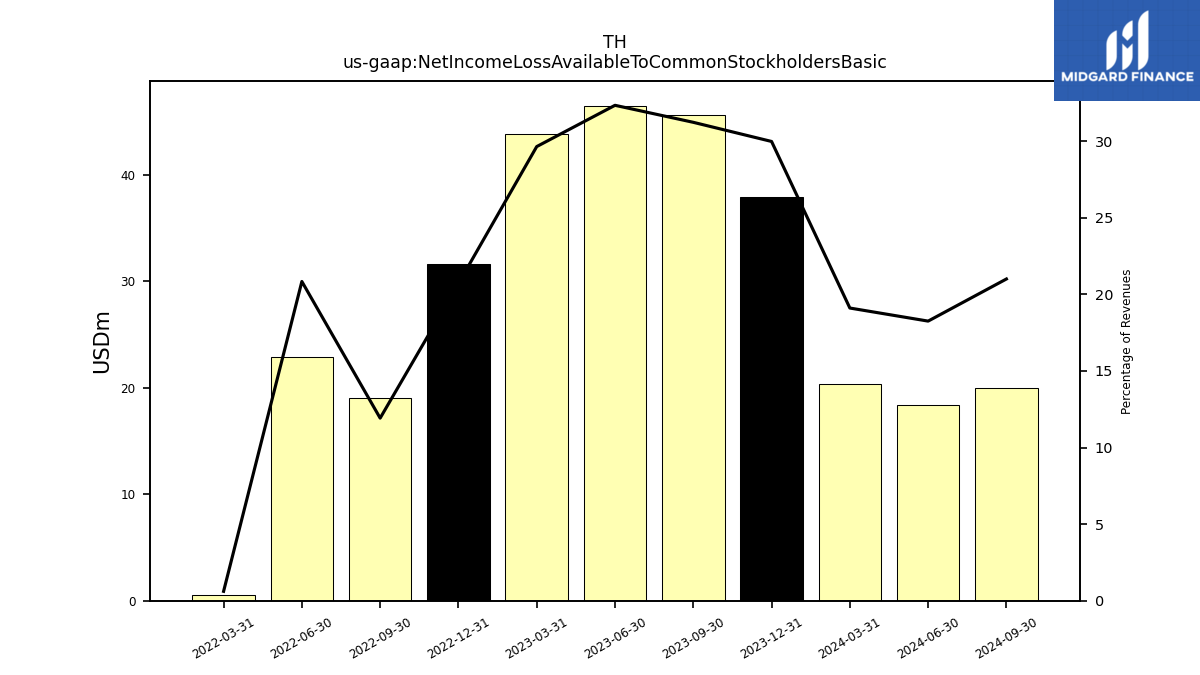
| Net Income Loss Available To Common Stockholders Basic | 20.38 | 37.84 | 45.58 | 46.45 | 43.83 | 31.57 | 19.02 | 22.85 | 0.49 | NA | NA | NA | NA | NA | NA | NA | NA | NA | NA | NA | NA | NA | NA | NA | NA | NA | NA | |
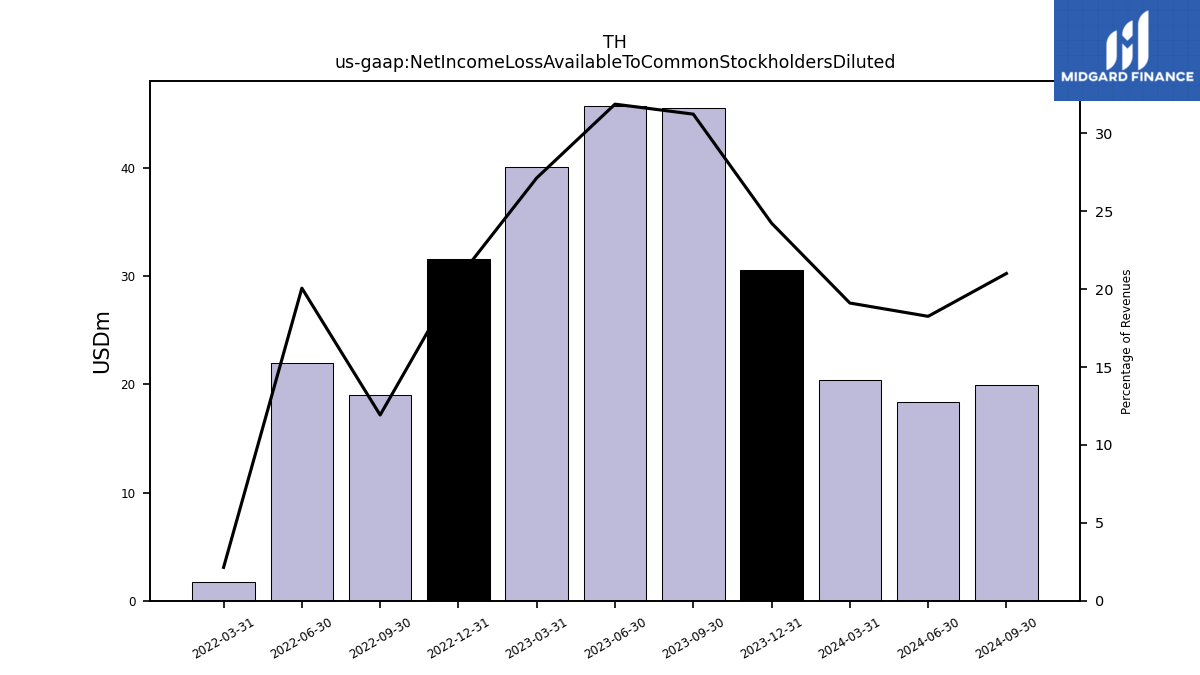
| Net Income Loss Available To Common Stockholders Diluted | 20.38 | 30.59 | 45.58 | 45.78 | 40.11 | 31.57 | 19.02 | 22.00 | 1.72 | NA | NA | NA | NA | NA | NA | NA | NA | NA | NA | NA | NA | NA | NA | NA | NA | NA | NA |
| 2024-03-31 | 2023-12-31 | 2023-09-30 | 2023-06-30 | 2023-03-31 | 2022-12-31 | 2022-09-30 | 2022-06-30 | 2022-03-31 | 2021-12-31 | 2021-09-30 | 2021-06-30 | 2021-03-31 | 2020-12-31 | 2020-09-30 | 2020-06-30 | 2020-03-31 | 2019-12-31 | 2019-09-30 | 2019-06-30 | 2019-03-31 | 2018-12-31 | 2018-09-30 | 2018-06-30 | 2018-03-31 | 2017-12-31 | 2017-09-30 | ||
|---|---|---|---|---|---|---|---|---|---|---|---|---|---|---|---|---|---|---|---|---|---|---|---|---|---|---|---|---|
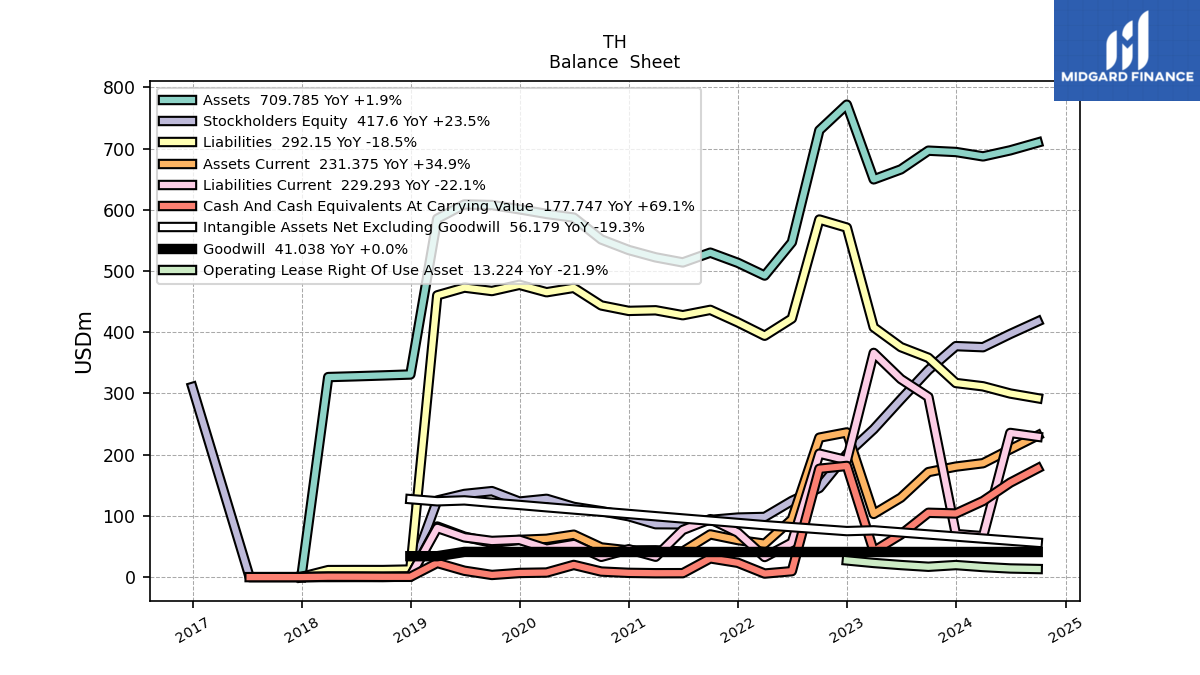
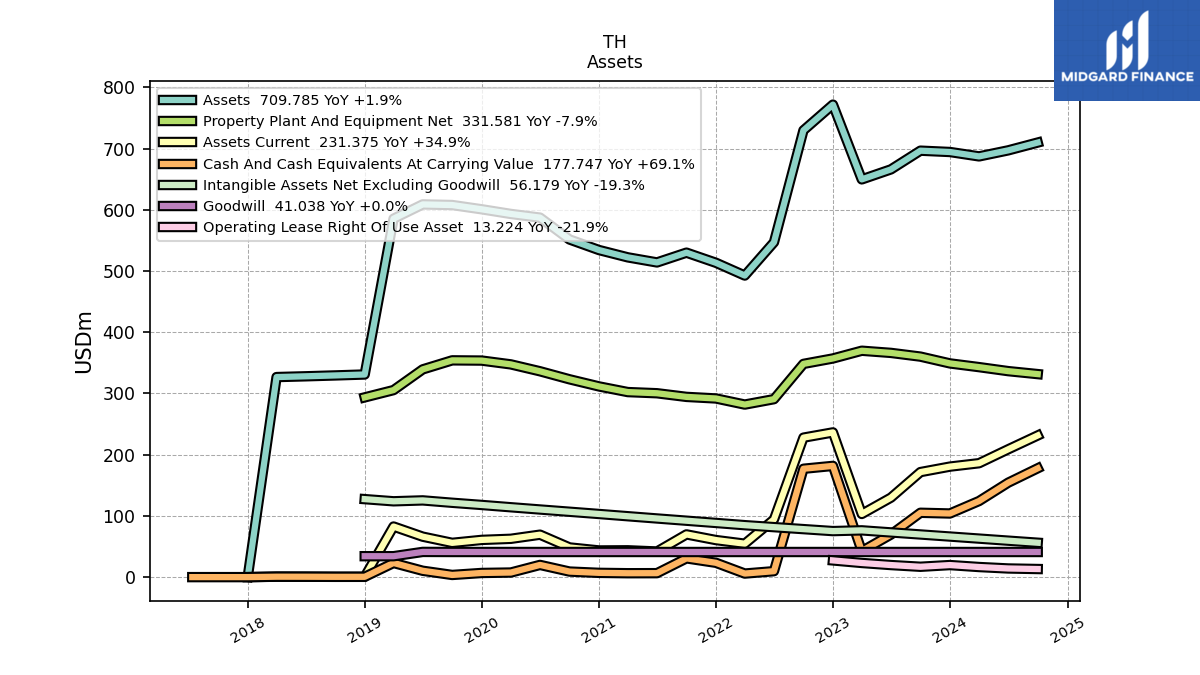
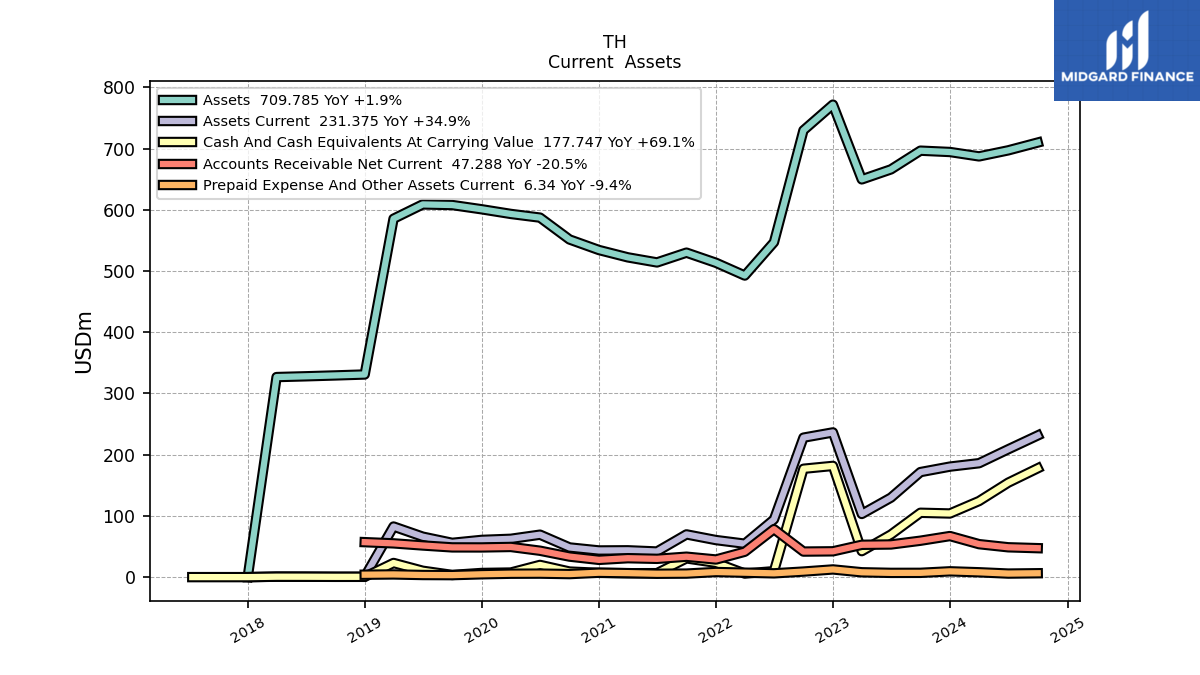
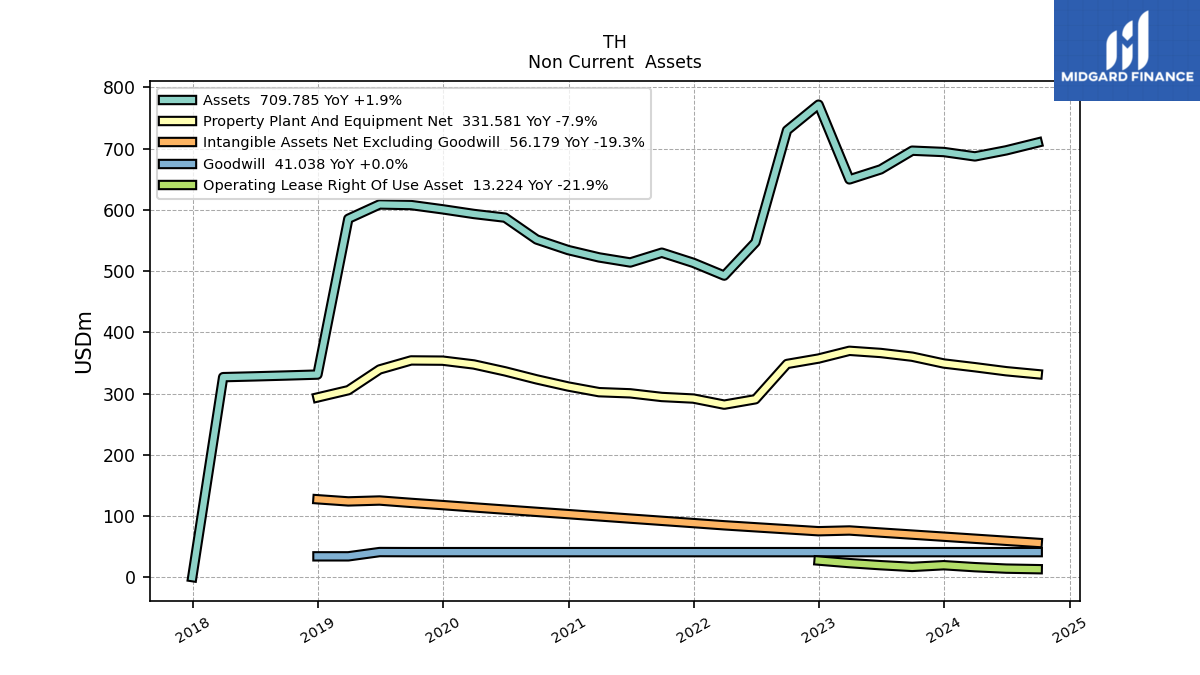
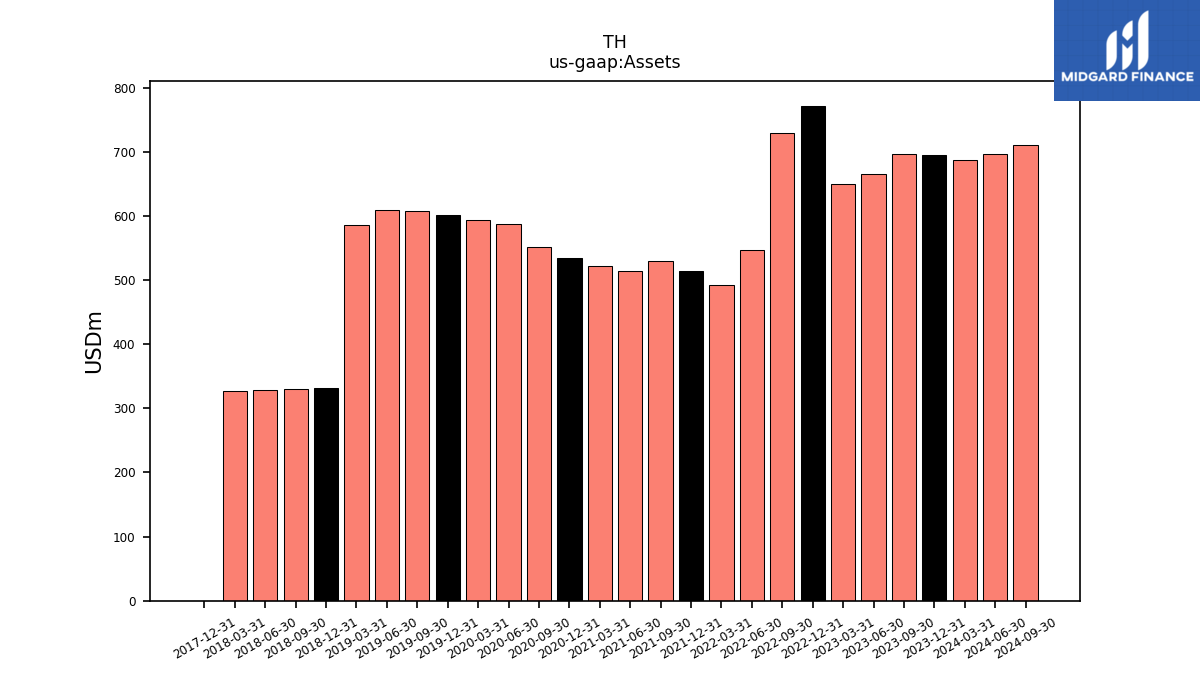
| Assets | 687.17 | 694.35 | 696.52 | 665.97 | 649.62 | 771.73 | 729.70 | 546.86 | 492.54 | 513.39 | 529.96 | 513.98 | 522.27 | 534.24 | 551.49 | 587.18 | 593.19 | 600.79 | 607.74 | 608.73 | 585.39 | 330.95 | 329.43 | 328.01 | 326.74 | 0.24 | NA | |
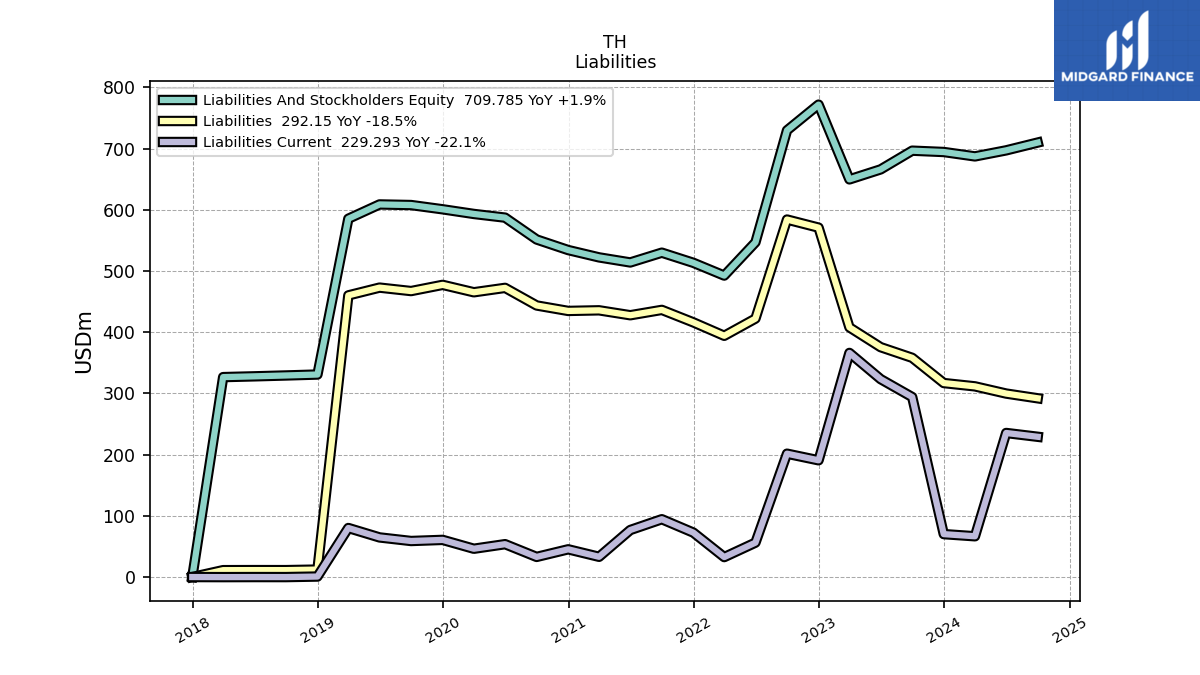
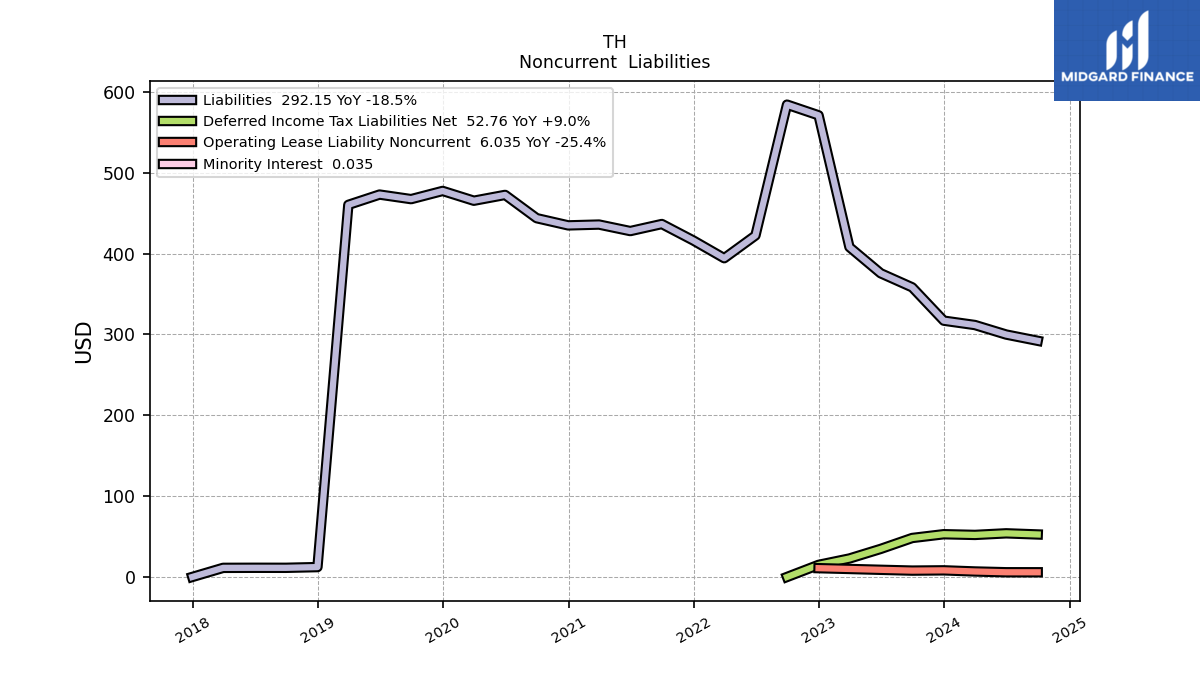
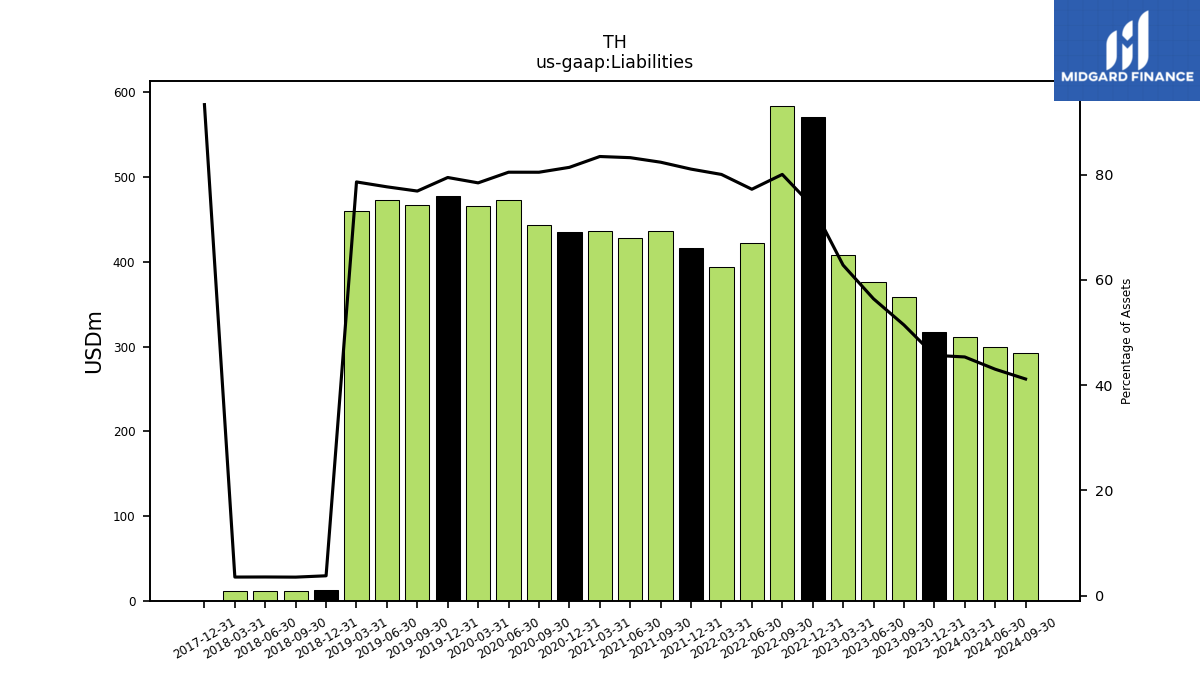
| Liabilities | 311.63 | 317.05 | 358.25 | 375.64 | 408.01 | 570.88 | 584.08 | 422.33 | 394.23 | 416.12 | 436.51 | 427.78 | 435.83 | 434.82 | 443.73 | 472.48 | 465.30 | 477.39 | 467.26 | 472.90 | 460.20 | 12.43 | 11.54 | 11.58 | 11.49 | 0.23 | NA | |
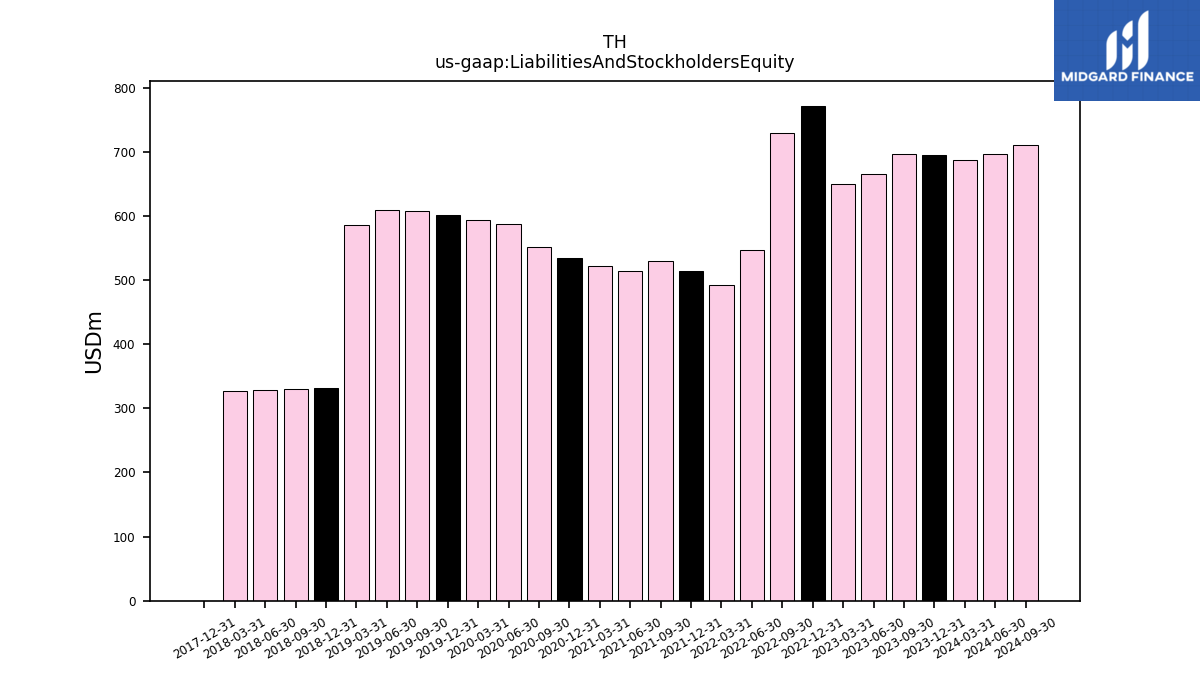
| Liabilities And Stockholders Equity | 687.17 | 694.35 | 696.52 | 665.97 | 649.62 | 771.73 | 729.70 | 546.86 | 492.54 | 513.39 | 529.96 | 513.98 | 522.27 | 534.24 | 551.49 | 587.18 | 593.19 | 600.79 | 607.74 | 608.73 | 585.39 | 330.95 | 329.43 | 328.01 | 326.74 | 0.24 | NA | |
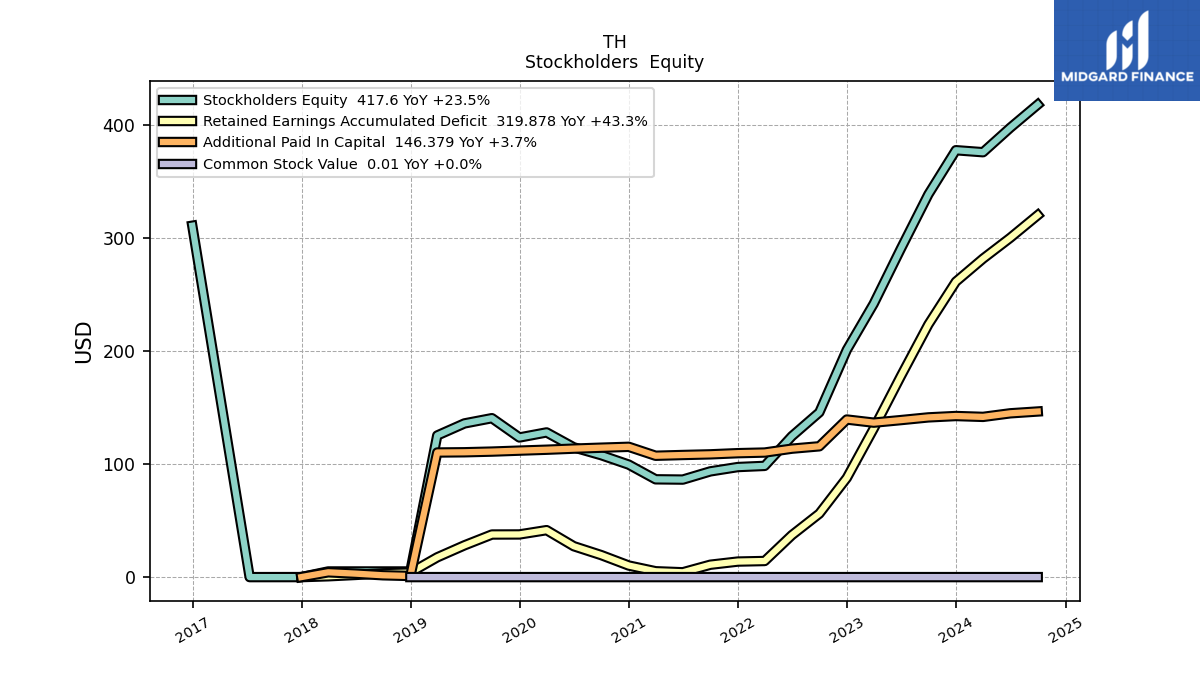
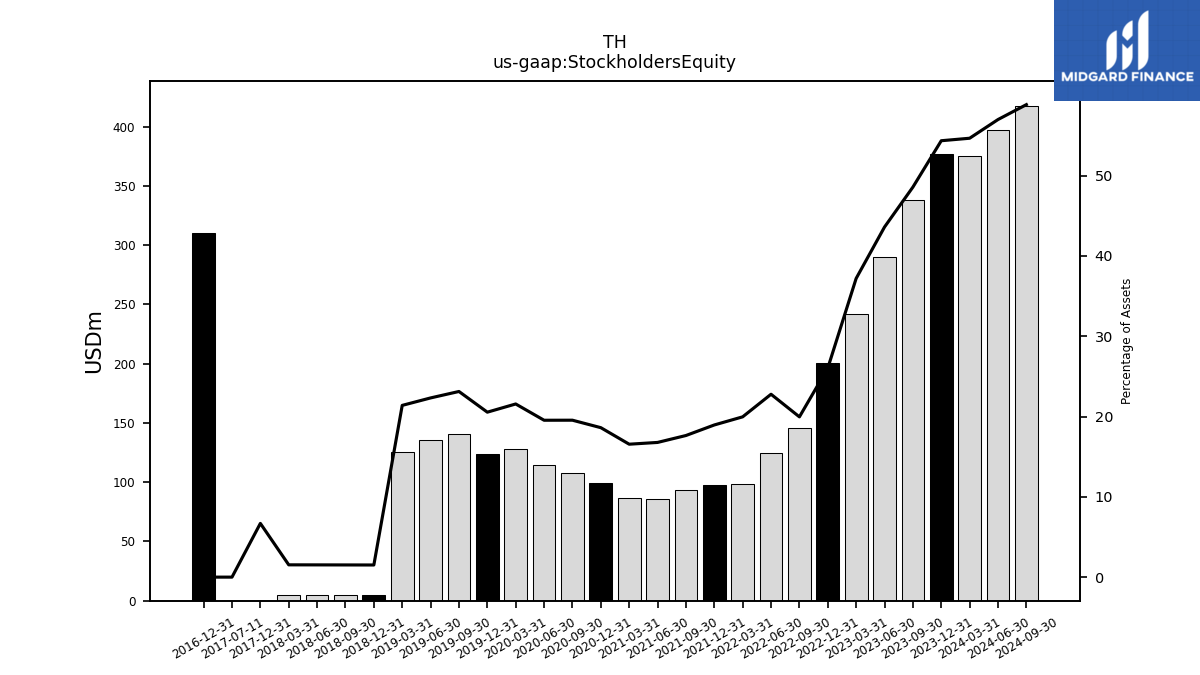
| Stockholders Equity | 375.53 | 377.31 | 338.27 | 290.32 | 241.61 | 200.85 | 145.62 | 124.53 | 98.31 | 97.27 | 93.45 | 86.20 | 86.44 | 99.42 | 107.76 | 114.70 | 127.89 | 123.40 | 140.48 | 135.83 | 125.18 | 5.00 | 5.00 | 5.00 | 5.00 | 0.02 | NA |
| 2024-03-31 | 2023-12-31 | 2023-09-30 | 2023-06-30 | 2023-03-31 | 2022-12-31 | 2022-09-30 | 2022-06-30 | 2022-03-31 | 2021-12-31 | 2021-09-30 | 2021-06-30 | 2021-03-31 | 2020-12-31 | 2020-09-30 | 2020-06-30 | 2020-03-31 | 2019-12-31 | 2019-09-30 | 2019-06-30 | 2019-03-31 | 2018-12-31 | 2018-09-30 | 2018-06-30 | 2018-03-31 | 2017-12-31 | 2017-09-30 | ||
|---|---|---|---|---|---|---|---|---|---|---|---|---|---|---|---|---|---|---|---|---|---|---|---|---|---|---|---|---|
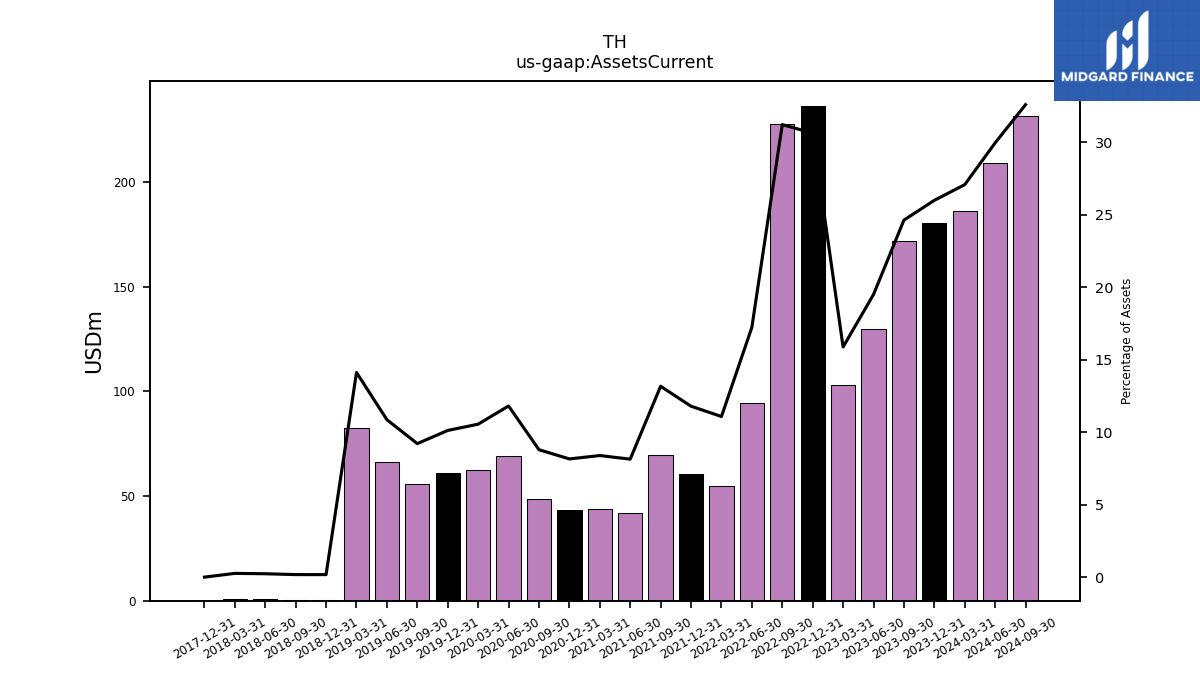
| Assets Current | 186.07 | 180.50 | 171.56 | 129.84 | 103.15 | 236.38 | 227.81 | 94.22 | 54.58 | 60.54 | 69.78 | 41.83 | 43.81 | 43.56 | 48.48 | 69.33 | 62.59 | 60.80 | 55.98 | 66.10 | 82.64 | 0.57 | 0.57 | 0.76 | 0.84 | 0.00 | NA | |
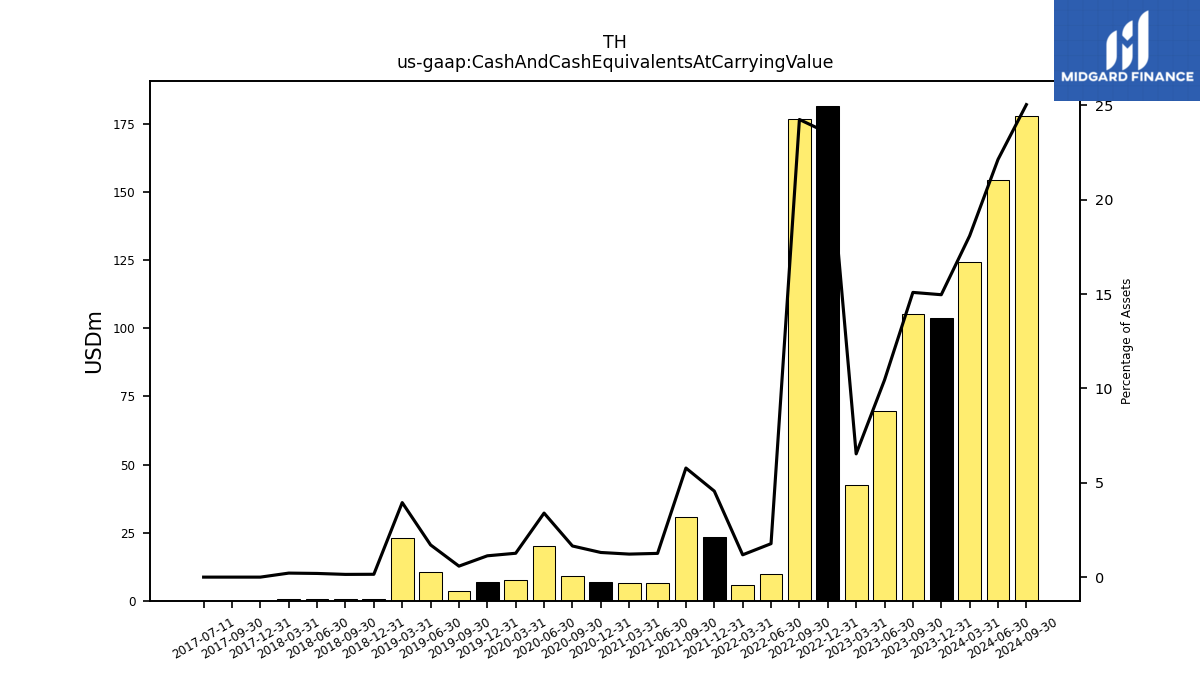
| Cash And Cash Equivalents At Carrying Value | 124.30 | 103.93 | 105.10 | 69.58 | 42.44 | 181.67 | 176.99 | 9.70 | 5.82 | 23.41 | 30.64 | 6.47 | 6.37 | 6.98 | 9.10 | 19.93 | 7.50 | 6.79 | 3.54 | 10.39 | 23.12 | 0.50 | 0.48 | 0.64 | 0.70 | 0.00 | 0.00 | |
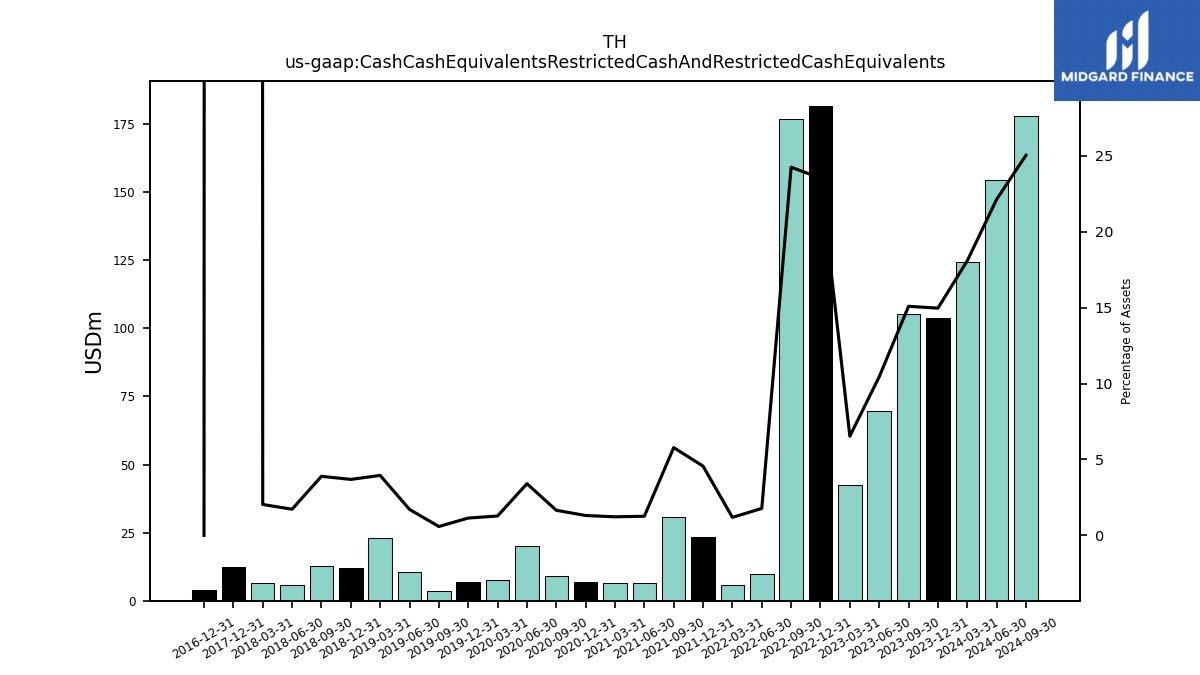
| Cash Cash Equivalents Restricted Cash And Restricted Cash Equivalents | 124.30 | 103.93 | 105.10 | 69.58 | 42.44 | 181.67 | 176.99 | 9.70 | 5.82 | 23.41 | 30.64 | 6.47 | 6.37 | 6.98 | 9.10 | 19.98 | 7.56 | 6.84 | 3.54 | 10.39 | 23.12 | 12.19 | 12.81 | 5.64 | 6.64 | 12.53 | NA | |
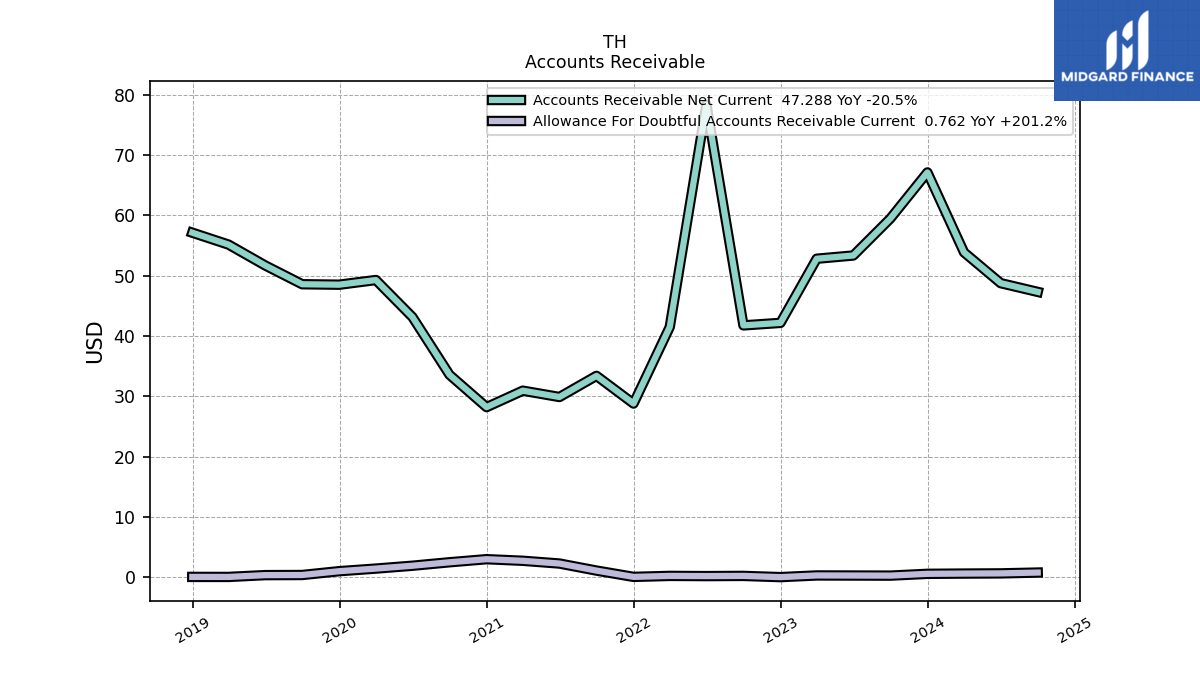
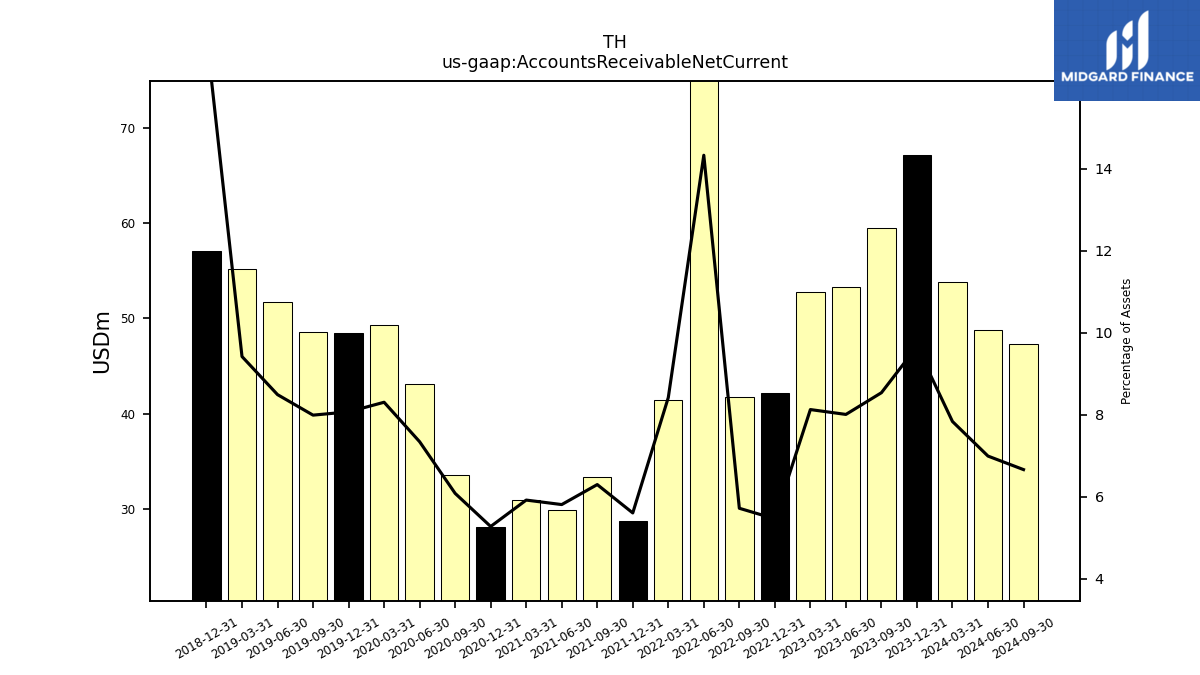
| Accounts Receivable Net Current | 53.84 | 67.09 | 59.46 | 53.33 | 52.79 | 42.15 | 41.74 | 78.33 | 41.46 | 28.78 | 33.37 | 29.86 | 30.91 | 28.18 | 33.55 | 43.11 | 49.26 | 48.48 | 48.56 | 51.68 | 55.13 | 57.11 | NA | NA | NA | NA | NA | |
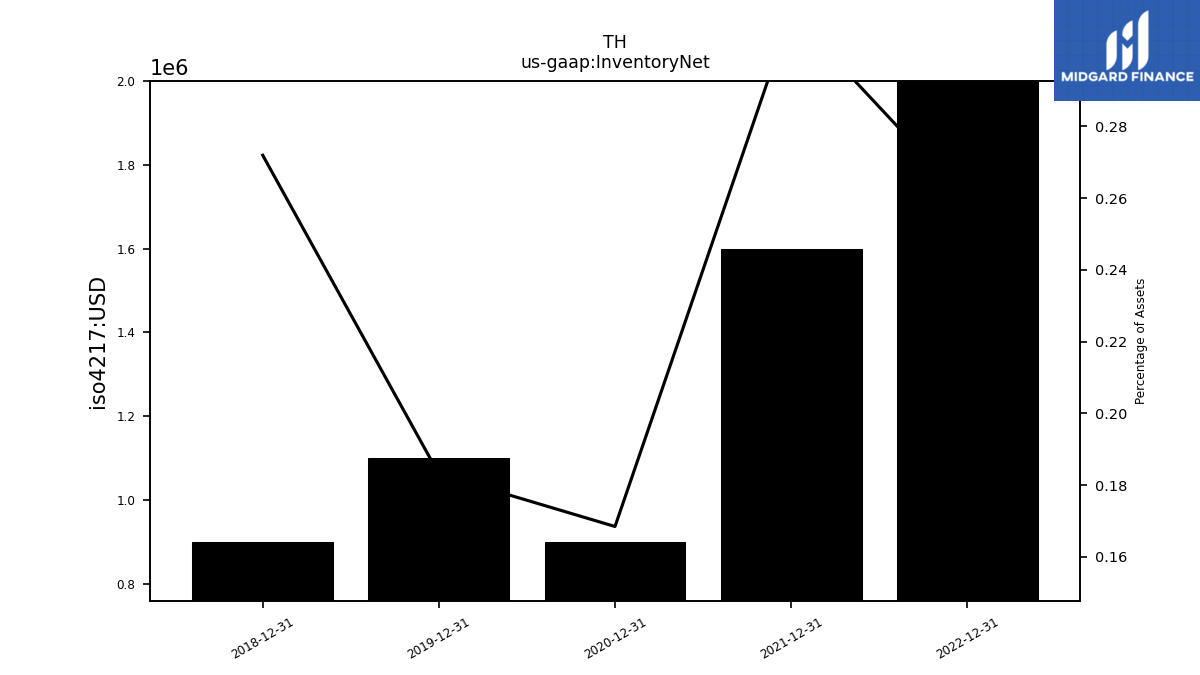
| Inventory Net | NA | 2.10 | NA | NA | NA | 2.00 | NA | NA | NA | 1.60 | NA | NA | NA | 0.90 | NA | NA | NA | 1.10 | NA | NA | NA | 0.90 | NA | NA | NA | NA | NA | |
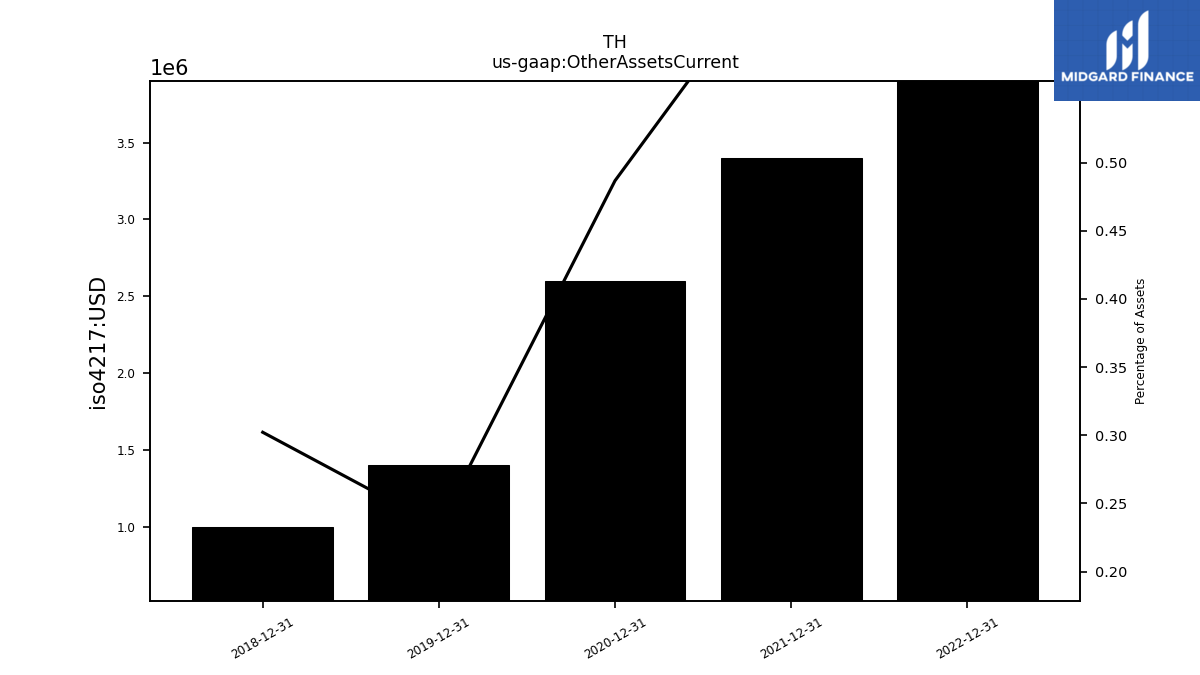
| Other Assets Current | NA | 4.00 | NA | NA | NA | 3.90 | NA | NA | NA | 3.40 | NA | NA | NA | 2.60 | NA | NA | NA | 1.40 | NA | NA | NA | 1.00 | NA | NA | NA | NA | NA | |
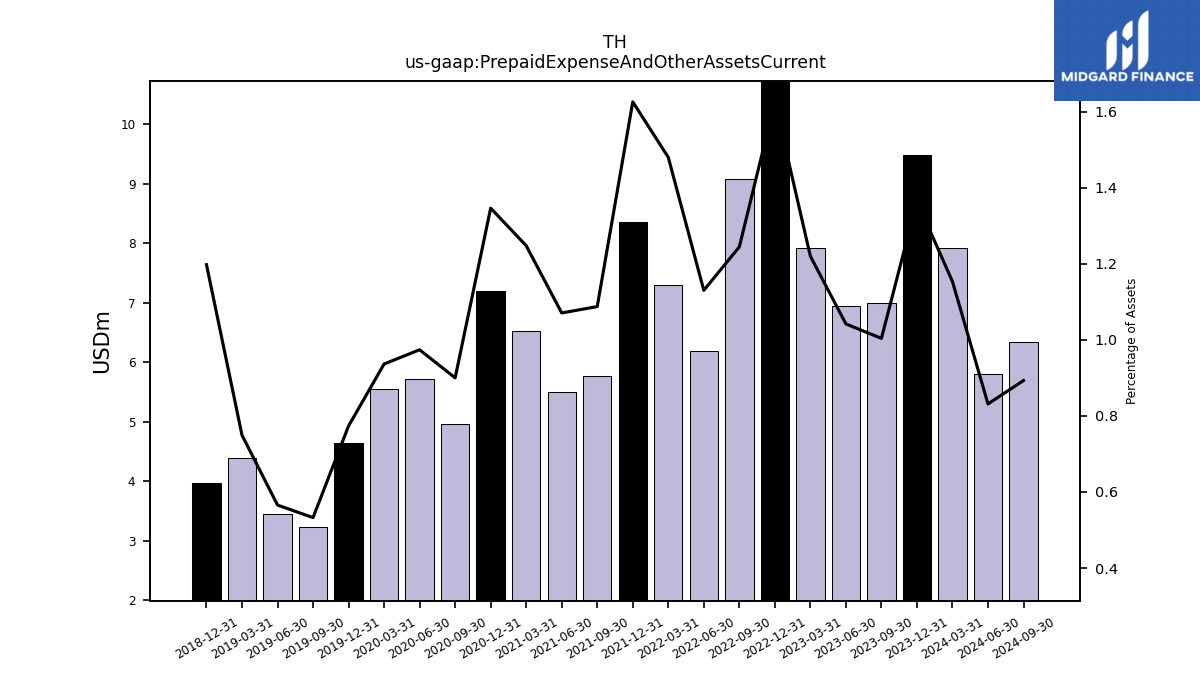
| Prepaid Expense And Other Assets Current | 7.93 | 9.48 | 6.99 | 6.94 | 7.93 | 12.55 | 9.09 | 6.18 | 7.29 | 8.35 | 5.76 | 5.50 | 6.52 | 7.20 | 4.96 | 5.72 | 5.56 | 4.65 | 3.24 | 3.44 | 4.39 | 3.96 | NA | NA | NA | NA | NA |
| 2024-03-31 | 2023-12-31 | 2023-09-30 | 2023-06-30 | 2023-03-31 | 2022-12-31 | 2022-09-30 | 2022-06-30 | 2022-03-31 | 2021-12-31 | 2021-09-30 | 2021-06-30 | 2021-03-31 | 2020-12-31 | 2020-09-30 | 2020-06-30 | 2020-03-31 | 2019-12-31 | 2019-09-30 | 2019-06-30 | 2019-03-31 | 2018-12-31 | 2018-09-30 | 2018-06-30 | 2018-03-31 | 2017-12-31 | 2017-09-30 | ||
|---|---|---|---|---|---|---|---|---|---|---|---|---|---|---|---|---|---|---|---|---|---|---|---|---|---|---|---|---|
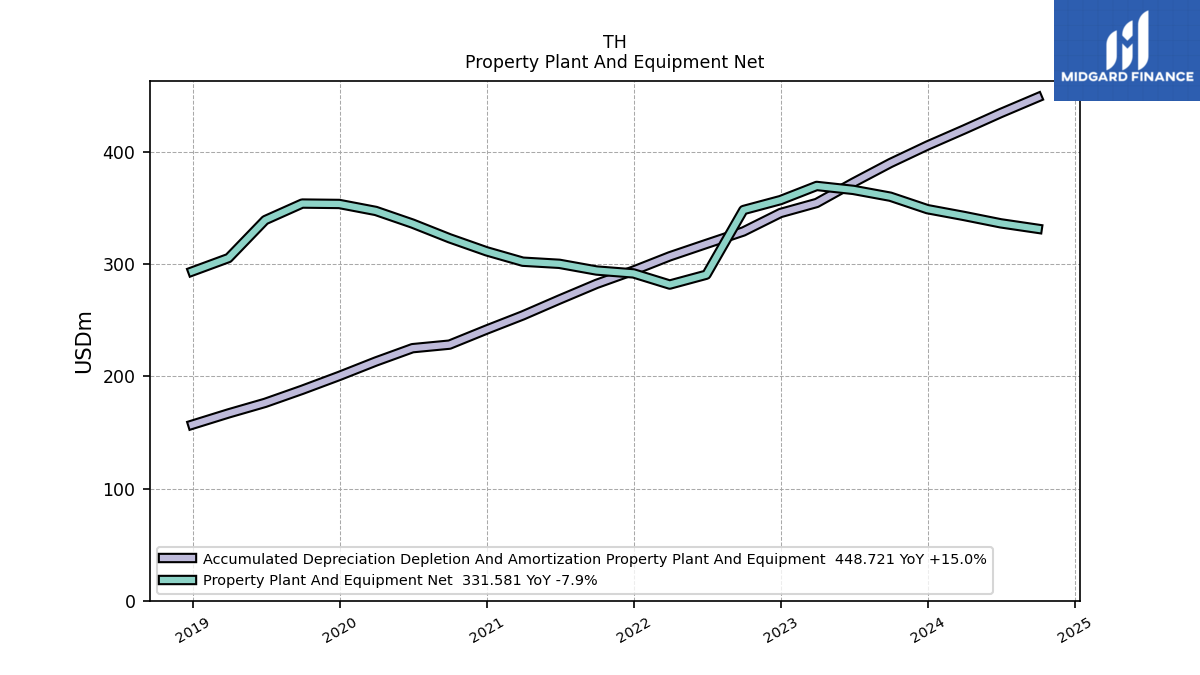
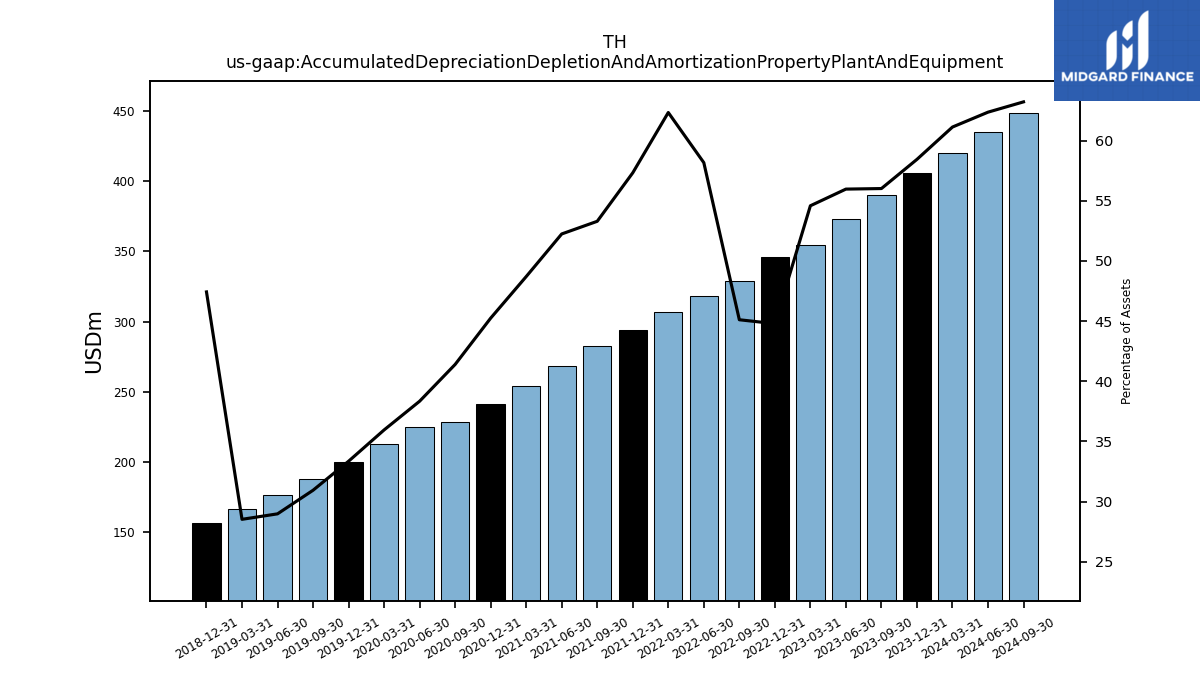
| Accumulated Depreciation Depletion And Amortization Property Plant And Equipment | 420.05 | 405.78 | 390.16 | 372.74 | 354.59 | 345.62 | 329.18 | 318.10 | 307.02 | 294.29 | 282.44 | 268.51 | 254.34 | 241.72 | 228.31 | 225.13 | 213.27 | 200.38 | 188.04 | 176.41 | 166.98 | 156.96 | NA | NA | NA | NA | NA | |
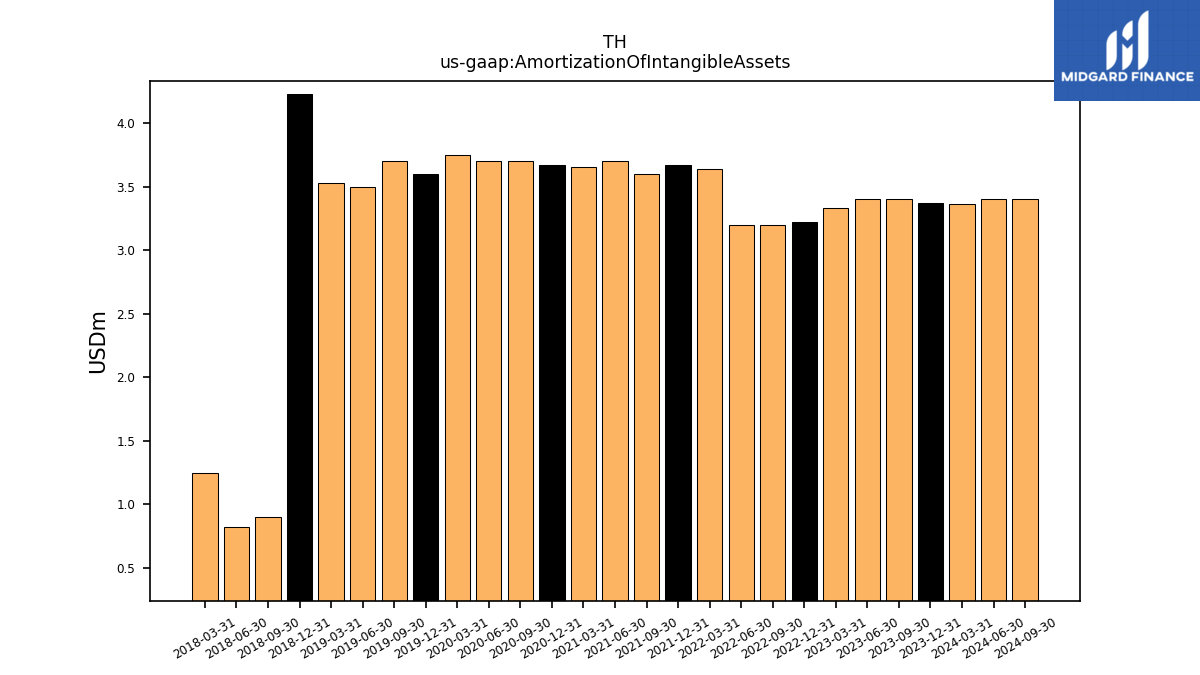
| Amortization Of Intangible Assets | 3.36 | 3.37 | 3.40 | 3.40 | 3.33 | 3.22 | 3.20 | 3.20 | 3.64 | 3.67 | 3.60 | 3.70 | 3.66 | 3.67 | 3.70 | 3.70 | 3.75 | 3.60 | 3.70 | 3.50 | 3.53 | 4.23 | 0.90 | 0.82 | 1.24 | NA | NA | |
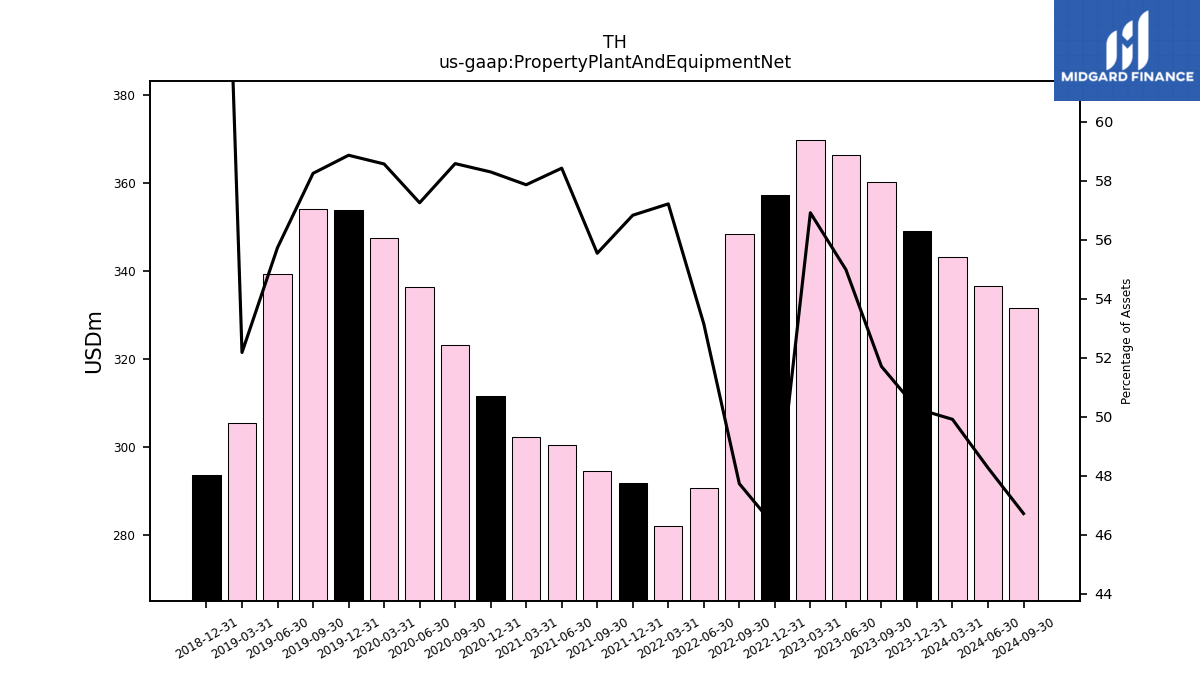
| Property Plant And Equipment Net | 342.99 | 349.06 | 360.16 | 366.23 | 369.76 | 357.13 | 348.28 | 290.65 | 281.84 | 291.79 | 294.37 | 300.33 | 302.24 | 311.49 | 323.11 | 336.22 | 347.46 | 353.69 | 354.06 | 339.30 | 305.46 | 293.56 | NA | NA | NA | NA | NA | |
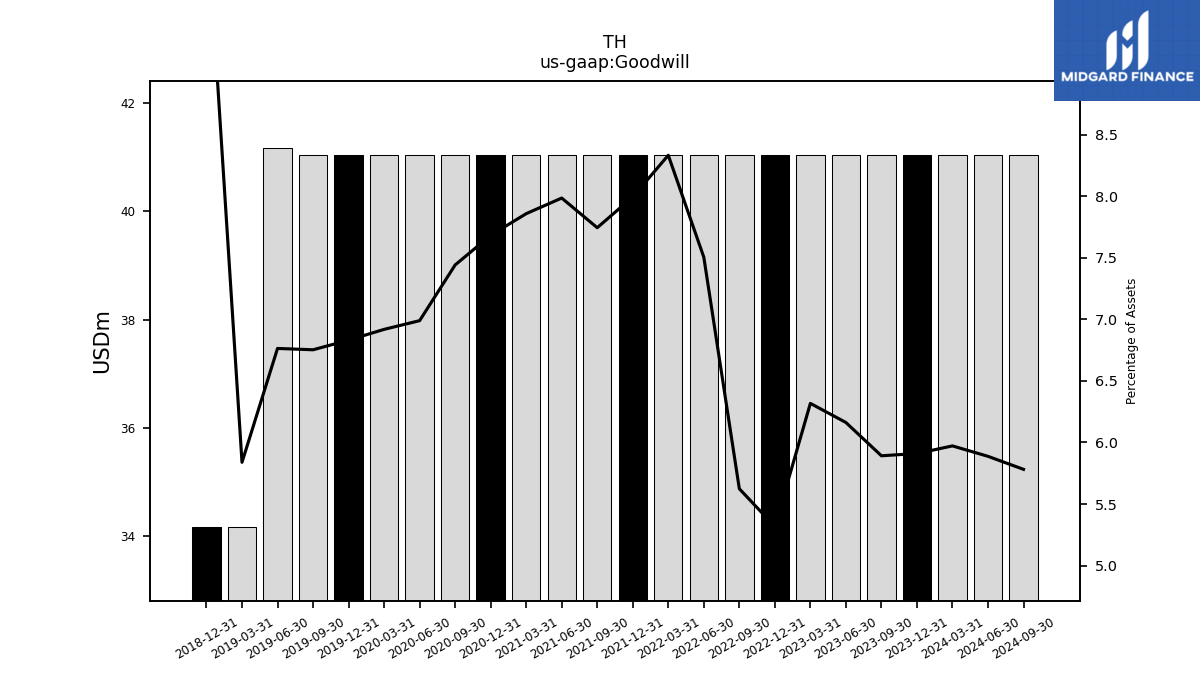
| Goodwill | 41.04 | 41.04 | 41.04 | 41.04 | 41.04 | 41.04 | 41.04 | 41.04 | 41.04 | 41.04 | 41.04 | 41.04 | 41.04 | 41.04 | 41.04 | 41.04 | 41.04 | 41.04 | 41.04 | 41.17 | 34.18 | 34.18 | NA | NA | NA | NA | NA | |
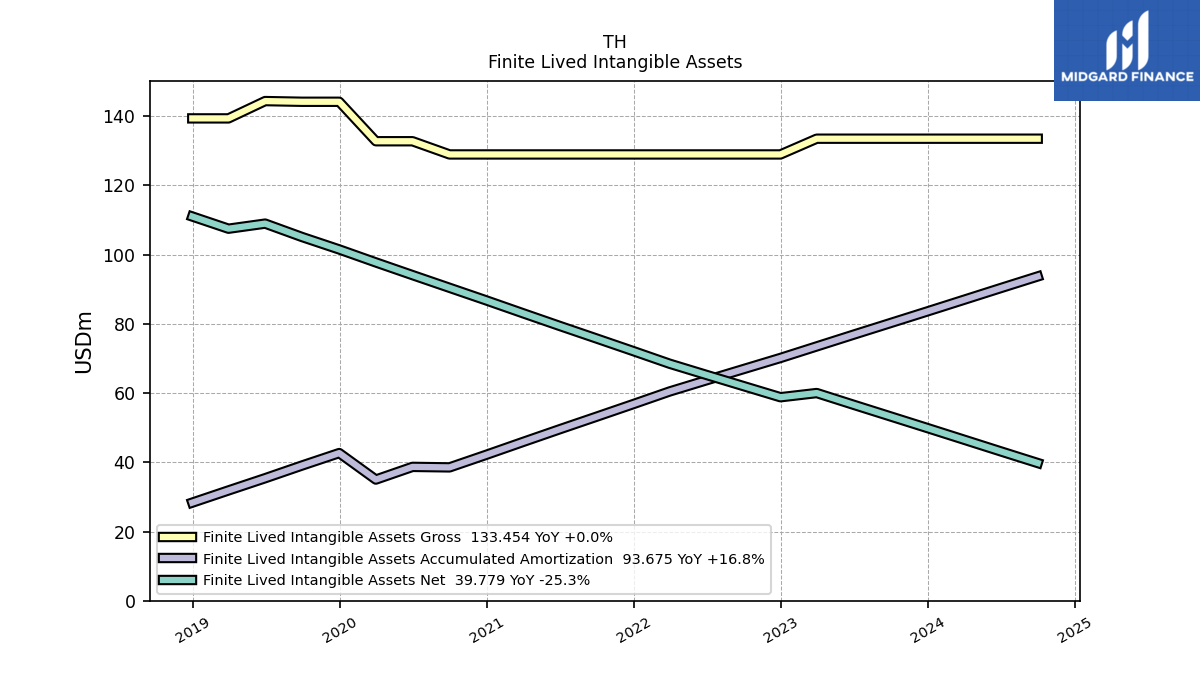
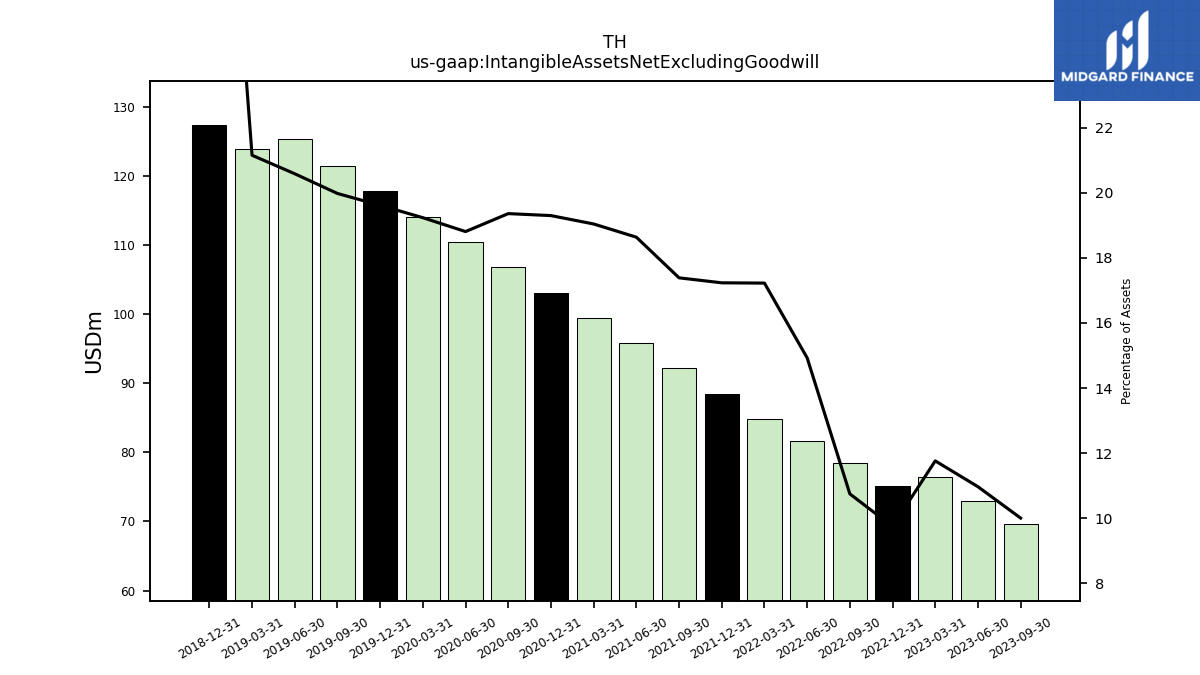
| Intangible Assets Net Excluding Goodwill | 62.92 | 66.28 | 69.66 | 73.03 | 76.39 | 75.18 | 78.41 | 81.63 | 84.85 | 88.48 | 92.15 | 95.80 | 99.46 | 103.12 | 106.79 | 110.46 | 114.12 | 117.87 | 121.44 | 125.33 | 123.86 | 127.38 | NA | NA | NA | NA | NA | |
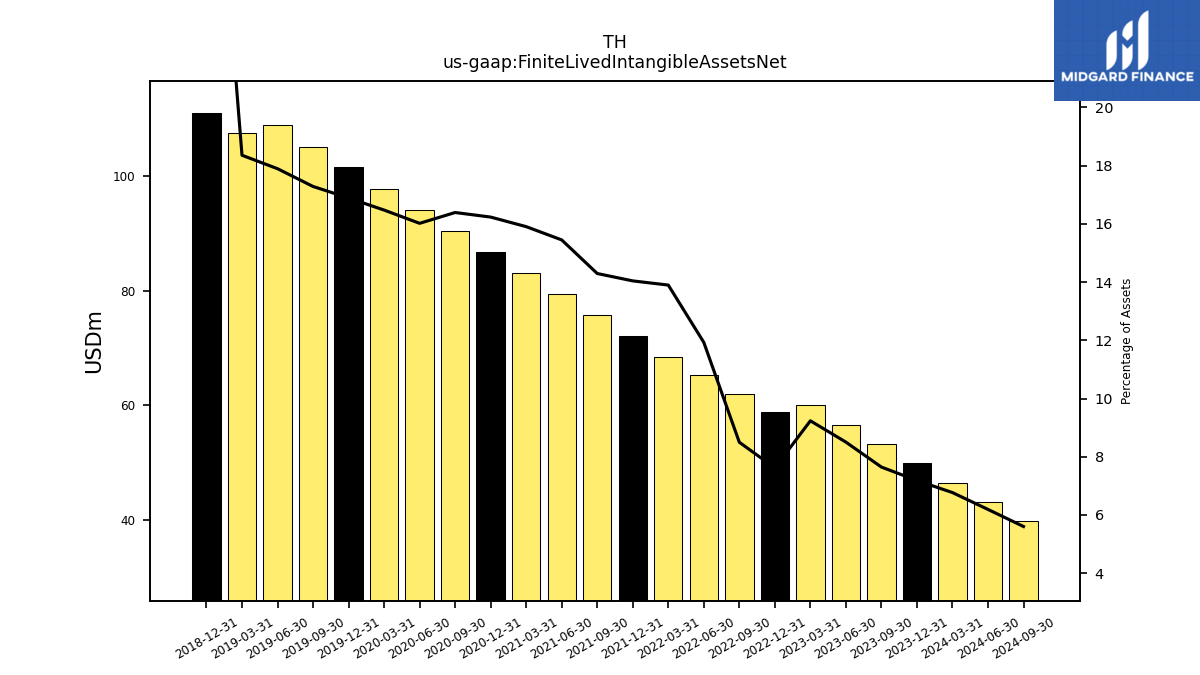
| Finite Lived Intangible Assets Net | 46.52 | 49.88 | 53.26 | 56.63 | 59.99 | 58.78 | 62.01 | 65.23 | 68.45 | 72.08 | 75.75 | 79.40 | 83.06 | 86.72 | 90.39 | 94.06 | 97.72 | 101.47 | 105.04 | 108.93 | 107.46 | 110.98 | NA | NA | NA | NA | NA | |
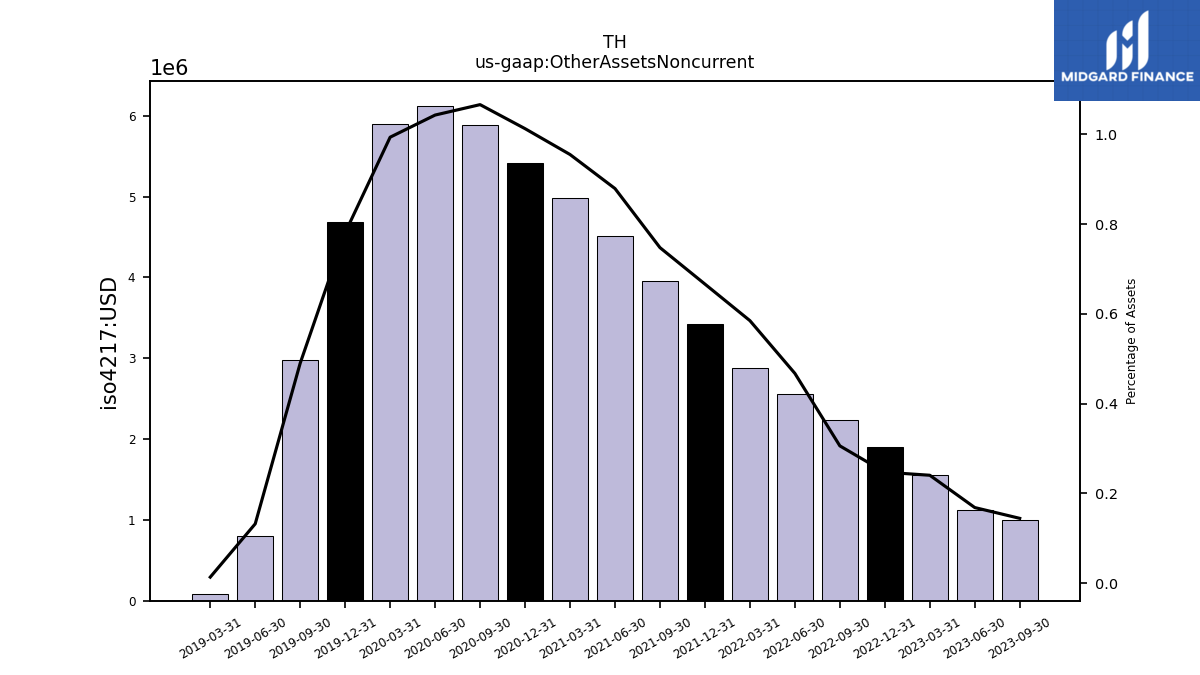
| Other Assets Noncurrent | 0.23 | 0.66 | 1.00 | 1.12 | 1.56 | 1.91 | 2.23 | 2.56 | 2.88 | 3.42 | 3.96 | 4.52 | 4.99 | 5.41 | 5.88 | 6.12 | 5.89 | 4.69 | 2.98 | 0.80 | 0.08 | NA | NA | NA | NA | NA | NA |
| 2024-03-31 | 2023-12-31 | 2023-09-30 | 2023-06-30 | 2023-03-31 | 2022-12-31 | 2022-09-30 | 2022-06-30 | 2022-03-31 | 2021-12-31 | 2021-09-30 | 2021-06-30 | 2021-03-31 | 2020-12-31 | 2020-09-30 | 2020-06-30 | 2020-03-31 | 2019-12-31 | 2019-09-30 | 2019-06-30 | 2019-03-31 | 2018-12-31 | 2018-09-30 | 2018-06-30 | 2018-03-31 | 2017-12-31 | 2017-09-30 | ||
|---|---|---|---|---|---|---|---|---|---|---|---|---|---|---|---|---|---|---|---|---|---|---|---|---|---|---|---|---|
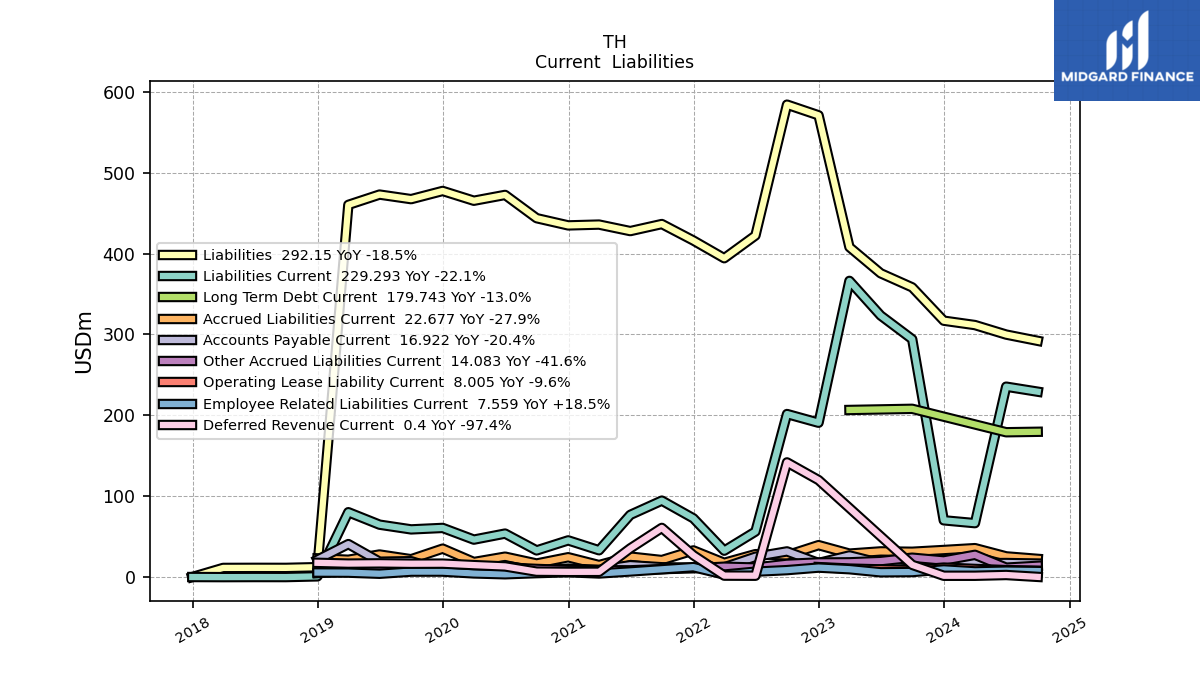
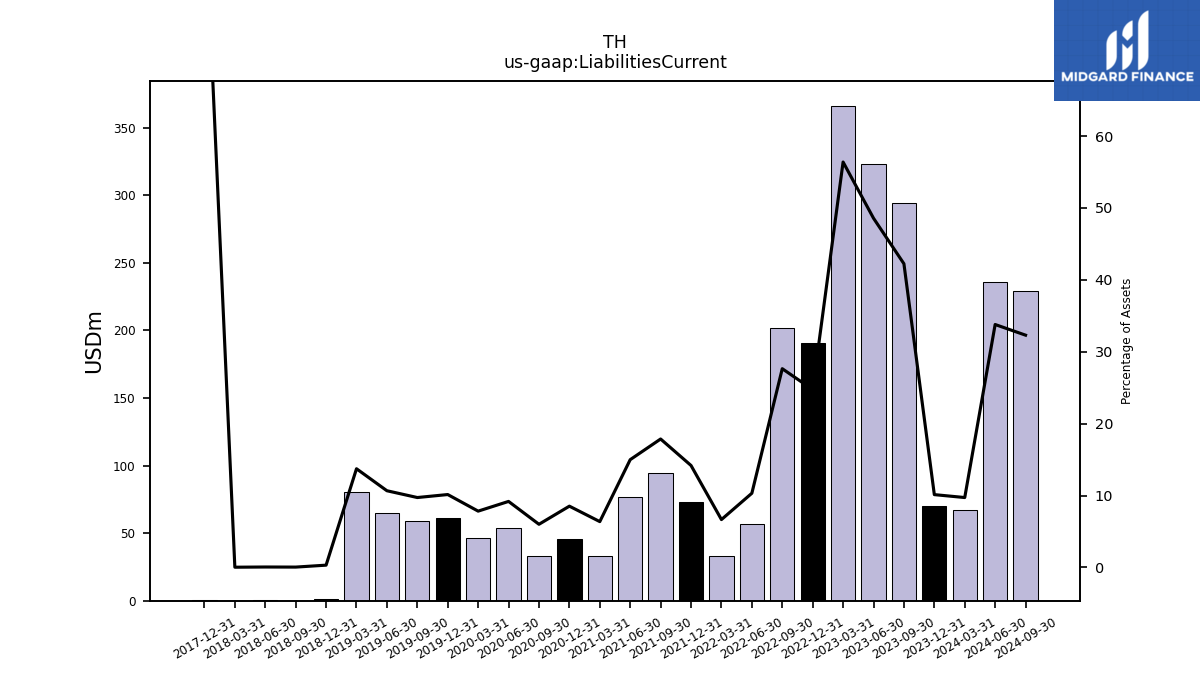
| Liabilities Current | 66.81 | 70.33 | 294.19 | 323.45 | 366.26 | 190.90 | 201.70 | 56.44 | 32.80 | 72.80 | 94.67 | 77.05 | 33.30 | 45.53 | 33.11 | 53.93 | 46.46 | 60.92 | 59.10 | 64.95 | 80.35 | 1.06 | 0.17 | 0.21 | 0.11 | 0.23 | NA | |
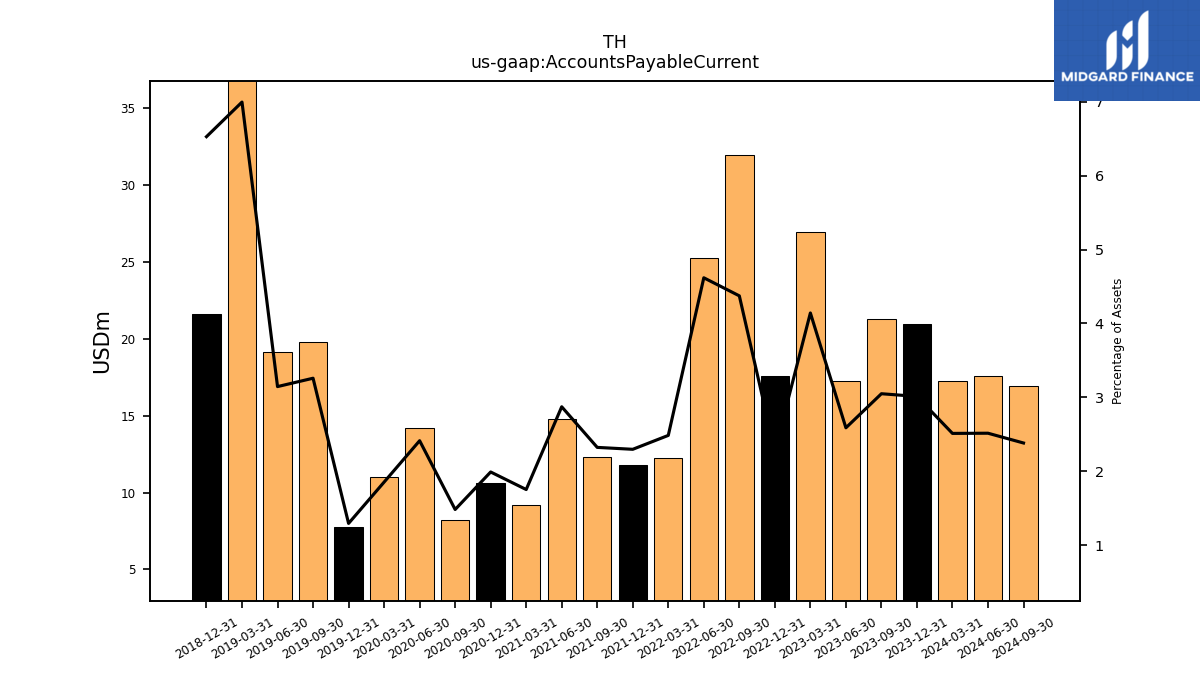
| Accounts Payable Current | 17.27 | 20.93 | 21.25 | 17.25 | 26.91 | 17.56 | 31.91 | 25.25 | 12.25 | 11.80 | 12.32 | 14.77 | 9.17 | 10.64 | 8.19 | 14.18 | 11.01 | 7.79 | 19.81 | 19.16 | 40.94 | 21.60 | NA | NA | NA | NA | NA | |
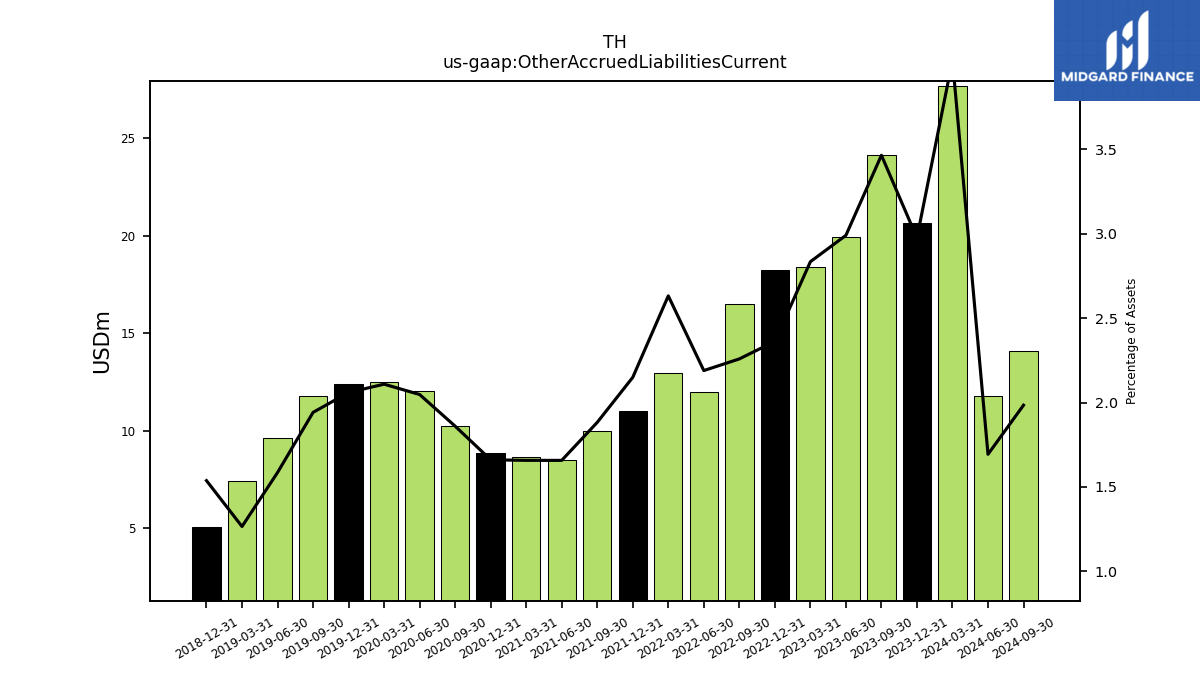
| Other Accrued Liabilities Current | 27.68 | 20.66 | 24.13 | 19.91 | 18.41 | 18.23 | 16.48 | 11.97 | 12.96 | 11.03 | 9.98 | 8.52 | 8.66 | 8.87 | 10.26 | 12.02 | 12.51 | 12.37 | 11.80 | 9.65 | 7.41 | 5.09 | NA | NA | NA | NA | NA | |
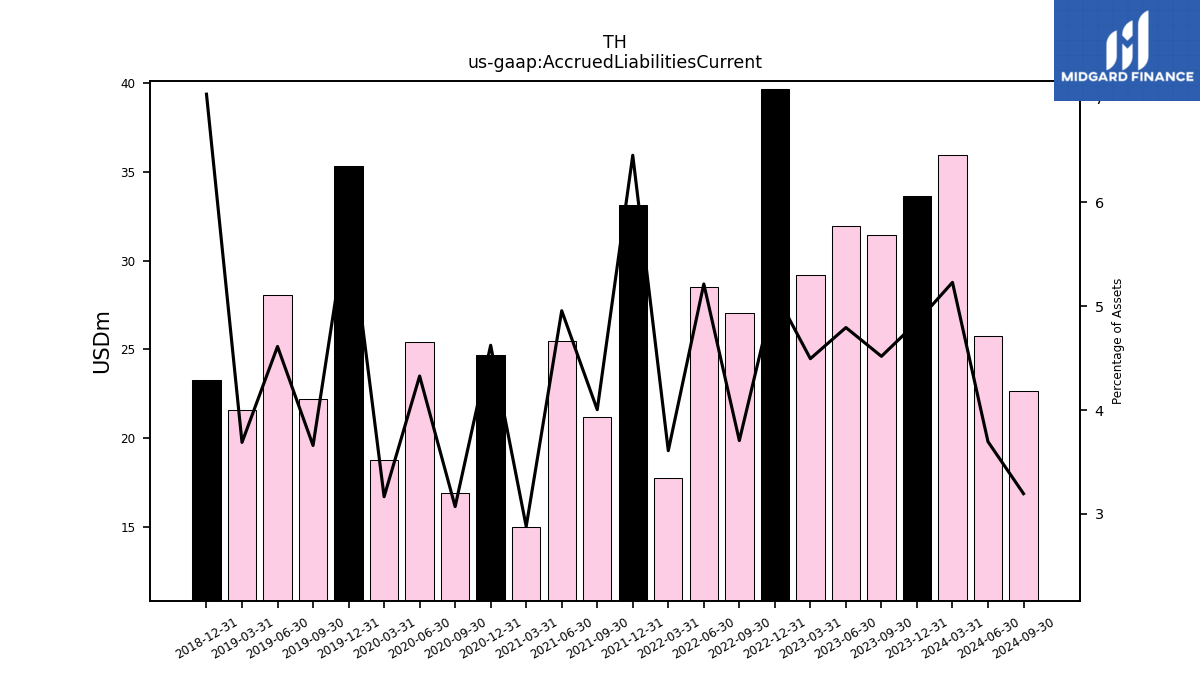
| Accrued Liabilities Current | 35.93 | 33.65 | 31.46 | 31.93 | 29.20 | 39.64 | 27.04 | 28.51 | 17.77 | 33.13 | 21.21 | 25.47 | 15.04 | 24.70 | 16.93 | 25.41 | 18.78 | 35.33 | 22.23 | 28.07 | 21.59 | 23.30 | NA | NA | NA | NA | NA |
| 2024-03-31 | 2023-12-31 | 2023-09-30 | 2023-06-30 | 2023-03-31 | 2022-12-31 | 2022-09-30 | 2022-06-30 | 2022-03-31 | 2021-12-31 | 2021-09-30 | 2021-06-30 | 2021-03-31 | 2020-12-31 | 2020-09-30 | 2020-06-30 | 2020-03-31 | 2019-12-31 | 2019-09-30 | 2019-06-30 | 2019-03-31 | 2018-12-31 | 2018-09-30 | 2018-06-30 | 2018-03-31 | 2017-12-31 | 2017-09-30 | ||
|---|---|---|---|---|---|---|---|---|---|---|---|---|---|---|---|---|---|---|---|---|---|---|---|---|---|---|---|---|
| Long Term Debt Noncurrent | 178.63 | 178.09 | NA | NA | NA | NA | NA | NA | NA | NA | NA | NA | NA | NA | NA | NA | NA | NA | NA | NA | NA | NA | NA | NA | NA | NA | NA | |
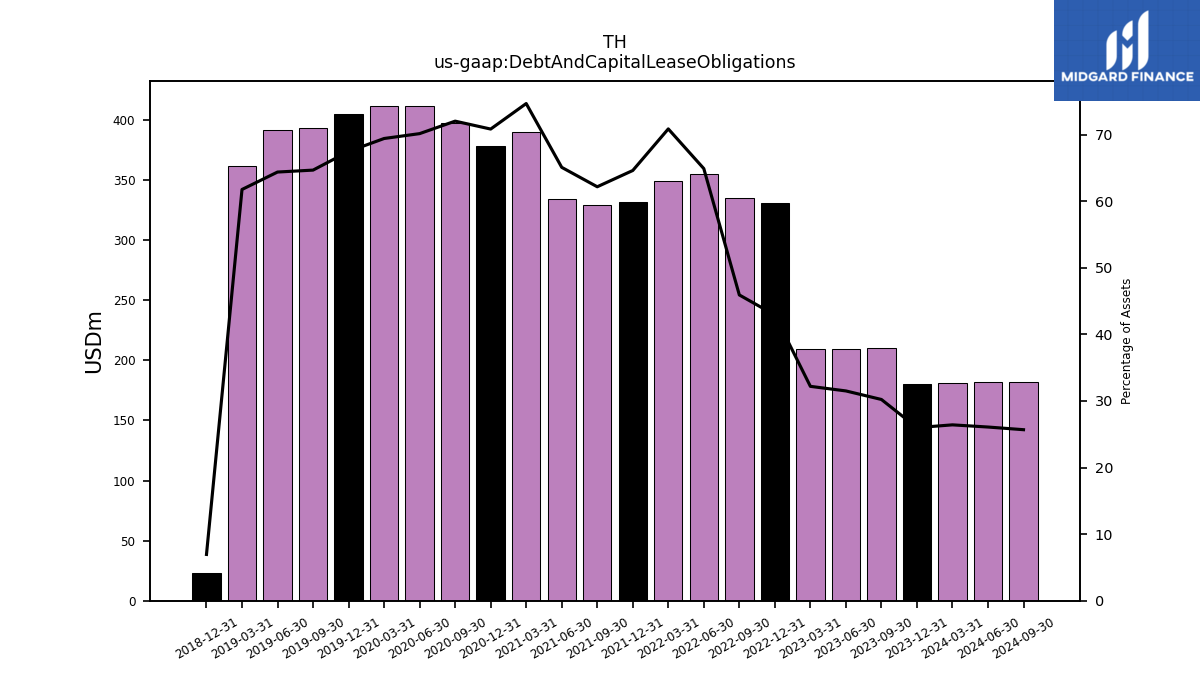
| Debt And Capital Lease Obligations | 181.47 | 180.49 | 210.48 | 209.79 | 209.12 | 331.07 | 335.02 | 354.81 | 348.92 | 331.64 | 329.39 | 334.45 | 389.87 | 378.34 | 397.11 | 411.81 | 411.68 | 405.24 | 392.94 | 391.81 | 361.46 | 23.01 | NA | NA | NA | NA | NA | |
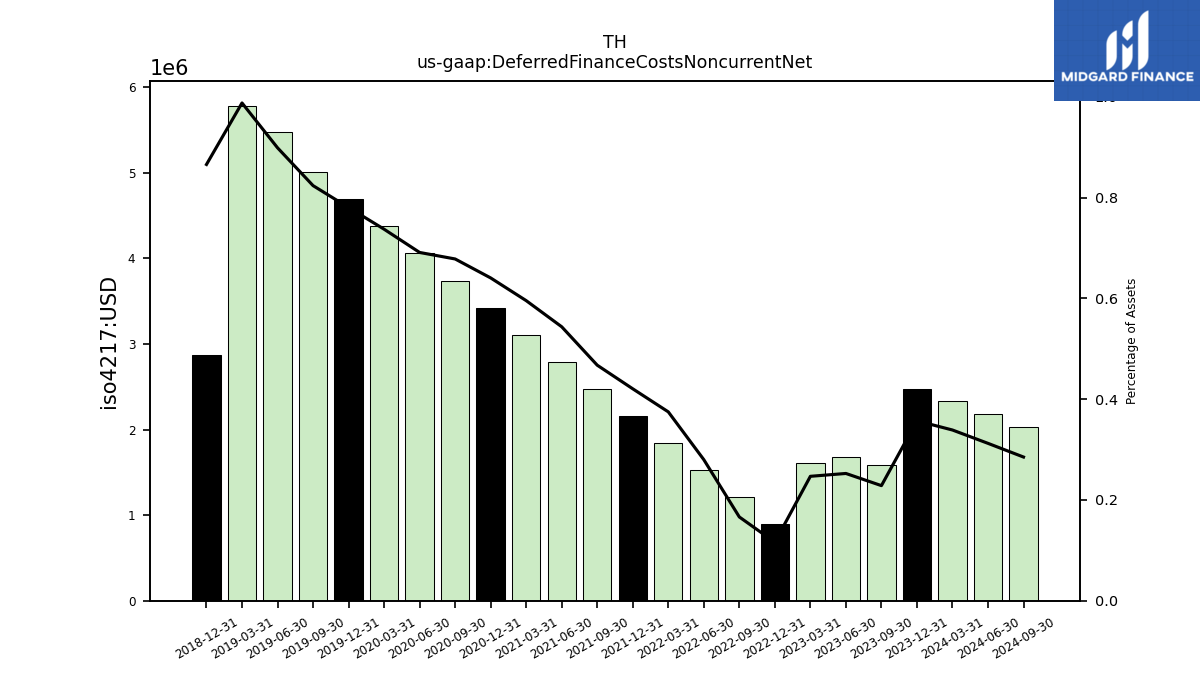
| Deferred Finance Costs Noncurrent Net | 2.33 | 2.48 | 1.59 | 1.68 | 1.60 | 0.90 | 1.21 | 1.53 | 1.85 | 2.16 | 2.48 | 2.79 | 3.11 | 3.42 | 3.74 | 4.06 | 4.37 | 4.69 | 5.01 | 5.47 | 5.78 | 2.87 | NA | NA | NA | NA | NA | |
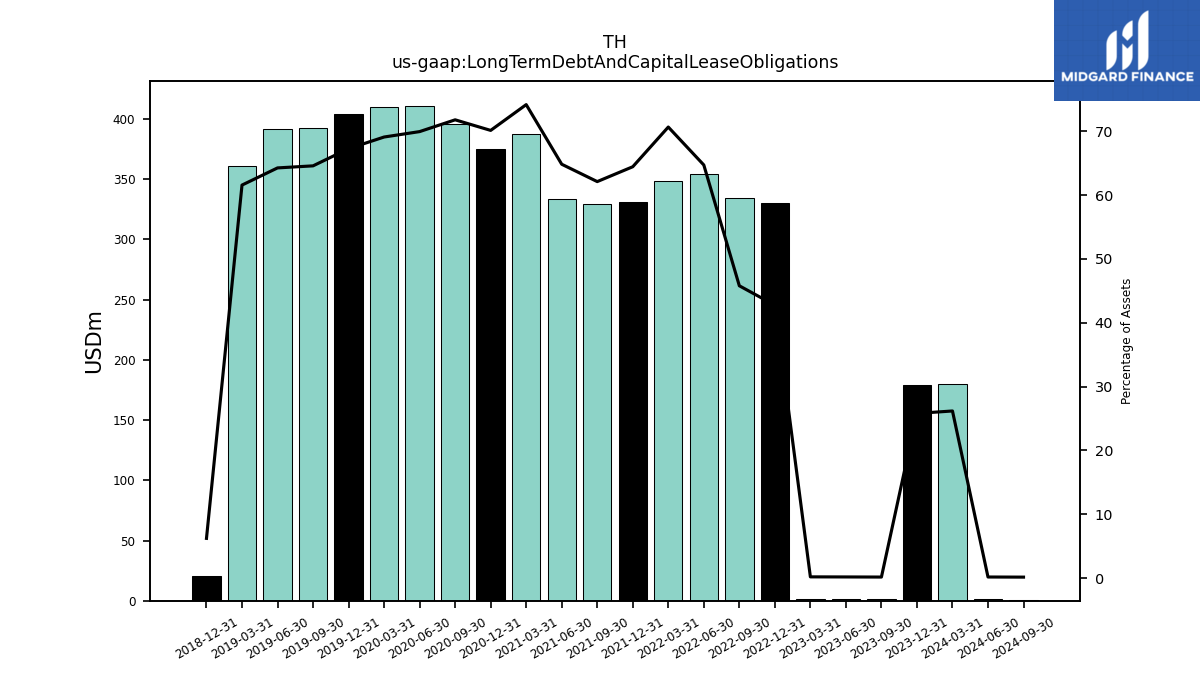
| Long Term Debt And Capital Lease Obligations | 179.90 | 179.12 | 1.05 | 1.11 | 1.18 | 329.94 | 334.19 | 353.98 | 348.11 | 330.91 | 329.25 | 333.30 | 387.47 | 374.77 | 396.02 | 410.81 | 409.97 | 404.25 | 392.57 | 391.24 | 360.49 | 20.56 | NA | NA | NA | NA | NA | |
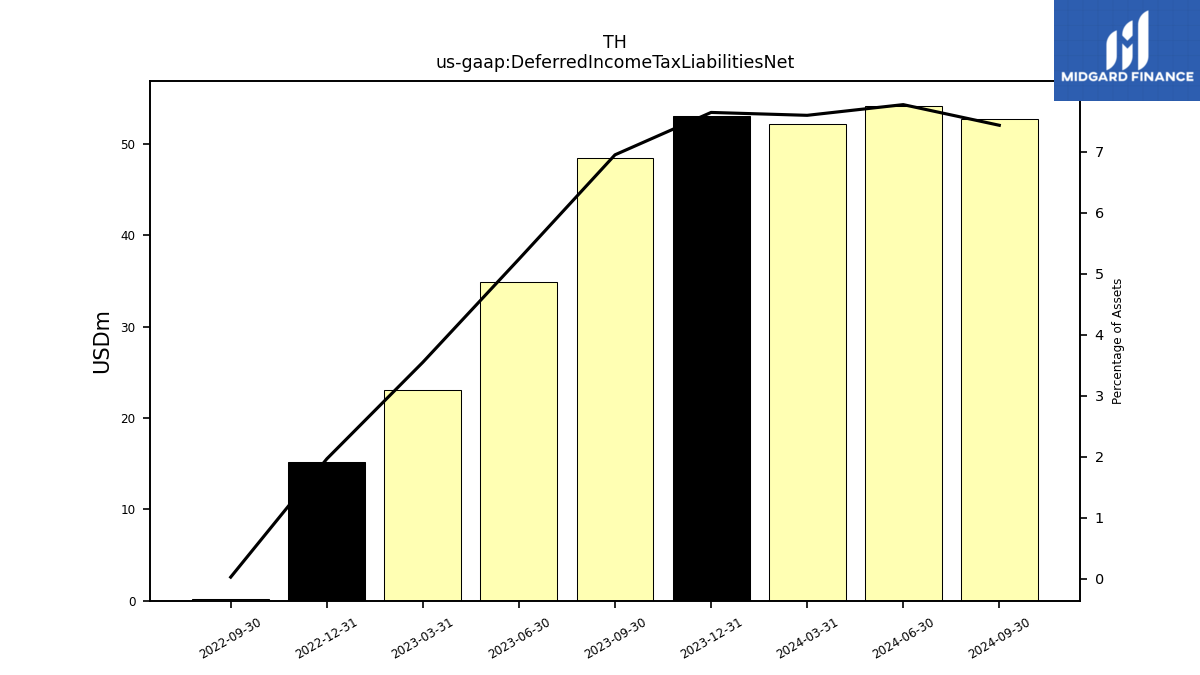
| Deferred Income Tax Liabilities Net | 52.20 | 53.07 | 48.40 | 34.89 | 23.06 | 15.17 | 0.21 | NA | NA | NA | NA | NA | NA | NA | NA | NA | NA | NA | NA | NA | NA | NA | NA | NA | NA | NA | NA | |
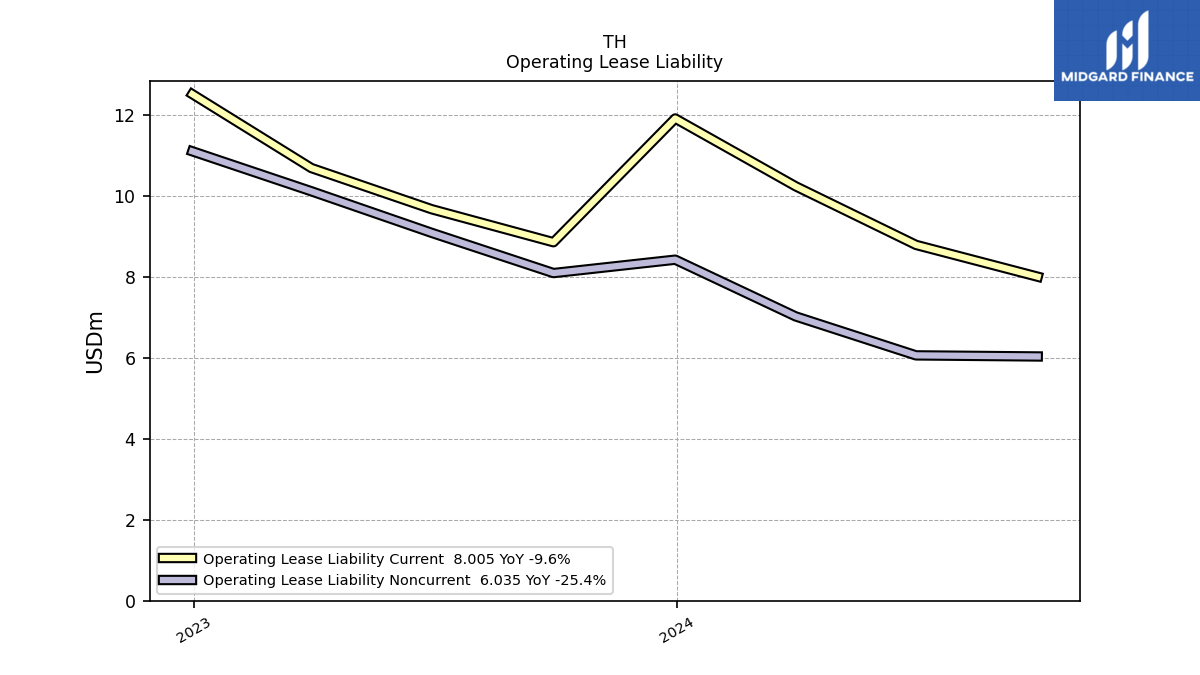
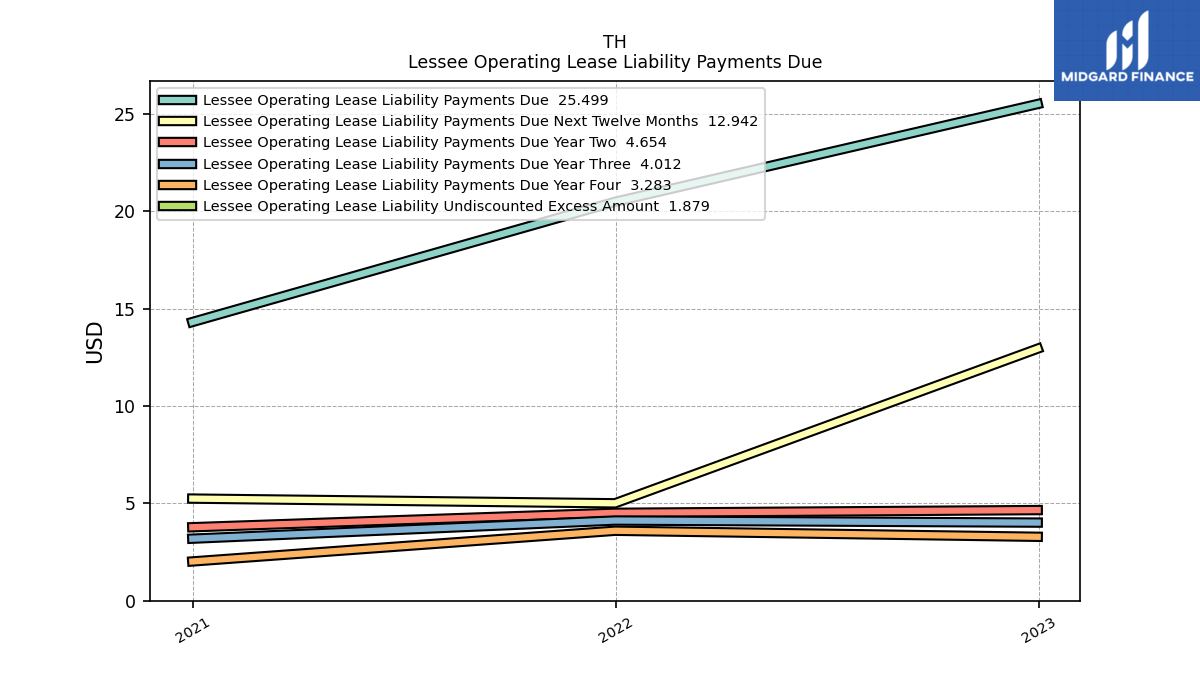
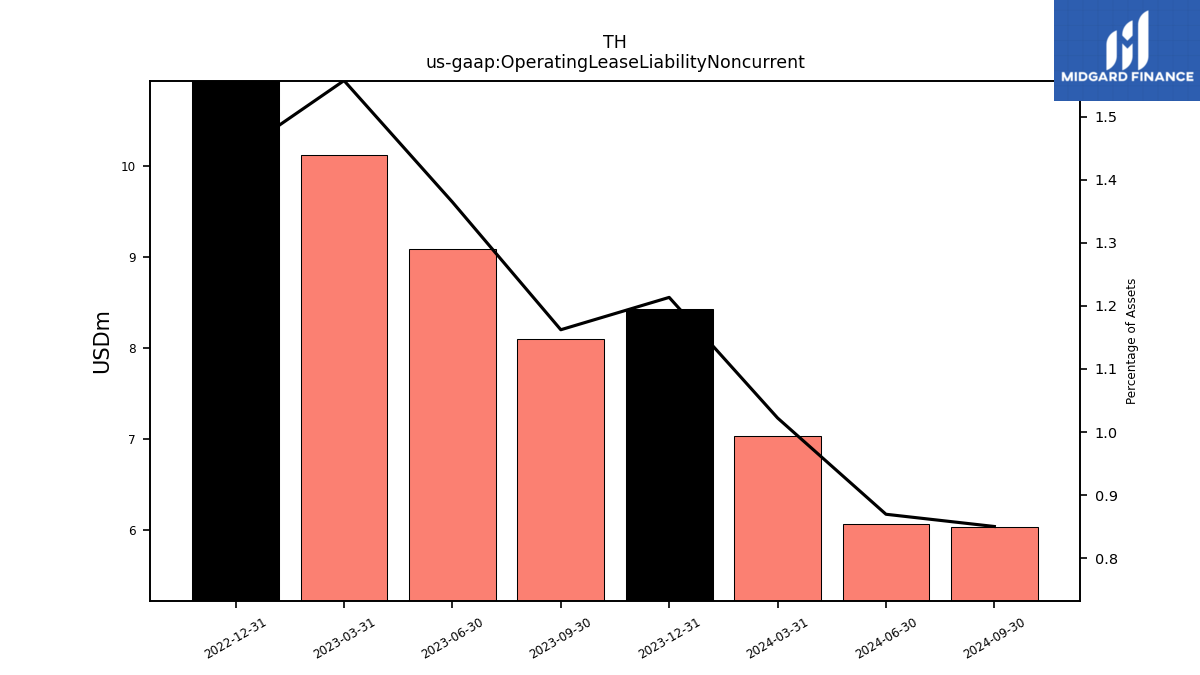
| Operating Lease Liability Noncurrent | 7.03 | 8.43 | 8.10 | 9.09 | 10.12 | 11.10 | NA | NA | NA | NA | NA | NA | NA | NA | NA | NA | NA | NA | NA | NA | NA | NA | NA | NA | NA | NA | NA |
| 2024-03-31 | 2023-12-31 | 2023-09-30 | 2023-06-30 | 2023-03-31 | 2022-12-31 | 2022-09-30 | 2022-06-30 | 2022-03-31 | 2021-12-31 | 2021-09-30 | 2021-06-30 | 2021-03-31 | 2020-12-31 | 2020-09-30 | 2020-06-30 | 2020-03-31 | 2019-12-31 | 2019-09-30 | 2019-06-30 | 2019-03-31 | 2018-12-31 | 2018-09-30 | 2018-06-30 | 2018-03-31 | 2017-12-31 | 2017-09-30 | ||
|---|---|---|---|---|---|---|---|---|---|---|---|---|---|---|---|---|---|---|---|---|---|---|---|---|---|---|---|---|
| Stockholders Equity | 375.53 | 377.31 | 338.27 | 290.32 | 241.61 | 200.85 | 145.62 | 124.53 | 98.31 | 97.27 | 93.45 | 86.20 | 86.44 | 99.42 | 107.76 | 114.70 | 127.89 | 123.40 | 140.48 | 135.83 | 125.18 | 5.00 | 5.00 | 5.00 | 5.00 | 0.02 | NA | |
| Common Stock Value | 0.01 | 0.01 | 0.01 | 0.01 | 0.01 | 0.01 | 0.01 | 0.01 | 0.01 | 0.01 | 0.01 | 0.01 | 0.01 | 0.01 | 0.01 | 0.01 | 0.01 | 0.01 | 0.01 | 0.01 | 0.01 | 0.01 | NA | NA | NA | NA | NA | |
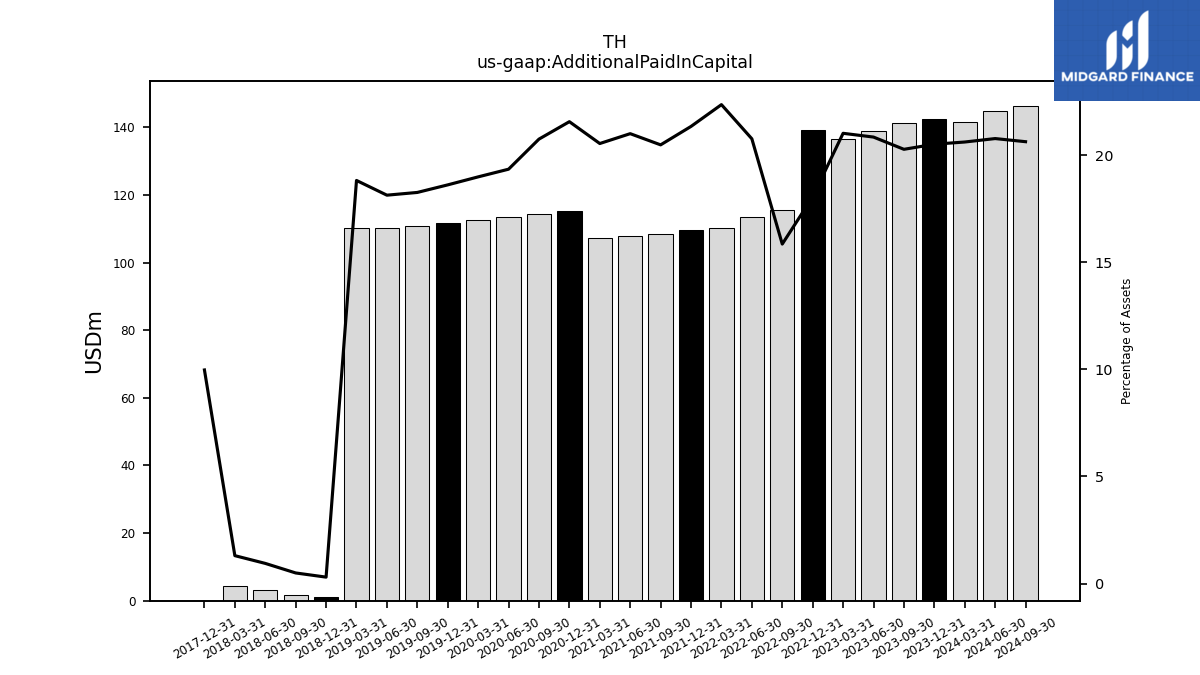
| Additional Paid In Capital | 141.61 | 142.38 | 141.17 | 138.78 | 136.52 | 139.29 | 115.62 | 113.52 | 110.10 | 109.54 | 108.51 | 107.92 | 107.26 | 115.17 | 114.40 | 113.56 | 112.59 | 111.79 | 110.94 | 110.34 | 110.14 | 1.00 | 1.63 | 3.09 | 4.26 | 0.02 | NA | |
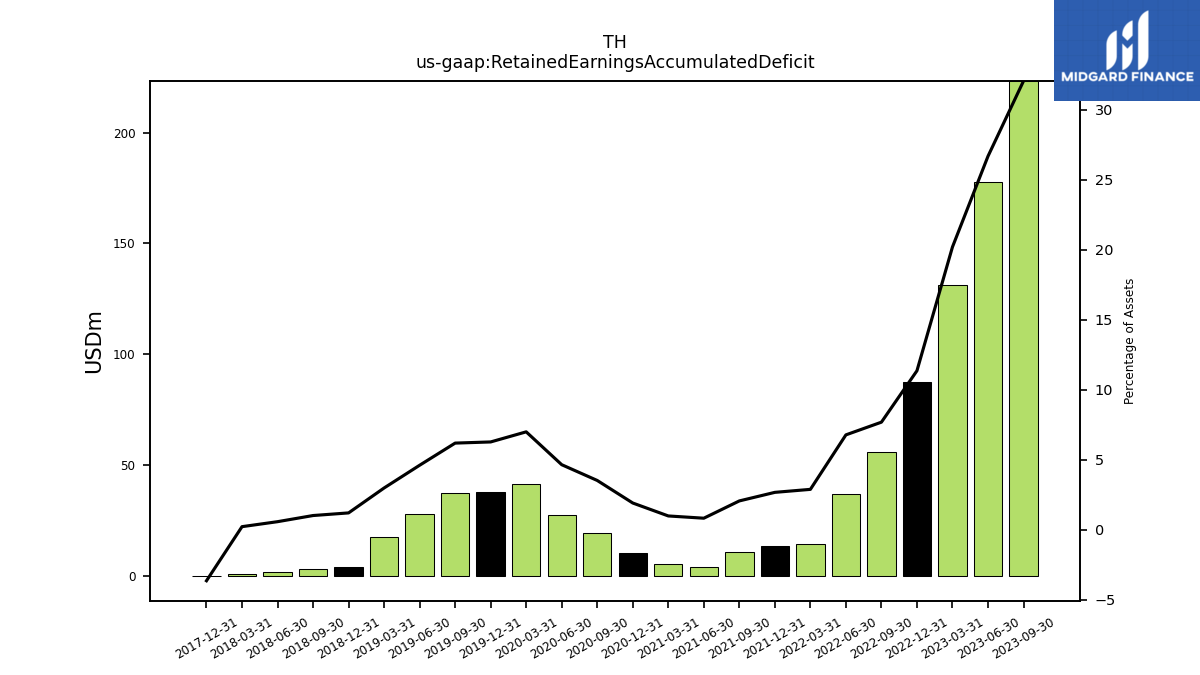
| Retained Earnings Accumulated Deficit | 281.50 | 261.12 | 223.27 | 177.69 | 131.24 | 87.68 | 56.11 | 37.09 | 14.24 | 13.74 | 10.95 | 4.27 | 5.18 | 10.24 | 19.45 | 27.32 | 41.52 | 37.72 | 37.65 | 28.08 | 17.50 | 4.00 | 3.37 | 1.91 | 0.74 | -0.01 | NA |
| 2024-03-31 | 2023-12-31 | 2023-09-30 | 2023-06-30 | 2023-03-31 | 2022-12-31 | 2022-09-30 | 2022-06-30 | 2022-03-31 | 2021-12-31 | 2021-09-30 | 2021-06-30 | 2021-03-31 | 2020-12-31 | 2020-09-30 | 2020-06-30 | 2020-03-31 | 2019-12-31 | 2019-09-30 | 2019-06-30 | 2019-03-31 | 2018-12-31 | 2018-09-30 | 2018-06-30 | 2018-03-31 | 2017-12-31 | 2017-09-30 | ||
|---|---|---|---|---|---|---|---|---|---|---|---|---|---|---|---|---|---|---|---|---|---|---|---|---|---|---|---|---|
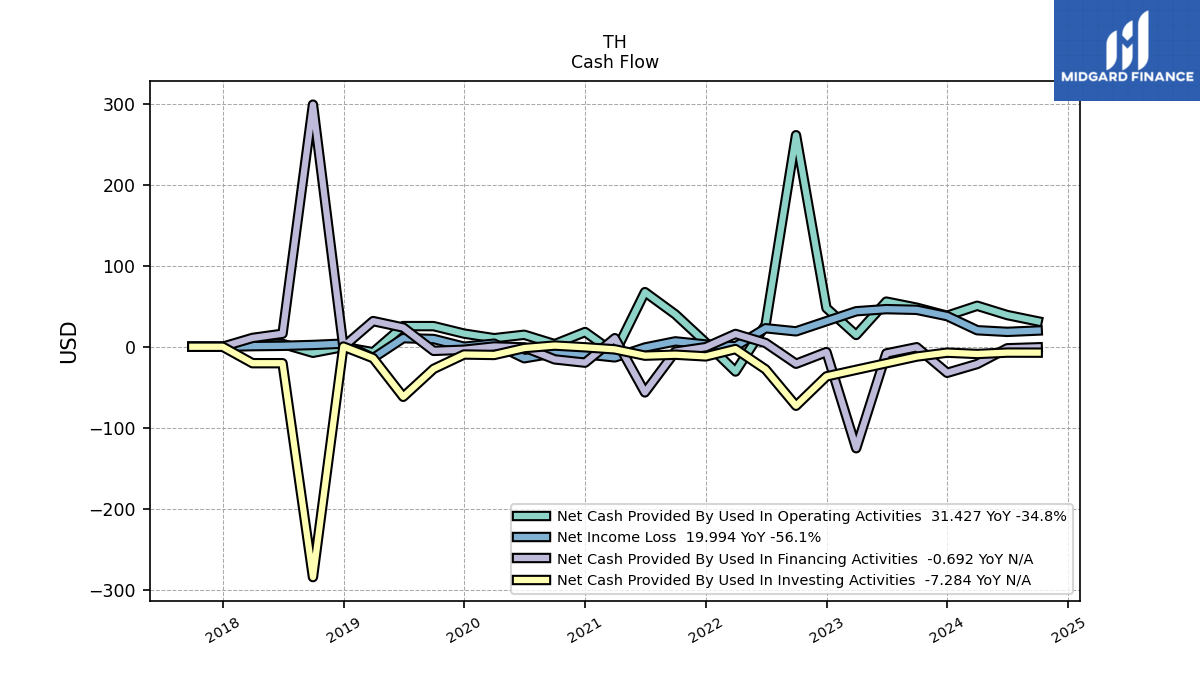
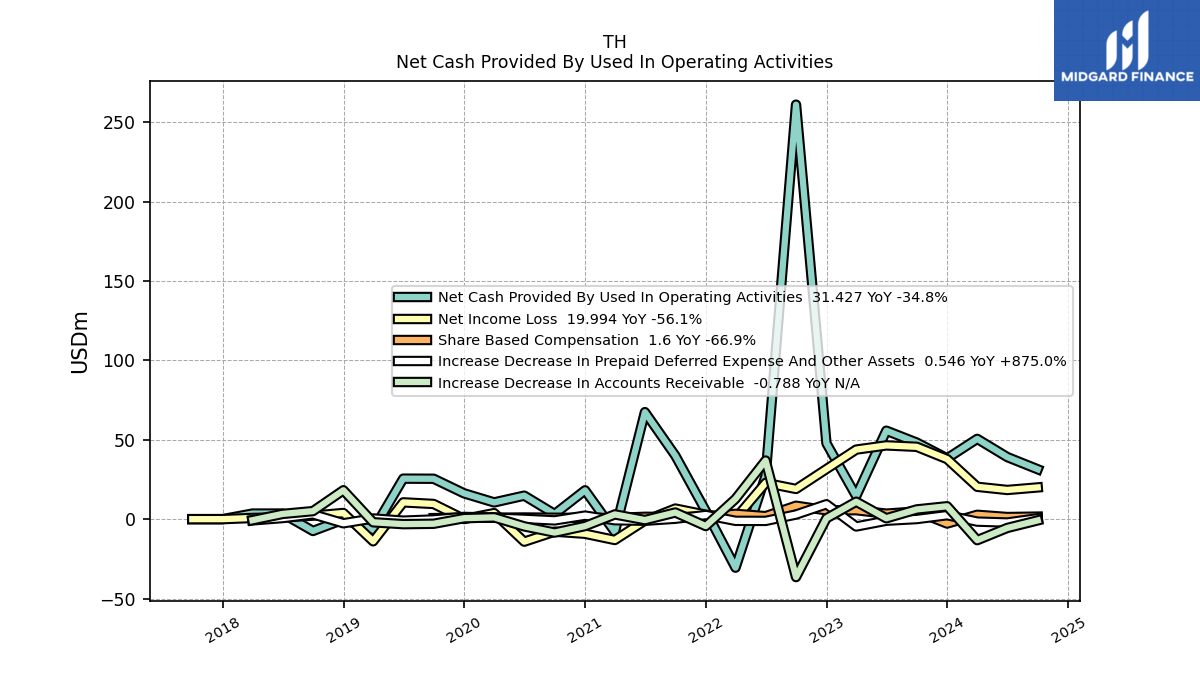
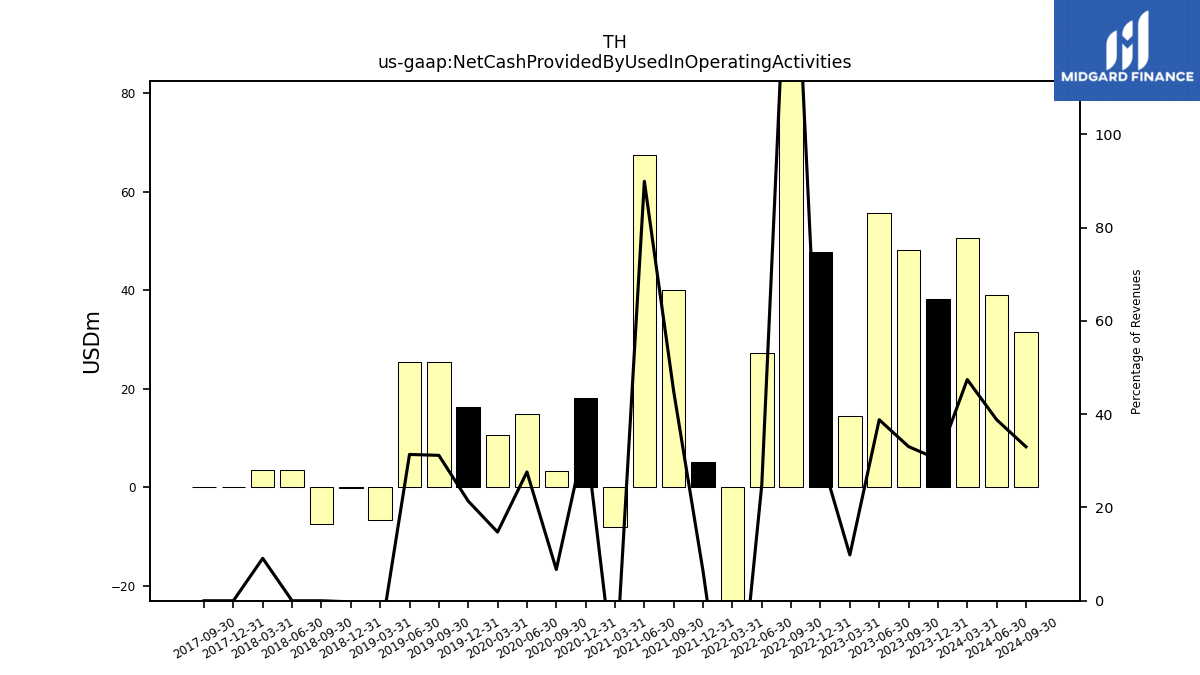
| Net Cash Provided By Used In Operating Activities | 50.59 | 38.29 | 48.24 | 55.75 | 14.53 | 47.79 | 261.19 | 27.21 | -30.58 | 5.15 | 40.01 | 67.44 | -8.00 | 18.19 | 3.23 | 14.81 | 10.55 | 16.27 | 25.45 | 25.52 | -6.75 | -0.23 | -7.45 | 3.53 | 3.52 | 0.00 | 0.00 | |
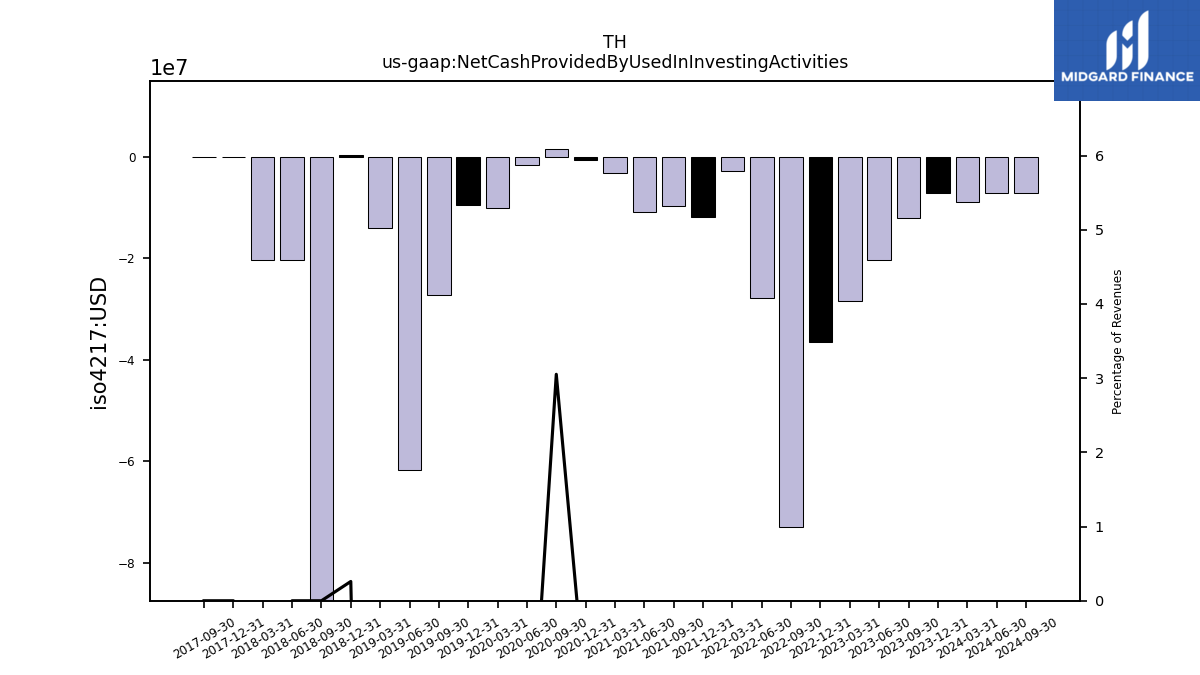
| Net Cash Provided By Used In Investing Activities | -8.92 | -7.27 | -12.12 | -20.35 | -28.45 | -36.57 | -72.89 | -27.93 | -2.83 | -11.91 | -9.80 | -11.01 | -3.20 | -0.66 | 1.47 | -1.62 | -10.14 | -9.57 | -27.28 | -61.83 | -14.02 | 0.25 | -284.41 | -20.29 | -20.30 | 0.00 | 0.00 | |
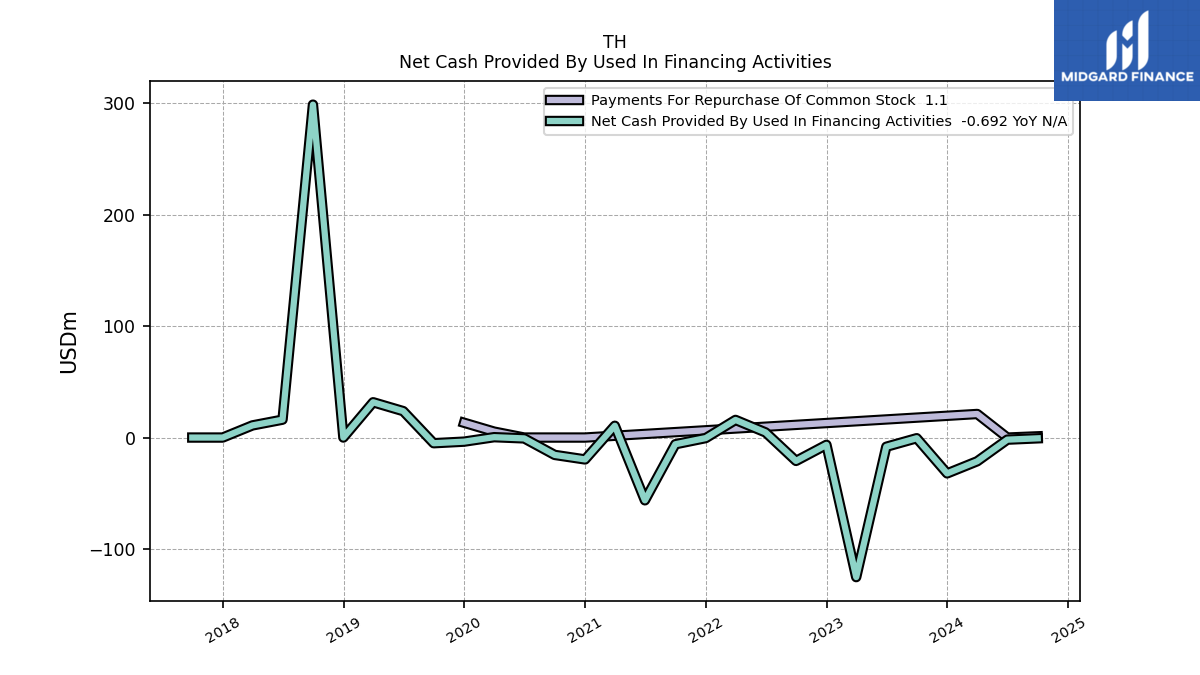
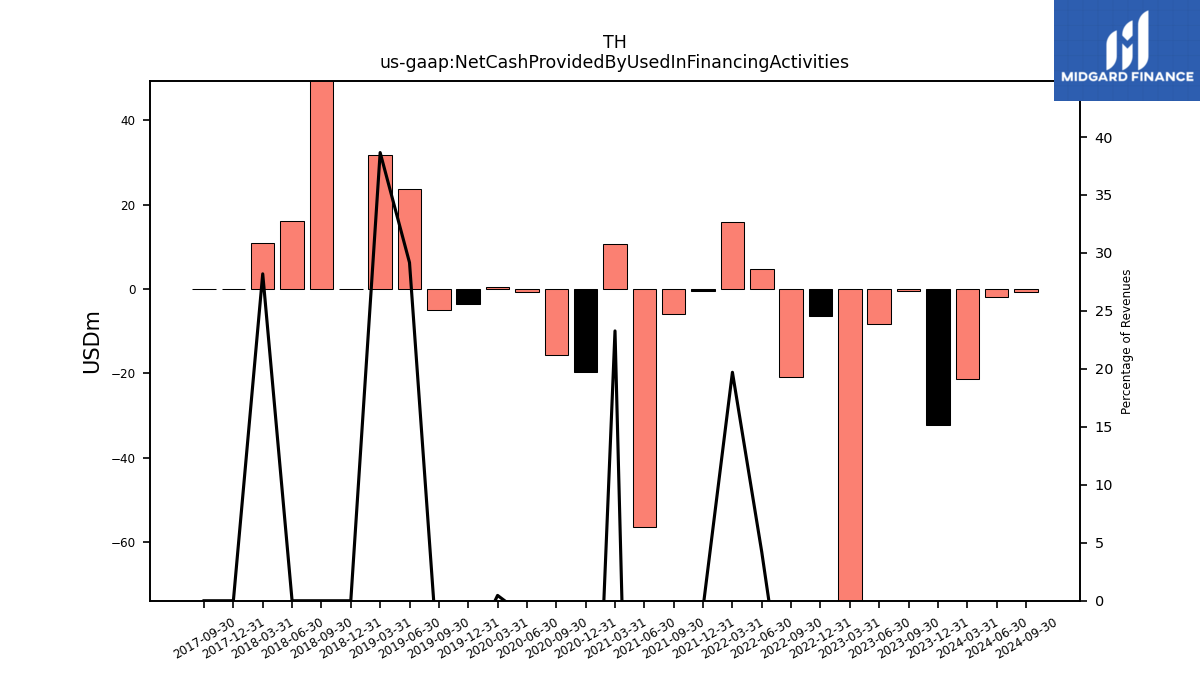
| Net Cash Provided By Used In Financing Activities | -21.30 | -32.19 | -0.59 | -8.26 | -125.33 | -6.54 | -20.99 | 4.59 | 15.83 | -0.48 | -6.02 | -56.36 | 10.59 | -19.66 | -15.59 | -0.77 | 0.33 | -3.67 | -5.10 | 23.73 | 31.69 | 0.00 | 298.93 | 16.05 | 10.90 | 0.00 | 0.00 |
| 2024-03-31 | 2023-12-31 | 2023-09-30 | 2023-06-30 | 2023-03-31 | 2022-12-31 | 2022-09-30 | 2022-06-30 | 2022-03-31 | 2021-12-31 | 2021-09-30 | 2021-06-30 | 2021-03-31 | 2020-12-31 | 2020-09-30 | 2020-06-30 | 2020-03-31 | 2019-12-31 | 2019-09-30 | 2019-06-30 | 2019-03-31 | 2018-12-31 | 2018-09-30 | 2018-06-30 | 2018-03-31 | 2017-12-31 | 2017-09-30 | ||
|---|---|---|---|---|---|---|---|---|---|---|---|---|---|---|---|---|---|---|---|---|---|---|---|---|---|---|---|---|
| Net Cash Provided By Used In Operating Activities | 50.59 | 38.29 | 48.24 | 55.75 | 14.53 | 47.79 | 261.19 | 27.21 | -30.58 | 5.15 | 40.01 | 67.44 | -8.00 | 18.19 | 3.23 | 14.81 | 10.55 | 16.27 | 25.45 | 25.52 | -6.75 | -0.23 | -7.45 | 3.53 | 3.52 | 0.00 | 0.00 | |
| Net Income Loss | 20.38 | 37.84 | 45.58 | 46.45 | 43.83 | 31.57 | 19.02 | 22.85 | 0.49 | 2.80 | 6.67 | -0.91 | -13.14 | -9.21 | -7.87 | -14.20 | 3.80 | 0.07 | 9.57 | 10.58 | -13.98 | 3.88 | 2.21 | 1.17 | 0.75 | -0.00 | -0.01 | |
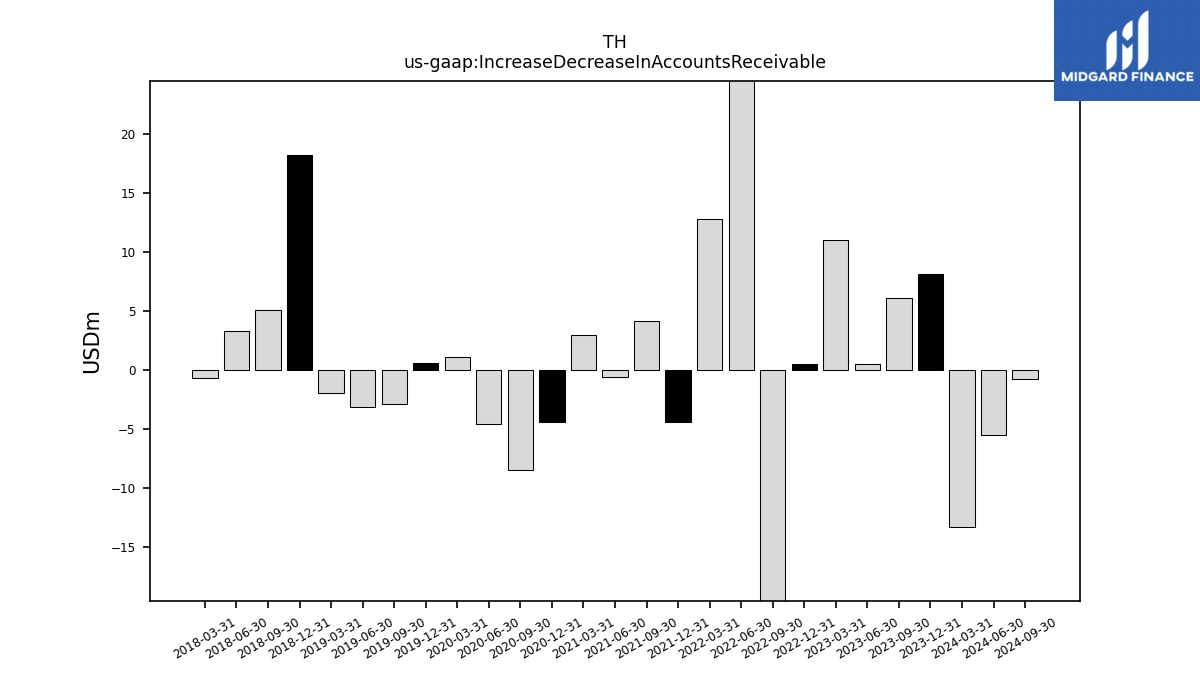
| Increase Decrease In Accounts Receivable | -13.25 | 8.12 | 6.13 | 0.54 | 11.01 | 0.51 | -36.53 | 36.93 | 12.78 | -4.37 | 4.19 | -0.57 | 2.98 | -4.36 | -8.47 | -4.56 | 1.12 | 0.60 | -2.91 | -3.16 | -1.97 | 18.21 | 5.06 | 3.29 | -0.65 | NA | NA | |
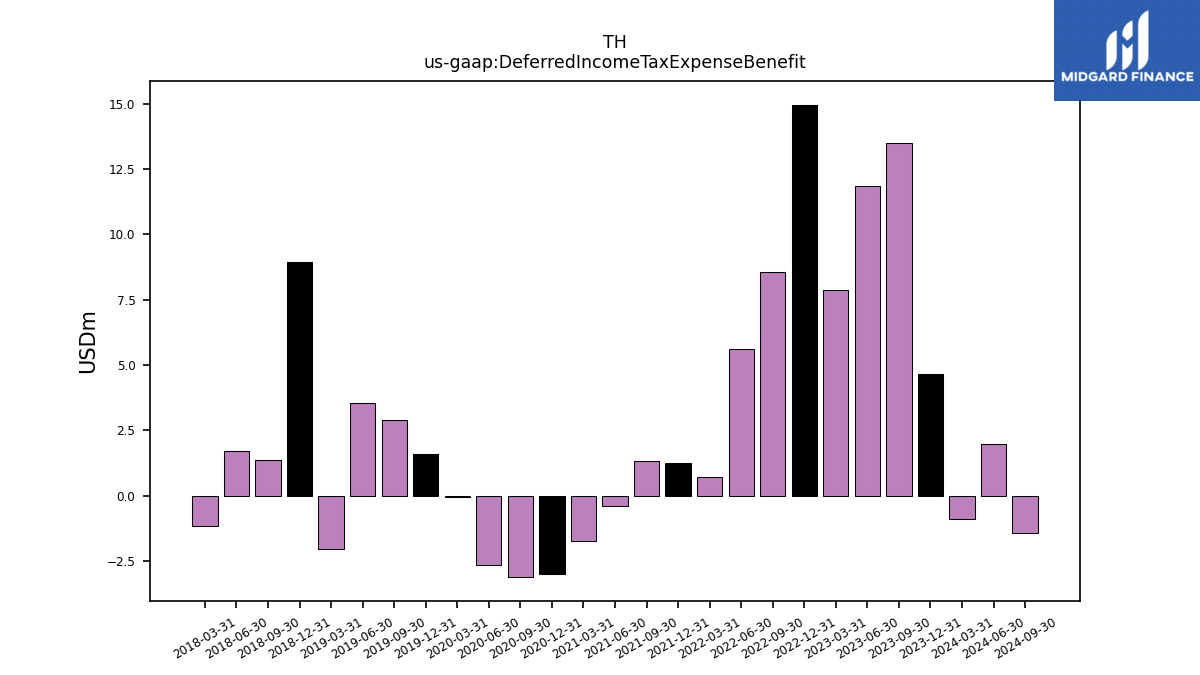
| Deferred Income Tax Expense Benefit | -0.87 | 4.67 | 13.51 | 11.83 | 7.89 | 14.96 | 8.57 | 5.62 | 0.72 | 1.27 | 1.32 | -0.39 | -1.74 | -2.98 | -3.11 | -2.63 | -0.04 | 1.58 | 2.91 | 3.54 | -2.04 | 8.93 | 1.37 | 1.72 | -1.16 | NA | NA | |
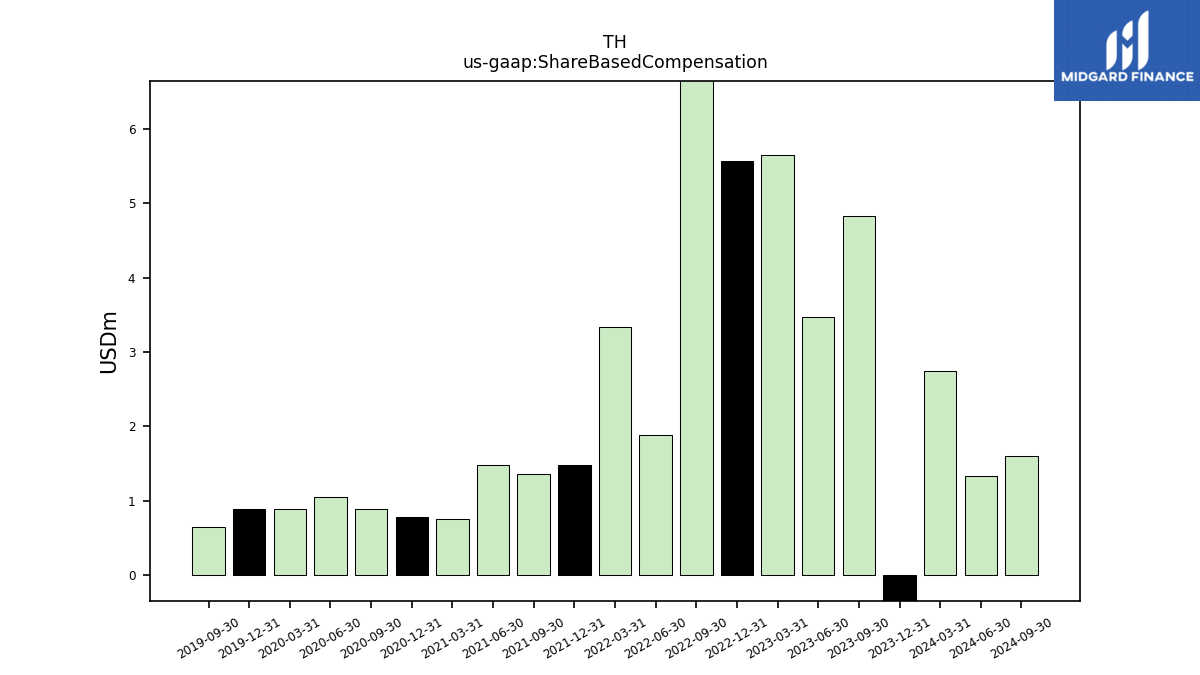
| Share Based Compensation | 2.75 | -2.77 | 4.83 | 3.47 | 5.65 | 5.57 | 8.44 | 1.89 | 3.34 | 1.48 | 1.36 | 1.48 | 0.76 | 0.78 | 0.89 | 1.05 | 0.88 | 0.89 | 0.65 | NA | NA | NA | NA | NA | NA | NA | NA | |
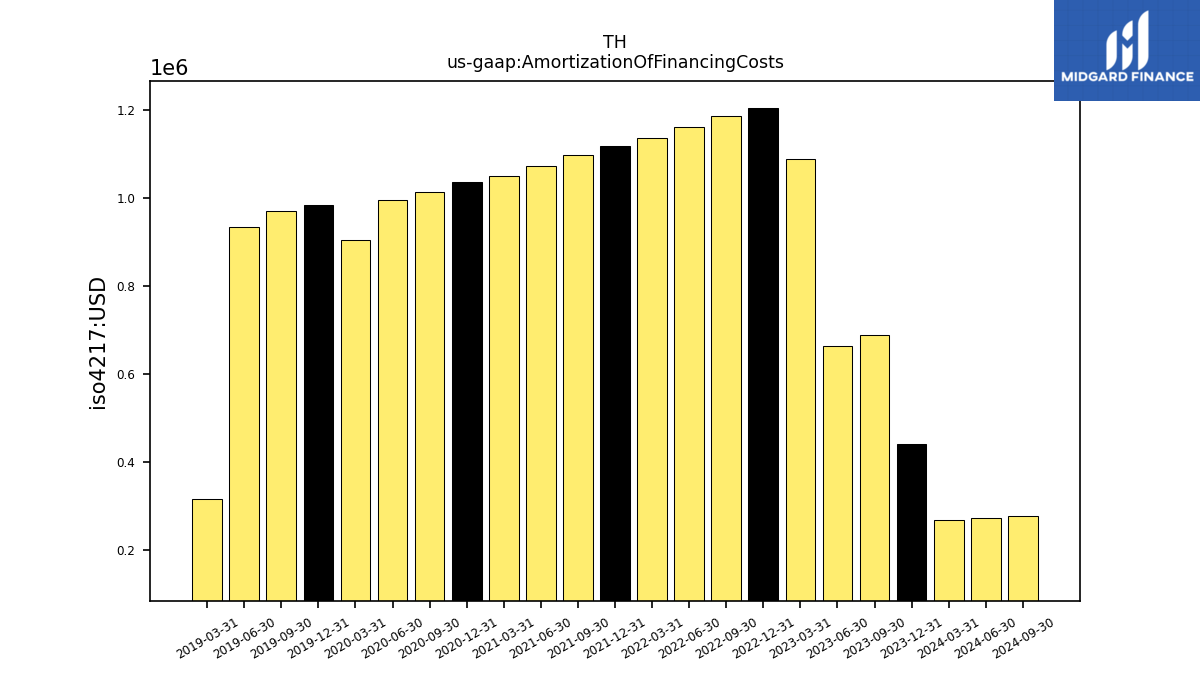
| Amortization Of Financing Costs | 0.27 | 0.44 | 0.69 | 0.66 | 1.09 | 1.21 | 1.19 | 1.16 | 1.14 | 1.12 | 1.10 | 1.07 | 1.05 | 1.04 | 1.01 | 0.99 | 0.90 | 0.98 | 0.97 | 0.94 | 0.32 | NA | NA | NA | NA | NA | NA |
| 2024-03-31 | 2023-12-31 | 2023-09-30 | 2023-06-30 | 2023-03-31 | 2022-12-31 | 2022-09-30 | 2022-06-30 | 2022-03-31 | 2021-12-31 | 2021-09-30 | 2021-06-30 | 2021-03-31 | 2020-12-31 | 2020-09-30 | 2020-06-30 | 2020-03-31 | 2019-12-31 | 2019-09-30 | 2019-06-30 | 2019-03-31 | 2018-12-31 | 2018-09-30 | 2018-06-30 | 2018-03-31 | 2017-12-31 | 2017-09-30 | ||
|---|---|---|---|---|---|---|---|---|---|---|---|---|---|---|---|---|---|---|---|---|---|---|---|---|---|---|---|---|
| Net Cash Provided By Used In Investing Activities | -8.92 | -7.27 | -12.12 | -20.35 | -28.45 | -36.57 | -72.89 | -27.93 | -2.83 | -11.91 | -9.80 | -11.01 | -3.20 | -0.66 | 1.47 | -1.62 | -10.14 | -9.57 | -27.28 | -61.83 | -14.02 | 0.25 | -284.41 | -20.29 | -20.30 | 0.00 | 0.00 |
| 2024-03-31 | 2023-12-31 | 2023-09-30 | 2023-06-30 | 2023-03-31 | 2022-12-31 | 2022-09-30 | 2022-06-30 | 2022-03-31 | 2021-12-31 | 2021-09-30 | 2021-06-30 | 2021-03-31 | 2020-12-31 | 2020-09-30 | 2020-06-30 | 2020-03-31 | 2019-12-31 | 2019-09-30 | 2019-06-30 | 2019-03-31 | 2018-12-31 | 2018-09-30 | 2018-06-30 | 2018-03-31 | 2017-12-31 | 2017-09-30 | ||
|---|---|---|---|---|---|---|---|---|---|---|---|---|---|---|---|---|---|---|---|---|---|---|---|---|---|---|---|---|
| Net Cash Provided By Used In Financing Activities | -21.30 | -32.19 | -0.59 | -8.26 | -125.33 | -6.54 | -20.99 | 4.59 | 15.83 | -0.48 | -6.02 | -56.36 | 10.59 | -19.66 | -15.59 | -0.77 | 0.33 | -3.67 | -5.10 | 23.73 | 31.69 | 0.00 | 298.93 | 16.05 | 10.90 | 0.00 | 0.00 | |
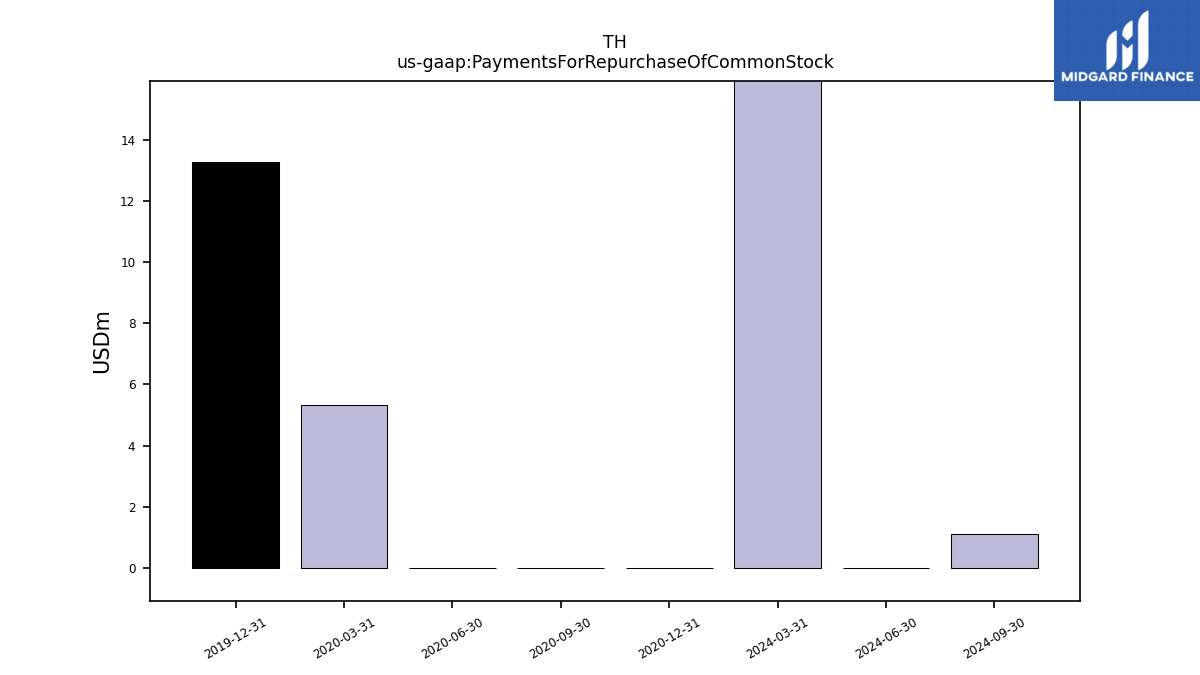
| Payments For Repurchase Of Common Stock | 21.16 | NA | NA | NA | NA | NA | NA | NA | NA | NA | NA | NA | NA | 0.00 | 0.00 | 0.00 | 5.32 | 13.28 | NA | NA | NA | NA | NA | NA | NA | NA | NA |
| 2024-03-31 | 2023-12-31 | 2023-09-30 | 2023-06-30 | 2023-03-31 | 2022-12-31 | 2022-09-30 | 2022-06-30 | 2022-03-31 | 2021-12-31 | 2021-09-30 | 2021-06-30 | 2021-03-31 | 2020-12-31 | 2020-09-30 | 2020-06-30 | 2020-03-31 | 2019-12-31 | 2019-09-30 | 2019-06-30 | 2019-03-31 | 2018-12-31 | 2018-09-30 | 2018-06-30 | 2018-03-31 | 2017-12-31 | 2017-09-30 | ||
|---|---|---|---|---|---|---|---|---|---|---|---|---|---|---|---|---|---|---|---|---|---|---|---|---|---|---|---|---|
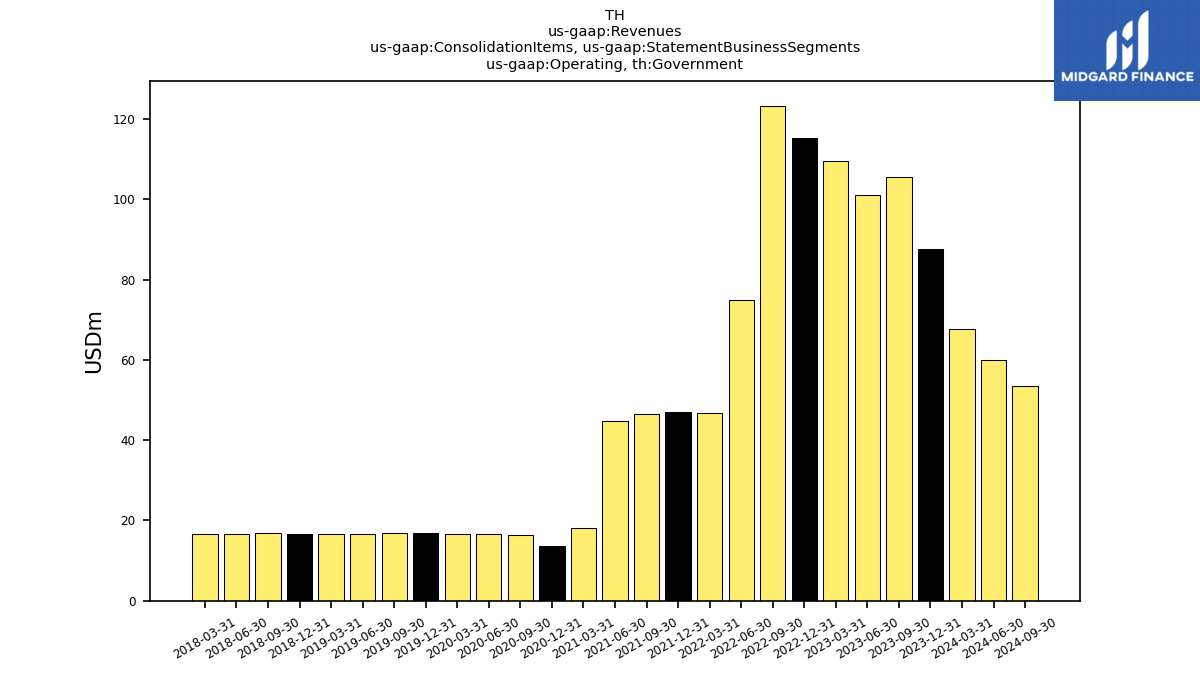
| Revenues | 106.67 | 126.22 | 145.94 | 143.63 | 147.82 | 152.44 | 159.56 | 109.65 | 80.33 | 81.69 | 89.17 | 74.99 | 45.49 | 51.61 | 48.26 | 53.62 | 71.66 | 76.11 | 81.64 | 81.36 | 81.98 | 96.15 | 0.00 | 0.00 | 38.65 | 0.00 | 0.00 | |
| Operating | 106.67 | 126.22 | 145.94 | 143.63 | 147.82 | 152.44 | 159.56 | 109.65 | 80.33 | 81.69 | 89.17 | 74.99 | 45.49 | 51.61 | 48.26 | 53.62 | 71.66 | 76.11 | 81.64 | 81.36 | 81.98 | 96.15 | 60.33 | 45.48 | 38.65 | NA | NA | |
| Operating, Government | 67.61 | 87.50 | 105.54 | 101.18 | 109.50 | 115.28 | 123.31 | 74.92 | 46.79 | 46.99 | 46.43 | 44.79 | 18.04 | 13.73 | 16.26 | 16.67 | 16.59 | 16.86 | 16.83 | 16.73 | 16.55 | 16.66 | 16.86 | 16.63 | 16.52 | NA | NA | |
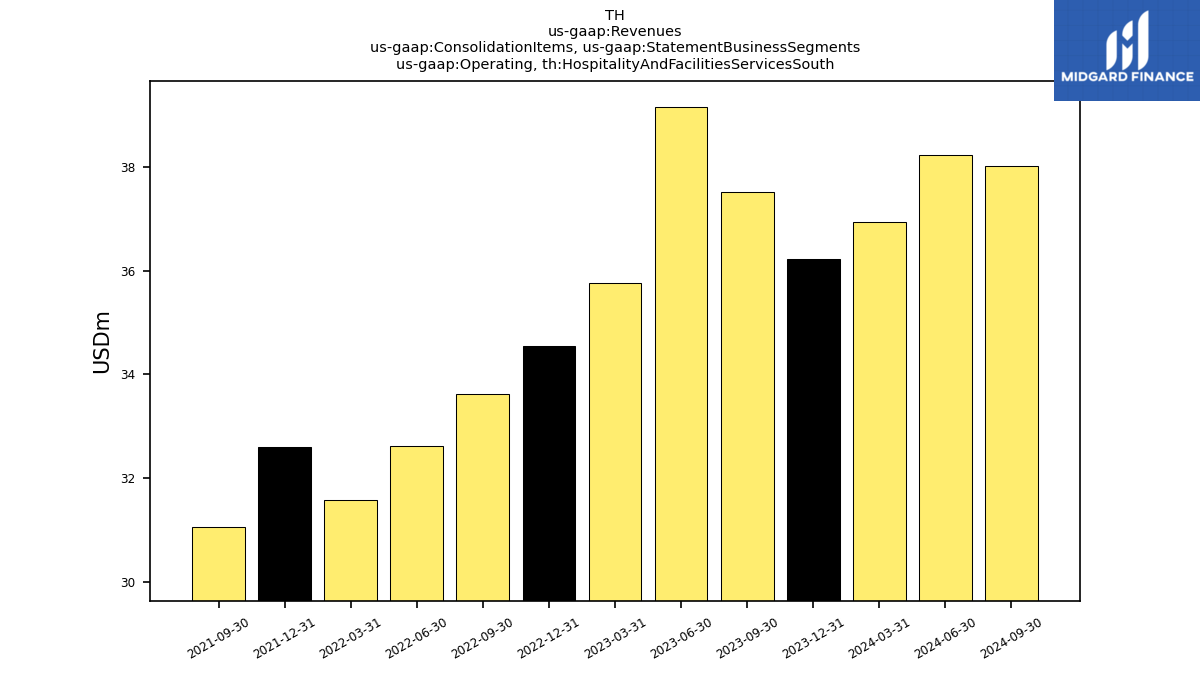
| Operating, Hospitality And Facilities Services South | 36.93 | 36.23 | 37.53 | 39.15 | 35.77 | 34.55 | 33.63 | 32.62 | 31.58 | 32.61 | 31.07 | NA | NA | NA | NA | NA | NA | NA | NA | NA | NA | NA | NA | NA | NA | NA | NA | |
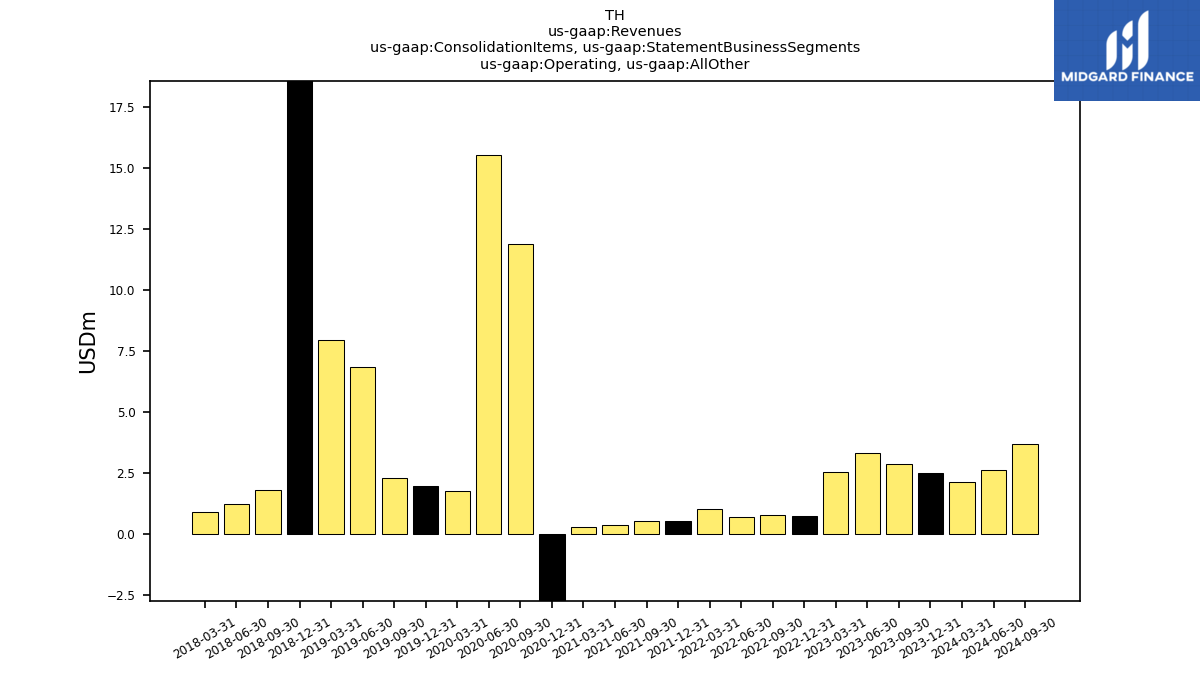
| Operating, All Other | 2.13 | 2.49 | 2.87 | 3.30 | 2.54 | 0.71 | 0.77 | 0.68 | 0.99 | 0.53 | 0.53 | 0.34 | 0.29 | -27.90 | 11.88 | 15.52 | 1.75 | 1.97 | 2.27 | 6.85 | 7.94 | 23.63 | 1.78 | 1.21 | 0.89 | NA | NA | |
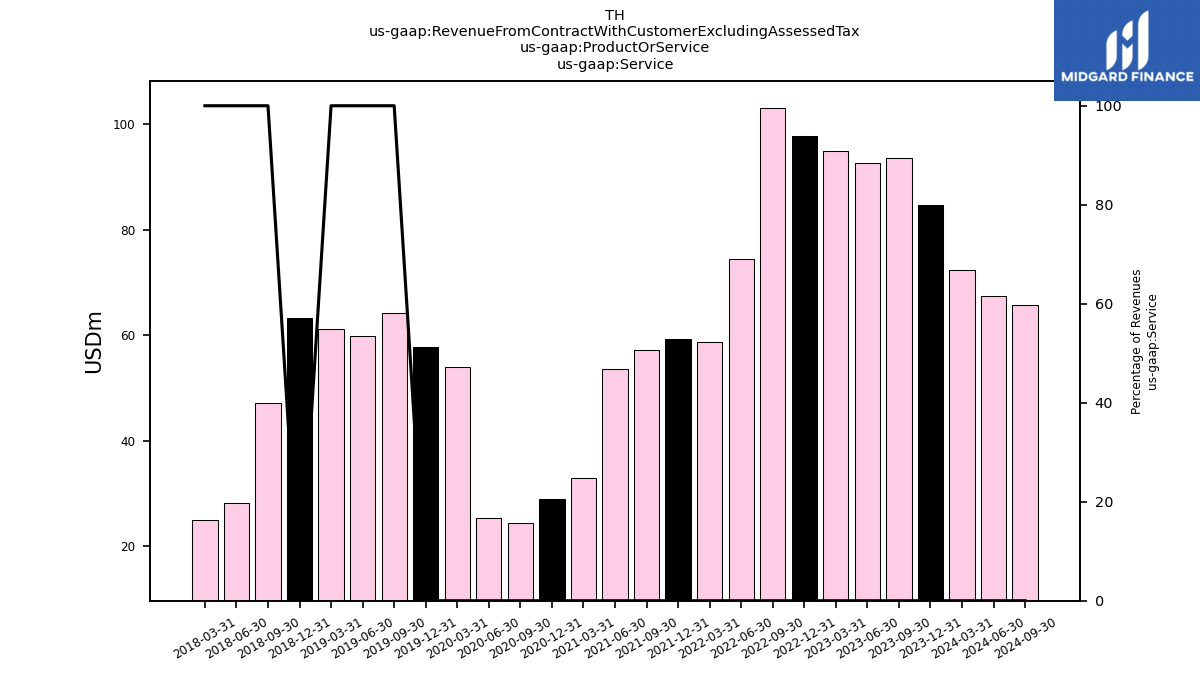
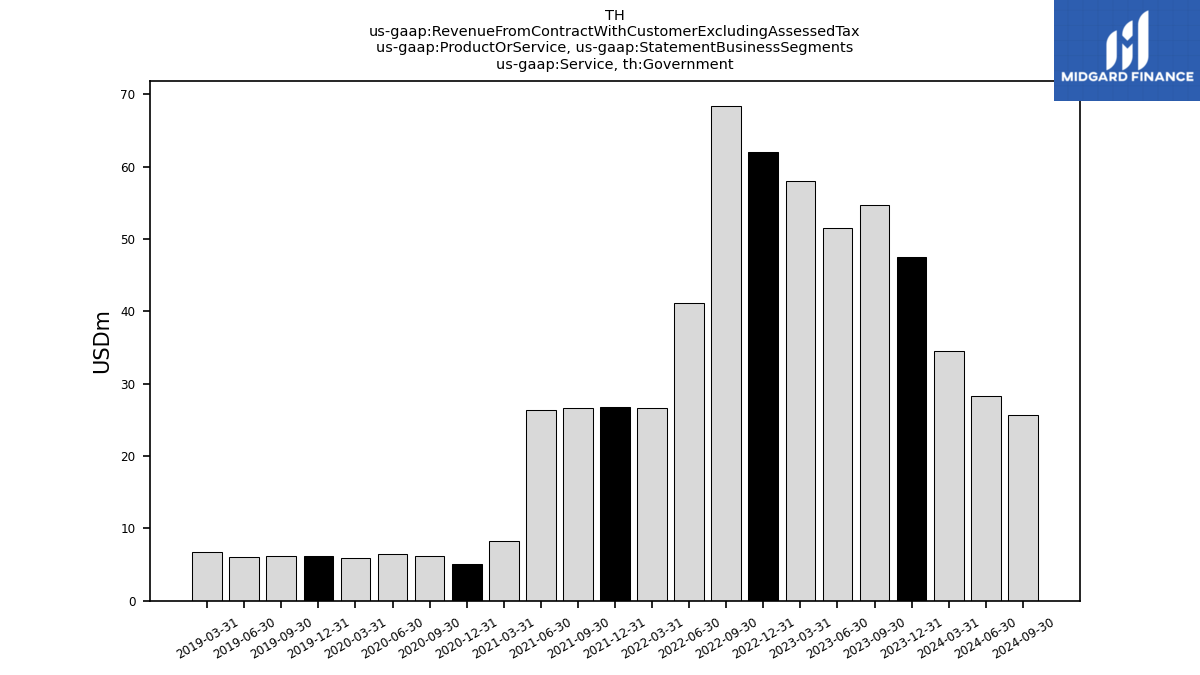
| Revenue From Contract With Customer Excluding Assessed Tax | 72.40 | 84.70 | 93.50 | 92.50 | 94.80 | 97.70 | 103.00 | 74.40 | 58.70 | 59.30 | 67.10 | 54.20 | 33.90 | 51.61 | 35.40 | 40.70 | 55.07 | 76.11 | 67.40 | 66.20 | 68.25 | 96.15 | 0.00 | 0.00 | 38.65 | 0.00 | 0.00 | |
| Service | 72.40 | 84.73 | 93.54 | 92.52 | 94.84 | 97.66 | 103.00 | 74.37 | 58.67 | 59.33 | 57.22 | 53.65 | 32.94 | 28.90 | 24.33 | 25.26 | 53.94 | 57.72 | 64.19 | 59.83 | 61.07 | 63.27 | 47.21 | 28.26 | 24.92 | NA | NA | |
| Service, Government | 34.55 | 47.51 | 54.66 | 51.58 | 58.00 | 62.00 | 68.44 | 41.23 | 26.58 | 26.79 | 26.66 | 26.36 | 8.31 | 5.09 | 6.17 | 6.43 | 5.85 | 6.12 | 6.19 | 6.03 | 6.74 | NA | NA | NA | NA | NA | NA | |
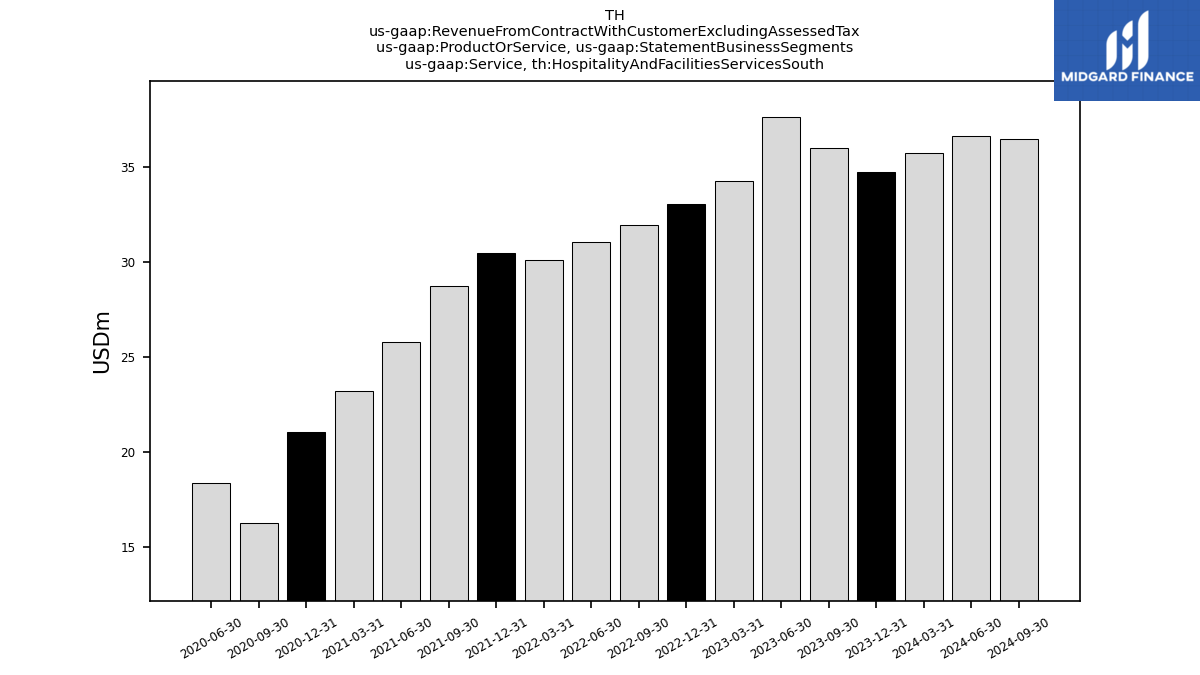
| Service, Hospitality And Facilities Services South | 35.71 | 34.73 | 36.00 | 37.65 | 34.29 | 33.05 | 31.94 | 31.02 | 30.12 | 30.45 | 28.73 | 25.80 | 23.20 | 21.02 | 16.24 | 18.34 | NA | NA | NA | NA | NA | NA | NA | NA | NA | NA | NA | |
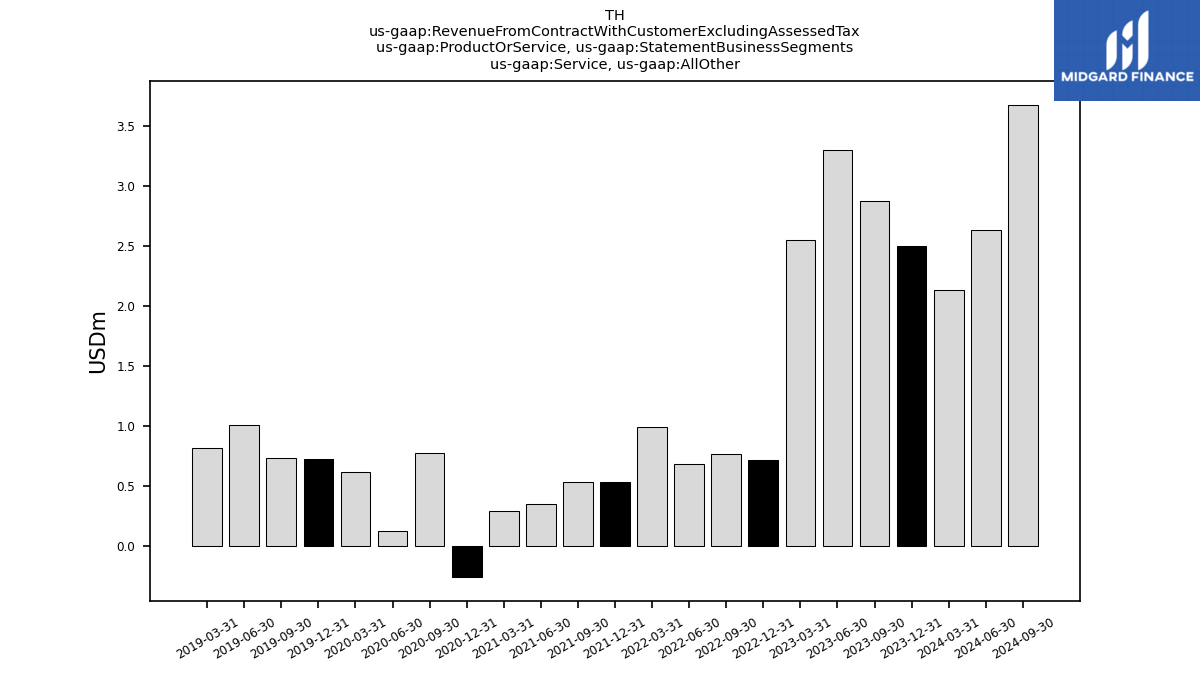
| Service, All Other | 2.13 | 2.49 | 2.87 | 3.30 | 2.54 | 0.71 | 0.76 | 0.68 | 0.99 | 0.53 | 0.53 | 0.34 | 0.29 | -0.26 | 0.77 | 0.12 | 0.61 | 0.72 | 0.73 | 1.01 | 0.81 | NA | NA | NA | NA | NA | NA | |
| Interest Income Operating | 1.21 | 1.18 | 1.01 | 0.65 | 1.30 | 1.40 | 0.15 | NA | NA | NA | NA | NA | NA | NA | NA | NA | NA | NA | NA | NA | NA | NA | NA | NA | NA | NA | NA |
