
| 2023-12-31 | 2023-09-30 | 2023-06-30 | 2023-03-31 | 2022-12-31 | 2022-09-30 | 2022-06-30 | 2022-03-31 | 2021-12-31 | 2021-09-30 | 2021-06-30 | 2021-03-31 | 2020-12-31 | 2020-09-30 | 2020-06-30 | 2020-03-31 | 2019-12-31 | 2019-09-30 | 2019-06-30 | 2019-03-31 | 2018-12-31 | 2018-09-30 | 2018-06-30 | 2018-03-31 | 2017-12-31 | 2017-09-30 | 2017-06-30 | 2017-03-31 | 2016-12-31 | 2016-09-30 | 2016-06-30 | 2016-03-31 | 2015-12-31 | 2015-09-30 | 2015-06-30 | 2015-03-31 | 2014-12-31 | 2014-09-30 | 2014-06-30 | 2014-03-31 | 2013-12-31 | 2013-09-30 | 2013-06-30 | 2013-03-31 | 2012-12-31 | 2012-09-30 | 2012-06-30 | 2012-03-31 | 2011-12-31 | 2011-09-30 | 2011-06-30 | 2011-03-31 | 2011-01-31 | ||
|---|---|---|---|---|---|---|---|---|---|---|---|---|---|---|---|---|---|---|---|---|---|---|---|---|---|---|---|---|---|---|---|---|---|---|---|---|---|---|---|---|---|---|---|---|---|---|---|---|---|---|---|---|---|---|
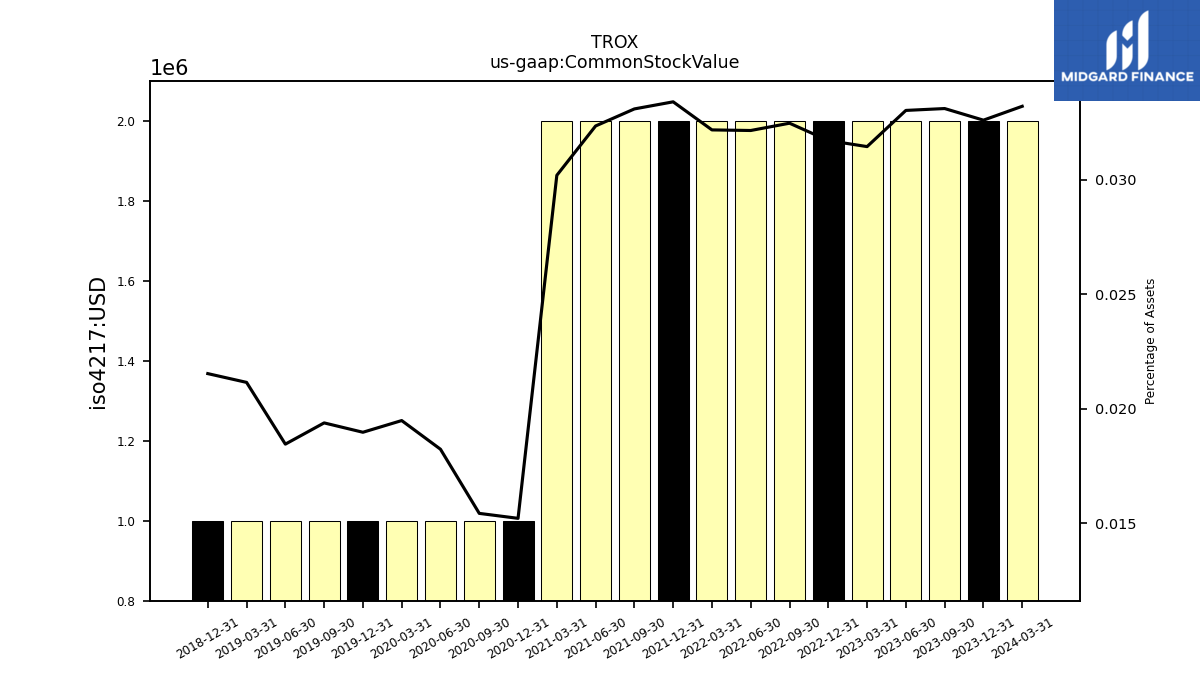
| Common Stock Value | 2.00 | 2.00 | 2.00 | 2.00 | 2.00 | 2.00 | 2.00 | 2.00 | 2.00 | 2.00 | 2.00 | 2.00 | 1.00 | 1.00 | 1.00 | 1.00 | 1.00 | 1.00 | 1.00 | 1.00 | 1.00 | NA | NA | NA | NA | NA | NA | NA | NA | NA | NA | NA | NA | NA | NA | NA | NA | NA | NA | NA | NA | NA | NA | NA | NA | NA | NA | NA | NA | NA | NA | NA | NA | |
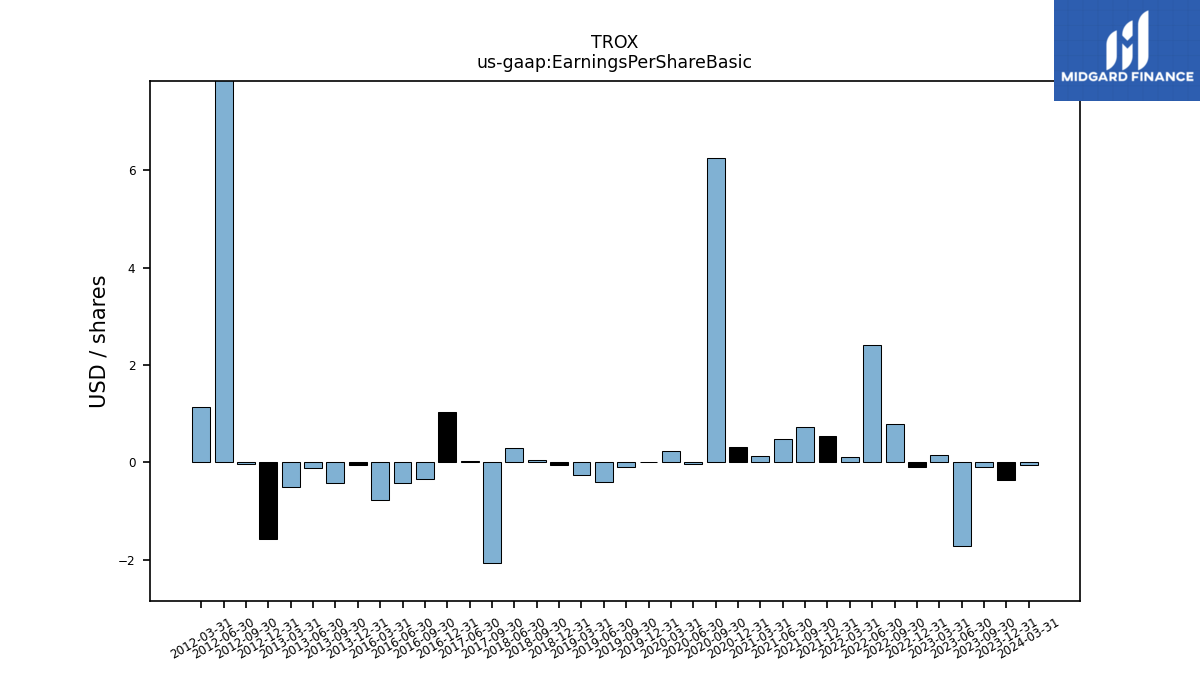
| Earnings Per Share Basic | -0.36 | -0.09 | -1.72 | 0.15 | -0.09 | 0.78 | 2.40 | 0.10 | 0.54 | 0.72 | 0.47 | 0.13 | 0.31 | 6.24 | -0.03 | 0.23 | 0.00 | -0.09 | -0.41 | -0.27 | -0.05 | 0.05 | 0.30 | NA | NA | -2.07 | 0.02 | NA | 1.04 | -0.35 | -0.42 | -0.78 | NA | NA | NA | NA | NA | NA | NA | NA | -0.06 | -0.43 | -0.11 | -0.50 | -1.58 | -0.03 | 13.46 | 1.14 | NA | NA | NA | NA | NA | |
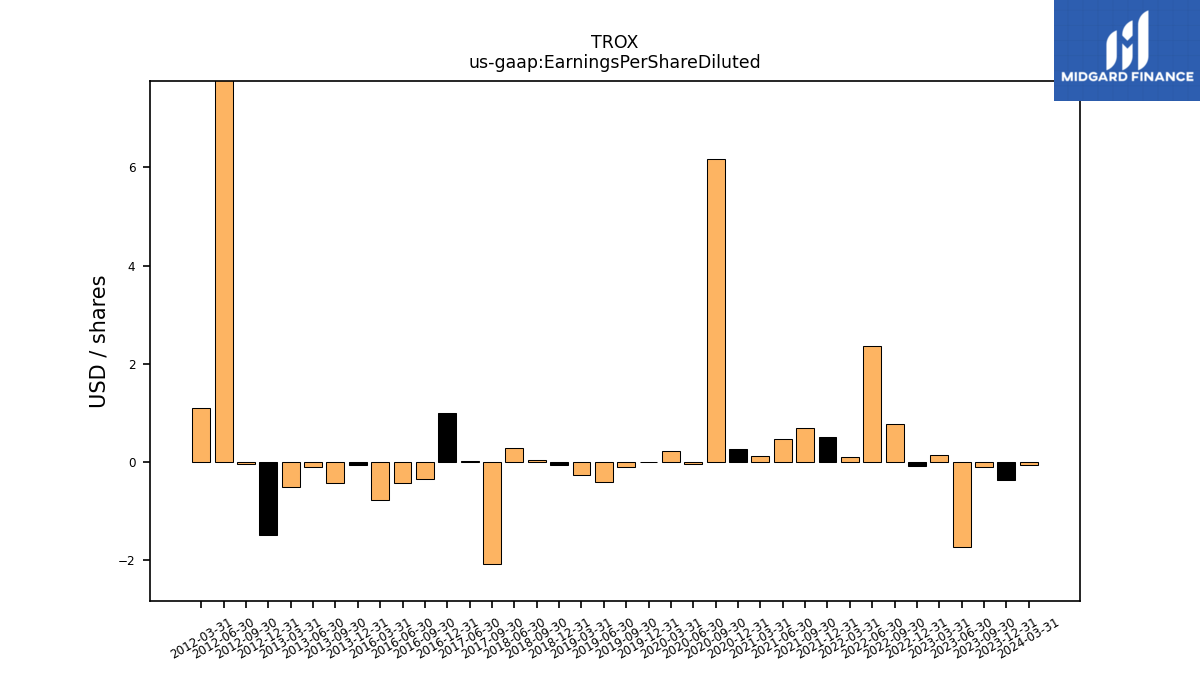
| Earnings Per Share Diluted | -0.36 | -0.09 | -1.72 | 0.15 | -0.07 | 0.77 | 2.37 | 0.10 | 0.52 | 0.70 | 0.46 | 0.12 | 0.27 | 6.18 | -0.03 | 0.22 | 0.00 | -0.09 | -0.41 | -0.27 | -0.05 | 0.05 | 0.29 | NA | NA | -2.07 | 0.02 | NA | 1.00 | -0.35 | -0.42 | -0.78 | NA | NA | NA | NA | NA | NA | NA | NA | -0.06 | -0.43 | -0.11 | -0.50 | -1.49 | -0.03 | 13.00 | 1.10 | NA | NA | NA | NA | NA |
| 2023-12-31 | 2023-09-30 | 2023-06-30 | 2023-03-31 | 2022-12-31 | 2022-09-30 | 2022-06-30 | 2022-03-31 | 2021-12-31 | 2021-09-30 | 2021-06-30 | 2021-03-31 | 2020-12-31 | 2020-09-30 | 2020-06-30 | 2020-03-31 | 2019-12-31 | 2019-09-30 | 2019-06-30 | 2019-03-31 | 2018-12-31 | 2018-09-30 | 2018-06-30 | 2018-03-31 | 2017-12-31 | 2017-09-30 | 2017-06-30 | 2017-03-31 | 2016-12-31 | 2016-09-30 | 2016-06-30 | 2016-03-31 | 2015-12-31 | 2015-09-30 | 2015-06-30 | 2015-03-31 | 2014-12-31 | 2014-09-30 | 2014-06-30 | 2014-03-31 | 2013-12-31 | 2013-09-30 | 2013-06-30 | 2013-03-31 | 2012-12-31 | 2012-09-30 | 2012-06-30 | 2012-03-31 | 2011-12-31 | 2011-09-30 | 2011-06-30 | 2011-03-31 | 2011-01-31 | ||
|---|---|---|---|---|---|---|---|---|---|---|---|---|---|---|---|---|---|---|---|---|---|---|---|---|---|---|---|---|---|---|---|---|---|---|---|---|---|---|---|---|---|---|---|---|---|---|---|---|---|---|---|---|---|---|
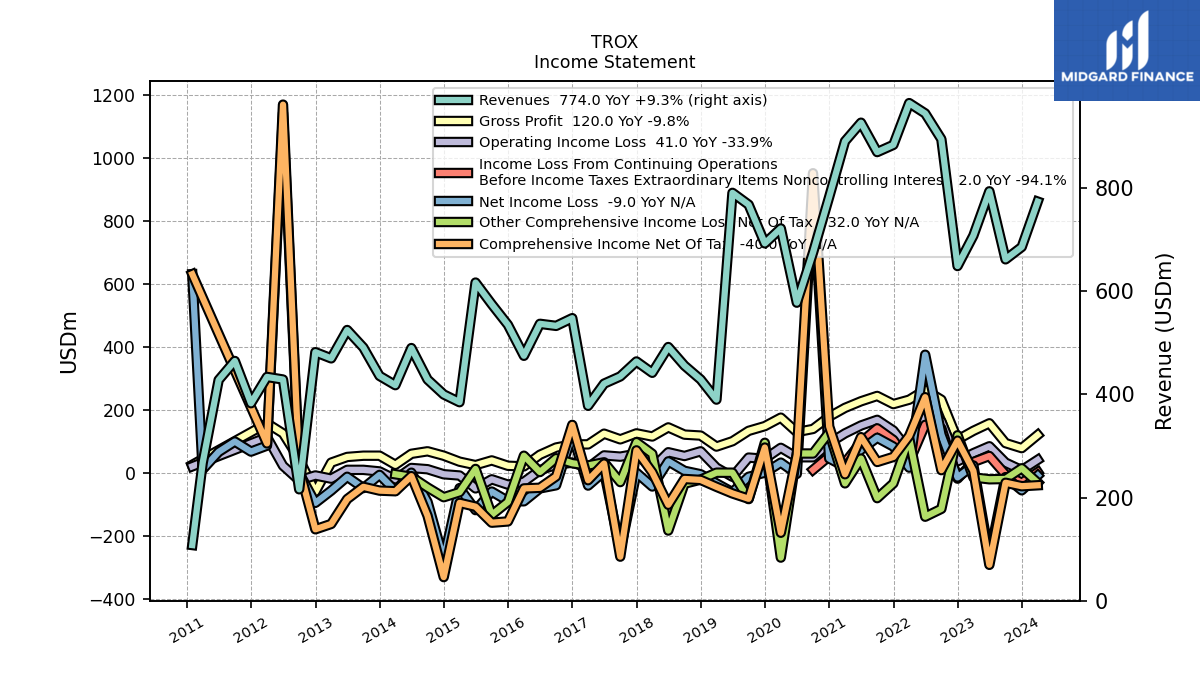
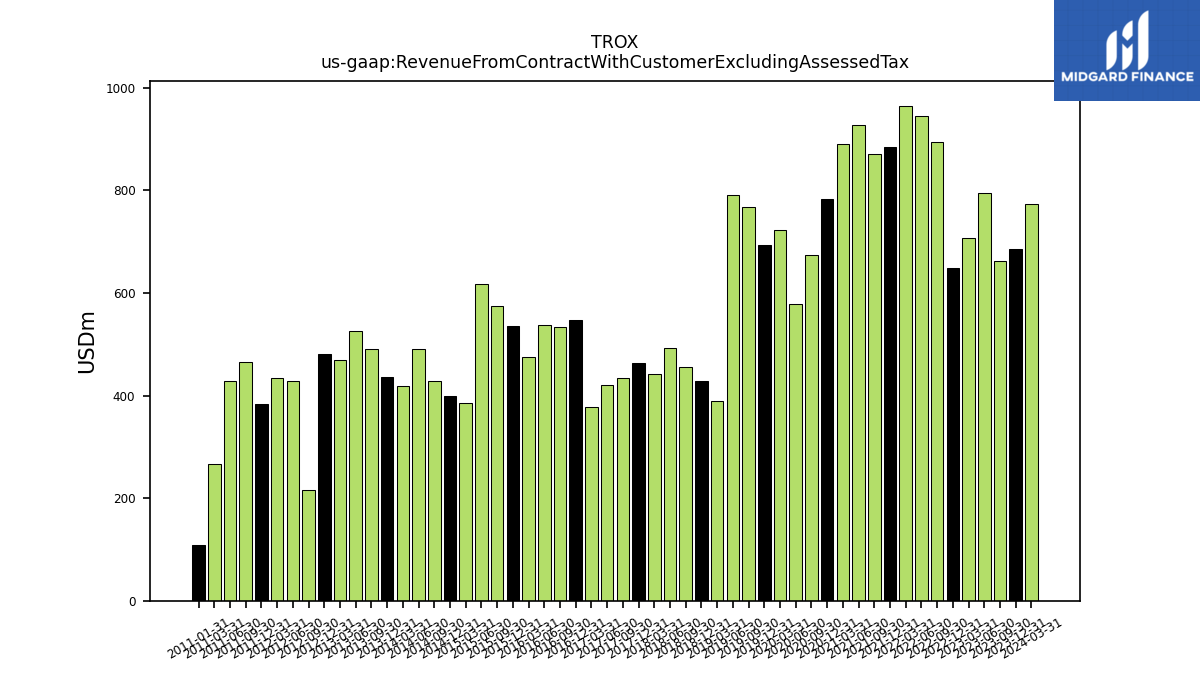
| Revenue From Contract With Customer Excluding Assessed Tax | 686.00 | 662.00 | 794.00 | 708.00 | 649.00 | 895.00 | 945.00 | 965.00 | 884.00 | 870.00 | 927.00 | 891.00 | 783.00 | 675.00 | 578.00 | 722.00 | 693.00 | 768.00 | 791.00 | 390.00 | 429.00 | 456.00 | 492.00 | 442.00 | 464.00 | 435.00 | 421.00 | 378.00 | 548.00 | 533.00 | 537.00 | 475.00 | 535.00 | 575.00 | 617.00 | 385.00 | 400.00 | 429.00 | 490.00 | 418.00 | 436.00 | 491.00 | 525.00 | 470.00 | 482.00 | 216.10 | 429.00 | 434.00 | 383.00 | 465.00 | 428.00 | 267.00 | 108.00 | |
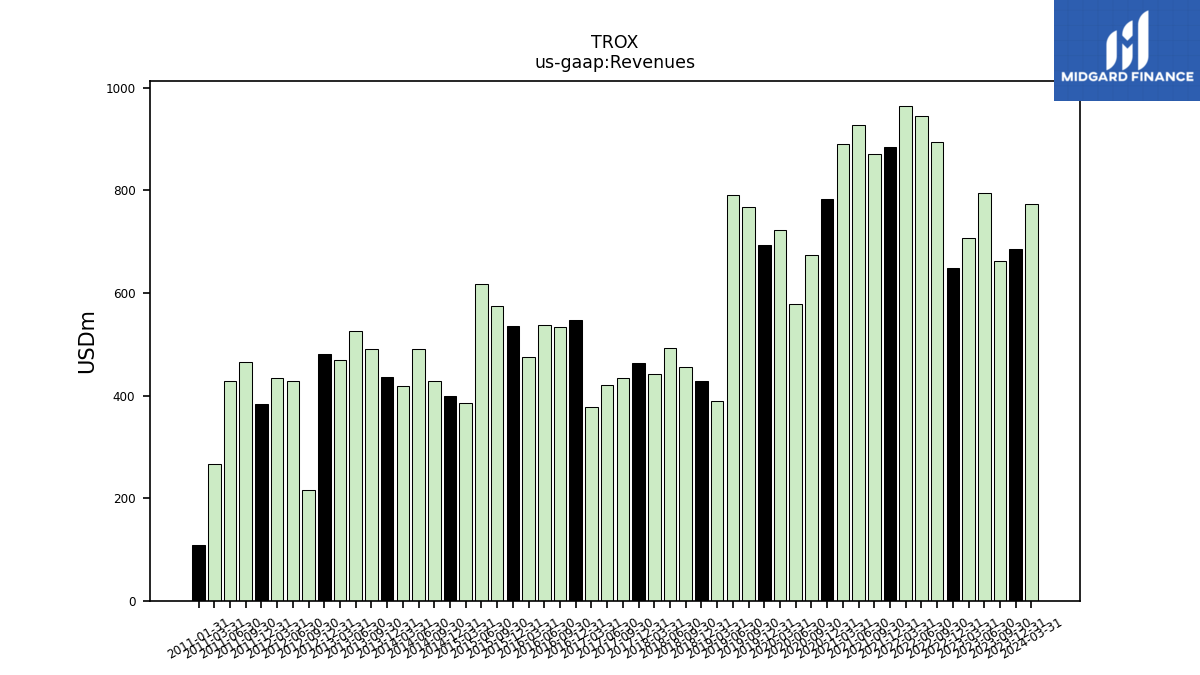
| Revenues | 686.00 | 662.00 | 794.00 | 708.00 | 649.00 | 895.00 | 945.00 | 965.00 | 884.00 | 870.00 | 927.00 | 891.00 | 783.00 | 675.00 | 578.00 | 722.00 | 693.00 | 768.00 | 791.00 | 390.00 | 429.00 | 456.00 | 492.00 | 442.00 | 464.00 | 435.00 | 421.00 | 378.00 | 548.00 | 533.00 | 537.00 | 475.00 | 535.00 | 575.00 | 617.00 | 385.00 | 400.00 | 429.00 | 490.00 | 418.00 | 436.00 | 491.00 | 525.00 | 470.00 | 482.00 | 216.10 | 429.00 | 434.00 | 383.00 | 465.00 | 428.00 | 267.00 | 108.00 | |
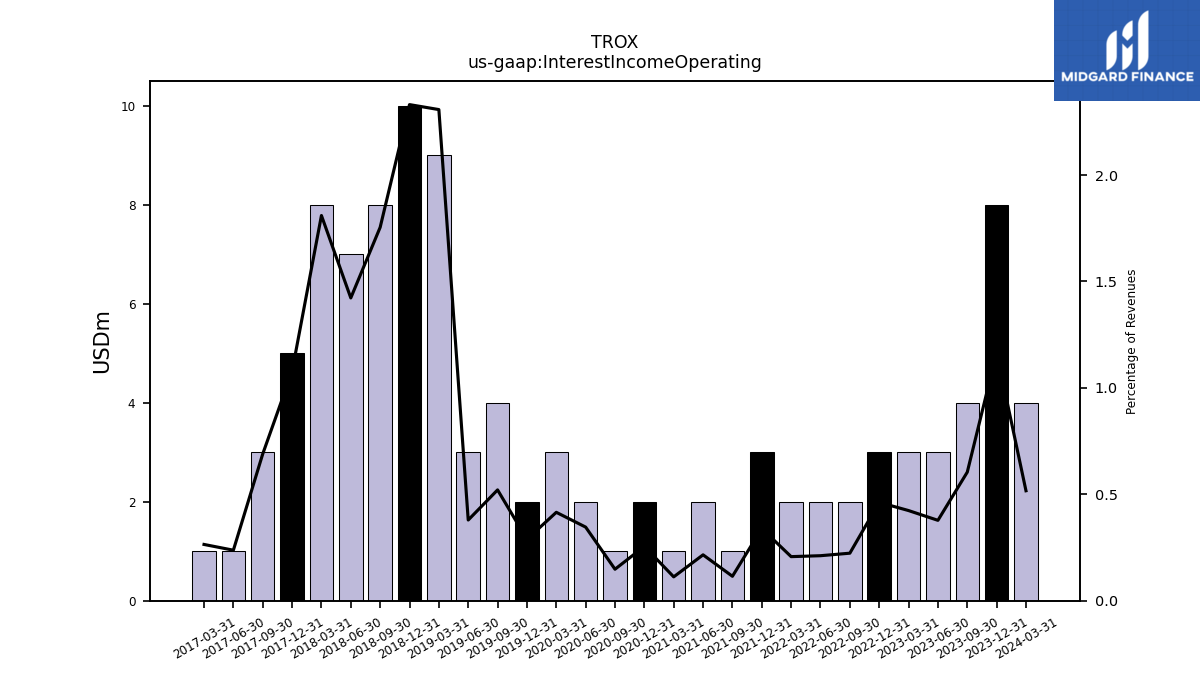
| Interest Income Operating | 8.00 | 4.00 | 3.00 | 3.00 | 3.00 | 2.00 | 2.00 | 2.00 | 3.00 | 1.00 | 2.00 | 1.00 | 2.00 | 1.00 | 2.00 | 3.00 | 2.00 | 4.00 | 3.00 | 9.00 | 10.00 | 8.00 | 7.00 | 8.00 | 5.00 | 3.00 | 1.00 | 1.00 | NA | NA | NA | NA | NA | NA | NA | NA | NA | NA | NA | NA | NA | NA | NA | NA | NA | NA | NA | NA | NA | NA | NA | NA | NA | |
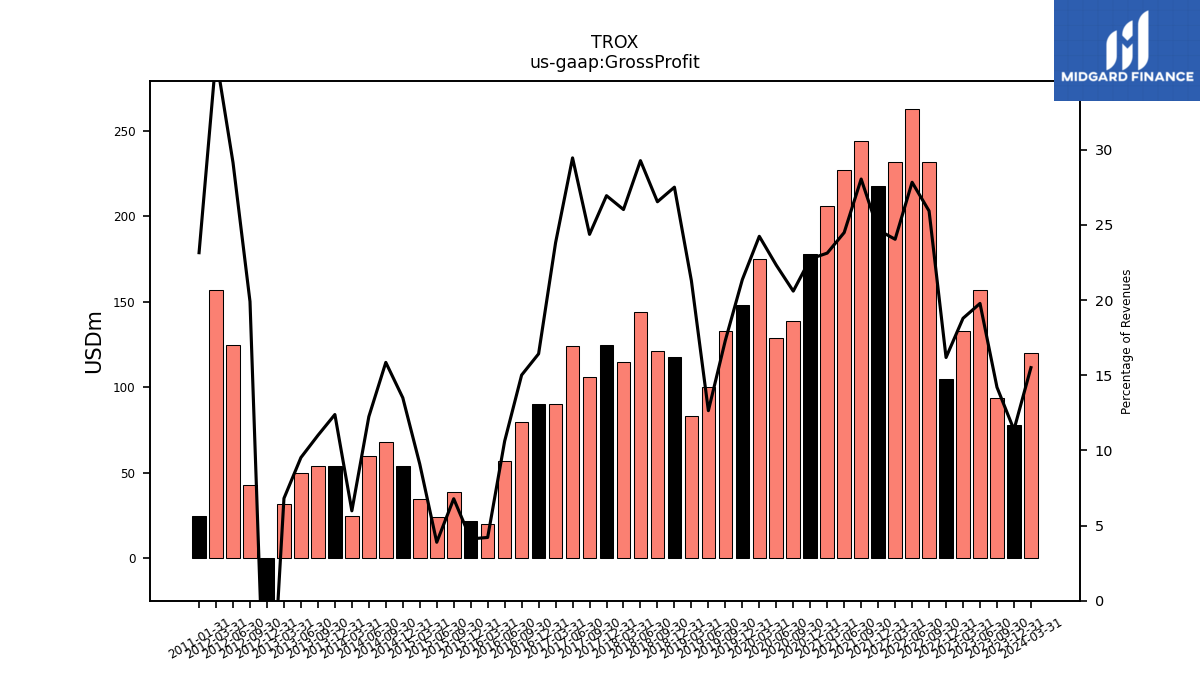
| Gross Profit | 78.00 | 94.00 | 157.00 | 133.00 | 105.00 | 232.00 | 263.00 | 232.00 | 218.00 | 244.00 | 227.00 | 206.00 | 178.00 | 139.00 | 129.00 | 175.00 | 148.00 | 133.00 | 100.00 | 83.00 | 118.00 | 121.00 | 144.00 | 115.00 | 125.00 | 106.00 | 124.00 | 90.00 | 90.00 | 80.00 | 57.00 | 20.00 | 22.00 | 39.00 | 24.00 | 35.00 | 54.00 | 68.00 | 60.00 | 25.00 | 54.00 | 54.00 | 50.00 | 32.00 | -61.00 | 43.00 | 125.00 | 157.00 | NA | NA | NA | NA | 25.00 | |
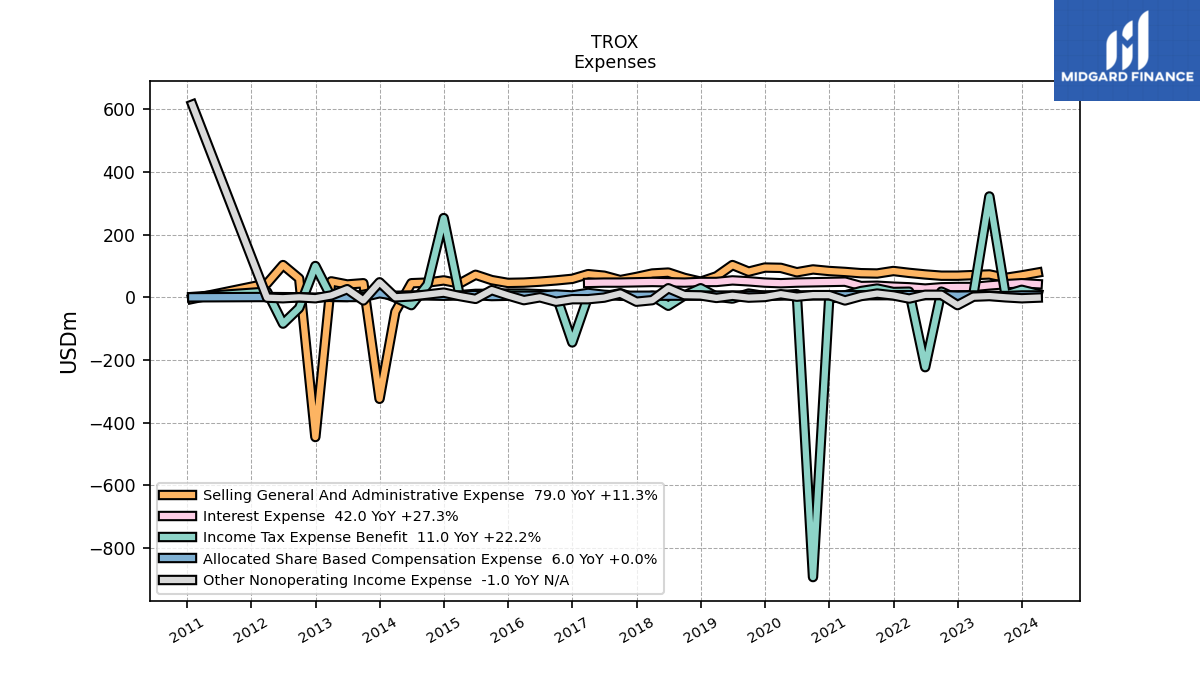
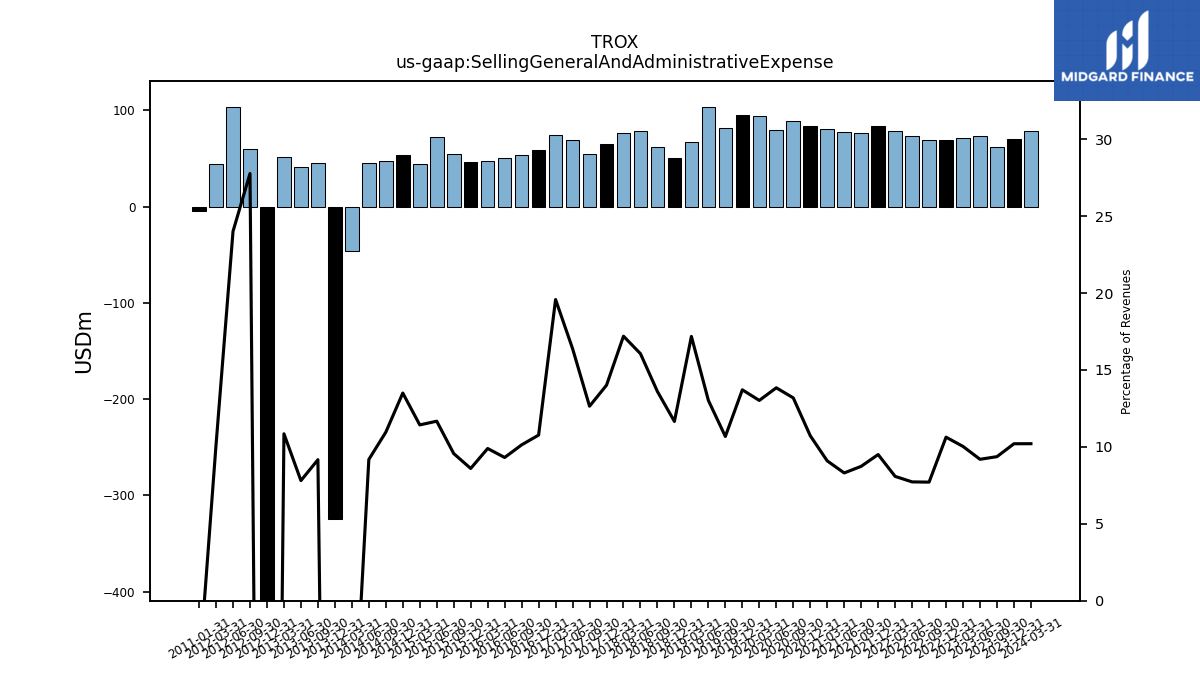
| Selling General And Administrative Expense | 70.00 | 62.00 | 73.00 | 71.00 | 69.00 | 69.00 | 73.00 | 78.00 | 84.00 | 76.00 | 77.00 | 81.00 | 84.00 | 89.00 | 80.00 | 94.00 | 95.00 | 82.00 | 103.00 | 67.00 | 50.00 | 62.00 | 79.00 | 76.00 | 65.00 | 55.00 | 69.00 | 74.00 | 59.00 | 54.00 | 50.00 | 47.00 | 46.00 | 55.00 | 72.00 | 44.00 | 54.00 | 47.00 | 45.00 | -46.00 | -324.00 | 45.00 | 41.00 | 51.00 | -446.00 | 60.00 | 103.00 | 44.00 | NA | NA | NA | NA | -5.00 | |
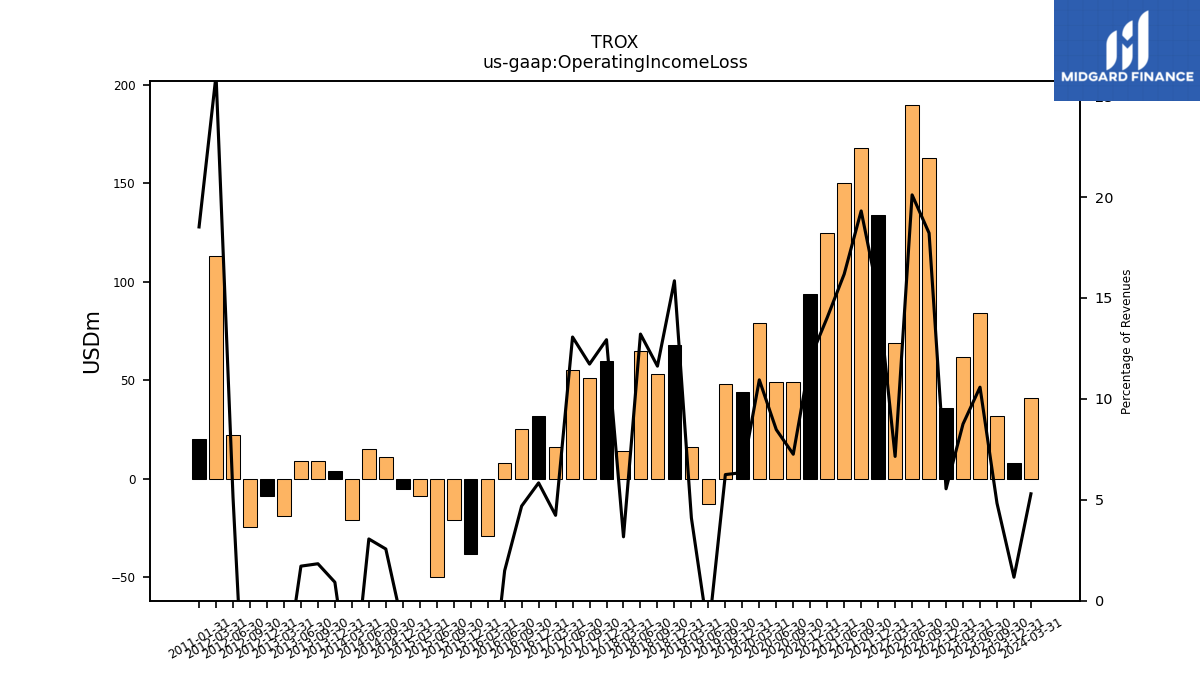
| Operating Income Loss | 8.00 | 32.00 | 84.00 | 62.00 | 36.00 | 163.00 | 190.00 | 69.00 | 134.00 | 168.00 | 150.00 | 125.00 | 94.00 | 49.00 | 49.00 | 79.00 | 44.00 | 48.00 | -13.00 | 16.00 | 68.00 | 53.00 | 65.00 | 14.00 | 60.00 | 51.00 | 55.00 | 16.00 | 32.00 | 25.00 | 8.00 | -29.00 | -38.00 | -21.00 | -50.00 | -9.00 | -5.00 | 11.00 | 15.00 | -21.00 | 4.00 | 9.00 | 9.00 | -19.00 | -8.80 | -24.50 | 22.00 | 113.00 | NA | NA | NA | NA | 20.00 | |
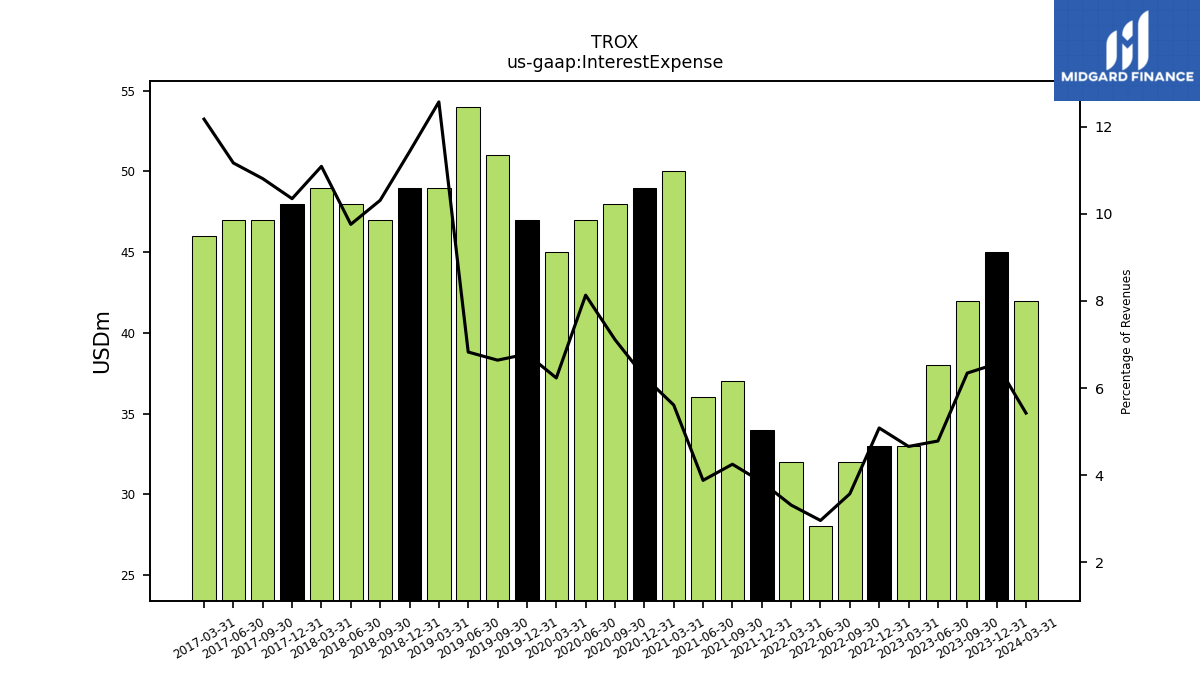
| Interest Expense | 45.00 | 42.00 | 38.00 | 33.00 | 33.00 | 32.00 | 28.00 | 32.00 | 34.00 | 37.00 | 36.00 | 50.00 | 49.00 | 48.00 | 47.00 | 45.00 | 47.00 | 51.00 | 54.00 | 49.00 | 49.00 | 47.00 | 48.00 | 49.00 | 48.00 | 47.00 | 47.00 | 46.00 | NA | NA | NA | NA | NA | NA | NA | NA | NA | NA | NA | NA | NA | NA | NA | NA | NA | NA | NA | NA | NA | NA | NA | NA | NA | |
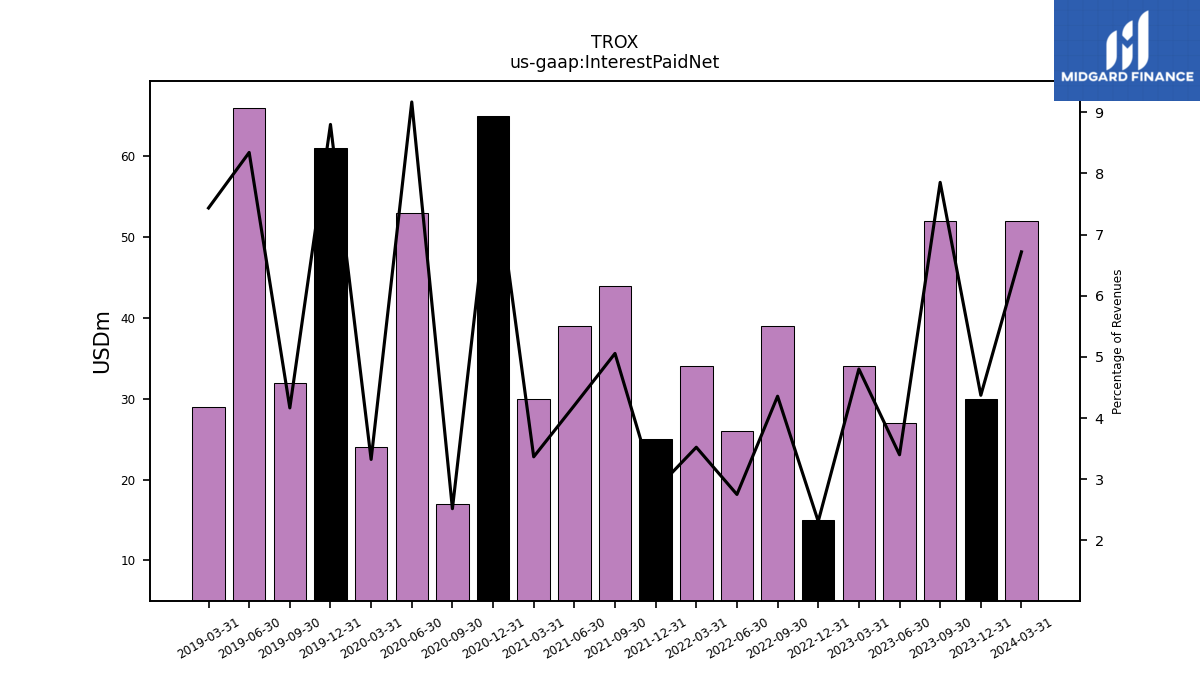
| Interest Paid Net | 30.00 | 52.00 | 27.00 | 34.00 | 15.00 | 39.00 | 26.00 | 34.00 | 25.00 | 44.00 | 39.00 | 30.00 | 65.00 | 17.00 | 53.00 | 24.00 | 61.00 | 32.00 | 66.00 | 29.00 | NA | NA | NA | NA | NA | NA | NA | NA | NA | NA | NA | NA | NA | NA | NA | NA | NA | NA | NA | NA | NA | NA | NA | NA | NA | NA | NA | NA | NA | NA | NA | NA | NA | |
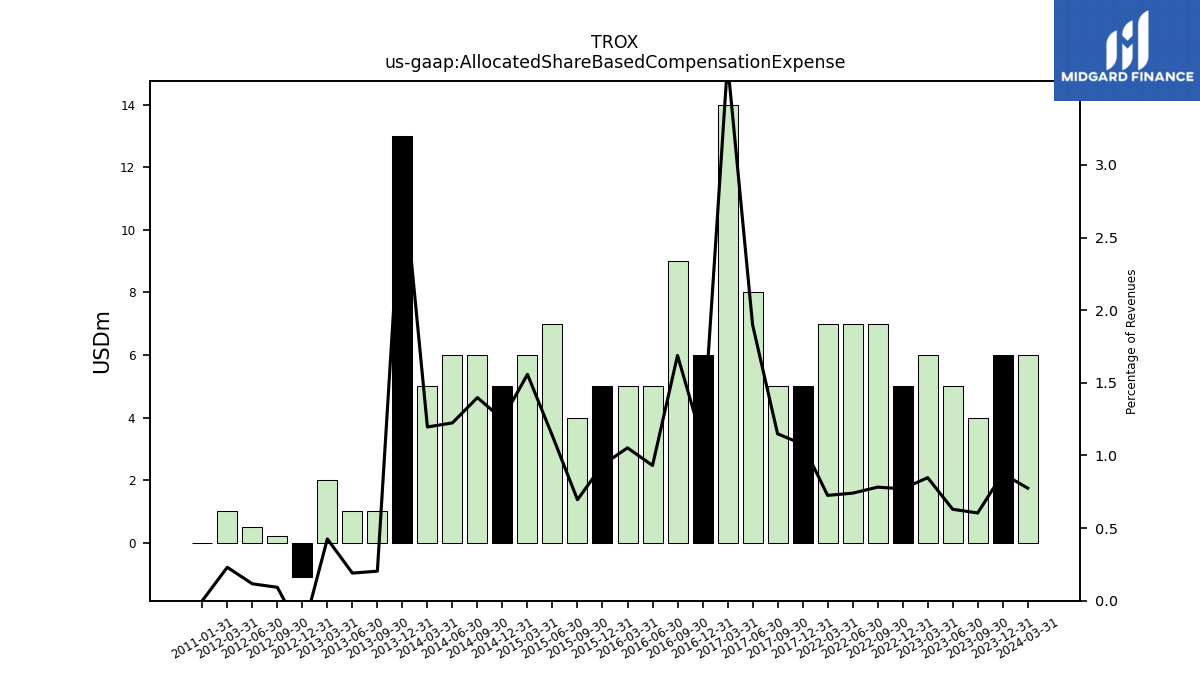
| Allocated Share Based Compensation Expense | 6.00 | 4.00 | 5.00 | 6.00 | 5.00 | 7.00 | 7.00 | 7.00 | NA | NA | NA | NA | NA | NA | NA | NA | NA | NA | NA | NA | NA | NA | NA | NA | 5.00 | 5.00 | 8.00 | 14.00 | 6.00 | 9.00 | 5.00 | 5.00 | 5.00 | 4.00 | 7.00 | 6.00 | 5.00 | 6.00 | 6.00 | 5.00 | 13.00 | 1.00 | 1.00 | 2.00 | -1.10 | 0.20 | 0.50 | 1.00 | NA | NA | NA | NA | 0.00 | |
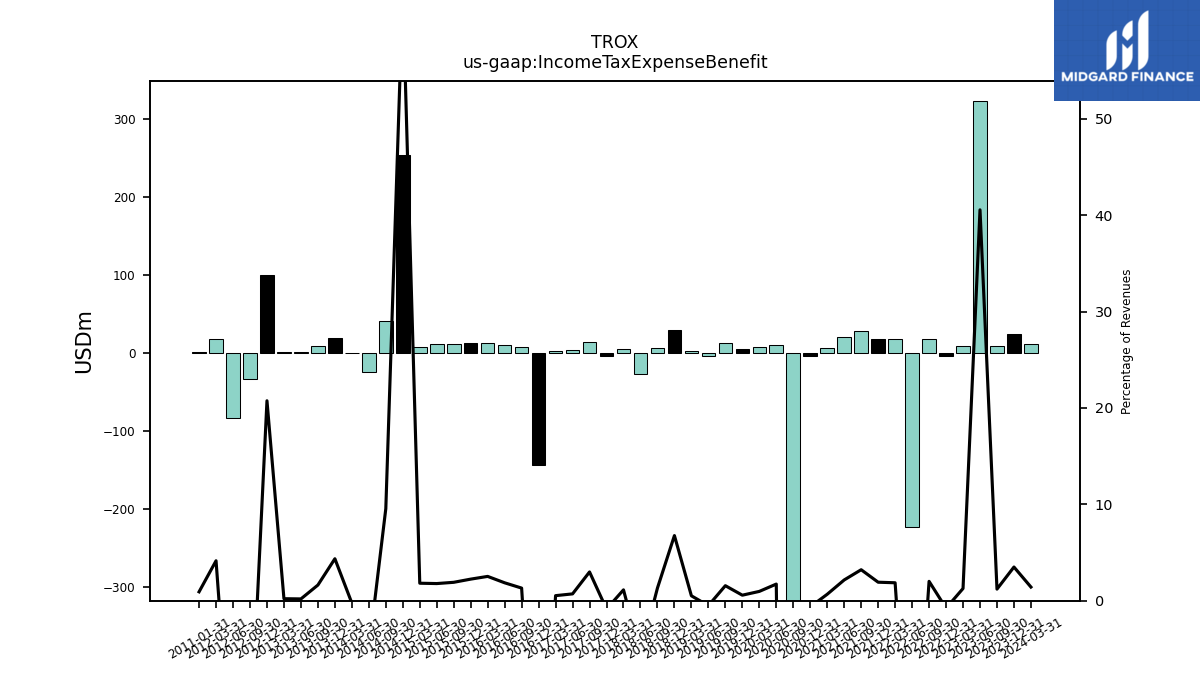
| Income Tax Expense Benefit | 24.00 | 8.00 | 322.00 | 9.00 | -5.00 | 18.00 | -223.00 | 18.00 | 17.00 | 28.00 | 20.00 | 6.00 | -5.00 | -893.00 | 10.00 | 7.00 | 4.00 | 12.00 | -4.00 | 2.00 | 29.00 | 6.00 | -27.00 | 5.00 | -4.00 | 13.00 | 3.00 | 2.00 | -144.00 | 7.00 | 10.00 | 12.00 | 12.00 | 11.00 | 11.00 | 7.00 | 253.00 | 41.00 | -25.00 | -1.00 | 19.00 | 8.00 | 1.00 | 1.00 | 100.00 | -34.00 | -84.00 | 18.00 | NA | NA | NA | NA | 1.00 | |
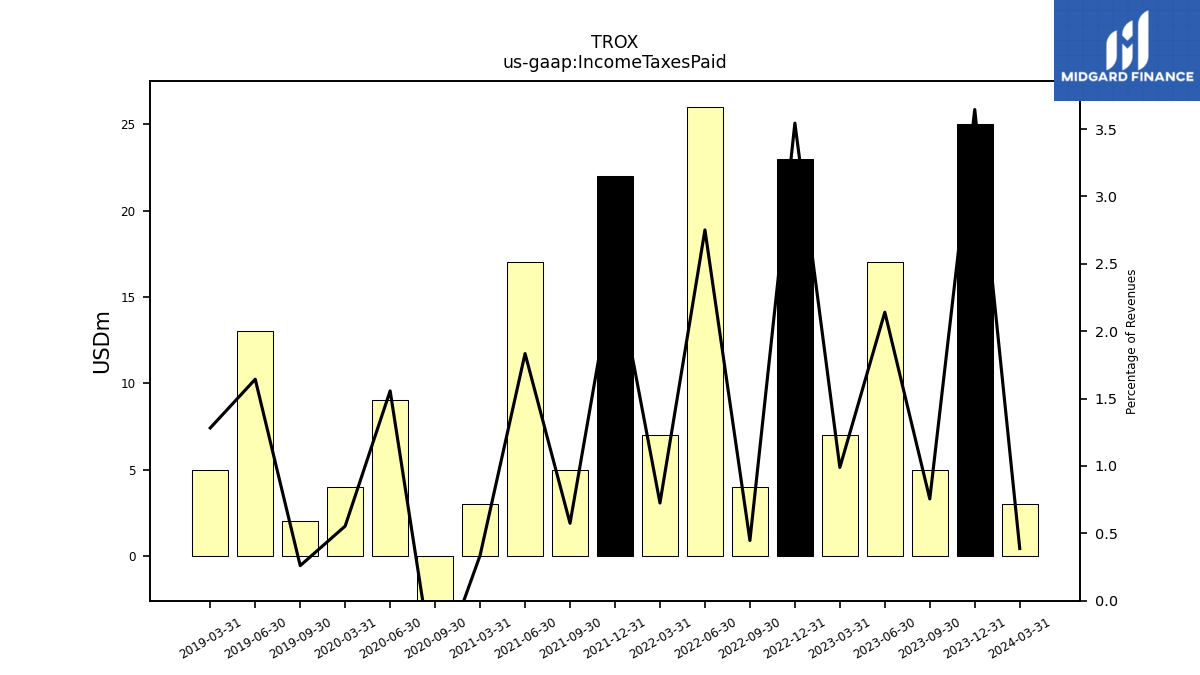
| Income Taxes Paid | 25.00 | 5.00 | 17.00 | 7.00 | 23.00 | 4.00 | 26.00 | 7.00 | 22.00 | 5.00 | 17.00 | 3.00 | NA | -4.00 | 9.00 | 4.00 | NA | 2.00 | 13.00 | 5.00 | NA | NA | NA | NA | NA | NA | NA | NA | NA | NA | NA | NA | NA | NA | NA | NA | NA | NA | NA | NA | NA | NA | NA | NA | NA | NA | NA | NA | NA | NA | NA | NA | NA | |
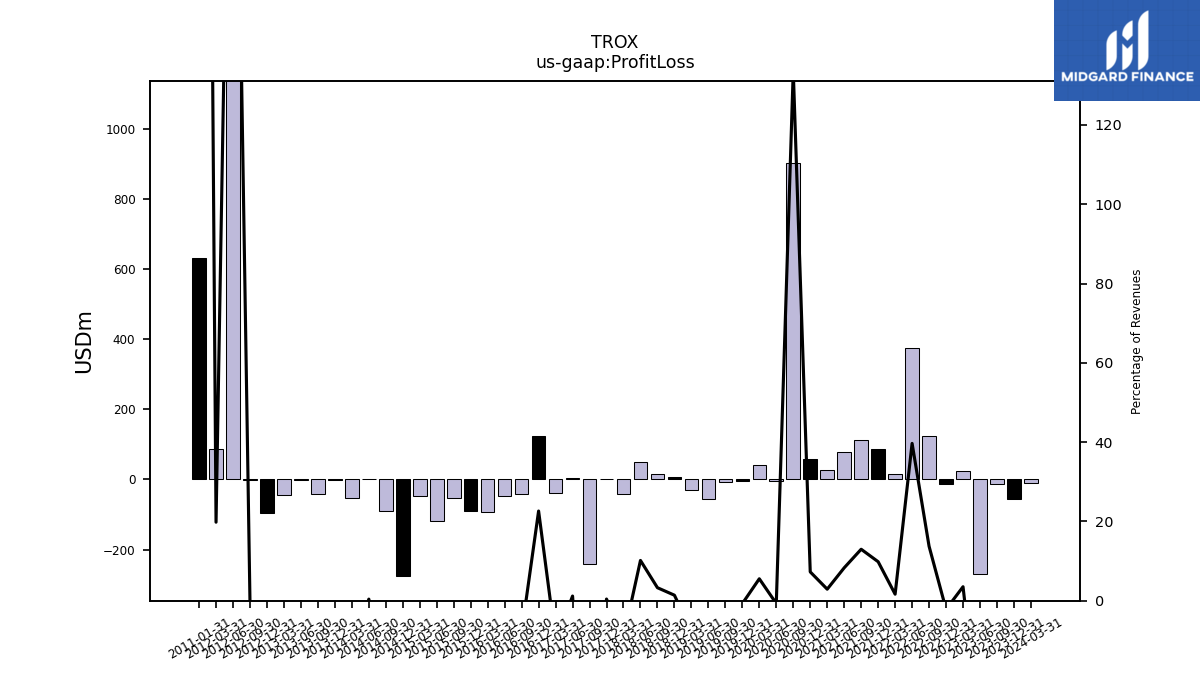
| Profit Loss | -56.00 | -14.00 | -269.00 | 25.00 | -14.00 | 123.00 | 375.00 | 16.00 | 87.00 | 113.00 | 77.00 | 26.00 | 57.00 | 902.00 | -4.00 | 40.00 | -5.00 | -6.00 | -56.00 | -30.00 | 6.00 | 15.00 | 50.00 | -41.00 | 2.00 | -241.00 | 5.00 | -38.00 | 124.00 | -42.00 | -48.00 | -92.00 | -89.00 | -54.00 | -118.00 | -46.00 | -275.00 | -90.00 | 2.00 | -54.00 | -3.00 | -41.00 | -1.00 | -45.00 | -96.00 | -1.00 | 1144.00 | 86.00 | NA | NA | NA | NA | 631.00 | |
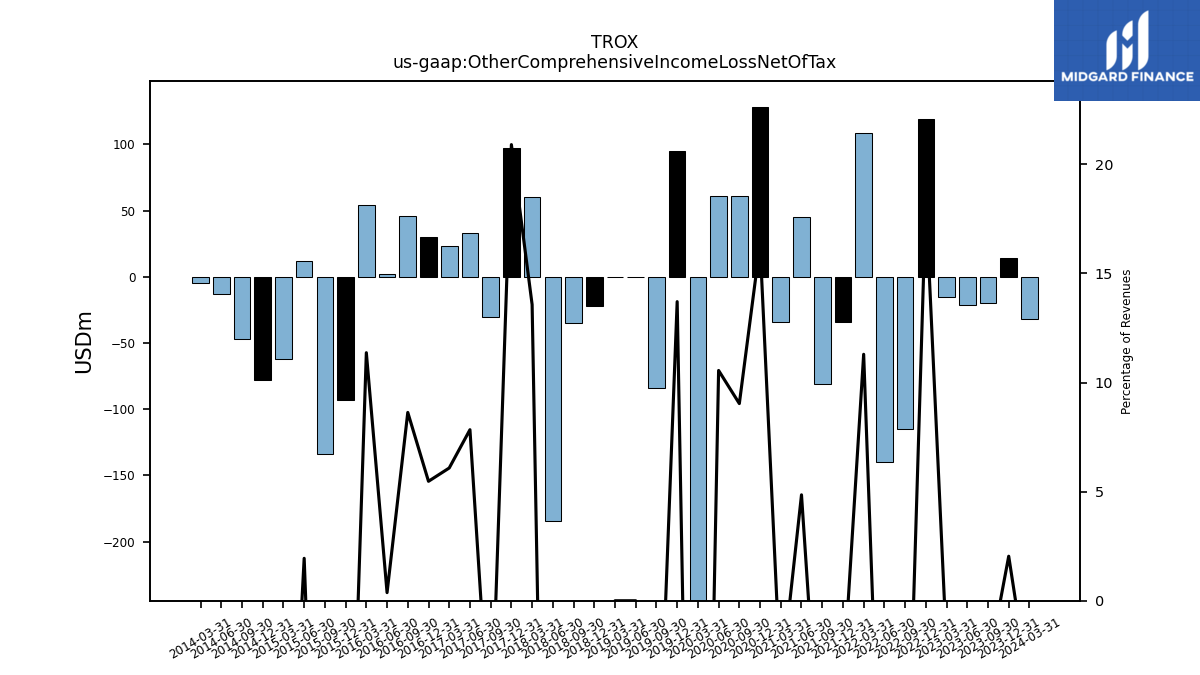
| Other Comprehensive Income Loss Net Of Tax | 14.00 | -20.00 | -21.00 | -15.00 | 119.00 | -115.00 | -140.00 | 109.00 | -34.00 | -81.00 | 45.00 | -34.00 | 128.00 | 61.00 | 61.00 | -270.00 | 95.00 | -84.00 | 0.00 | 0.00 | -22.00 | -35.00 | -184.00 | 60.00 | 97.00 | -30.00 | 33.00 | 23.00 | 30.00 | 46.00 | 2.00 | 54.00 | -93.00 | -134.00 | 12.00 | -62.00 | -78.00 | -47.00 | -13.00 | -5.00 | NA | NA | NA | NA | NA | NA | NA | NA | NA | NA | NA | NA | NA | |
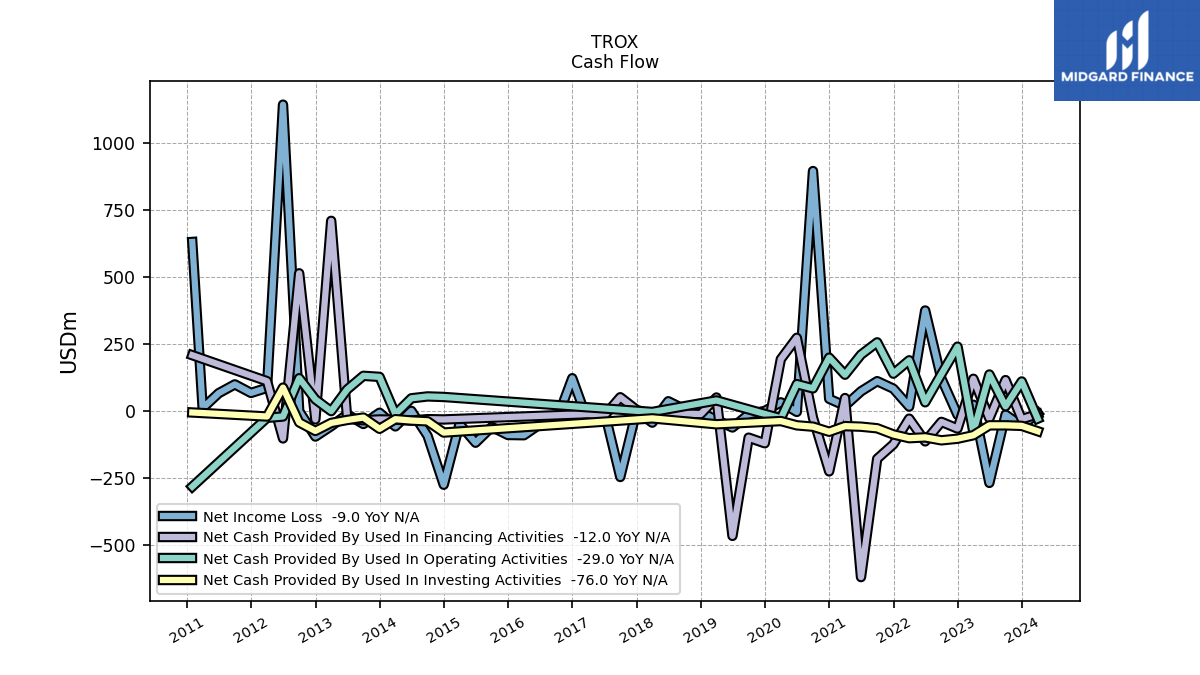
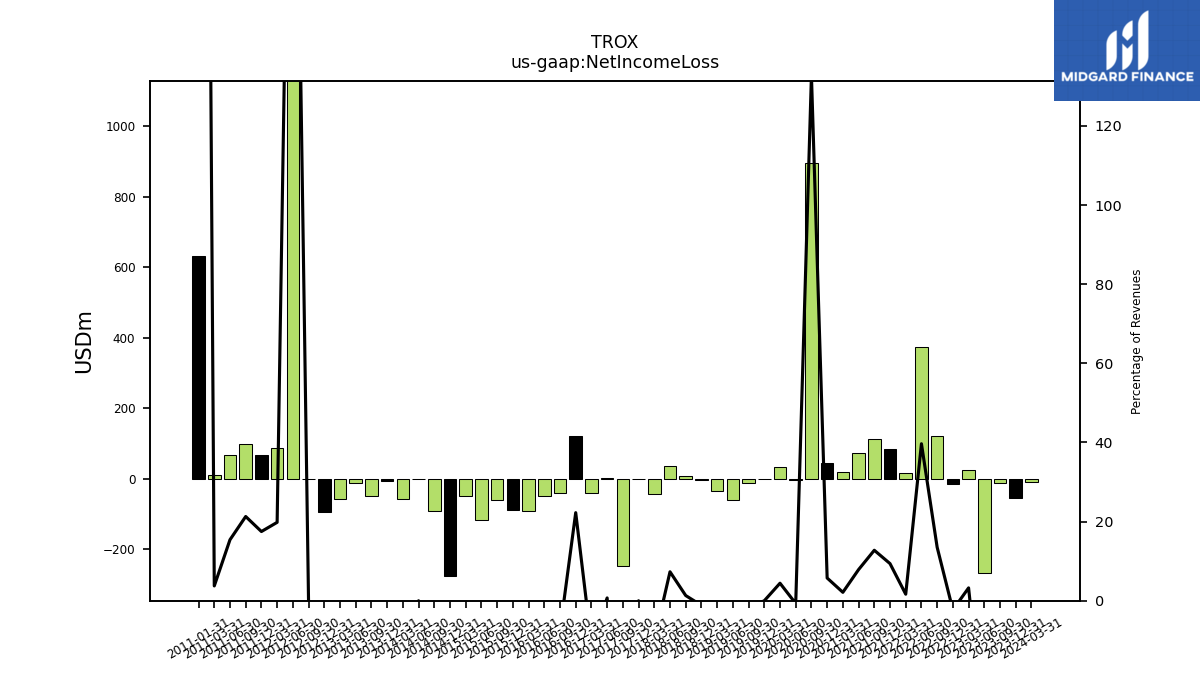
| Net Income Loss | -56.00 | -14.00 | -269.00 | 23.00 | -15.00 | 121.00 | 375.00 | 16.00 | 83.00 | 111.00 | 73.00 | 19.00 | 45.00 | 896.00 | -4.00 | 32.00 | 0.00 | -13.00 | -62.00 | -34.00 | -5.00 | 6.00 | 36.00 | -44.00 | 0.00 | -247.00 | 3.00 | -41.00 | 122.00 | -40.00 | -50.00 | -91.00 | -90.00 | -60.00 | -119.00 | -49.00 | -276.00 | -93.00 | 0.00 | -58.00 | -7.00 | -49.00 | -13.00 | -57.00 | -96.00 | -1.00 | 1144.00 | 86.00 | 67.00 | 99.00 | 66.00 | 10.00 | 631.00 | |
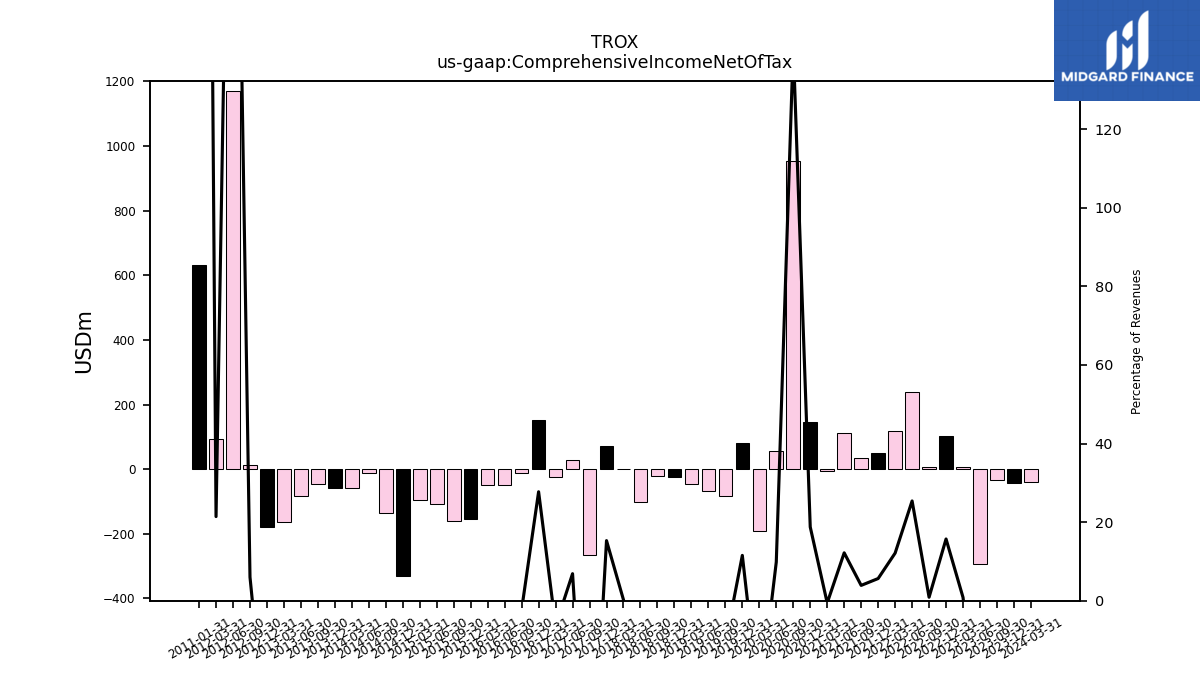
| Comprehensive Income Net Of Tax | -43.00 | -32.00 | -293.00 | 6.00 | 102.00 | 8.00 | 240.00 | 117.00 | 50.00 | 34.00 | 113.00 | -5.00 | 147.00 | 952.00 | 57.00 | -191.00 | 80.00 | -83.00 | -66.00 | -45.00 | -23.00 | -20.00 | -102.00 | 1.00 | 71.00 | -267.00 | 29.00 | -24.00 | 152.00 | -12.00 | -48.00 | -50.00 | -155.00 | -159.00 | -108.00 | -96.00 | -332.00 | -137.00 | -11.00 | -59.00 | -57.00 | -45.00 | -84.00 | -163.00 | -180.00 | 13.00 | 1170.00 | 93.00 | NA | NA | NA | NA | 631.00 | |
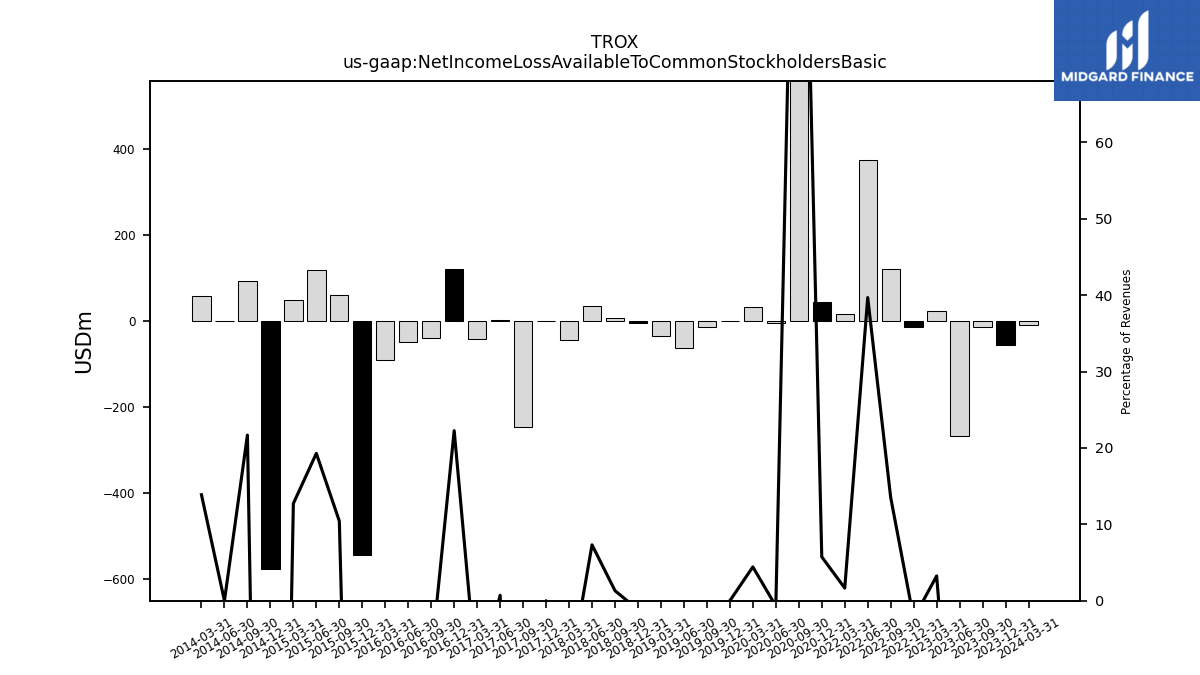
| Net Income Loss Available To Common Stockholders Basic | -56.00 | -14.00 | -269.00 | 23.00 | -15.00 | 121.00 | 375.00 | 16.00 | NA | NA | NA | NA | 45.00 | 896.00 | -4.00 | 32.00 | 0.00 | -13.00 | -62.00 | -34.00 | -5.00 | 6.00 | 36.00 | -44.00 | 0.00 | -247.00 | 3.00 | -41.00 | 122.00 | -40.00 | -50.00 | -91.00 | -546.00 | 60.00 | 119.00 | 49.00 | -578.00 | 93.00 | 0.00 | 58.00 | NA | NA | NA | NA | NA | NA | NA | NA | NA | NA | NA | NA | NA |
| 2023-12-31 | 2023-09-30 | 2023-06-30 | 2023-03-31 | 2022-12-31 | 2022-09-30 | 2022-06-30 | 2022-03-31 | 2021-12-31 | 2021-09-30 | 2021-06-30 | 2021-03-31 | 2020-12-31 | 2020-09-30 | 2020-06-30 | 2020-03-31 | 2019-12-31 | 2019-09-30 | 2019-06-30 | 2019-03-31 | 2018-12-31 | 2018-09-30 | 2018-06-30 | 2018-03-31 | 2017-12-31 | 2017-09-30 | 2017-06-30 | 2017-03-31 | 2016-12-31 | 2016-09-30 | 2016-06-30 | 2016-03-31 | 2015-12-31 | 2015-09-30 | 2015-06-30 | 2015-03-31 | 2014-12-31 | 2014-09-30 | 2014-06-30 | 2014-03-31 | 2013-12-31 | 2013-09-30 | 2013-06-30 | 2013-03-31 | 2012-12-31 | 2012-09-30 | 2012-06-30 | 2012-03-31 | 2011-12-31 | 2011-09-30 | 2011-06-30 | 2011-03-31 | 2011-01-31 | ||
|---|---|---|---|---|---|---|---|---|---|---|---|---|---|---|---|---|---|---|---|---|---|---|---|---|---|---|---|---|---|---|---|---|---|---|---|---|---|---|---|---|---|---|---|---|---|---|---|---|---|---|---|---|---|---|
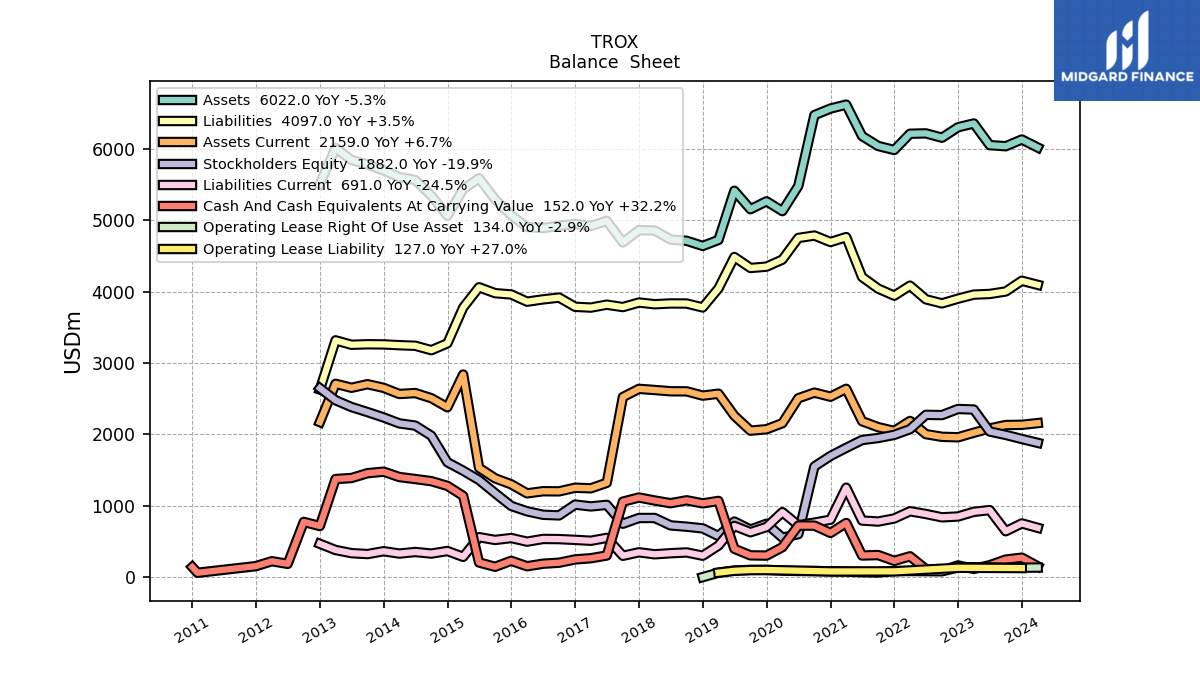
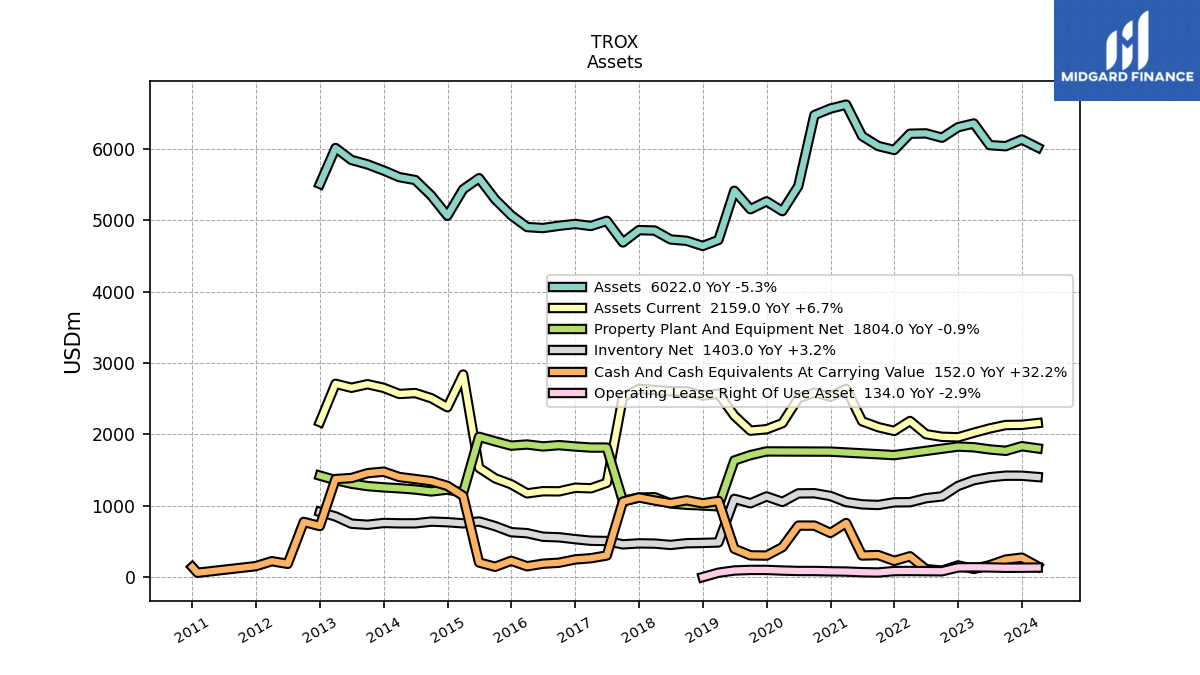
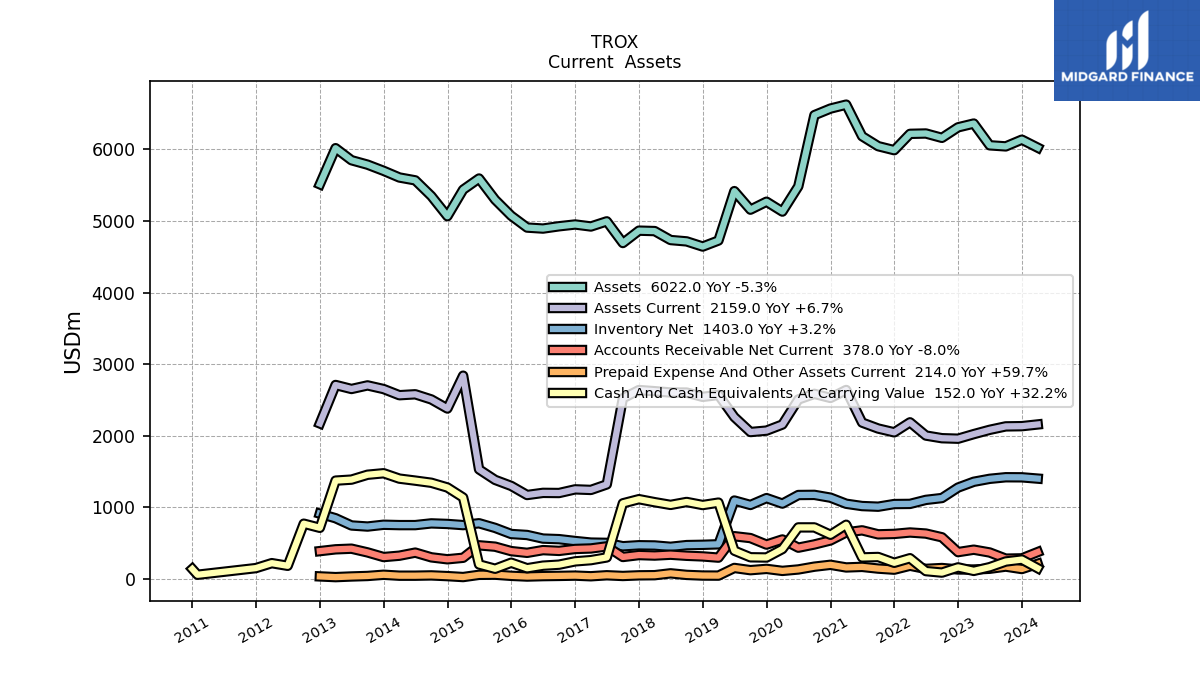
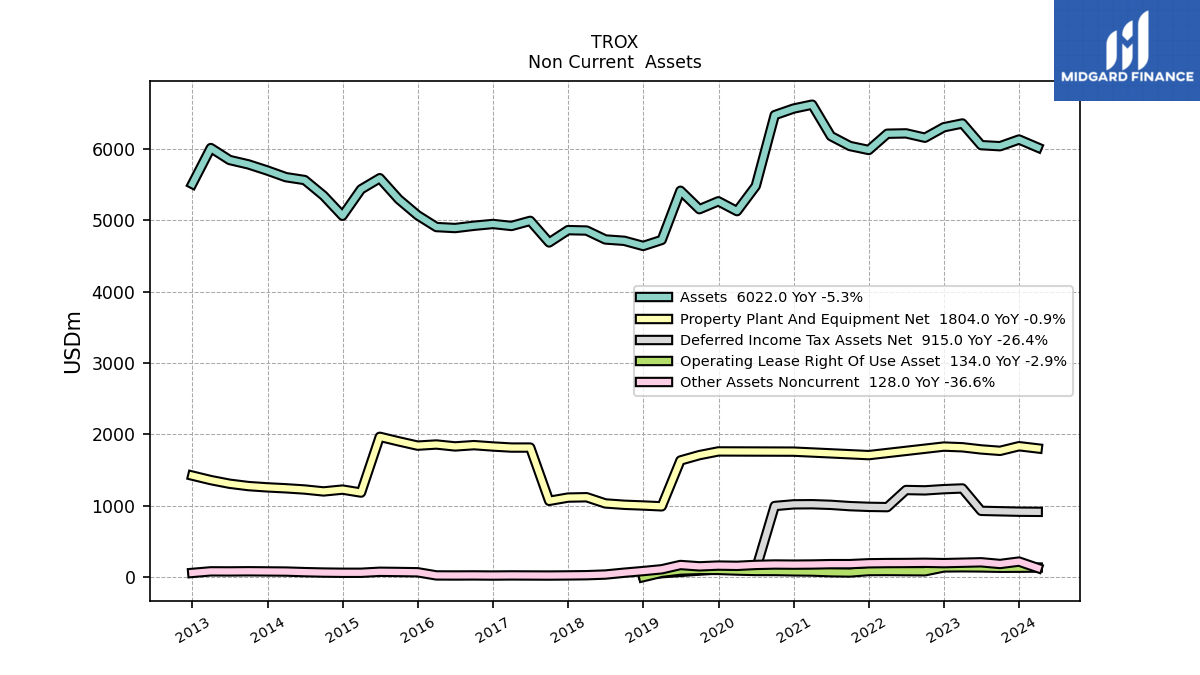
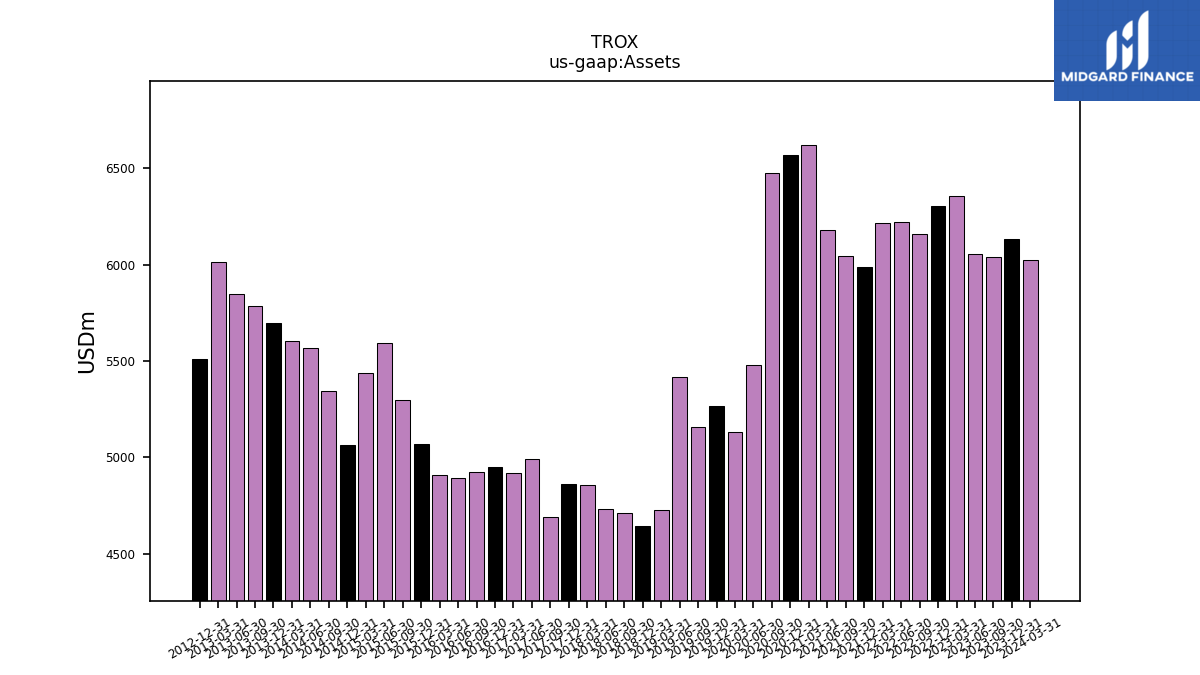
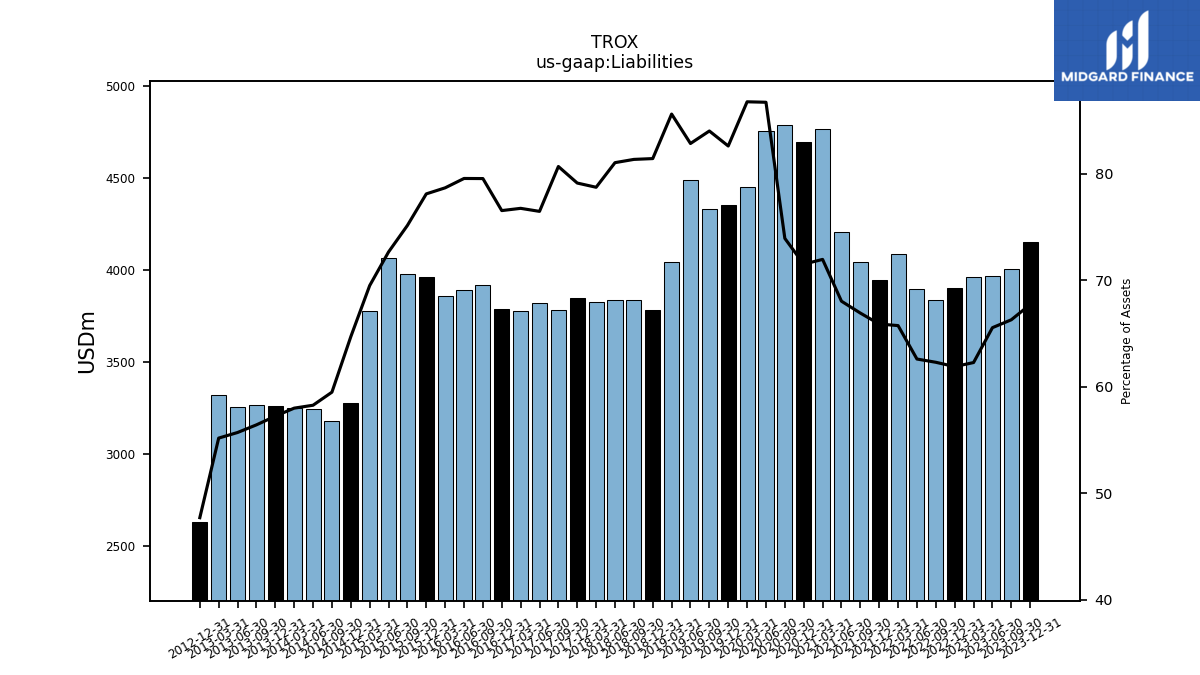
| Assets | 6134.00 | 6040.00 | 6055.00 | 6359.00 | 6306.00 | 6159.00 | 6220.00 | 6215.00 | 5987.00 | 6043.00 | 6182.00 | 6623.00 | 6568.00 | 6476.00 | 5482.00 | 5130.00 | 5268.00 | 5157.00 | 5416.00 | 4726.00 | 4642.00 | 4714.00 | 4733.00 | 4858.00 | 4864.00 | 4691.00 | 4994.00 | 4922.00 | 4950.00 | 4925.00 | 4893.00 | 4907.00 | 5072.00 | 5296.00 | 5592.00 | 5436.00 | 5065.00 | 5347.00 | 5566.00 | 5606.00 | 5699.00 | 5785.00 | 5847.00 | 6015.00 | 5511.00 | NA | NA | NA | NA | NA | NA | NA | NA | |
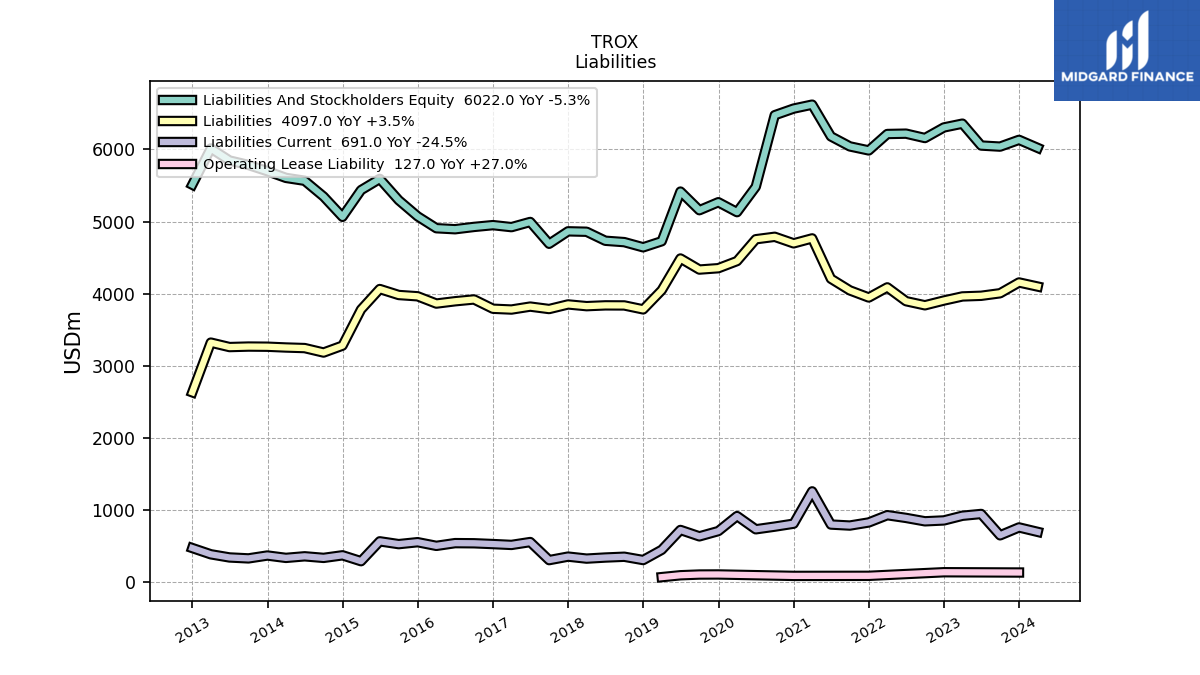
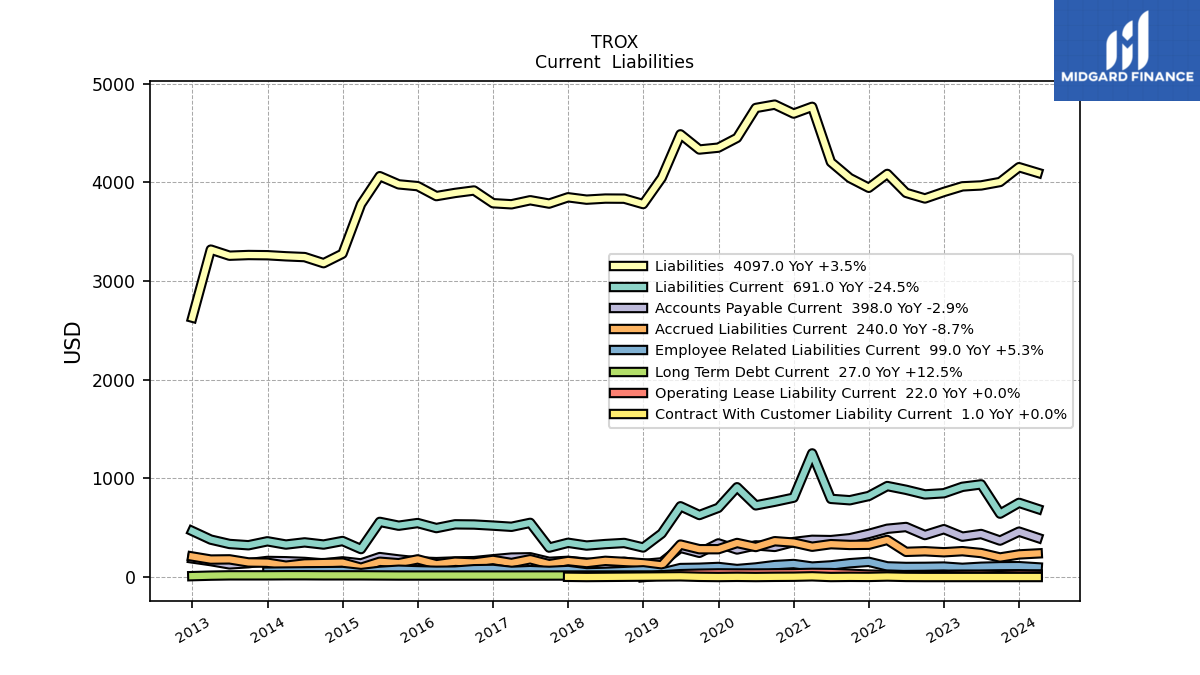
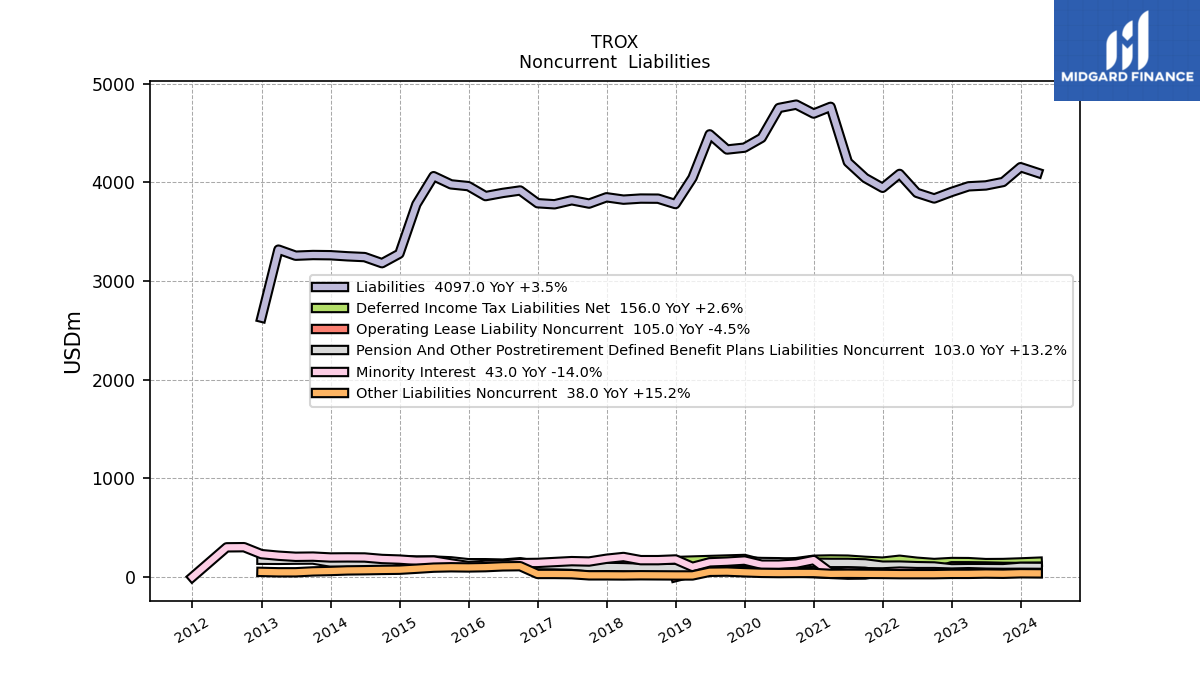
| Liabilities | 4154.00 | 4004.00 | 3969.00 | 3960.00 | 3903.00 | 3837.00 | 3894.00 | 4086.00 | 3945.00 | 4044.00 | 4206.00 | 4766.00 | 4697.00 | 4788.00 | 4754.00 | 4451.00 | 4352.00 | 4333.00 | 4487.00 | 4046.00 | 3780.00 | 3835.00 | 3836.00 | 3825.00 | 3849.00 | 3785.00 | 3819.00 | 3778.00 | 3789.00 | 3918.00 | 3893.00 | 3861.00 | 3962.00 | 3980.00 | 4063.00 | 3778.00 | 3277.00 | 3181.00 | 3243.00 | 3251.00 | 3262.00 | 3264.00 | 3257.00 | 3319.00 | 2629.00 | NA | NA | NA | NA | NA | NA | NA | NA | |
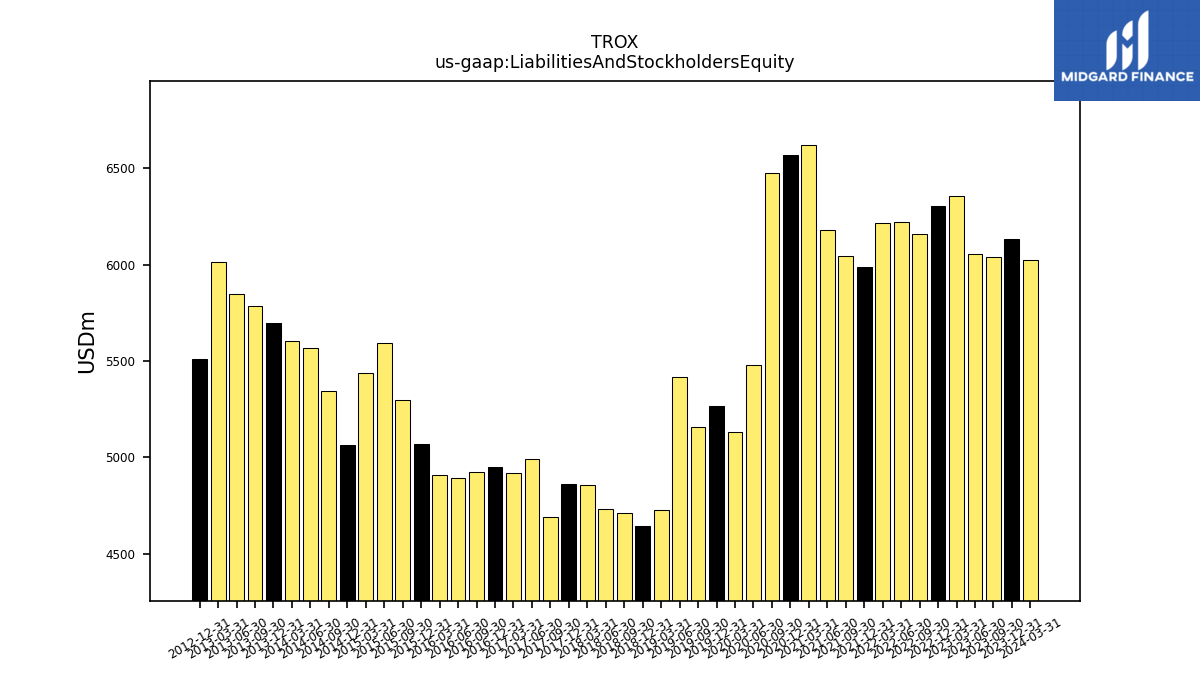
| Liabilities And Stockholders Equity | 6134.00 | 6040.00 | 6055.00 | 6359.00 | 6306.00 | 6159.00 | 6220.00 | 6215.00 | 5987.00 | 6043.00 | 6182.00 | 6623.00 | 6568.00 | 6476.00 | 5482.00 | 5130.00 | 5268.00 | 5157.00 | 5416.00 | 4726.00 | 4642.00 | 4714.00 | 4733.00 | 4858.00 | 4864.00 | 4691.00 | 4994.00 | 4922.00 | 4950.00 | 4925.00 | 4893.00 | 4907.00 | 5072.00 | 5296.00 | 5592.00 | 5436.00 | 5065.00 | 5347.00 | 5566.00 | 5606.00 | 5699.00 | 5785.00 | 5847.00 | 6015.00 | 5511.00 | NA | NA | NA | NA | NA | NA | NA | NA | |
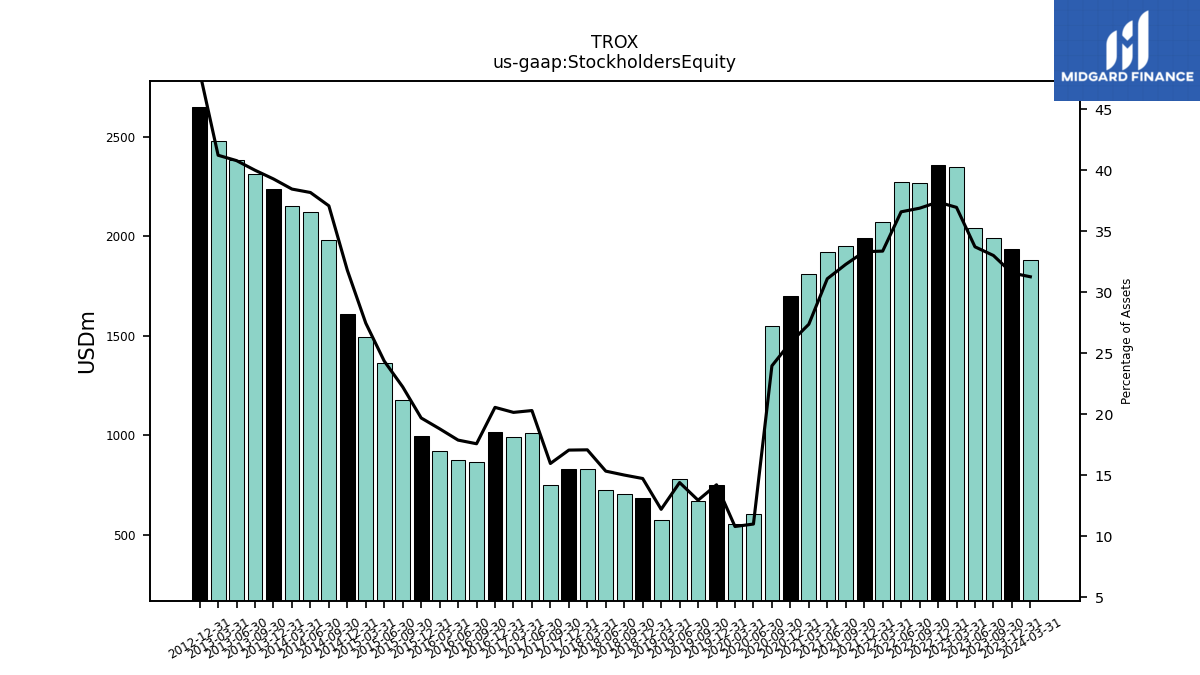
| Stockholders Equity | 1936.00 | 1993.00 | 2041.00 | 2349.00 | 2357.00 | 2271.00 | 2275.00 | 2073.00 | 1994.00 | 1950.00 | 1922.00 | 1812.00 | 1698.00 | 1551.00 | 602.00 | 553.00 | 748.00 | 667.00 | 779.00 | 576.00 | 683.00 | 707.00 | 725.00 | 829.00 | 829.00 | 748.00 | 1013.00 | 991.00 | 1017.00 | 865.00 | 874.00 | 922.00 | 998.00 | 1177.00 | 1361.00 | 1492.00 | 1610.00 | 1982.00 | 2124.00 | 2155.00 | 2238.00 | 2313.00 | 2384.00 | 2479.00 | 2649.00 | NA | NA | NA | NA | NA | NA | NA | NA |
| 2023-12-31 | 2023-09-30 | 2023-06-30 | 2023-03-31 | 2022-12-31 | 2022-09-30 | 2022-06-30 | 2022-03-31 | 2021-12-31 | 2021-09-30 | 2021-06-30 | 2021-03-31 | 2020-12-31 | 2020-09-30 | 2020-06-30 | 2020-03-31 | 2019-12-31 | 2019-09-30 | 2019-06-30 | 2019-03-31 | 2018-12-31 | 2018-09-30 | 2018-06-30 | 2018-03-31 | 2017-12-31 | 2017-09-30 | 2017-06-30 | 2017-03-31 | 2016-12-31 | 2016-09-30 | 2016-06-30 | 2016-03-31 | 2015-12-31 | 2015-09-30 | 2015-06-30 | 2015-03-31 | 2014-12-31 | 2014-09-30 | 2014-06-30 | 2014-03-31 | 2013-12-31 | 2013-09-30 | 2013-06-30 | 2013-03-31 | 2012-12-31 | 2012-09-30 | 2012-06-30 | 2012-03-31 | 2011-12-31 | 2011-09-30 | 2011-06-30 | 2011-03-31 | 2011-01-31 | ||
|---|---|---|---|---|---|---|---|---|---|---|---|---|---|---|---|---|---|---|---|---|---|---|---|---|---|---|---|---|---|---|---|---|---|---|---|---|---|---|---|---|---|---|---|---|---|---|---|---|---|---|---|---|---|---|
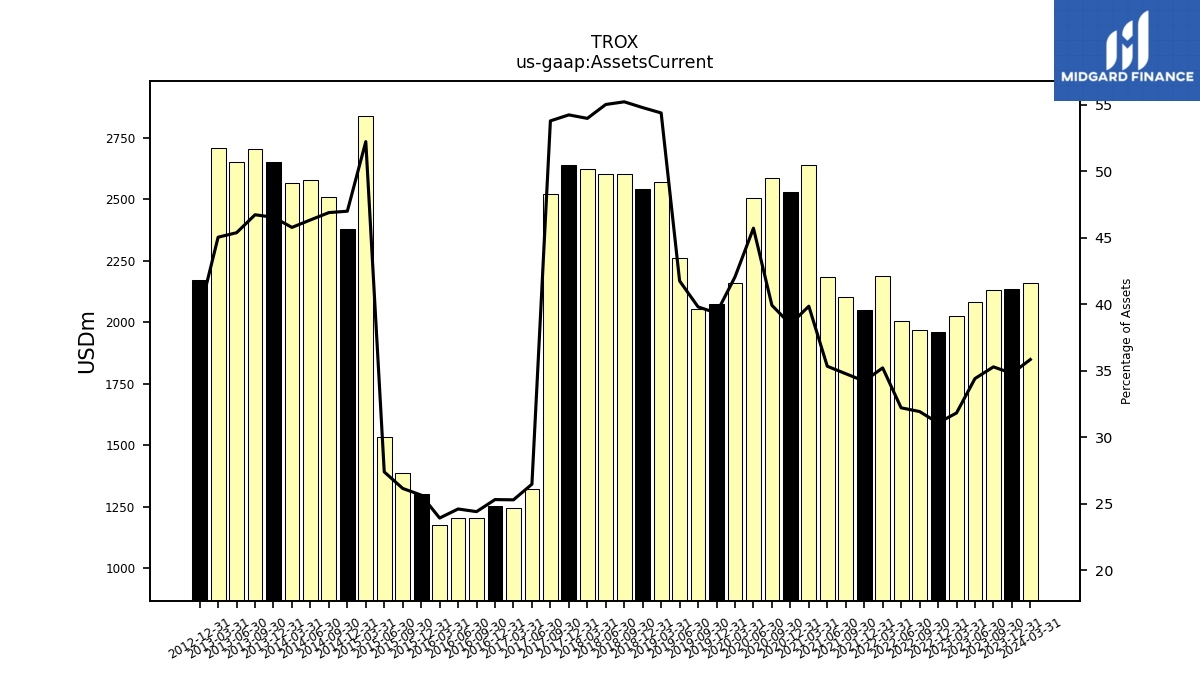
| Assets Current | 2135.00 | 2132.00 | 2084.00 | 2024.00 | 1960.00 | 1967.00 | 2004.00 | 2189.00 | 2049.00 | 2102.00 | 2185.00 | 2640.00 | 2529.00 | 2586.00 | 2507.00 | 2158.00 | 2073.00 | 2053.00 | 2262.00 | 2571.00 | 2544.00 | 2604.00 | 2605.00 | 2623.00 | 2639.00 | 2524.00 | 1322.00 | 1245.00 | 1253.00 | 1202.00 | 1204.00 | 1174.00 | 1301.00 | 1385.00 | 1532.00 | 2840.00 | 2381.00 | 2508.00 | 2580.00 | 2567.00 | 2653.00 | 2704.00 | 2654.00 | 2710.00 | 2173.00 | NA | NA | NA | NA | NA | NA | NA | NA | |
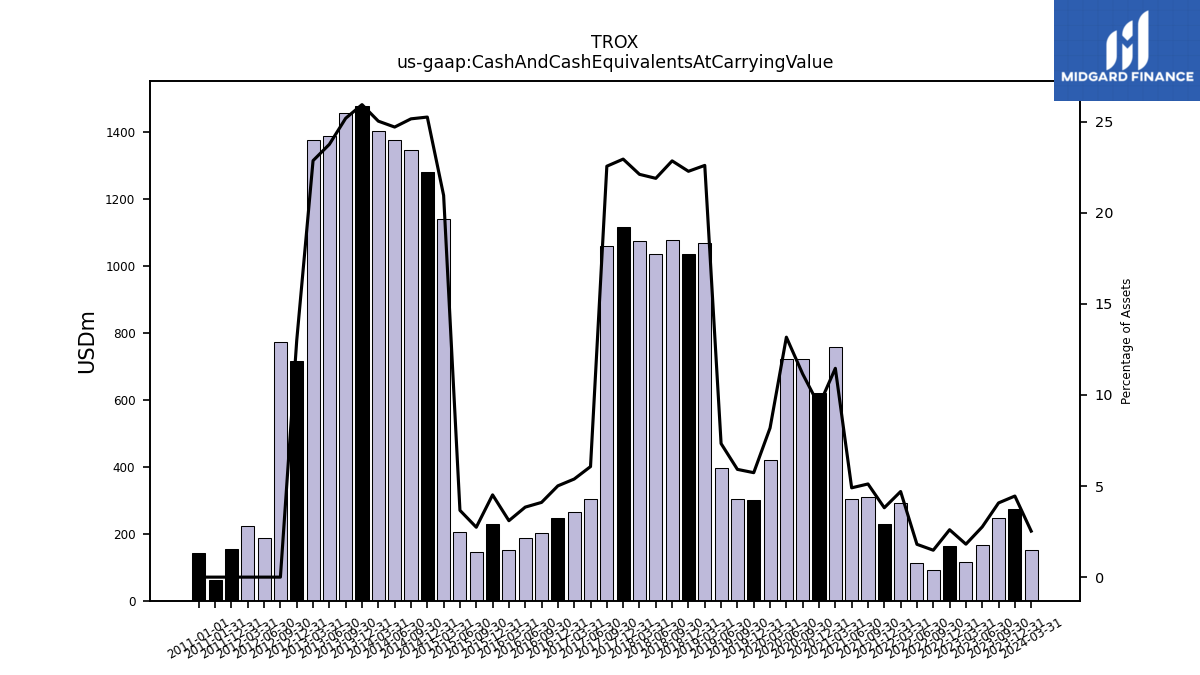
| Cash And Cash Equivalents At Carrying Value | 273.00 | 246.00 | 167.00 | 115.00 | 164.00 | 91.00 | 112.00 | 292.00 | 228.00 | 309.00 | 303.00 | 759.00 | 619.00 | 722.00 | 722.00 | 420.00 | 302.00 | 305.00 | 397.00 | 1068.00 | 1034.00 | 1077.00 | 1036.00 | 1074.00 | 1116.00 | 1058.00 | 303.00 | 265.00 | 248.00 | 202.00 | 188.00 | 152.00 | 229.00 | 145.00 | 205.00 | 1139.00 | 1279.00 | 1345.00 | 1375.00 | 1403.00 | 1478.00 | 1457.00 | 1389.00 | 1375.00 | 716.00 | 774.00 | 186.00 | 223.00 | 154.00 | NA | NA | NA | 61.00 | |
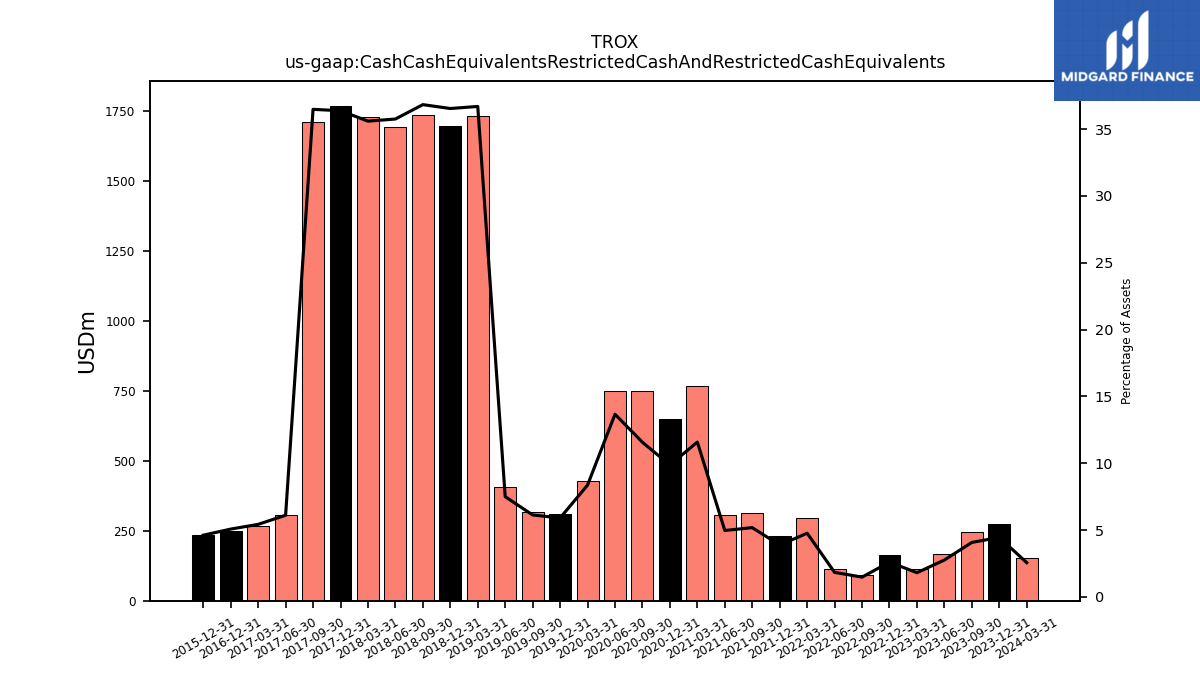
| Cash Cash Equivalents Restricted Cash And Restricted Cash Equivalents | 273.00 | 246.00 | 167.00 | 115.00 | 164.00 | 91.00 | 114.00 | 296.00 | 232.00 | 313.00 | 307.00 | 767.00 | 648.00 | 749.00 | 749.00 | 429.00 | 311.00 | 316.00 | 406.00 | 1734.00 | 1696.00 | 1736.00 | 1692.00 | 1729.00 | 1769.00 | 1711.00 | 305.00 | 267.00 | 251.00 | NA | NA | NA | 234.00 | NA | NA | NA | NA | NA | NA | NA | NA | NA | NA | NA | NA | NA | NA | NA | NA | NA | NA | NA | NA | |
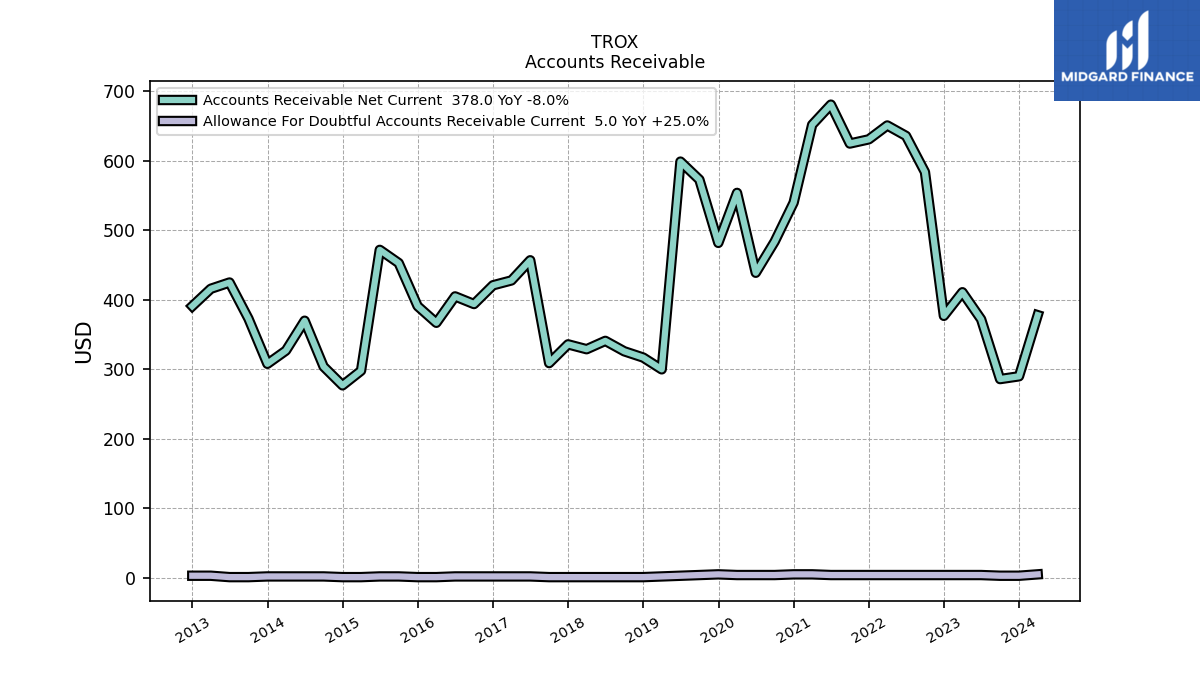
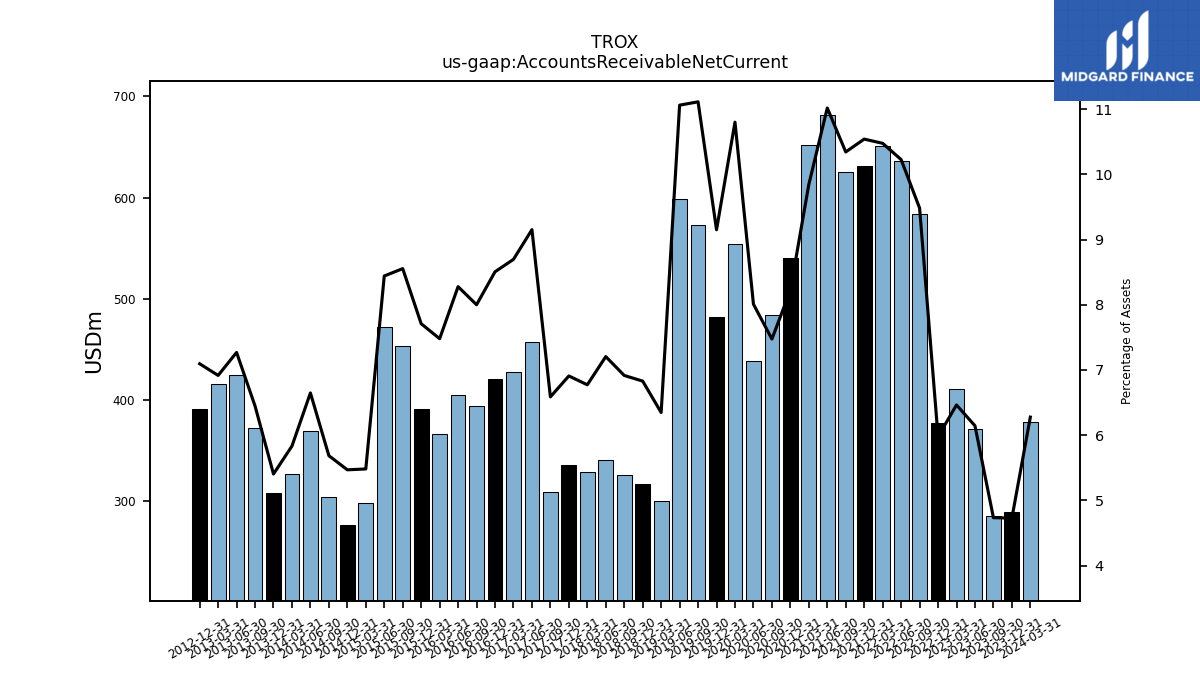
| Accounts Receivable Net Current | 290.00 | 286.00 | 372.00 | 411.00 | 377.00 | 584.00 | 636.00 | 651.00 | 631.00 | 625.00 | 681.00 | 652.00 | 540.00 | 484.00 | 439.00 | 554.00 | 482.00 | 573.00 | 599.00 | 300.00 | 317.00 | 326.00 | 341.00 | 329.00 | 336.00 | 309.00 | 457.00 | 428.00 | 421.00 | 394.00 | 405.00 | 367.00 | 391.00 | 453.00 | 472.00 | 298.00 | 277.00 | 304.00 | 370.00 | 327.00 | 308.00 | 373.00 | 425.00 | 416.00 | 391.00 | NA | NA | NA | NA | NA | NA | NA | NA | |
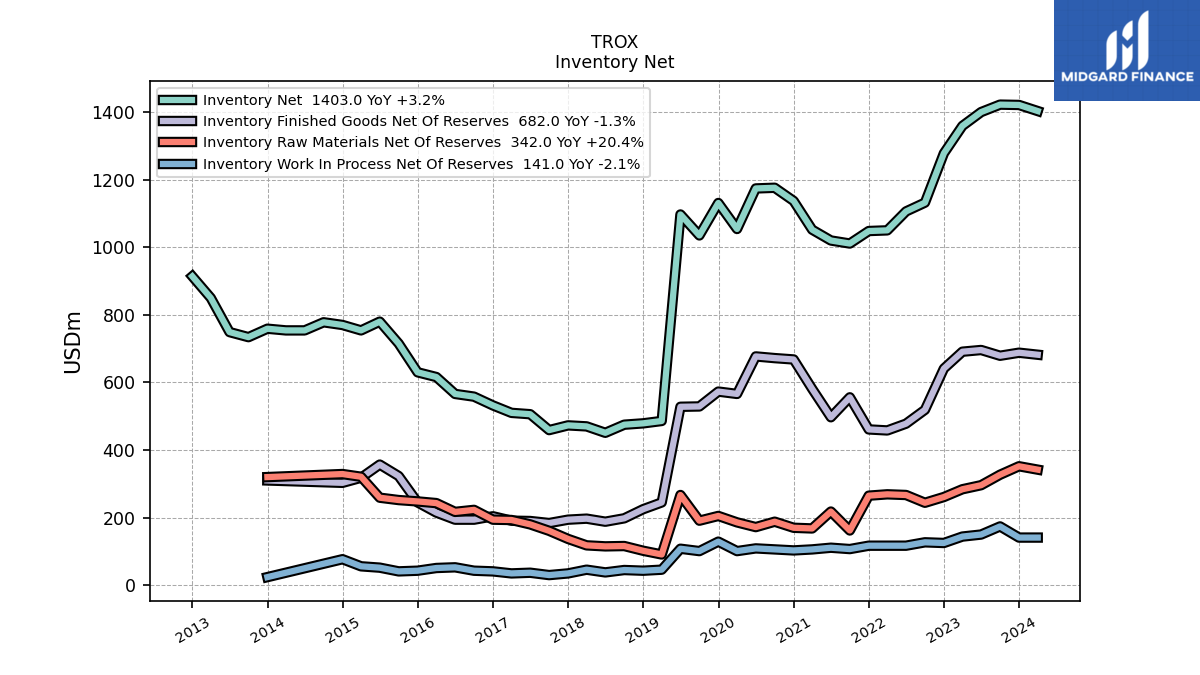
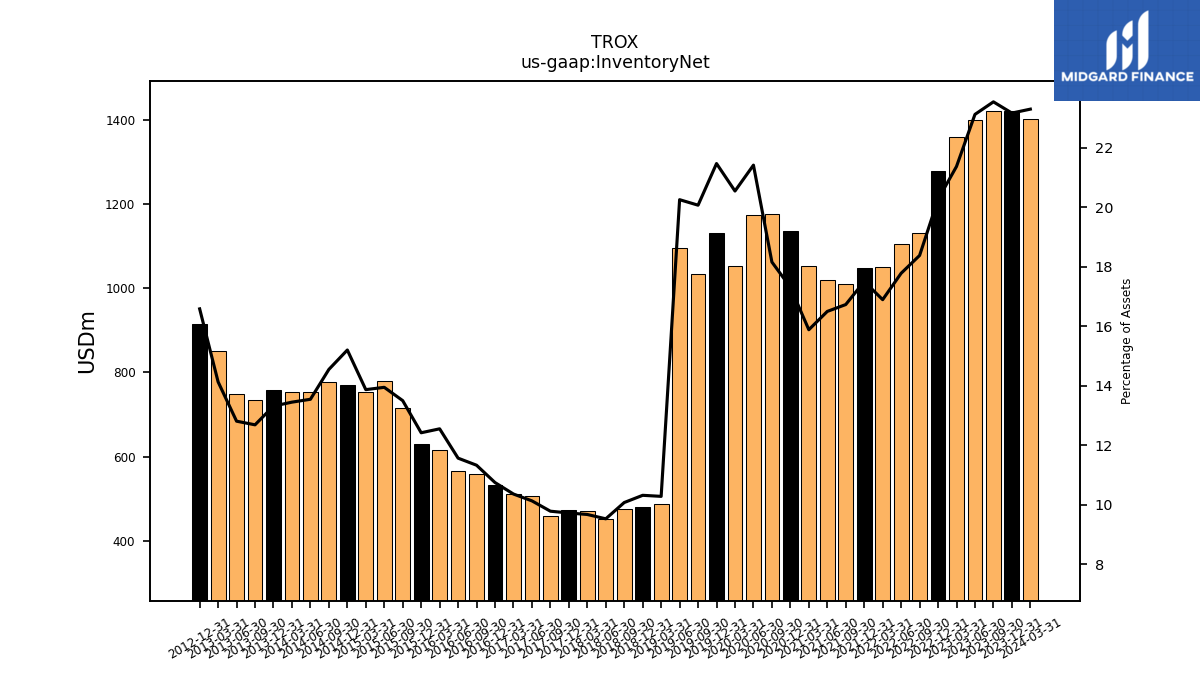
| Inventory Net | 1421.00 | 1422.00 | 1400.00 | 1359.00 | 1278.00 | 1132.00 | 1106.00 | 1050.00 | 1048.00 | 1011.00 | 1020.00 | 1052.00 | 1137.00 | 1176.00 | 1174.00 | 1054.00 | 1131.00 | 1035.00 | 1097.00 | 486.00 | 479.00 | 475.00 | 451.00 | 470.00 | 473.00 | 459.00 | 506.00 | 510.00 | 532.00 | 558.00 | 566.00 | 616.00 | 630.00 | 715.00 | 780.00 | 754.00 | 770.00 | 778.00 | 754.00 | 754.00 | 759.00 | 734.00 | 749.00 | 850.00 | 914.00 | NA | NA | NA | NA | NA | NA | NA | NA | |
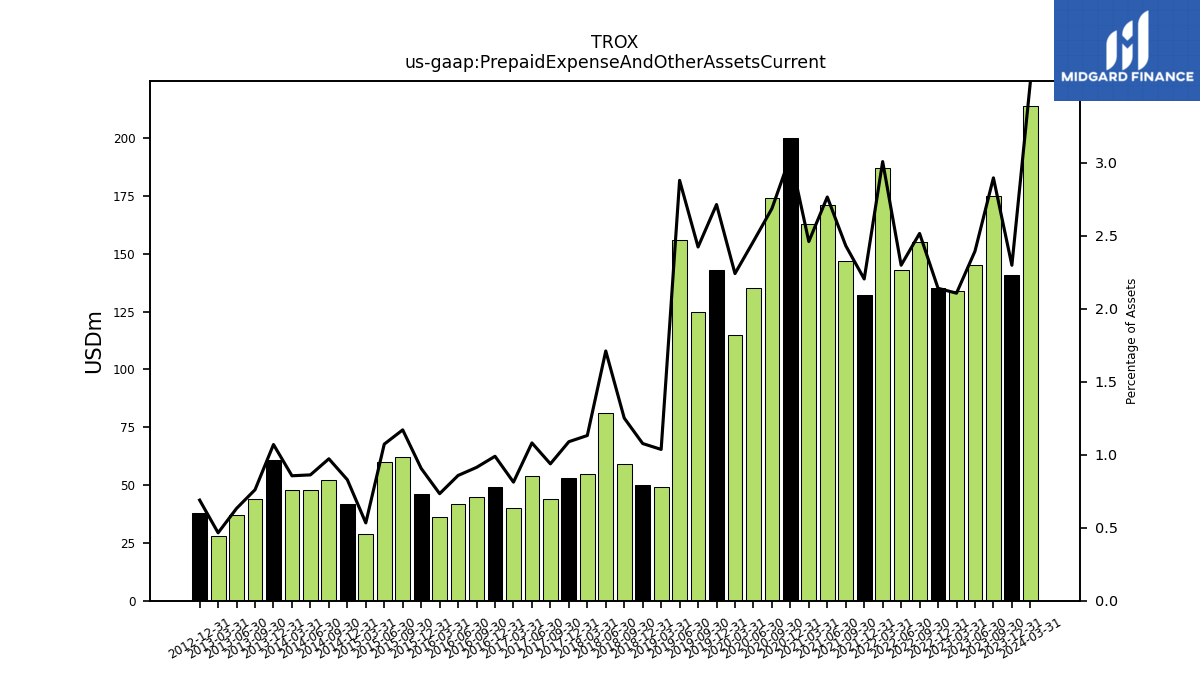
| Prepaid Expense And Other Assets Current | 141.00 | 175.00 | 145.00 | 134.00 | 135.00 | 155.00 | 143.00 | 187.00 | 132.00 | 147.00 | 171.00 | 163.00 | 200.00 | 174.00 | 135.00 | 115.00 | 143.00 | 125.00 | 156.00 | 49.00 | 50.00 | 59.00 | 81.00 | 55.00 | 53.00 | 44.00 | 54.00 | 40.00 | 49.00 | 45.00 | 42.00 | 36.00 | 46.00 | 62.00 | 60.00 | 29.00 | 42.00 | 52.00 | 48.00 | 48.00 | 61.00 | 44.00 | 37.00 | 28.00 | 38.00 | NA | NA | NA | NA | NA | NA | NA | NA |
| 2023-12-31 | 2023-09-30 | 2023-06-30 | 2023-03-31 | 2022-12-31 | 2022-09-30 | 2022-06-30 | 2022-03-31 | 2021-12-31 | 2021-09-30 | 2021-06-30 | 2021-03-31 | 2020-12-31 | 2020-09-30 | 2020-06-30 | 2020-03-31 | 2019-12-31 | 2019-09-30 | 2019-06-30 | 2019-03-31 | 2018-12-31 | 2018-09-30 | 2018-06-30 | 2018-03-31 | 2017-12-31 | 2017-09-30 | 2017-06-30 | 2017-03-31 | 2016-12-31 | 2016-09-30 | 2016-06-30 | 2016-03-31 | 2015-12-31 | 2015-09-30 | 2015-06-30 | 2015-03-31 | 2014-12-31 | 2014-09-30 | 2014-06-30 | 2014-03-31 | 2013-12-31 | 2013-09-30 | 2013-06-30 | 2013-03-31 | 2012-12-31 | 2012-09-30 | 2012-06-30 | 2012-03-31 | 2011-12-31 | 2011-09-30 | 2011-06-30 | 2011-03-31 | 2011-01-31 | ||
|---|---|---|---|---|---|---|---|---|---|---|---|---|---|---|---|---|---|---|---|---|---|---|---|---|---|---|---|---|---|---|---|---|---|---|---|---|---|---|---|---|---|---|---|---|---|---|---|---|---|---|---|---|---|---|
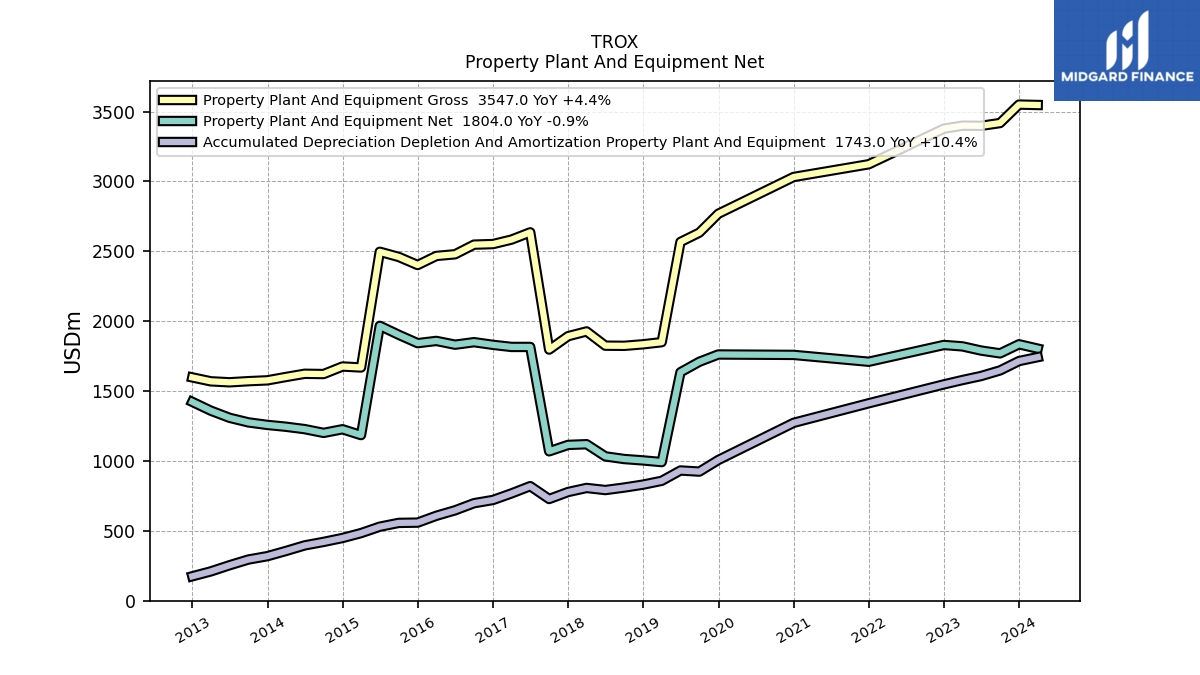
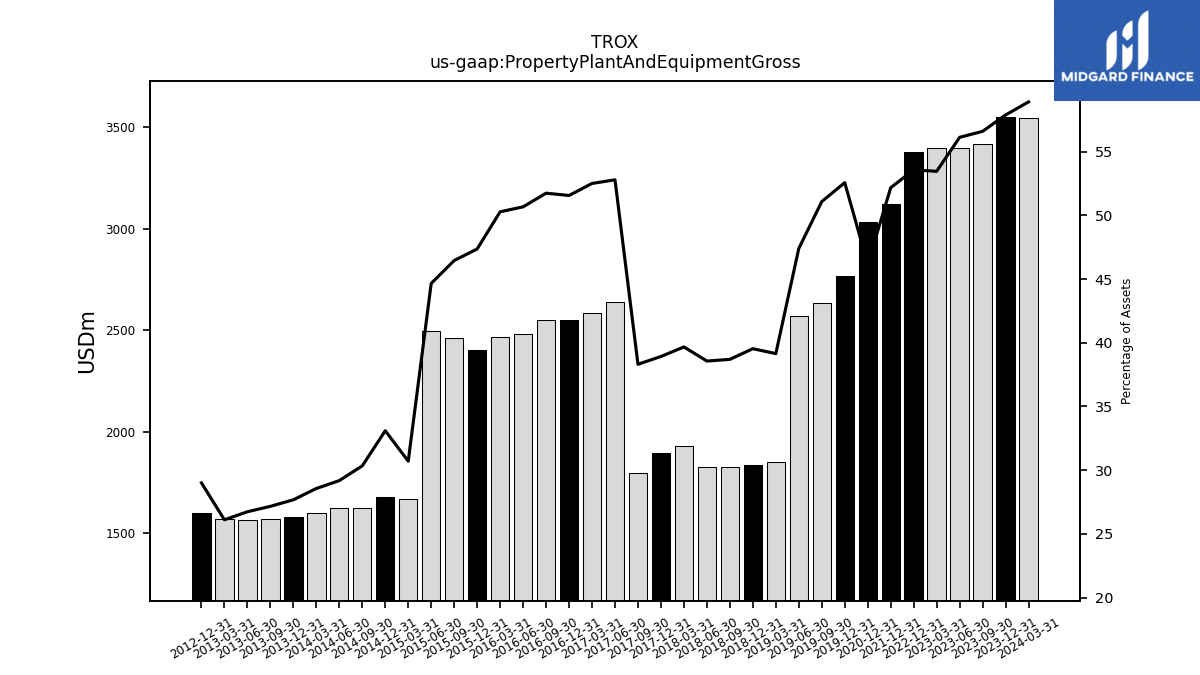
| Property Plant And Equipment Gross | 3550.00 | 3418.00 | 3398.00 | 3399.00 | 3378.00 | NA | NA | NA | 3123.00 | NA | NA | NA | 3032.00 | NA | NA | NA | 2769.00 | 2634.00 | 2567.00 | 1850.00 | 1835.00 | 1824.00 | 1825.00 | 1927.00 | 1893.00 | 1797.00 | 2636.00 | 2584.00 | 2552.00 | 2548.00 | 2479.00 | 2467.00 | 2402.00 | 2460.00 | 2497.00 | 1669.00 | 1676.00 | 1622.00 | 1624.00 | 1601.00 | 1577.00 | 1571.00 | 1563.00 | 1570.00 | 1598.00 | NA | NA | NA | NA | NA | NA | NA | NA | |
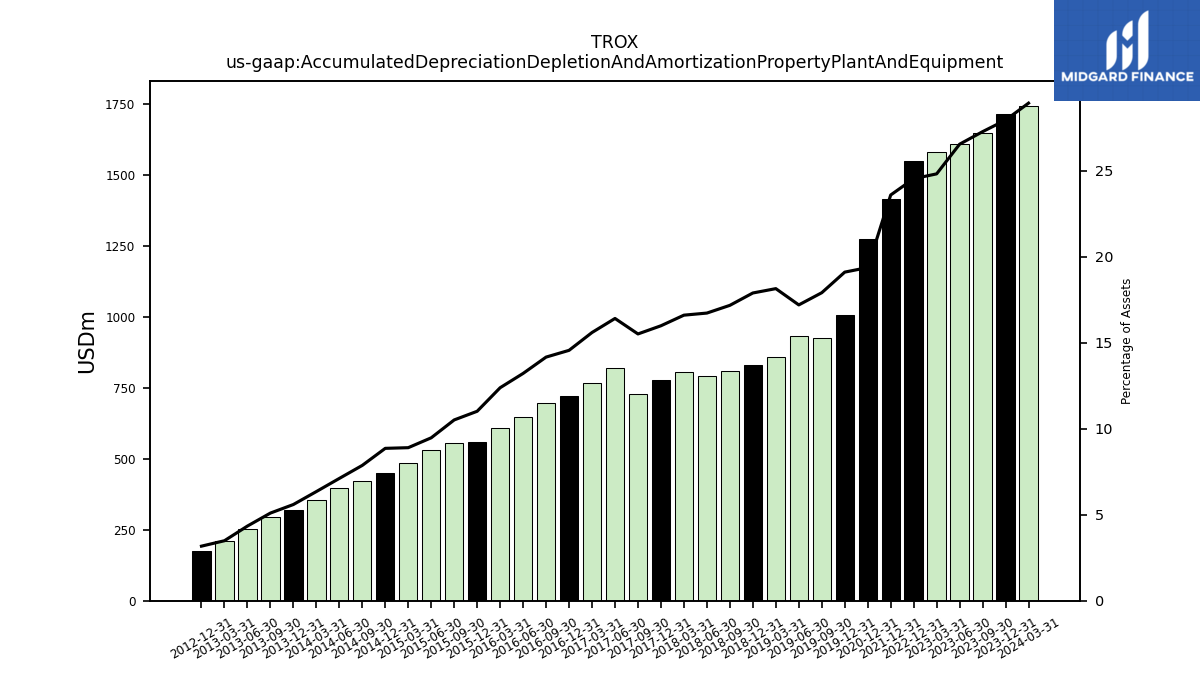
| Accumulated Depreciation Depletion And Amortization Property Plant And Equipment | 1715.00 | 1648.00 | 1608.00 | 1579.00 | 1548.00 | NA | NA | NA | 1413.00 | NA | NA | NA | 1273.00 | NA | NA | NA | 1007.00 | 924.00 | 932.00 | 858.00 | 831.00 | 810.00 | 792.00 | 807.00 | 778.00 | 728.00 | 820.00 | 768.00 | 721.00 | 698.00 | 647.00 | 608.00 | 559.00 | 557.00 | 530.00 | 484.00 | 449.00 | 421.00 | 396.00 | 356.00 | 319.00 | 295.00 | 254.00 | 210.00 | 175.00 | NA | NA | NA | NA | NA | NA | NA | NA | |
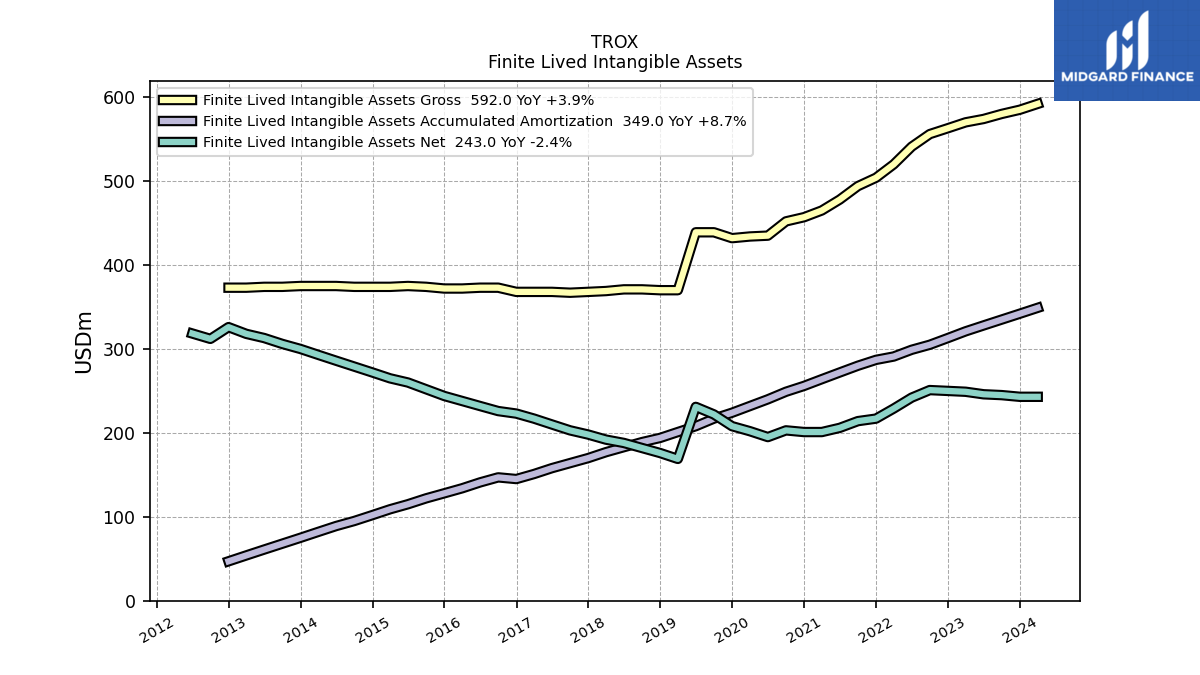
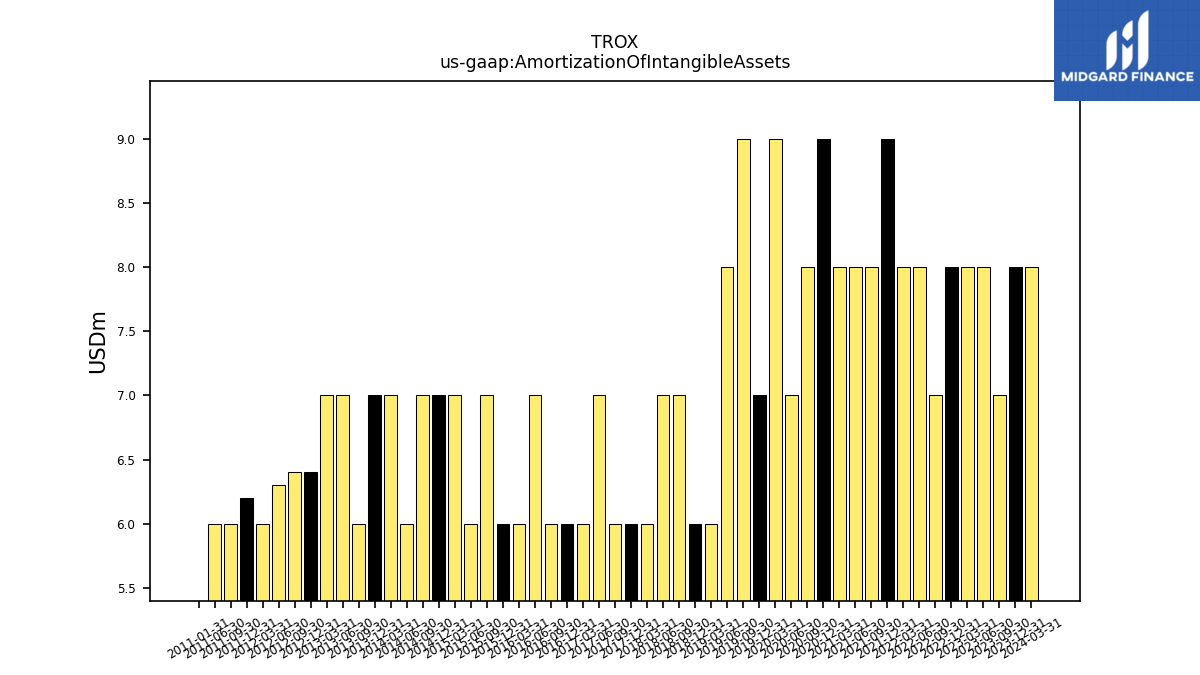
| Amortization Of Intangible Assets | 8.00 | 7.00 | 8.00 | 8.00 | 8.00 | 7.00 | 8.00 | 8.00 | 9.00 | 8.00 | 8.00 | 8.00 | 9.00 | 8.00 | 7.00 | 9.00 | 7.00 | 9.00 | 8.00 | 6.00 | 6.00 | 7.00 | 7.00 | 6.00 | 6.00 | 6.00 | 7.00 | 6.00 | 6.00 | 6.00 | 7.00 | 6.00 | 6.00 | 7.00 | 6.00 | 7.00 | 7.00 | 7.00 | 6.00 | 7.00 | 7.00 | 6.00 | 7.00 | 7.00 | 6.40 | 6.40 | 6.30 | 6.00 | 6.20 | 6.00 | 6.00 | NA | 0.00 | |
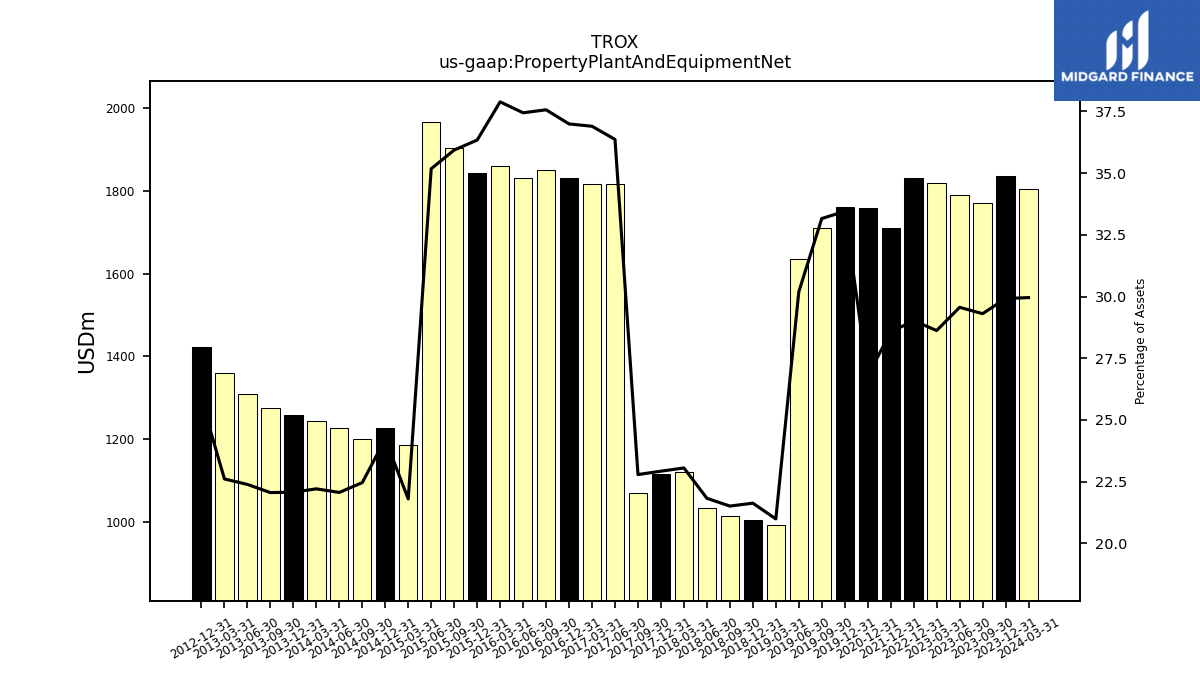
| Property Plant And Equipment Net | 1835.00 | 1770.00 | 1790.00 | 1820.00 | 1830.00 | NA | NA | NA | 1710.00 | NA | NA | NA | 1759.00 | NA | NA | NA | 1762.00 | 1710.00 | 1635.00 | 992.00 | 1004.00 | 1014.00 | 1033.00 | 1120.00 | 1115.00 | 1069.00 | 1816.00 | 1816.00 | 1831.00 | 1850.00 | 1832.00 | 1859.00 | 1843.00 | 1903.00 | 1967.00 | 1185.00 | 1227.00 | 1201.00 | 1228.00 | 1245.00 | 1258.00 | 1276.00 | 1309.00 | 1360.00 | 1423.00 | NA | NA | NA | NA | NA | NA | NA | NA | |
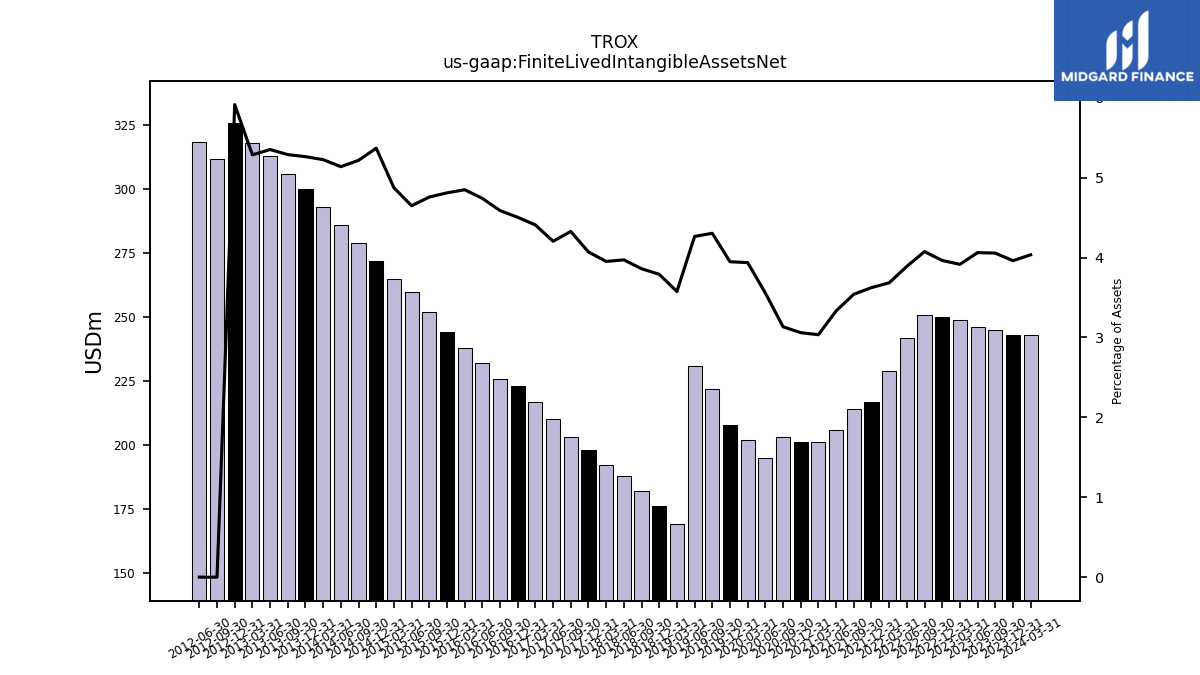
| Finite Lived Intangible Assets Net | 243.00 | 245.00 | 246.00 | 249.00 | 250.00 | 251.00 | 242.00 | 229.00 | 217.00 | 214.00 | 206.00 | 201.00 | 201.00 | 203.00 | 195.00 | 202.00 | 208.00 | 222.00 | 231.00 | 169.00 | 176.00 | 182.00 | 188.00 | 192.00 | 198.00 | 203.00 | 210.00 | 217.00 | 223.00 | 226.00 | 232.00 | 238.00 | 244.00 | 252.00 | 260.00 | 265.00 | 272.00 | 279.00 | 286.00 | 293.00 | 300.00 | 306.00 | 313.00 | 318.00 | 326.00 | 312.00 | 318.40 | NA | NA | NA | NA | NA | NA | |
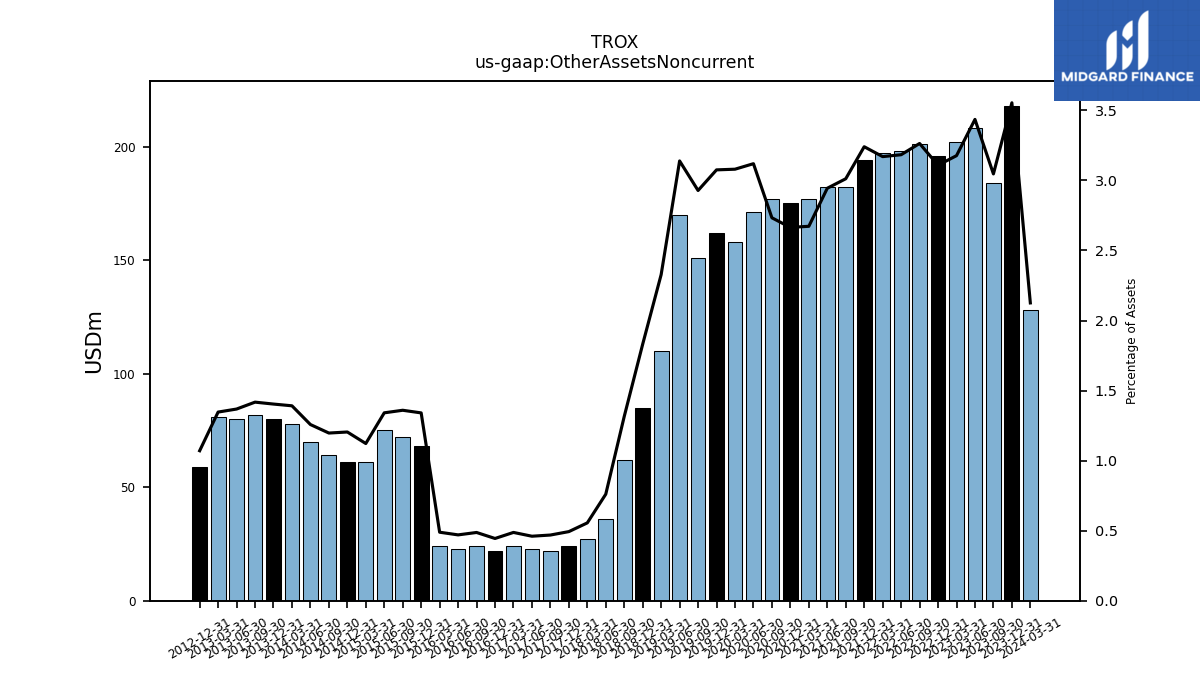
| Other Assets Noncurrent | 218.00 | 184.00 | 208.00 | 202.00 | 196.00 | 201.00 | 198.00 | 197.00 | 194.00 | 182.00 | 182.00 | 177.00 | 175.00 | 177.00 | 171.00 | 158.00 | 162.00 | 151.00 | 170.00 | 110.00 | 85.00 | 62.00 | 36.00 | 27.00 | 24.00 | 22.00 | 23.00 | 24.00 | 22.00 | 24.00 | 23.00 | 24.00 | 68.00 | 72.00 | 75.00 | 61.00 | 61.00 | 64.00 | 70.00 | 78.00 | 80.00 | 82.00 | 80.00 | 81.00 | 59.00 | NA | NA | NA | NA | NA | NA | NA | NA |
| 2023-12-31 | 2023-09-30 | 2023-06-30 | 2023-03-31 | 2022-12-31 | 2022-09-30 | 2022-06-30 | 2022-03-31 | 2021-12-31 | 2021-09-30 | 2021-06-30 | 2021-03-31 | 2020-12-31 | 2020-09-30 | 2020-06-30 | 2020-03-31 | 2019-12-31 | 2019-09-30 | 2019-06-30 | 2019-03-31 | 2018-12-31 | 2018-09-30 | 2018-06-30 | 2018-03-31 | 2017-12-31 | 2017-09-30 | 2017-06-30 | 2017-03-31 | 2016-12-31 | 2016-09-30 | 2016-06-30 | 2016-03-31 | 2015-12-31 | 2015-09-30 | 2015-06-30 | 2015-03-31 | 2014-12-31 | 2014-09-30 | 2014-06-30 | 2014-03-31 | 2013-12-31 | 2013-09-30 | 2013-06-30 | 2013-03-31 | 2012-12-31 | 2012-09-30 | 2012-06-30 | 2012-03-31 | 2011-12-31 | 2011-09-30 | 2011-06-30 | 2011-03-31 | 2011-01-31 | ||
|---|---|---|---|---|---|---|---|---|---|---|---|---|---|---|---|---|---|---|---|---|---|---|---|---|---|---|---|---|---|---|---|---|---|---|---|---|---|---|---|---|---|---|---|---|---|---|---|---|---|---|---|---|---|---|
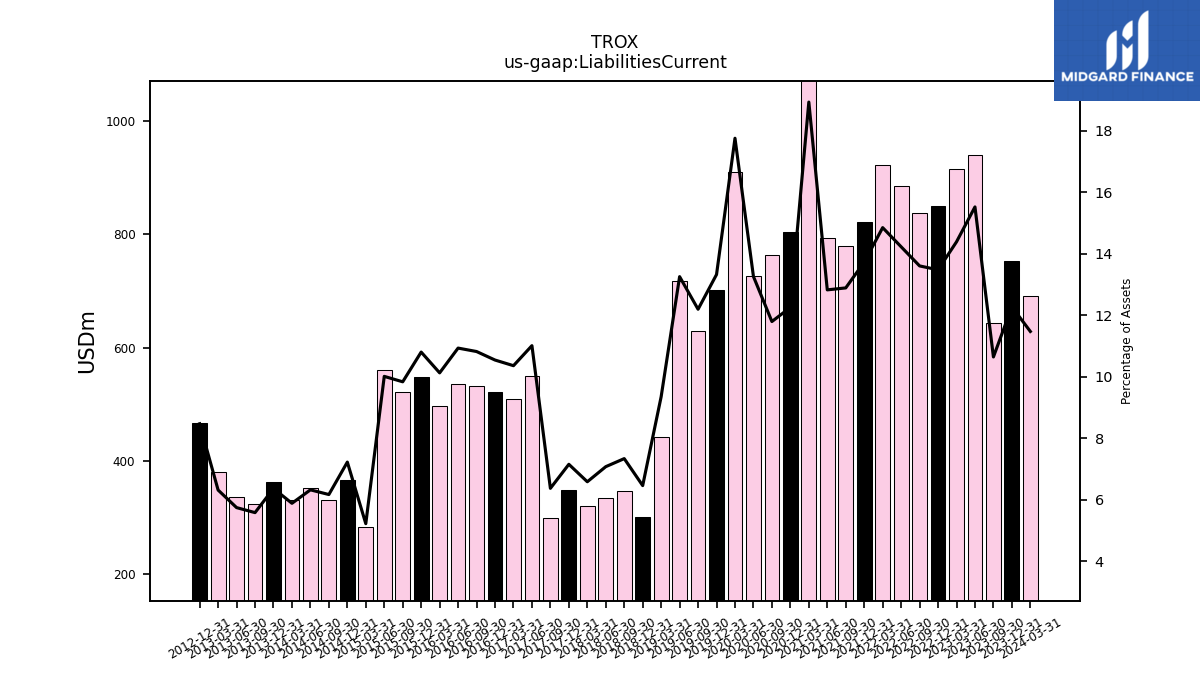
| Liabilities Current | 753.00 | 643.00 | 940.00 | 915.00 | 850.00 | 838.00 | 885.00 | 923.00 | 822.00 | 779.00 | 793.00 | 1254.00 | 805.00 | 764.00 | 727.00 | 911.00 | 702.00 | 629.00 | 718.00 | 442.00 | 300.00 | 346.00 | 335.00 | 320.00 | 348.00 | 299.00 | 550.00 | 510.00 | 522.00 | 533.00 | 535.00 | 497.00 | 548.00 | 521.00 | 560.00 | 284.00 | 366.00 | 330.00 | 352.00 | 330.00 | 363.00 | 323.00 | 336.00 | 380.00 | 467.00 | NA | NA | NA | NA | NA | NA | NA | NA | |
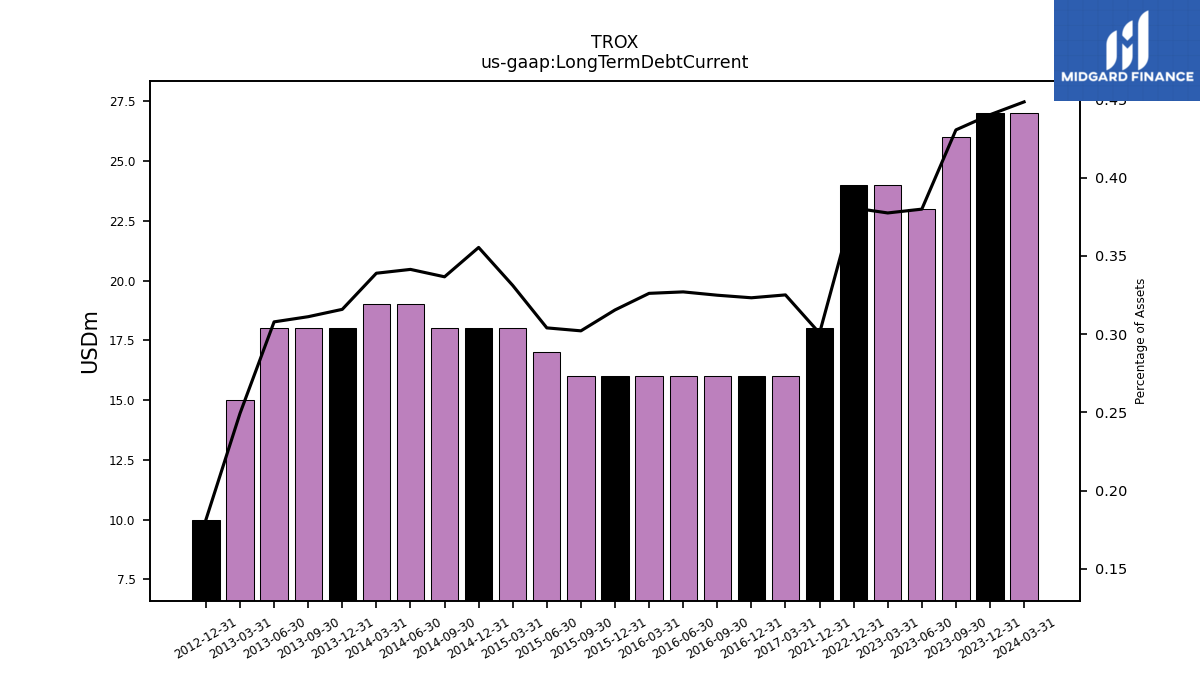
| Long Term Debt Current | 27.00 | 26.00 | 23.00 | 24.00 | 24.00 | NA | NA | NA | 18.00 | NA | NA | NA | NA | NA | NA | NA | NA | NA | NA | NA | NA | NA | NA | NA | NA | NA | NA | 16.00 | 16.00 | 16.00 | 16.00 | 16.00 | 16.00 | 16.00 | 17.00 | 18.00 | 18.00 | 18.00 | 19.00 | 19.00 | 18.00 | 18.00 | 18.00 | 15.00 | 10.00 | NA | NA | NA | NA | NA | NA | NA | NA | |
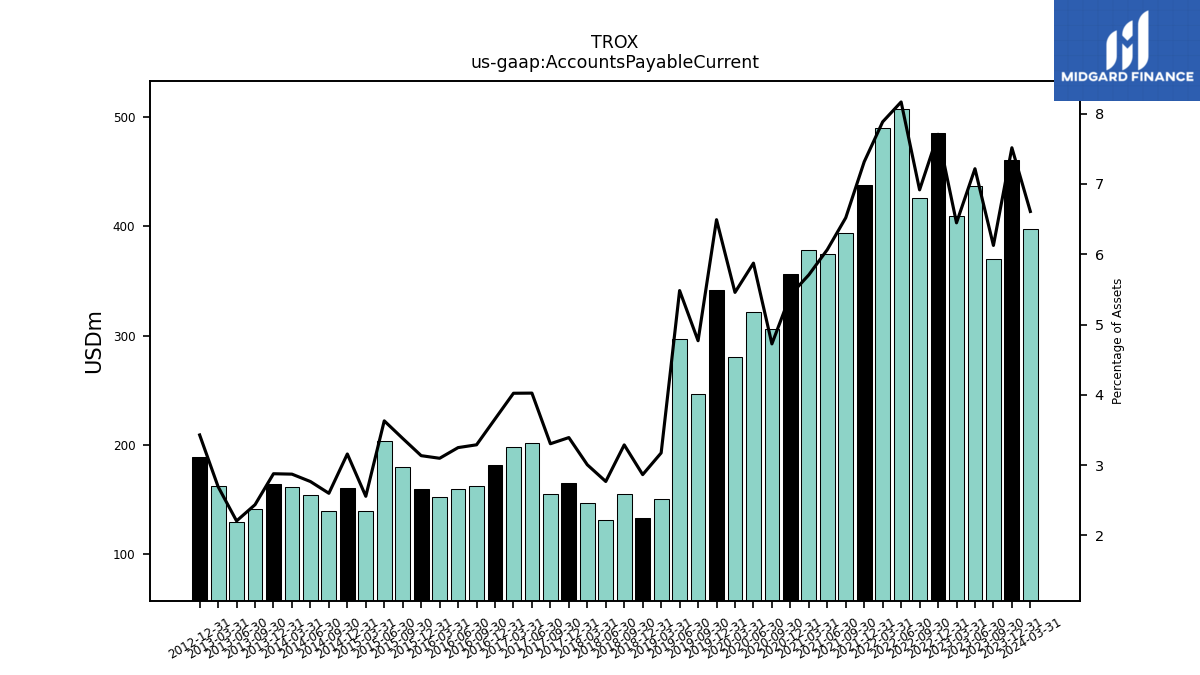
| Accounts Payable Current | 461.00 | 370.00 | 437.00 | 410.00 | 486.00 | 426.00 | 508.00 | 490.00 | 438.00 | 394.00 | 375.00 | 378.00 | 356.00 | 306.00 | 322.00 | 280.00 | 342.00 | 246.00 | 297.00 | 150.00 | 133.00 | 155.00 | 131.00 | 146.00 | 165.00 | 155.00 | 201.00 | 198.00 | 181.00 | 162.00 | 159.00 | 152.00 | 159.00 | 179.00 | 203.00 | 139.00 | 160.00 | 139.00 | 154.00 | 161.00 | 164.00 | 141.00 | 129.00 | 162.00 | 189.00 | NA | NA | NA | NA | NA | NA | NA | NA | |
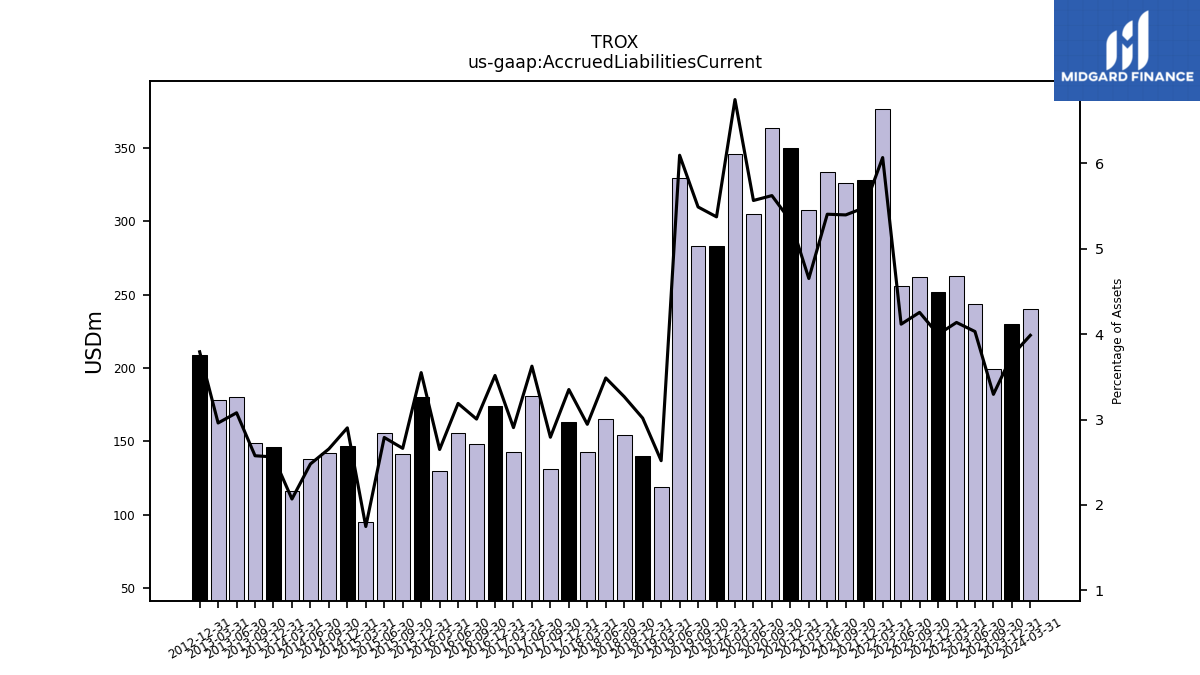
| Accrued Liabilities Current | 230.00 | 199.00 | 244.00 | 263.00 | 252.00 | 262.00 | 256.00 | 377.00 | 328.00 | 326.00 | 334.00 | 308.00 | 350.00 | 364.00 | 305.00 | 346.00 | 283.00 | 283.00 | 330.00 | 119.00 | 140.00 | 154.00 | 165.00 | 143.00 | 163.00 | 131.00 | 181.00 | 143.00 | 174.00 | 148.00 | 156.00 | 130.00 | 180.00 | 141.00 | 156.00 | 95.00 | 147.00 | 142.00 | 138.00 | 116.00 | 146.00 | 149.00 | 180.00 | 178.00 | 209.00 | NA | NA | NA | NA | NA | NA | NA | NA | |
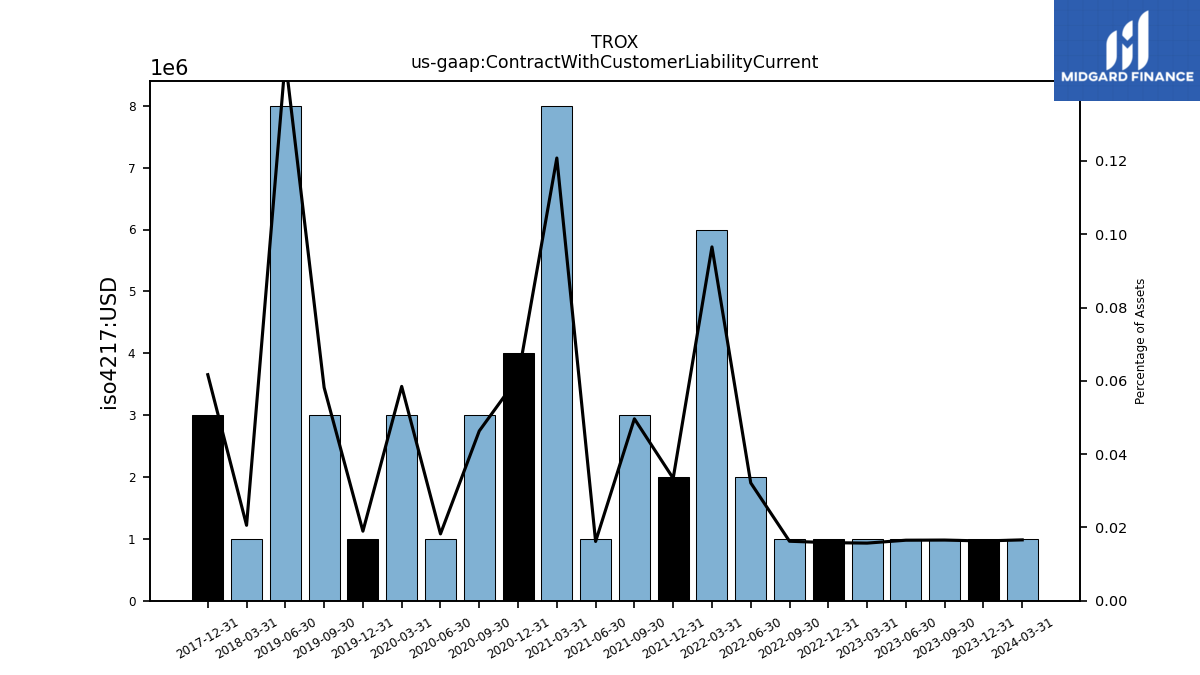
| Contract With Customer Liability Current | 1.00 | 1.00 | 1.00 | 1.00 | 1.00 | 1.00 | 2.00 | 6.00 | 2.00 | 3.00 | 1.00 | 8.00 | 4.00 | 3.00 | 1.00 | 3.00 | 1.00 | 3.00 | 8.00 | NA | NA | NA | NA | 1.00 | 3.00 | NA | NA | NA | NA | NA | NA | NA | NA | NA | NA | NA | NA | NA | NA | NA | NA | NA | NA | NA | NA | NA | NA | NA | NA | NA | NA | NA | NA |
| 2023-12-31 | 2023-09-30 | 2023-06-30 | 2023-03-31 | 2022-12-31 | 2022-09-30 | 2022-06-30 | 2022-03-31 | 2021-12-31 | 2021-09-30 | 2021-06-30 | 2021-03-31 | 2020-12-31 | 2020-09-30 | 2020-06-30 | 2020-03-31 | 2019-12-31 | 2019-09-30 | 2019-06-30 | 2019-03-31 | 2018-12-31 | 2018-09-30 | 2018-06-30 | 2018-03-31 | 2017-12-31 | 2017-09-30 | 2017-06-30 | 2017-03-31 | 2016-12-31 | 2016-09-30 | 2016-06-30 | 2016-03-31 | 2015-12-31 | 2015-09-30 | 2015-06-30 | 2015-03-31 | 2014-12-31 | 2014-09-30 | 2014-06-30 | 2014-03-31 | 2013-12-31 | 2013-09-30 | 2013-06-30 | 2013-03-31 | 2012-12-31 | 2012-09-30 | 2012-06-30 | 2012-03-31 | 2011-12-31 | 2011-09-30 | 2011-06-30 | 2011-03-31 | 2011-01-31 | ||
|---|---|---|---|---|---|---|---|---|---|---|---|---|---|---|---|---|---|---|---|---|---|---|---|---|---|---|---|---|---|---|---|---|---|---|---|---|---|---|---|---|---|---|---|---|---|---|---|---|---|---|---|---|---|---|
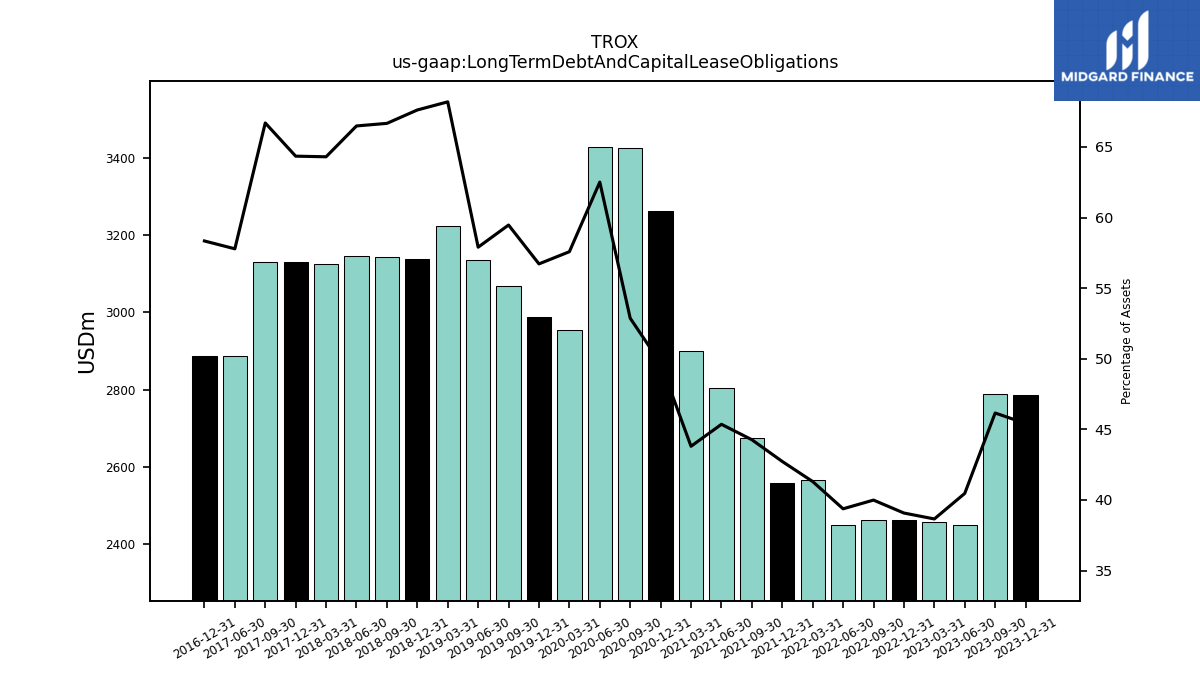
| Long Term Debt And Capital Lease Obligations | 2786.00 | 2788.00 | 2450.00 | 2458.00 | 2464.00 | 2463.00 | 2449.00 | 2567.00 | 2558.00 | 2675.00 | 2804.00 | 2901.00 | 3263.00 | 3424.00 | 3427.00 | 2954.00 | 2988.00 | 3067.00 | 3136.00 | 3223.00 | 3139.00 | 3143.00 | 3147.00 | 3124.00 | 3130.00 | 3129.00 | 2886.00 | NA | 2888.00 | NA | NA | NA | NA | NA | NA | NA | NA | NA | NA | NA | NA | NA | NA | NA | NA | NA | NA | NA | NA | NA | NA | NA | NA | |
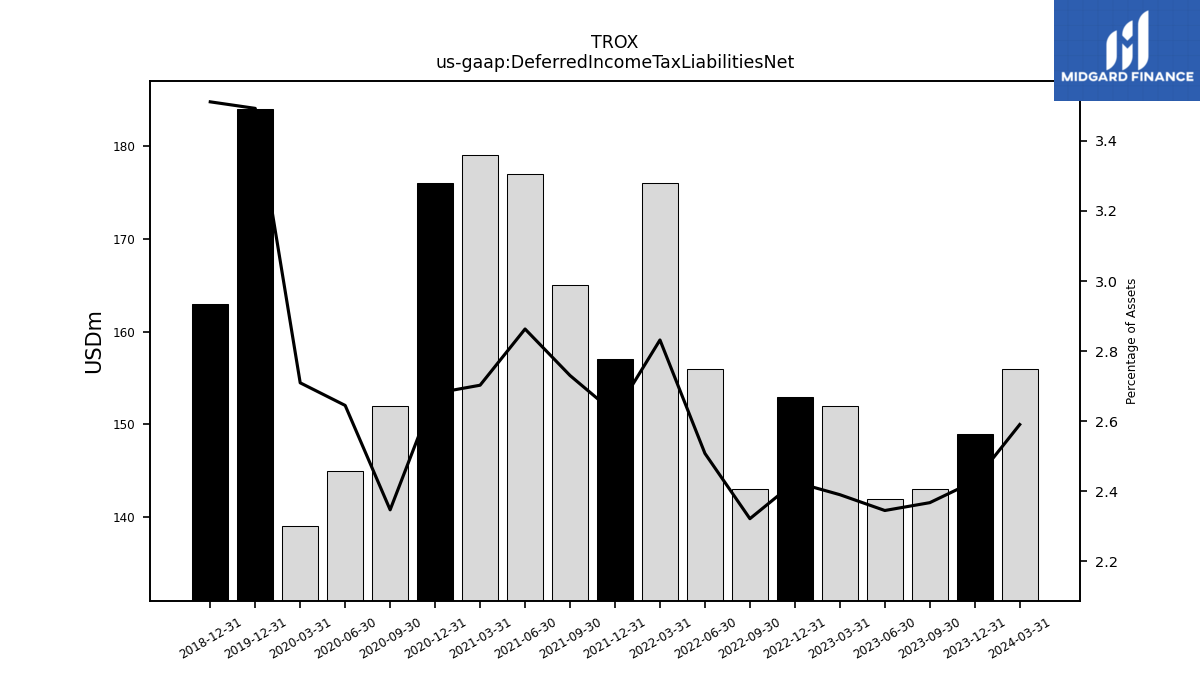
| Deferred Income Tax Liabilities Net | 149.00 | 143.00 | 142.00 | 152.00 | 153.00 | 143.00 | 156.00 | 176.00 | 157.00 | 165.00 | 177.00 | 179.00 | 176.00 | 152.00 | 145.00 | 139.00 | 184.00 | NA | NA | NA | 163.00 | NA | NA | NA | NA | NA | NA | NA | NA | NA | NA | NA | NA | NA | NA | NA | NA | NA | NA | NA | NA | NA | NA | NA | NA | NA | NA | NA | NA | NA | NA | NA | NA | |
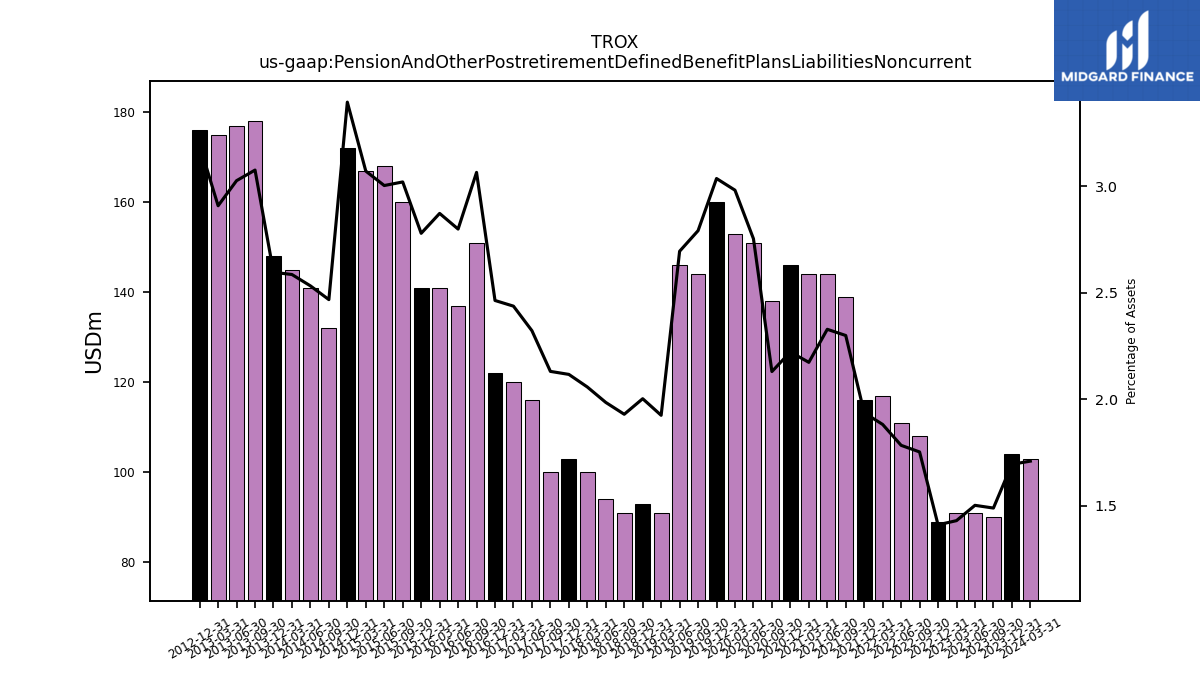
| Pension And Other Postretirement Defined Benefit Plans Liabilities Noncurrent | 104.00 | 90.00 | 91.00 | 91.00 | 89.00 | 108.00 | 111.00 | 117.00 | 116.00 | 139.00 | 144.00 | 144.00 | 146.00 | 138.00 | 151.00 | 153.00 | 160.00 | 144.00 | 146.00 | 91.00 | 93.00 | 91.00 | 94.00 | 100.00 | 103.00 | 100.00 | 116.00 | 120.00 | 122.00 | 151.00 | 137.00 | 141.00 | 141.00 | 160.00 | 168.00 | 167.00 | 172.00 | 132.00 | 141.00 | 145.00 | 148.00 | 178.00 | 177.00 | 175.00 | 176.00 | NA | NA | NA | NA | NA | NA | NA | NA | |
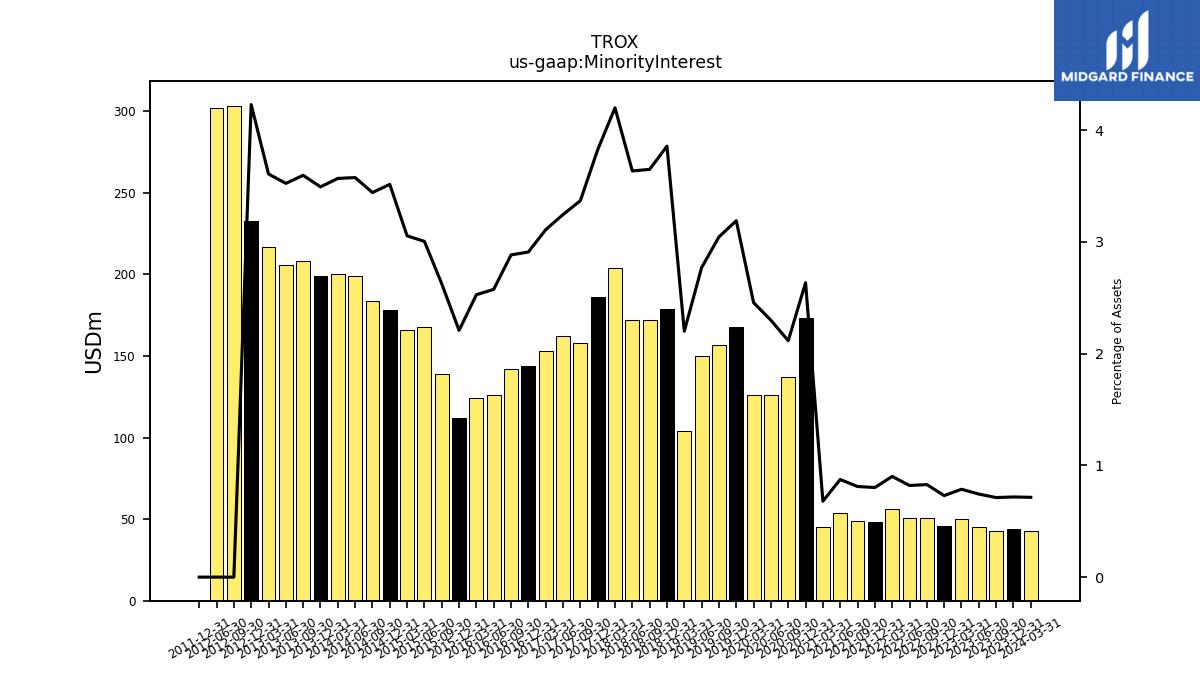
| Minority Interest | 44.00 | 43.00 | 45.00 | 50.00 | 46.00 | 51.00 | 51.00 | 56.00 | 48.00 | 49.00 | 54.00 | 45.00 | 173.00 | 137.00 | 126.00 | 126.00 | 168.00 | 157.00 | 150.00 | 104.00 | 179.00 | 172.00 | 172.00 | 204.00 | 186.00 | 158.00 | 162.00 | 153.00 | 144.00 | 142.00 | 126.00 | 124.00 | 112.00 | 139.00 | 168.00 | 166.00 | 178.00 | 184.00 | 199.00 | 200.00 | 199.00 | 208.00 | 206.00 | 217.00 | 233.00 | 303.40 | 301.90 | NA | 0.00 | NA | NA | NA | NA | |
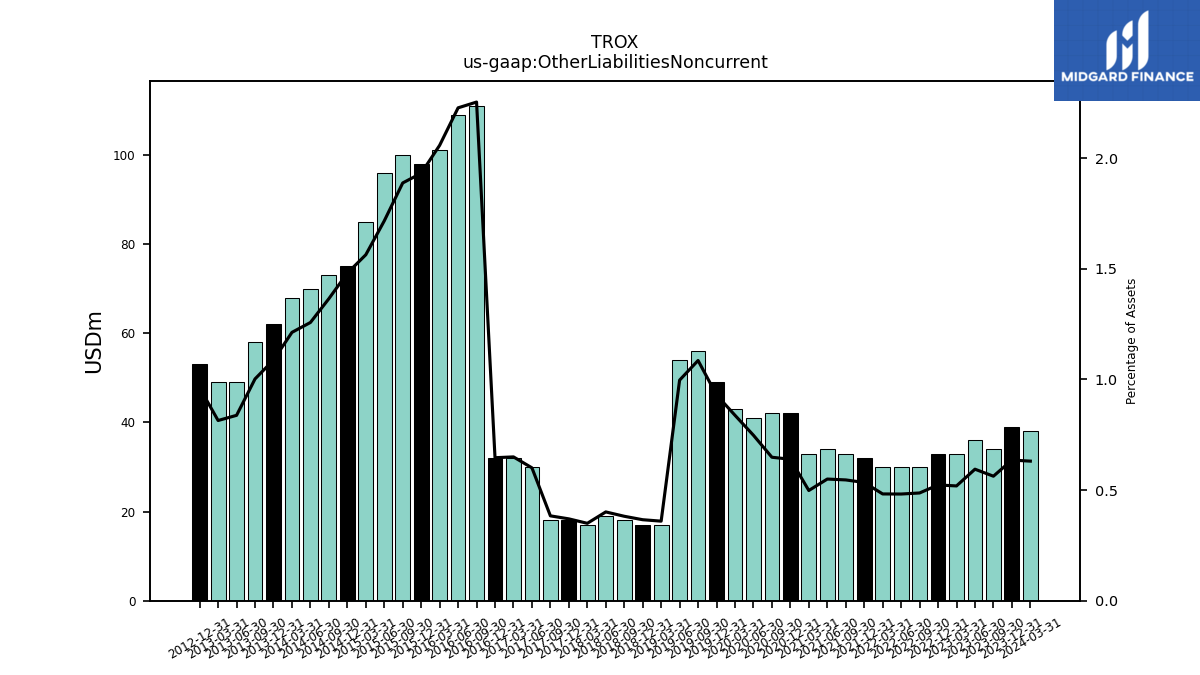
| Other Liabilities Noncurrent | 39.00 | 34.00 | 36.00 | 33.00 | 33.00 | 30.00 | 30.00 | 30.00 | 32.00 | 33.00 | 34.00 | 33.00 | 42.00 | 42.00 | 41.00 | 43.00 | 49.00 | 56.00 | 54.00 | 17.00 | 17.00 | 18.00 | 19.00 | 17.00 | 18.00 | 18.00 | 30.00 | 32.00 | 32.00 | 111.00 | 109.00 | 101.00 | 98.00 | 100.00 | 96.00 | 85.00 | 75.00 | 73.00 | 70.00 | 68.00 | 62.00 | 58.00 | 49.00 | 49.00 | 53.00 | NA | NA | NA | NA | NA | NA | NA | NA | |
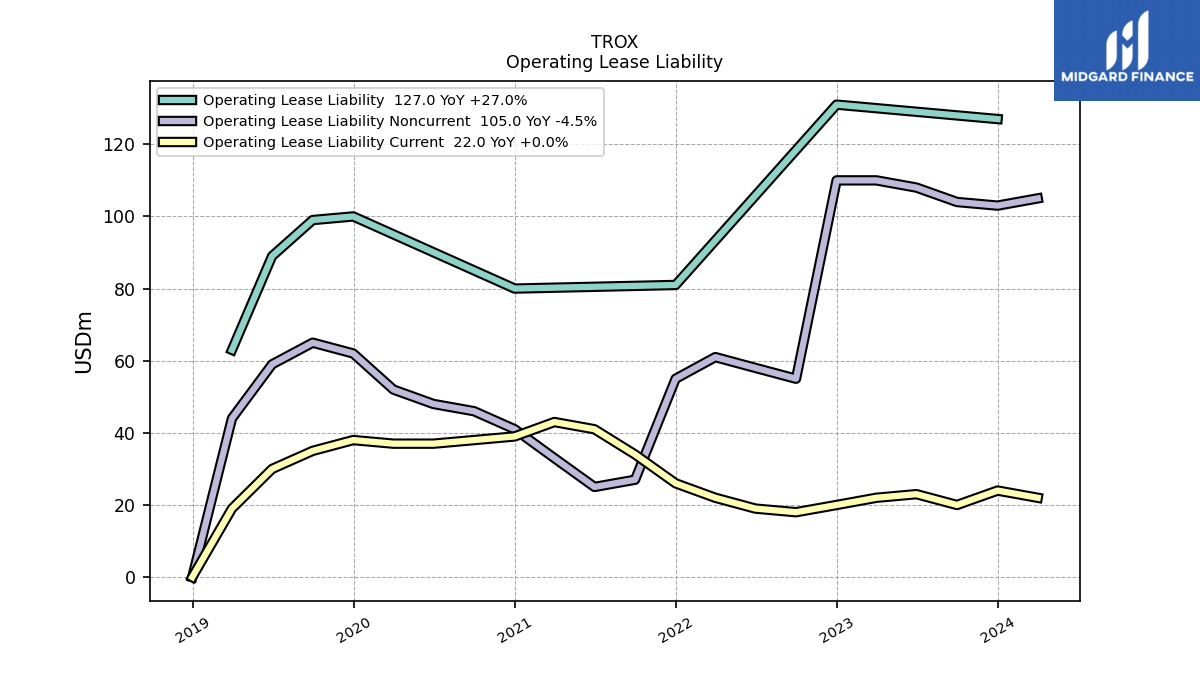
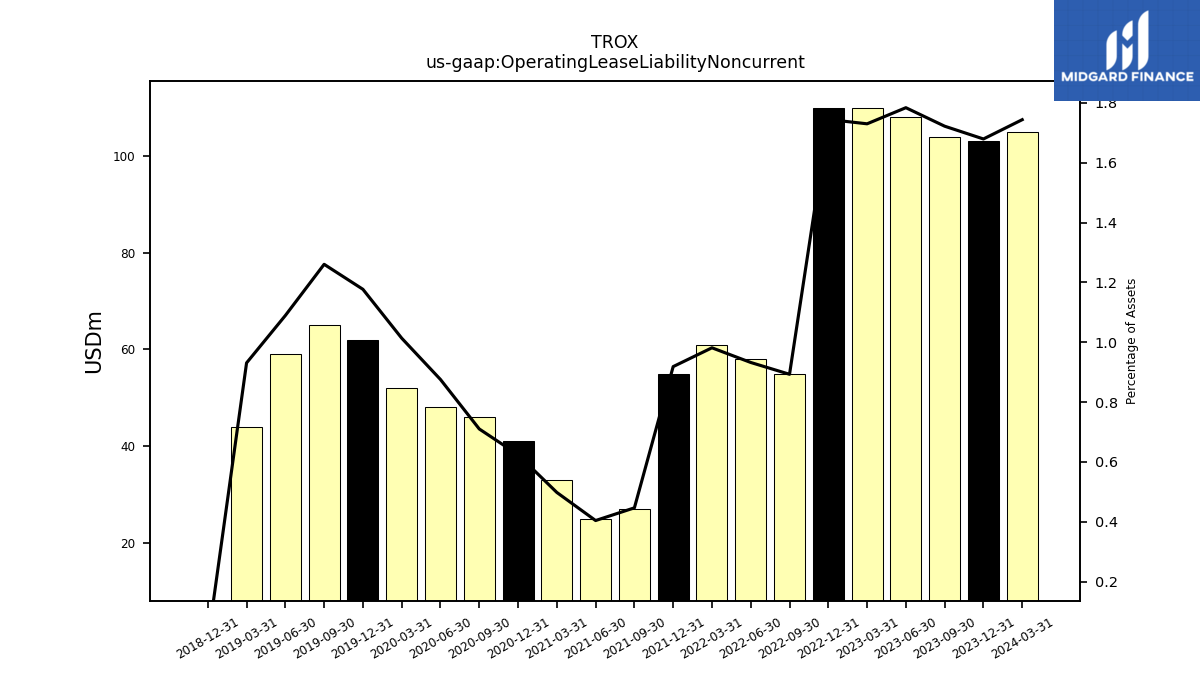
| Operating Lease Liability Noncurrent | 103.00 | 104.00 | 108.00 | 110.00 | 110.00 | 55.00 | 58.00 | 61.00 | 55.00 | 27.00 | 25.00 | 33.00 | 41.00 | 46.00 | 48.00 | 52.00 | 62.00 | 65.00 | 59.00 | 44.00 | 0.00 | NA | NA | NA | NA | NA | NA | NA | NA | NA | NA | NA | NA | NA | NA | NA | NA | NA | NA | NA | NA | NA | NA | NA | NA | NA | NA | NA | NA | NA | NA | NA | NA |
| 2023-12-31 | 2023-09-30 | 2023-06-30 | 2023-03-31 | 2022-12-31 | 2022-09-30 | 2022-06-30 | 2022-03-31 | 2021-12-31 | 2021-09-30 | 2021-06-30 | 2021-03-31 | 2020-12-31 | 2020-09-30 | 2020-06-30 | 2020-03-31 | 2019-12-31 | 2019-09-30 | 2019-06-30 | 2019-03-31 | 2018-12-31 | 2018-09-30 | 2018-06-30 | 2018-03-31 | 2017-12-31 | 2017-09-30 | 2017-06-30 | 2017-03-31 | 2016-12-31 | 2016-09-30 | 2016-06-30 | 2016-03-31 | 2015-12-31 | 2015-09-30 | 2015-06-30 | 2015-03-31 | 2014-12-31 | 2014-09-30 | 2014-06-30 | 2014-03-31 | 2013-12-31 | 2013-09-30 | 2013-06-30 | 2013-03-31 | 2012-12-31 | 2012-09-30 | 2012-06-30 | 2012-03-31 | 2011-12-31 | 2011-09-30 | 2011-06-30 | 2011-03-31 | 2011-01-31 | ||
|---|---|---|---|---|---|---|---|---|---|---|---|---|---|---|---|---|---|---|---|---|---|---|---|---|---|---|---|---|---|---|---|---|---|---|---|---|---|---|---|---|---|---|---|---|---|---|---|---|---|---|---|---|---|---|
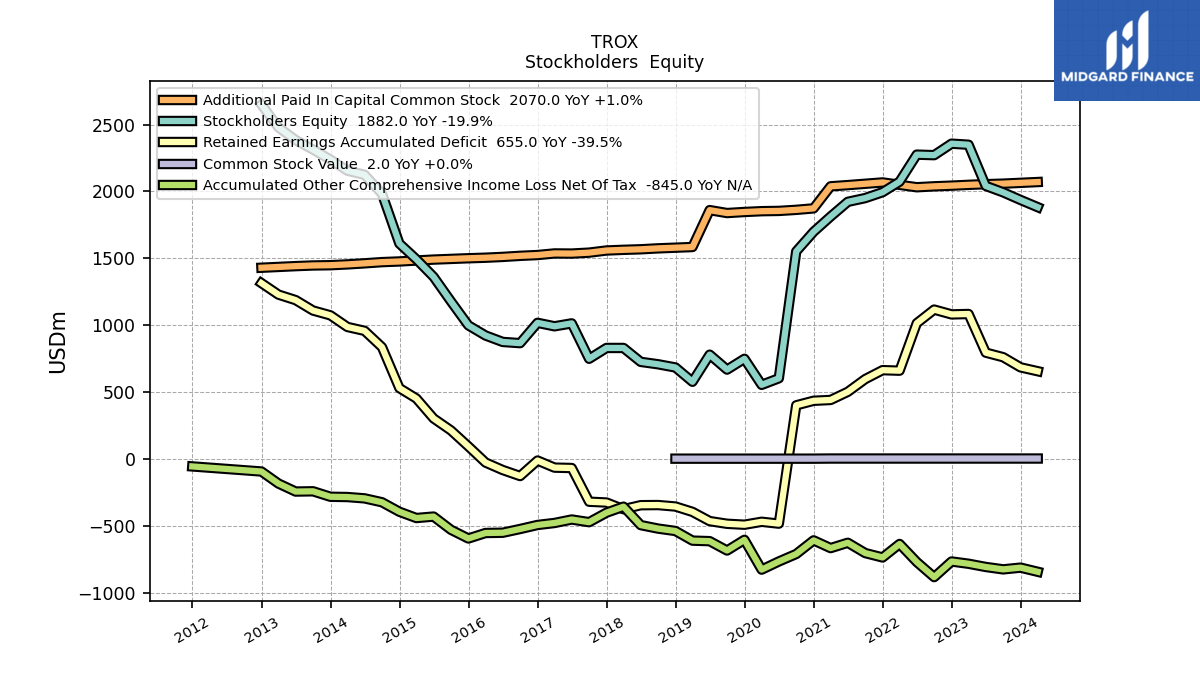
| Stockholders Equity | 1936.00 | 1993.00 | 2041.00 | 2349.00 | 2357.00 | 2271.00 | 2275.00 | 2073.00 | 1994.00 | 1950.00 | 1922.00 | 1812.00 | 1698.00 | 1551.00 | 602.00 | 553.00 | 748.00 | 667.00 | 779.00 | 576.00 | 683.00 | 707.00 | 725.00 | 829.00 | 829.00 | 748.00 | 1013.00 | 991.00 | 1017.00 | 865.00 | 874.00 | 922.00 | 998.00 | 1177.00 | 1361.00 | 1492.00 | 1610.00 | 1982.00 | 2124.00 | 2155.00 | 2238.00 | 2313.00 | 2384.00 | 2479.00 | 2649.00 | NA | NA | NA | NA | NA | NA | NA | NA | |
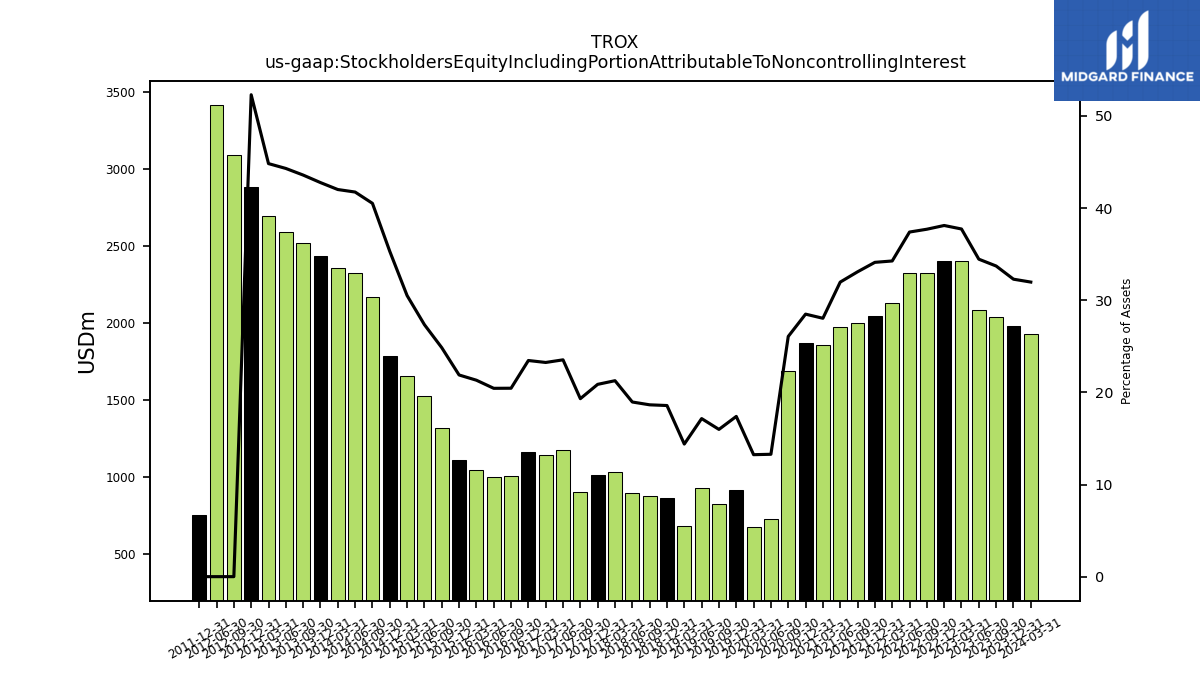
| Stockholders Equity Including Portion Attributable To Noncontrolling Interest | 1980.00 | 2036.00 | 2086.00 | 2399.00 | 2403.00 | 2322.00 | 2326.00 | 2129.00 | 2042.00 | 1999.00 | 1976.00 | 1857.00 | 1871.00 | 1688.00 | 728.00 | 679.00 | 916.00 | 824.00 | 929.00 | 680.00 | 862.00 | 879.00 | 897.00 | 1033.00 | 1015.00 | 906.00 | 1175.00 | 1144.00 | 1161.00 | 1007.00 | 1000.00 | 1046.00 | 1110.00 | 1316.00 | 1529.00 | 1658.00 | 1788.00 | 2166.00 | 2323.00 | 2355.00 | 2437.00 | 2521.00 | 2590.00 | 2696.00 | 2882.00 | 3088.00 | 3412.00 | NA | 752.00 | NA | NA | NA | NA | |
| Common Stock Value | 2.00 | 2.00 | 2.00 | 2.00 | 2.00 | 2.00 | 2.00 | 2.00 | 2.00 | 2.00 | 2.00 | 2.00 | 1.00 | 1.00 | 1.00 | 1.00 | 1.00 | 1.00 | 1.00 | 1.00 | 1.00 | NA | NA | NA | NA | NA | NA | NA | NA | NA | NA | NA | NA | NA | NA | NA | NA | NA | NA | NA | NA | NA | NA | NA | NA | NA | NA | NA | NA | NA | NA | NA | NA | |
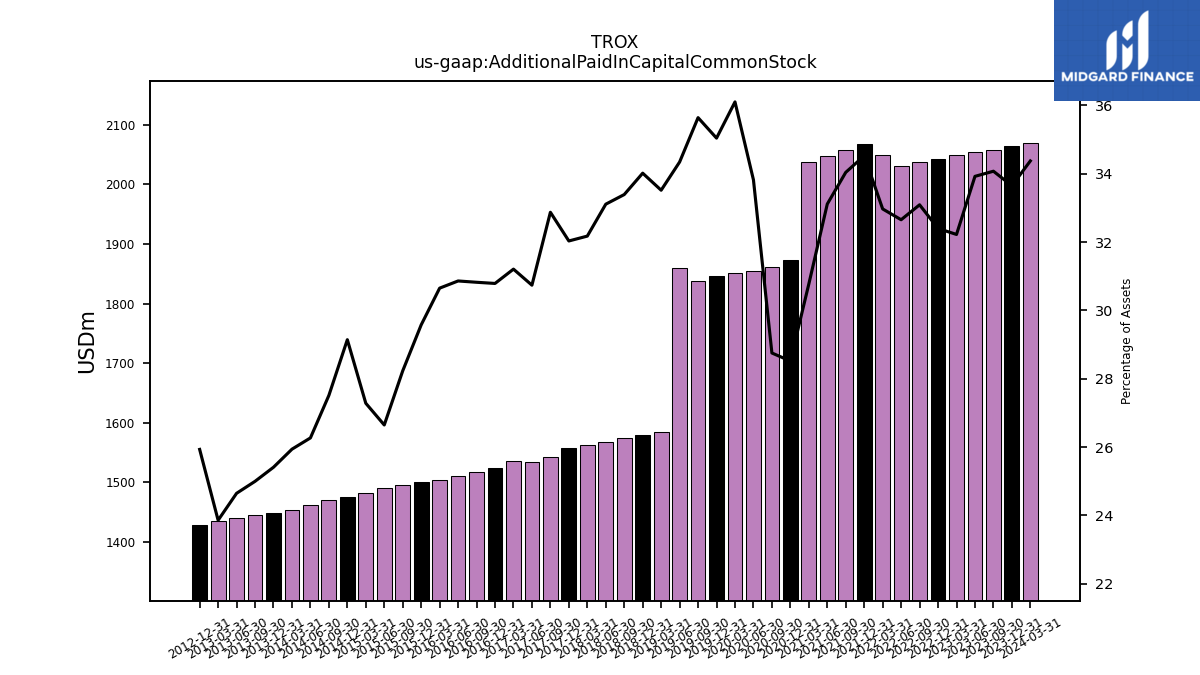
| Additional Paid In Capital Common Stock | 2064.00 | 2058.00 | 2054.00 | 2049.00 | 2043.00 | 2038.00 | 2031.00 | 2049.00 | 2067.00 | 2057.00 | 2047.00 | 2038.00 | 1873.00 | 1862.00 | 1854.00 | 1852.00 | 1846.00 | 1838.00 | 1860.00 | 1584.00 | 1579.00 | 1574.00 | 1567.00 | 1563.00 | 1558.00 | 1542.00 | 1535.00 | 1536.00 | 1524.00 | 1518.00 | 1510.00 | 1504.00 | 1500.00 | 1495.00 | 1490.00 | 1483.00 | 1476.00 | 1471.00 | 1462.00 | 1454.00 | 1448.00 | 1446.00 | 1441.00 | 1435.00 | 1429.00 | NA | NA | NA | NA | NA | NA | NA | NA | |
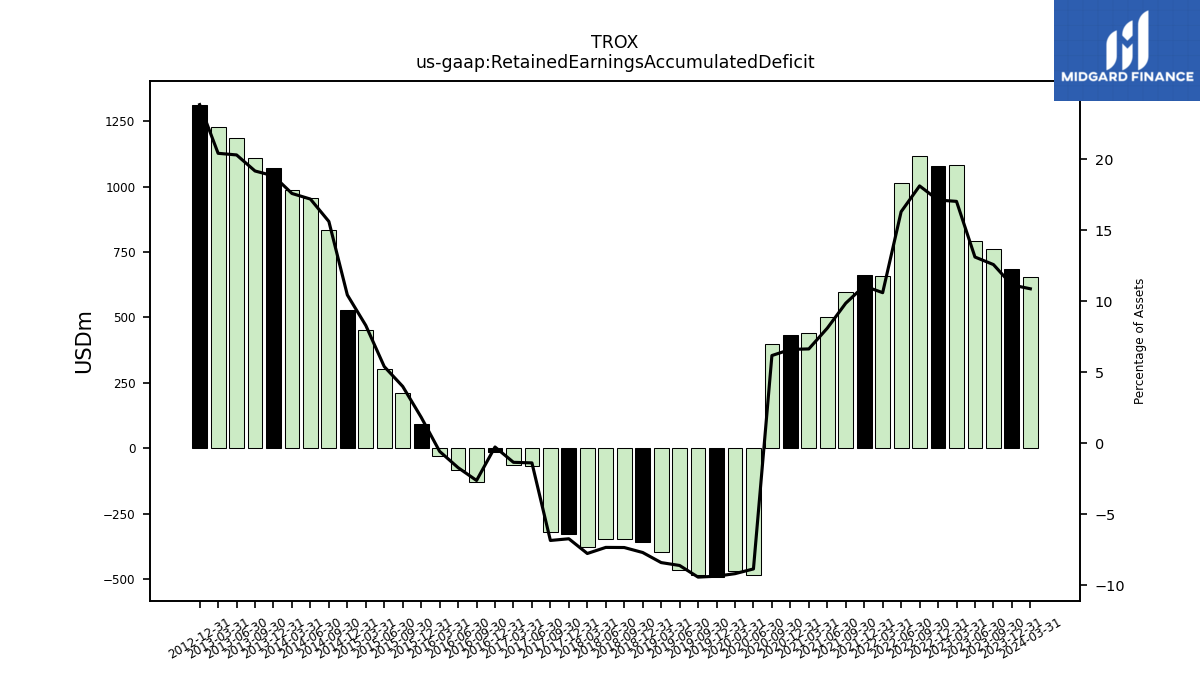
| Retained Earnings Accumulated Deficit | 684.00 | 760.00 | 794.00 | 1083.00 | 1080.00 | 1116.00 | 1014.00 | 659.00 | 663.00 | 596.00 | 501.00 | 440.00 | 434.00 | 400.00 | -485.00 | -471.00 | -493.00 | -486.00 | -466.00 | -397.00 | -357.00 | -346.00 | -347.00 | -377.00 | -327.00 | -321.00 | -69.00 | -66.00 | -13.00 | -129.00 | -84.00 | -28.00 | 93.00 | 212.00 | 302.00 | 451.00 | 529.00 | 835.00 | 957.00 | 986.00 | 1073.00 | 1109.00 | 1187.00 | 1228.00 | 1314.00 | NA | NA | NA | NA | NA | NA | NA | NA | |
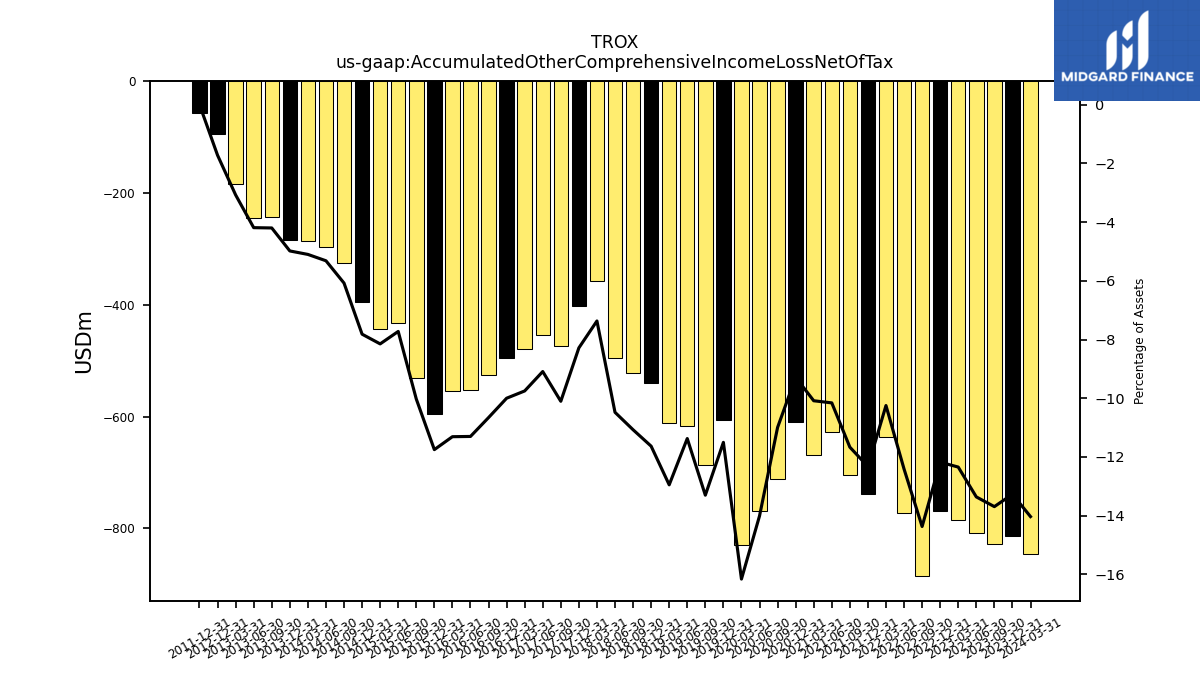
| Accumulated Other Comprehensive Income Loss Net Of Tax | -814.00 | -827.00 | -809.00 | -785.00 | -768.00 | -885.00 | -772.00 | -637.00 | -738.00 | -705.00 | -628.00 | -668.00 | -610.00 | -712.00 | -768.00 | -829.00 | -606.00 | -686.00 | -616.00 | -612.00 | -540.00 | -522.00 | -496.00 | -358.00 | -403.00 | -474.00 | -454.00 | -480.00 | -495.00 | -525.00 | -553.00 | -555.00 | -596.00 | -531.00 | -432.00 | -443.00 | -396.00 | -325.00 | -296.00 | -286.00 | -284.00 | -243.00 | -245.00 | -185.00 | -95.00 | NA | NA | NA | -57.00 | NA | NA | NA | NA | |
| Minority Interest | 44.00 | 43.00 | 45.00 | 50.00 | 46.00 | 51.00 | 51.00 | 56.00 | 48.00 | 49.00 | 54.00 | 45.00 | 173.00 | 137.00 | 126.00 | 126.00 | 168.00 | 157.00 | 150.00 | 104.00 | 179.00 | 172.00 | 172.00 | 204.00 | 186.00 | 158.00 | 162.00 | 153.00 | 144.00 | 142.00 | 126.00 | 124.00 | 112.00 | 139.00 | 168.00 | 166.00 | 178.00 | 184.00 | 199.00 | 200.00 | 199.00 | 208.00 | 206.00 | 217.00 | 233.00 | 303.40 | 301.90 | NA | 0.00 | NA | NA | NA | NA |
| 2023-12-31 | 2023-09-30 | 2023-06-30 | 2023-03-31 | 2022-12-31 | 2022-09-30 | 2022-06-30 | 2022-03-31 | 2021-12-31 | 2021-09-30 | 2021-06-30 | 2021-03-31 | 2020-12-31 | 2020-09-30 | 2020-06-30 | 2020-03-31 | 2019-12-31 | 2019-09-30 | 2019-06-30 | 2019-03-31 | 2018-12-31 | 2018-09-30 | 2018-06-30 | 2018-03-31 | 2017-12-31 | 2017-09-30 | 2017-06-30 | 2017-03-31 | 2016-12-31 | 2016-09-30 | 2016-06-30 | 2016-03-31 | 2015-12-31 | 2015-09-30 | 2015-06-30 | 2015-03-31 | 2014-12-31 | 2014-09-30 | 2014-06-30 | 2014-03-31 | 2013-12-31 | 2013-09-30 | 2013-06-30 | 2013-03-31 | 2012-12-31 | 2012-09-30 | 2012-06-30 | 2012-03-31 | 2011-12-31 | 2011-09-30 | 2011-06-30 | 2011-03-31 | 2011-01-31 | ||
|---|---|---|---|---|---|---|---|---|---|---|---|---|---|---|---|---|---|---|---|---|---|---|---|---|---|---|---|---|---|---|---|---|---|---|---|---|---|---|---|---|---|---|---|---|---|---|---|---|---|---|---|---|---|---|
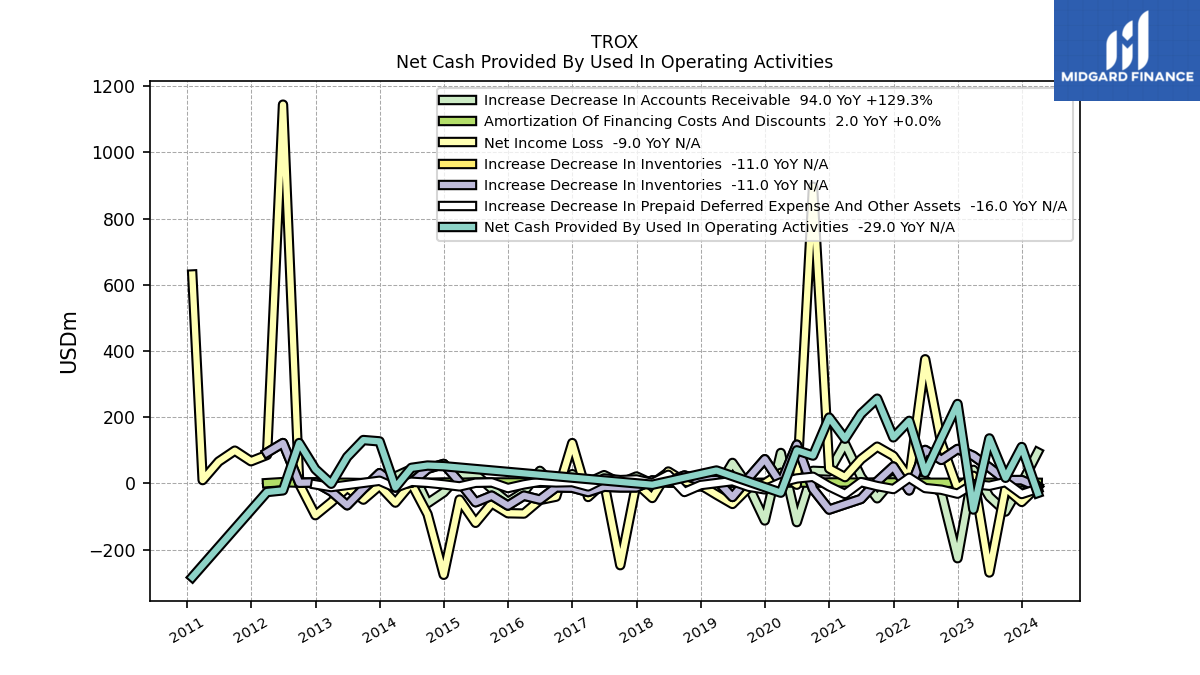
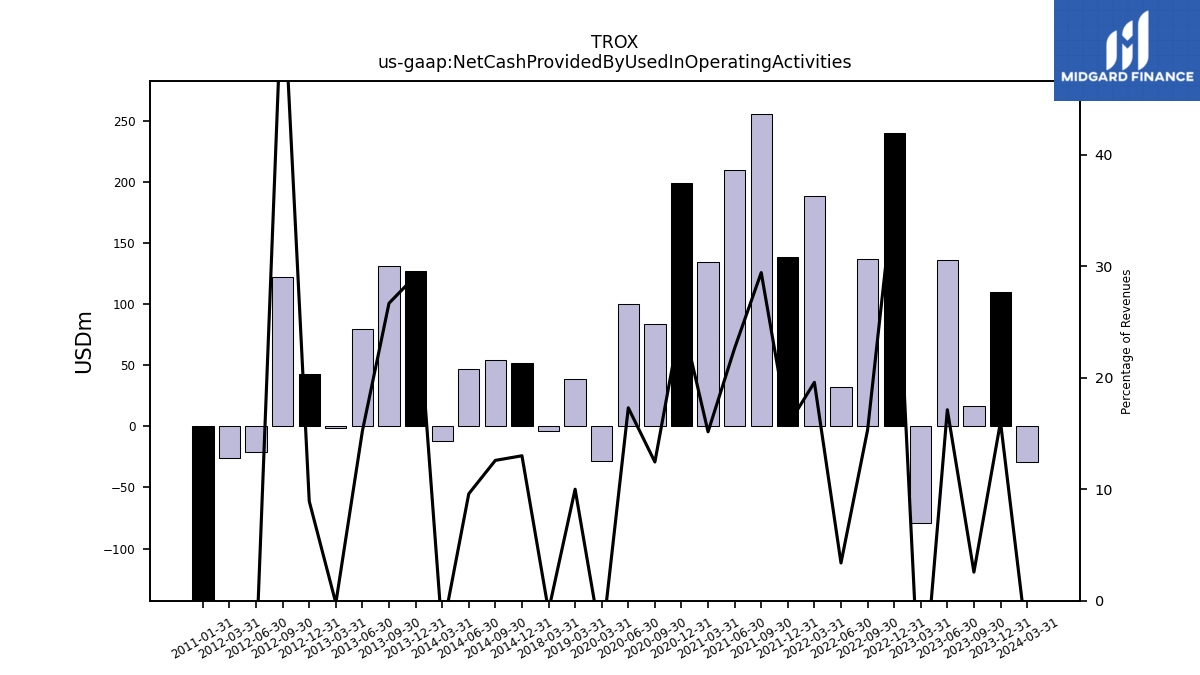
| Net Cash Provided By Used In Operating Activities | 110.00 | 17.00 | 136.00 | -79.00 | 240.00 | 137.00 | 32.00 | 189.00 | 139.00 | 256.00 | 210.00 | 135.00 | 199.00 | 84.00 | 100.00 | -28.00 | NA | NA | NA | 39.00 | NA | NA | NA | -4.00 | NA | NA | NA | NA | NA | NA | NA | NA | NA | NA | NA | NA | 52.00 | 54.00 | 47.00 | -12.00 | 127.00 | 131.00 | 80.00 | -1.00 | 43.00 | 122.00 | -21.00 | -26.00 | NA | NA | NA | NA | -283.00 | |
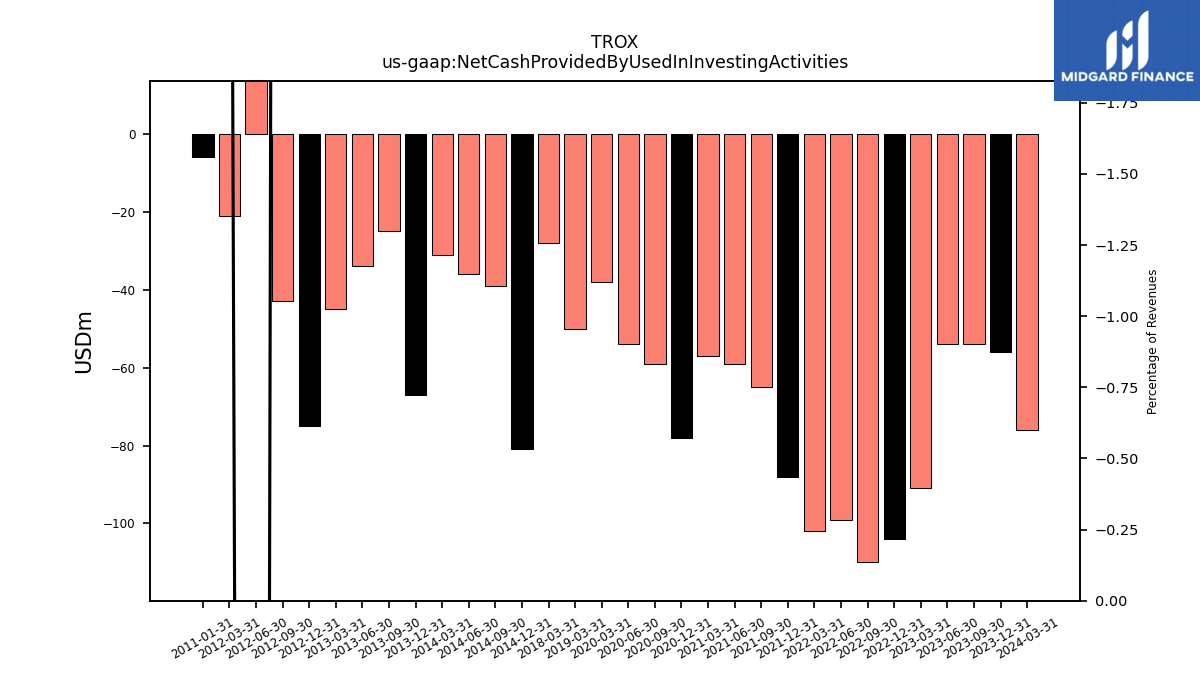
| Net Cash Provided By Used In Investing Activities | -56.00 | -54.00 | -54.00 | -91.00 | -104.00 | -110.00 | -99.00 | -102.00 | -88.00 | -65.00 | -59.00 | -57.00 | -78.00 | -59.00 | -54.00 | -38.00 | NA | NA | NA | -50.00 | NA | NA | NA | -28.00 | NA | NA | NA | NA | NA | NA | NA | NA | NA | NA | NA | NA | -81.00 | -39.00 | -36.00 | -31.00 | -67.00 | -25.00 | -34.00 | -45.00 | -75.00 | -43.00 | 87.00 | -21.00 | NA | NA | NA | NA | -6.00 | |
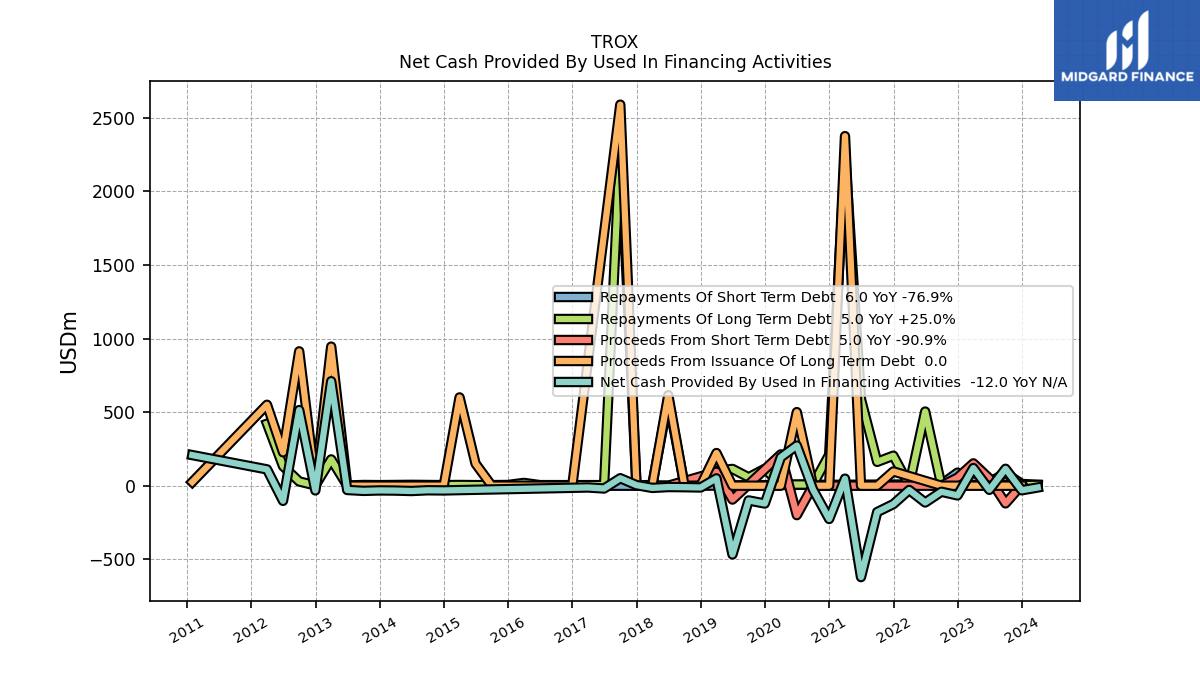
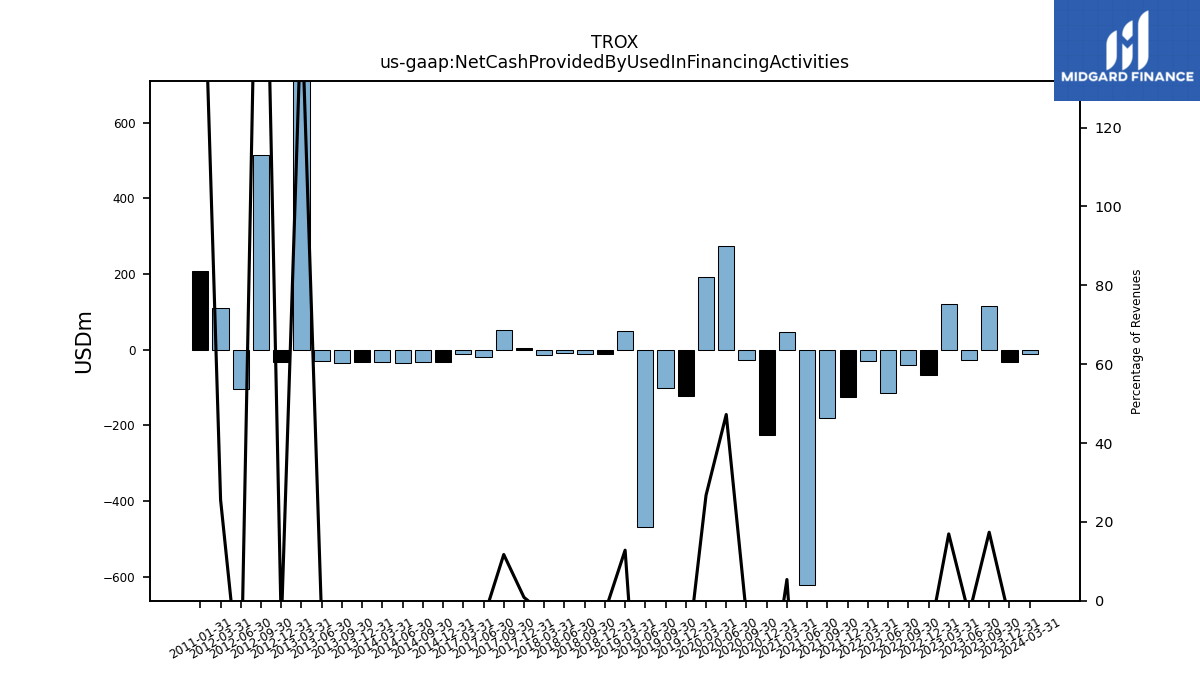
| Net Cash Provided By Used In Financing Activities | -31.00 | 115.00 | -28.00 | 120.00 | -66.00 | -41.00 | -114.00 | -29.00 | -125.00 | -179.00 | -621.00 | 48.00 | -226.00 | -26.00 | 273.00 | 193.00 | -121.00 | -100.00 | -467.00 | 50.00 | -12.00 | -10.00 | -9.00 | -15.00 | 4.00 | 51.00 | -19.00 | -12.00 | NA | NA | NA | NA | NA | NA | NA | NA | -32.00 | -31.00 | -36.00 | -33.00 | -32.00 | -35.00 | -29.00 | 710.00 | -32.00 | 514.00 | -103.00 | 111.00 | NA | NA | NA | NA | 208.00 |
| 2023-12-31 | 2023-09-30 | 2023-06-30 | 2023-03-31 | 2022-12-31 | 2022-09-30 | 2022-06-30 | 2022-03-31 | 2021-12-31 | 2021-09-30 | 2021-06-30 | 2021-03-31 | 2020-12-31 | 2020-09-30 | 2020-06-30 | 2020-03-31 | 2019-12-31 | 2019-09-30 | 2019-06-30 | 2019-03-31 | 2018-12-31 | 2018-09-30 | 2018-06-30 | 2018-03-31 | 2017-12-31 | 2017-09-30 | 2017-06-30 | 2017-03-31 | 2016-12-31 | 2016-09-30 | 2016-06-30 | 2016-03-31 | 2015-12-31 | 2015-09-30 | 2015-06-30 | 2015-03-31 | 2014-12-31 | 2014-09-30 | 2014-06-30 | 2014-03-31 | 2013-12-31 | 2013-09-30 | 2013-06-30 | 2013-03-31 | 2012-12-31 | 2012-09-30 | 2012-06-30 | 2012-03-31 | 2011-12-31 | 2011-09-30 | 2011-06-30 | 2011-03-31 | 2011-01-31 | ||
|---|---|---|---|---|---|---|---|---|---|---|---|---|---|---|---|---|---|---|---|---|---|---|---|---|---|---|---|---|---|---|---|---|---|---|---|---|---|---|---|---|---|---|---|---|---|---|---|---|---|---|---|---|---|---|
| Net Cash Provided By Used In Operating Activities | 110.00 | 17.00 | 136.00 | -79.00 | 240.00 | 137.00 | 32.00 | 189.00 | 139.00 | 256.00 | 210.00 | 135.00 | 199.00 | 84.00 | 100.00 | -28.00 | NA | NA | NA | 39.00 | NA | NA | NA | -4.00 | NA | NA | NA | NA | NA | NA | NA | NA | NA | NA | NA | NA | 52.00 | 54.00 | 47.00 | -12.00 | 127.00 | 131.00 | 80.00 | -1.00 | 43.00 | 122.00 | -21.00 | -26.00 | NA | NA | NA | NA | -283.00 | |
| Net Income Loss | -56.00 | -14.00 | -269.00 | 23.00 | -15.00 | 121.00 | 375.00 | 16.00 | 83.00 | 111.00 | 73.00 | 19.00 | 45.00 | 896.00 | -4.00 | 32.00 | 0.00 | -13.00 | -62.00 | -34.00 | -5.00 | 6.00 | 36.00 | -44.00 | 0.00 | -247.00 | 3.00 | -41.00 | 122.00 | -40.00 | -50.00 | -91.00 | -90.00 | -60.00 | -119.00 | -49.00 | -276.00 | -93.00 | 0.00 | -58.00 | -7.00 | -49.00 | -13.00 | -57.00 | -96.00 | -1.00 | 1144.00 | 86.00 | 67.00 | 99.00 | 66.00 | 10.00 | 631.00 | |
| Profit Loss | -56.00 | -14.00 | -269.00 | 25.00 | -14.00 | 123.00 | 375.00 | 16.00 | 87.00 | 113.00 | 77.00 | 26.00 | 57.00 | 902.00 | -4.00 | 40.00 | -5.00 | -6.00 | -56.00 | -30.00 | 6.00 | 15.00 | 50.00 | -41.00 | 2.00 | -241.00 | 5.00 | -38.00 | 124.00 | -42.00 | -48.00 | -92.00 | -89.00 | -54.00 | -118.00 | -46.00 | -275.00 | -90.00 | 2.00 | -54.00 | -3.00 | -41.00 | -1.00 | -45.00 | -96.00 | -1.00 | 1144.00 | 86.00 | NA | NA | NA | NA | 631.00 | |
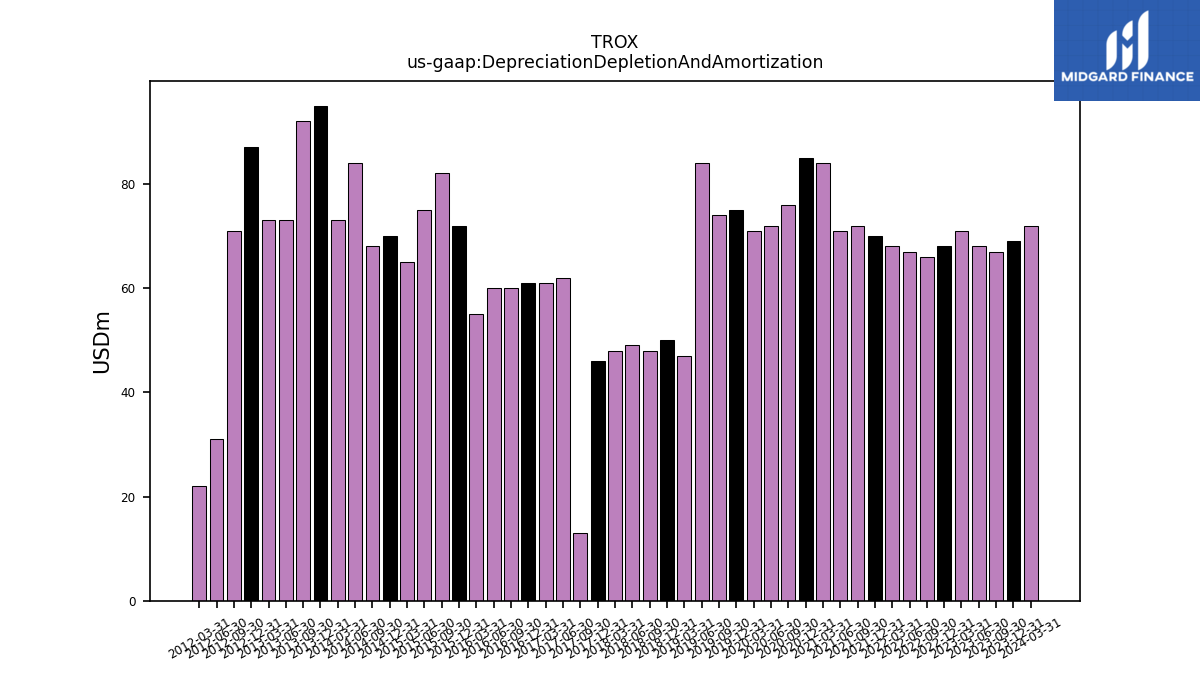
| Depreciation Depletion And Amortization | 69.00 | 67.00 | 68.00 | 71.00 | 68.00 | 66.00 | 67.00 | 68.00 | 70.00 | 72.00 | 71.00 | 84.00 | 85.00 | 76.00 | 72.00 | 71.00 | 75.00 | 74.00 | 84.00 | 47.00 | 50.00 | 48.00 | 49.00 | 48.00 | 46.00 | 13.00 | 62.00 | 61.00 | 61.00 | 60.00 | 60.00 | 55.00 | 72.00 | 82.00 | 75.00 | 65.00 | 70.00 | 68.00 | 84.00 | 73.00 | 95.00 | 92.00 | 73.00 | 73.00 | 87.00 | 71.00 | 31.00 | 22.00 | NA | NA | NA | NA | NA | |
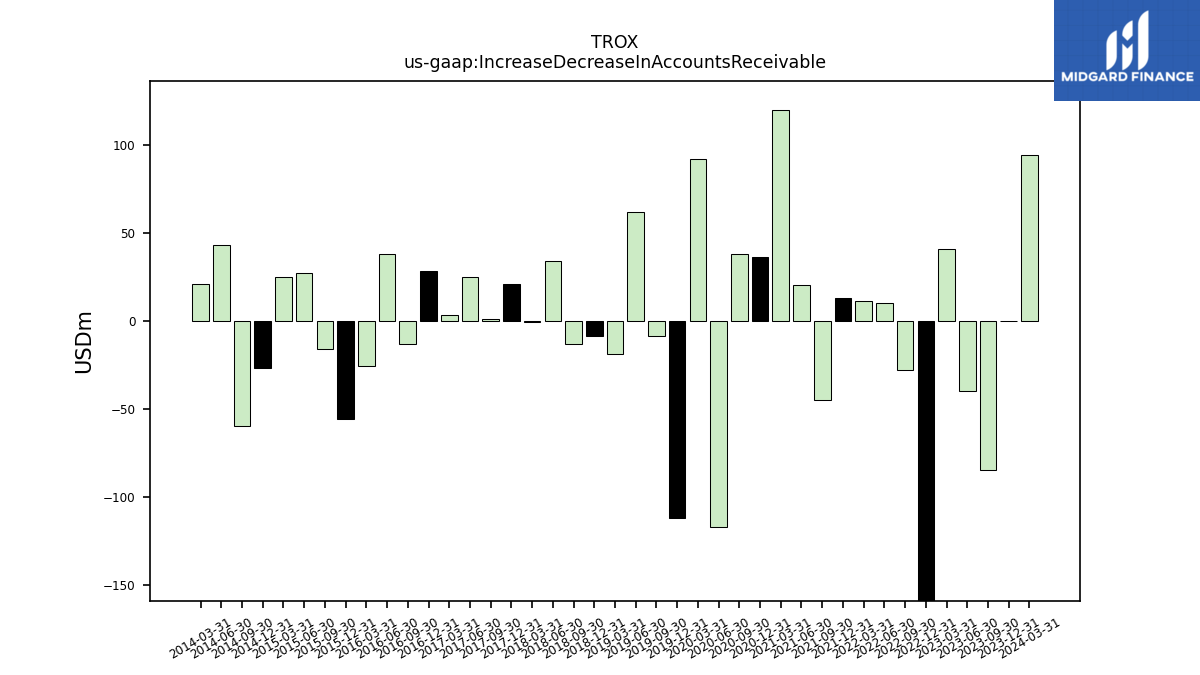
| Increase Decrease In Accounts Receivable | 0.00 | -85.00 | -40.00 | 41.00 | -226.00 | -28.00 | 10.00 | 11.00 | 13.00 | -45.00 | 20.00 | 120.00 | 36.00 | 38.00 | -117.00 | 92.00 | -112.00 | -9.00 | 62.00 | -19.00 | -9.00 | -13.00 | 34.00 | -1.00 | 21.00 | 1.00 | 25.00 | 3.00 | 28.00 | -13.00 | 38.00 | -26.00 | -56.00 | -16.00 | 27.00 | 25.00 | -27.00 | -60.00 | 43.00 | 21.00 | NA | NA | NA | NA | NA | NA | NA | NA | NA | NA | NA | NA | NA | |
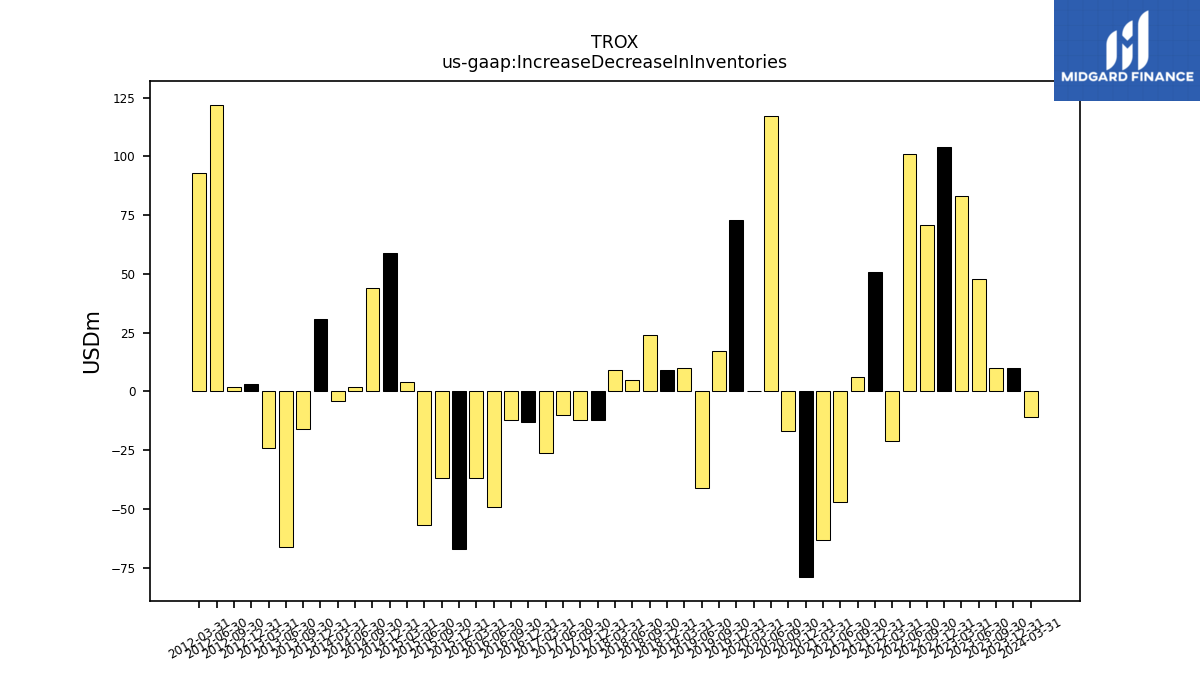
| Increase Decrease In Inventories | 10.00 | 10.00 | 48.00 | 83.00 | 104.00 | 71.00 | 101.00 | -21.00 | 51.00 | 6.00 | -47.00 | -63.00 | -79.00 | -17.00 | 117.00 | 0.00 | 73.00 | 17.00 | -41.00 | 10.00 | 9.00 | 24.00 | 5.00 | 9.00 | -12.00 | -12.00 | -10.00 | -26.00 | -13.00 | -12.00 | -49.00 | -37.00 | -67.00 | -37.00 | -57.00 | 4.00 | 59.00 | 44.00 | 2.00 | -4.00 | 31.00 | -16.00 | -66.00 | -24.00 | 3.00 | 2.00 | 122.00 | 93.00 | NA | NA | NA | NA | NA | |
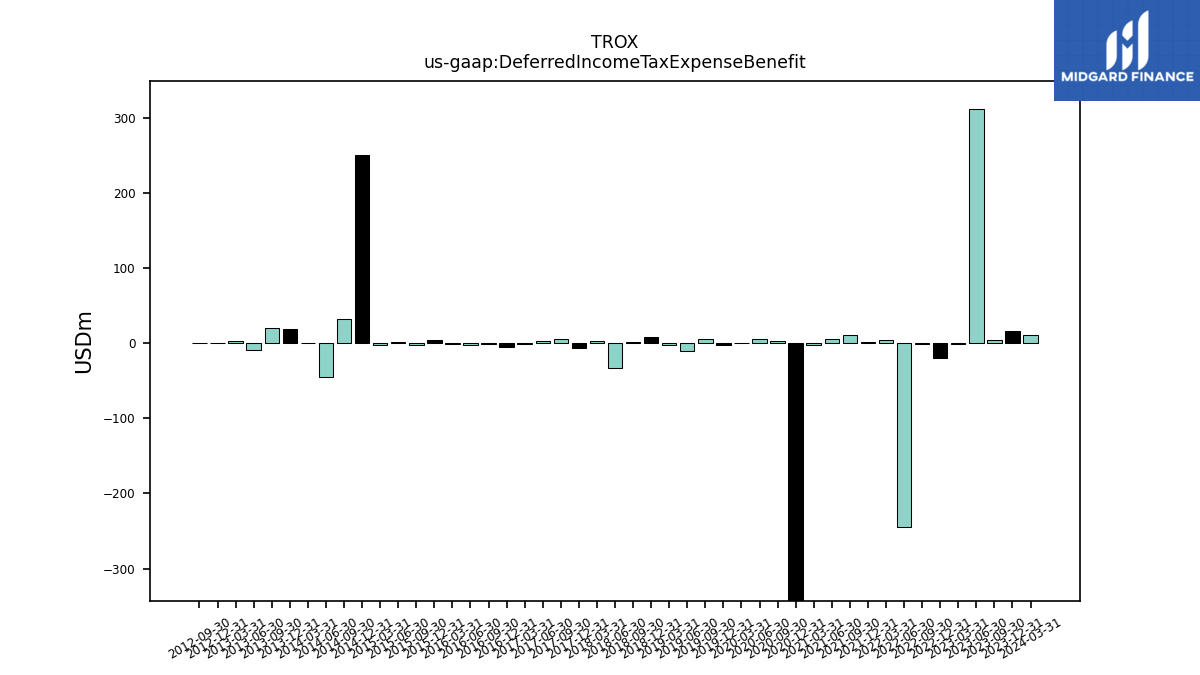
| Deferred Income Tax Expense Benefit | 16.00 | 4.00 | 311.00 | -1.00 | -20.00 | -1.00 | -244.00 | 4.00 | 2.00 | 11.00 | 5.00 | -3.00 | -908.00 | 3.00 | 6.00 | 0.00 | -2.00 | 6.00 | -10.00 | -3.00 | 8.00 | 1.00 | -33.00 | 3.00 | -6.00 | 6.00 | 3.00 | -1.00 | -5.00 | -1.00 | -2.00 | -1.00 | 4.00 | -2.00 | 1.00 | -3.00 | 250.00 | 32.00 | -45.00 | 0.00 | 19.00 | 20.00 | -9.00 | 3.00 | 0.20 | 0.00 | NA | NA | NA | NA | NA | NA | NA |
| 2023-12-31 | 2023-09-30 | 2023-06-30 | 2023-03-31 | 2022-12-31 | 2022-09-30 | 2022-06-30 | 2022-03-31 | 2021-12-31 | 2021-09-30 | 2021-06-30 | 2021-03-31 | 2020-12-31 | 2020-09-30 | 2020-06-30 | 2020-03-31 | 2019-12-31 | 2019-09-30 | 2019-06-30 | 2019-03-31 | 2018-12-31 | 2018-09-30 | 2018-06-30 | 2018-03-31 | 2017-12-31 | 2017-09-30 | 2017-06-30 | 2017-03-31 | 2016-12-31 | 2016-09-30 | 2016-06-30 | 2016-03-31 | 2015-12-31 | 2015-09-30 | 2015-06-30 | 2015-03-31 | 2014-12-31 | 2014-09-30 | 2014-06-30 | 2014-03-31 | 2013-12-31 | 2013-09-30 | 2013-06-30 | 2013-03-31 | 2012-12-31 | 2012-09-30 | 2012-06-30 | 2012-03-31 | 2011-12-31 | 2011-09-30 | 2011-06-30 | 2011-03-31 | 2011-01-31 | ||
|---|---|---|---|---|---|---|---|---|---|---|---|---|---|---|---|---|---|---|---|---|---|---|---|---|---|---|---|---|---|---|---|---|---|---|---|---|---|---|---|---|---|---|---|---|---|---|---|---|---|---|---|---|---|---|
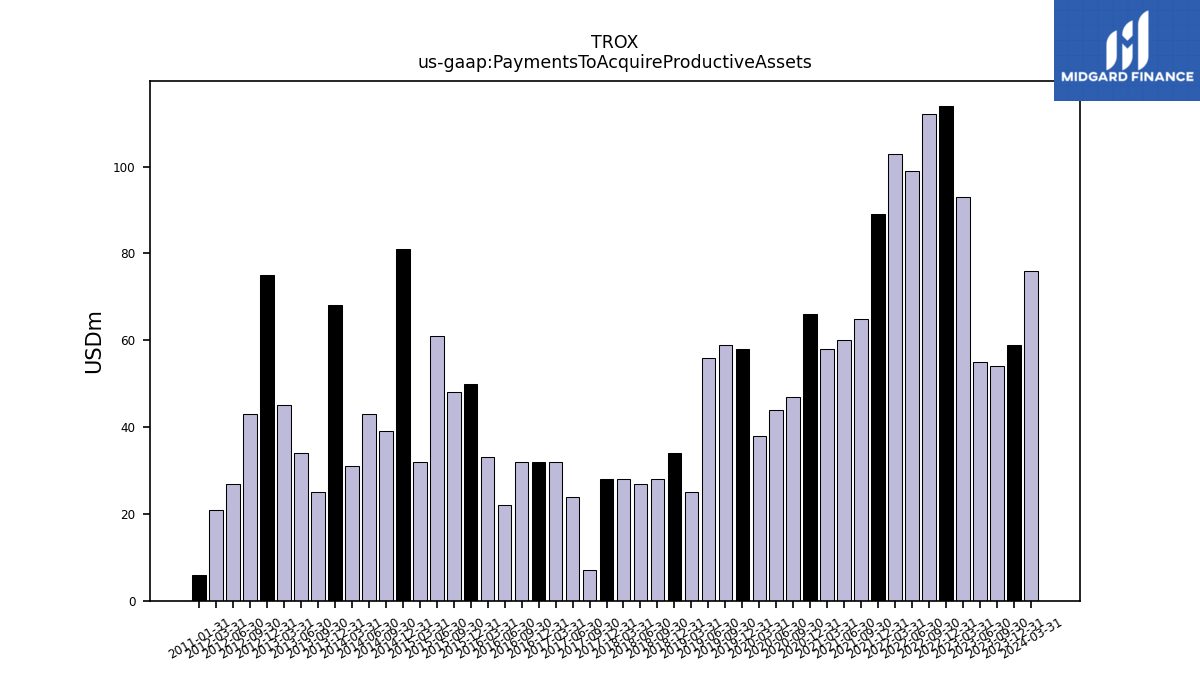
| Net Cash Provided By Used In Investing Activities | -56.00 | -54.00 | -54.00 | -91.00 | -104.00 | -110.00 | -99.00 | -102.00 | -88.00 | -65.00 | -59.00 | -57.00 | -78.00 | -59.00 | -54.00 | -38.00 | NA | NA | NA | -50.00 | NA | NA | NA | -28.00 | NA | NA | NA | NA | NA | NA | NA | NA | NA | NA | NA | NA | -81.00 | -39.00 | -36.00 | -31.00 | -67.00 | -25.00 | -34.00 | -45.00 | -75.00 | -43.00 | 87.00 | -21.00 | NA | NA | NA | NA | -6.00 | |
| Payments To Acquire Productive Assets | 59.00 | 54.00 | 55.00 | 93.00 | 114.00 | 112.00 | 99.00 | 103.00 | 89.00 | 65.00 | 60.00 | 58.00 | 66.00 | 47.00 | 44.00 | 38.00 | 58.00 | 59.00 | 56.00 | 25.00 | 34.00 | 28.00 | 27.00 | 28.00 | 28.00 | 7.00 | 24.00 | 32.00 | 32.00 | 32.00 | 22.00 | 33.00 | 50.00 | 48.00 | 61.00 | 32.00 | 81.00 | 39.00 | 43.00 | 31.00 | 68.00 | 25.00 | 34.00 | 45.00 | 75.00 | 43.00 | 27.00 | 21.00 | NA | NA | NA | NA | 6.00 |
| 2023-12-31 | 2023-09-30 | 2023-06-30 | 2023-03-31 | 2022-12-31 | 2022-09-30 | 2022-06-30 | 2022-03-31 | 2021-12-31 | 2021-09-30 | 2021-06-30 | 2021-03-31 | 2020-12-31 | 2020-09-30 | 2020-06-30 | 2020-03-31 | 2019-12-31 | 2019-09-30 | 2019-06-30 | 2019-03-31 | 2018-12-31 | 2018-09-30 | 2018-06-30 | 2018-03-31 | 2017-12-31 | 2017-09-30 | 2017-06-30 | 2017-03-31 | 2016-12-31 | 2016-09-30 | 2016-06-30 | 2016-03-31 | 2015-12-31 | 2015-09-30 | 2015-06-30 | 2015-03-31 | 2014-12-31 | 2014-09-30 | 2014-06-30 | 2014-03-31 | 2013-12-31 | 2013-09-30 | 2013-06-30 | 2013-03-31 | 2012-12-31 | 2012-09-30 | 2012-06-30 | 2012-03-31 | 2011-12-31 | 2011-09-30 | 2011-06-30 | 2011-03-31 | 2011-01-31 | ||
|---|---|---|---|---|---|---|---|---|---|---|---|---|---|---|---|---|---|---|---|---|---|---|---|---|---|---|---|---|---|---|---|---|---|---|---|---|---|---|---|---|---|---|---|---|---|---|---|---|---|---|---|---|---|---|
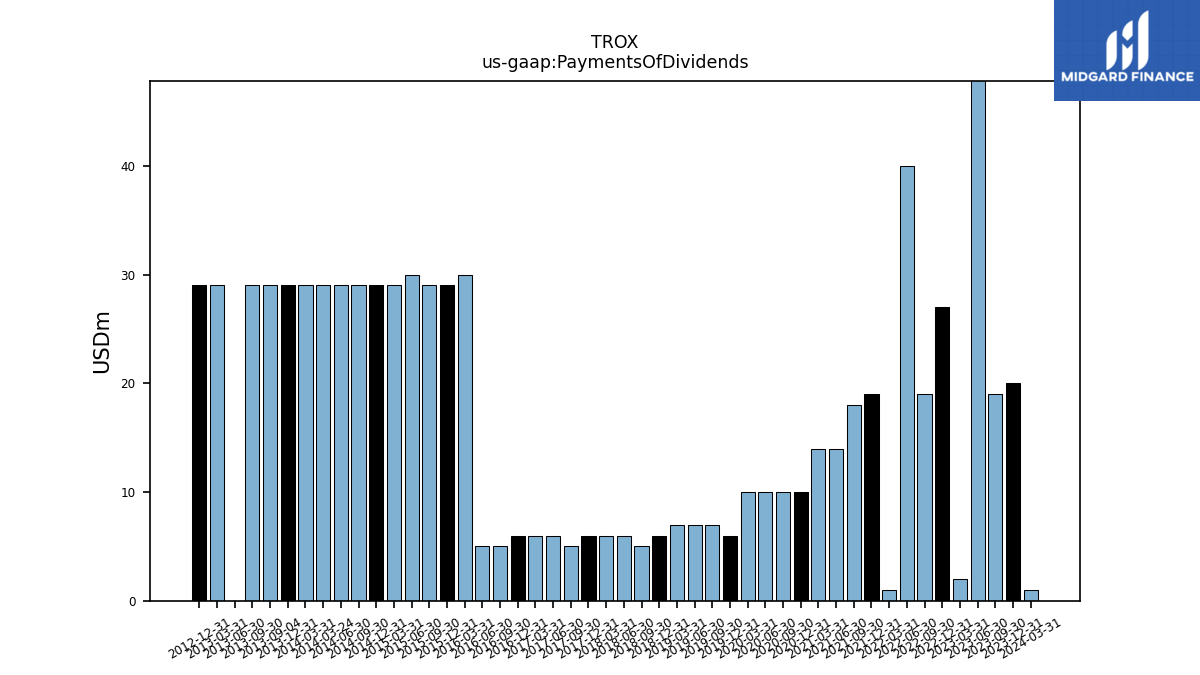
| Net Cash Provided By Used In Financing Activities | -31.00 | 115.00 | -28.00 | 120.00 | -66.00 | -41.00 | -114.00 | -29.00 | -125.00 | -179.00 | -621.00 | 48.00 | -226.00 | -26.00 | 273.00 | 193.00 | -121.00 | -100.00 | -467.00 | 50.00 | -12.00 | -10.00 | -9.00 | -15.00 | 4.00 | 51.00 | -19.00 | -12.00 | NA | NA | NA | NA | NA | NA | NA | NA | -32.00 | -31.00 | -36.00 | -33.00 | -32.00 | -35.00 | -29.00 | 710.00 | -32.00 | 514.00 | -103.00 | 111.00 | NA | NA | NA | NA | 208.00 | |
| Payments Of Dividends | 20.00 | 19.00 | 48.00 | 2.00 | 27.00 | 19.00 | 40.00 | 1.00 | 19.00 | 18.00 | 14.00 | 14.00 | 10.00 | 10.00 | 10.00 | 10.00 | 6.00 | 7.00 | 7.00 | 7.00 | 6.00 | 5.00 | 6.00 | 6.00 | 6.00 | 5.00 | 6.00 | 6.00 | 6.00 | 5.00 | 5.00 | 30.00 | 29.00 | 29.00 | 30.00 | 29.00 | 29.00 | 29.00 | 29.00 | 29.00 | 29.00 | 29.00 | 0.00 | 29.00 | 29.00 | NA | NA | NA | NA | NA | NA | NA | NA |
| 2023-12-31 | 2023-09-30 | 2023-06-30 | 2023-03-31 | 2022-12-31 | 2022-09-30 | 2022-06-30 | 2022-03-31 | 2021-12-31 | 2021-09-30 | 2021-06-30 | 2021-03-31 | 2020-12-31 | 2020-09-30 | 2020-06-30 | 2020-03-31 | 2019-12-31 | 2019-09-30 | 2019-06-30 | 2019-03-31 | 2018-12-31 | 2018-09-30 | 2018-06-30 | 2018-03-31 | 2017-12-31 | 2017-09-30 | 2017-06-30 | 2017-03-31 | 2016-12-31 | 2016-09-30 | 2016-06-30 | 2016-03-31 | 2015-12-31 | 2015-09-30 | 2015-06-30 | 2015-03-31 | 2014-12-31 | 2014-09-30 | 2014-06-30 | 2014-03-31 | 2013-12-31 | 2013-09-30 | 2013-06-30 | 2013-03-31 | 2012-12-31 | 2012-09-30 | 2012-06-30 | 2012-03-31 | 2011-12-31 | 2011-09-30 | 2011-06-30 | 2011-03-31 | 2011-01-31 | ||
|---|---|---|---|---|---|---|---|---|---|---|---|---|---|---|---|---|---|---|---|---|---|---|---|---|---|---|---|---|---|---|---|---|---|---|---|---|---|---|---|---|---|---|---|---|---|---|---|---|---|---|---|---|---|---|
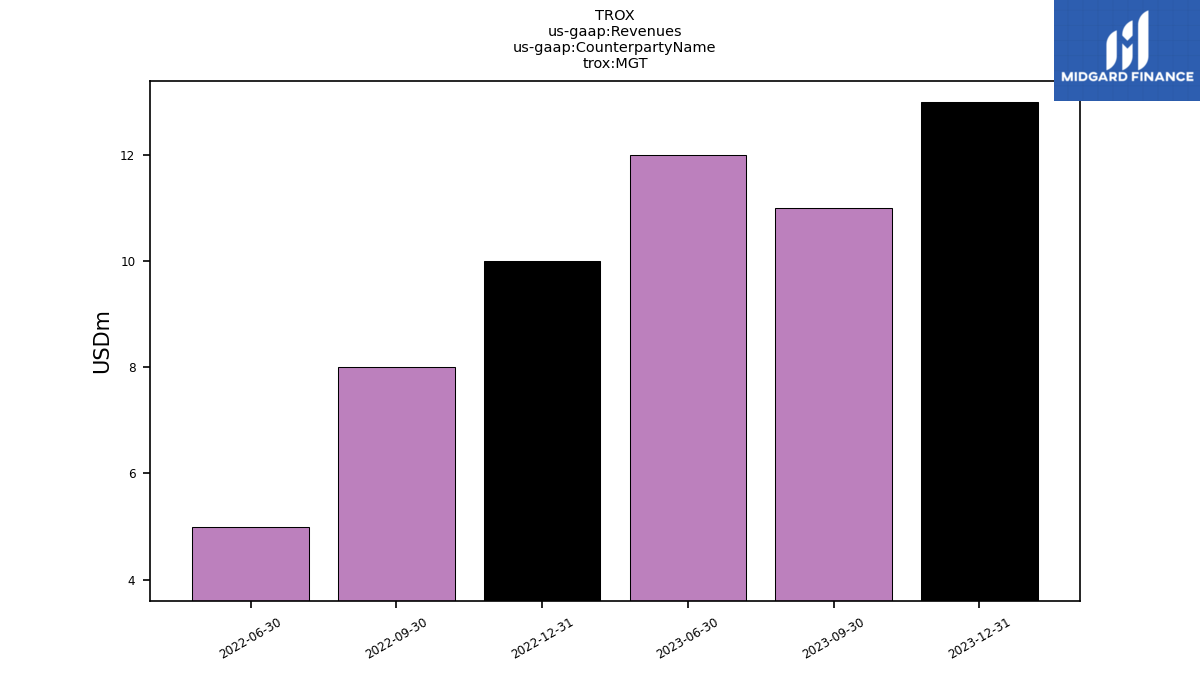
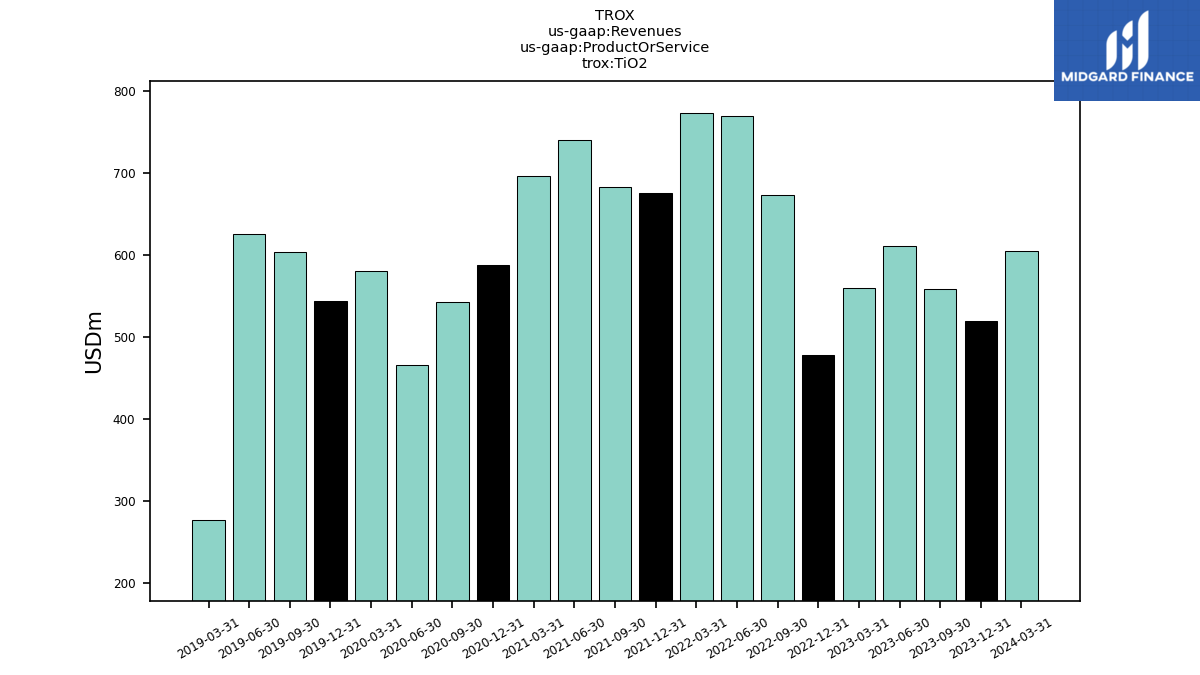
| Revenues | 686.00 | 662.00 | 794.00 | 708.00 | 649.00 | 895.00 | 945.00 | 965.00 | 884.00 | 870.00 | 927.00 | 891.00 | 783.00 | 675.00 | 578.00 | 722.00 | 693.00 | 768.00 | 791.00 | 390.00 | 429.00 | 456.00 | 492.00 | 442.00 | 464.00 | 435.00 | 421.00 | 378.00 | 548.00 | 533.00 | 537.00 | 475.00 | 535.00 | 575.00 | 617.00 | 385.00 | 400.00 | 429.00 | 490.00 | 418.00 | 436.00 | 491.00 | 525.00 | 470.00 | 482.00 | 216.10 | 429.00 | 434.00 | 383.00 | 465.00 | 428.00 | 267.00 | 108.00 | |
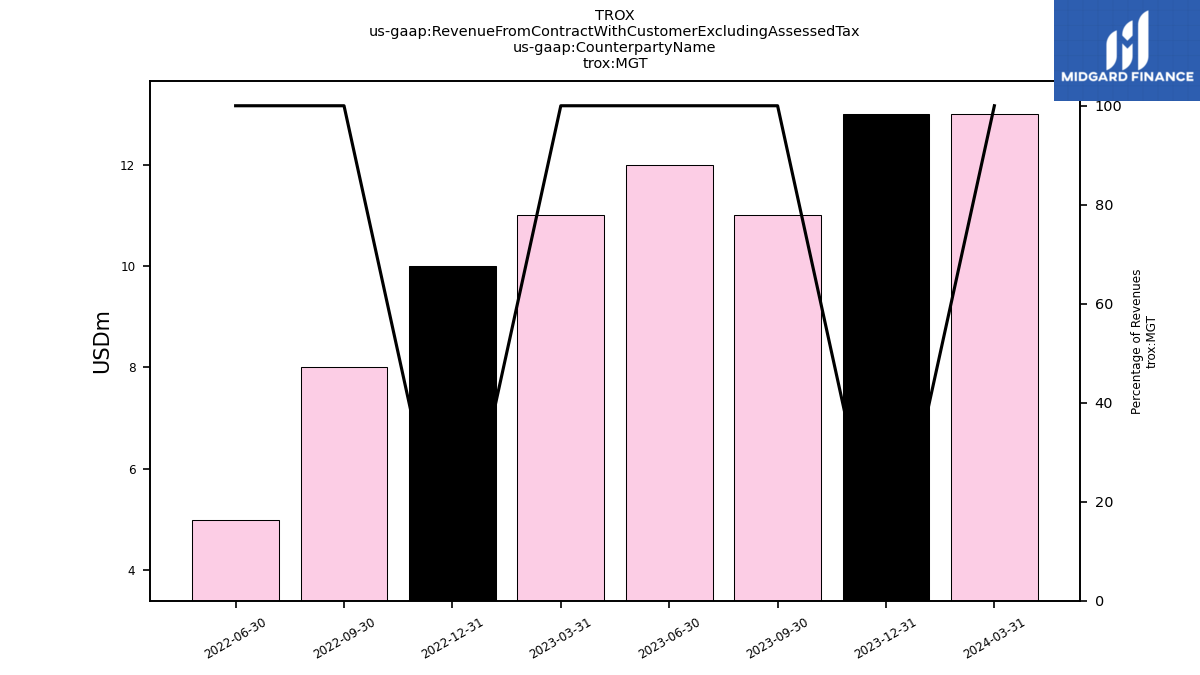
| MGT | 13.00 | 11.00 | 12.00 | NA | 10.00 | 8.00 | 5.00 | NA | NA | NA | NA | NA | NA | NA | NA | NA | NA | NA | NA | NA | NA | NA | NA | NA | NA | NA | NA | NA | NA | NA | NA | NA | NA | NA | NA | NA | NA | NA | NA | NA | NA | NA | NA | NA | NA | NA | NA | NA | NA | NA | NA | NA | NA | |
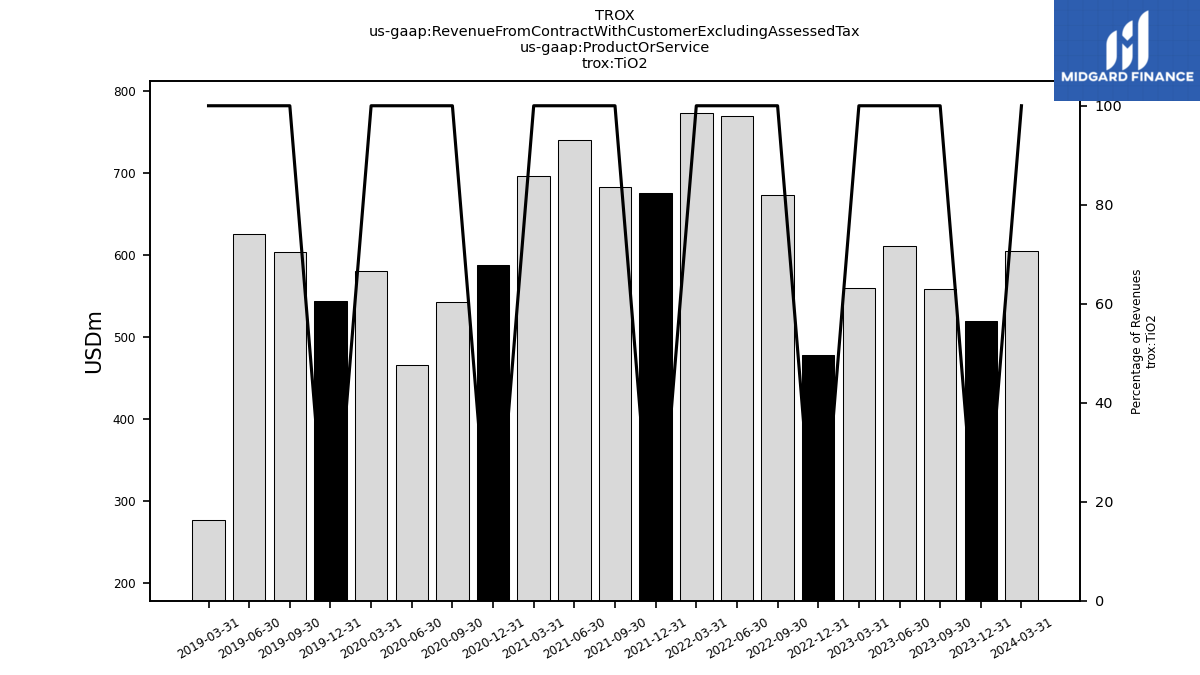
| Ti O2 | 519.00 | 558.00 | 611.00 | 560.00 | 478.00 | 673.00 | 769.00 | 773.00 | 675.00 | 682.00 | 740.00 | 696.00 | 587.00 | 543.00 | 466.00 | 580.00 | 544.00 | 603.00 | 625.00 | 277.00 | NA | NA | NA | NA | NA | NA | NA | NA | NA | NA | NA | NA | NA | NA | NA | NA | NA | NA | NA | NA | NA | NA | NA | NA | NA | NA | NA | NA | NA | NA | NA | NA | NA | |
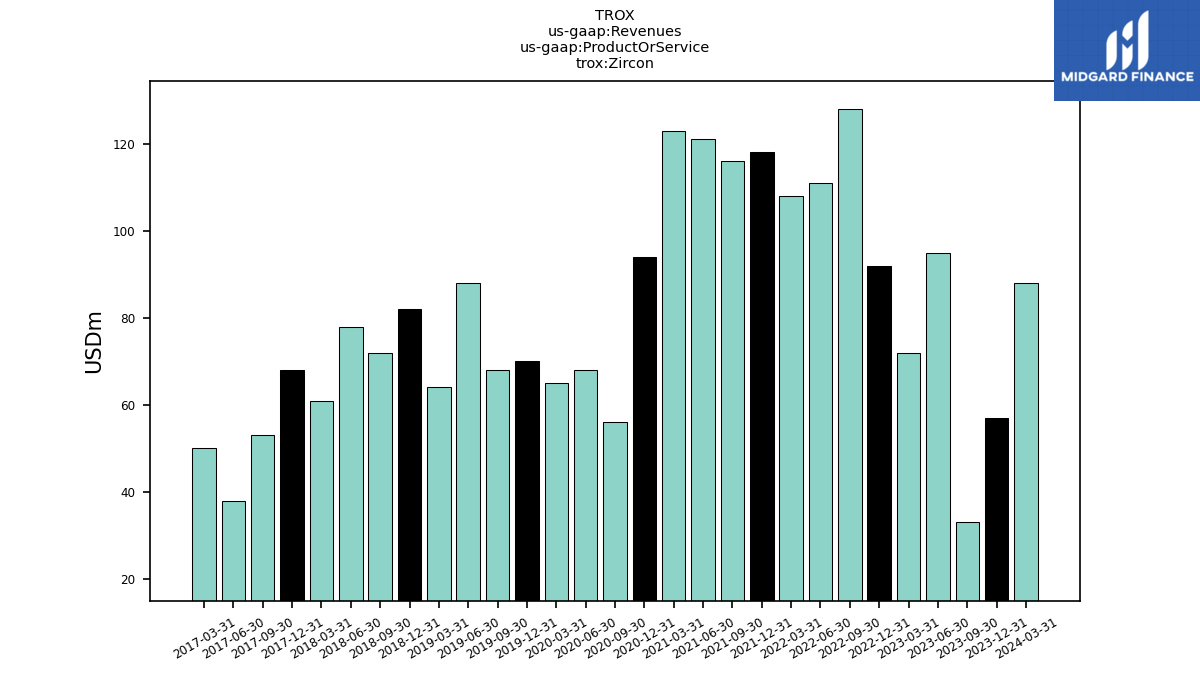
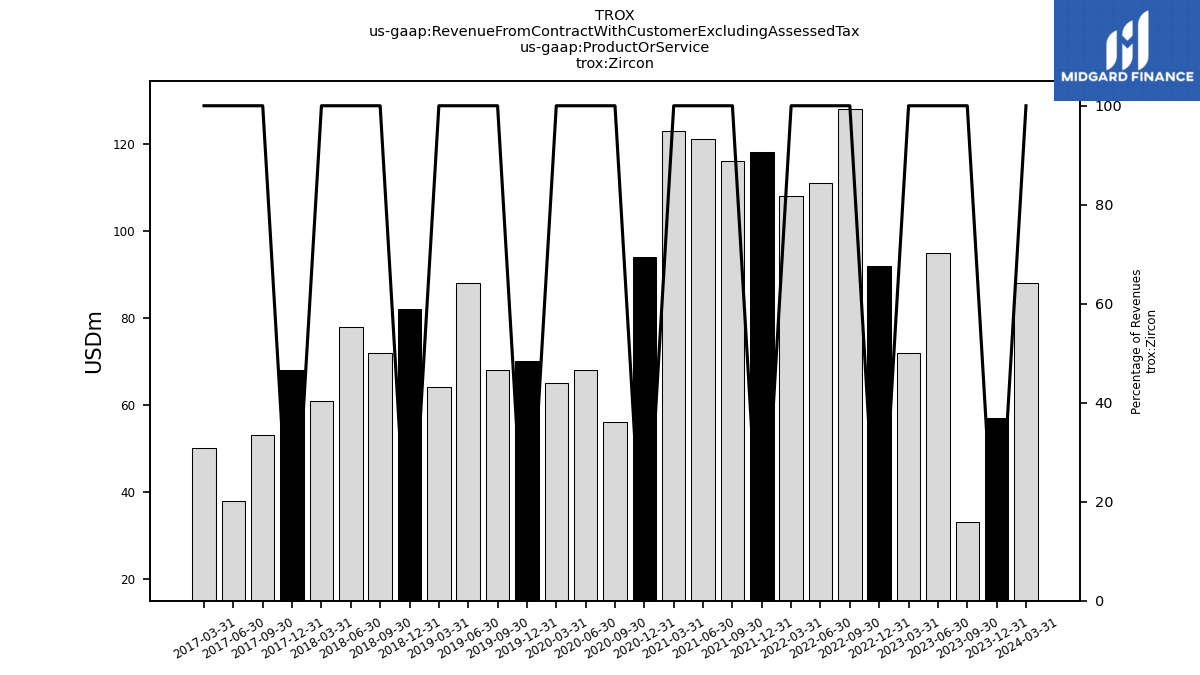
| Zircon | 57.00 | 33.00 | 95.00 | 72.00 | 92.00 | 128.00 | 111.00 | 108.00 | 118.00 | 116.00 | 121.00 | 123.00 | 94.00 | 56.00 | 68.00 | 65.00 | 70.00 | 68.00 | 88.00 | 64.00 | 82.00 | 72.00 | 78.00 | 61.00 | 68.00 | 53.00 | 38.00 | 50.00 | NA | NA | NA | NA | NA | NA | NA | NA | NA | NA | NA | NA | NA | NA | NA | NA | NA | NA | NA | NA | NA | NA | NA | NA | NA | |
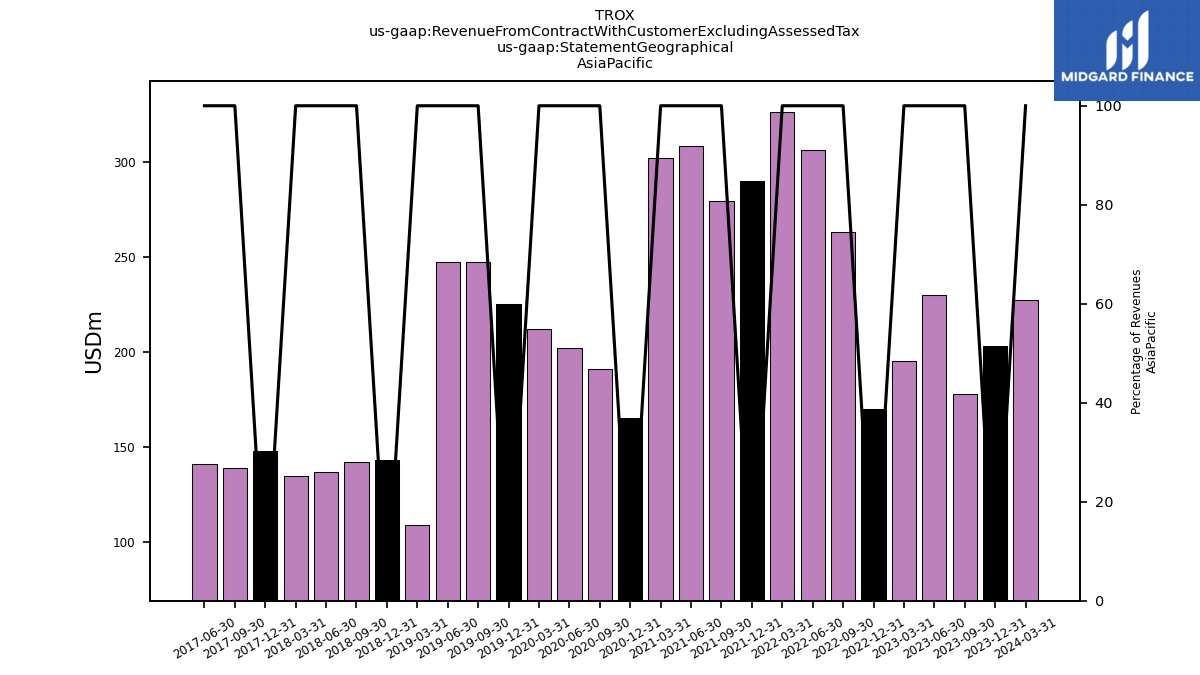
| 203.00 | 178.00 | 230.00 | 195.00 | 170.00 | 263.00 | 306.00 | 326.00 | 290.00 | 279.00 | 308.00 | 302.00 | 165.00 | 191.00 | 202.00 | 212.00 | 225.00 | 247.00 | 247.00 | 109.00 | 143.00 | 142.00 | 137.00 | 135.00 | 148.00 | 139.00 | 141.00 | NA | NA | NA | NA | NA | NA | NA | NA | NA | NA | NA | NA | NA | NA | NA | NA | NA | NA | NA | NA | NA | NA | NA | NA | NA | NA | ||
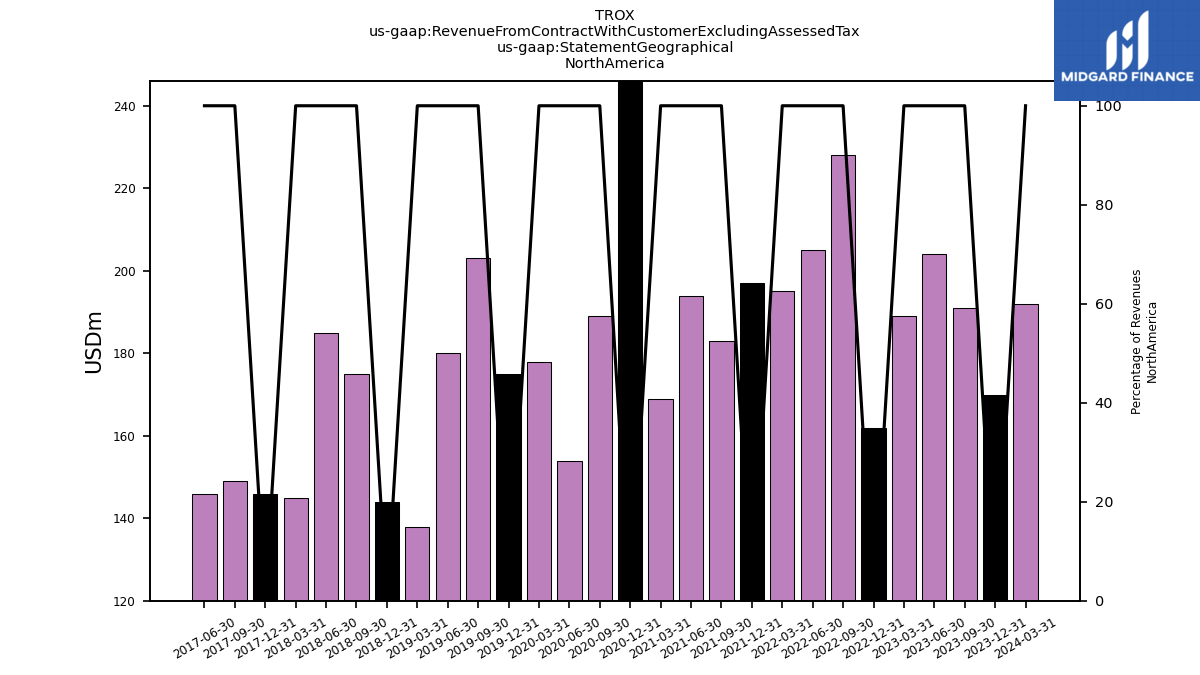
| 170.00 | 191.00 | 204.00 | 189.00 | 162.00 | 228.00 | 205.00 | 195.00 | 197.00 | 183.00 | 194.00 | 169.00 | 273.00 | 189.00 | 154.00 | 178.00 | 175.00 | 203.00 | 180.00 | 138.00 | 144.00 | 175.00 | 185.00 | 145.00 | 146.00 | 149.00 | 146.00 | NA | NA | NA | NA | NA | NA | NA | NA | NA | NA | NA | NA | NA | NA | NA | NA | NA | NA | NA | NA | NA | NA | NA | NA | NA | NA | ||
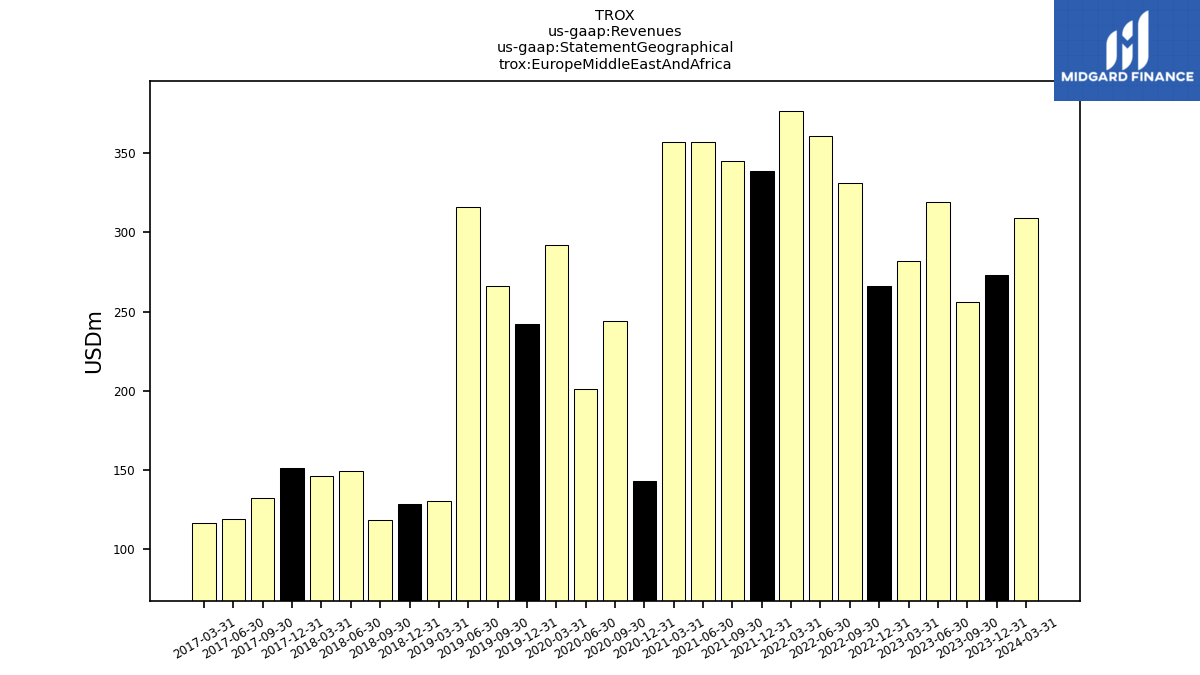
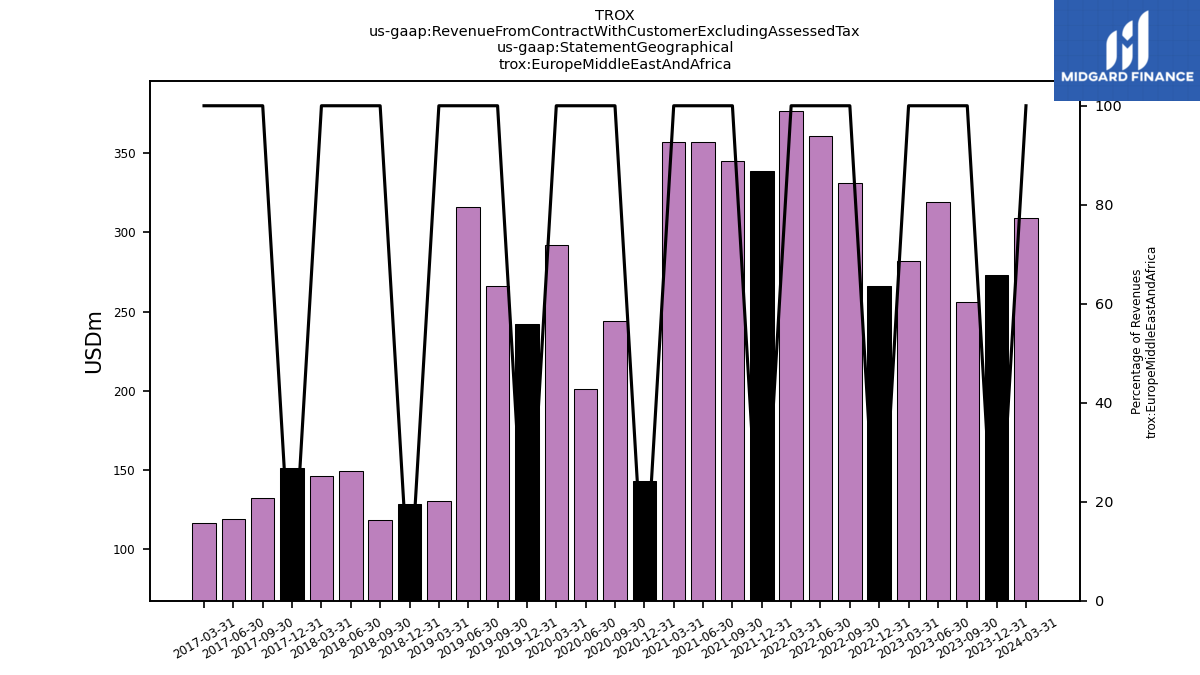
| Europe Middle East And Africa | 273.00 | 256.00 | 319.00 | 282.00 | 266.00 | 331.00 | 361.00 | 377.00 | 339.00 | 345.00 | 357.00 | 357.00 | 143.00 | 244.00 | 201.00 | 292.00 | 242.00 | 266.00 | 316.00 | 130.00 | 128.00 | 118.00 | 149.00 | 146.00 | 151.00 | 132.00 | 119.00 | 116.00 | NA | NA | NA | NA | NA | NA | NA | NA | NA | NA | NA | NA | NA | NA | NA | NA | NA | NA | NA | NA | NA | NA | NA | NA | NA | |
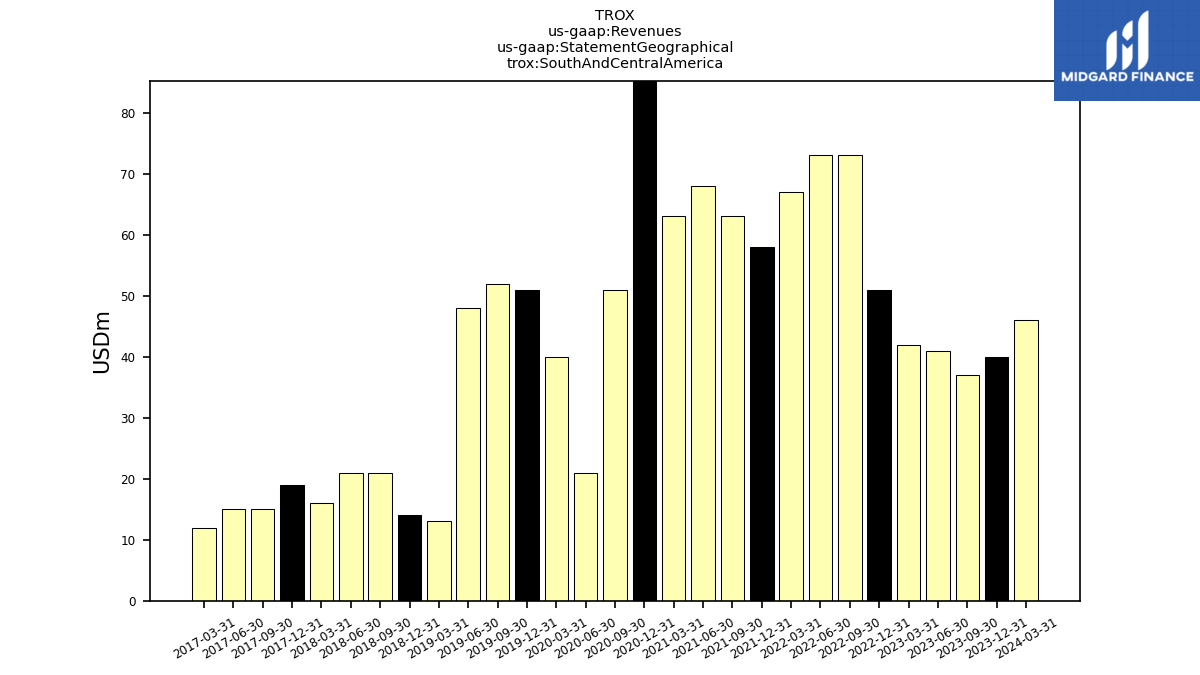
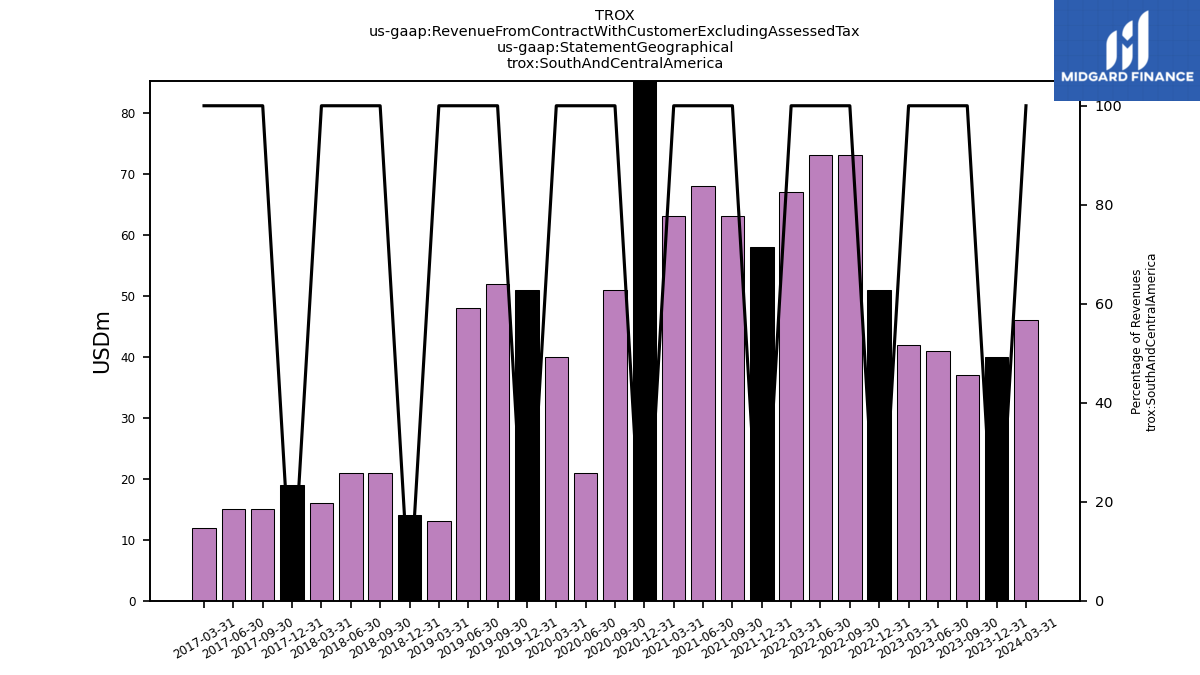
| South And Central America | 40.00 | 37.00 | 41.00 | 42.00 | 51.00 | 73.00 | 73.00 | 67.00 | 58.00 | 63.00 | 68.00 | 63.00 | 202.00 | 51.00 | 21.00 | 40.00 | 51.00 | 52.00 | 48.00 | 13.00 | 14.00 | 21.00 | 21.00 | 16.00 | 19.00 | 15.00 | 15.00 | 12.00 | NA | NA | NA | NA | NA | NA | NA | NA | NA | NA | NA | NA | NA | NA | NA | NA | NA | NA | NA | NA | NA | NA | NA | NA | NA | |
| Revenue From Contract With Customer Excluding Assessed Tax | 686.00 | 662.00 | 794.00 | 708.00 | 649.00 | 895.00 | 945.00 | 965.00 | 884.00 | 870.00 | 927.00 | 891.00 | 783.00 | 675.00 | 578.00 | 722.00 | 693.00 | 768.00 | 791.00 | 390.00 | 429.00 | 456.00 | 492.00 | 442.00 | 464.00 | 435.00 | 421.00 | 378.00 | 548.00 | 533.00 | 537.00 | 475.00 | 535.00 | 575.00 | 617.00 | 385.00 | 400.00 | 429.00 | 490.00 | 418.00 | 436.00 | 491.00 | 525.00 | 470.00 | 482.00 | 216.10 | 429.00 | 434.00 | 383.00 | 465.00 | 428.00 | 267.00 | 108.00 | |
| MGT | 13.00 | 11.00 | 12.00 | NA | 10.00 | 8.00 | 5.00 | NA | NA | NA | NA | NA | NA | NA | NA | NA | NA | NA | NA | NA | NA | NA | NA | NA | NA | NA | NA | NA | NA | NA | NA | NA | NA | NA | NA | NA | NA | NA | NA | NA | NA | NA | NA | NA | NA | NA | NA | NA | NA | NA | NA | NA | NA | |
| Ti O2 | 519.00 | 558.00 | 611.00 | 560.00 | 478.00 | 673.00 | 769.00 | 773.00 | 675.00 | 682.00 | 740.00 | 696.00 | 587.00 | 543.00 | 466.00 | 580.00 | 544.00 | 603.00 | 625.00 | 277.00 | NA | NA | NA | NA | NA | NA | NA | NA | NA | NA | NA | NA | NA | NA | NA | NA | NA | NA | NA | NA | NA | NA | NA | NA | NA | NA | NA | NA | NA | NA | NA | NA | NA | |
| Zircon | 57.00 | 33.00 | 95.00 | 72.00 | 92.00 | 128.00 | 111.00 | 108.00 | 118.00 | 116.00 | 121.00 | 123.00 | 94.00 | 56.00 | 68.00 | 65.00 | 70.00 | 68.00 | 88.00 | 64.00 | 82.00 | 72.00 | 78.00 | 61.00 | 68.00 | 53.00 | 38.00 | 50.00 | NA | NA | NA | NA | NA | NA | NA | NA | NA | NA | NA | NA | NA | NA | NA | NA | NA | NA | NA | NA | NA | NA | NA | NA | NA | |
| 203.00 | 178.00 | 230.00 | 195.00 | 170.00 | 263.00 | 306.00 | 326.00 | 290.00 | 279.00 | 308.00 | 302.00 | 165.00 | 191.00 | 202.00 | 212.00 | 225.00 | 247.00 | 247.00 | 109.00 | 143.00 | 142.00 | 137.00 | 135.00 | 148.00 | 139.00 | 141.00 | NA | NA | NA | NA | NA | NA | NA | NA | NA | NA | NA | NA | NA | NA | NA | NA | NA | NA | NA | NA | NA | NA | NA | NA | NA | NA | ||
| 170.00 | 191.00 | 204.00 | 189.00 | 162.00 | 228.00 | 205.00 | 195.00 | 197.00 | 183.00 | 194.00 | 169.00 | 273.00 | 189.00 | 154.00 | 178.00 | 175.00 | 203.00 | 180.00 | 138.00 | 144.00 | 175.00 | 185.00 | 145.00 | 146.00 | 149.00 | 146.00 | NA | NA | NA | NA | NA | NA | NA | NA | NA | NA | NA | NA | NA | NA | NA | NA | NA | NA | NA | NA | NA | NA | NA | NA | NA | NA | ||
| Europe Middle East And Africa | 273.00 | 256.00 | 319.00 | 282.00 | 266.00 | 331.00 | 361.00 | 377.00 | 339.00 | 345.00 | 357.00 | 357.00 | 143.00 | 244.00 | 201.00 | 292.00 | 242.00 | 266.00 | 316.00 | 130.00 | 128.00 | 118.00 | 149.00 | 146.00 | 151.00 | 132.00 | 119.00 | 116.00 | NA | NA | NA | NA | NA | NA | NA | NA | NA | NA | NA | NA | NA | NA | NA | NA | NA | NA | NA | NA | NA | NA | NA | NA | NA | |
| South And Central America | 40.00 | 37.00 | 41.00 | 42.00 | 51.00 | 73.00 | 73.00 | 67.00 | 58.00 | 63.00 | 68.00 | 63.00 | 202.00 | 51.00 | 21.00 | 40.00 | 51.00 | 52.00 | 48.00 | 13.00 | 14.00 | 21.00 | 21.00 | 16.00 | 19.00 | 15.00 | 15.00 | 12.00 | NA | NA | NA | NA | NA | NA | NA | NA | NA | NA | NA | NA | NA | NA | NA | NA | NA | NA | NA | NA | NA | NA | NA | NA | NA | |
| Interest Income Operating | 8.00 | 4.00 | 3.00 | 3.00 | 3.00 | 2.00 | 2.00 | 2.00 | 3.00 | 1.00 | 2.00 | 1.00 | 2.00 | 1.00 | 2.00 | 3.00 | 2.00 | 4.00 | 3.00 | 9.00 | 10.00 | 8.00 | 7.00 | 8.00 | 5.00 | 3.00 | 1.00 | 1.00 | NA | NA | NA | NA | NA | NA | NA | NA | NA | NA | NA | NA | NA | NA | NA | NA | NA | NA | NA | NA | NA | NA | NA | NA | NA |