
| 2023-09-30 | 2023-06-30 | 2023-03-31 | 2022-12-31 | 2022-09-30 | 2022-06-30 | 2022-03-31 | 2021-12-31 | 2021-09-30 | 2021-06-30 | 2021-03-31 | 2020-12-31 | 2020-09-30 | 2020-06-30 | 2020-03-31 | 2019-12-31 | 2019-09-30 | 2019-06-30 | 2019-03-31 | 2018-12-31 | 2018-09-30 | 2018-06-30 | 2018-03-31 | 2017-12-31 | 2017-09-30 | 2017-06-30 | 2017-03-31 | 2016-12-31 | 2016-09-30 | 2016-06-30 | 2016-03-31 | 2015-12-31 | 2015-09-30 | ||
|---|---|---|---|---|---|---|---|---|---|---|---|---|---|---|---|---|---|---|---|---|---|---|---|---|---|---|---|---|---|---|---|---|---|---|
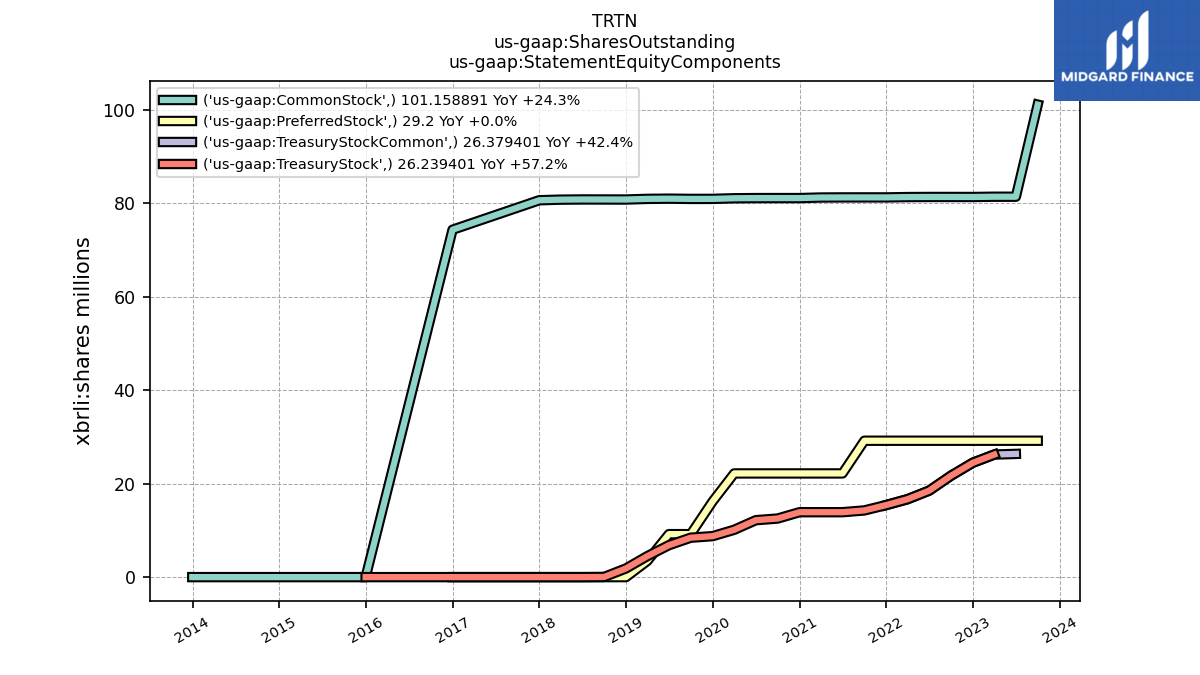
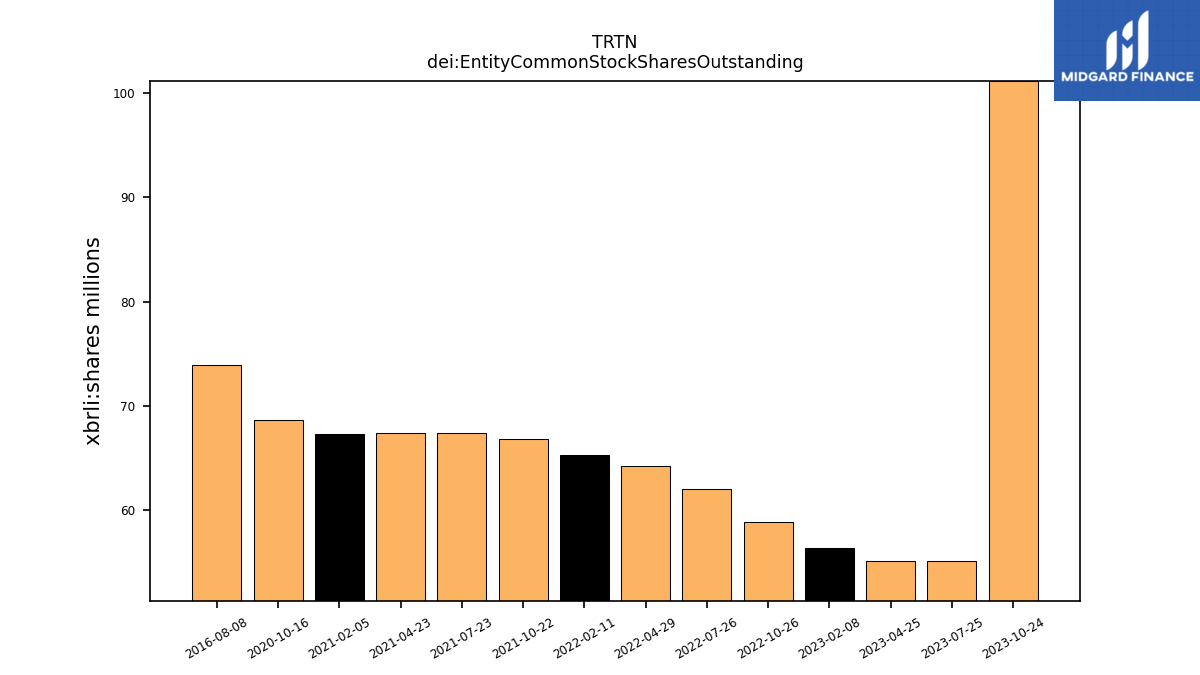
| dei: Entity Common Stock Shares Outstanding | NA | NA | NA | NA | NA | NA | NA | NA | NA | NA | NA | NA | NA | NA | NA | NA | NA | NA | NA | NA | NA | NA | NA | NA | NA | NA | NA | NA | NA | NA | NA | NA | NA | |
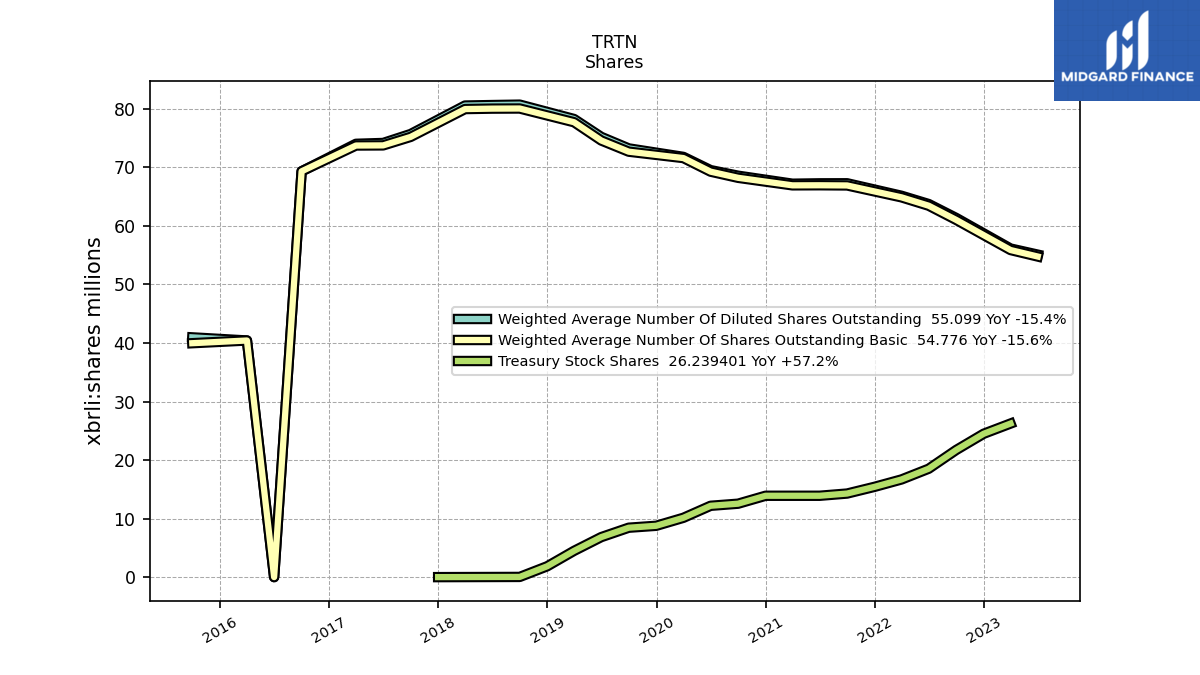
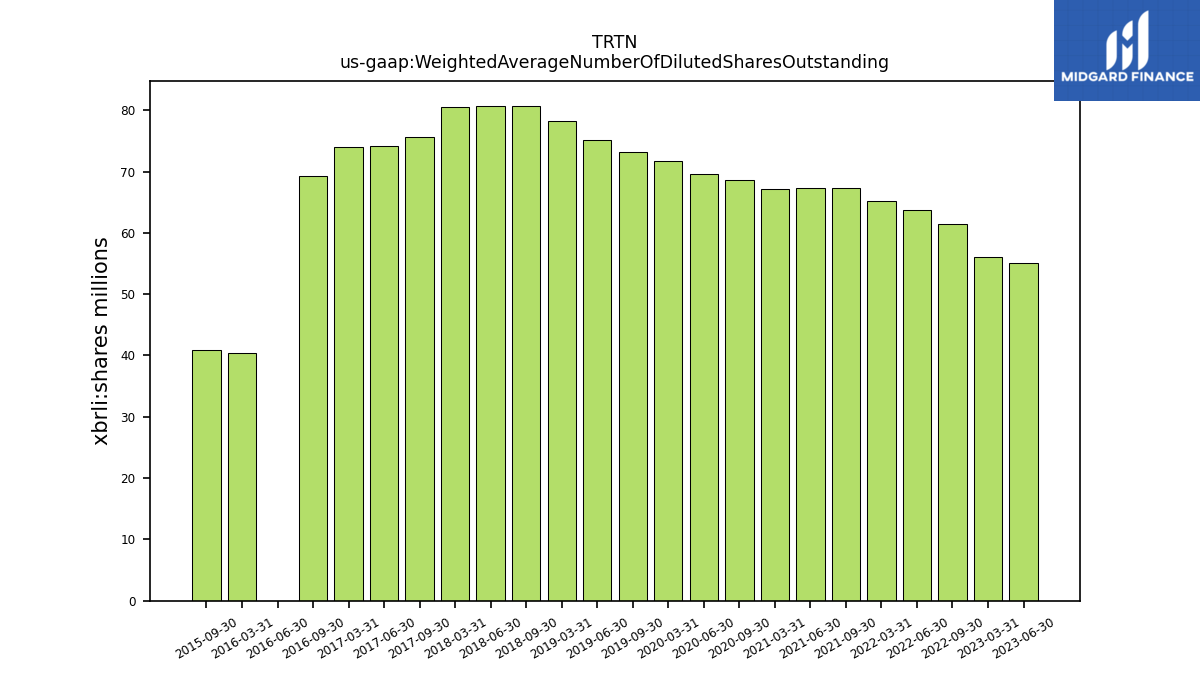
| Weighted Average Number Of Diluted Shares Outstanding | NA | 55.10 | 56.14 | NA | 61.36 | 63.74 | 65.15 | NA | 67.29 | 67.28 | 67.22 | NA | 68.58 | 69.54 | 71.80 | NA | 73.25 | 75.22 | 78.27 | NA | 80.73 | 80.66 | 80.57 | NA | 75.71 | 74.18 | 74.03 | NA | 69.34 | 0.00 | 40.43 | NA | 40.96 | |
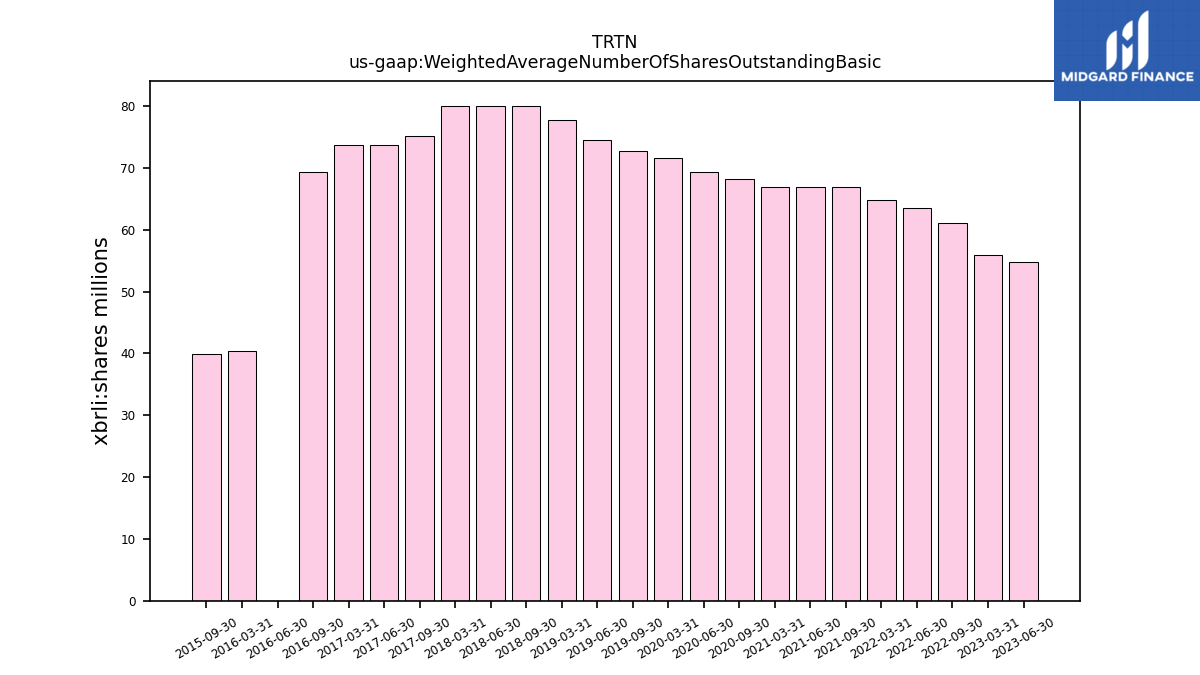
| Weighted Average Number Of Shares Outstanding Basic | NA | 54.78 | 55.88 | NA | 61.03 | 63.46 | 64.89 | NA | 66.92 | 66.95 | 66.94 | NA | 68.22 | 69.28 | 71.60 | NA | 72.69 | 74.60 | 77.72 | NA | 80.06 | 80.04 | 79.97 | NA | 75.21 | 73.76 | 73.74 | NA | 69.34 | 0.00 | 40.43 | NA | 39.97 | |
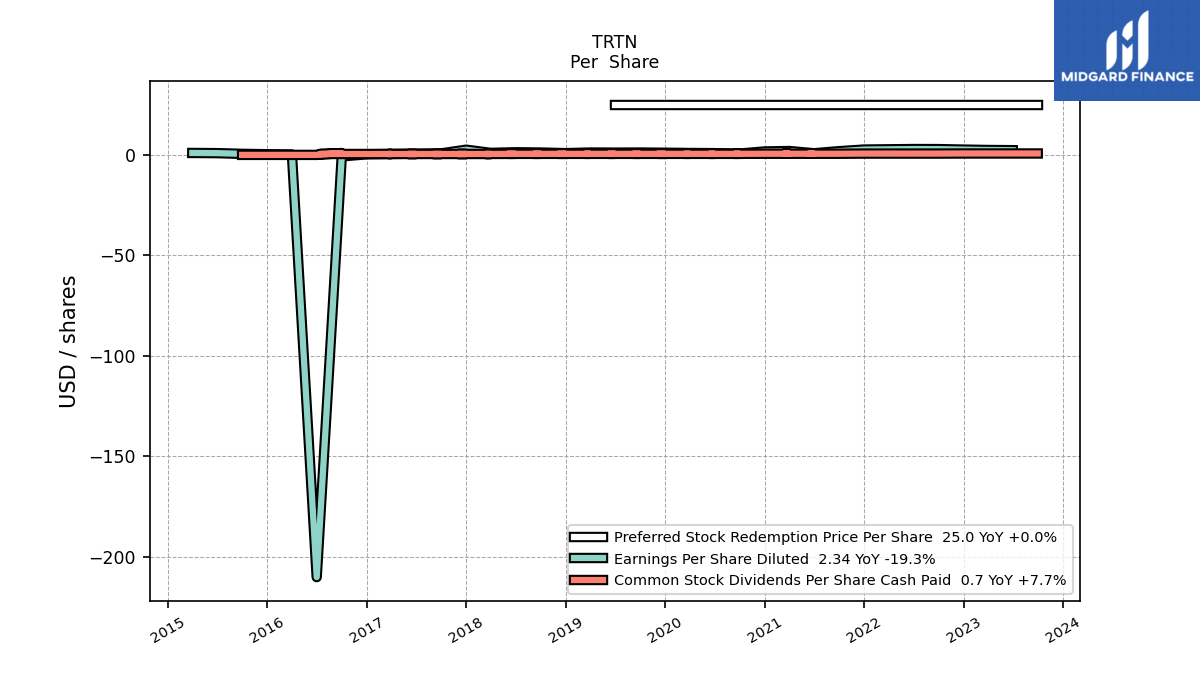
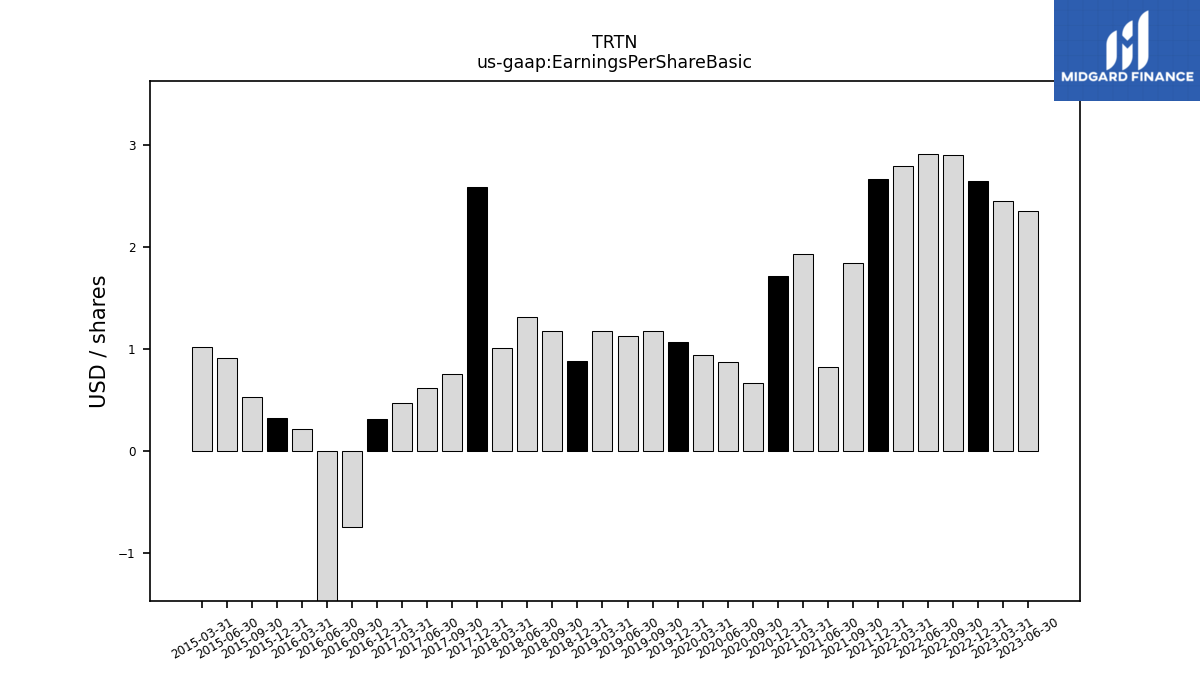
| Earnings Per Share Basic | NA | 2.35 | 2.45 | 2.65 | 2.90 | 2.91 | 2.79 | 2.67 | 1.84 | 0.82 | 1.93 | 1.72 | 0.67 | 0.87 | 0.94 | 1.07 | 1.18 | 1.13 | 1.18 | 0.88 | 1.18 | 1.31 | 1.01 | 2.59 | 0.76 | 0.62 | 0.47 | 0.31 | -0.74 | -210.00 | 0.22 | 0.32 | 0.53 | |
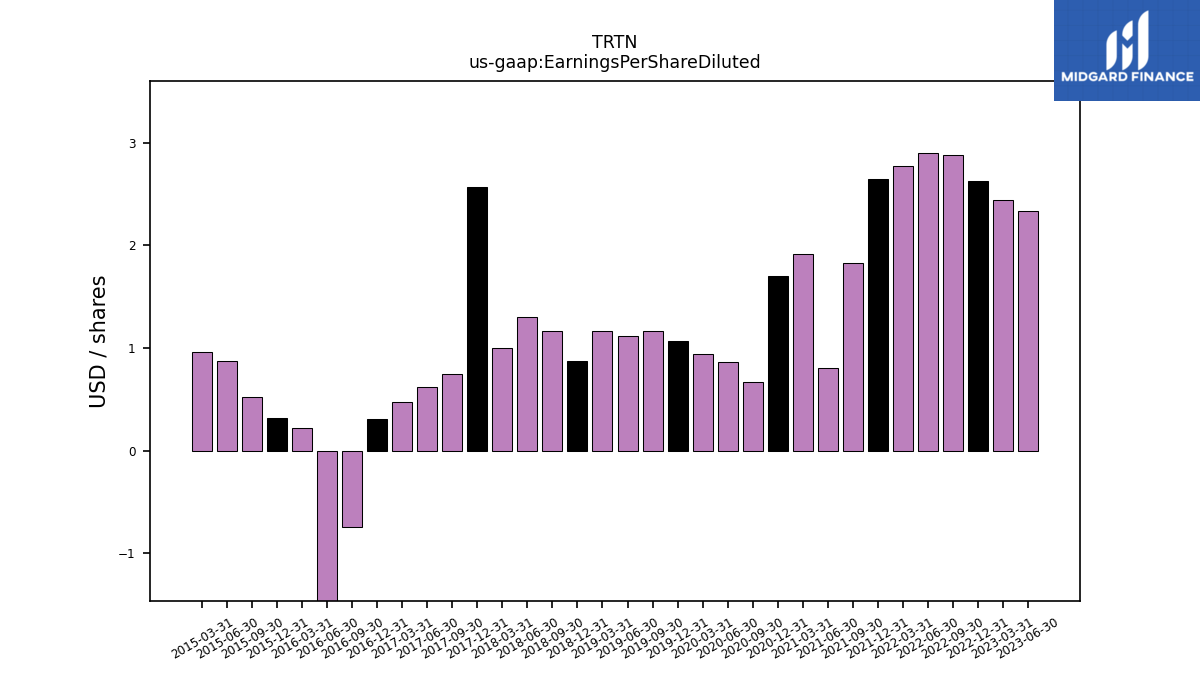
| Earnings Per Share Diluted | NA | 2.34 | 2.44 | 2.63 | 2.88 | 2.90 | 2.78 | 2.65 | 1.83 | 0.81 | 1.92 | 1.70 | 0.67 | 0.86 | 0.94 | 1.07 | 1.17 | 1.12 | 1.17 | 0.87 | 1.17 | 1.30 | 1.00 | 2.57 | 0.75 | 0.62 | 0.47 | 0.31 | -0.74 | -210.00 | 0.22 | 0.32 | 0.52 |
| 2023-09-30 | 2023-06-30 | 2023-03-31 | 2022-12-31 | 2022-09-30 | 2022-06-30 | 2022-03-31 | 2021-12-31 | 2021-09-30 | 2021-06-30 | 2021-03-31 | 2020-12-31 | 2020-09-30 | 2020-06-30 | 2020-03-31 | 2019-12-31 | 2019-09-30 | 2019-06-30 | 2019-03-31 | 2018-12-31 | 2018-09-30 | 2018-06-30 | 2018-03-31 | 2017-12-31 | 2017-09-30 | 2017-06-30 | 2017-03-31 | 2016-12-31 | 2016-09-30 | 2016-06-30 | 2016-03-31 | 2015-12-31 | 2015-09-30 | ||
|---|---|---|---|---|---|---|---|---|---|---|---|---|---|---|---|---|---|---|---|---|---|---|---|---|---|---|---|---|---|---|---|---|---|---|
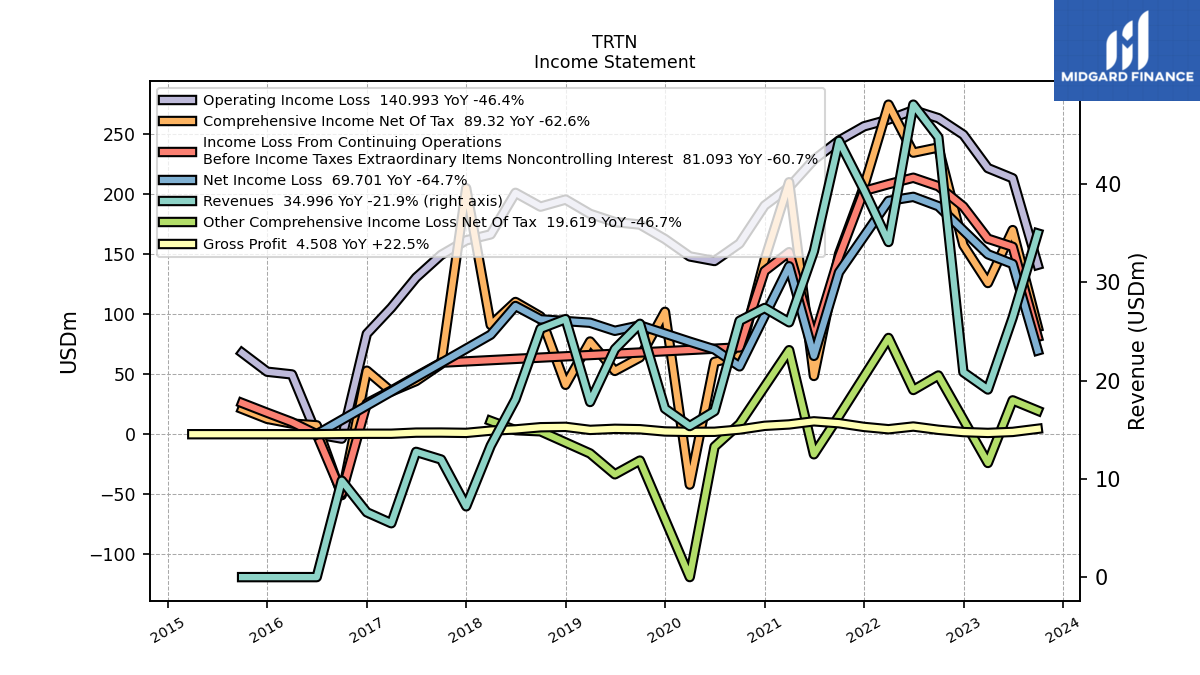
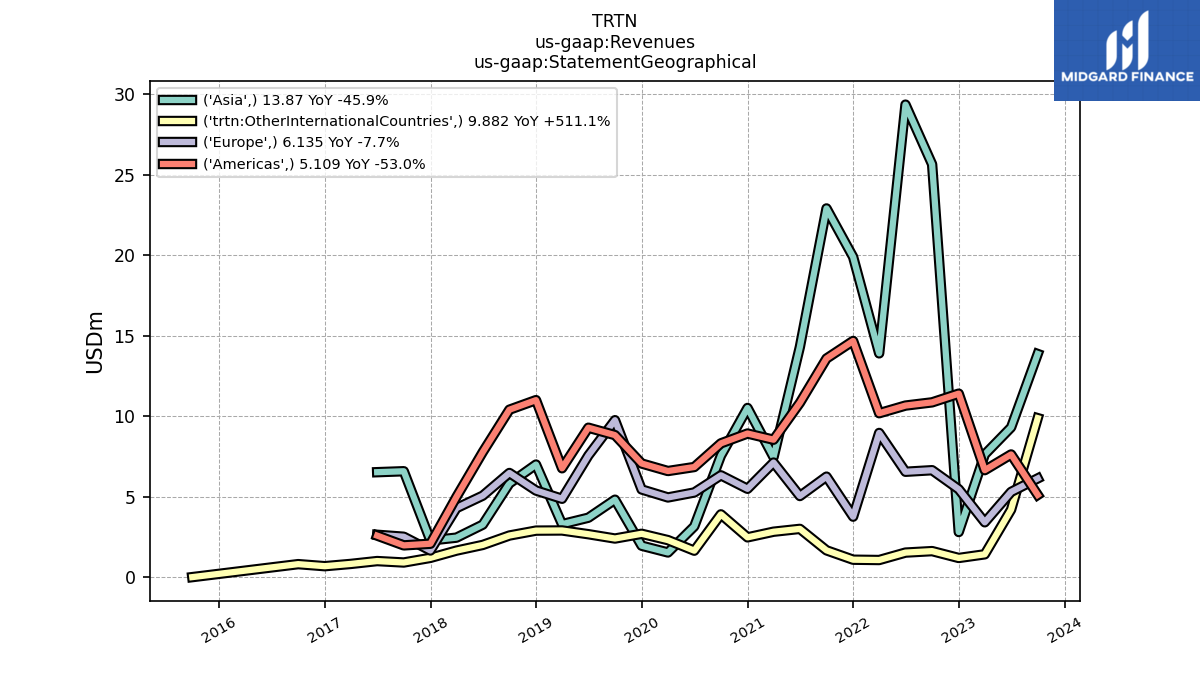
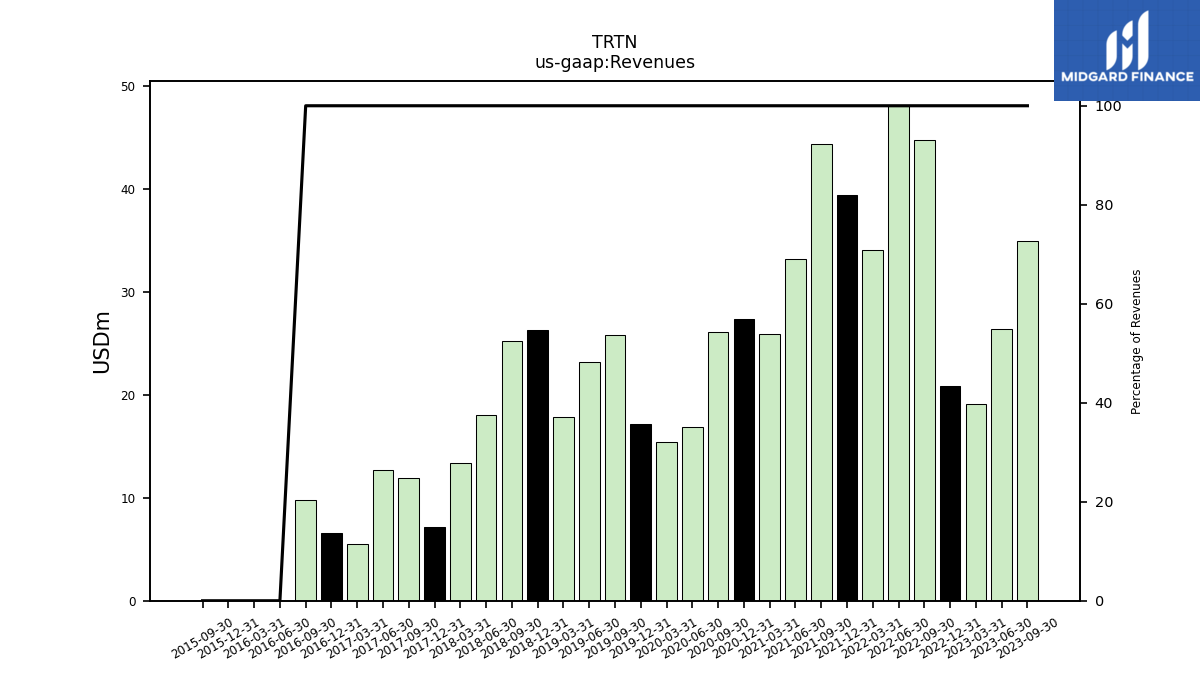
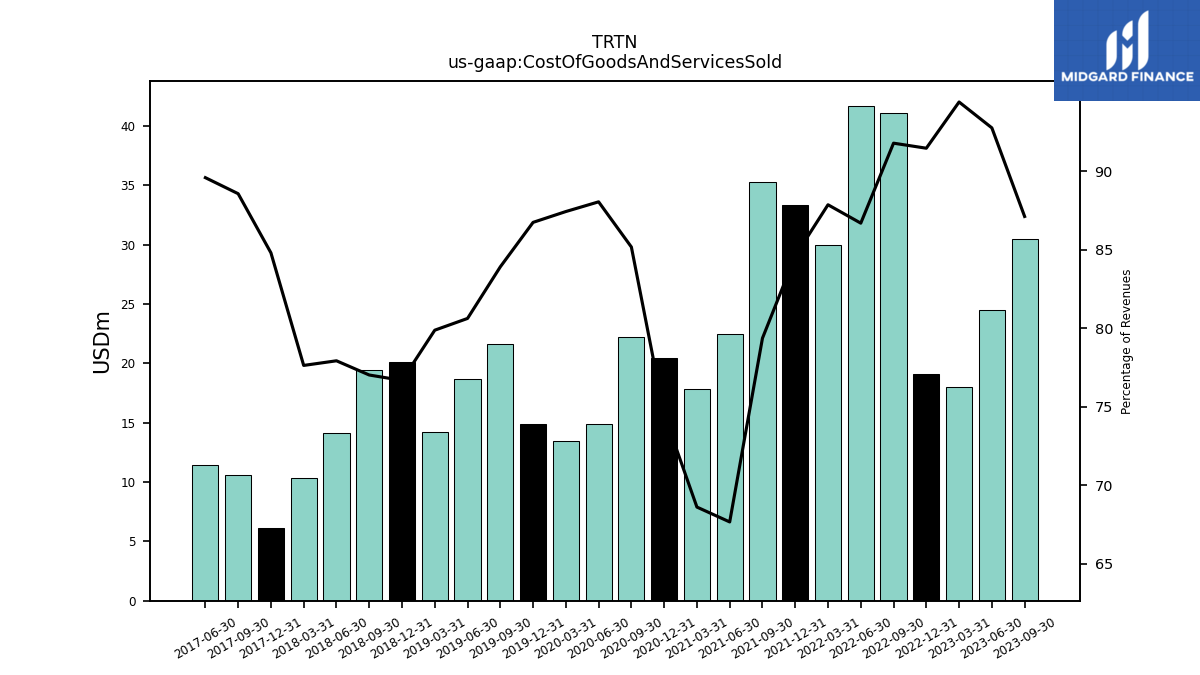
| Revenues | 35.00 | 26.43 | 19.10 | 20.86 | 44.79 | 48.11 | 34.12 | 39.42 | 44.42 | 33.18 | 25.95 | 27.40 | 26.09 | 16.90 | 15.38 | 17.16 | 25.80 | 23.21 | 17.83 | 26.27 | 25.29 | 18.10 | 13.38 | 7.21 | 11.97 | 12.76 | 5.48 | 6.60 | 9.82 | 0.00 | 0.00 | 0.00 | 0.00 | |
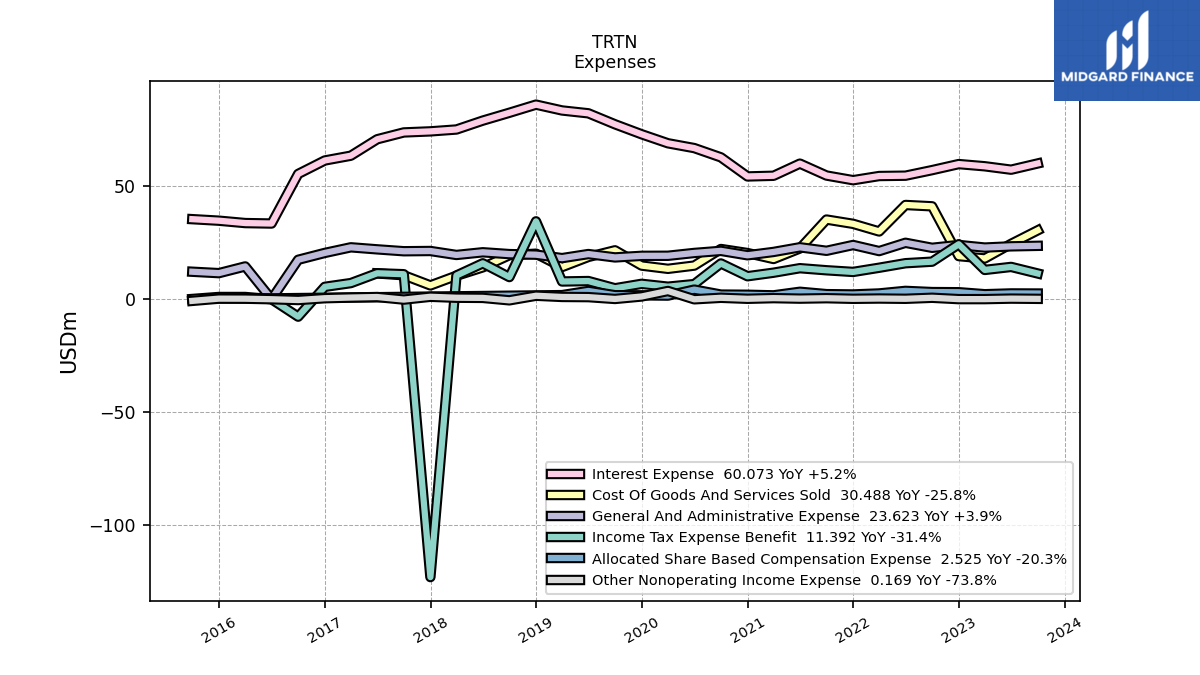
| Cost Of Goods And Services Sold | 30.49 | 24.51 | 18.03 | 19.08 | 41.11 | 41.71 | 29.98 | 33.35 | 35.26 | 22.46 | 17.80 | 20.43 | 22.23 | 14.88 | 13.45 | 14.88 | 21.65 | 18.71 | 14.24 | 20.15 | 19.48 | 14.11 | 10.38 | 6.11 | 10.61 | 11.43 | NA | NA | NA | NA | NA | NA | NA | |
| Gross Profit | 4.51 | 1.91 | 1.07 | 1.78 | 3.68 | 6.40 | 4.14 | 6.07 | 9.16 | 10.73 | 8.14 | 6.98 | 3.87 | 2.02 | 1.93 | 2.27 | 4.15 | 4.50 | 3.59 | 6.13 | 5.81 | 3.99 | 2.99 | 1.09 | 1.37 | 1.33 | 0.39 | 0.39 | 0.23 | 0.00 | 0.00 | 0.00 | 0.00 | |
| Costs And Expenses | 260.73 | 196.93 | 192.74 | 193.90 | 191.69 | 193.33 | 188.21 | 194.98 | 190.48 | 183.35 | 171.13 | 172.32 | 183.59 | 183.76 | 179.45 | 175.81 | 172.45 | 173.95 | 169.46 | 174.11 | 173.47 | 164.84 | 160.93 | 164.28 | 164.46 | 162.49 | 165.85 | 171.95 | 239.52 | 109.80 | 111.42 | 119.91 | 104.67 | |
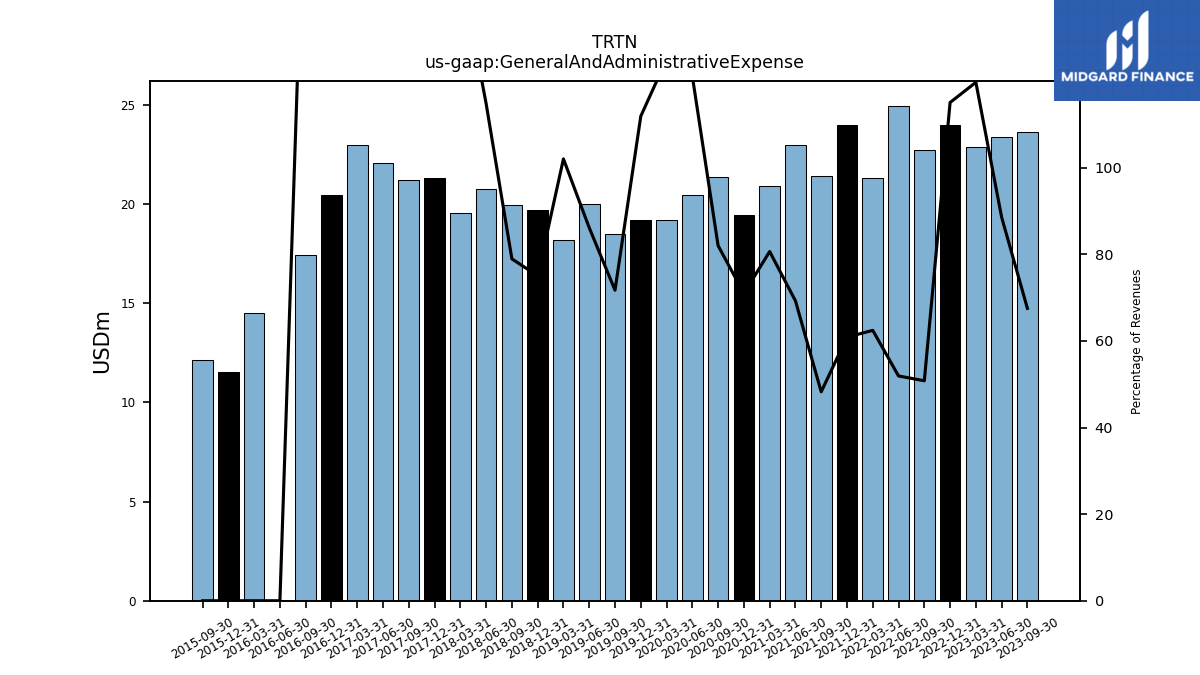
| General And Administrative Expense | 23.62 | 23.40 | 22.86 | 24.00 | 22.75 | 24.97 | 21.30 | 23.99 | 21.43 | 22.98 | 20.92 | 19.44 | 21.39 | 20.47 | 19.23 | 19.20 | 18.50 | 19.99 | 18.19 | 19.71 | 19.96 | 20.77 | 19.58 | 21.34 | 21.23 | 22.07 | 22.97 | 20.48 | 17.46 | 0.02 | 14.51 | 11.54 | 12.17 | |
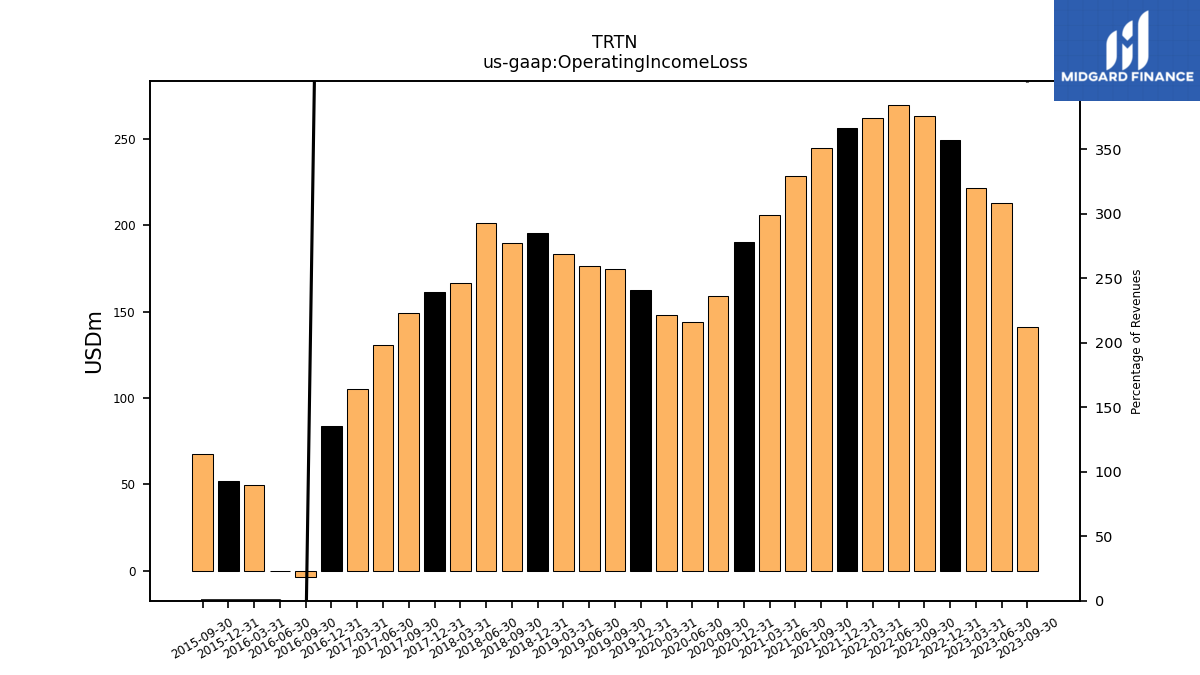
| Operating Income Loss | 140.99 | 213.10 | 221.55 | 249.35 | 263.14 | 269.75 | 261.99 | 256.34 | 244.48 | 228.56 | 205.72 | 190.36 | 158.77 | 144.20 | 148.03 | 162.50 | 174.57 | 176.63 | 183.46 | 195.37 | 189.47 | 200.99 | 166.37 | 161.43 | 149.29 | 130.41 | 105.31 | 83.58 | -3.68 | -0.02 | 49.77 | 52.03 | 67.80 | |
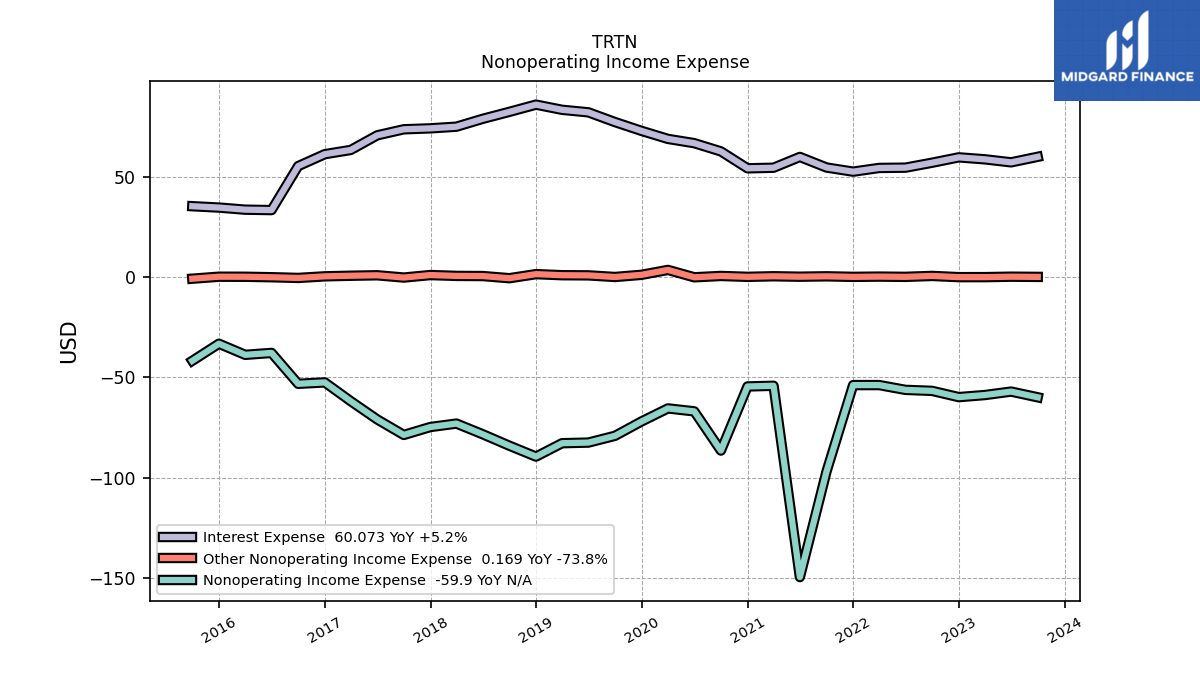
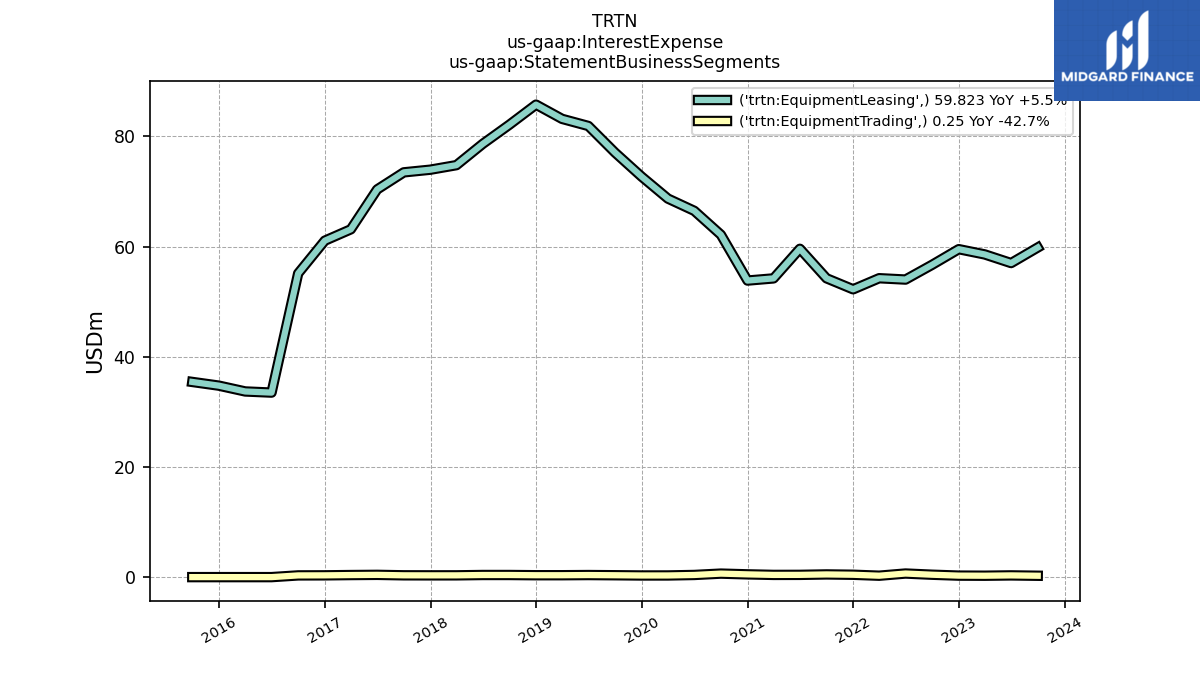
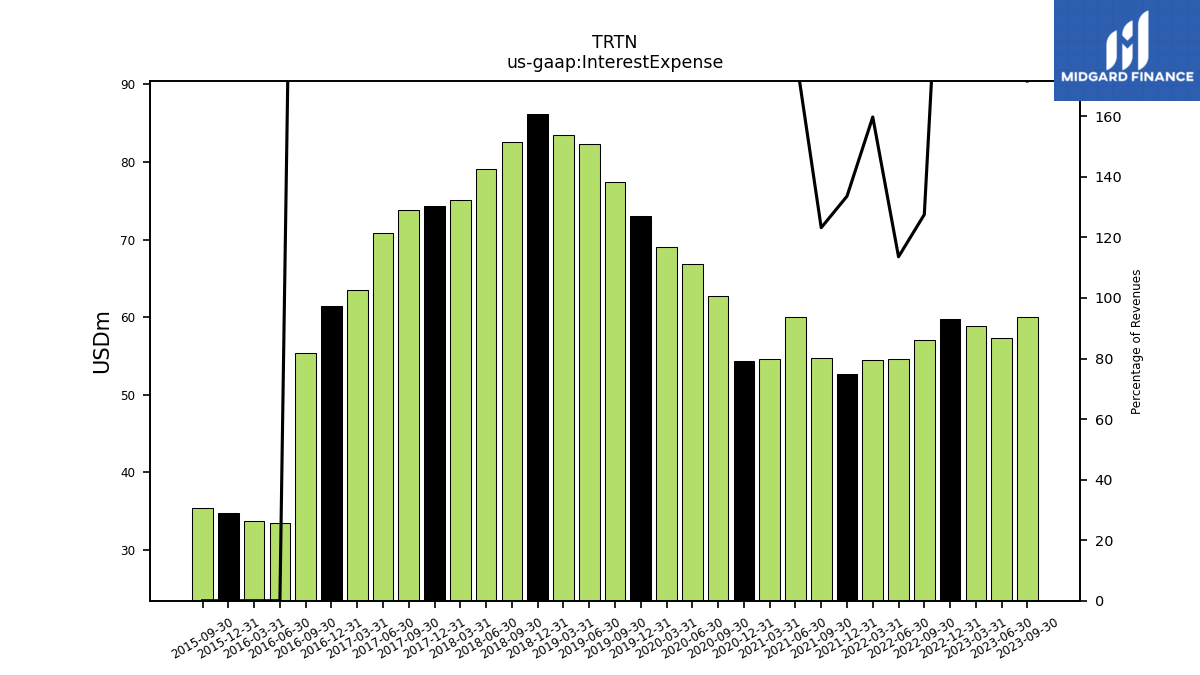
| Interest Expense | 60.07 | 57.31 | 58.82 | 59.80 | 57.12 | 54.66 | 54.51 | 52.67 | 54.73 | 60.00 | 54.62 | 54.33 | 62.78 | 66.87 | 69.00 | 72.99 | 77.40 | 82.26 | 83.52 | 86.10 | 82.50 | 79.03 | 75.10 | 74.27 | 73.80 | 70.78 | 63.50 | 61.39 | 55.44 | 33.49 | 33.70 | 34.75 | 35.43 | |
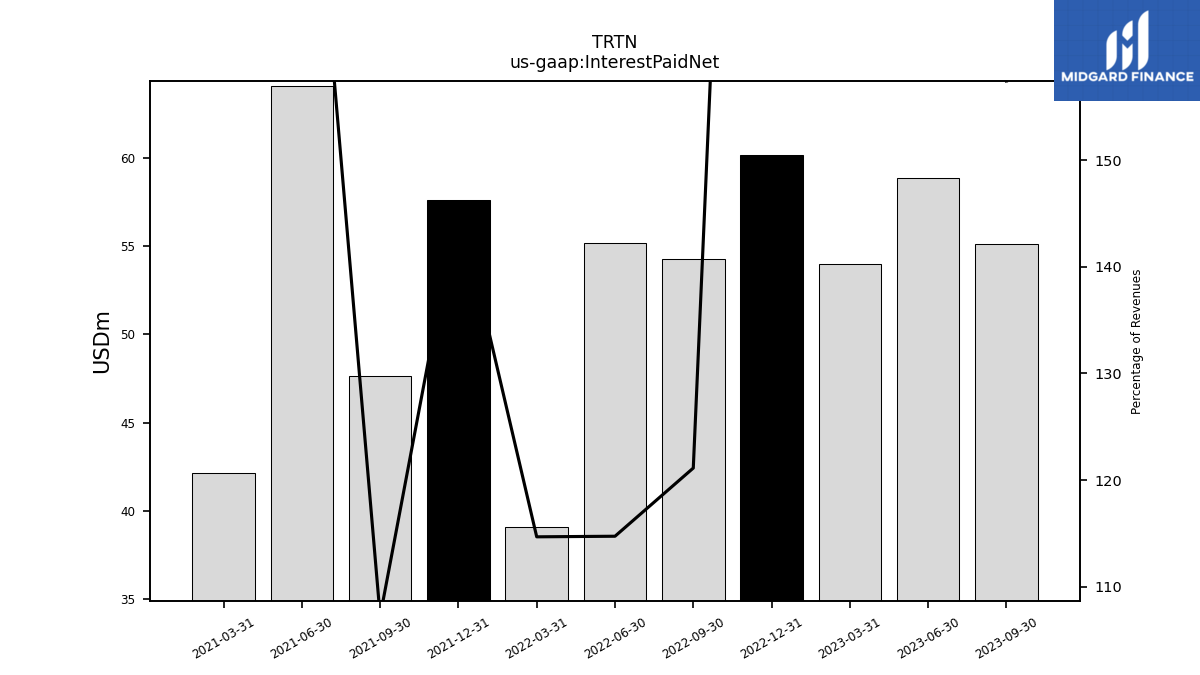
| Interest Paid Net | 55.10 | 58.88 | 54.01 | 60.15 | 54.25 | 55.19 | 39.13 | 57.60 | 47.63 | 64.05 | 42.13 | NA | NA | NA | NA | NA | NA | NA | NA | NA | NA | NA | NA | NA | NA | NA | NA | NA | NA | NA | NA | NA | NA | |
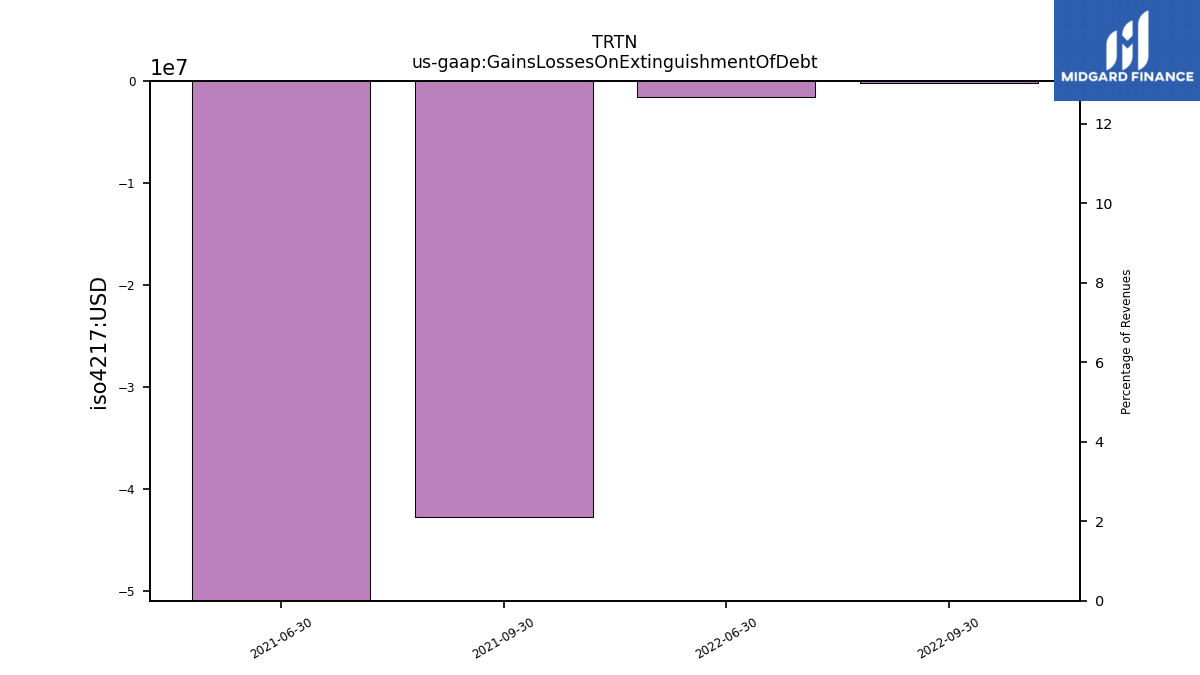
| Gains Losses On Extinguishment Of Debt | NA | NA | NA | NA | -0.20 | -1.60 | NA | NA | -42.70 | -89.90 | NA | NA | NA | NA | NA | NA | NA | NA | NA | NA | NA | NA | NA | NA | NA | NA | NA | NA | NA | NA | NA | NA | NA | |
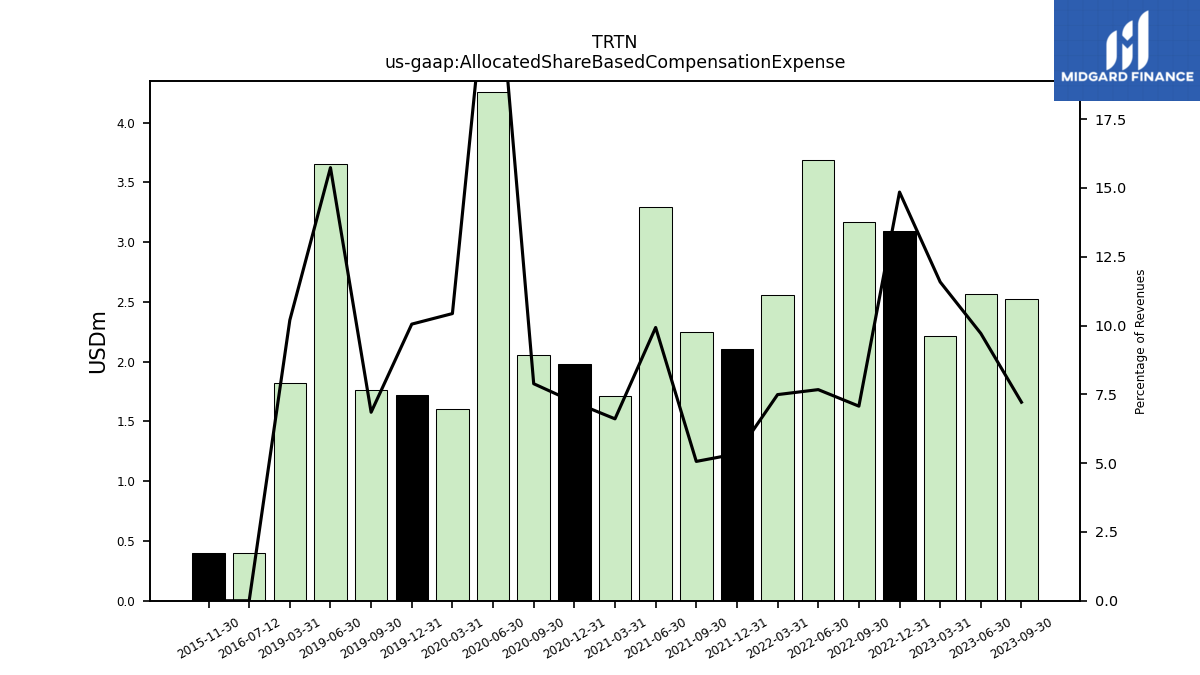
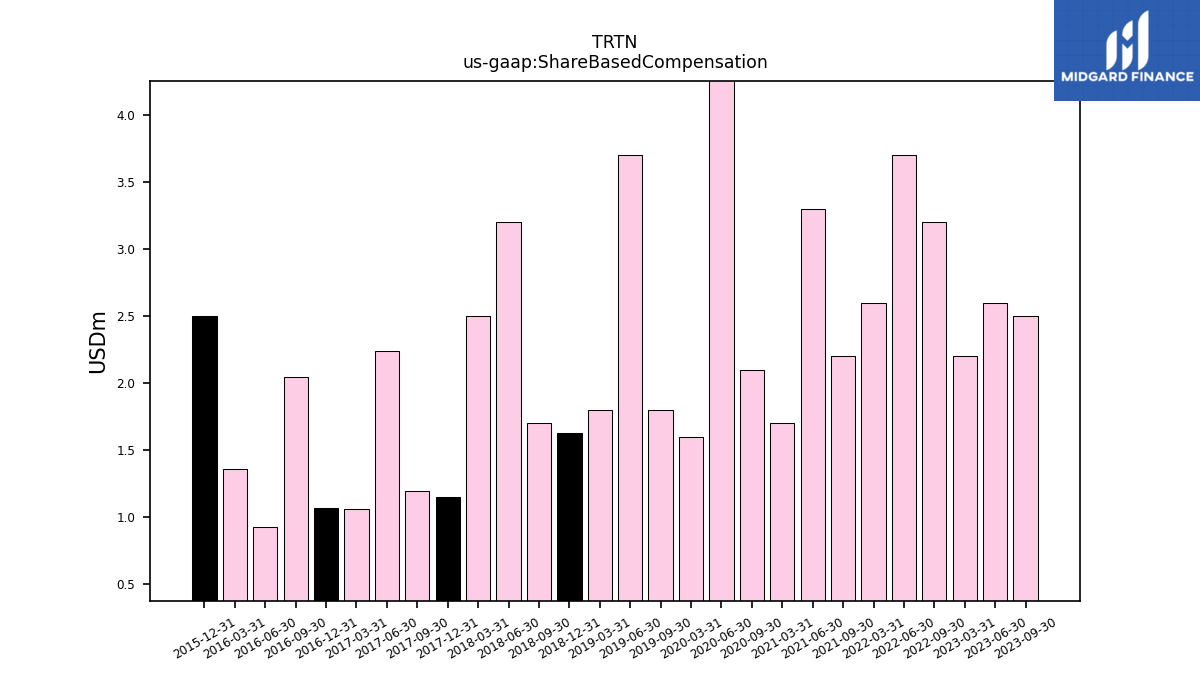
| Allocated Share Based Compensation Expense | 2.52 | 2.57 | 2.21 | 3.10 | 3.17 | 3.69 | 2.56 | 2.11 | 2.25 | 3.29 | 1.72 | 1.98 | 2.06 | 4.26 | 1.60 | 1.73 | 1.77 | 3.65 | 1.82 | NA | NA | NA | NA | NA | NA | NA | NA | NA | NA | NA | NA | NA | NA | |
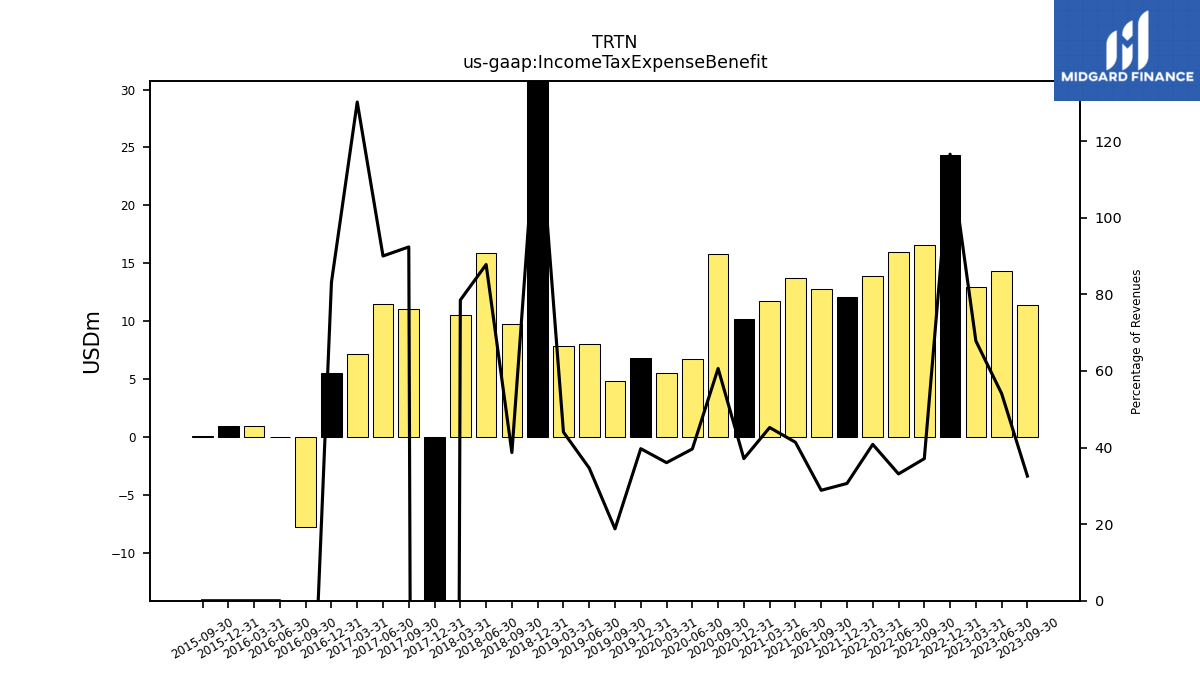
| Income Tax Expense Benefit | 11.39 | 14.30 | 12.96 | 24.32 | 16.62 | 15.93 | 13.93 | 12.08 | 12.81 | 13.73 | 11.74 | 10.17 | 15.82 | 6.70 | 5.55 | 6.81 | 4.84 | 8.04 | 7.85 | 34.46 | 9.79 | 15.89 | 10.50 | -122.96 | 11.06 | 11.48 | 7.14 | 5.49 | -7.72 | 0.00 | 0.99 | 0.99 | 0.11 | |
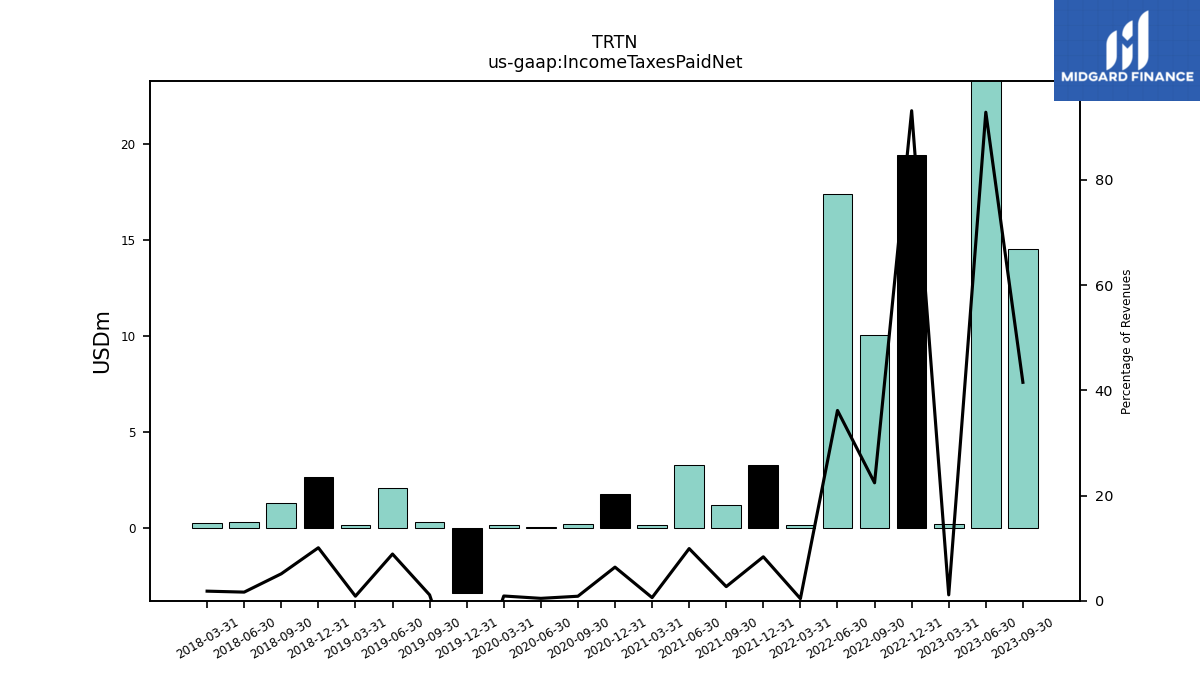
| Income Taxes Paid Net | 14.53 | 24.54 | 0.21 | 19.43 | 10.04 | 17.40 | 0.14 | 3.29 | 1.19 | 3.29 | 0.15 | 1.75 | 0.22 | 0.08 | 0.14 | -3.40 | 0.29 | 2.06 | 0.15 | 2.65 | 1.30 | 0.30 | 0.24 | NA | NA | NA | NA | NA | NA | NA | NA | NA | NA | |
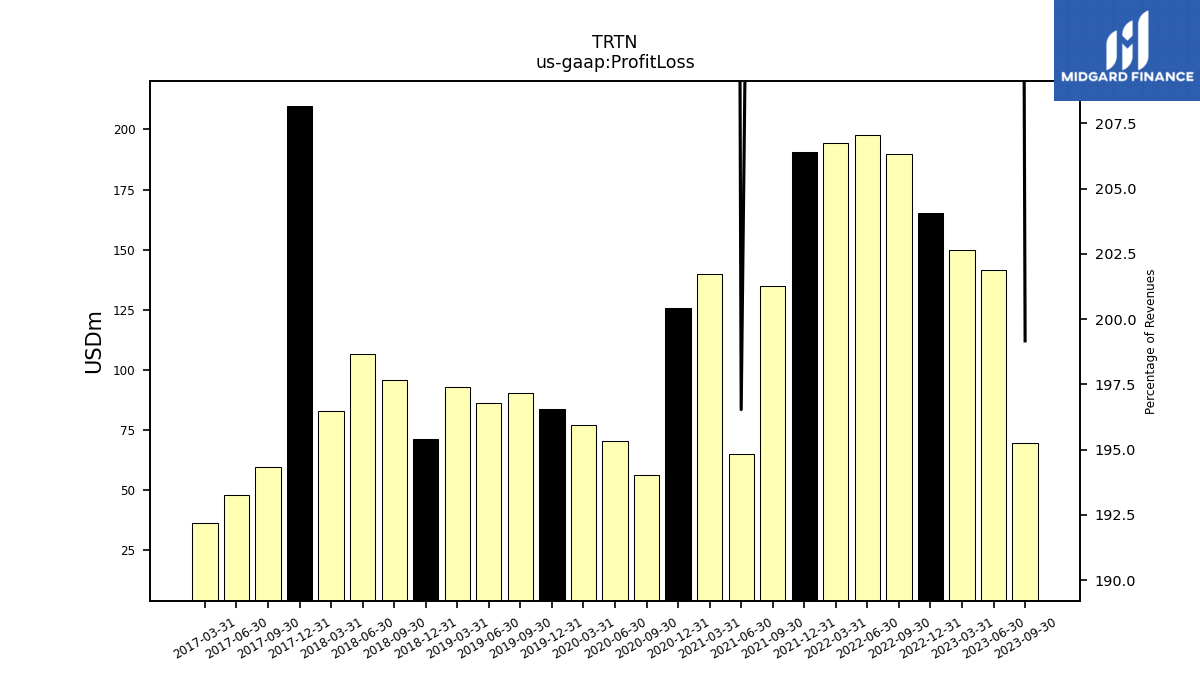
| Profit Loss | 69.70 | 141.76 | 149.81 | 165.21 | 189.84 | 197.62 | 194.26 | 190.45 | 134.73 | 65.22 | 139.84 | 125.70 | 56.46 | 70.59 | 77.04 | 83.77 | 90.60 | 86.10 | 92.81 | 71.42 | 95.63 | 106.75 | 82.86 | 209.66 | 59.55 | 48.01 | 36.30 | NA | NA | NA | NA | NA | NA | |
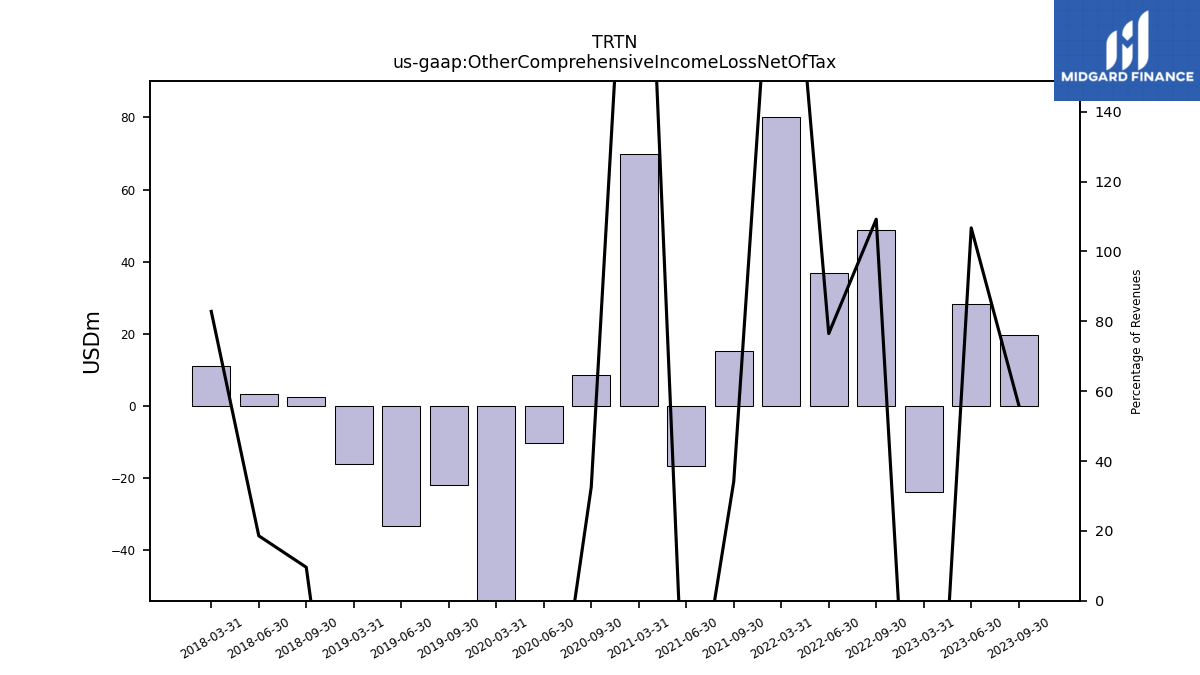
| Other Comprehensive Income Loss Net Of Tax | 19.62 | 28.21 | -23.95 | NA | 48.91 | 36.80 | 80.16 | NA | 15.16 | -16.73 | 69.97 | NA | 8.50 | -10.37 | -118.99 | NA | -21.94 | -33.41 | -16.03 | NA | 2.42 | 3.37 | 11.08 | NA | NA | NA | NA | NA | NA | NA | NA | NA | NA | |
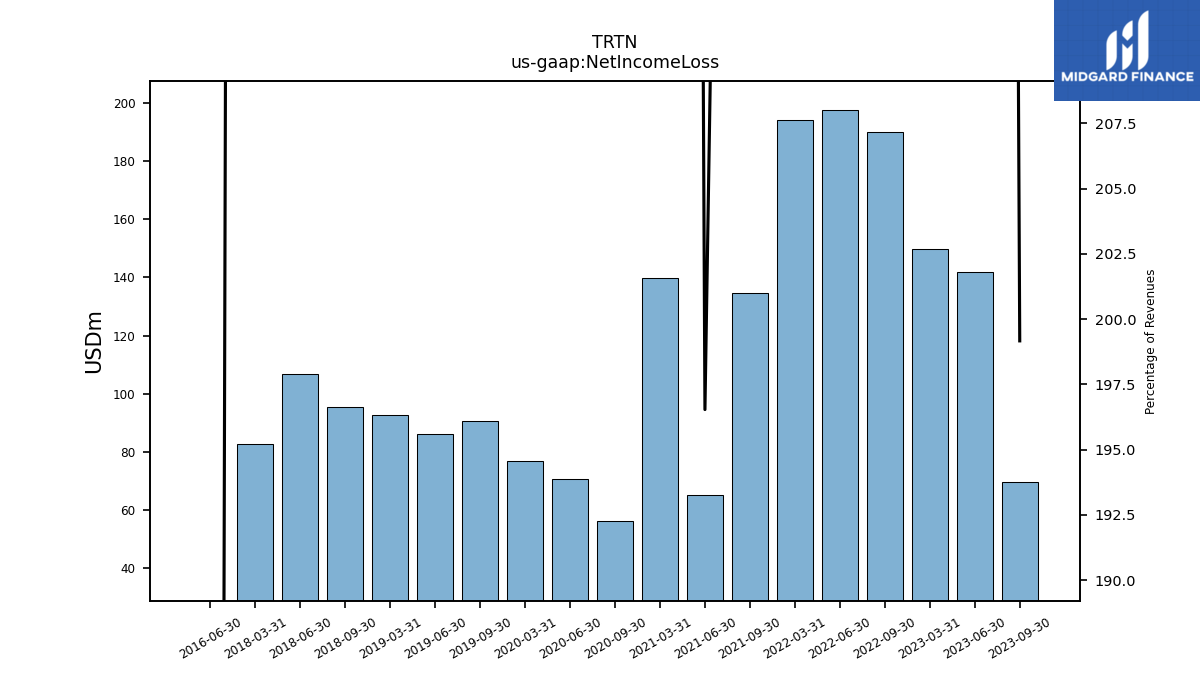
| Net Income Loss | 69.70 | 141.76 | 149.81 | NA | 189.84 | 197.62 | 194.26 | NA | 134.73 | 65.22 | 139.84 | NA | 56.46 | 70.59 | 77.04 | NA | 90.60 | 86.10 | 92.81 | NA | 95.63 | 106.75 | 82.86 | NA | NA | NA | NA | NA | NA | -0.02 | NA | NA | NA | |
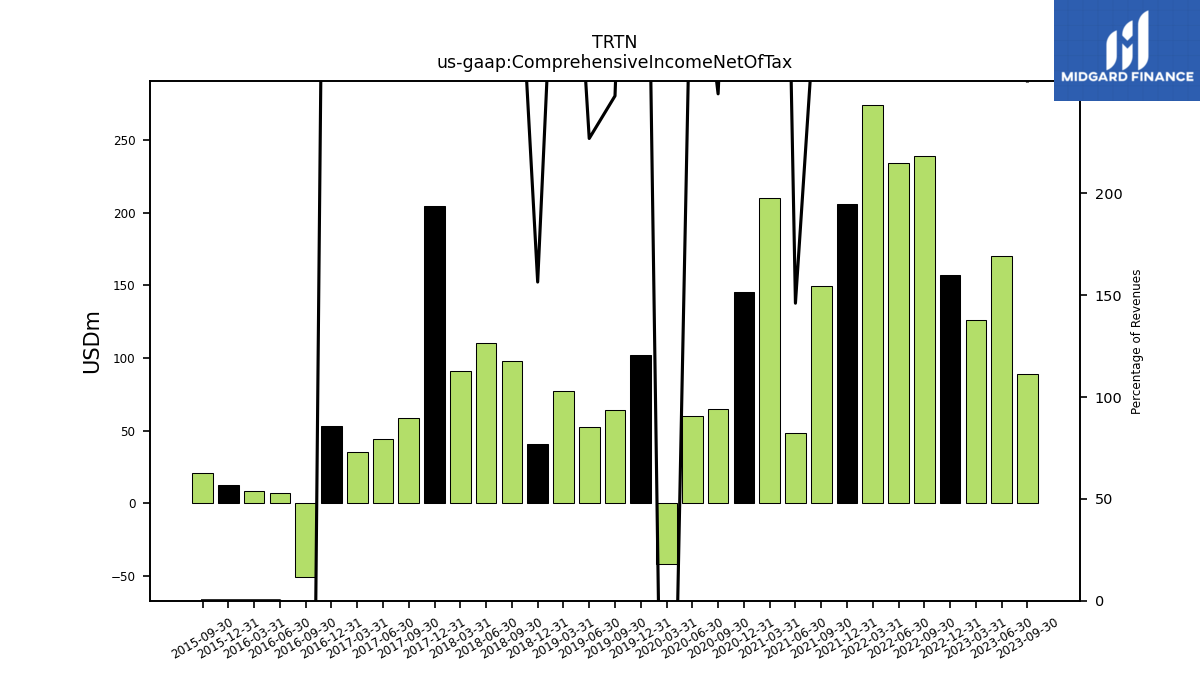
| Comprehensive Income Net Of Tax | 89.32 | 169.97 | 125.87 | 157.43 | 238.75 | 234.42 | 274.42 | 206.27 | 149.89 | 48.49 | 209.81 | 145.16 | 64.95 | 60.22 | -41.95 | 101.91 | 63.95 | 52.69 | 77.21 | 41.12 | 98.05 | 110.12 | 90.92 | 204.80 | 58.47 | 44.27 | 35.55 | 52.90 | -50.76 | 7.41 | 8.84 | 12.78 | 21.02 | |
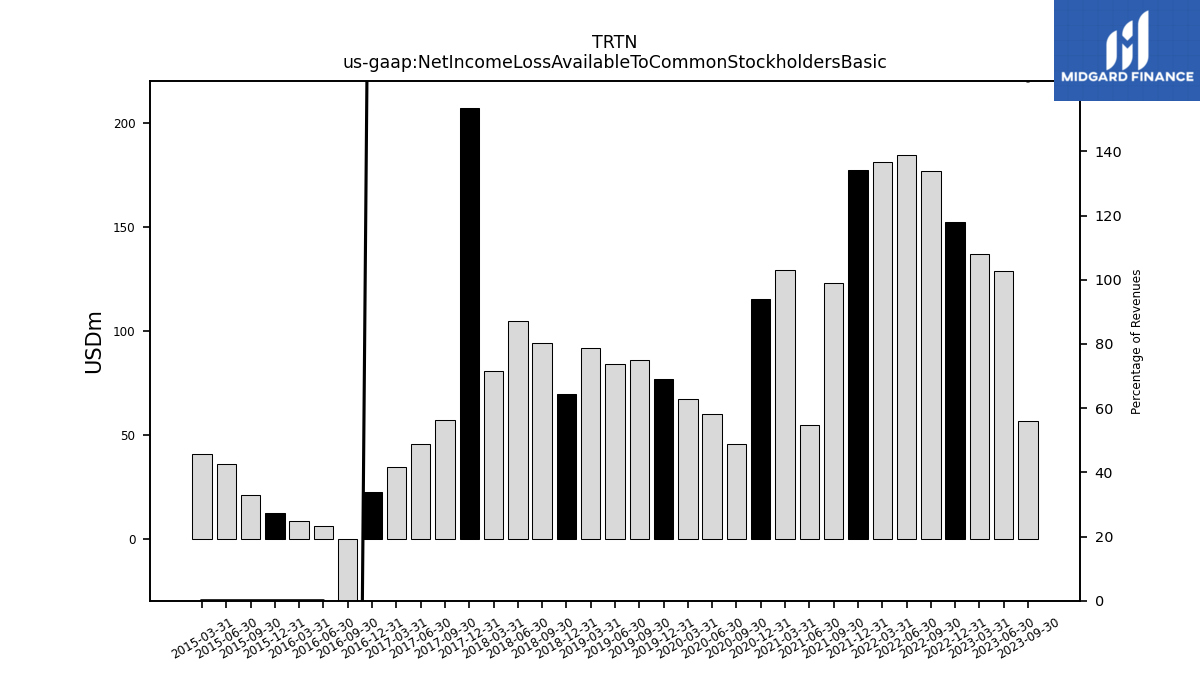
| Net Income Loss Available To Common Stockholders Basic | 56.67 | 128.73 | 136.78 | 152.18 | 176.81 | 184.59 | 181.23 | 177.43 | 123.05 | 54.70 | 129.32 | 115.19 | 45.95 | 60.08 | 67.21 | 77.16 | 85.89 | 84.07 | 91.91 | 69.56 | 94.24 | 104.87 | 80.89 | 207.16 | 57.16 | 45.67 | 34.61 | 22.78 | -51.21 | 6.17 | 8.74 | 12.82 | 21.16 |
| 2023-09-30 | 2023-06-30 | 2023-03-31 | 2022-12-31 | 2022-09-30 | 2022-06-30 | 2022-03-31 | 2021-12-31 | 2021-09-30 | 2021-06-30 | 2021-03-31 | 2020-12-31 | 2020-09-30 | 2020-06-30 | 2020-03-31 | 2019-12-31 | 2019-09-30 | 2019-06-30 | 2019-03-31 | 2018-12-31 | 2018-09-30 | 2018-06-30 | 2018-03-31 | 2017-12-31 | 2017-09-30 | 2017-06-30 | 2017-03-31 | 2016-12-31 | 2016-09-30 | 2016-06-30 | 2016-03-31 | 2015-12-31 | 2015-09-30 | ||
|---|---|---|---|---|---|---|---|---|---|---|---|---|---|---|---|---|---|---|---|---|---|---|---|---|---|---|---|---|---|---|---|---|---|---|
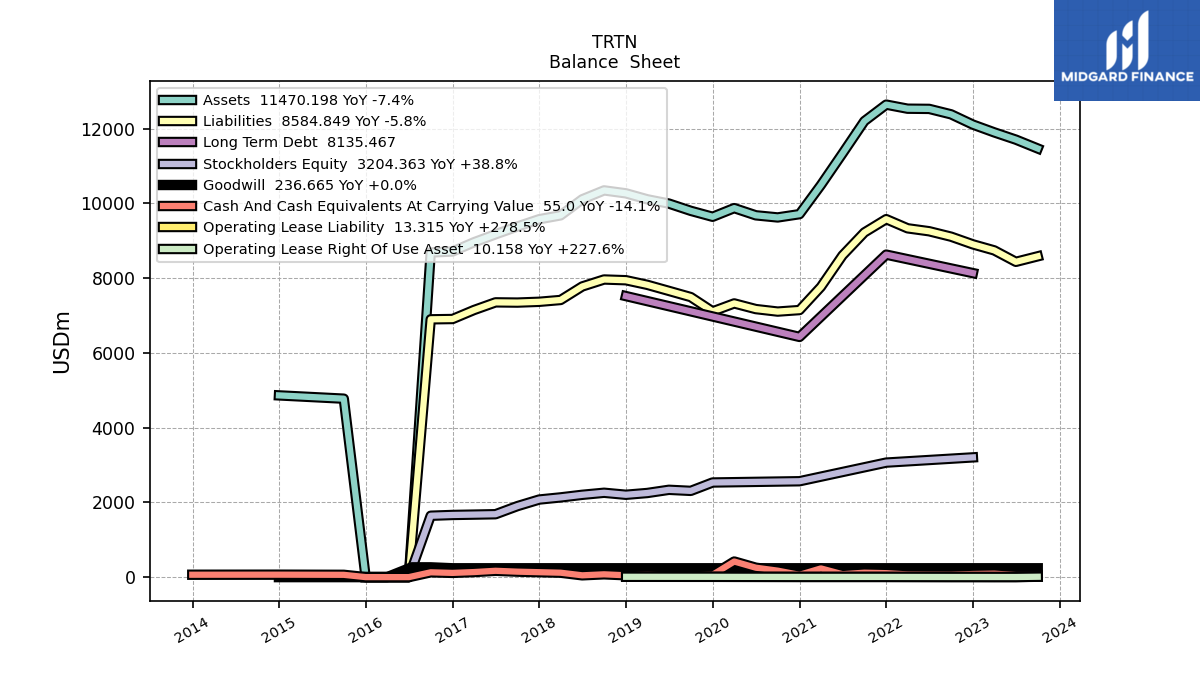
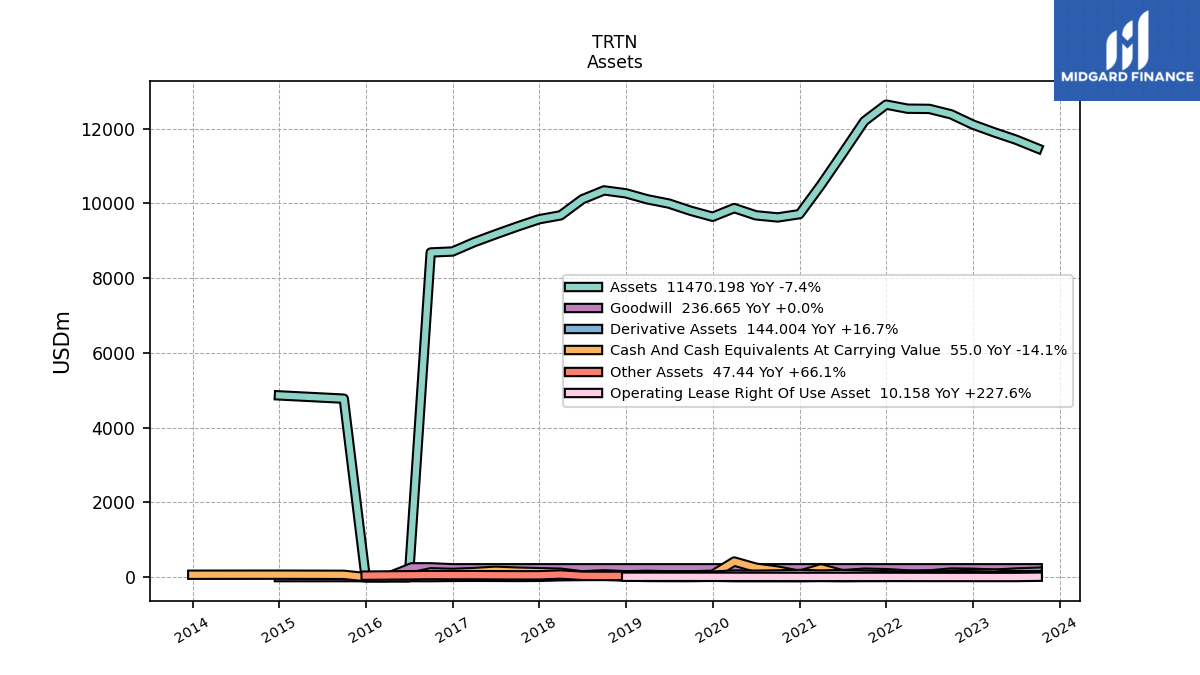
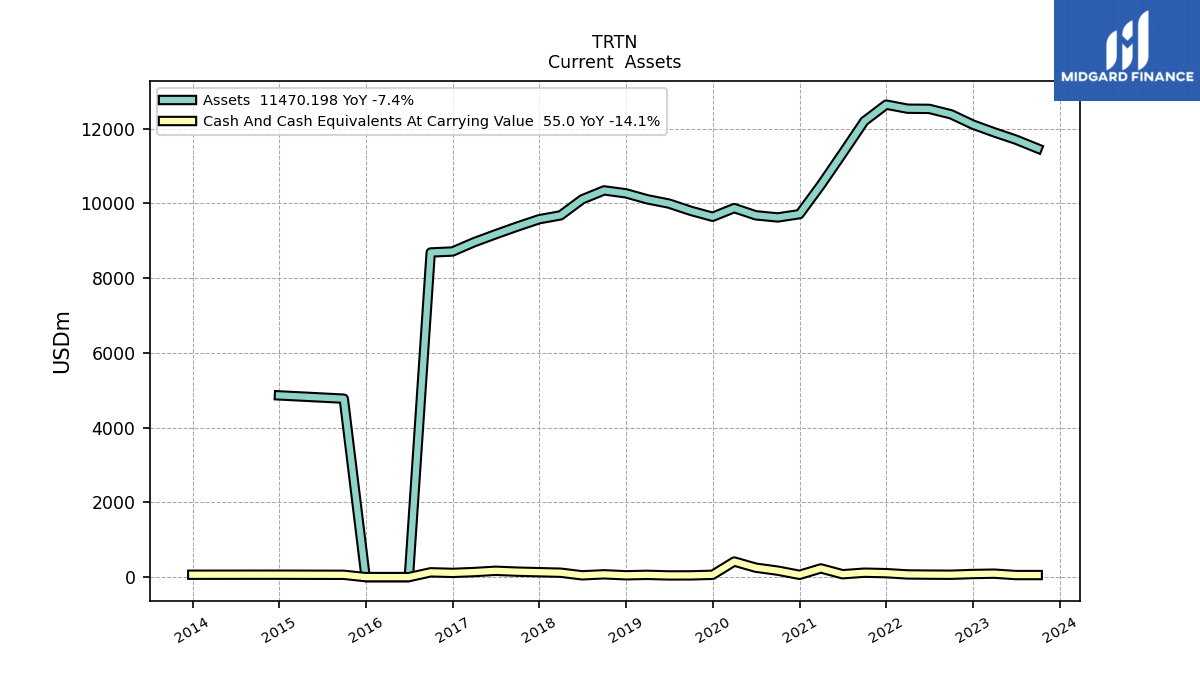
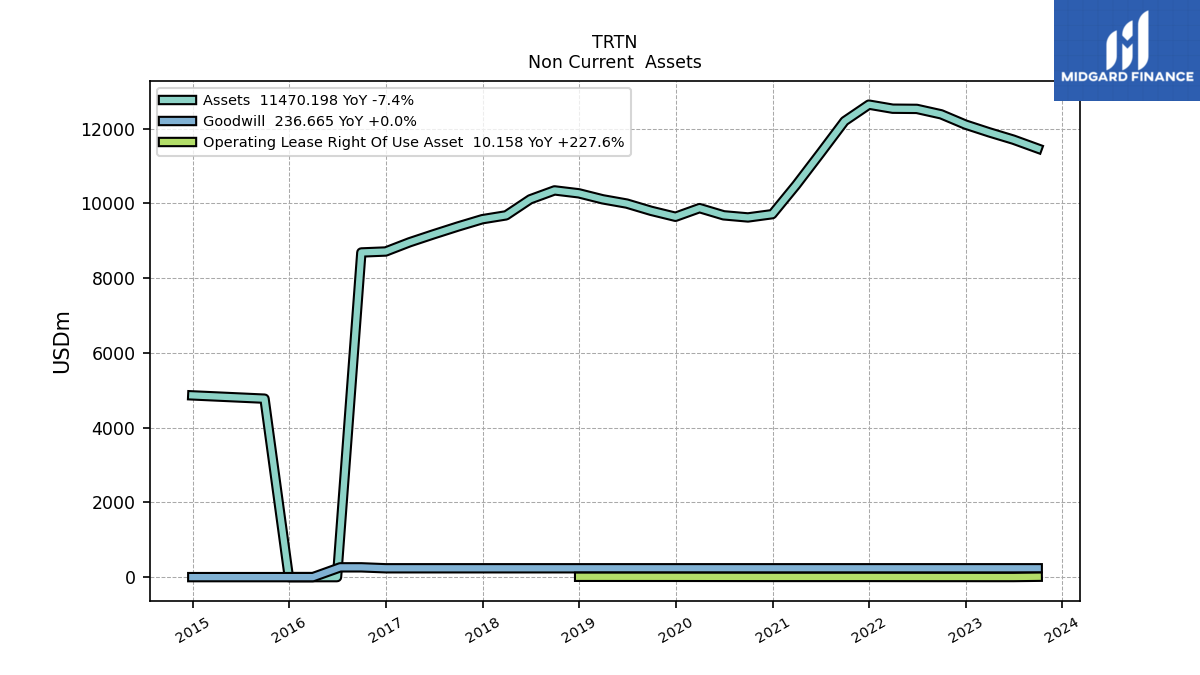
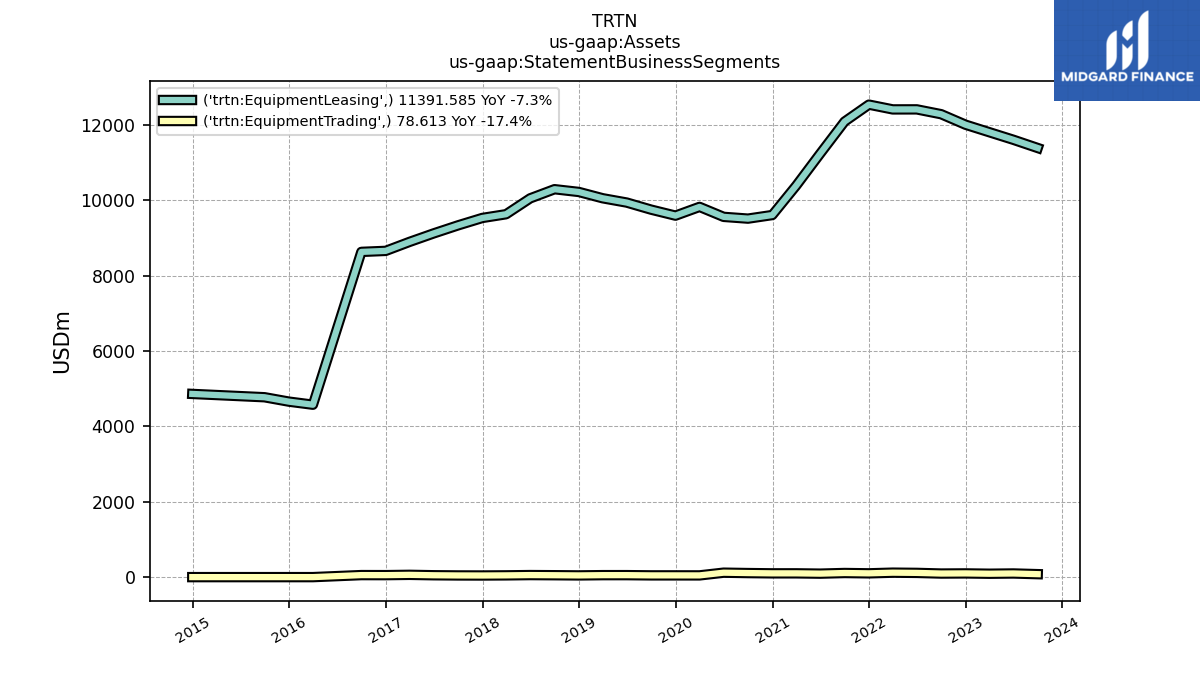
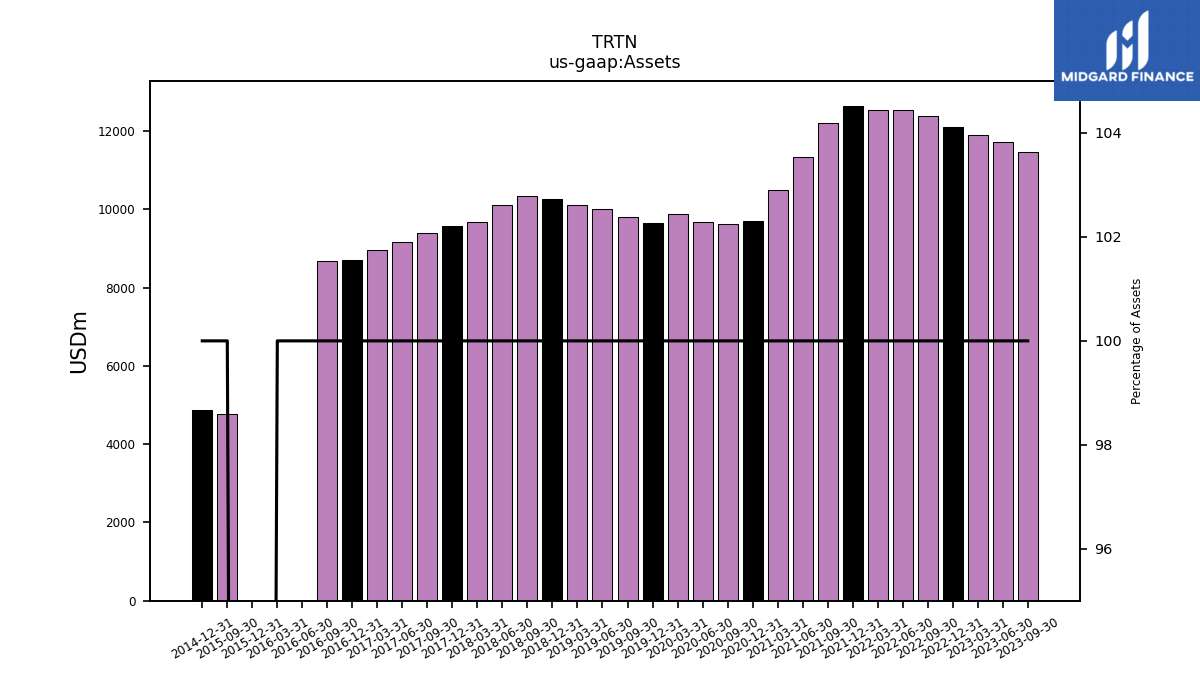
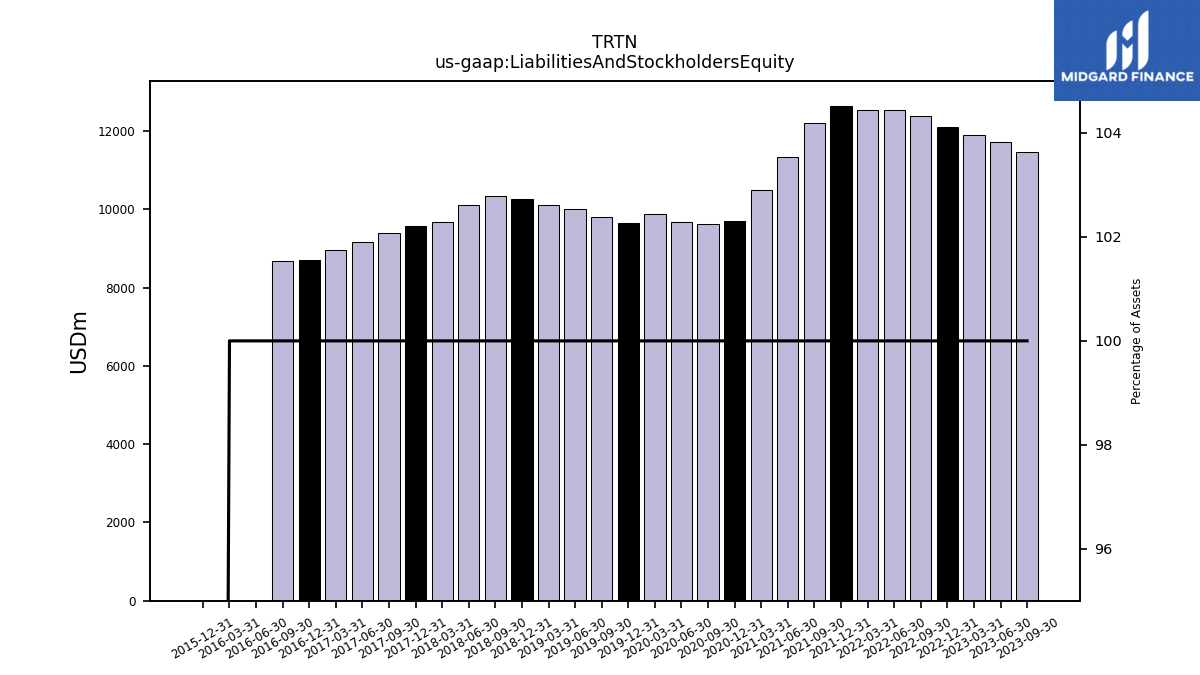
| Assets | 11470.20 | 11706.82 | 11901.19 | 12109.26 | 12384.34 | 12529.59 | 12534.81 | 12643.84 | 12201.60 | 11335.36 | 10490.98 | 9712.53 | 9624.67 | 9681.75 | 9874.39 | 9642.63 | 9801.88 | 9995.83 | 10110.12 | 10270.01 | 10348.50 | 10110.12 | 9680.95 | 9577.62 | 9382.21 | 9173.96 | 8960.06 | 8713.57 | 8687.66 | 0.01 | 0.01 | 0.00 | 4775.33 | |
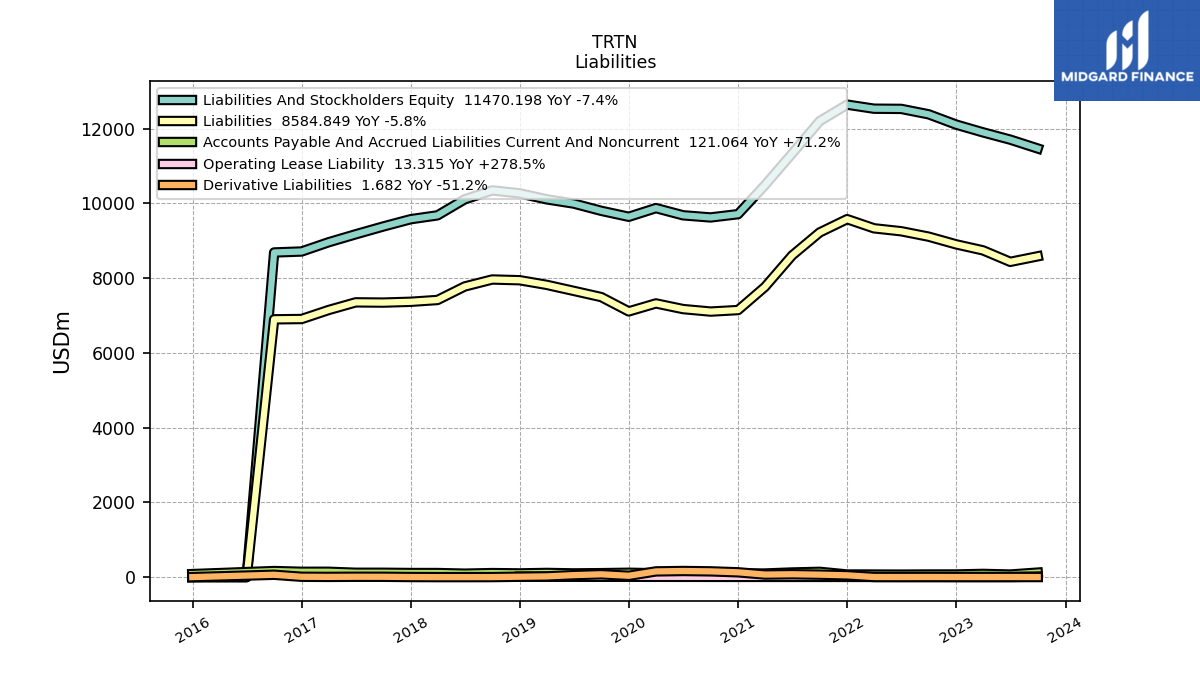
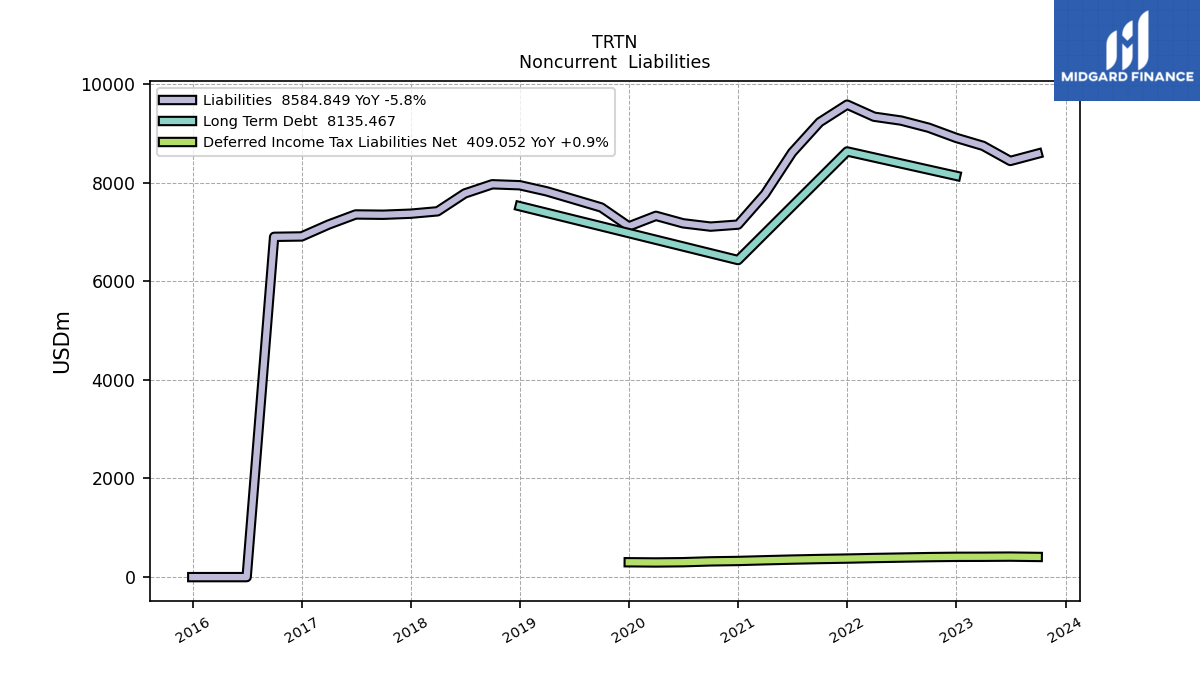
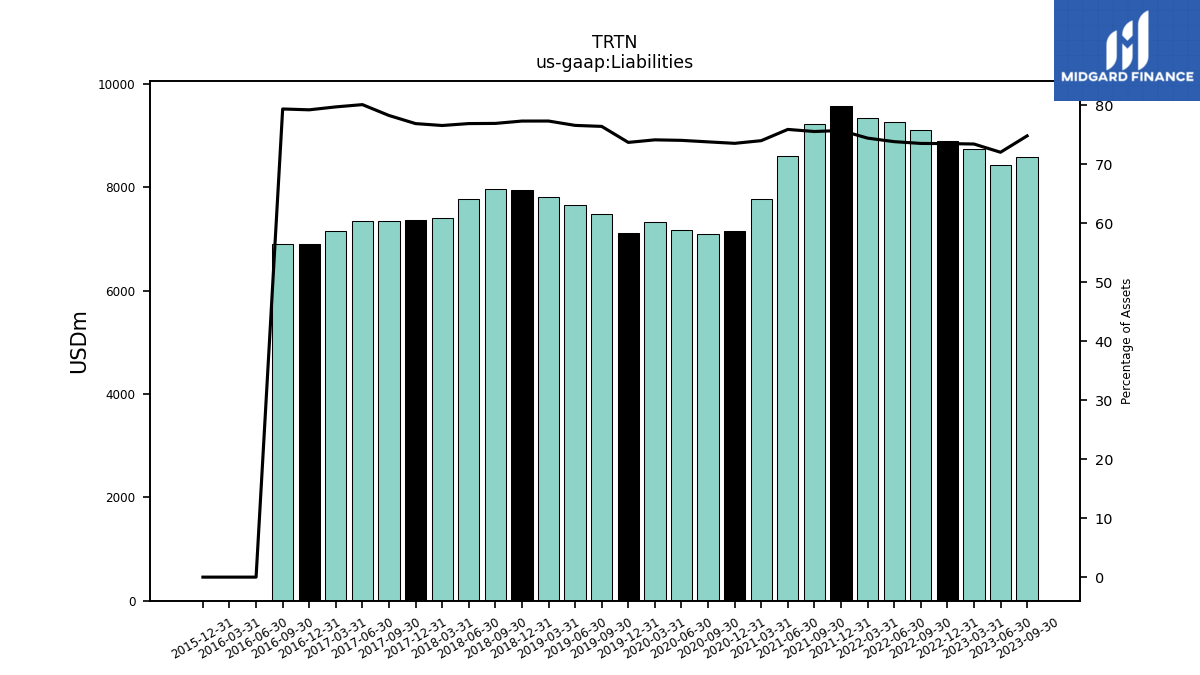
| Liabilities | 8584.85 | 8436.93 | 8743.43 | 8904.90 | 9110.42 | 9255.29 | 9334.26 | 9579.13 | 9222.73 | 8608.28 | 7766.66 | 7146.59 | 7105.79 | 7172.80 | 7324.14 | 7110.40 | 7493.90 | 7659.23 | 7821.53 | 7944.80 | 7964.35 | 7777.86 | 7416.18 | 7367.80 | 7346.53 | 7352.66 | 7146.84 | 6906.83 | 6898.77 | 0.00 | 0.00 | 0.01 | NA | |
| Liabilities And Stockholders Equity | 11470.20 | 11706.82 | 11901.19 | 12109.26 | 12384.34 | 12529.59 | 12534.81 | 12643.84 | 12201.60 | 11335.36 | 10490.98 | 9712.53 | 9624.67 | 9681.75 | 9874.39 | 9642.63 | 9801.88 | 9995.83 | 10110.12 | 10270.01 | 10348.50 | 10110.12 | 9680.95 | 9577.62 | 9382.21 | 9173.96 | 8960.06 | 8713.57 | 8687.66 | 0.01 | 0.01 | 0.00 | NA | |
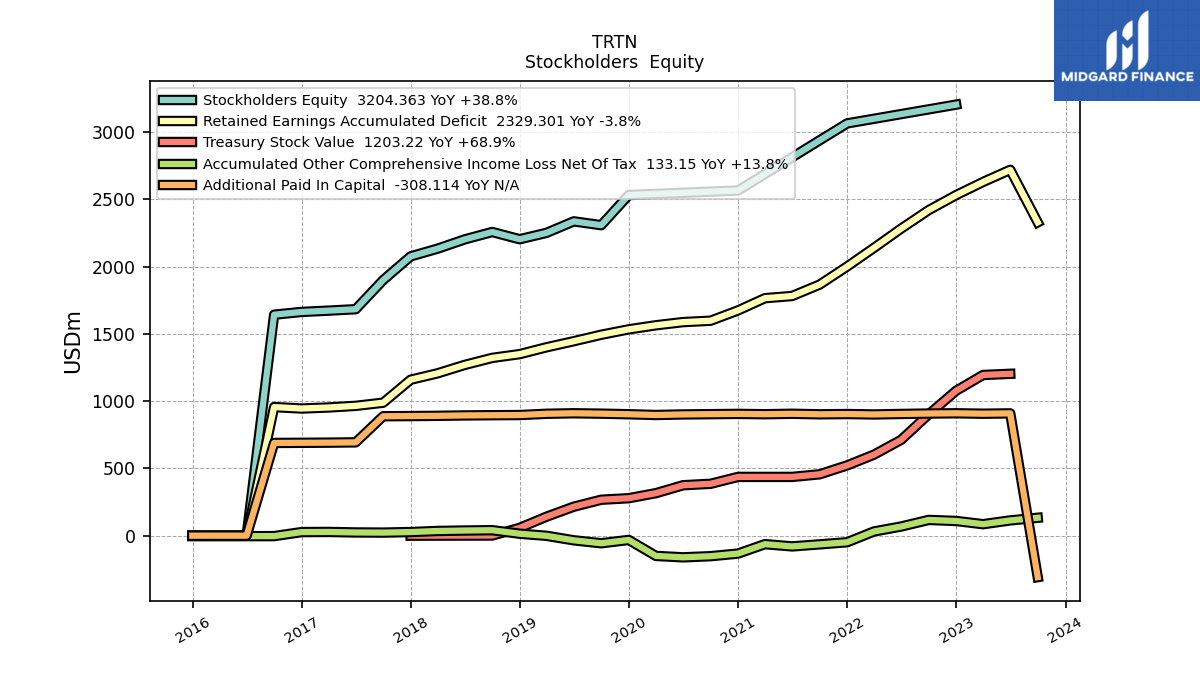
| Stockholders Equity | NA | NA | NA | 3204.36 | NA | NA | NA | 3064.71 | NA | NA | NA | 2565.95 | NA | NA | NA | 2532.24 | 2307.98 | 2336.61 | 2251.28 | 2203.70 | 2257.48 | 2202.60 | 2133.51 | 2076.28 | 1900.03 | 1683.47 | 1672.92 | 1663.23 | 1642.69 | 0.01 | 0.01 | -0.01 | NA |
| 2023-09-30 | 2023-06-30 | 2023-03-31 | 2022-12-31 | 2022-09-30 | 2022-06-30 | 2022-03-31 | 2021-12-31 | 2021-09-30 | 2021-06-30 | 2021-03-31 | 2020-12-31 | 2020-09-30 | 2020-06-30 | 2020-03-31 | 2019-12-31 | 2019-09-30 | 2019-06-30 | 2019-03-31 | 2018-12-31 | 2018-09-30 | 2018-06-30 | 2018-03-31 | 2017-12-31 | 2017-09-30 | 2017-06-30 | 2017-03-31 | 2016-12-31 | 2016-09-30 | 2016-06-30 | 2016-03-31 | 2015-12-31 | 2015-09-30 | ||
|---|---|---|---|---|---|---|---|---|---|---|---|---|---|---|---|---|---|---|---|---|---|---|---|---|---|---|---|---|---|---|---|---|---|---|
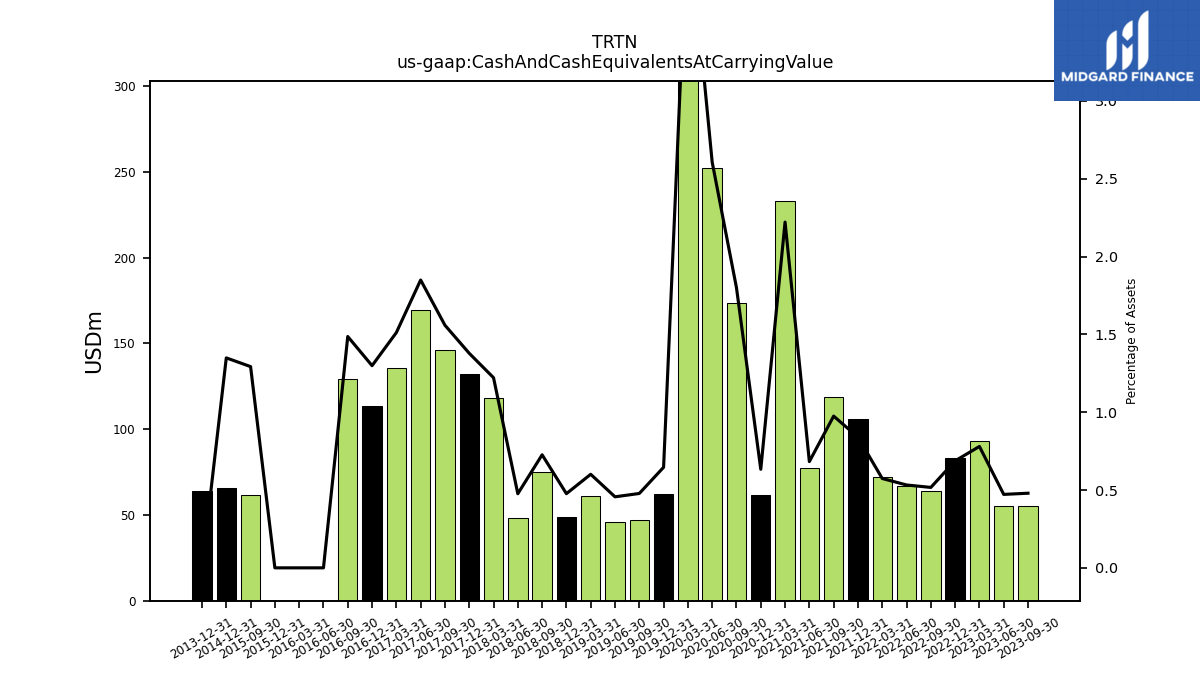
| Cash And Cash Equivalents At Carrying Value | 55.00 | 55.25 | 92.83 | 83.23 | 63.99 | 66.71 | 71.97 | 106.17 | 118.97 | 77.39 | 233.06 | 61.51 | 173.26 | 252.38 | 417.55 | 62.30 | 46.84 | 45.62 | 60.77 | 48.95 | 75.18 | 48.15 | 118.27 | 132.03 | 146.26 | 169.66 | 135.44 | 113.20 | 129.12 | 0.00 | 0.00 | 0.00 | 61.75 | |
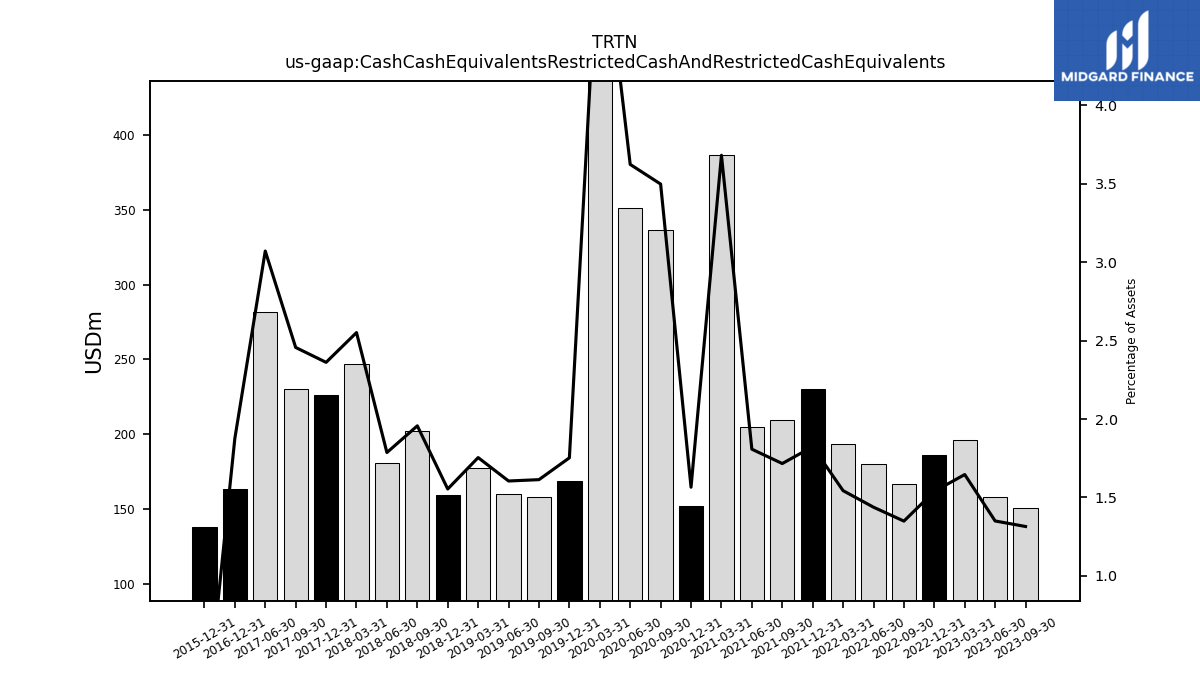
| Cash Cash Equivalents Restricted Cash And Restricted Cash Equivalents | 150.75 | 157.98 | 195.86 | 186.31 | 167.02 | 180.10 | 193.40 | 230.54 | 209.37 | 204.88 | 386.34 | 152.00 | 336.74 | 350.88 | 520.58 | 168.97 | 158.12 | 160.38 | 177.32 | 159.54 | 202.46 | 180.58 | 246.99 | 226.17 | 230.47 | 281.78 | NA | 163.49 | NA | NA | NA | 138.38 | NA |
| 2023-09-30 | 2023-06-30 | 2023-03-31 | 2022-12-31 | 2022-09-30 | 2022-06-30 | 2022-03-31 | 2021-12-31 | 2021-09-30 | 2021-06-30 | 2021-03-31 | 2020-12-31 | 2020-09-30 | 2020-06-30 | 2020-03-31 | 2019-12-31 | 2019-09-30 | 2019-06-30 | 2019-03-31 | 2018-12-31 | 2018-09-30 | 2018-06-30 | 2018-03-31 | 2017-12-31 | 2017-09-30 | 2017-06-30 | 2017-03-31 | 2016-12-31 | 2016-09-30 | 2016-06-30 | 2016-03-31 | 2015-12-31 | 2015-09-30 | ||
|---|---|---|---|---|---|---|---|---|---|---|---|---|---|---|---|---|---|---|---|---|---|---|---|---|---|---|---|---|---|---|---|---|---|---|
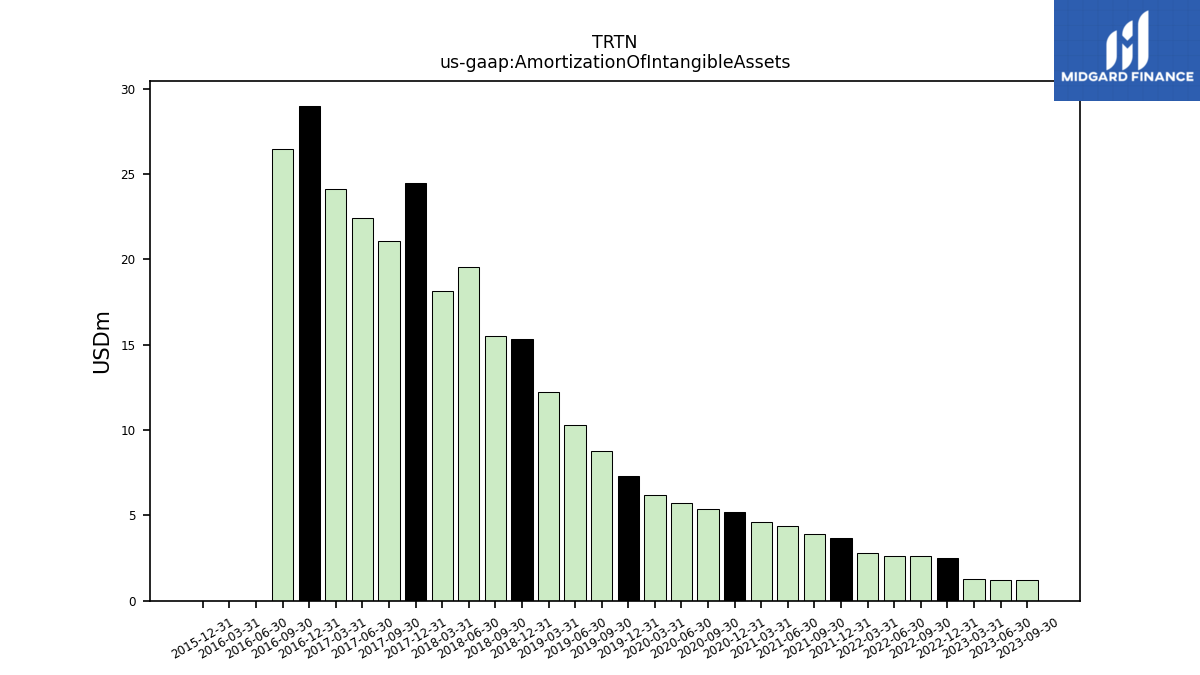
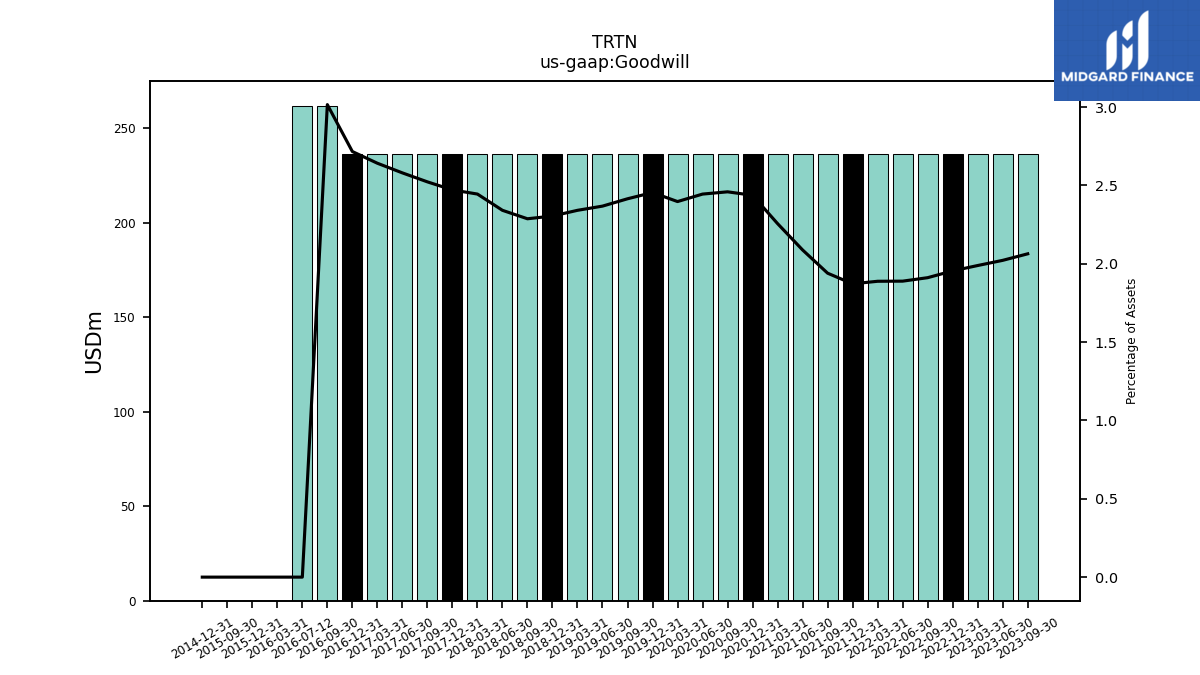
| Amortization Of Intangible Assets | 1.20 | 1.20 | 1.30 | 2.50 | 2.60 | 2.60 | 2.80 | 3.70 | 3.90 | 4.40 | 4.60 | 5.20 | 5.40 | 5.70 | 6.20 | 7.30 | 8.80 | 10.30 | 12.25 | 15.31 | 15.50 | 19.56 | 18.17 | 24.46 | 21.06 | 22.39 | 24.14 | 29.00 | 26.49 | 0.00 | 0.00 | 0.00 | NA | |
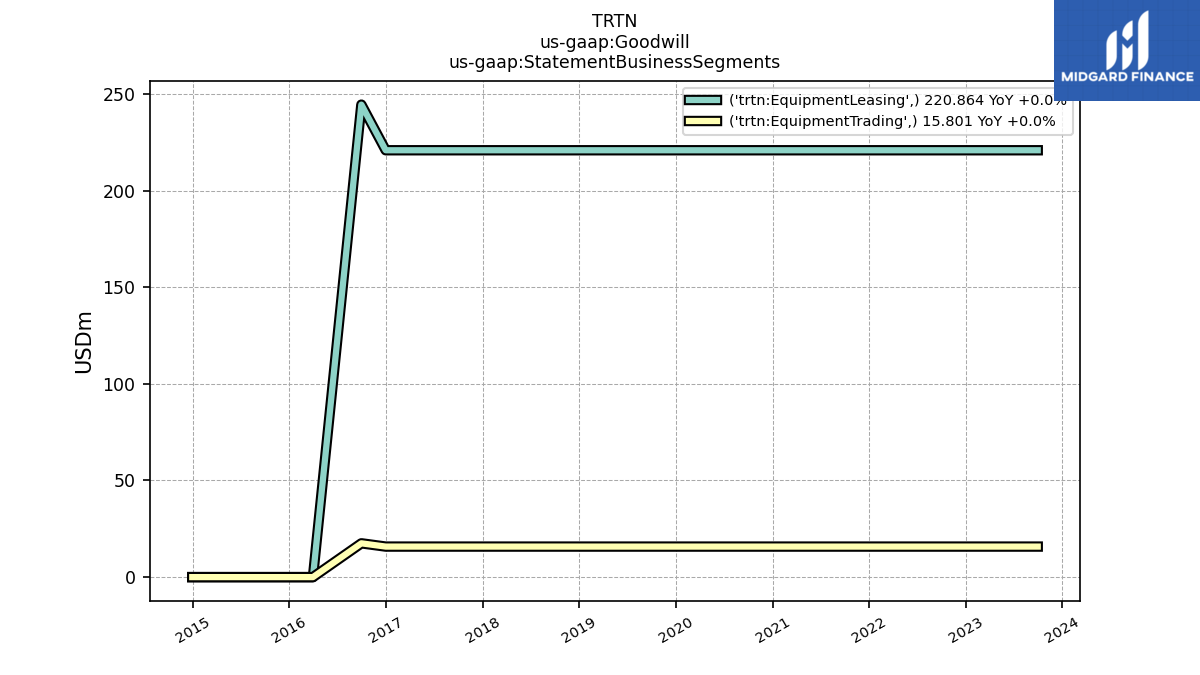
| Goodwill | 236.66 | 236.66 | 236.66 | 236.66 | 236.66 | 236.66 | 236.66 | 236.66 | 236.66 | 236.66 | 236.66 | 236.66 | 236.66 | 236.66 | 236.66 | 236.66 | 236.66 | 236.66 | 236.66 | 236.66 | 236.66 | 236.66 | 236.66 | 236.66 | 236.66 | 236.66 | 236.66 | 236.66 | 261.97 | NA | 0.00 | 0.00 | 0.00 |
| 2023-09-30 | 2023-06-30 | 2023-03-31 | 2022-12-31 | 2022-09-30 | 2022-06-30 | 2022-03-31 | 2021-12-31 | 2021-09-30 | 2021-06-30 | 2021-03-31 | 2020-12-31 | 2020-09-30 | 2020-06-30 | 2020-03-31 | 2019-12-31 | 2019-09-30 | 2019-06-30 | 2019-03-31 | 2018-12-31 | 2018-09-30 | 2018-06-30 | 2018-03-31 | 2017-12-31 | 2017-09-30 | 2017-06-30 | 2017-03-31 | 2016-12-31 | 2016-09-30 | 2016-06-30 | 2016-03-31 | 2015-12-31 | 2015-09-30 | ||
|---|---|---|---|---|---|---|---|---|---|---|---|---|---|---|---|---|---|---|---|---|---|---|---|---|---|---|---|---|---|---|---|---|---|---|
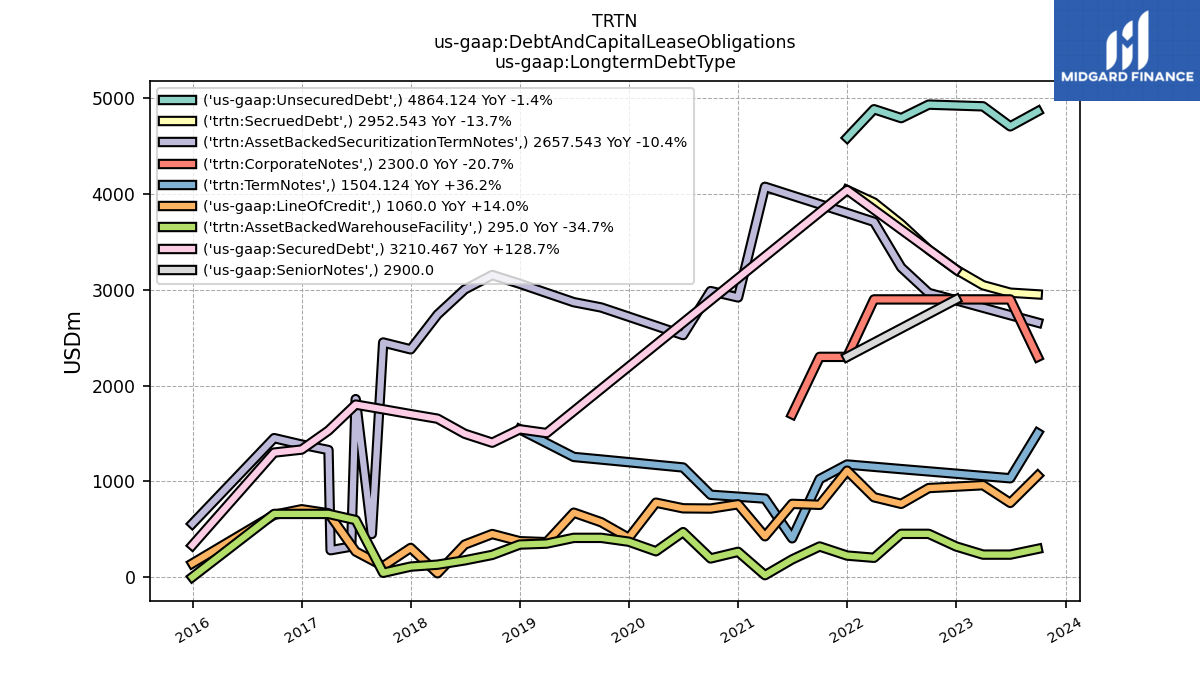
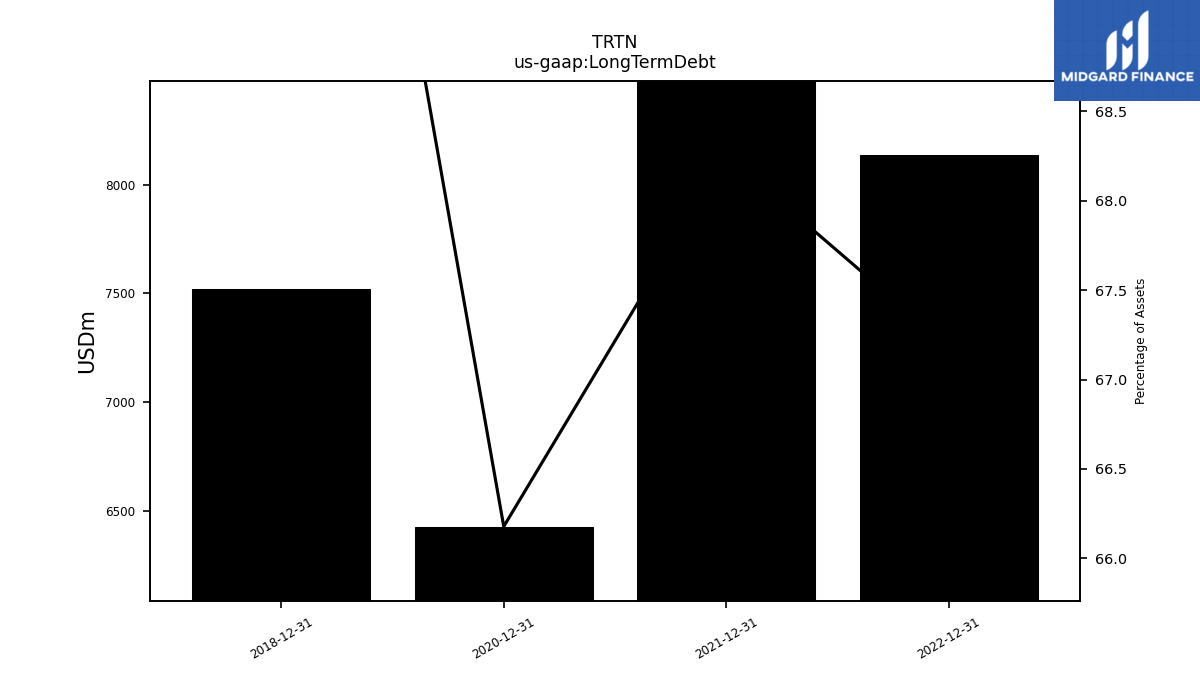
| Long Term Debt | NA | NA | NA | 8135.47 | NA | NA | NA | 8629.82 | NA | NA | NA | 6427.62 | NA | NA | NA | NA | NA | NA | NA | 7520.40 | NA | NA | NA | NA | NA | NA | NA | NA | NA | NA | NA | NA | NA | |
| Debt And Capital Lease Obligations | 7816.67 | 7677.25 | 7963.97 | 8135.47 | NA | NA | NA | 8629.82 | 8307.64 | 7704.92 | 6970.58 | 6444.93 | 6469.94 | 6613.12 | 6789.09 | 6684.16 | 7042.79 | 7266.10 | NA | 7595.92 | NA | NA | NA | NA | NA | NA | NA | 6415.66 | NA | NA | NA | 3185.93 | NA | |
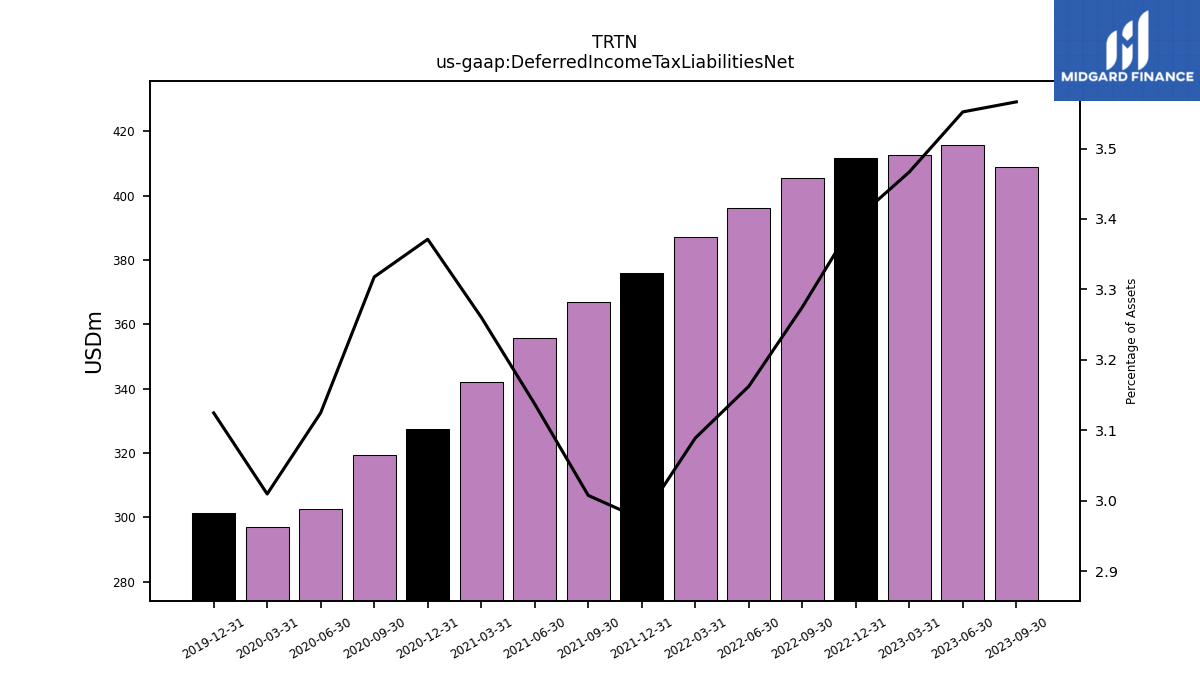
| Deferred Income Tax Liabilities Net | 409.05 | 415.83 | 412.58 | 411.63 | 405.57 | 396.25 | 387.21 | 376.01 | 366.99 | 355.64 | 342.07 | 327.43 | 319.32 | 302.55 | 297.20 | 301.32 | NA | NA | NA | NA | NA | NA | NA | NA | NA | NA | NA | NA | NA | NA | NA | NA | NA |
| 2023-09-30 | 2023-06-30 | 2023-03-31 | 2022-12-31 | 2022-09-30 | 2022-06-30 | 2022-03-31 | 2021-12-31 | 2021-09-30 | 2021-06-30 | 2021-03-31 | 2020-12-31 | 2020-09-30 | 2020-06-30 | 2020-03-31 | 2019-12-31 | 2019-09-30 | 2019-06-30 | 2019-03-31 | 2018-12-31 | 2018-09-30 | 2018-06-30 | 2018-03-31 | 2017-12-31 | 2017-09-30 | 2017-06-30 | 2017-03-31 | 2016-12-31 | 2016-09-30 | 2016-06-30 | 2016-03-31 | 2015-12-31 | 2015-09-30 | ||
|---|---|---|---|---|---|---|---|---|---|---|---|---|---|---|---|---|---|---|---|---|---|---|---|---|---|---|---|---|---|---|---|---|---|---|
| Stockholders Equity | NA | NA | NA | 3204.36 | NA | NA | NA | 3064.71 | NA | NA | NA | 2565.95 | NA | NA | NA | 2532.24 | 2307.98 | 2336.61 | 2251.28 | 2203.70 | 2257.48 | 2202.60 | 2133.51 | 2076.28 | 1900.03 | 1683.47 | 1672.92 | 1663.23 | 1642.69 | 0.01 | 0.01 | -0.01 | NA | |
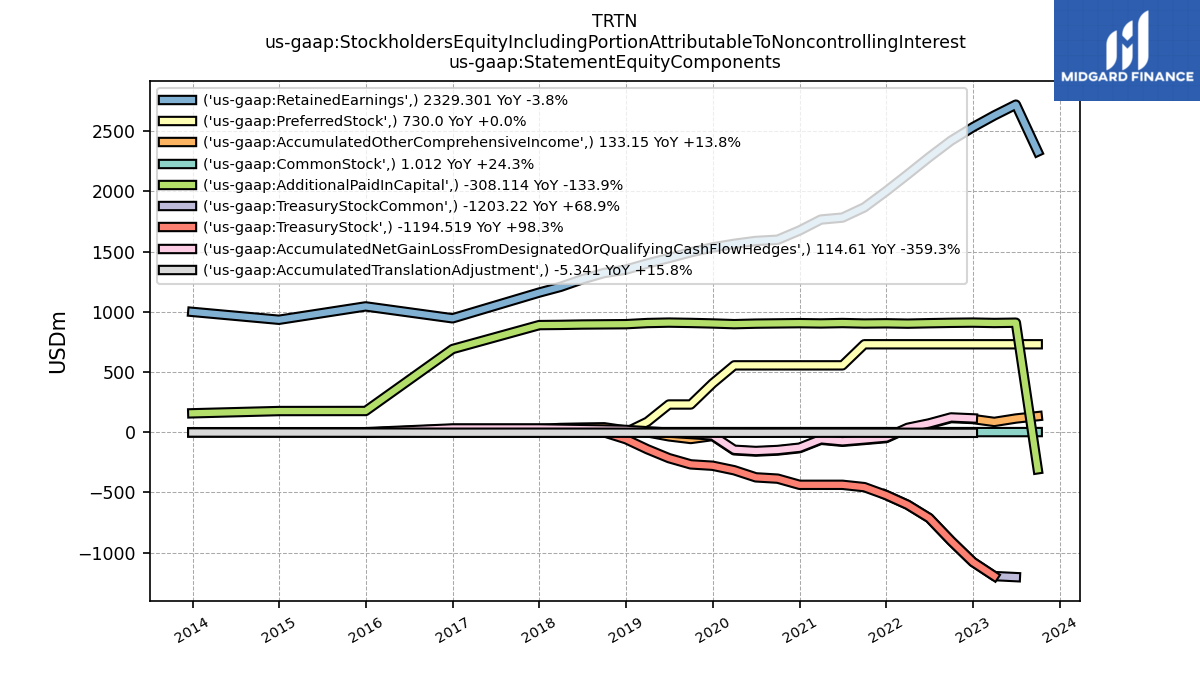
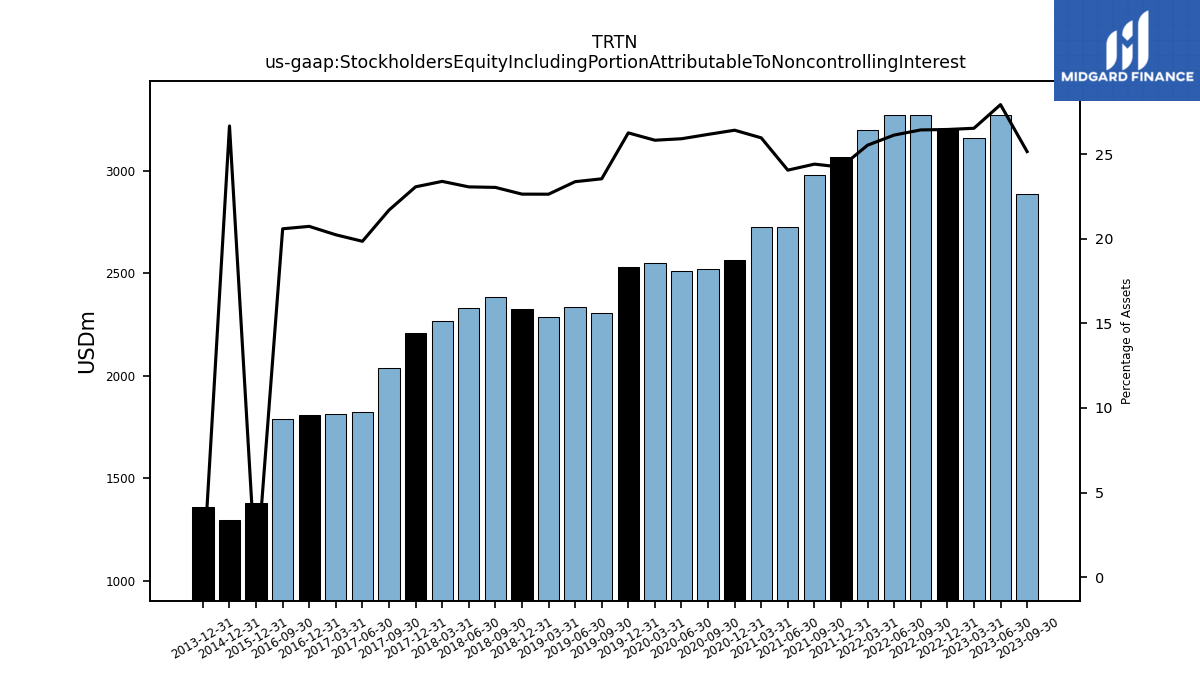
| Stockholders Equity Including Portion Attributable To Noncontrolling Interest | 2885.35 | 3269.89 | 3157.76 | 3204.36 | 3273.92 | 3274.30 | 3200.55 | 3064.71 | 2978.87 | 2727.08 | 2724.32 | 2565.95 | 2518.89 | 2508.95 | 2550.25 | 2532.24 | 2307.98 | 2336.61 | 2288.59 | 2325.21 | 2384.15 | 2332.26 | 2264.77 | 2209.83 | 2035.68 | 1821.30 | 1813.22 | 1806.74 | 1788.89 | NA | NA | 1377.83 | NA | |
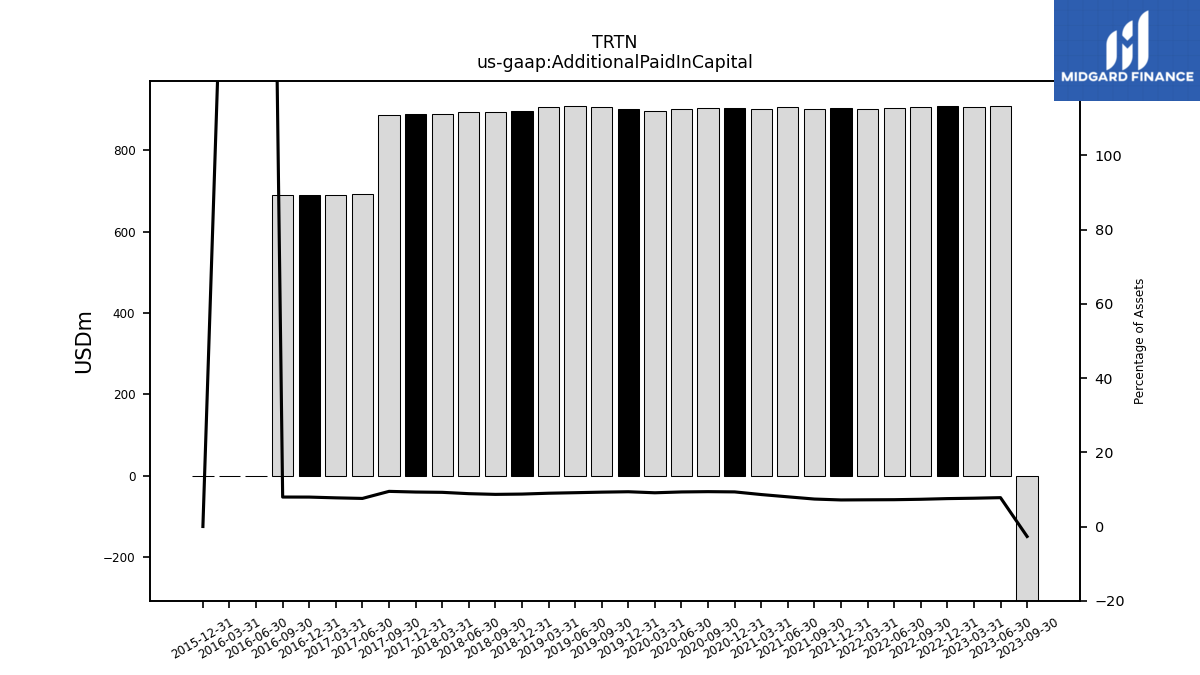
| Additional Paid In Capital | -308.11 | 909.21 | 906.64 | 909.91 | 908.01 | 904.84 | 901.15 | 904.22 | 902.26 | 906.19 | 902.89 | 905.32 | 903.35 | 901.29 | 897.00 | 902.73 | 907.02 | 909.94 | 906.16 | 896.81 | 895.46 | 894.00 | 890.86 | 889.17 | 887.78 | 693.72 | 691.54 | 690.42 | 689.28 | 0.04 | 0.03 | 0.00 | NA | |
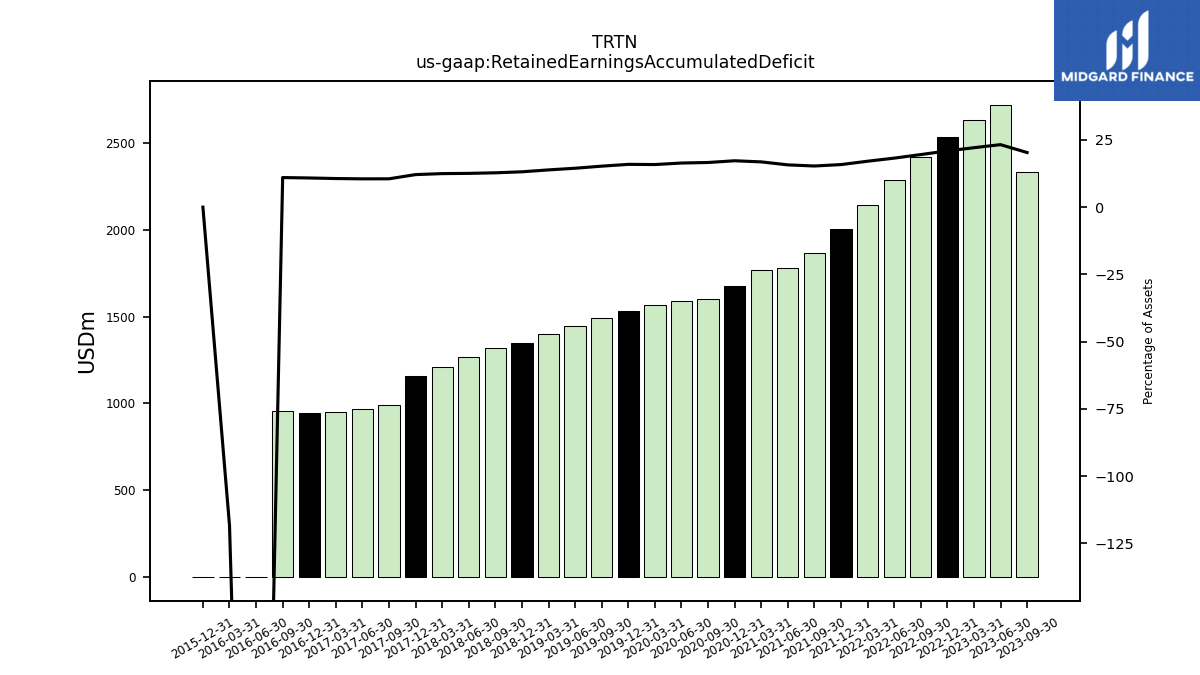
| Retained Earnings Accumulated Deficit | 2329.30 | 2719.56 | 2629.50 | 2531.93 | 2420.17 | 2283.08 | 2139.78 | 2000.85 | 1866.64 | 1781.69 | 1765.50 | 1674.67 | 1597.93 | 1587.75 | 1564.06 | 1533.85 | 1493.77 | 1445.65 | 1400.49 | 1349.63 | 1321.55 | 1269.43 | 1206.85 | 1159.37 | 988.57 | 965.06 | 952.95 | 945.31 | 956.02 | -0.04 | -0.01 | -0.01 | NA | |
| Accumulated Other Comprehensive Income Loss Net Of Tax | 133.15 | 113.53 | 85.32 | 109.27 | 117.05 | 68.14 | 31.34 | -48.82 | -64.64 | -79.79 | -63.06 | -133.03 | -152.50 | -161.00 | -150.62 | -31.63 | -56.38 | -34.44 | -1.03 | 14.56 | 40.78 | 38.36 | 34.99 | 26.94 | 22.88 | 23.95 | 27.70 | 26.76 | -3.36 | NA | NA | -3.67 | NA | |
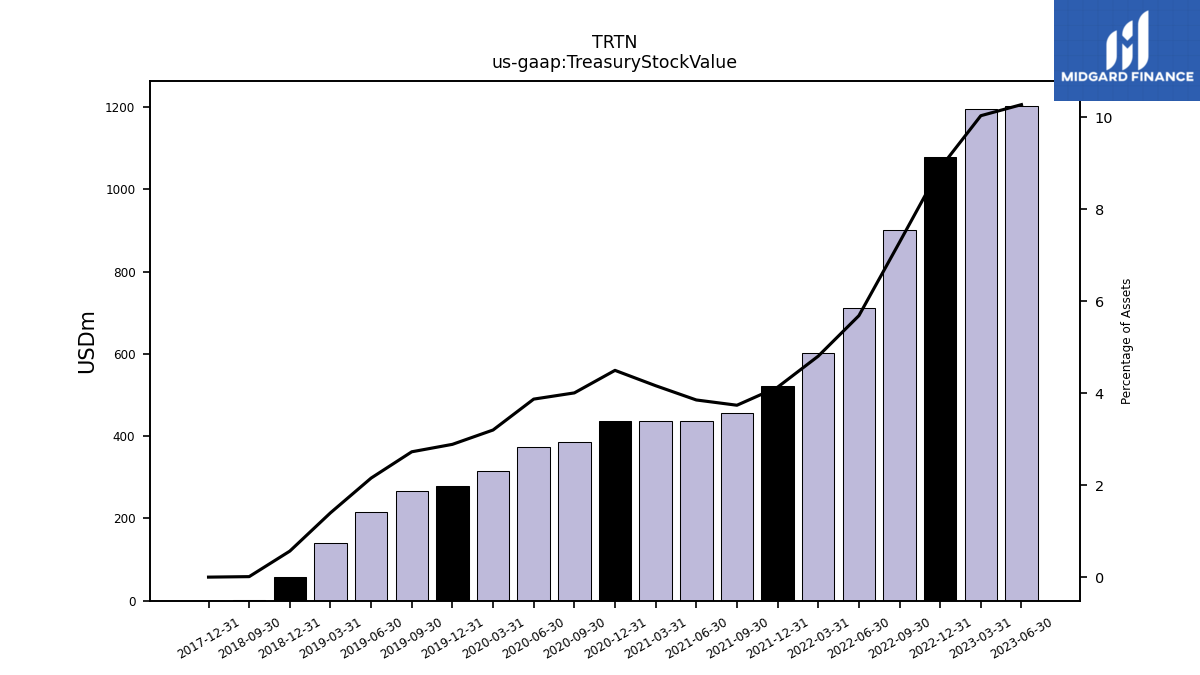
| Treasury Stock Value | NA | 1203.22 | 1194.52 | 1077.56 | 902.12 | 712.58 | 602.53 | 522.36 | 456.22 | 436.82 | 436.82 | 436.82 | 385.70 | 374.90 | 316.00 | 278.51 | 267.23 | 215.35 | 141.41 | 58.11 | 1.11 | NA | NA | 0.00 | NA | NA | NA | NA | NA | NA | NA | NA | NA | |
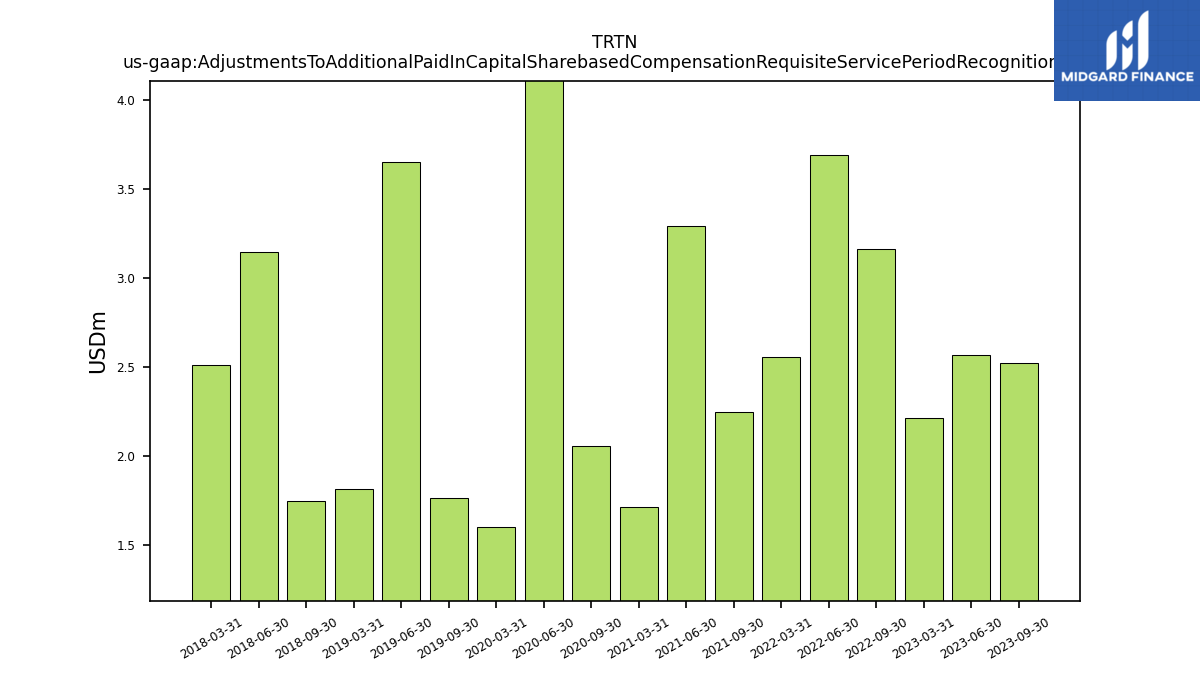
| Adjustments To Additional Paid In Capital Sharebased Compensation Requisite Service Period Recognition Value | 2.52 | 2.57 | 2.21 | NA | 3.17 | 3.69 | 2.56 | NA | 2.25 | 3.29 | 1.72 | NA | 2.06 | 4.26 | 1.60 | NA | 1.77 | 3.65 | 1.82 | NA | 1.75 | 3.15 | 2.51 | NA | NA | NA | NA | NA | NA | NA | NA | NA | NA |
| 2023-09-30 | 2023-06-30 | 2023-03-31 | 2022-12-31 | 2022-09-30 | 2022-06-30 | 2022-03-31 | 2021-12-31 | 2021-09-30 | 2021-06-30 | 2021-03-31 | 2020-12-31 | 2020-09-30 | 2020-06-30 | 2020-03-31 | 2019-12-31 | 2019-09-30 | 2019-06-30 | 2019-03-31 | 2018-12-31 | 2018-09-30 | 2018-06-30 | 2018-03-31 | 2017-12-31 | 2017-09-30 | 2017-06-30 | 2017-03-31 | 2016-12-31 | 2016-09-30 | 2016-06-30 | 2016-03-31 | 2015-12-31 | 2015-09-30 | ||
|---|---|---|---|---|---|---|---|---|---|---|---|---|---|---|---|---|---|---|---|---|---|---|---|---|---|---|---|---|---|---|---|---|---|---|
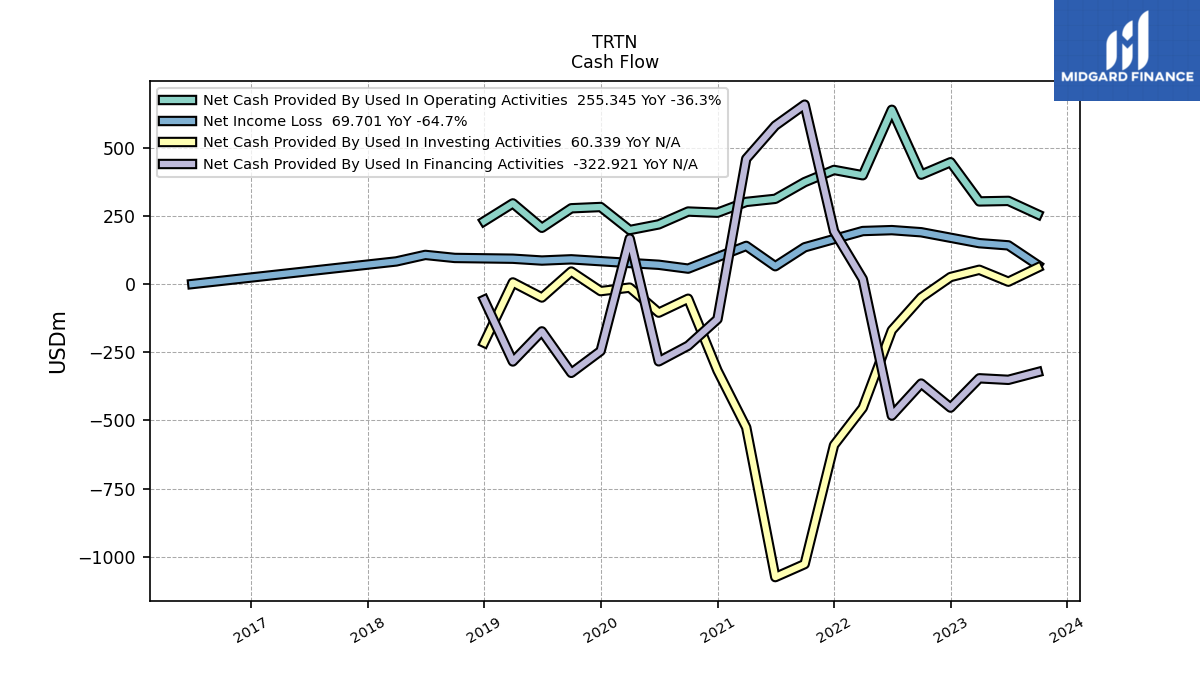
| Net Cash Provided By Used In Operating Activities | 255.34 | 304.79 | 302.82 | 446.61 | 400.81 | 638.78 | 398.67 | 418.25 | 373.60 | 312.33 | 300.99 | 261.41 | 265.77 | 218.61 | 197.96 | 282.40 | 277.69 | 206.08 | 295.73 | 230.04 | NA | NA | NA | NA | NA | NA | NA | NA | NA | NA | NA | NA | NA | |
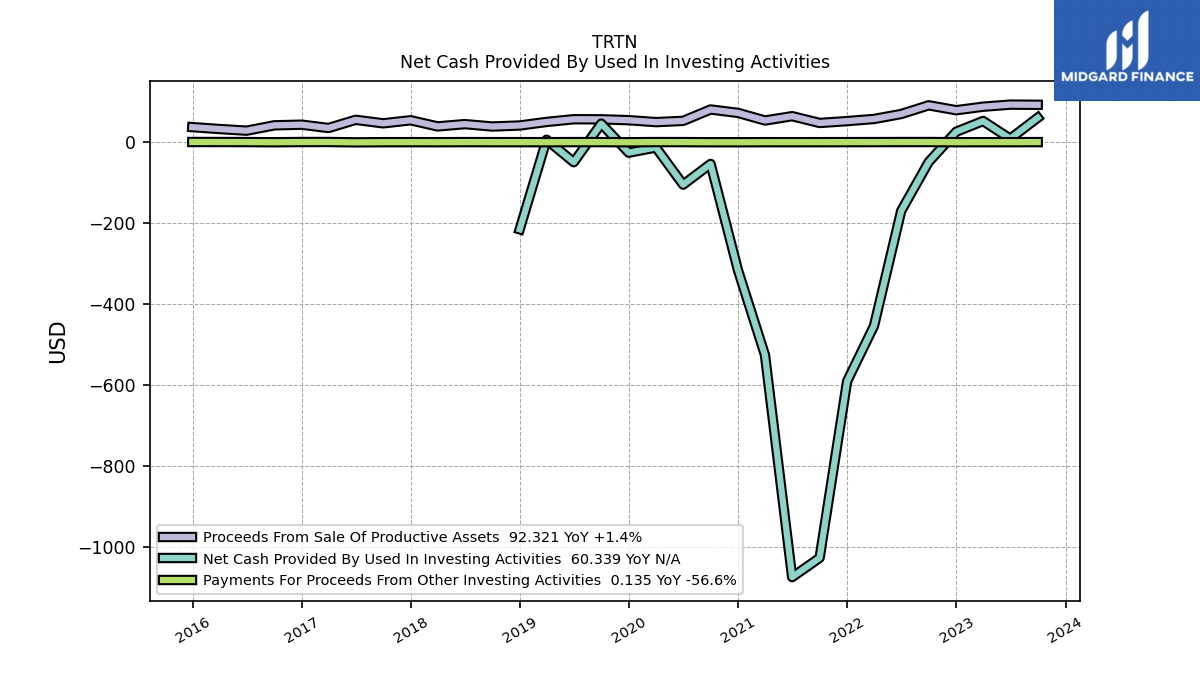
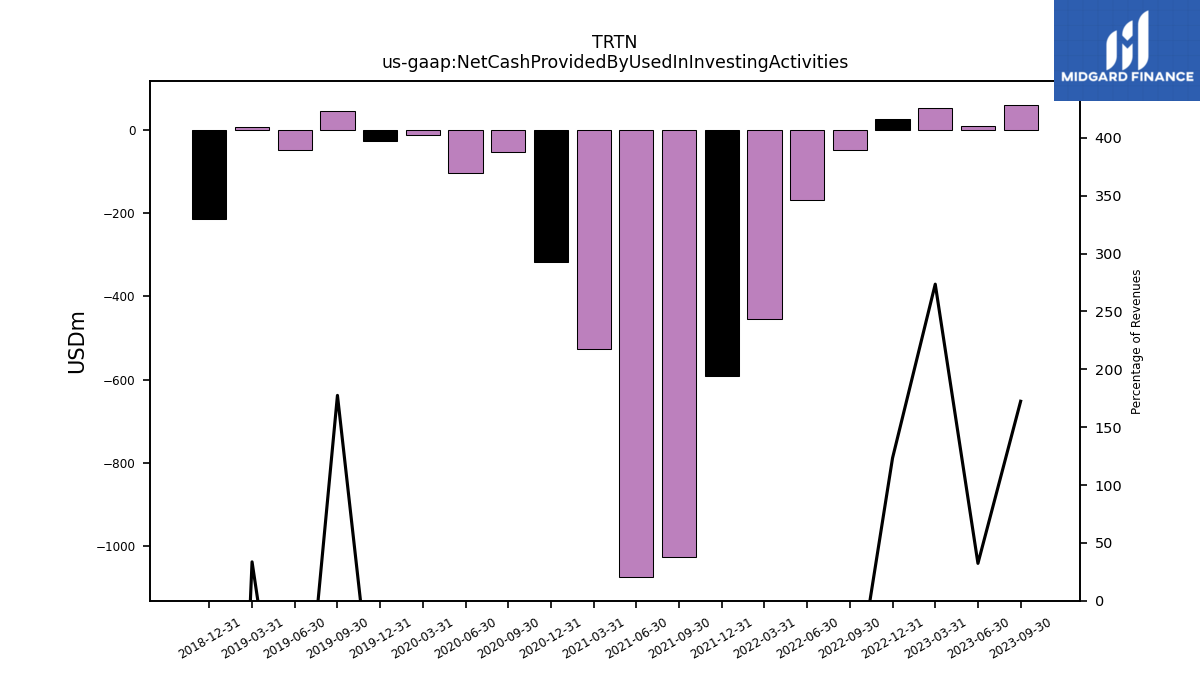
| Net Cash Provided By Used In Investing Activities | 60.34 | 8.54 | 52.26 | 25.73 | -49.09 | -169.72 | -453.89 | -590.51 | -1026.79 | -1074.41 | -525.68 | -317.23 | -53.76 | -104.90 | -13.12 | -25.99 | 45.78 | -49.51 | 5.99 | -215.21 | NA | NA | NA | NA | NA | NA | NA | NA | NA | NA | NA | NA | NA | |
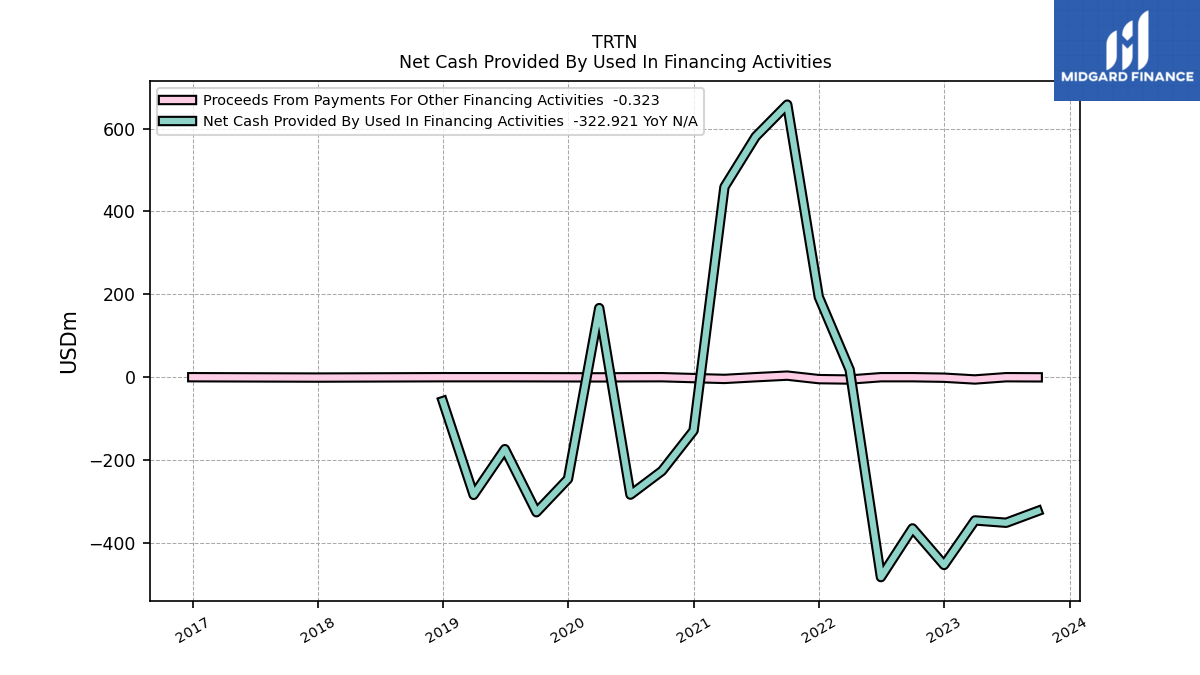
| Net Cash Provided By Used In Financing Activities | -322.92 | -351.20 | -345.53 | -453.05 | -364.81 | -482.36 | 18.08 | 193.43 | 657.68 | 580.62 | 459.04 | -128.93 | -226.15 | -283.40 | 166.77 | -245.55 | -325.75 | -173.51 | -283.94 | -57.75 | NA | NA | NA | NA | NA | NA | NA | NA | NA | NA | NA | NA | NA |
| 2023-09-30 | 2023-06-30 | 2023-03-31 | 2022-12-31 | 2022-09-30 | 2022-06-30 | 2022-03-31 | 2021-12-31 | 2021-09-30 | 2021-06-30 | 2021-03-31 | 2020-12-31 | 2020-09-30 | 2020-06-30 | 2020-03-31 | 2019-12-31 | 2019-09-30 | 2019-06-30 | 2019-03-31 | 2018-12-31 | 2018-09-30 | 2018-06-30 | 2018-03-31 | 2017-12-31 | 2017-09-30 | 2017-06-30 | 2017-03-31 | 2016-12-31 | 2016-09-30 | 2016-06-30 | 2016-03-31 | 2015-12-31 | 2015-09-30 | ||
|---|---|---|---|---|---|---|---|---|---|---|---|---|---|---|---|---|---|---|---|---|---|---|---|---|---|---|---|---|---|---|---|---|---|---|
| Net Cash Provided By Used In Operating Activities | 255.34 | 304.79 | 302.82 | 446.61 | 400.81 | 638.78 | 398.67 | 418.25 | 373.60 | 312.33 | 300.99 | 261.41 | 265.77 | 218.61 | 197.96 | 282.40 | 277.69 | 206.08 | 295.73 | 230.04 | NA | NA | NA | NA | NA | NA | NA | NA | NA | NA | NA | NA | NA | |
| Net Income Loss | 69.70 | 141.76 | 149.81 | NA | 189.84 | 197.62 | 194.26 | NA | 134.73 | 65.22 | 139.84 | NA | 56.46 | 70.59 | 77.04 | NA | 90.60 | 86.10 | 92.81 | NA | 95.63 | 106.75 | 82.86 | NA | NA | NA | NA | NA | NA | -0.02 | NA | NA | NA | |
| Profit Loss | 69.70 | 141.76 | 149.81 | 165.21 | 189.84 | 197.62 | 194.26 | 190.45 | 134.73 | 65.22 | 139.84 | 125.70 | 56.46 | 70.59 | 77.04 | 83.77 | 90.60 | 86.10 | 92.81 | 71.42 | 95.63 | 106.75 | 82.86 | 209.66 | 59.55 | 48.01 | 36.30 | NA | NA | NA | NA | NA | NA | |
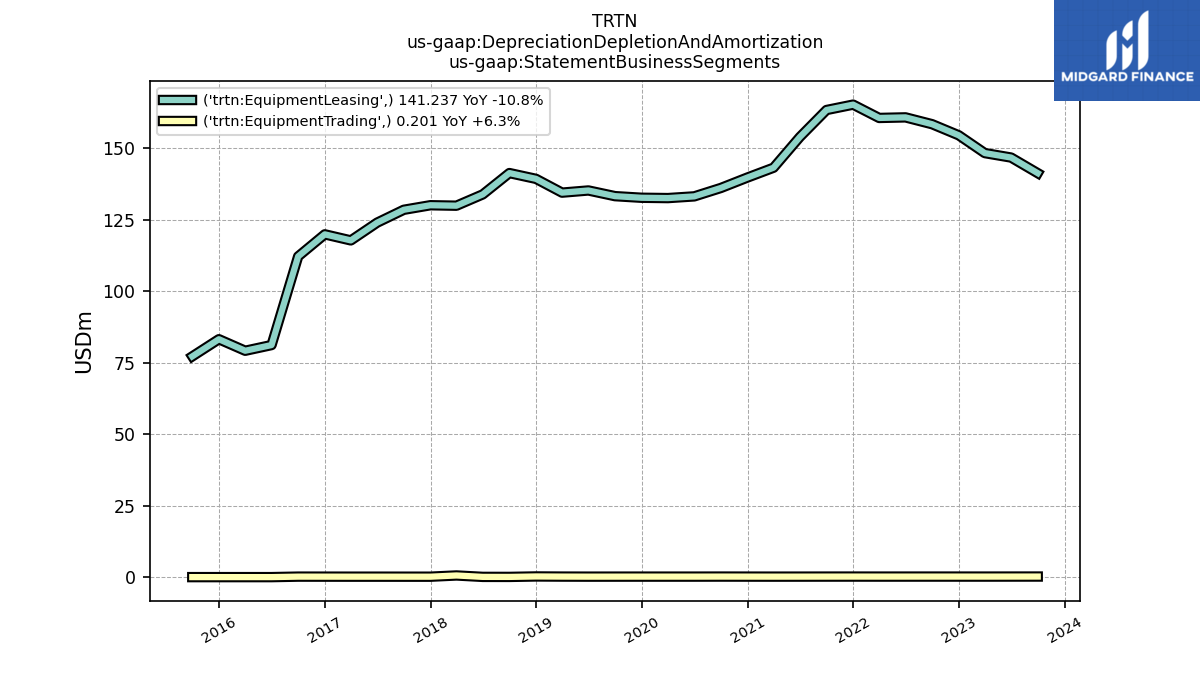
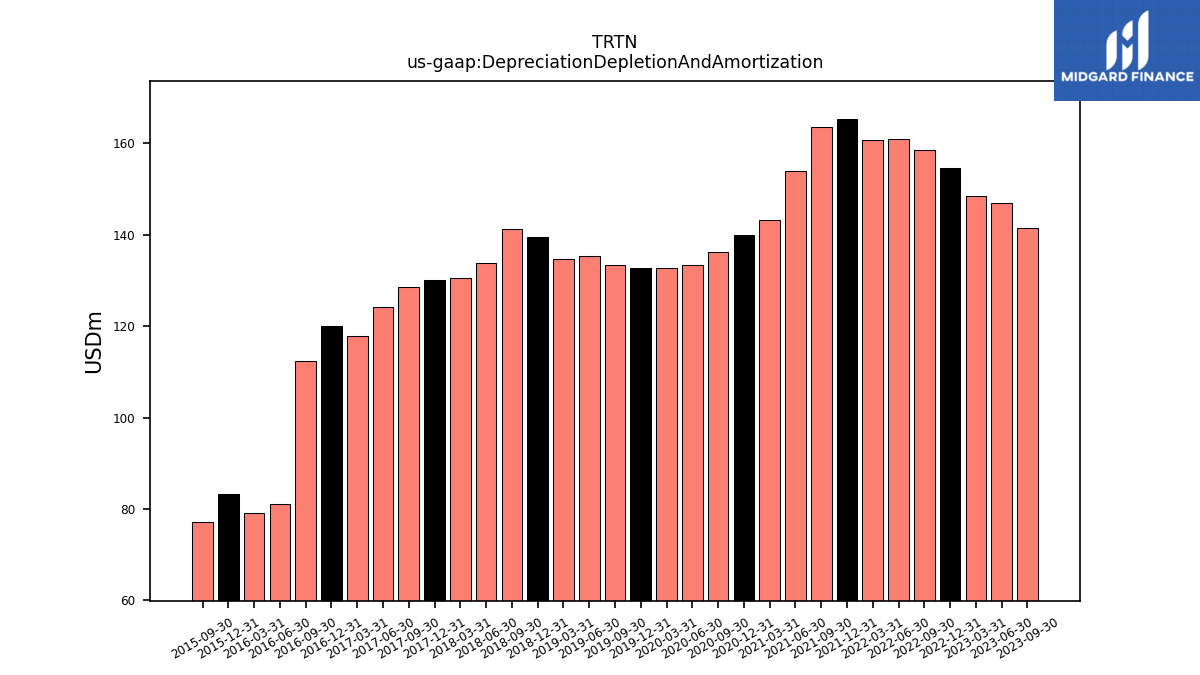
| Depreciation Depletion And Amortization | 141.44 | 146.88 | 148.44 | 154.66 | 158.54 | 160.92 | 160.72 | 165.38 | 163.49 | 154.06 | 143.31 | 139.89 | 136.25 | 133.29 | 132.69 | 132.81 | 133.37 | 135.35 | 134.61 | 139.47 | 141.34 | 133.89 | 130.43 | 130.17 | 128.58 | 124.09 | 117.88 | 120.01 | 112.31 | 81.13 | 79.14 | 83.17 | 77.18 | |
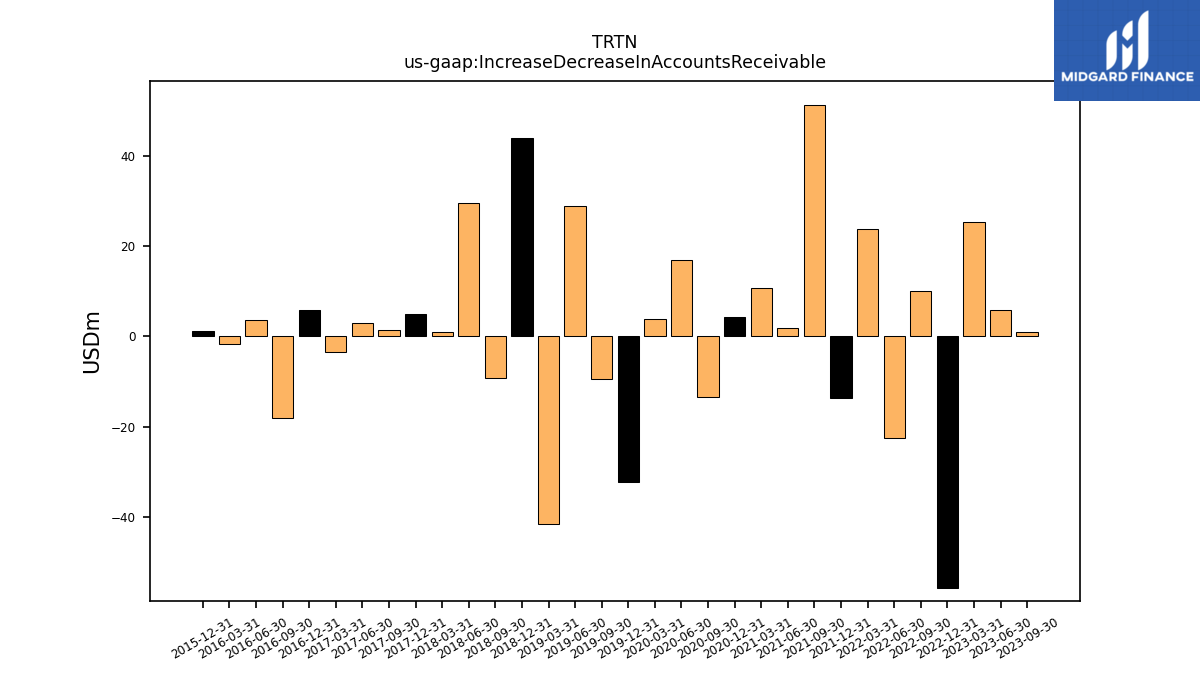
| Increase Decrease In Accounts Receivable | 0.94 | 5.90 | 25.33 | -55.66 | 10.08 | -22.38 | 23.84 | -13.58 | 51.21 | 1.88 | 10.83 | 4.42 | -13.45 | 17.00 | 3.77 | -32.16 | -9.46 | 28.88 | -41.42 | 43.95 | -9.11 | 29.48 | 1.07 | 4.87 | 1.50 | 2.96 | -3.35 | 5.82 | -17.94 | 3.67 | -1.66 | 1.15 | NA | |
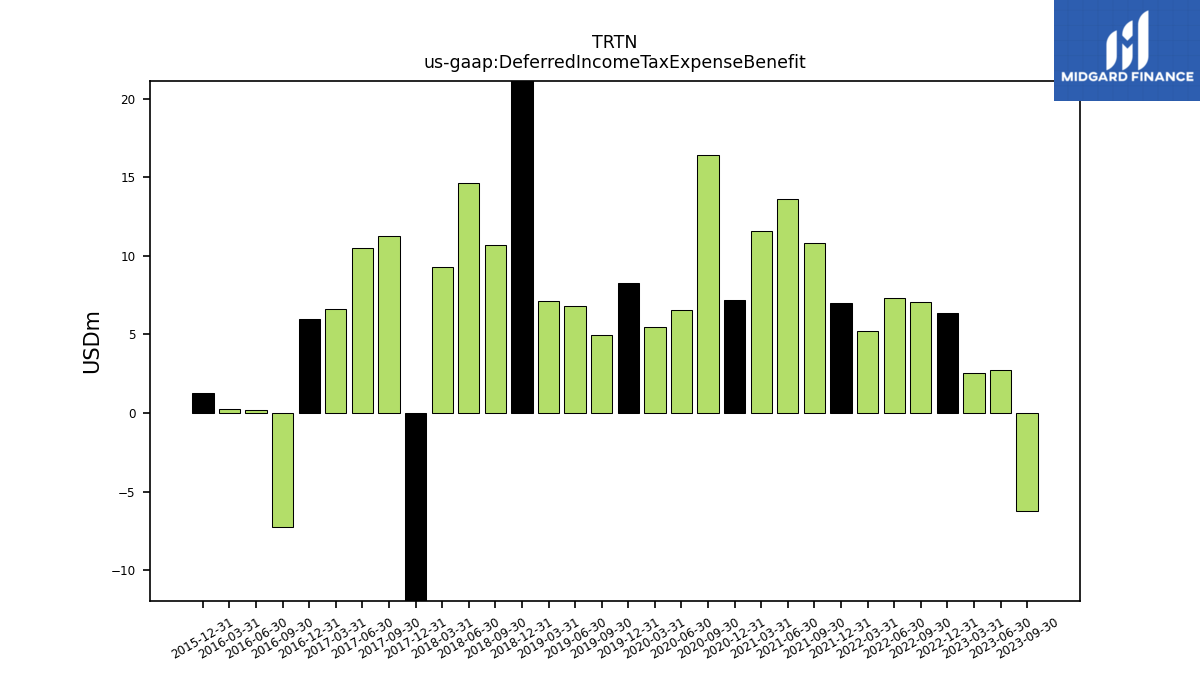
| Deferred Income Tax Expense Benefit | -6.26 | 2.71 | 2.52 | 6.38 | 7.09 | 7.35 | 5.19 | 7.00 | 10.85 | 13.61 | 11.62 | 7.22 | 16.40 | 6.53 | 5.50 | 8.30 | 4.97 | 6.79 | 7.12 | 31.83 | 10.69 | 14.64 | 9.30 | -123.05 | 11.27 | 10.51 | 6.59 | 5.96 | -7.22 | 0.18 | 0.27 | 1.25 | NA | |
| Share Based Compensation | 2.50 | 2.60 | 2.20 | NA | 3.20 | 3.70 | 2.60 | NA | 2.20 | 3.30 | 1.70 | NA | 2.10 | 4.30 | 1.60 | NA | 1.80 | 3.70 | 1.80 | 1.63 | 1.70 | 3.20 | 2.50 | 1.15 | 1.19 | 2.24 | 1.06 | 1.06 | 2.05 | 0.93 | 1.36 | 2.50 | NA | |
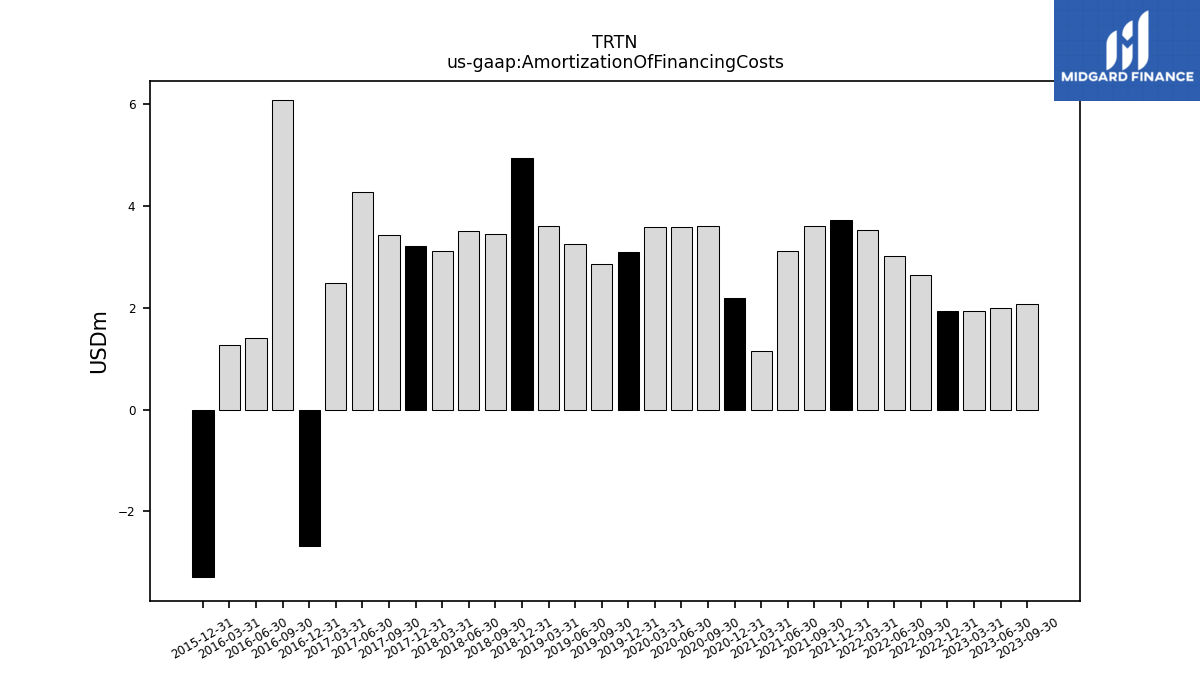
| Amortization Of Financing Costs | 2.07 | 1.99 | 1.95 | 1.93 | 2.64 | 3.02 | 3.53 | 3.73 | 3.62 | 3.11 | 1.14 | 2.18 | 3.60 | 3.59 | 3.60 | 3.09 | 2.87 | 3.25 | 3.60 | 4.93 | 3.44 | 3.51 | 3.11 | 3.22 | 3.42 | 4.27 | 2.49 | -2.68 | 6.09 | 1.41 | 1.26 | -3.29 | NA |
| 2023-09-30 | 2023-06-30 | 2023-03-31 | 2022-12-31 | 2022-09-30 | 2022-06-30 | 2022-03-31 | 2021-12-31 | 2021-09-30 | 2021-06-30 | 2021-03-31 | 2020-12-31 | 2020-09-30 | 2020-06-30 | 2020-03-31 | 2019-12-31 | 2019-09-30 | 2019-06-30 | 2019-03-31 | 2018-12-31 | 2018-09-30 | 2018-06-30 | 2018-03-31 | 2017-12-31 | 2017-09-30 | 2017-06-30 | 2017-03-31 | 2016-12-31 | 2016-09-30 | 2016-06-30 | 2016-03-31 | 2015-12-31 | 2015-09-30 | ||
|---|---|---|---|---|---|---|---|---|---|---|---|---|---|---|---|---|---|---|---|---|---|---|---|---|---|---|---|---|---|---|---|---|---|---|
| Net Cash Provided By Used In Investing Activities | 60.34 | 8.54 | 52.26 | 25.73 | -49.09 | -169.72 | -453.89 | -590.51 | -1026.79 | -1074.41 | -525.68 | -317.23 | -53.76 | -104.90 | -13.12 | -25.99 | 45.78 | -49.51 | 5.99 | -215.21 | NA | NA | NA | NA | NA | NA | NA | NA | NA | NA | NA | NA | NA | |
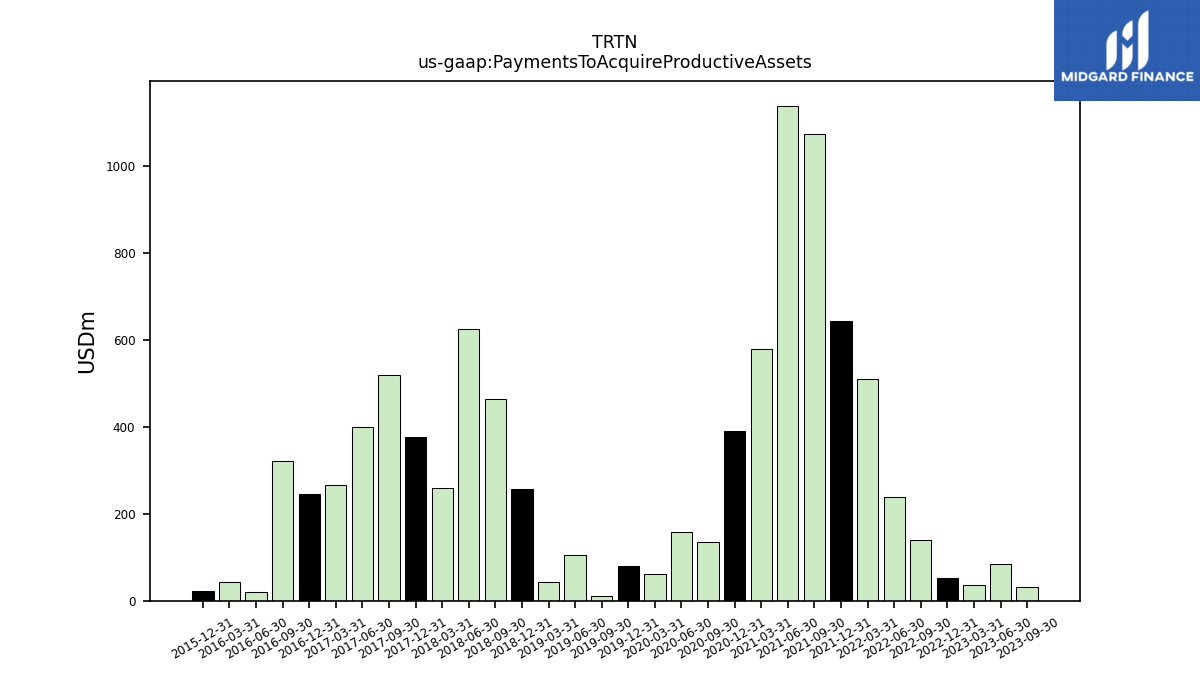
| Payments To Acquire Productive Assets | 31.85 | 84.20 | 35.32 | 53.25 | 139.79 | 238.99 | 511.03 | 642.45 | 1074.10 | 1138.63 | 579.21 | 389.70 | 134.64 | 157.38 | 62.41 | 79.65 | 10.53 | 106.00 | 43.98 | 256.31 | 463.19 | 625.34 | 258.67 | 377.38 | 520.01 | 399.77 | 265.71 | 244.59 | 320.64 | 21.01 | 43.09 | 23.00 | NA |
| 2023-09-30 | 2023-06-30 | 2023-03-31 | 2022-12-31 | 2022-09-30 | 2022-06-30 | 2022-03-31 | 2021-12-31 | 2021-09-30 | 2021-06-30 | 2021-03-31 | 2020-12-31 | 2020-09-30 | 2020-06-30 | 2020-03-31 | 2019-12-31 | 2019-09-30 | 2019-06-30 | 2019-03-31 | 2018-12-31 | 2018-09-30 | 2018-06-30 | 2018-03-31 | 2017-12-31 | 2017-09-30 | 2017-06-30 | 2017-03-31 | 2016-12-31 | 2016-09-30 | 2016-06-30 | 2016-03-31 | 2015-12-31 | 2015-09-30 | ||
|---|---|---|---|---|---|---|---|---|---|---|---|---|---|---|---|---|---|---|---|---|---|---|---|---|---|---|---|---|---|---|---|---|---|---|
| Net Cash Provided By Used In Financing Activities | -322.92 | -351.20 | -345.53 | -453.05 | -364.81 | -482.36 | 18.08 | 193.43 | 657.68 | 580.62 | 459.04 | -128.93 | -226.15 | -283.40 | 166.77 | -245.55 | -325.75 | -173.51 | -283.94 | -57.75 | NA | NA | NA | NA | NA | NA | NA | NA | NA | NA | NA | NA | NA | |
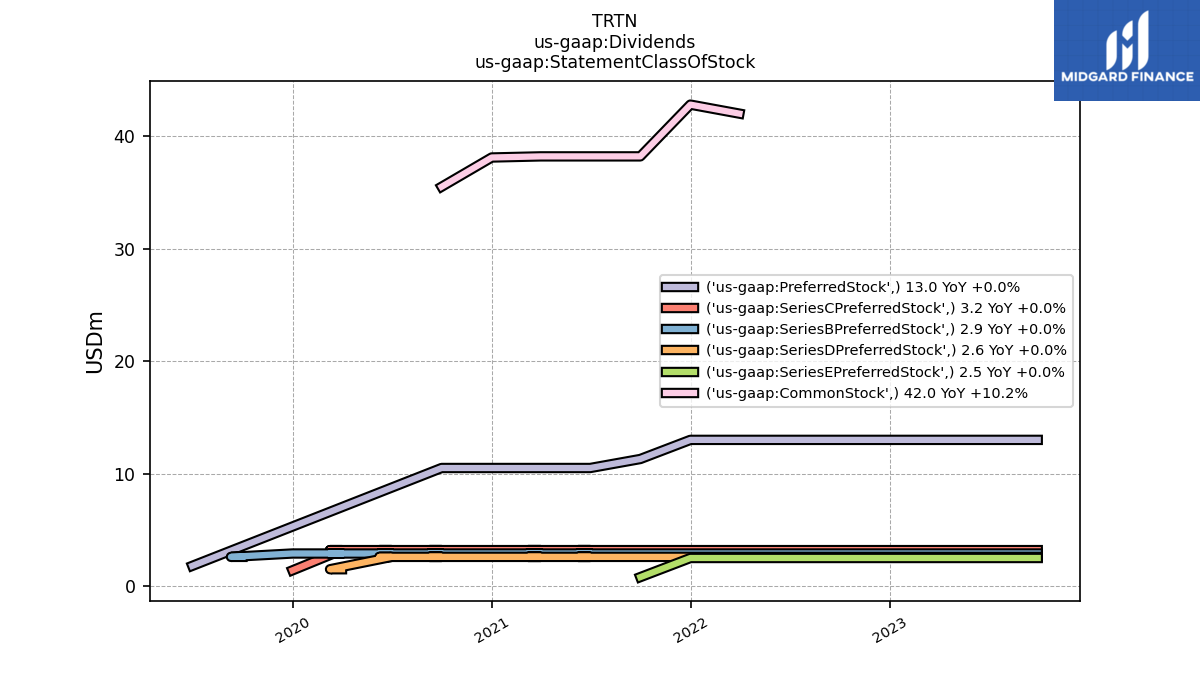
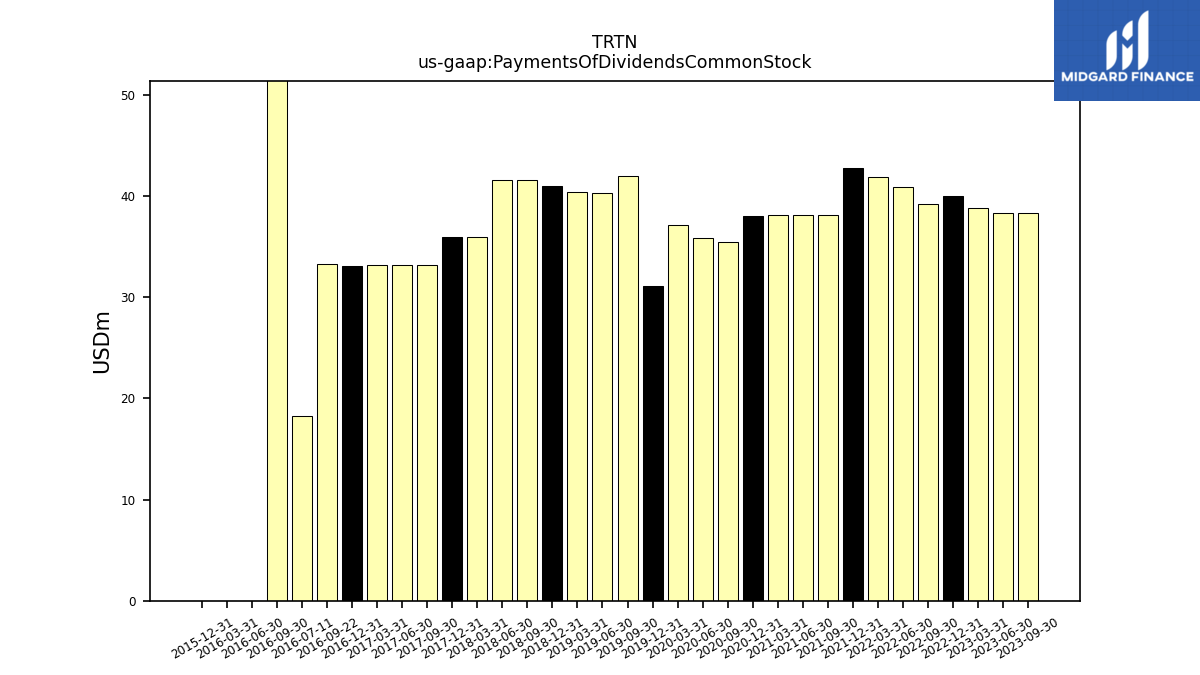
| Payments Of Dividends Common Stock | 38.34 | 38.34 | 38.87 | 40.02 | 39.27 | 40.93 | 41.95 | 42.83 | 38.17 | 38.16 | 38.15 | 38.05 | 35.46 | 35.85 | 37.11 | 31.09 | 41.98 | 40.37 | 40.43 | 41.01 | 41.64 | 41.63 | 36.01 | 35.97 | 33.20 | 33.20 | 33.18 | 33.13 | 51.62 | 0.00 | 0.00 | 0.00 | NA |
| 2023-09-30 | 2023-06-30 | 2023-03-31 | 2022-12-31 | 2022-09-30 | 2022-06-30 | 2022-03-31 | 2021-12-31 | 2021-09-30 | 2021-06-30 | 2021-03-31 | 2020-12-31 | 2020-09-30 | 2020-06-30 | 2020-03-31 | 2019-12-31 | 2019-09-30 | 2019-06-30 | 2019-03-31 | 2018-12-31 | 2018-09-30 | 2018-06-30 | 2018-03-31 | 2017-12-31 | 2017-09-30 | 2017-06-30 | 2017-03-31 | 2016-12-31 | 2016-09-30 | 2016-06-30 | 2016-03-31 | 2015-12-31 | 2015-09-30 | ||
|---|---|---|---|---|---|---|---|---|---|---|---|---|---|---|---|---|---|---|---|---|---|---|---|---|---|---|---|---|---|---|---|---|---|---|
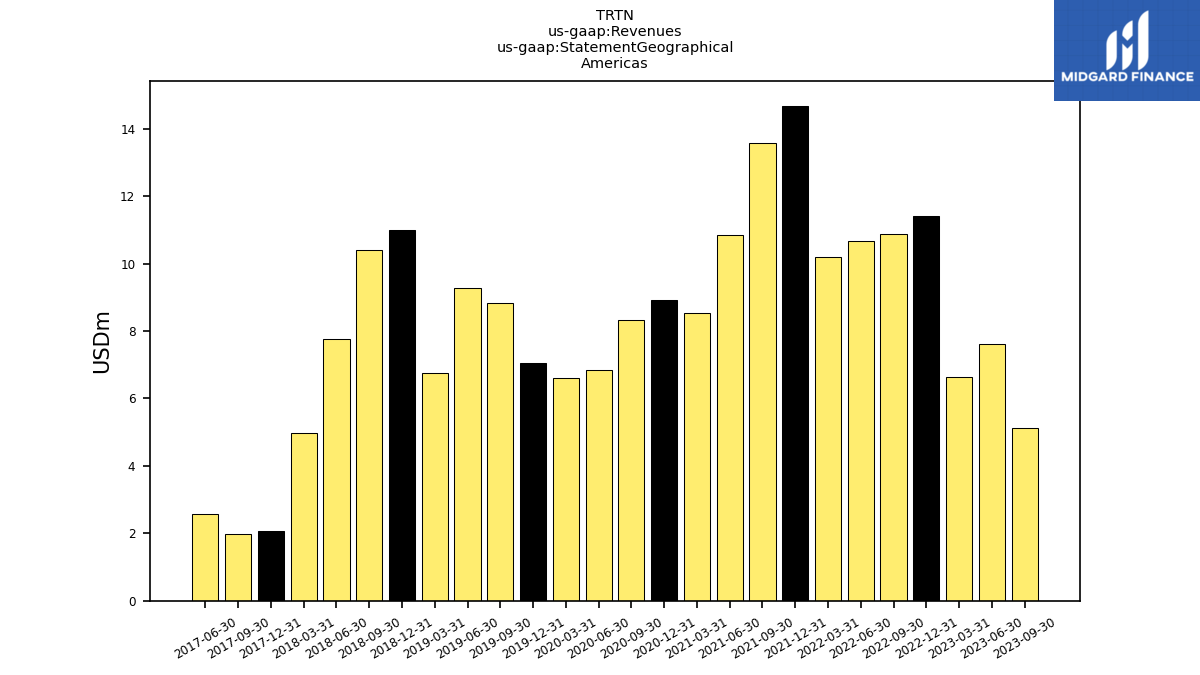
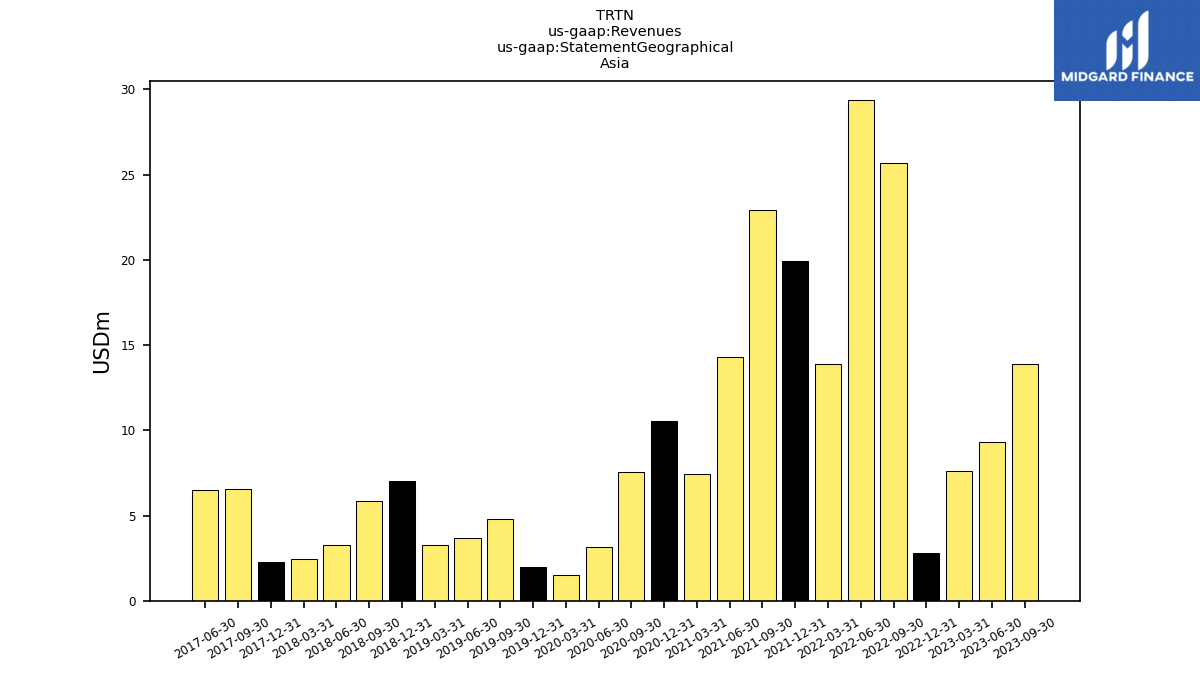
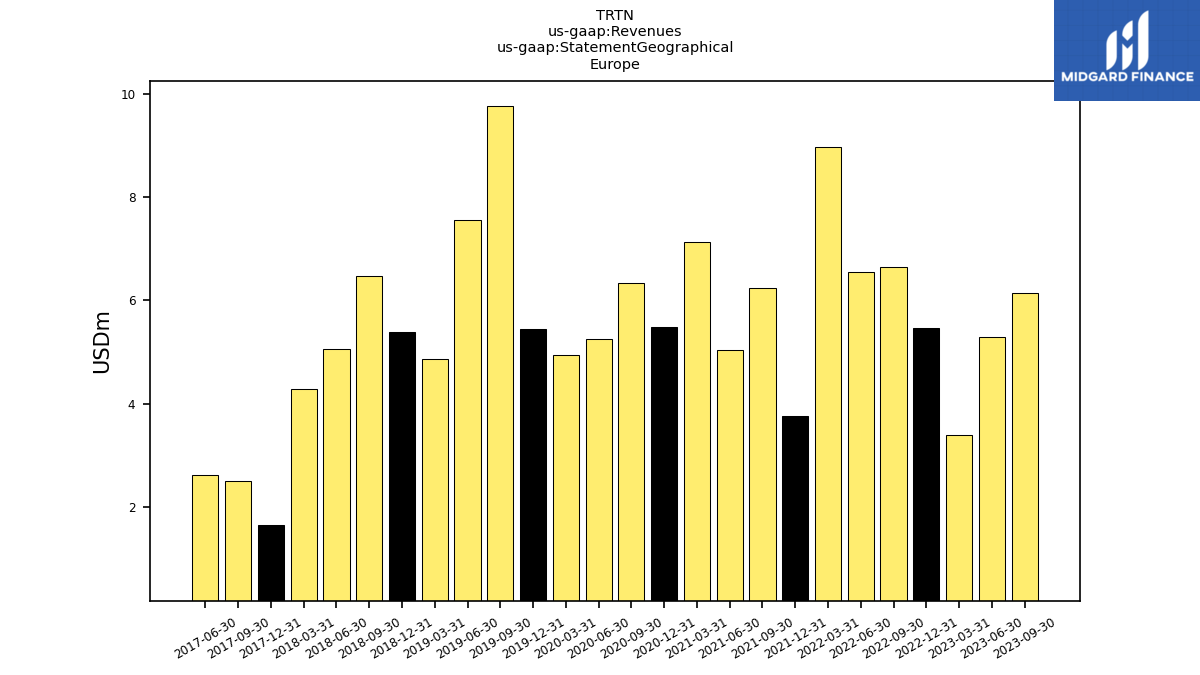
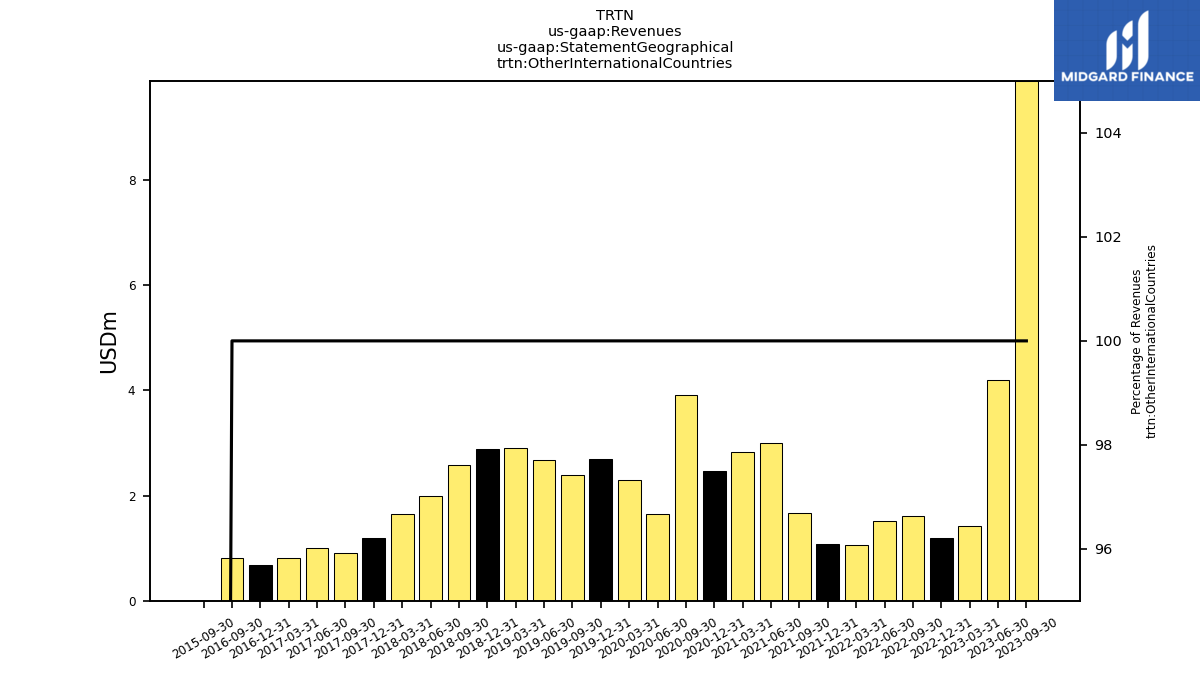
| Revenues | 35.00 | 26.43 | 19.10 | 20.86 | 44.79 | 48.11 | 34.12 | 39.42 | 44.42 | 33.18 | 25.95 | 27.40 | 26.09 | 16.90 | 15.38 | 17.16 | 25.80 | 23.21 | 17.83 | 26.27 | 25.29 | 18.10 | 13.38 | 7.21 | 11.97 | 12.76 | 5.48 | 6.60 | 9.82 | 0.00 | 0.00 | 0.00 | 0.00 | |
| 5.11 | 7.63 | 6.65 | 11.40 | 10.86 | 10.66 | 10.19 | 14.68 | 13.59 | 10.83 | 8.54 | 8.93 | 8.32 | 6.84 | 6.59 | 7.06 | 8.83 | 9.29 | 6.76 | 11.00 | 10.41 | 7.77 | 4.98 | 2.08 | 1.97 | 2.58 | NA | NA | NA | NA | NA | NA | NA | ||
| 13.87 | 9.31 | 7.63 | 2.80 | 25.66 | 29.37 | 13.91 | 19.90 | 22.92 | 14.31 | 7.46 | 10.52 | 7.55 | 3.15 | 1.53 | 1.95 | 4.81 | 3.69 | 3.29 | 7.00 | 5.82 | 3.26 | 2.45 | 2.28 | 6.58 | 6.52 | NA | NA | NA | NA | NA | NA | NA | ||
| 6.13 | 5.30 | 3.41 | 5.46 | 6.65 | 6.55 | 8.96 | 3.76 | 6.25 | 5.04 | 7.12 | 5.49 | 6.33 | 5.26 | 4.95 | 5.45 | 9.76 | 7.56 | 4.87 | 5.38 | 6.47 | 5.06 | 4.29 | 1.66 | 2.51 | 2.63 | NA | NA | NA | NA | NA | NA | NA | ||
| Other International Countries | 9.88 | 4.19 | 1.42 | 1.19 | 1.62 | 1.52 | 1.06 | 1.08 | 1.67 | 3.00 | 2.82 | 2.47 | 3.90 | 1.64 | 2.30 | 2.69 | 2.40 | 2.67 | 2.90 | 2.89 | 2.59 | 2.00 | 1.65 | 1.20 | 0.91 | 1.00 | 0.82 | 0.68 | 0.81 | NA | NA | NA | 0.00 |

