
| 2023-09-30 | 2023-06-30 | 2023-03-31 | 2022-12-31 | 2022-09-30 | 2022-06-30 | 2022-03-31 | 2021-12-31 | 2021-09-30 | 2021-06-30 | 2021-03-31 | 2020-12-31 | 2020-09-30 | 2020-06-30 | 2020-03-31 | 2019-12-31 | 2019-09-30 | 2019-06-30 | 2019-03-31 | 2018-12-31 | 2018-09-30 | 2018-06-30 | 2018-03-31 | 2017-12-31 | 2017-09-30 | 2017-06-30 | 2017-03-31 | 2016-12-31 | 2016-09-30 | 2016-06-30 | 2016-03-31 | 2015-12-31 | 2015-09-30 | 2015-06-30 | 2015-03-31 | 2014-12-31 | 2014-09-30 | 2014-06-30 | 2014-03-31 | 2013-12-31 | 2013-09-30 | 2013-06-30 | 2013-03-31 | 2012-12-31 | 2012-09-30 | 2012-06-30 | 2012-03-31 | ||
|---|---|---|---|---|---|---|---|---|---|---|---|---|---|---|---|---|---|---|---|---|---|---|---|---|---|---|---|---|---|---|---|---|---|---|---|---|---|---|---|---|---|---|---|---|---|---|---|---|
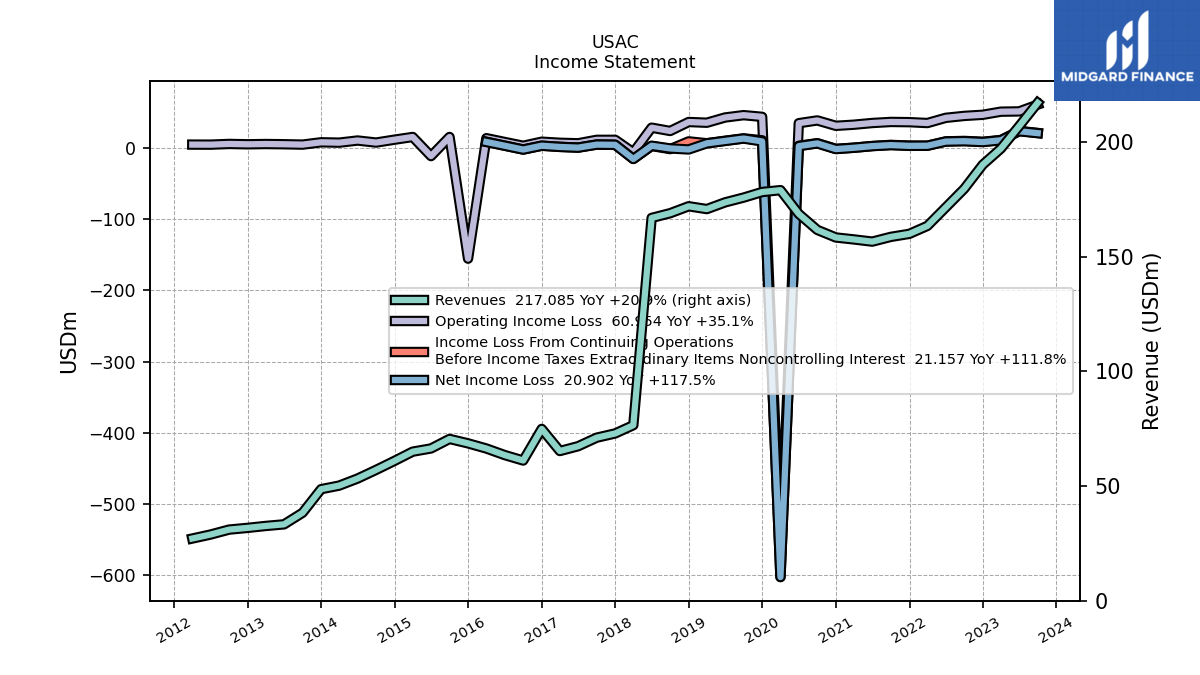
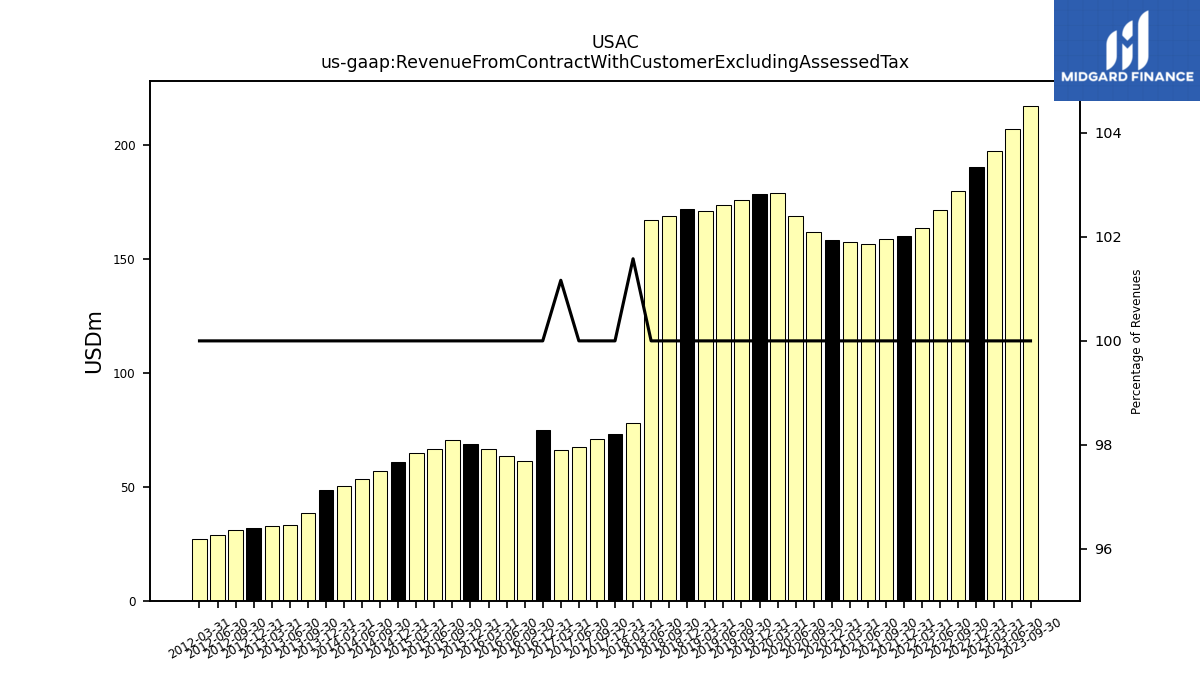
| Revenue From Contract With Customer Excluding Assessed Tax | 217.09 | 206.92 | 197.12 | 190.11 | 179.61 | 171.46 | 163.41 | 159.94 | 158.63 | 156.56 | 157.51 | 158.37 | 161.67 | 168.65 | 179.00 | 178.19 | 175.76 | 173.68 | 170.75 | 171.98 | 168.95 | 166.90 | 77.74 | 72.94 | 71.09 | 67.37 | 66.03 | 74.91 | 61.13 | 63.51 | 66.37 | 68.61 | 70.54 | 66.39 | 65.00 | 60.99 | 57.05 | 53.27 | 50.20 | 48.64 | 38.36 | 33.31 | 32.60 | 31.77 | 31.02 | 28.87 | 27.12 | |
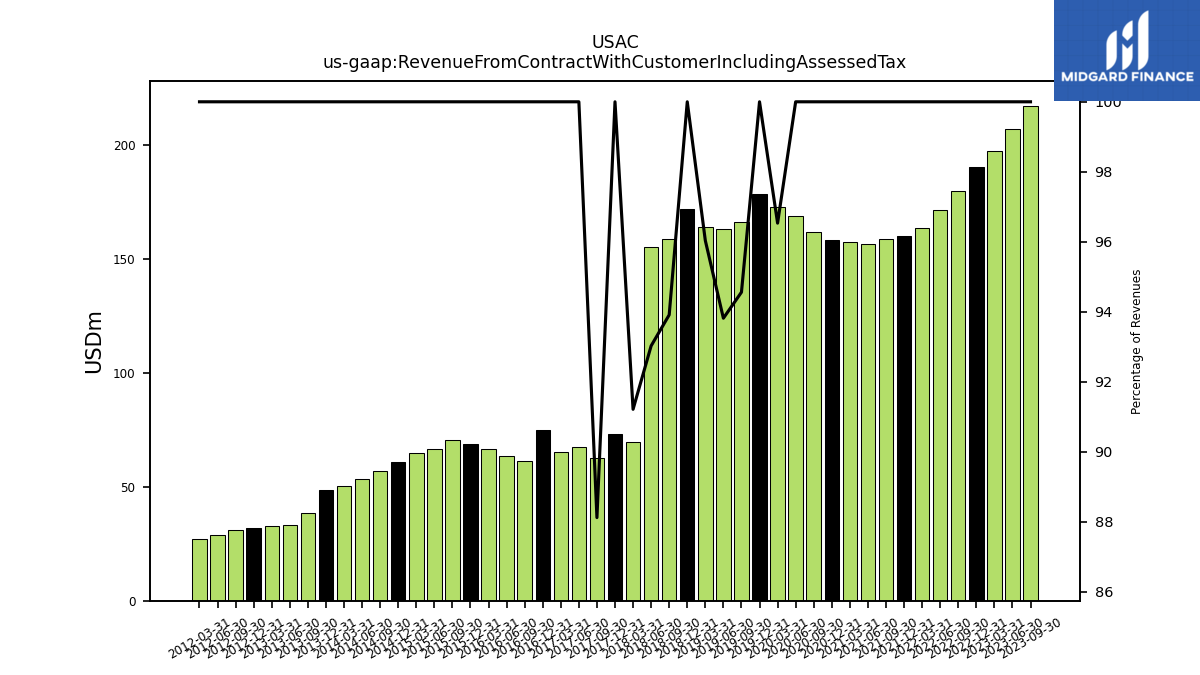
| Revenue From Contract With Customer Including Assessed Tax | 217.09 | 206.92 | 197.12 | 190.11 | 179.61 | 171.46 | 163.41 | 159.94 | 158.63 | 156.56 | 157.51 | 158.37 | 161.67 | 168.65 | 172.79 | 178.19 | 166.20 | 162.94 | 163.98 | 171.98 | 158.66 | 155.26 | 69.81 | 72.94 | 62.65 | 67.37 | 65.27 | 74.91 | 61.13 | 63.51 | 66.37 | 68.61 | 70.54 | 66.39 | 65.00 | 60.99 | 57.05 | 53.27 | 50.20 | 48.64 | 38.36 | 33.31 | 32.60 | 31.77 | 31.02 | 28.87 | 27.12 | |
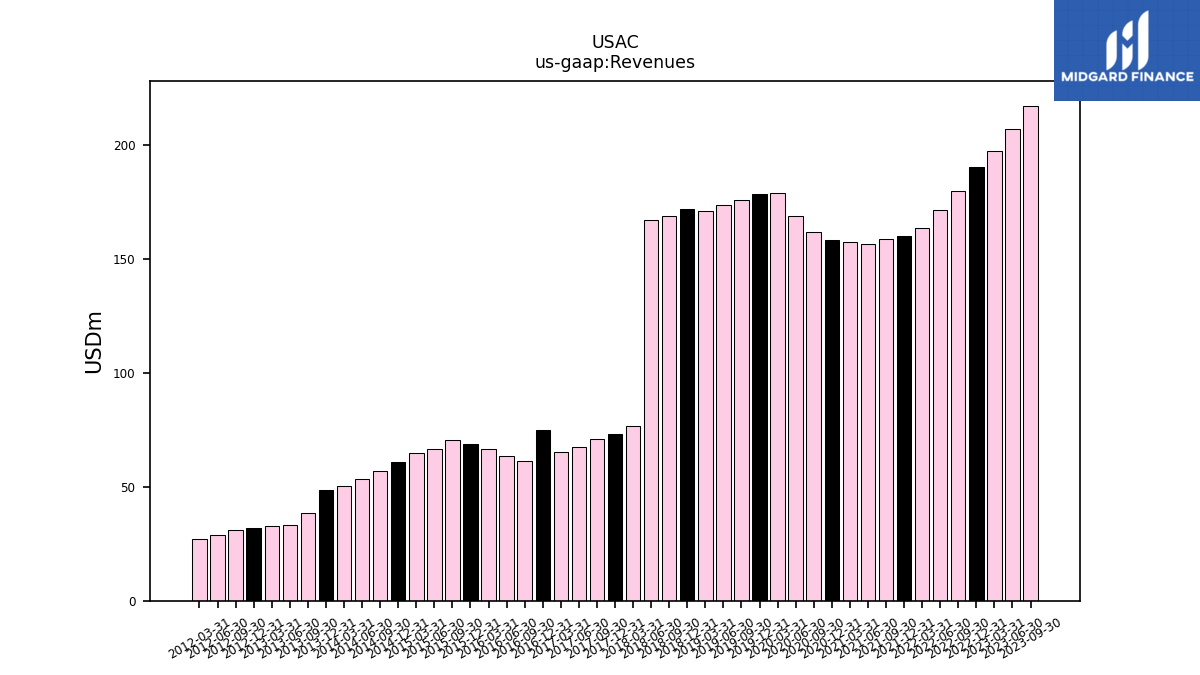
| Revenues | 217.09 | 206.92 | 197.12 | 190.11 | 179.61 | 171.46 | 163.41 | 159.94 | 158.63 | 156.56 | 157.51 | 158.37 | 161.67 | 168.65 | 179.00 | 178.19 | 175.76 | 173.68 | 170.75 | 171.98 | 168.95 | 166.90 | 76.53 | 72.94 | 71.09 | 67.37 | 65.27 | 74.91 | 61.13 | 63.51 | 66.37 | 68.61 | 70.54 | 66.39 | 65.00 | 60.99 | 57.05 | 53.27 | 50.20 | 48.64 | 38.36 | 33.31 | 32.60 | 31.77 | 31.02 | 28.87 | 27.12 | |
| Cost Of Goods And Service Excluding Depreciation Depletion And Amortization | 74.93 | 69.92 | 66.67 | 65.99 | 59.45 | 55.16 | 53.73 | 51.00 | 49.16 | 45.60 | 48.63 | 50.09 | 46.72 | 49.97 | 59.16 | 56.61 | 57.42 | 56.24 | 57.02 | 55.55 | 64.31 | 57.53 | NA | NA | NA | NA | NA | NA | NA | NA | NA | NA | NA | NA | NA | NA | NA | NA | NA | NA | NA | NA | NA | NA | NA | NA | NA | |
| Costs And Expenses | 156.13 | 155.49 | 146.07 | 143.42 | 134.51 | 129.06 | 128.31 | 123.61 | 122.00 | 121.42 | 124.75 | 127.17 | 122.89 | 133.76 | 748.71 | 134.39 | 129.59 | 130.78 | 135.22 | 135.41 | 145.01 | 138.31 | NA | NA | NA | NA | NA | NA | NA | NA | NA | NA | NA | NA | NA | NA | NA | NA | NA | NA | NA | NA | NA | NA | NA | NA | NA | |
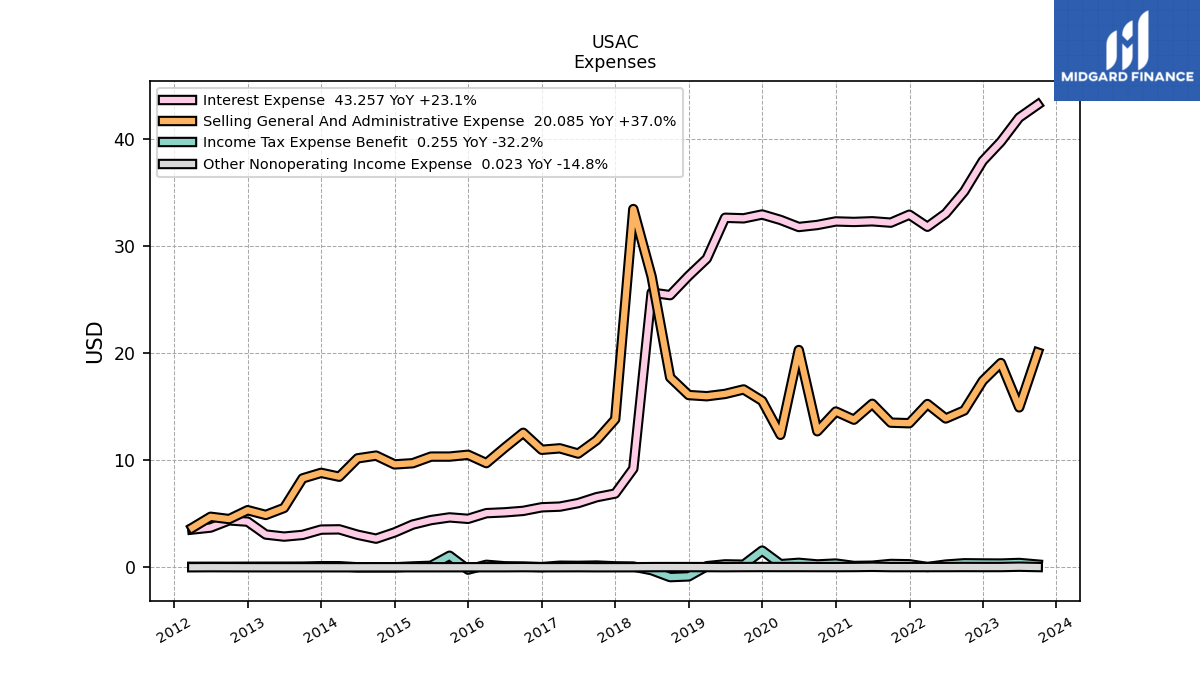
| Selling General And Administrative Expense | 20.09 | 14.95 | 19.10 | 17.44 | 14.66 | 13.91 | 15.27 | 13.47 | 13.52 | 15.29 | 13.80 | 14.56 | 12.72 | 20.32 | 12.38 | 15.56 | 16.63 | 16.21 | 15.99 | 16.10 | 17.75 | 27.18 | 33.49 | 13.84 | 11.89 | 10.63 | 11.12 | 10.99 | 12.58 | 11.18 | 9.74 | 10.52 | 10.35 | 10.35 | 9.73 | 9.62 | 10.44 | 10.19 | 8.47 | 8.83 | 8.31 | 5.55 | 4.89 | 5.34 | 4.51 | 4.72 | 3.69 | |
| Operating Income Loss | 60.95 | 51.43 | 51.06 | 46.69 | 45.10 | 42.40 | 35.10 | 36.34 | 36.63 | 35.15 | 32.76 | 31.19 | 38.77 | 34.89 | -569.71 | 43.80 | 46.16 | 42.89 | 35.53 | 36.57 | 23.94 | 28.59 | -6.09 | 11.53 | 11.51 | 6.68 | 7.37 | 8.89 | 3.19 | 8.50 | 13.83 | -155.32 | 15.55 | -11.35 | 15.52 | 11.76 | 7.68 | 10.56 | 7.57 | 8.06 | 4.80 | 5.33 | 5.64 | 5.26 | 5.75 | 4.75 | 4.82 | |
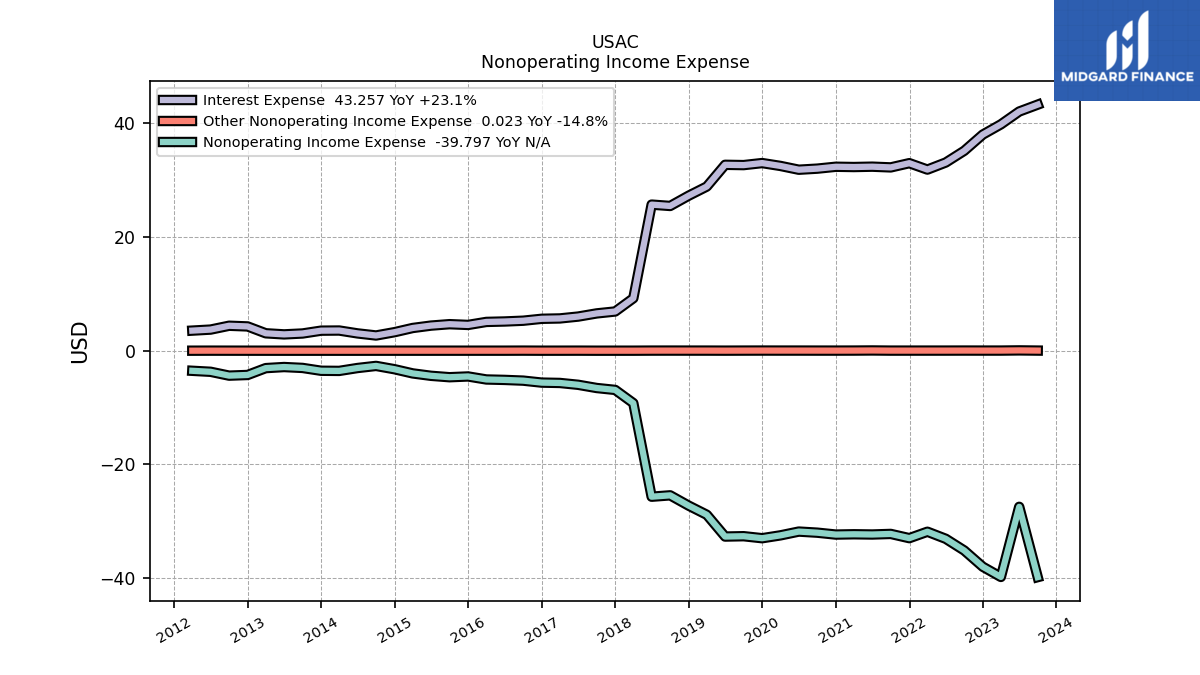
| Interest Expense | 43.26 | 42.05 | 39.79 | 37.99 | 35.14 | 33.08 | 31.84 | 32.97 | 32.22 | 32.35 | 32.29 | 32.34 | 32.00 | 31.82 | 32.48 | 32.98 | 32.63 | 32.68 | 28.86 | 27.25 | 25.44 | 25.68 | 9.22 | 6.90 | 6.56 | 6.00 | 5.67 | 5.61 | 5.28 | 5.14 | 5.06 | 4.53 | 4.67 | 4.42 | 3.99 | 3.26 | 2.68 | 3.04 | 3.55 | 3.52 | 3.03 | 2.87 | 3.06 | 4.27 | 4.39 | 3.71 | 3.53 | |
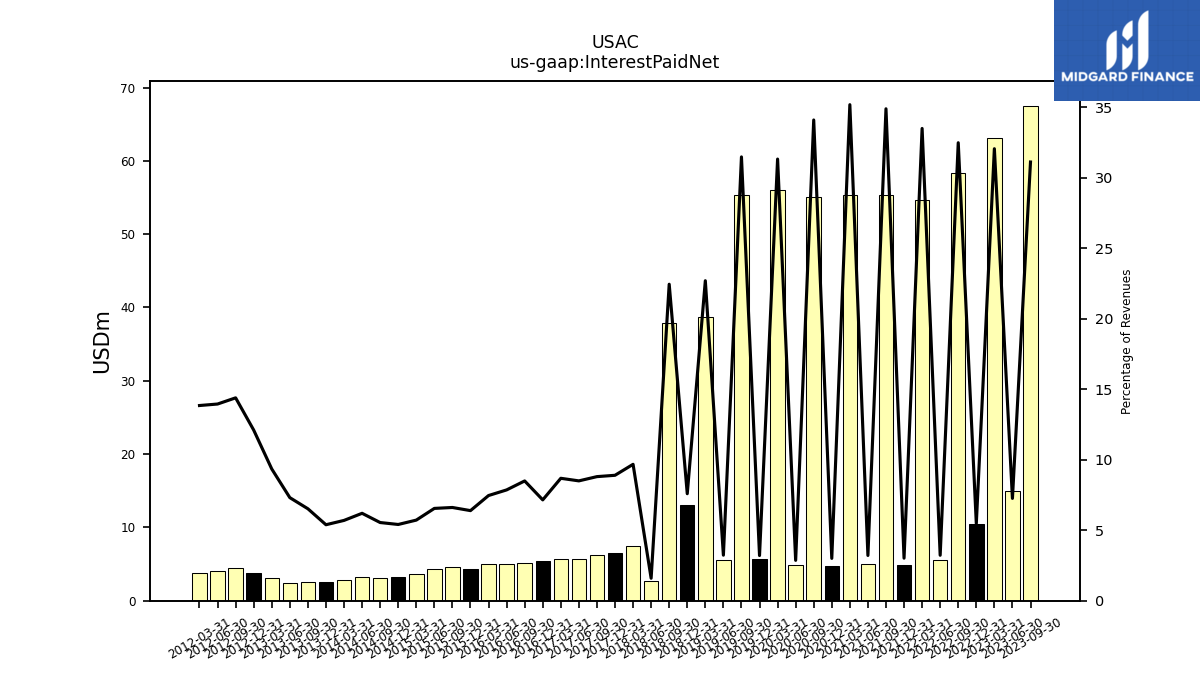
| Interest Paid Net | 67.52 | 15.01 | 63.17 | 10.40 | 58.32 | 5.53 | 54.71 | 4.83 | 55.32 | 5.03 | 55.39 | 4.76 | 55.10 | 4.83 | 56.05 | 5.71 | 55.30 | 5.61 | 38.74 | 13.05 | 37.91 | 2.66 | 7.40 | 6.49 | 6.25 | 5.72 | 5.67 | 5.36 | 5.19 | 4.99 | 4.95 | 4.38 | 4.66 | 4.35 | 3.72 | 3.30 | 3.16 | 3.30 | 2.86 | 2.62 | 2.50 | 2.43 | 3.05 | 3.84 | 4.46 | 4.03 | 3.75 | |
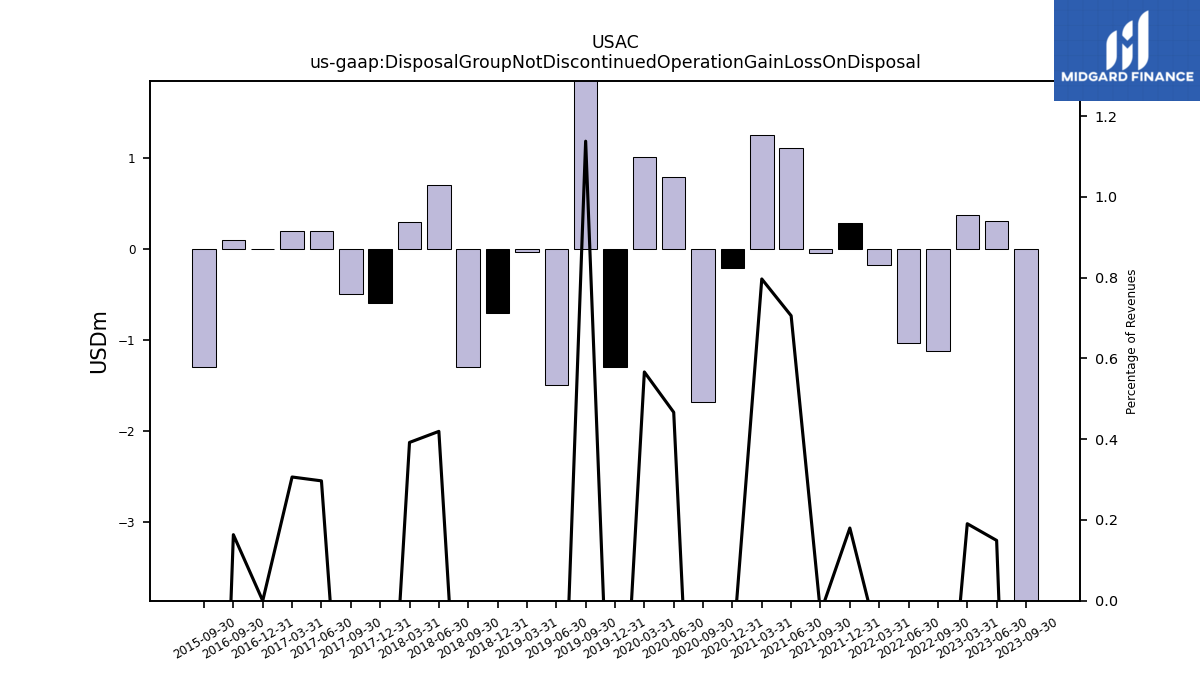
| Disposal Group Not Discontinued Operation Gain Loss On Disposal | -3.87 | 0.31 | 0.38 | NA | -1.12 | -1.03 | -0.18 | 0.29 | -0.05 | 1.10 | 1.25 | -0.21 | -1.69 | 0.79 | 1.01 | -1.30 | 2.00 | -1.50 | -0.04 | -0.70 | -1.30 | 0.70 | 0.30 | -0.60 | -0.50 | 0.20 | 0.20 | 0.00 | 0.10 | NA | NA | NA | -1.30 | NA | NA | NA | NA | NA | NA | NA | NA | NA | NA | NA | NA | NA | NA | |
| Income Tax Expense Benefit | 0.26 | 0.41 | 0.35 | 0.36 | 0.38 | 0.26 | 0.03 | 0.28 | 0.31 | 0.15 | 0.13 | 0.35 | 0.27 | 0.42 | 0.30 | 1.56 | 0.24 | 0.28 | 0.10 | -0.85 | -0.92 | -0.27 | 0.07 | 0.09 | 0.17 | 0.13 | 0.15 | 0.02 | 0.07 | 0.09 | 0.23 | -0.22 | 1.08 | 0.14 | 0.08 | 0.00 | 0.00 | 0.00 | 0.10 | 0.10 | 0.06 | 0.06 | 0.06 | 0.05 | 0.05 | 0.05 | 0.05 | |
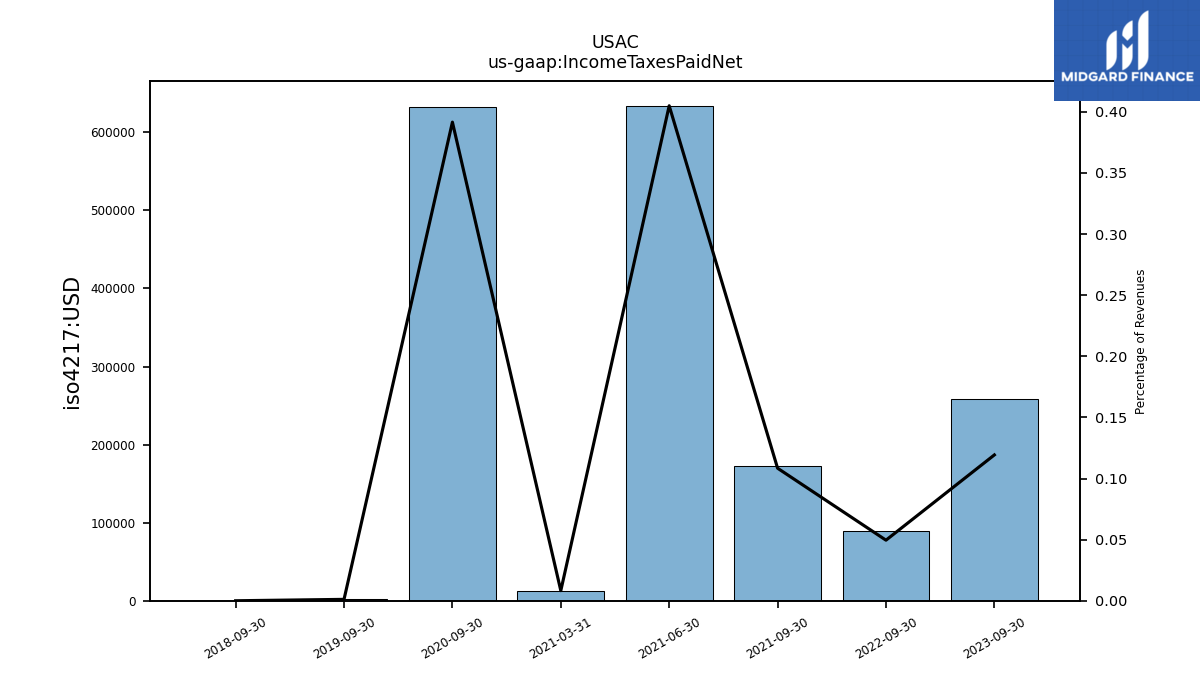
| Income Taxes Paid Net | 0.26 | NA | NA | NA | 0.09 | NA | NA | NA | 0.17 | 0.63 | 0.01 | NA | 0.63 | NA | NA | NA | 0.00 | NA | NA | NA | 0.00 | NA | NA | NA | NA | NA | NA | NA | NA | NA | NA | NA | NA | NA | NA | NA | NA | NA | NA | NA | NA | NA | NA | NA | NA | NA | NA | |
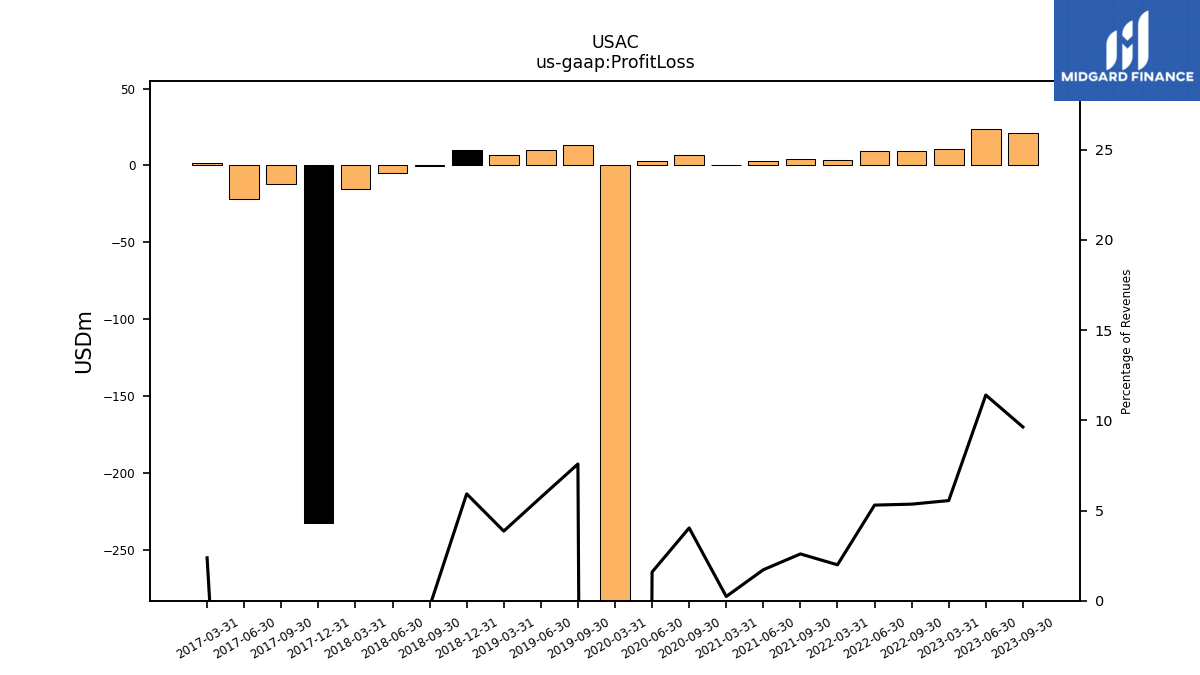
| Profit Loss | 20.90 | 23.58 | 10.94 | NA | 9.61 | 9.09 | 3.25 | NA | 4.12 | 2.69 | 0.37 | NA | 6.52 | 2.68 | -602.46 | NA | 13.31 | 9.95 | 6.59 | 10.19 | -0.56 | -4.80 | -15.37 | -232.22 | -12.36 | -21.71 | 1.55 | NA | NA | NA | NA | NA | NA | NA | NA | NA | NA | NA | NA | NA | NA | NA | NA | NA | NA | NA | NA | |
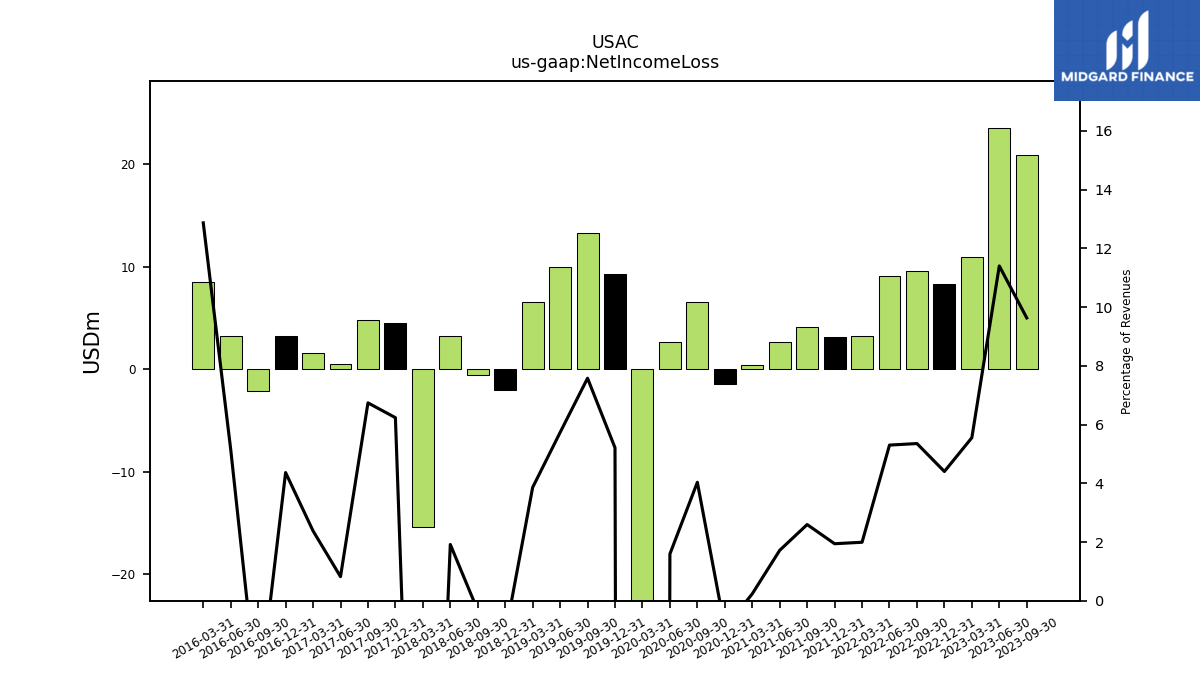
| Net Income Loss | 20.90 | 23.58 | 10.94 | 8.37 | 9.61 | 9.09 | 3.25 | 3.10 | 4.12 | 2.69 | 0.37 | -1.47 | 6.52 | 2.68 | -602.46 | 9.28 | 13.31 | 9.95 | 6.59 | -2.00 | -0.56 | 3.20 | -15.37 | 4.55 | 4.79 | 0.55 | 1.55 | 3.27 | -2.15 | 3.27 | 8.54 | NA | NA | NA | NA | NA | NA | NA | NA | NA | NA | NA | NA | NA | NA | NA | NA | |
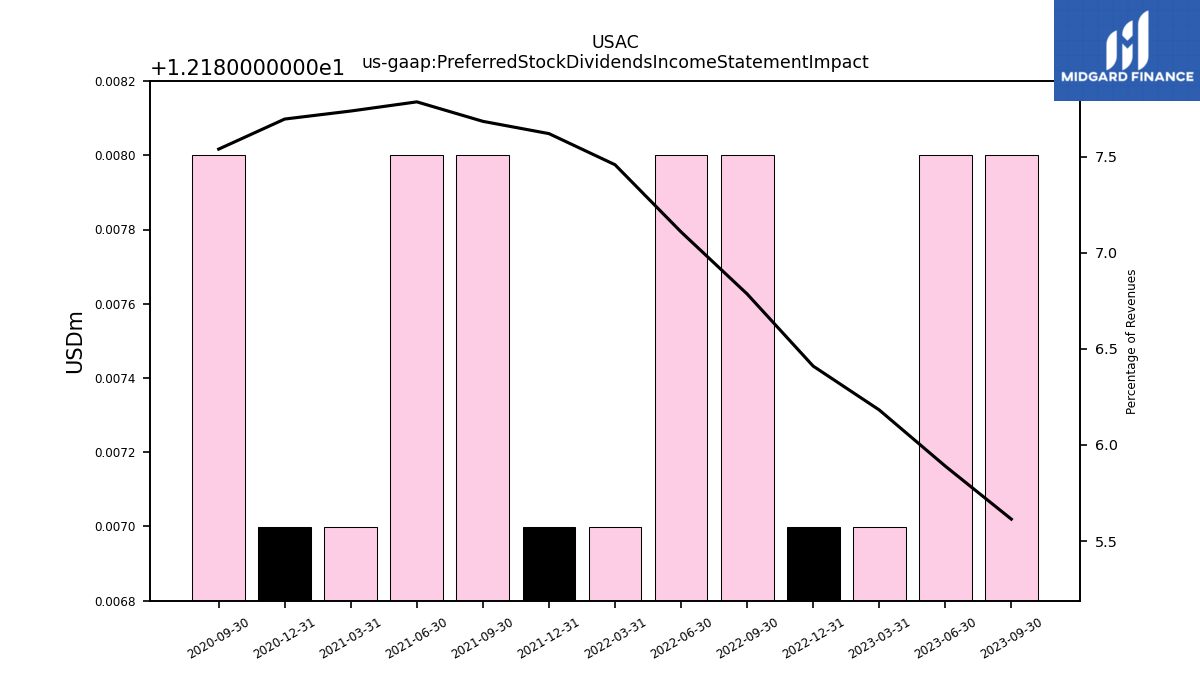
| Preferred Stock Dividends Income Statement Impact | 12.19 | 12.19 | 12.19 | 12.19 | 12.19 | 12.19 | 12.19 | 12.19 | 12.19 | 12.19 | 12.19 | 12.19 | 12.19 | NA | NA | NA | NA | NA | NA | NA | NA | NA | NA | NA | NA | NA | NA | NA | NA | NA | NA | NA | NA | NA | NA | NA | NA | NA | NA | NA | NA | NA | NA | NA | NA | NA | NA |
| 2023-09-30 | 2023-06-30 | 2023-03-31 | 2022-12-31 | 2022-09-30 | 2022-06-30 | 2022-03-31 | 2021-12-31 | 2021-09-30 | 2021-06-30 | 2021-03-31 | 2020-12-31 | 2020-09-30 | 2020-06-30 | 2020-03-31 | 2019-12-31 | 2019-09-30 | 2019-06-30 | 2019-03-31 | 2018-12-31 | 2018-09-30 | 2018-06-30 | 2018-03-31 | 2017-12-31 | 2017-09-30 | 2017-06-30 | 2017-03-31 | 2016-12-31 | 2016-09-30 | 2016-06-30 | 2016-03-31 | 2015-12-31 | 2015-09-30 | 2015-06-30 | 2015-03-31 | 2014-12-31 | 2014-09-30 | 2014-06-30 | 2014-03-31 | 2013-12-31 | 2013-09-30 | 2013-06-30 | 2013-03-31 | 2012-12-31 | 2012-09-30 | 2012-06-30 | 2012-03-31 | ||
|---|---|---|---|---|---|---|---|---|---|---|---|---|---|---|---|---|---|---|---|---|---|---|---|---|---|---|---|---|---|---|---|---|---|---|---|---|---|---|---|---|---|---|---|---|---|---|---|---|
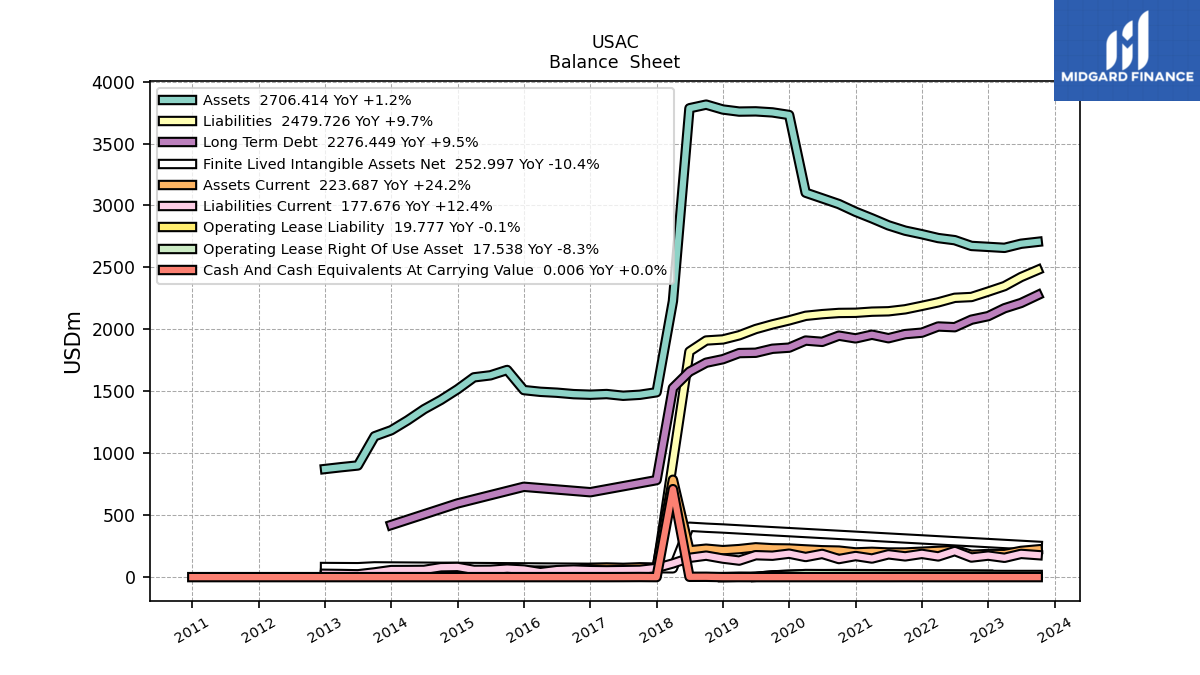
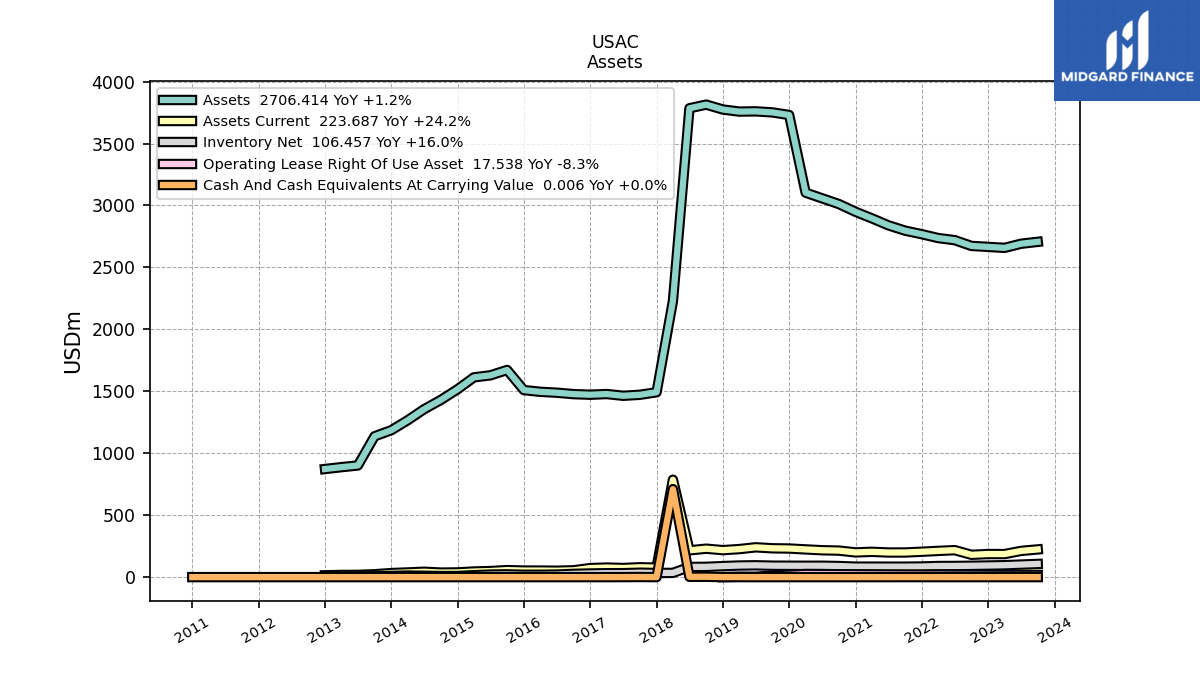
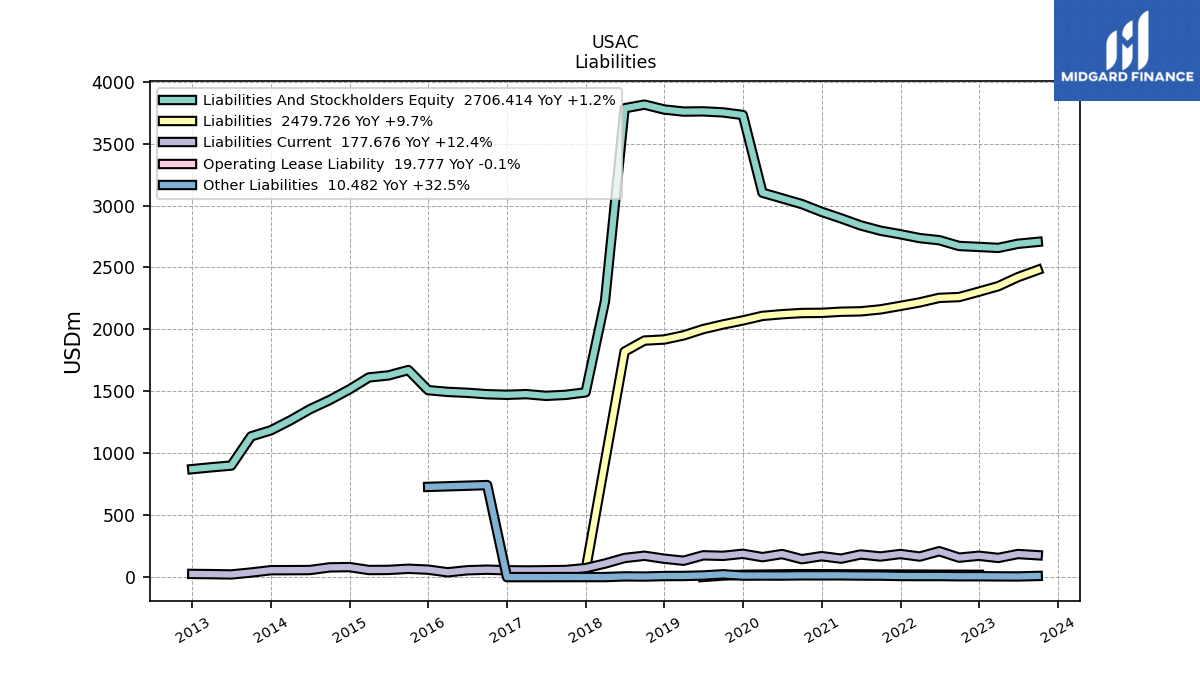
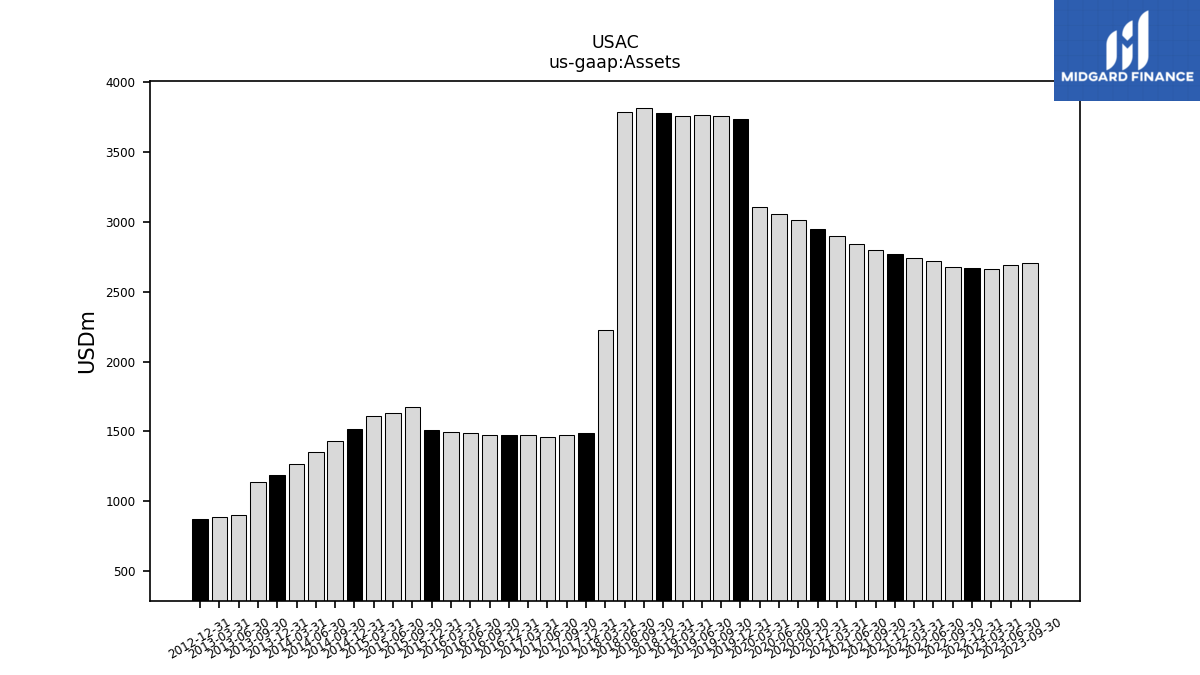
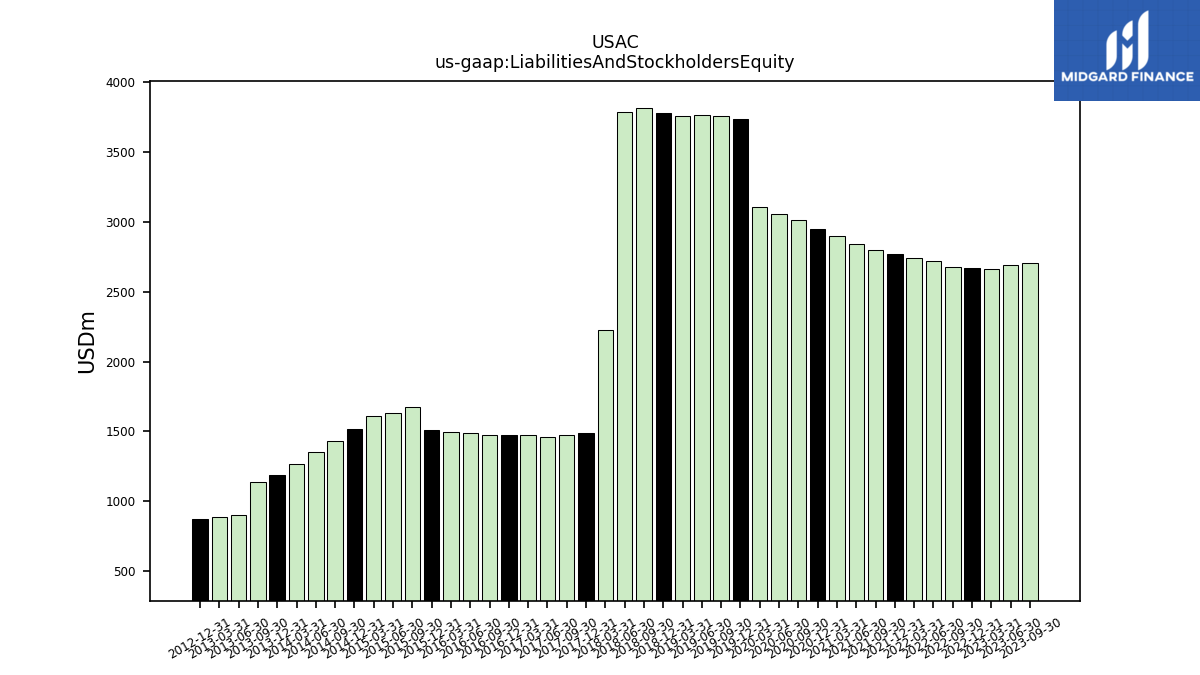
| Assets | 2706.41 | 2691.04 | 2657.87 | 2665.72 | 2673.39 | 2719.89 | 2736.95 | 2767.98 | 2796.55 | 2839.31 | 2895.95 | 2948.70 | 3011.33 | 3057.69 | 3103.09 | 3730.41 | 3751.23 | 3759.67 | 3757.85 | 3774.65 | 3814.05 | 3784.72 | 2228.20 | 1492.09 | 1471.94 | 1463.88 | 1477.81 | 1472.41 | 1477.08 | 1488.58 | 1495.85 | 1509.77 | 1672.18 | 1628.89 | 1612.60 | 1516.48 | 1430.31 | 1355.79 | 1265.90 | 1185.88 | 1136.97 | 901.32 | 887.56 | 872.64 | NA | NA | NA | |
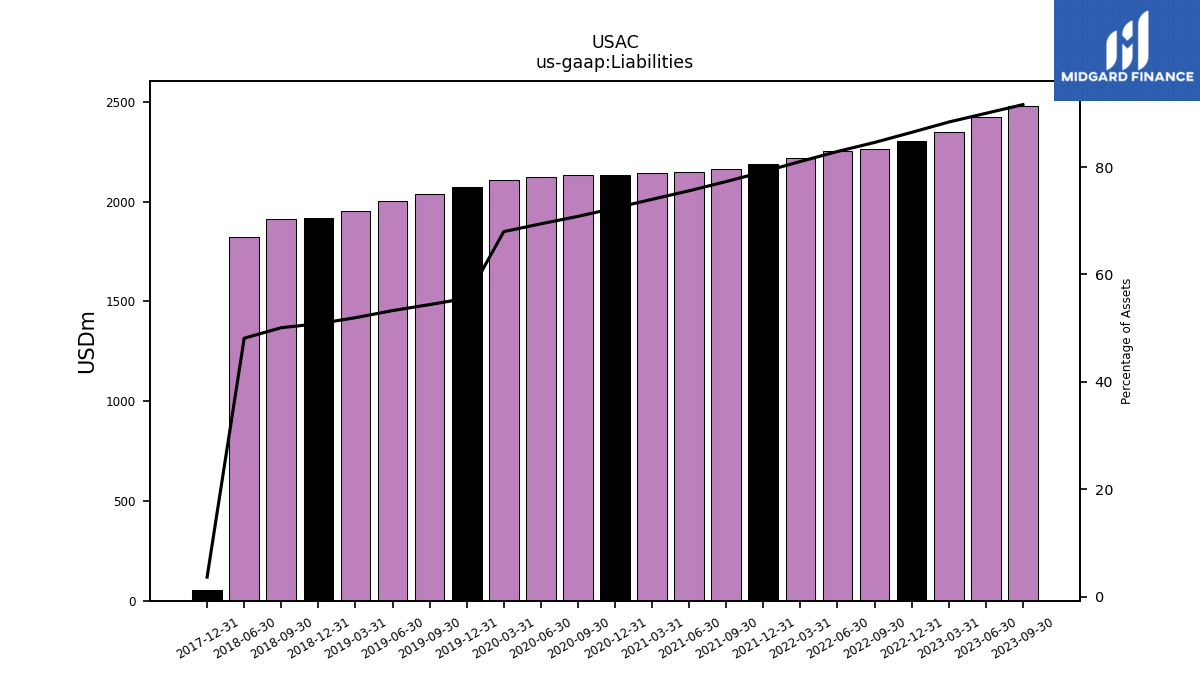
| Liabilities | 2479.73 | 2421.92 | 2349.03 | 2304.71 | 2261.15 | 2254.65 | 2218.03 | 2189.56 | 2161.72 | 2145.92 | 2142.83 | 2133.74 | 2132.35 | 2122.74 | 2109.16 | 2072.50 | 2040.00 | 2002.50 | 1951.90 | 1918.48 | 1909.98 | 1821.05 | NA | 54.08 | NA | NA | NA | NA | NA | NA | NA | NA | NA | NA | NA | NA | NA | NA | NA | NA | NA | NA | NA | NA | NA | NA | NA | |
| Liabilities And Stockholders Equity | 2706.41 | 2691.04 | 2657.87 | 2665.72 | 2673.39 | 2719.89 | 2736.95 | 2767.98 | 2796.55 | 2839.31 | 2895.95 | 2948.70 | 3011.33 | 3057.69 | 3103.09 | 3730.41 | 3751.23 | 3759.67 | 3757.85 | 3774.65 | 3814.05 | 3784.72 | 2228.20 | 1492.09 | 1471.94 | 1463.88 | 1477.81 | 1472.41 | 1477.08 | 1488.58 | 1495.85 | 1509.77 | 1672.18 | 1628.89 | 1612.60 | 1516.48 | 1430.31 | 1355.79 | 1265.90 | 1185.88 | 1136.97 | 901.32 | 887.56 | 872.64 | NA | NA | NA |
| 2023-09-30 | 2023-06-30 | 2023-03-31 | 2022-12-31 | 2022-09-30 | 2022-06-30 | 2022-03-31 | 2021-12-31 | 2021-09-30 | 2021-06-30 | 2021-03-31 | 2020-12-31 | 2020-09-30 | 2020-06-30 | 2020-03-31 | 2019-12-31 | 2019-09-30 | 2019-06-30 | 2019-03-31 | 2018-12-31 | 2018-09-30 | 2018-06-30 | 2018-03-31 | 2017-12-31 | 2017-09-30 | 2017-06-30 | 2017-03-31 | 2016-12-31 | 2016-09-30 | 2016-06-30 | 2016-03-31 | 2015-12-31 | 2015-09-30 | 2015-06-30 | 2015-03-31 | 2014-12-31 | 2014-09-30 | 2014-06-30 | 2014-03-31 | 2013-12-31 | 2013-09-30 | 2013-06-30 | 2013-03-31 | 2012-12-31 | 2012-09-30 | 2012-06-30 | 2012-03-31 | ||
|---|---|---|---|---|---|---|---|---|---|---|---|---|---|---|---|---|---|---|---|---|---|---|---|---|---|---|---|---|---|---|---|---|---|---|---|---|---|---|---|---|---|---|---|---|---|---|---|---|
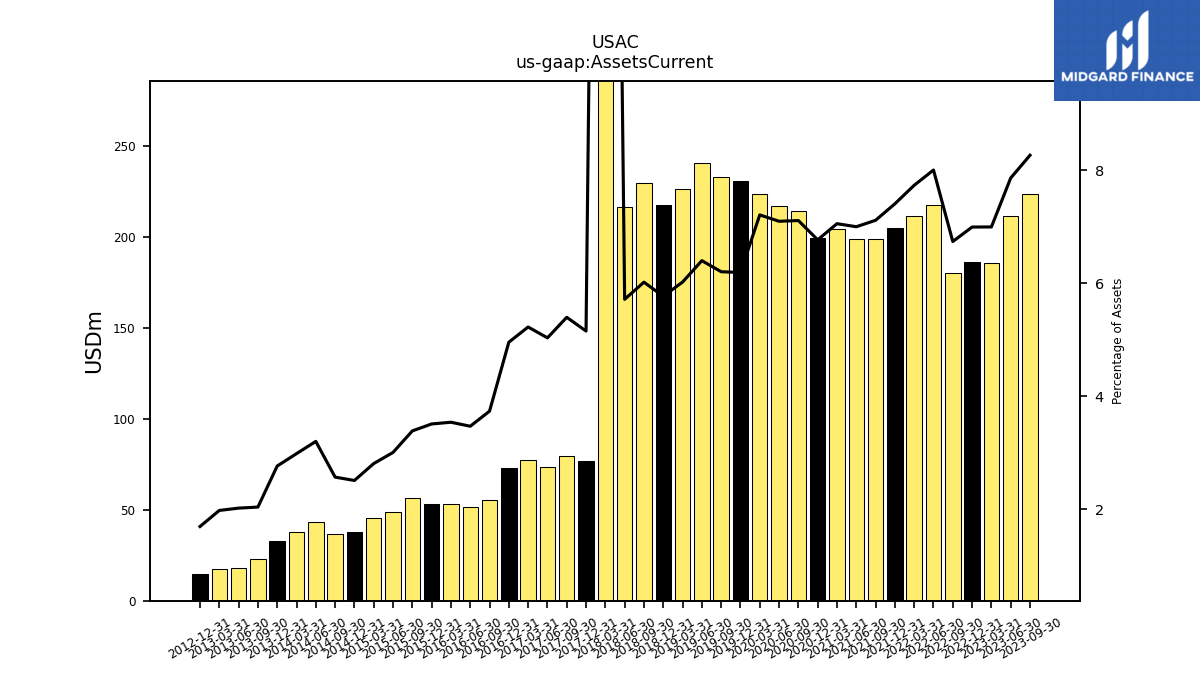
| Assets Current | 223.69 | 211.58 | 185.94 | 186.45 | 180.13 | 217.68 | 211.67 | 204.99 | 198.94 | 198.74 | 204.27 | 199.56 | 214.09 | 216.98 | 223.70 | 230.92 | 232.70 | 240.59 | 226.24 | 217.74 | 229.54 | 216.29 | 786.28 | 76.89 | 79.43 | 73.67 | 77.21 | 72.97 | 55.17 | 51.62 | 52.94 | 52.97 | 56.61 | 48.94 | 45.27 | 38.03 | 36.72 | 43.38 | 37.76 | 32.78 | 23.16 | 18.19 | 17.55 | 14.78 | NA | NA | NA | |
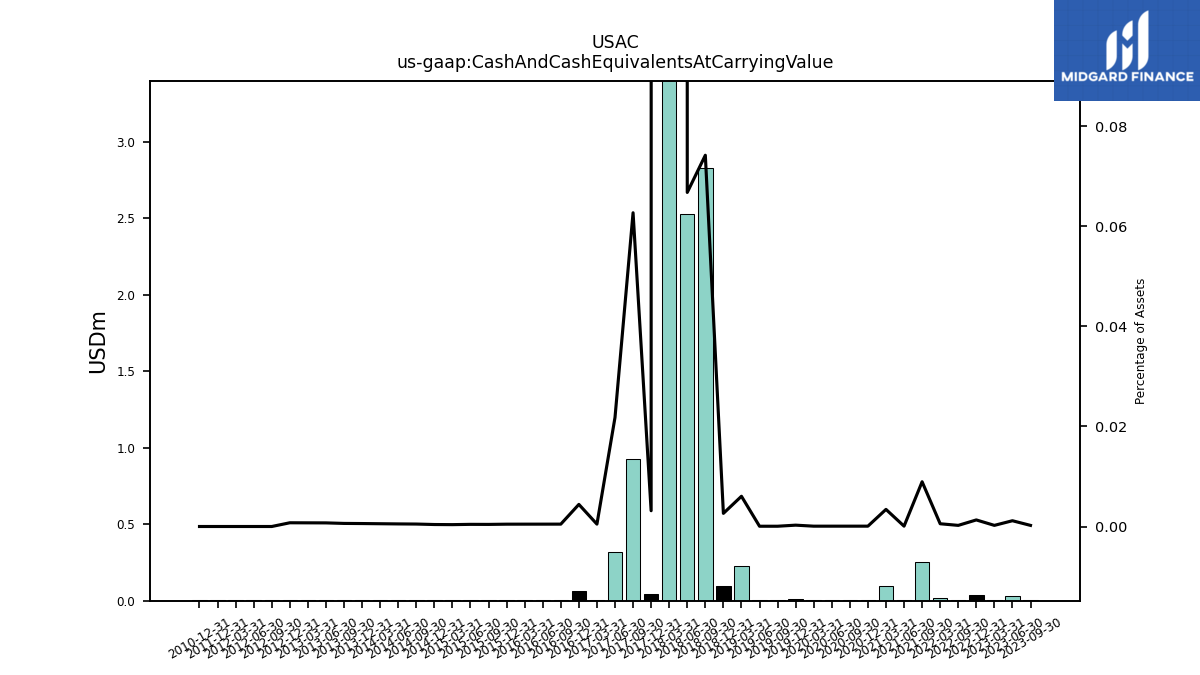
| Cash And Cash Equivalents At Carrying Value | 0.01 | 0.03 | 0.01 | 0.04 | 0.01 | NA | 0.01 | NA | 0.25 | 0.00 | 0.10 | 0.00 | 0.00 | 0.00 | 0.00 | 0.01 | 0.00 | 0.00 | 0.23 | 0.10 | 2.83 | 2.53 | 710.51 | 0.05 | 0.92 | 0.32 | 0.01 | 0.07 | 0.01 | 0.01 | 0.01 | 0.01 | 0.01 | 0.01 | 0.01 | 0.01 | 0.01 | 0.01 | 0.01 | 0.01 | 0.01 | 0.01 | 0.01 | 0.01 | 0.01 | 0.01 | 0.01 | |
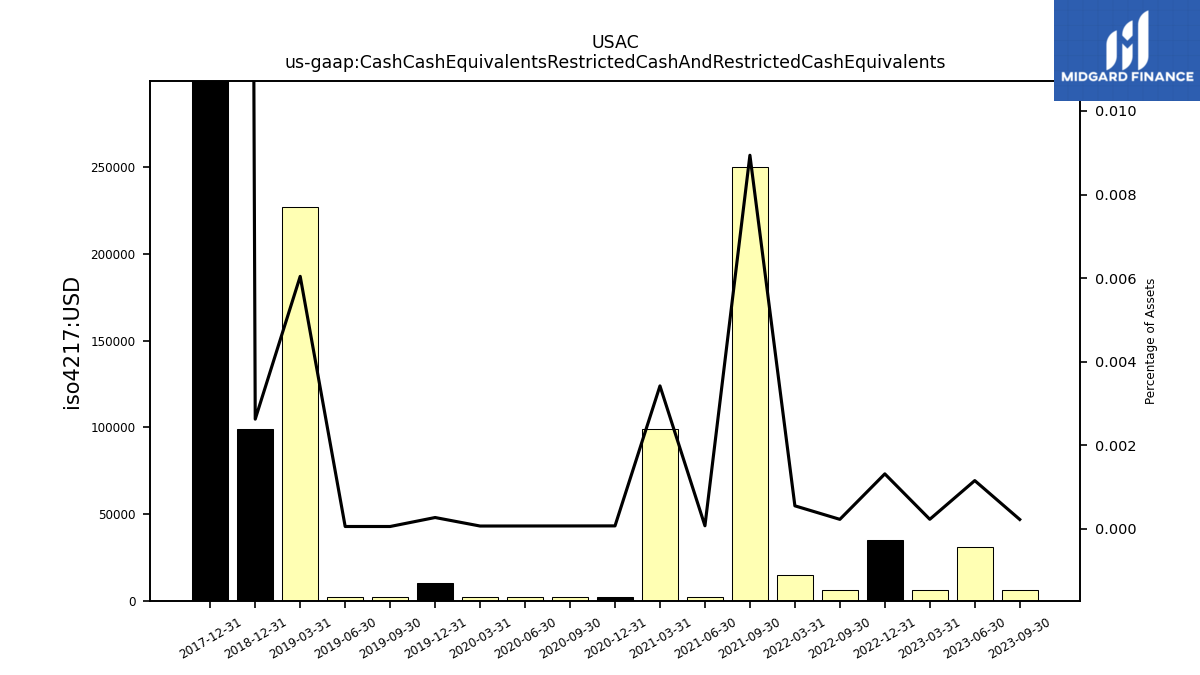
| Cash Cash Equivalents Restricted Cash And Restricted Cash Equivalents | 0.01 | 0.03 | 0.01 | 0.04 | 0.01 | NA | 0.01 | NA | 0.25 | 0.00 | 0.10 | 0.00 | 0.00 | 0.00 | 0.00 | 0.01 | 0.00 | 0.00 | 0.23 | 0.10 | NA | NA | NA | 4.01 | NA | NA | NA | NA | NA | NA | NA | NA | NA | NA | NA | NA | NA | NA | NA | NA | NA | NA | NA | NA | NA | NA | NA | |
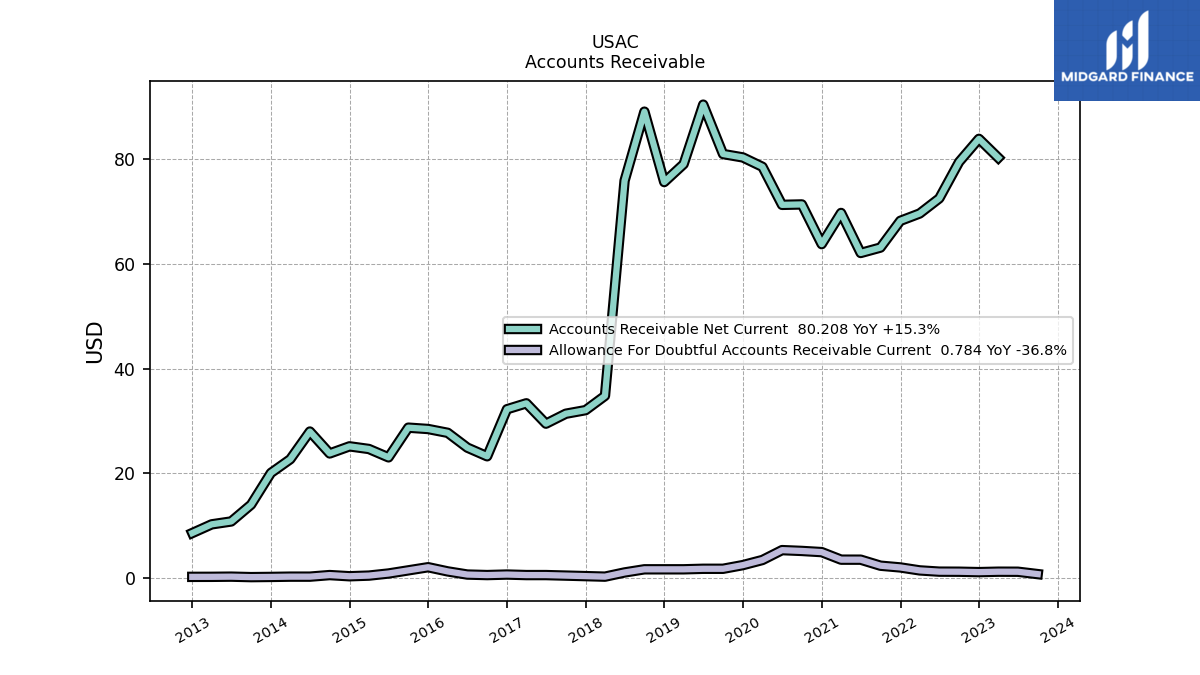
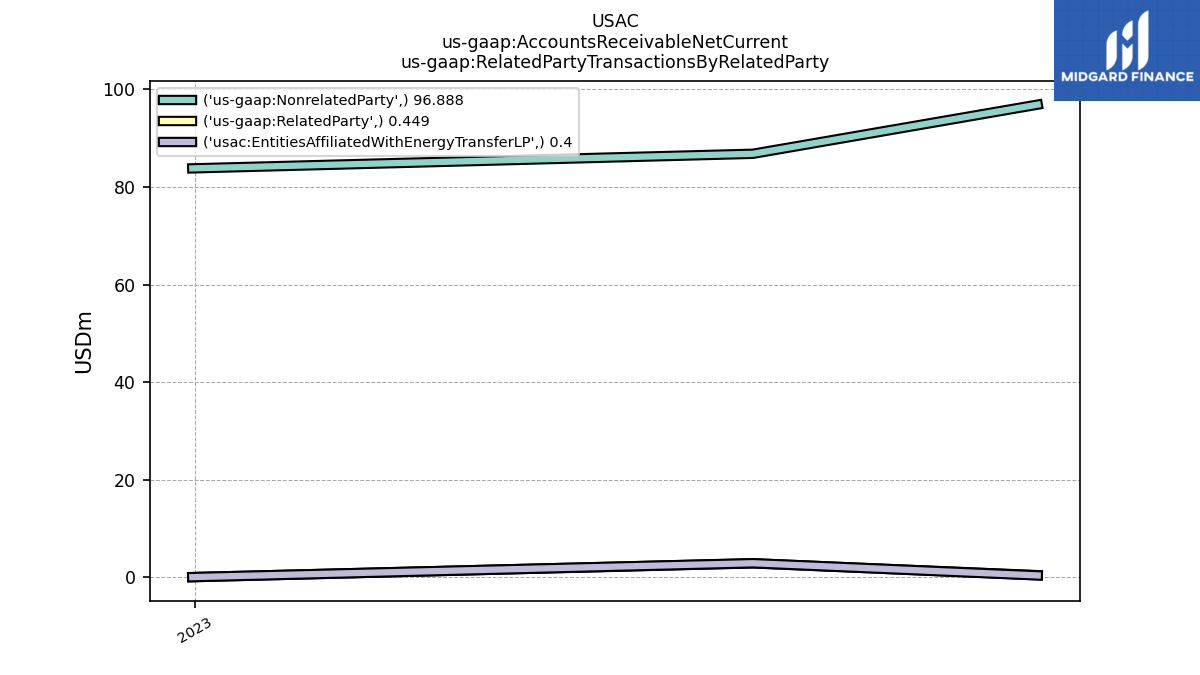
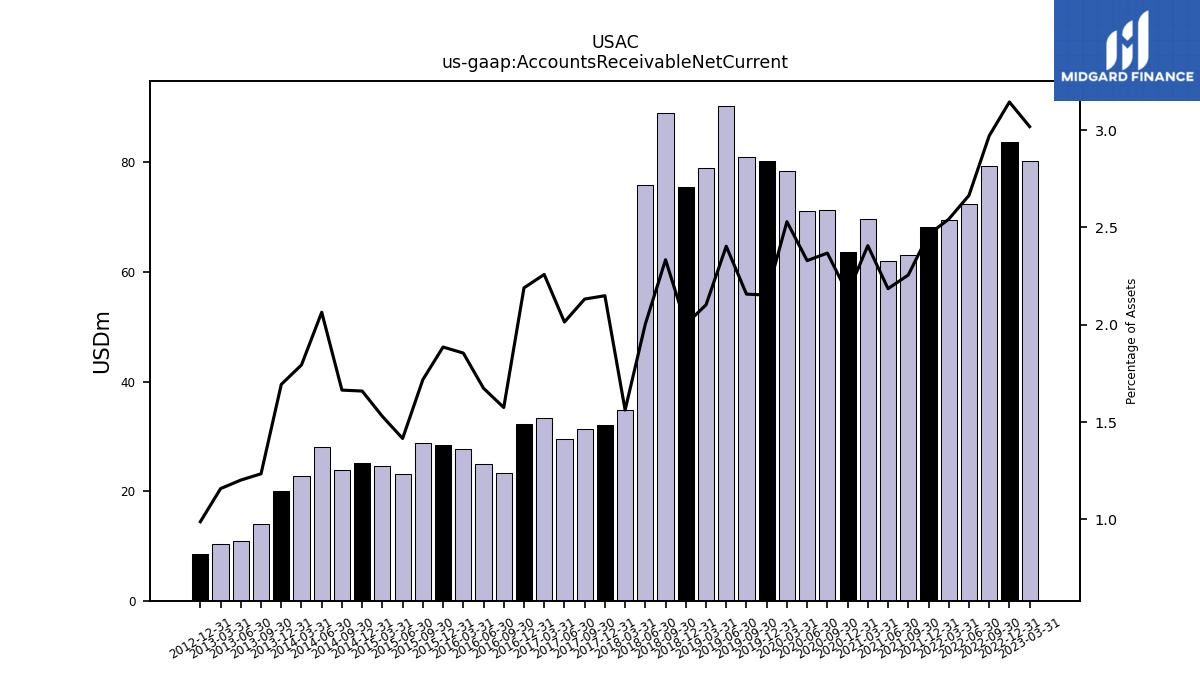
| Accounts Receivable Net Current | NA | NA | 80.21 | 83.82 | 79.41 | 72.47 | 69.58 | 68.17 | 63.08 | 62.04 | 69.69 | 63.73 | 71.31 | 71.23 | 78.48 | 80.28 | 80.93 | 90.35 | 78.99 | 75.57 | 89.01 | 75.84 | 34.79 | 32.06 | 31.38 | 29.48 | 33.37 | 32.24 | 23.26 | 24.91 | 27.74 | 28.46 | 28.72 | 23.06 | 24.65 | 25.16 | 23.80 | 27.98 | 22.70 | 20.08 | 14.03 | 10.83 | 10.28 | 8.62 | NA | NA | NA | |
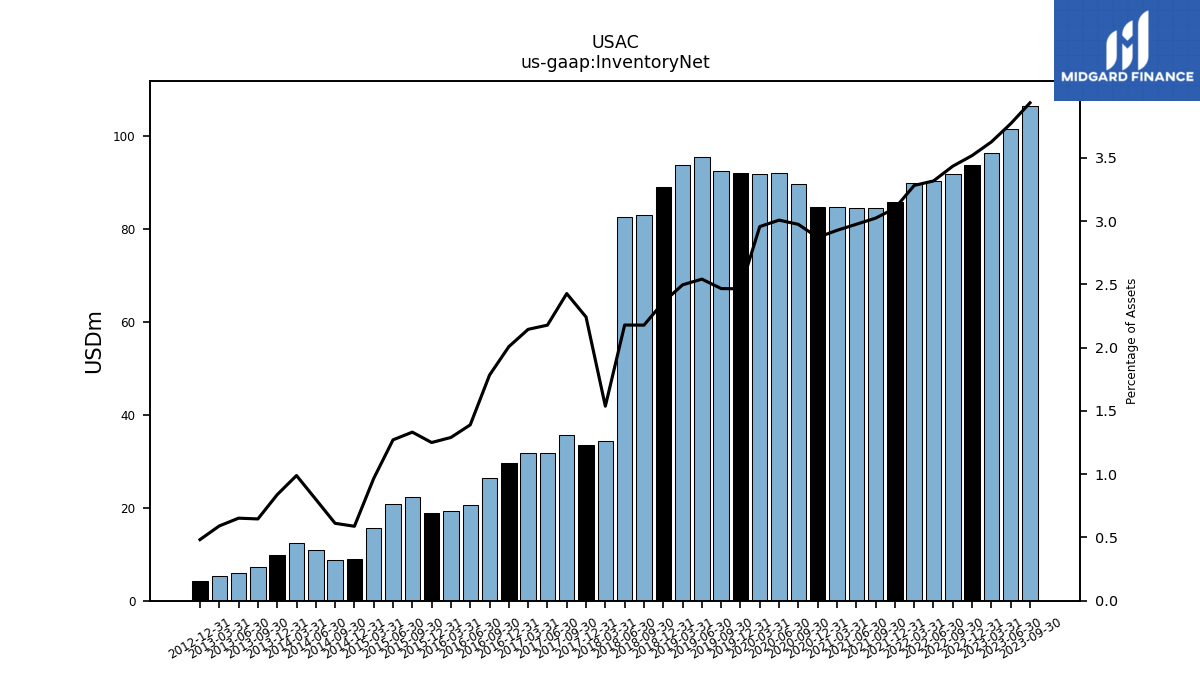
| Inventory Net | 106.46 | 101.42 | 96.35 | 93.75 | 91.78 | 90.20 | 89.80 | 85.82 | 84.53 | 84.45 | 84.74 | 84.63 | 89.54 | 91.94 | 91.72 | 91.92 | 92.52 | 95.53 | 93.78 | 89.01 | 83.04 | 82.44 | 34.25 | 33.44 | 35.72 | 31.87 | 31.69 | 29.56 | 26.33 | 20.68 | 19.30 | 18.87 | 22.27 | 20.70 | 15.58 | 8.92 | 8.75 | 10.86 | 12.52 | 9.94 | 7.35 | 5.88 | 5.25 | 4.22 | NA | NA | NA | |
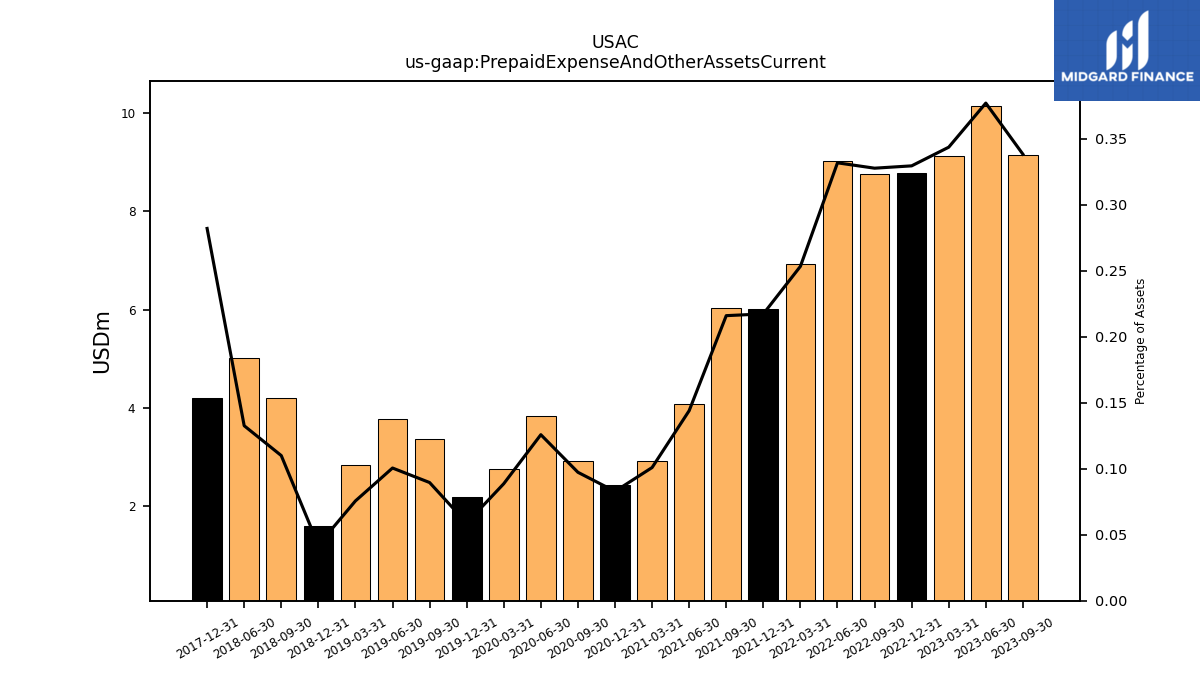
| Prepaid Expense And Other Assets Current | 9.16 | 10.15 | 9.13 | 8.78 | 8.76 | 9.03 | 6.93 | 6.02 | 6.04 | 4.09 | 2.92 | 2.44 | 2.93 | 3.85 | 2.75 | 2.20 | 3.36 | 3.78 | 2.84 | 1.59 | 4.20 | 5.02 | NA | 4.21 | NA | NA | NA | NA | NA | NA | NA | NA | NA | NA | NA | NA | NA | NA | NA | NA | NA | NA | NA | NA | NA | NA | NA |
| 2023-09-30 | 2023-06-30 | 2023-03-31 | 2022-12-31 | 2022-09-30 | 2022-06-30 | 2022-03-31 | 2021-12-31 | 2021-09-30 | 2021-06-30 | 2021-03-31 | 2020-12-31 | 2020-09-30 | 2020-06-30 | 2020-03-31 | 2019-12-31 | 2019-09-30 | 2019-06-30 | 2019-03-31 | 2018-12-31 | 2018-09-30 | 2018-06-30 | 2018-03-31 | 2017-12-31 | 2017-09-30 | 2017-06-30 | 2017-03-31 | 2016-12-31 | 2016-09-30 | 2016-06-30 | 2016-03-31 | 2015-12-31 | 2015-09-30 | 2015-06-30 | 2015-03-31 | 2014-12-31 | 2014-09-30 | 2014-06-30 | 2014-03-31 | 2013-12-31 | 2013-09-30 | 2013-06-30 | 2013-03-31 | 2012-12-31 | 2012-09-30 | 2012-06-30 | 2012-03-31 | ||
|---|---|---|---|---|---|---|---|---|---|---|---|---|---|---|---|---|---|---|---|---|---|---|---|---|---|---|---|---|---|---|---|---|---|---|---|---|---|---|---|---|---|---|---|---|---|---|---|---|
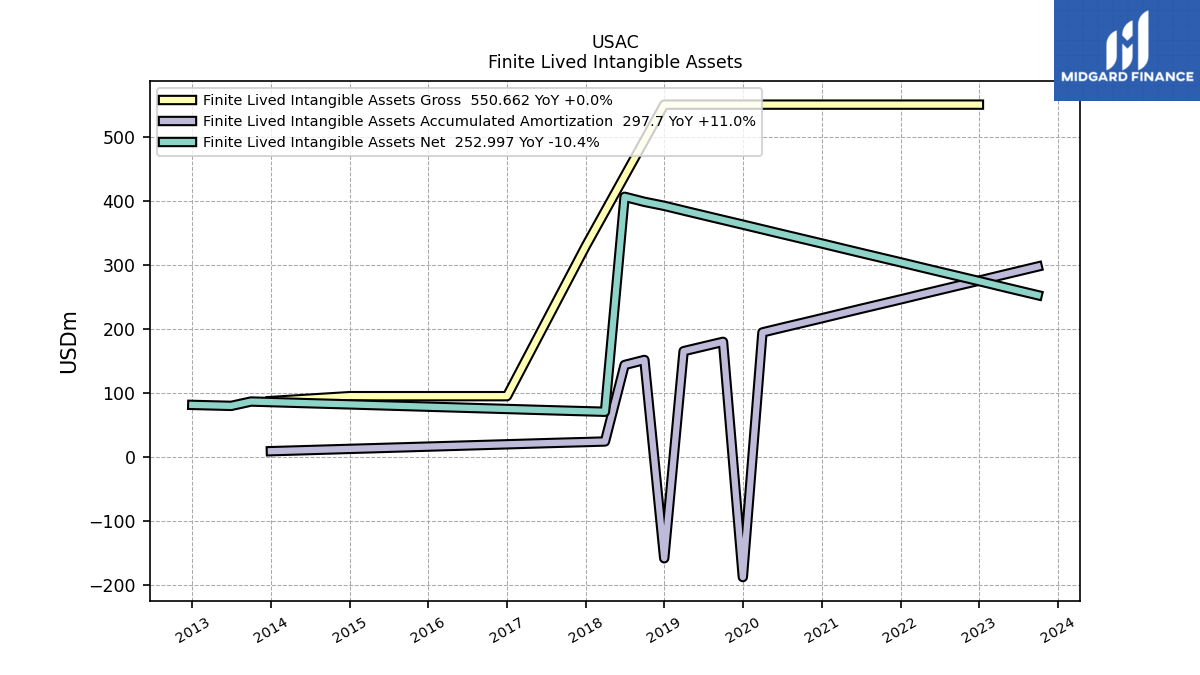
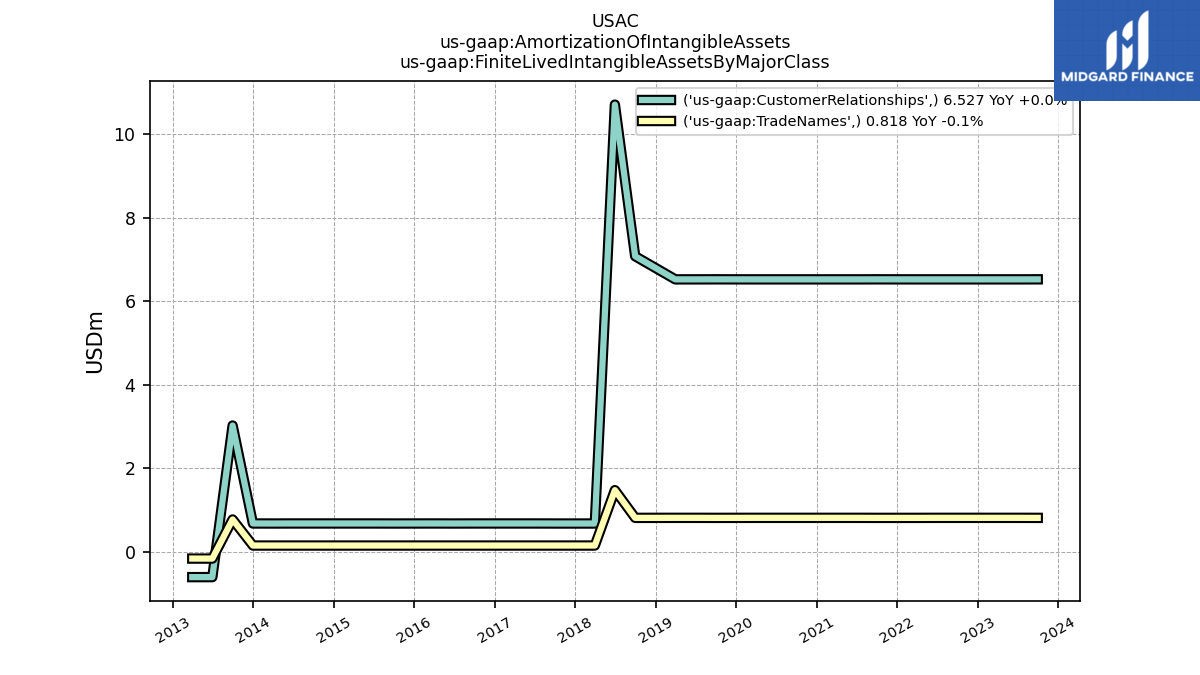
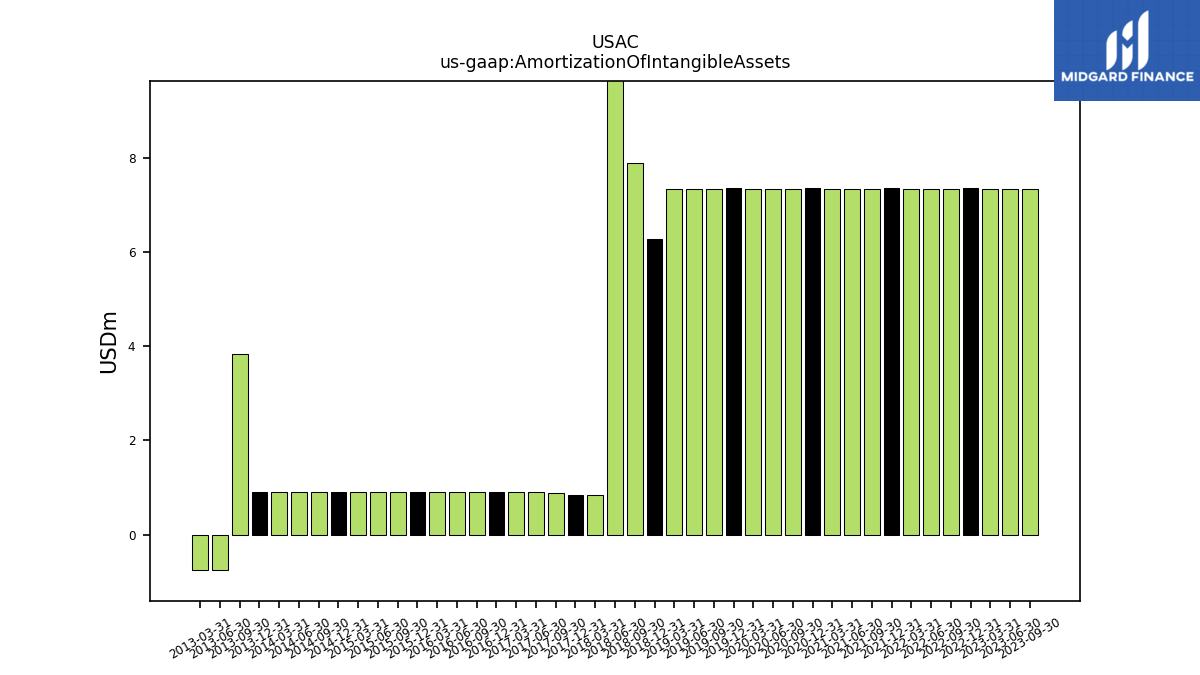
| Amortization Of Intangible Assets | 7.34 | 7.34 | 7.34 | 7.37 | 7.34 | 7.34 | 7.34 | 7.37 | 7.34 | 7.34 | 7.34 | 7.37 | 7.34 | 7.34 | 7.34 | 7.37 | 7.34 | 7.34 | 7.34 | 6.27 | 7.90 | 12.19 | 0.84 | 0.83 | 0.88 | 0.90 | 0.90 | 0.91 | 0.90 | 0.90 | 0.90 | 0.91 | 0.90 | 0.90 | 0.90 | 0.91 | 0.90 | 0.90 | 0.90 | 0.90 | 3.83 | -0.76 | -0.76 | NA | NA | NA | NA | |
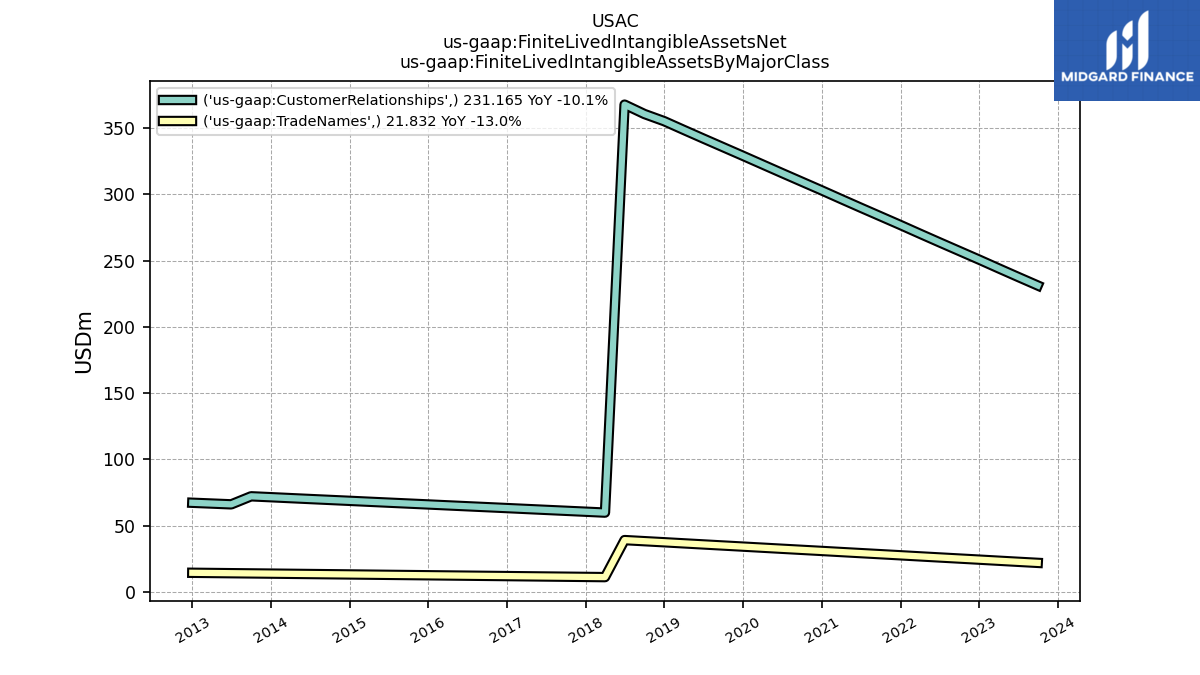
| Finite Lived Intangible Assets Net | 253.00 | 260.34 | 267.69 | 275.03 | 282.38 | 289.72 | 297.07 | 304.41 | 311.76 | 319.10 | 326.45 | 333.79 | 341.14 | 348.48 | 355.83 | 363.17 | 370.51 | 377.86 | 385.20 | 392.55 | 398.79 | 406.69 | 70.84 | 71.68 | 72.52 | 73.40 | 74.29 | 75.19 | 76.08 | 76.98 | 77.88 | 78.77 | 79.67 | 80.56 | 81.46 | 82.36 | 83.25 | 84.15 | 85.05 | 85.94 | 86.84 | 80.04 | 80.80 | 81.55 | NA | NA | NA | |
| Other Assets Noncurrent | 10.54 | 11.34 | 12.12 | 13.13 | 13.91 | 14.71 | 15.28 | 16.07 | 8.00 | 9.29 | 10.80 | 11.96 | 13.12 | 12.54 | 13.62 | 15.64 | 27.20 | 17.16 | 18.64 | 16.54 | 17.42 | 18.36 | 5.28 | 4.54 | 5.09 | 5.66 | 6.20 | 6.74 | 7.28 | 7.84 | 8.37 | 6.85 | 7.26 | 7.67 | 8.09 | 5.16 | 5.39 | 5.43 | 5.94 | 6.15 | 3.91 | 4.38 | 4.84 | 9.11 | NA | NA | NA |
| 2023-09-30 | 2023-06-30 | 2023-03-31 | 2022-12-31 | 2022-09-30 | 2022-06-30 | 2022-03-31 | 2021-12-31 | 2021-09-30 | 2021-06-30 | 2021-03-31 | 2020-12-31 | 2020-09-30 | 2020-06-30 | 2020-03-31 | 2019-12-31 | 2019-09-30 | 2019-06-30 | 2019-03-31 | 2018-12-31 | 2018-09-30 | 2018-06-30 | 2018-03-31 | 2017-12-31 | 2017-09-30 | 2017-06-30 | 2017-03-31 | 2016-12-31 | 2016-09-30 | 2016-06-30 | 2016-03-31 | 2015-12-31 | 2015-09-30 | 2015-06-30 | 2015-03-31 | 2014-12-31 | 2014-09-30 | 2014-06-30 | 2014-03-31 | 2013-12-31 | 2013-09-30 | 2013-06-30 | 2013-03-31 | 2012-12-31 | 2012-09-30 | 2012-06-30 | 2012-03-31 | ||
|---|---|---|---|---|---|---|---|---|---|---|---|---|---|---|---|---|---|---|---|---|---|---|---|---|---|---|---|---|---|---|---|---|---|---|---|---|---|---|---|---|---|---|---|---|---|---|---|---|
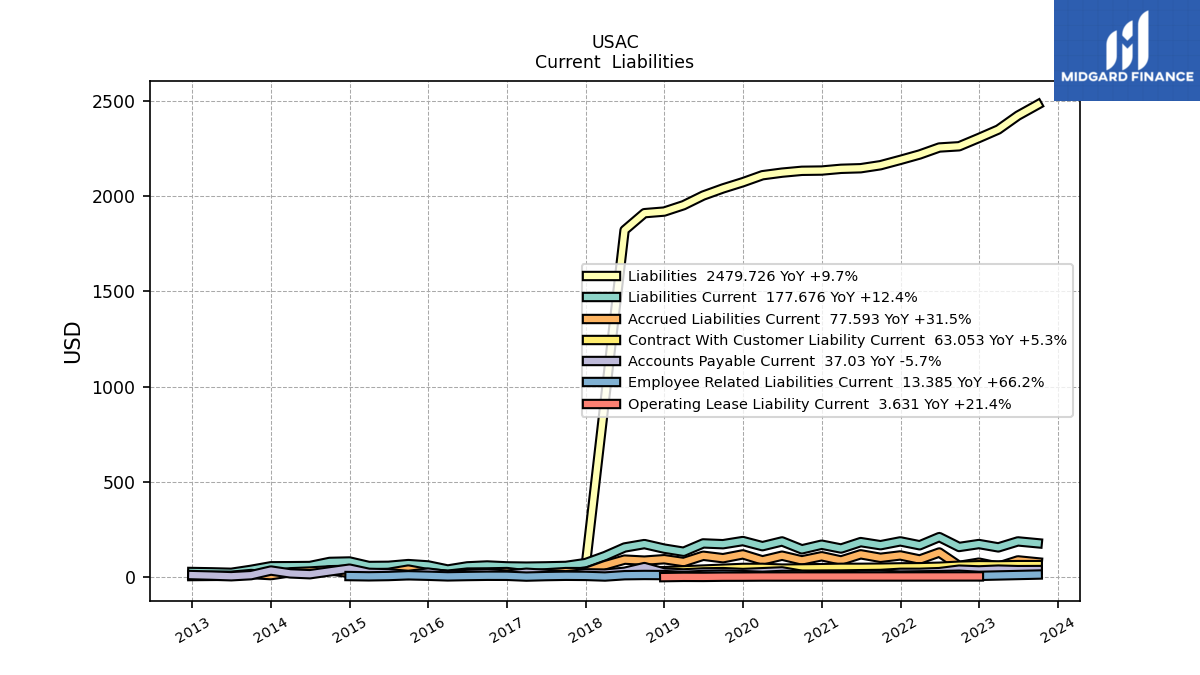
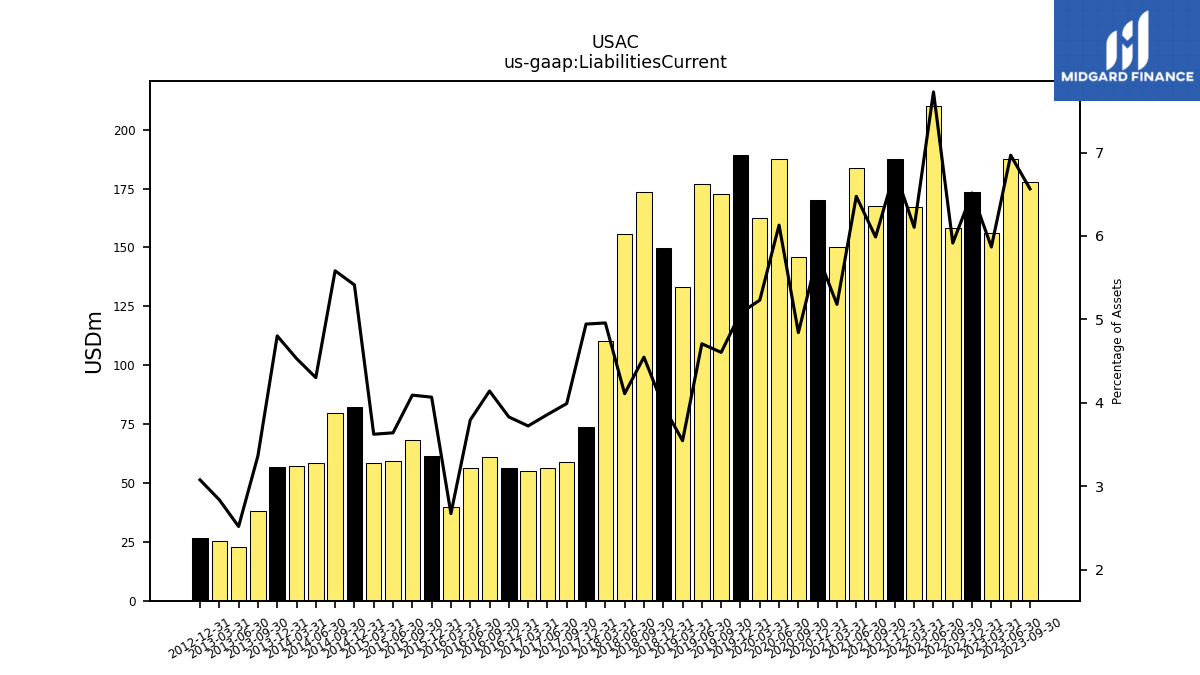
| Liabilities Current | 177.68 | 187.50 | 155.97 | 173.66 | 158.15 | 210.15 | 167.05 | 187.65 | 167.46 | 183.85 | 150.03 | 170.27 | 145.81 | 187.44 | 162.32 | 189.38 | 172.74 | 177.00 | 133.28 | 149.60 | 173.46 | 155.57 | 110.47 | 73.77 | 58.76 | 56.51 | 55.02 | 56.41 | 61.18 | 56.48 | 39.99 | 61.42 | 68.43 | 59.30 | 58.44 | 82.10 | 79.85 | 58.34 | 57.37 | 56.95 | 38.25 | 22.70 | 25.19 | 26.85 | NA | NA | NA | |
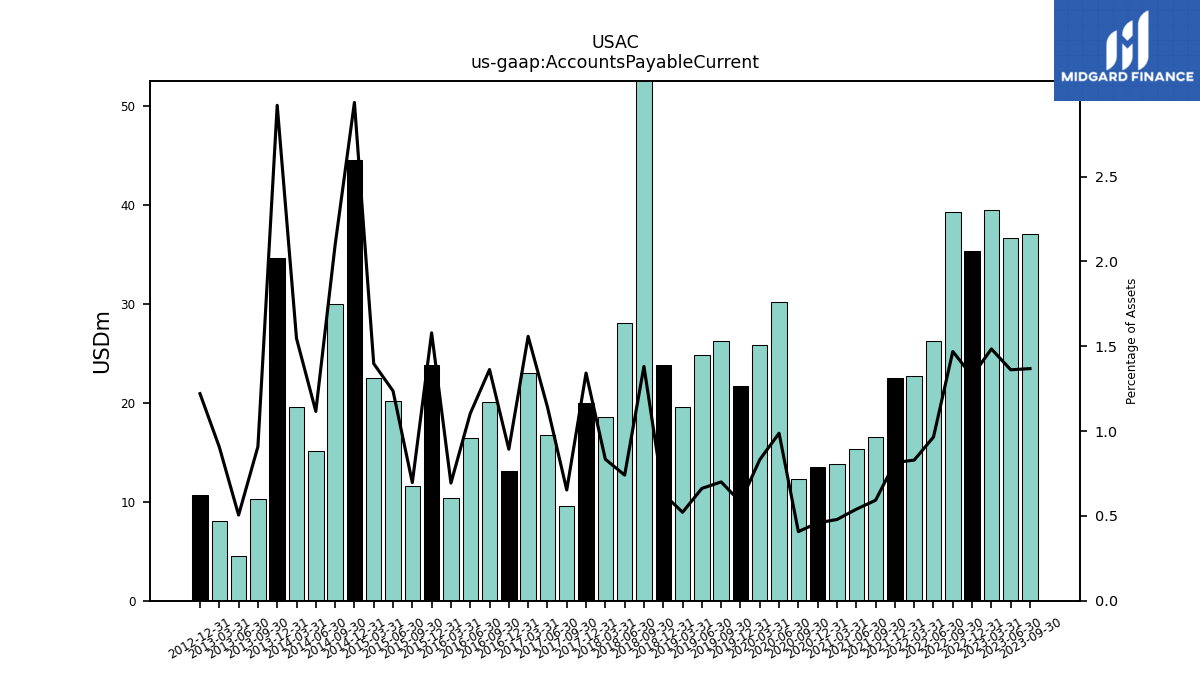
| Accounts Payable Current | 37.03 | 36.63 | 39.44 | 35.30 | 39.27 | 26.25 | 22.69 | 22.54 | 16.56 | 15.31 | 13.87 | 13.53 | 12.27 | 30.19 | 25.81 | 21.70 | 26.27 | 24.89 | 19.59 | 23.80 | 52.68 | 28.03 | 18.59 | 20.02 | 9.61 | 16.72 | 23.03 | 13.15 | 20.13 | 16.42 | 10.37 | 23.84 | 11.65 | 20.14 | 22.54 | 44.53 | 29.98 | 15.13 | 19.57 | 34.63 | 10.32 | 4.55 | 8.04 | 10.65 | NA | NA | NA | |
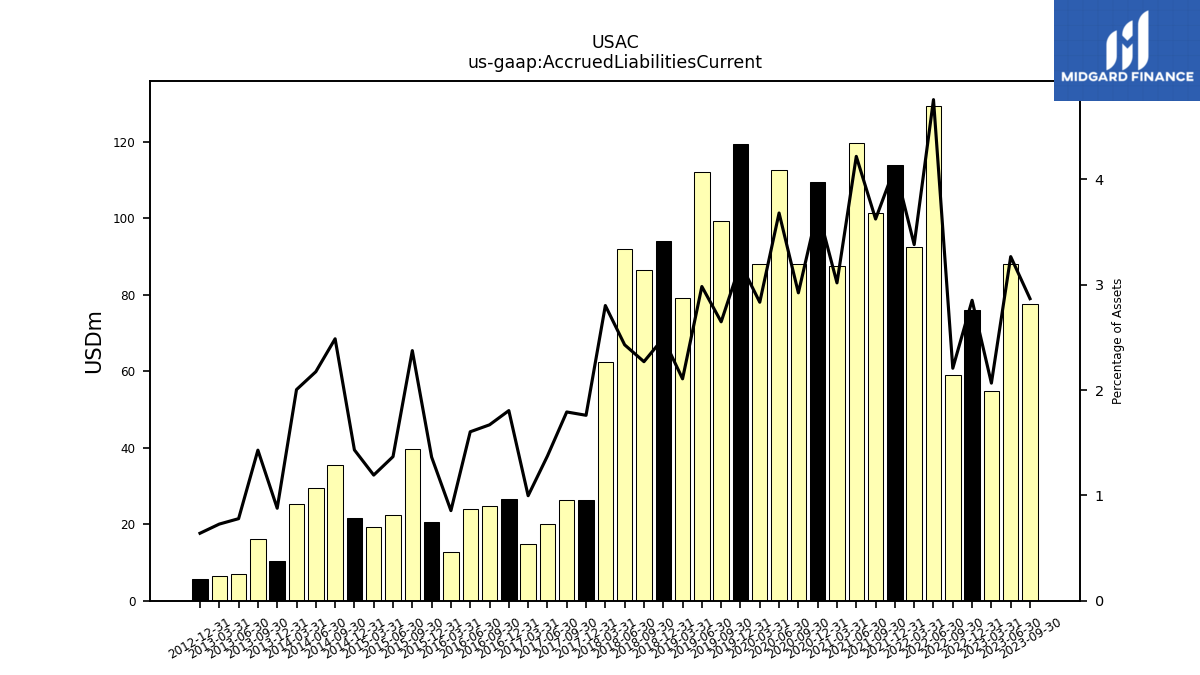
| Accrued Liabilities Current | 77.59 | 87.89 | 54.90 | 76.02 | 58.99 | 129.36 | 92.51 | 113.89 | 101.32 | 119.75 | 87.37 | 109.54 | 88.00 | 112.53 | 87.92 | 119.38 | 99.31 | 112.12 | 79.15 | 94.03 | 86.54 | 91.93 | 62.43 | 26.26 | 26.37 | 20.11 | 14.73 | 26.57 | 24.66 | 23.87 | 12.80 | 20.58 | 39.70 | 22.28 | 19.23 | 21.71 | 35.56 | 29.47 | 25.37 | 10.41 | 16.25 | 7.02 | 6.46 | 5.59 | NA | NA | NA | |
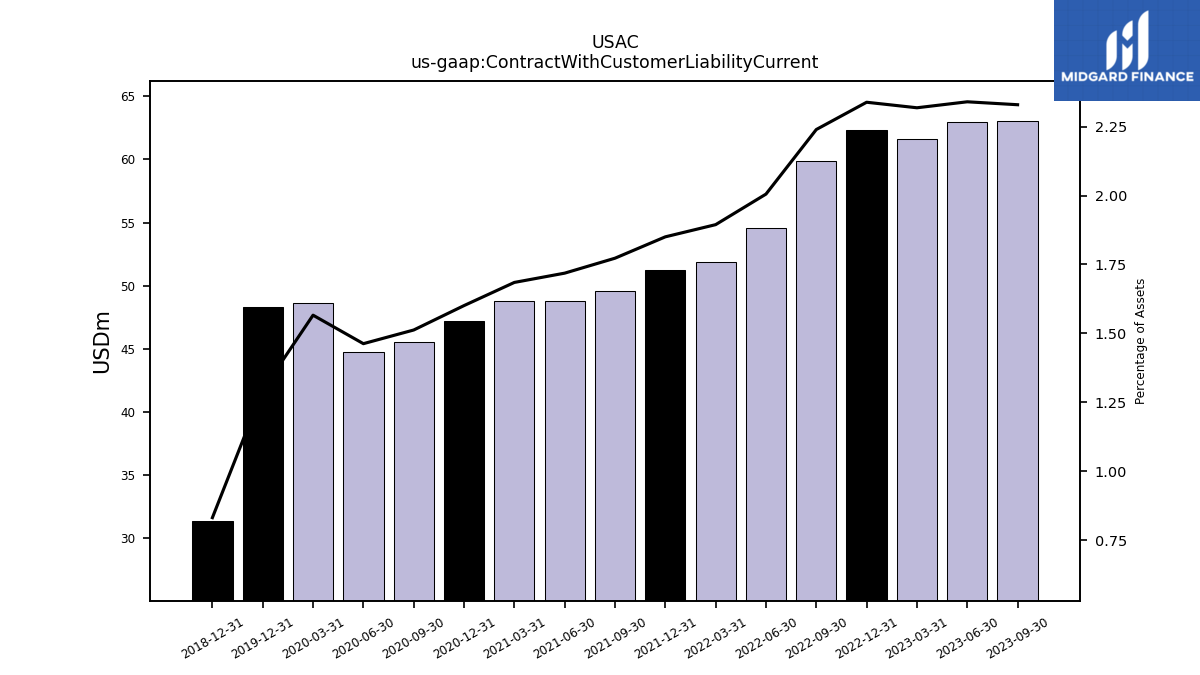
| Contract With Customer Liability Current | 63.05 | 62.98 | 61.63 | 62.34 | 59.88 | 54.55 | 51.85 | 51.22 | 49.58 | 48.79 | 48.79 | 47.20 | 45.54 | 44.72 | 48.59 | 48.29 | NA | NA | NA | 31.37 | NA | NA | NA | NA | NA | NA | NA | NA | NA | NA | NA | NA | NA | NA | NA | NA | NA | NA | NA | NA | NA | NA | NA | NA | NA | NA | NA |
| 2023-09-30 | 2023-06-30 | 2023-03-31 | 2022-12-31 | 2022-09-30 | 2022-06-30 | 2022-03-31 | 2021-12-31 | 2021-09-30 | 2021-06-30 | 2021-03-31 | 2020-12-31 | 2020-09-30 | 2020-06-30 | 2020-03-31 | 2019-12-31 | 2019-09-30 | 2019-06-30 | 2019-03-31 | 2018-12-31 | 2018-09-30 | 2018-06-30 | 2018-03-31 | 2017-12-31 | 2017-09-30 | 2017-06-30 | 2017-03-31 | 2016-12-31 | 2016-09-30 | 2016-06-30 | 2016-03-31 | 2015-12-31 | 2015-09-30 | 2015-06-30 | 2015-03-31 | 2014-12-31 | 2014-09-30 | 2014-06-30 | 2014-03-31 | 2013-12-31 | 2013-09-30 | 2013-06-30 | 2013-03-31 | 2012-12-31 | 2012-09-30 | 2012-06-30 | 2012-03-31 | ||
|---|---|---|---|---|---|---|---|---|---|---|---|---|---|---|---|---|---|---|---|---|---|---|---|---|---|---|---|---|---|---|---|---|---|---|---|---|---|---|---|---|---|---|---|---|---|---|---|---|
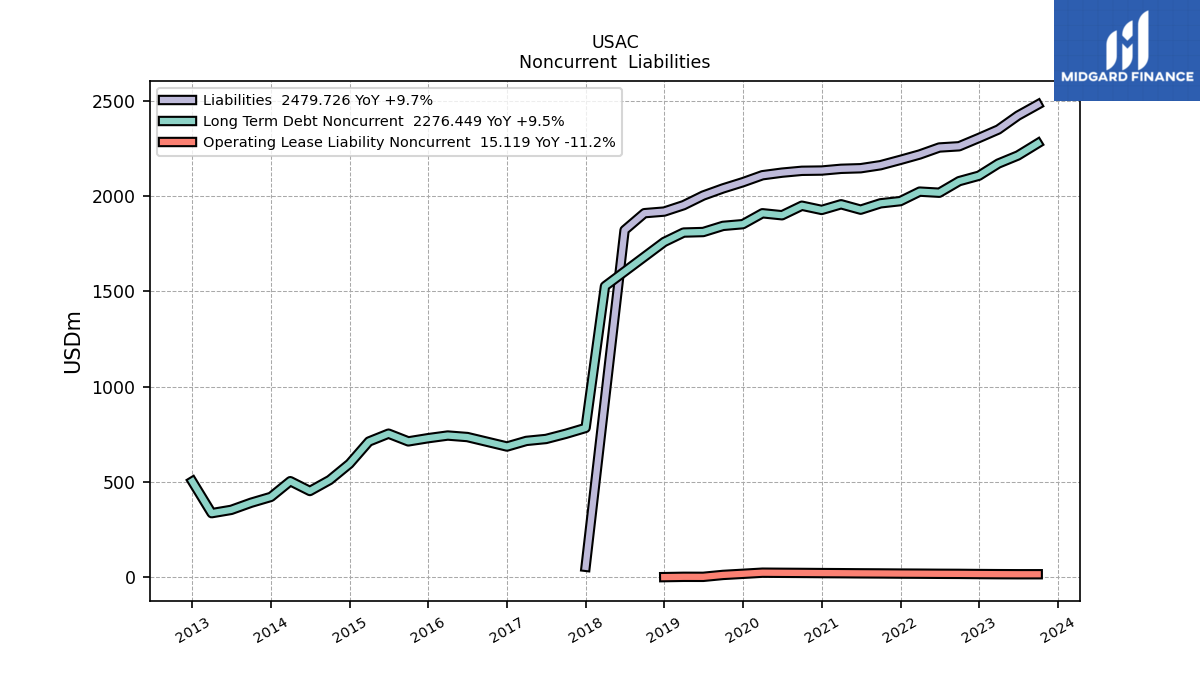
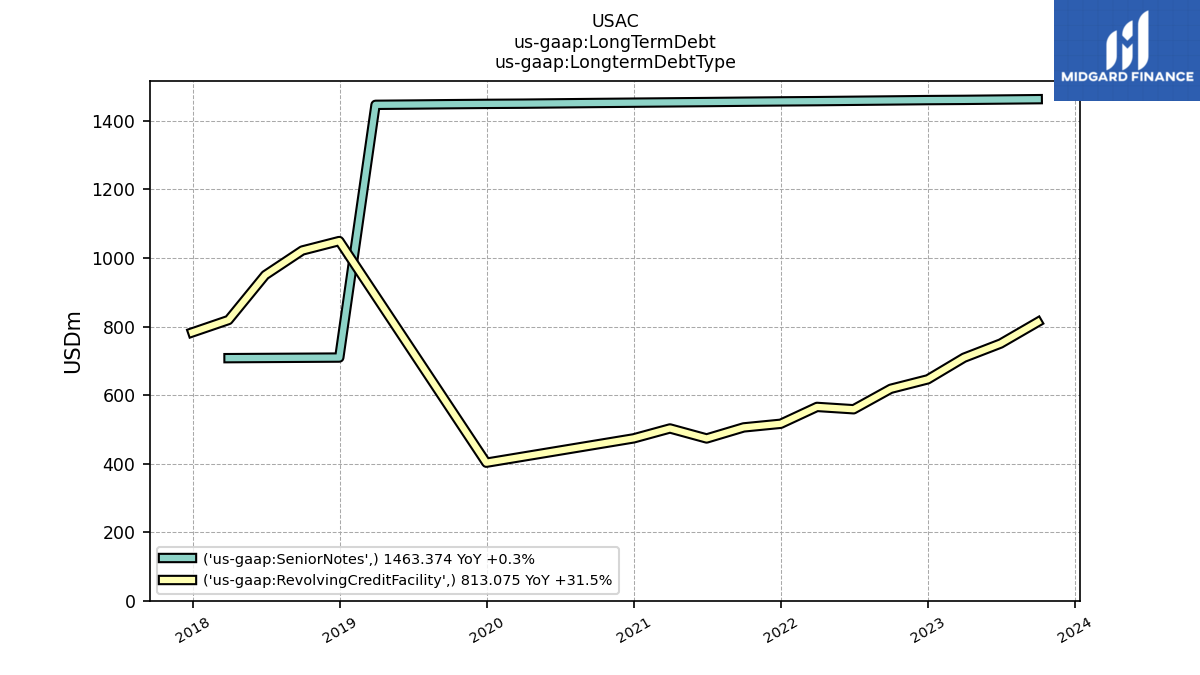
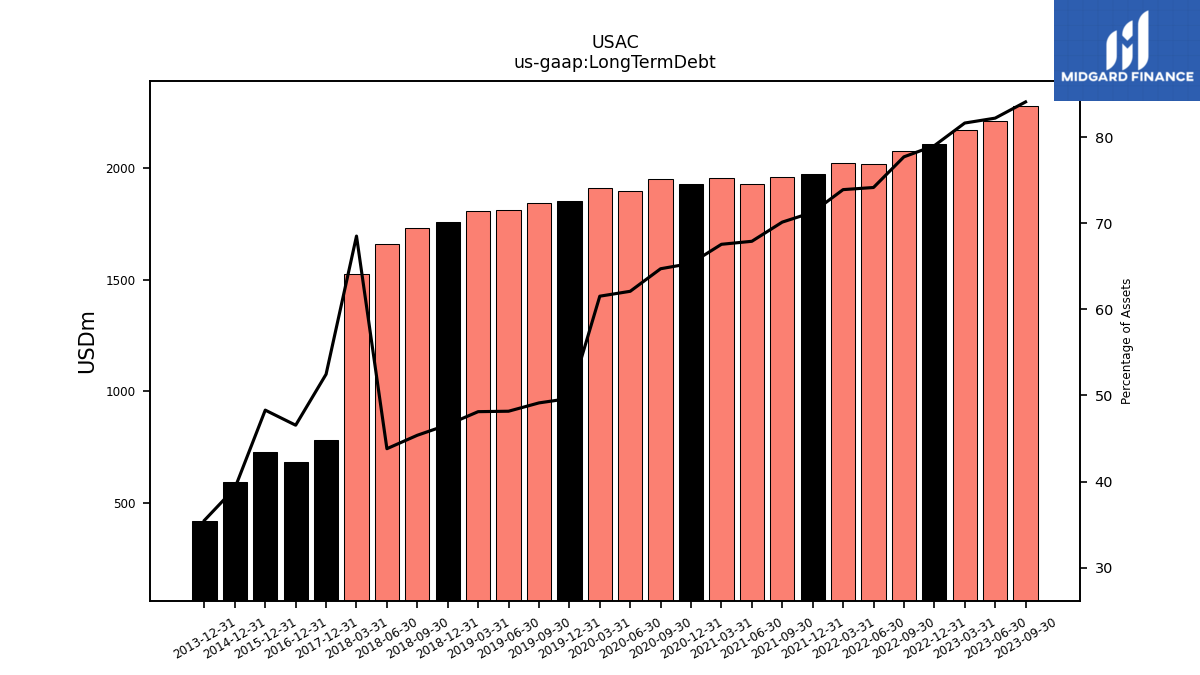
| Long Term Debt | 2276.45 | 2212.79 | 2170.42 | 2106.65 | 2078.07 | 2017.33 | 2023.18 | 1973.23 | 1961.70 | 1928.41 | 1956.75 | 1927.01 | 1949.18 | 1899.07 | 1909.58 | 1852.36 | 1843.31 | 1811.11 | 1808.31 | 1759.06 | 1730.76 | 1658.37 | 1526.87 | 782.90 | NA | NA | NA | 685.37 | NA | NA | NA | 729.19 | NA | NA | NA | 594.86 | NA | NA | NA | 420.93 | NA | NA | NA | NA | NA | NA | NA | |
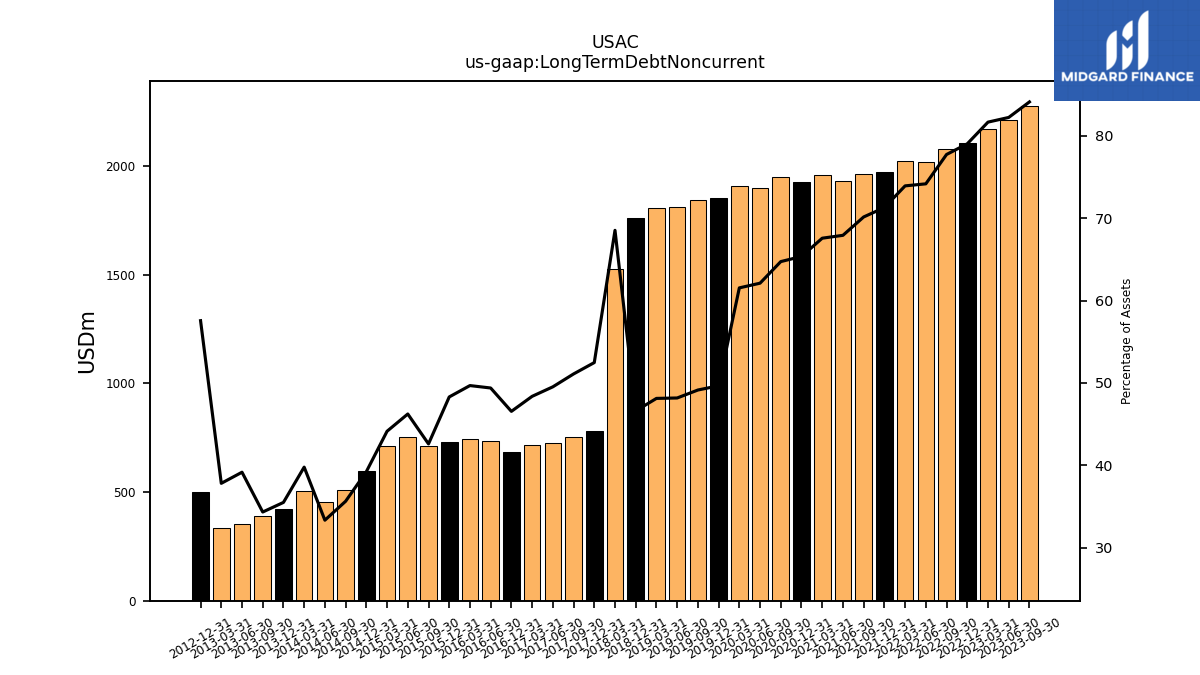
| Long Term Debt Noncurrent | 2276.45 | 2212.79 | 2170.42 | 2106.65 | 2078.07 | 2017.33 | 2023.18 | 1973.23 | 1961.70 | 1928.41 | 1956.75 | 1927.01 | 1949.18 | 1899.07 | 1909.58 | 1852.36 | 1843.31 | 1811.11 | 1808.31 | 1759.06 | NA | NA | 1526.87 | 782.90 | 752.00 | 725.00 | 714.82 | 685.37 | NA | 735.12 | 743.11 | 729.19 | 712.31 | 753.01 | 711.69 | 594.86 | 509.68 | 451.96 | 503.56 | 420.93 | 390.31 | 352.95 | 335.60 | 502.27 | NA | NA | NA | |
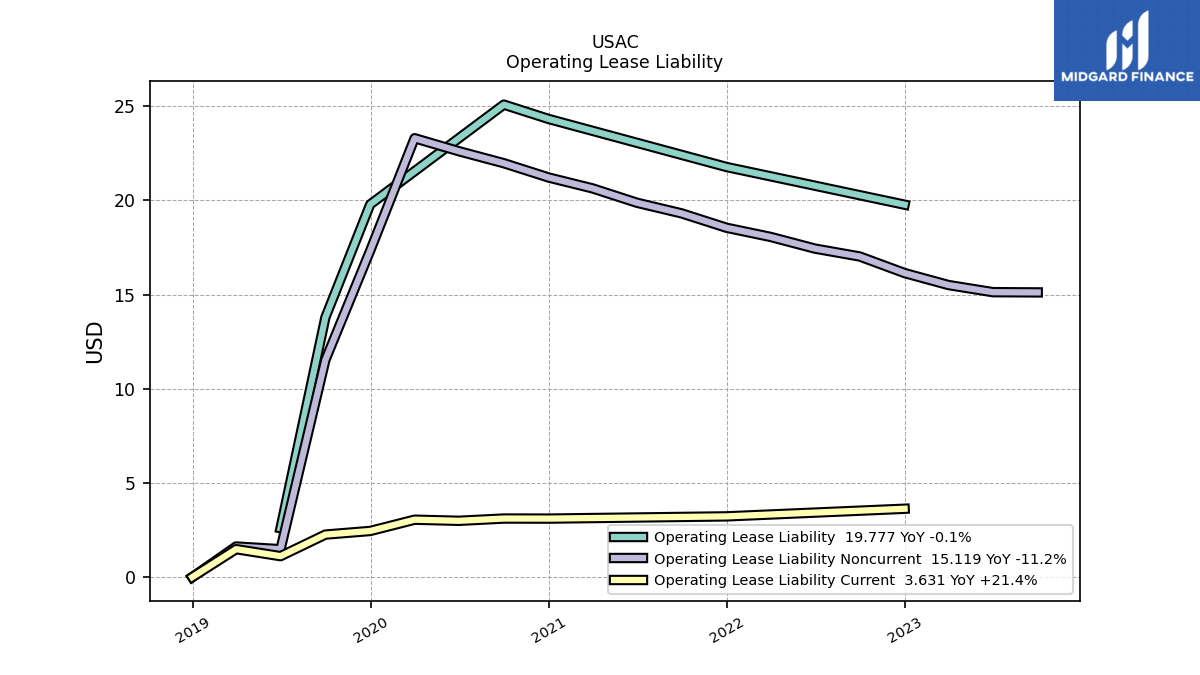
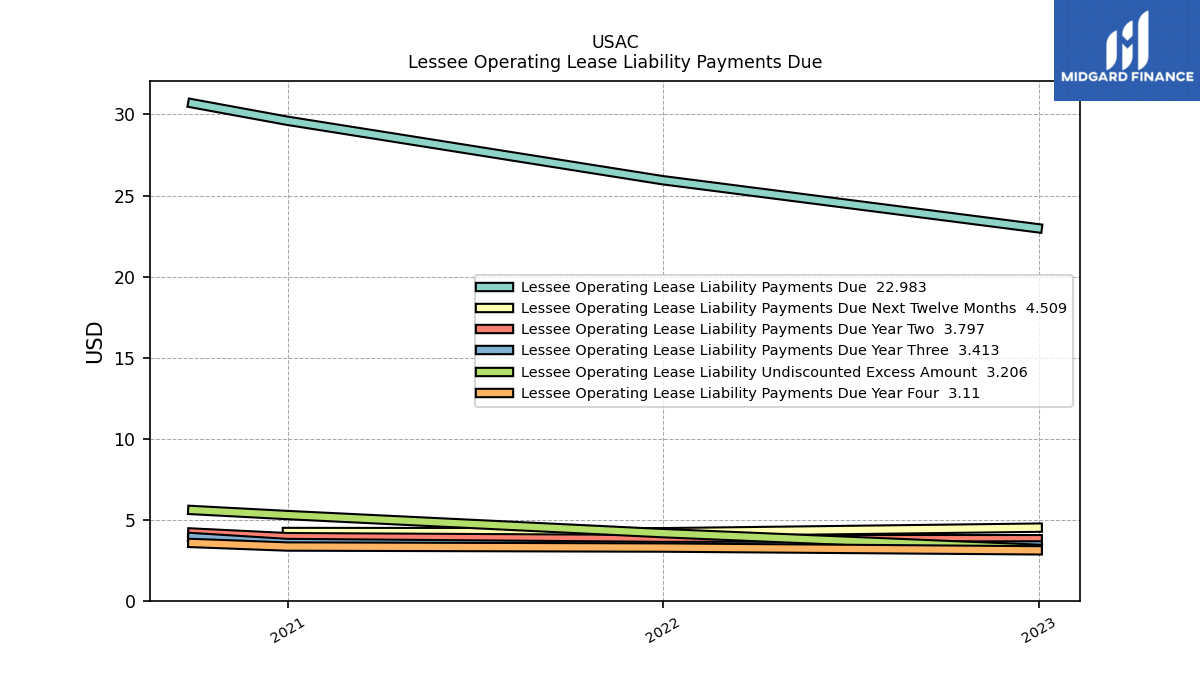
| Operating Lease Liability Noncurrent | 15.12 | 15.13 | 15.51 | 16.15 | 17.03 | 17.45 | 18.07 | 18.55 | 19.31 | 19.88 | 20.64 | 21.22 | 21.98 | 22.61 | 23.31 | 17.34 | 11.53 | 1.48 | 1.63 | 0.00 | NA | NA | NA | NA | NA | NA | NA | NA | NA | NA | NA | NA | NA | NA | NA | NA | NA | NA | NA | NA | NA | NA | NA | NA | NA | NA | NA |
| 2023-09-30 | 2023-06-30 | 2023-03-31 | 2022-12-31 | 2022-09-30 | 2022-06-30 | 2022-03-31 | 2021-12-31 | 2021-09-30 | 2021-06-30 | 2021-03-31 | 2020-12-31 | 2020-09-30 | 2020-06-30 | 2020-03-31 | 2019-12-31 | 2019-09-30 | 2019-06-30 | 2019-03-31 | 2018-12-31 | 2018-09-30 | 2018-06-30 | 2018-03-31 | 2017-12-31 | 2017-09-30 | 2017-06-30 | 2017-03-31 | 2016-12-31 | 2016-09-30 | 2016-06-30 | 2016-03-31 | 2015-12-31 | 2015-09-30 | 2015-06-30 | 2015-03-31 | 2014-12-31 | 2014-09-30 | 2014-06-30 | 2014-03-31 | 2013-12-31 | 2013-09-30 | 2013-06-30 | 2013-03-31 | 2012-12-31 | 2012-09-30 | 2012-06-30 | 2012-03-31 | ||
|---|---|---|---|---|---|---|---|---|---|---|---|---|---|---|---|---|---|---|---|---|---|---|---|---|---|---|---|---|---|---|---|---|---|---|---|---|---|---|---|---|---|---|---|---|---|---|---|---|
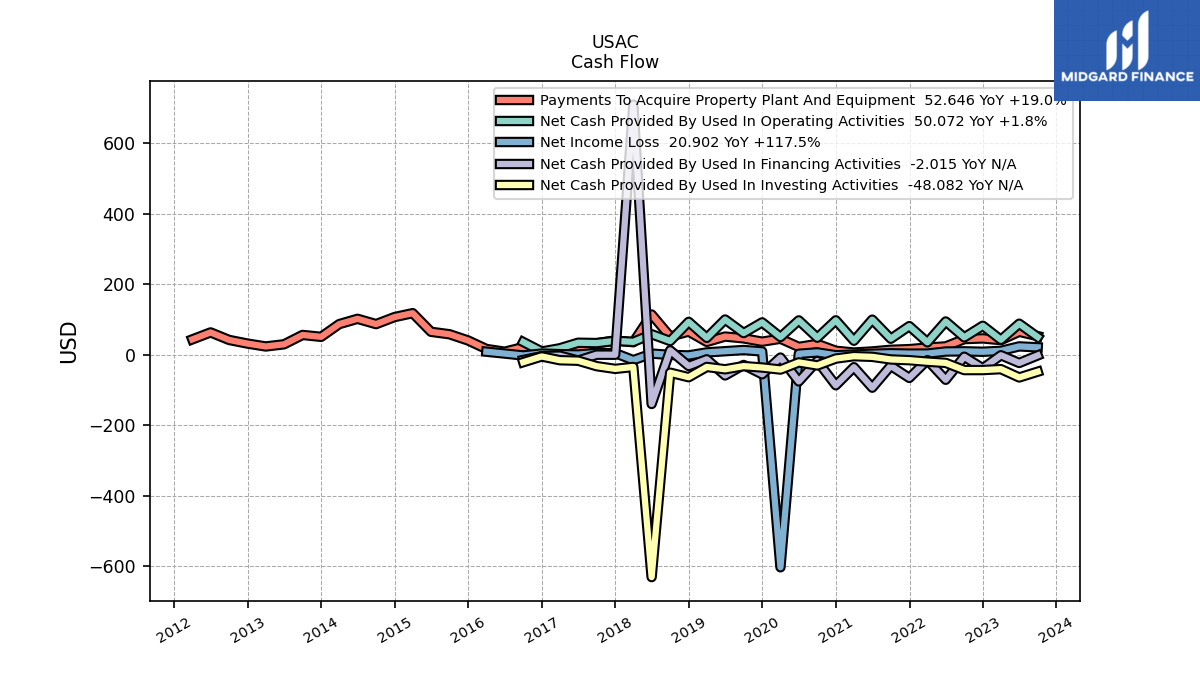
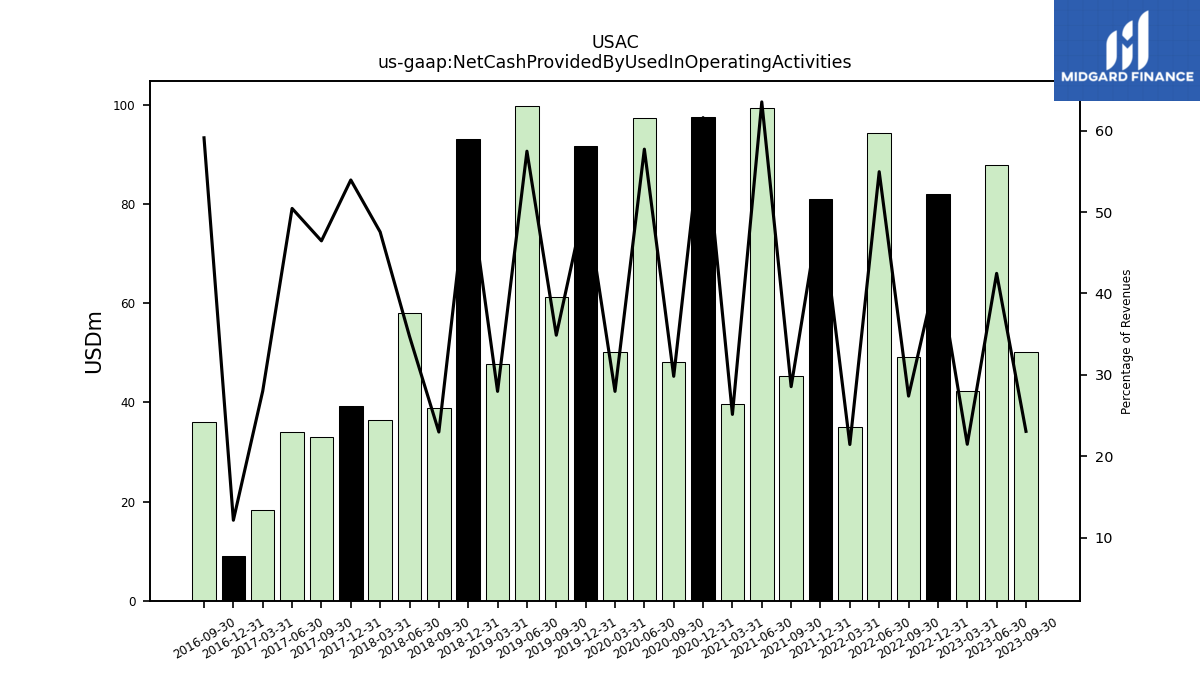
| Net Cash Provided By Used In Operating Activities | 50.07 | 87.87 | 42.34 | 82.10 | 49.21 | 94.23 | 35.05 | 81.06 | 45.30 | 99.46 | 39.61 | 97.55 | 48.22 | 97.36 | 50.08 | 91.70 | 61.29 | 99.82 | 47.77 | 93.14 | 38.83 | 57.98 | 36.39 | 39.34 | 33.03 | 33.99 | 18.29 | 9.10 | 36.14 | NA | NA | NA | NA | NA | NA | NA | NA | NA | NA | NA | NA | NA | NA | NA | NA | NA | NA | |
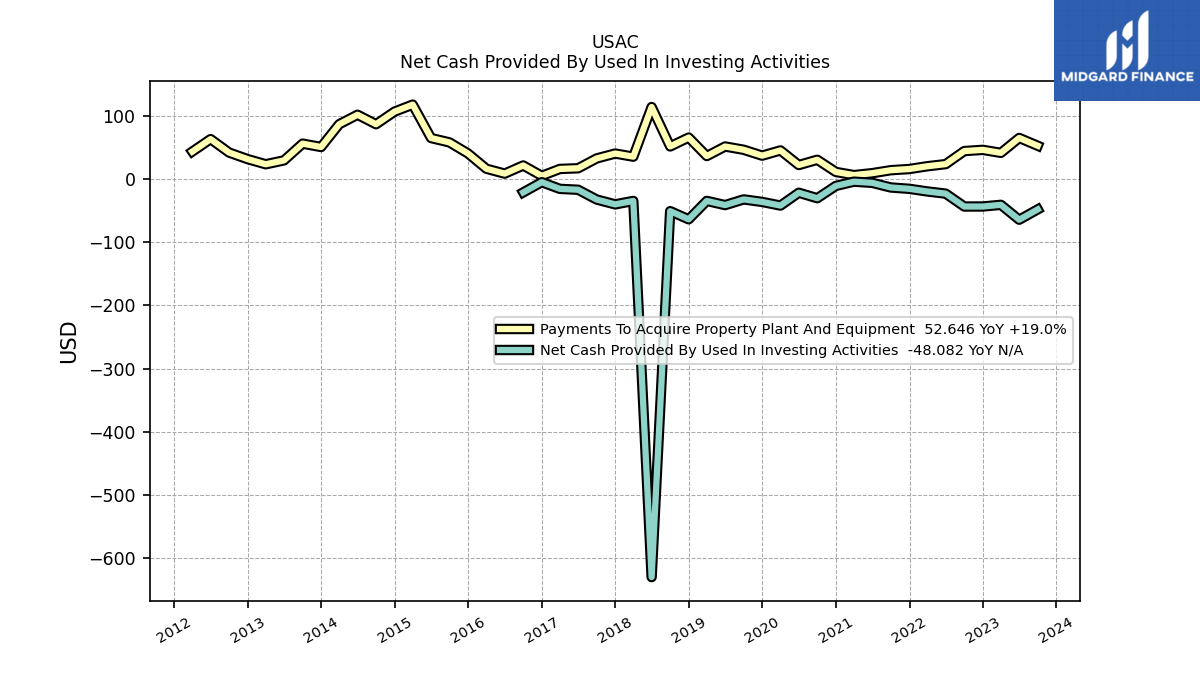
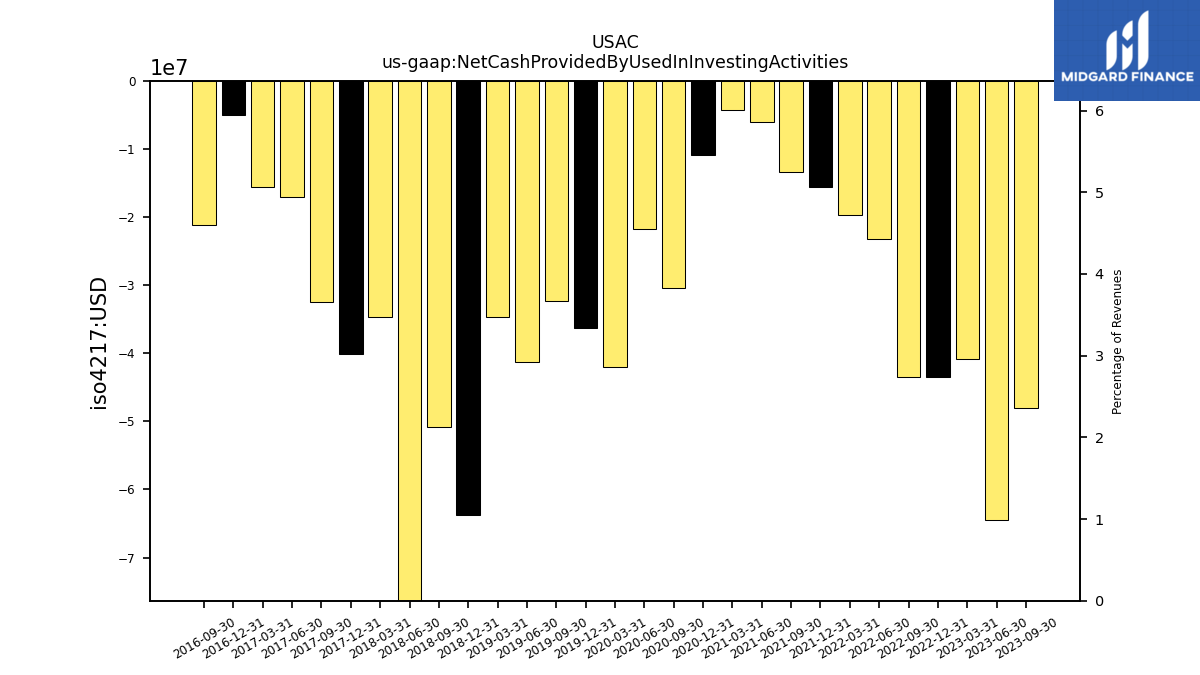
| Net Cash Provided By Used In Investing Activities | -48.08 | -64.45 | -40.86 | -43.53 | -43.55 | -23.16 | -19.71 | -15.52 | -13.40 | -6.06 | -4.21 | -10.91 | -30.39 | -21.73 | -42.07 | -36.26 | -32.28 | -41.30 | -34.65 | -63.81 | -50.88 | -630.29 | -34.68 | -40.15 | -32.48 | -17.01 | -15.59 | -4.96 | -21.22 | NA | NA | NA | NA | NA | NA | NA | NA | NA | NA | NA | NA | NA | NA | NA | NA | NA | NA | |
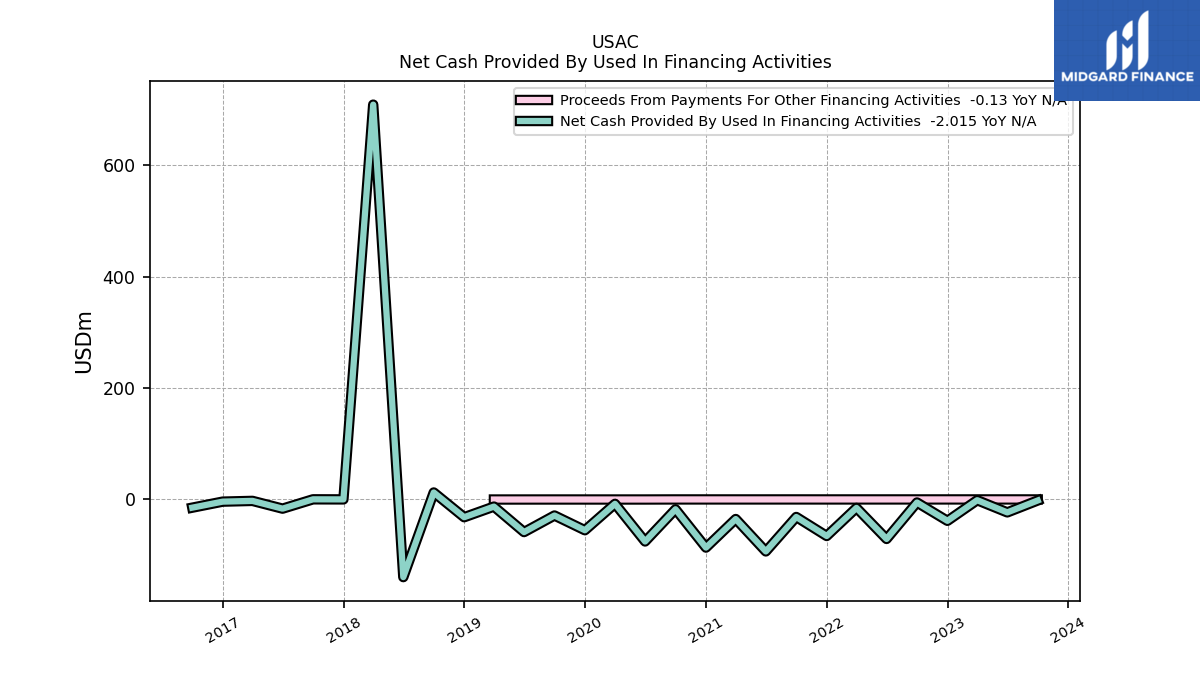
| Net Cash Provided By Used In Financing Activities | -2.02 | -23.40 | -1.51 | -38.54 | -5.66 | -71.09 | -15.32 | -65.78 | -31.65 | -93.49 | -35.31 | -86.64 | -17.82 | -75.63 | -8.02 | -55.43 | -29.02 | -58.75 | -12.99 | -32.06 | 12.35 | -139.63 | 708.75 | -0.07 | 0.06 | -16.66 | -2.75 | -4.08 | -14.92 | NA | NA | NA | NA | NA | NA | NA | NA | NA | NA | NA | NA | NA | NA | NA | NA | NA | NA |
| 2023-09-30 | 2023-06-30 | 2023-03-31 | 2022-12-31 | 2022-09-30 | 2022-06-30 | 2022-03-31 | 2021-12-31 | 2021-09-30 | 2021-06-30 | 2021-03-31 | 2020-12-31 | 2020-09-30 | 2020-06-30 | 2020-03-31 | 2019-12-31 | 2019-09-30 | 2019-06-30 | 2019-03-31 | 2018-12-31 | 2018-09-30 | 2018-06-30 | 2018-03-31 | 2017-12-31 | 2017-09-30 | 2017-06-30 | 2017-03-31 | 2016-12-31 | 2016-09-30 | 2016-06-30 | 2016-03-31 | 2015-12-31 | 2015-09-30 | 2015-06-30 | 2015-03-31 | 2014-12-31 | 2014-09-30 | 2014-06-30 | 2014-03-31 | 2013-12-31 | 2013-09-30 | 2013-06-30 | 2013-03-31 | 2012-12-31 | 2012-09-30 | 2012-06-30 | 2012-03-31 | ||
|---|---|---|---|---|---|---|---|---|---|---|---|---|---|---|---|---|---|---|---|---|---|---|---|---|---|---|---|---|---|---|---|---|---|---|---|---|---|---|---|---|---|---|---|---|---|---|---|---|
| Net Cash Provided By Used In Operating Activities | 50.07 | 87.87 | 42.34 | 82.10 | 49.21 | 94.23 | 35.05 | 81.06 | 45.30 | 99.46 | 39.61 | 97.55 | 48.22 | 97.36 | 50.08 | 91.70 | 61.29 | 99.82 | 47.77 | 93.14 | 38.83 | 57.98 | 36.39 | 39.34 | 33.03 | 33.99 | 18.29 | 9.10 | 36.14 | NA | NA | NA | NA | NA | NA | NA | NA | NA | NA | NA | NA | NA | NA | NA | NA | NA | NA | |
| Net Income Loss | 20.90 | 23.58 | 10.94 | 8.37 | 9.61 | 9.09 | 3.25 | 3.10 | 4.12 | 2.69 | 0.37 | -1.47 | 6.52 | 2.68 | -602.46 | 9.28 | 13.31 | 9.95 | 6.59 | -2.00 | -0.56 | 3.20 | -15.37 | 4.55 | 4.79 | 0.55 | 1.55 | 3.27 | -2.15 | 3.27 | 8.54 | NA | NA | NA | NA | NA | NA | NA | NA | NA | NA | NA | NA | NA | NA | NA | NA | |
| Profit Loss | 20.90 | 23.58 | 10.94 | NA | 9.61 | 9.09 | 3.25 | NA | 4.12 | 2.69 | 0.37 | NA | 6.52 | 2.68 | -602.46 | NA | 13.31 | 9.95 | 6.59 | 10.19 | -0.56 | -4.80 | -15.37 | -232.22 | -12.36 | -21.71 | 1.55 | NA | NA | NA | NA | NA | NA | NA | NA | NA | NA | NA | NA | NA | NA | NA | NA | NA | NA | NA | NA | |
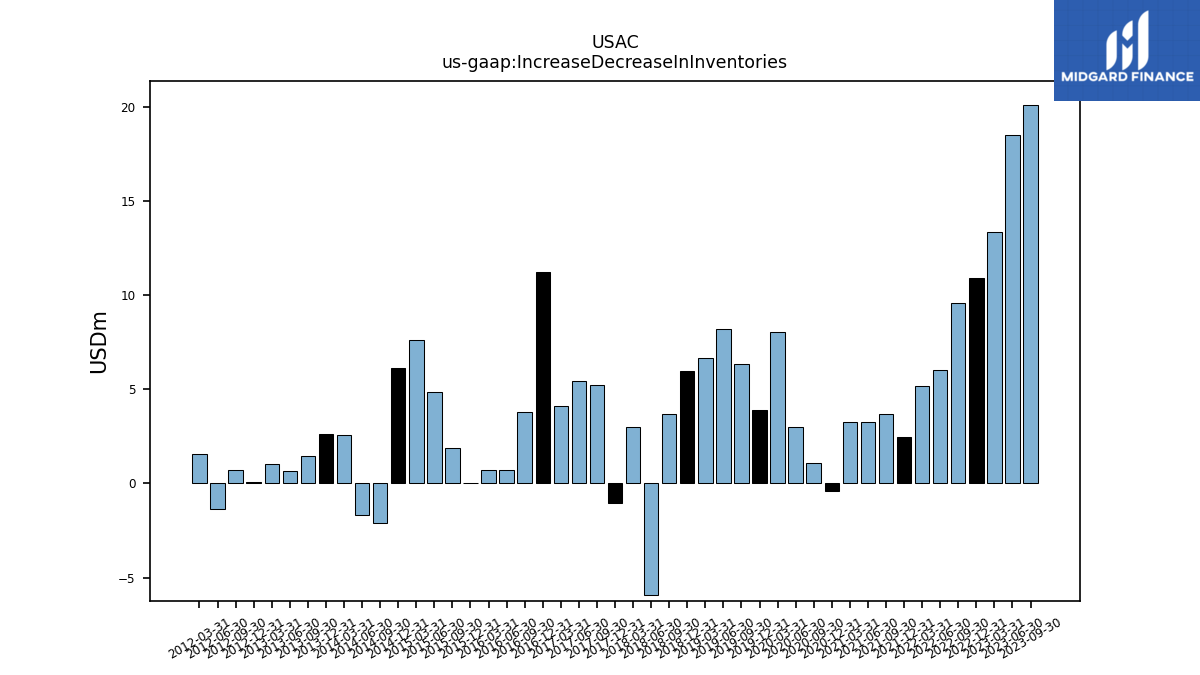
| Increase Decrease In Inventories | 20.06 | 18.49 | 13.33 | 10.89 | 9.55 | 6.00 | 5.16 | 2.44 | 3.66 | 3.23 | 3.26 | -0.42 | 1.05 | 3.00 | 8.05 | 3.91 | 6.36 | 8.21 | 6.66 | 5.97 | 3.68 | -5.90 | 2.98 | -1.05 | 5.24 | 5.44 | 4.11 | 11.23 | 3.76 | 0.73 | 0.72 | 0.01 | 1.87 | 4.85 | 7.62 | 6.13 | -2.11 | -1.66 | 2.58 | 2.59 | 1.47 | 0.63 | 1.03 | 0.05 | 0.72 | -1.35 | 1.58 | |
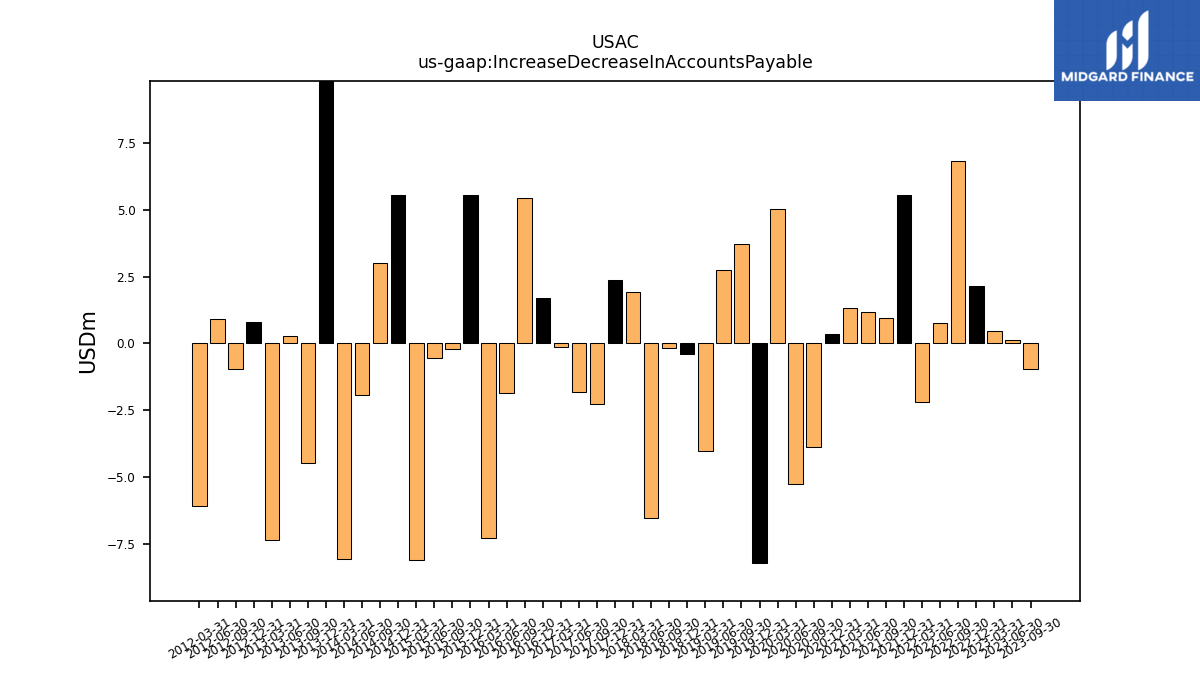
| Increase Decrease In Accounts Payable | -0.95 | 0.13 | 0.45 | 2.16 | 6.83 | 0.75 | -2.20 | 5.56 | 0.97 | 1.18 | 1.32 | 0.35 | -3.87 | -5.26 | 5.04 | -8.23 | 3.73 | 2.75 | -4.01 | -0.39 | -0.15 | -6.53 | 1.94 | 2.38 | -2.25 | -1.83 | -0.14 | 1.70 | 5.45 | -1.84 | -7.29 | 5.57 | -0.22 | -0.55 | -8.10 | 5.55 | 3.03 | -1.93 | -8.08 | 19.70 | -4.49 | 0.28 | -7.36 | 0.81 | -0.96 | 0.91 | -6.09 | |
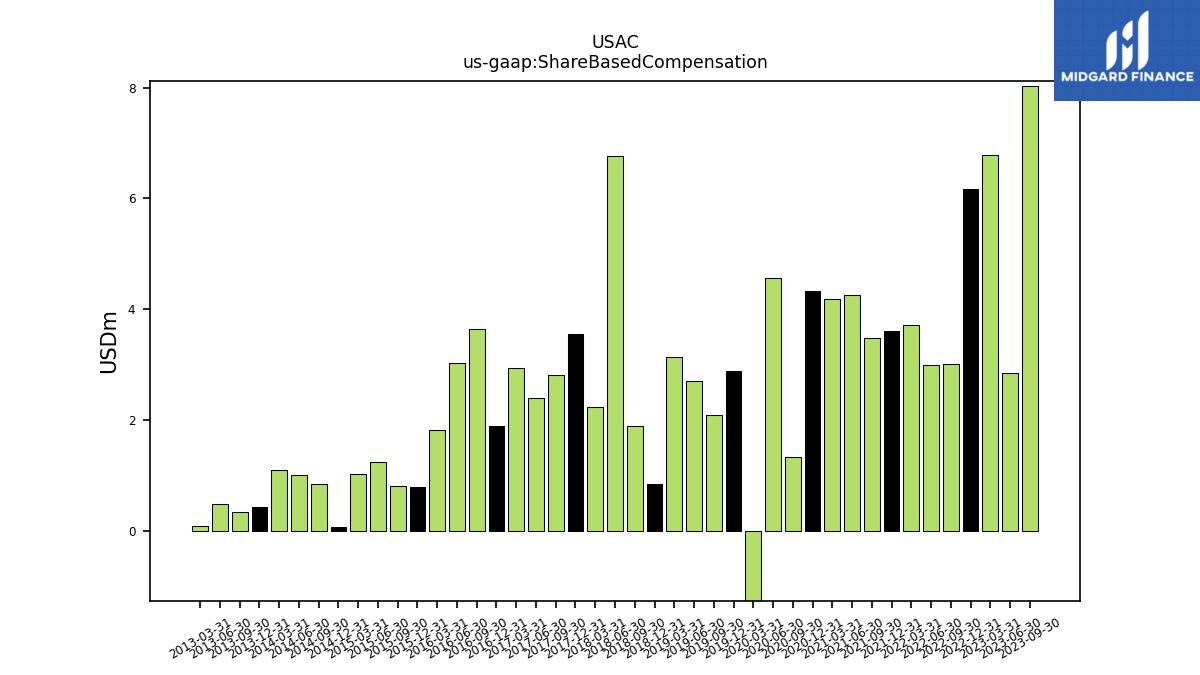
| Share Based Compensation | 8.02 | 2.85 | 6.78 | 6.18 | 3.01 | 3.00 | 3.71 | 3.60 | 3.48 | 4.26 | 4.18 | 4.33 | 1.33 | 4.57 | -1.83 | 2.88 | 2.09 | 2.71 | 3.13 | 0.85 | 1.89 | 6.76 | 2.24 | 3.55 | 2.81 | 2.40 | 2.94 | 1.89 | 3.65 | 3.02 | 1.81 | 0.80 | 0.80 | 1.24 | 1.03 | 0.08 | 0.85 | 1.01 | 1.10 | 0.44 | 0.34 | 0.49 | 0.08 | NA | NA | NA | NA |
| 2023-09-30 | 2023-06-30 | 2023-03-31 | 2022-12-31 | 2022-09-30 | 2022-06-30 | 2022-03-31 | 2021-12-31 | 2021-09-30 | 2021-06-30 | 2021-03-31 | 2020-12-31 | 2020-09-30 | 2020-06-30 | 2020-03-31 | 2019-12-31 | 2019-09-30 | 2019-06-30 | 2019-03-31 | 2018-12-31 | 2018-09-30 | 2018-06-30 | 2018-03-31 | 2017-12-31 | 2017-09-30 | 2017-06-30 | 2017-03-31 | 2016-12-31 | 2016-09-30 | 2016-06-30 | 2016-03-31 | 2015-12-31 | 2015-09-30 | 2015-06-30 | 2015-03-31 | 2014-12-31 | 2014-09-30 | 2014-06-30 | 2014-03-31 | 2013-12-31 | 2013-09-30 | 2013-06-30 | 2013-03-31 | 2012-12-31 | 2012-09-30 | 2012-06-30 | 2012-03-31 | ||
|---|---|---|---|---|---|---|---|---|---|---|---|---|---|---|---|---|---|---|---|---|---|---|---|---|---|---|---|---|---|---|---|---|---|---|---|---|---|---|---|---|---|---|---|---|---|---|---|---|
| Net Cash Provided By Used In Investing Activities | -48.08 | -64.45 | -40.86 | -43.53 | -43.55 | -23.16 | -19.71 | -15.52 | -13.40 | -6.06 | -4.21 | -10.91 | -30.39 | -21.73 | -42.07 | -36.26 | -32.28 | -41.30 | -34.65 | -63.81 | -50.88 | -630.29 | -34.68 | -40.15 | -32.48 | -17.01 | -15.59 | -4.96 | -21.22 | NA | NA | NA | NA | NA | NA | NA | NA | NA | NA | NA | NA | NA | NA | NA | NA | NA | NA | |
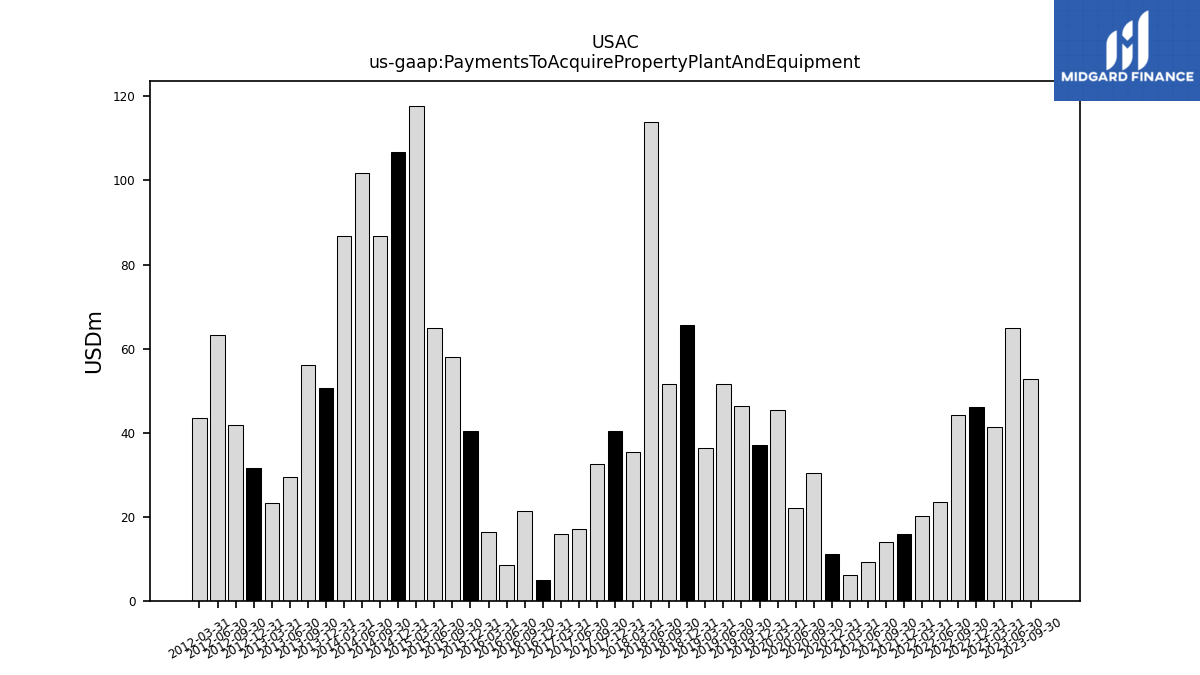
| Payments To Acquire Property Plant And Equipment | 52.65 | 65.00 | 41.40 | 46.16 | 44.24 | 23.59 | 20.23 | 15.82 | 13.96 | 9.25 | 6.18 | 11.19 | 30.48 | 22.12 | 45.27 | 37.00 | 46.33 | 51.48 | 36.34 | 65.63 | 51.57 | 113.98 | 35.38 | 40.34 | 32.59 | 17.03 | 15.93 | 4.99 | 21.44 | 8.54 | 16.27 | 40.42 | 57.95 | 64.91 | 117.77 | 106.71 | 86.72 | 101.75 | 86.76 | 50.64 | 56.02 | 29.53 | 23.35 | 31.50 | 41.88 | 63.20 | 43.40 |
| 2023-09-30 | 2023-06-30 | 2023-03-31 | 2022-12-31 | 2022-09-30 | 2022-06-30 | 2022-03-31 | 2021-12-31 | 2021-09-30 | 2021-06-30 | 2021-03-31 | 2020-12-31 | 2020-09-30 | 2020-06-30 | 2020-03-31 | 2019-12-31 | 2019-09-30 | 2019-06-30 | 2019-03-31 | 2018-12-31 | 2018-09-30 | 2018-06-30 | 2018-03-31 | 2017-12-31 | 2017-09-30 | 2017-06-30 | 2017-03-31 | 2016-12-31 | 2016-09-30 | 2016-06-30 | 2016-03-31 | 2015-12-31 | 2015-09-30 | 2015-06-30 | 2015-03-31 | 2014-12-31 | 2014-09-30 | 2014-06-30 | 2014-03-31 | 2013-12-31 | 2013-09-30 | 2013-06-30 | 2013-03-31 | 2012-12-31 | 2012-09-30 | 2012-06-30 | 2012-03-31 | ||
|---|---|---|---|---|---|---|---|---|---|---|---|---|---|---|---|---|---|---|---|---|---|---|---|---|---|---|---|---|---|---|---|---|---|---|---|---|---|---|---|---|---|---|---|---|---|---|---|---|
| Net Cash Provided By Used In Financing Activities | -2.02 | -23.40 | -1.51 | -38.54 | -5.66 | -71.09 | -15.32 | -65.78 | -31.65 | -93.49 | -35.31 | -86.64 | -17.82 | -75.63 | -8.02 | -55.43 | -29.02 | -58.75 | -12.99 | -32.06 | 12.35 | -139.63 | 708.75 | -0.07 | 0.06 | -16.66 | -2.75 | -4.08 | -14.92 | NA | NA | NA | NA | NA | NA | NA | NA | NA | NA | NA | NA | NA | NA | NA | NA | NA | NA |
| 2023-09-30 | 2023-06-30 | 2023-03-31 | 2022-12-31 | 2022-09-30 | 2022-06-30 | 2022-03-31 | 2021-12-31 | 2021-09-30 | 2021-06-30 | 2021-03-31 | 2020-12-31 | 2020-09-30 | 2020-06-30 | 2020-03-31 | 2019-12-31 | 2019-09-30 | 2019-06-30 | 2019-03-31 | 2018-12-31 | 2018-09-30 | 2018-06-30 | 2018-03-31 | 2017-12-31 | 2017-09-30 | 2017-06-30 | 2017-03-31 | 2016-12-31 | 2016-09-30 | 2016-06-30 | 2016-03-31 | 2015-12-31 | 2015-09-30 | 2015-06-30 | 2015-03-31 | 2014-12-31 | 2014-09-30 | 2014-06-30 | 2014-03-31 | 2013-12-31 | 2013-09-30 | 2013-06-30 | 2013-03-31 | 2012-12-31 | 2012-09-30 | 2012-06-30 | 2012-03-31 | ||
|---|---|---|---|---|---|---|---|---|---|---|---|---|---|---|---|---|---|---|---|---|---|---|---|---|---|---|---|---|---|---|---|---|---|---|---|---|---|---|---|---|---|---|---|---|---|---|---|---|
| Revenues | 217.09 | 206.92 | 197.12 | 190.11 | 179.61 | 171.46 | 163.41 | 159.94 | 158.63 | 156.56 | 157.51 | 158.37 | 161.67 | 168.65 | 179.00 | 178.19 | 175.76 | 173.68 | 170.75 | 171.98 | 168.95 | 166.90 | 76.53 | 72.94 | 71.09 | 67.37 | 65.27 | 74.91 | 61.13 | 63.51 | 66.37 | 68.61 | 70.54 | 66.39 | 65.00 | 60.99 | 57.05 | 53.27 | 50.20 | 48.64 | 38.36 | 33.31 | 32.60 | 31.77 | 31.02 | 28.87 | 27.12 | |
| Revenue From Contract With Customer Excluding Assessed Tax | 217.09 | 206.92 | 197.12 | 190.11 | 179.61 | 171.46 | 163.41 | 159.94 | 158.63 | 156.56 | 157.51 | 158.37 | 161.67 | 168.65 | 179.00 | 178.19 | 175.76 | 173.68 | 170.75 | 171.98 | 168.95 | 166.90 | 77.74 | 72.94 | 71.09 | 67.37 | 66.03 | 74.91 | 61.13 | 63.51 | 66.37 | 68.61 | 70.54 | 66.39 | 65.00 | 60.99 | 57.05 | 53.27 | 50.20 | 48.64 | 38.36 | 33.31 | 32.60 | 31.77 | 31.02 | 28.87 | 27.12 | |
| Contract Operations Revenue | 209.84 | 202.40 | 193.14 | 184.81 | 174.70 | 167.85 | 161.49 | 156.69 | 154.55 | 154.73 | 155.47 | 154.93 | 159.68 | 166.10 | 175.90 | 174.28 | 169.91 | 169.27 | 168.01 | 167.28 | 162.90 | 159.57 | 76.72 | 70.81 | 66.91 | 65.16 | 60.43 | NA | NA | NA | NA | NA | NA | NA | NA | NA | NA | NA | NA | NA | NA | NA | NA | NA | NA | NA | NA | |
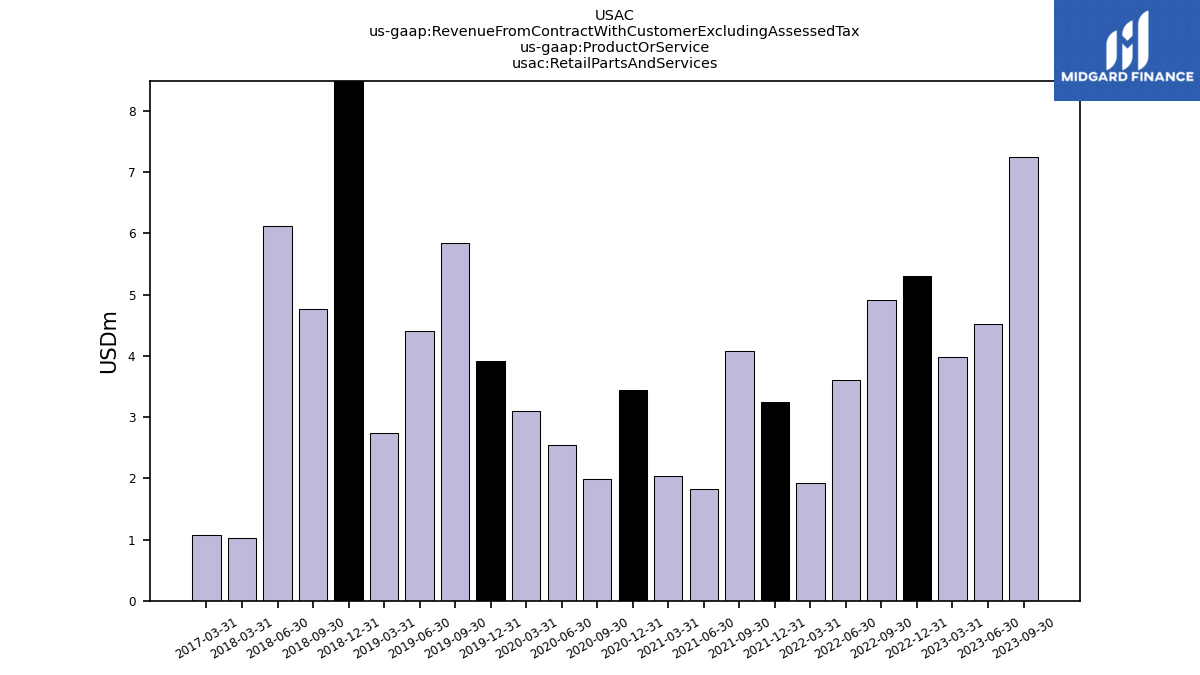
| Retail Parts And Services | 7.24 | 4.52 | 3.98 | 5.30 | 4.91 | 3.61 | 1.93 | 3.25 | 4.07 | 1.83 | 2.04 | 3.44 | 1.98 | 2.55 | 3.10 | 3.91 | 5.84 | 4.40 | 2.74 | 10.05 | 4.76 | 6.12 | 1.02 | NA | NA | NA | 1.08 | NA | NA | NA | NA | NA | NA | NA | NA | NA | NA | NA | NA | NA | NA | NA | NA | NA | NA | NA | NA | |
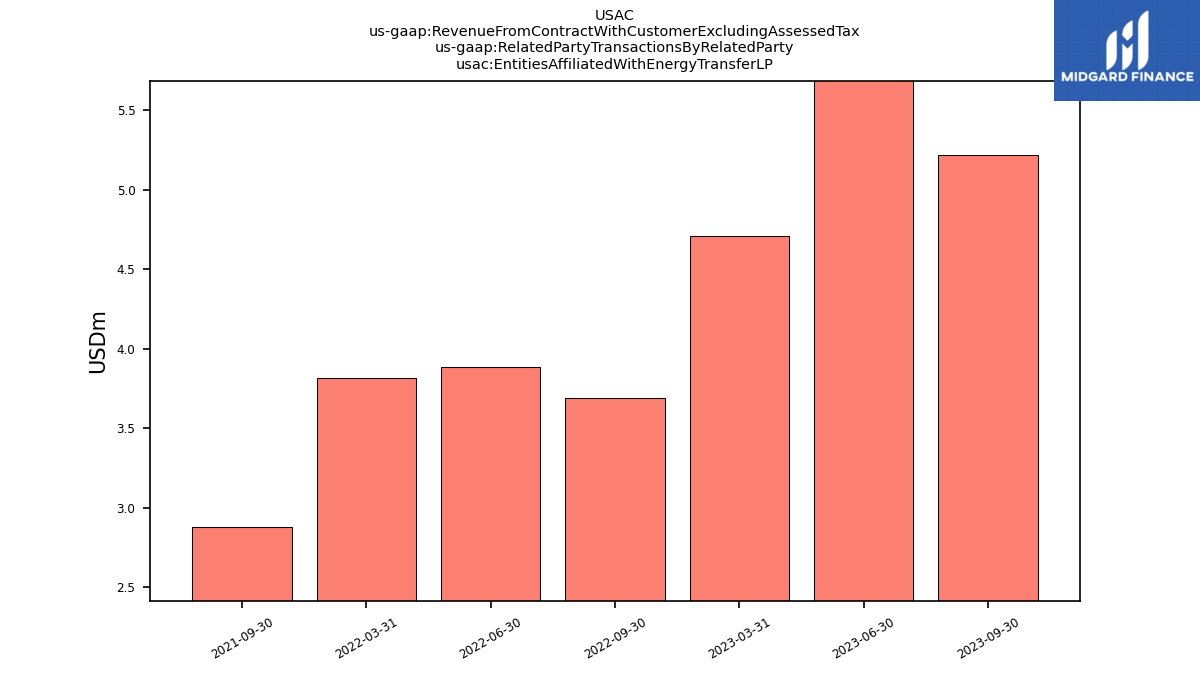
| Entities Affiliated With Energy Transfer L P | 5.22 | 5.84 | 4.71 | NA | 3.69 | 3.89 | 3.82 | NA | 2.88 | NA | NA | NA | NA | NA | NA | NA | NA | NA | NA | NA | NA | NA | NA | NA | NA | NA | NA | NA | NA | NA | NA | NA | NA | NA | NA | NA | NA | NA | NA | NA | NA | NA | NA | NA | NA | NA | NA | |
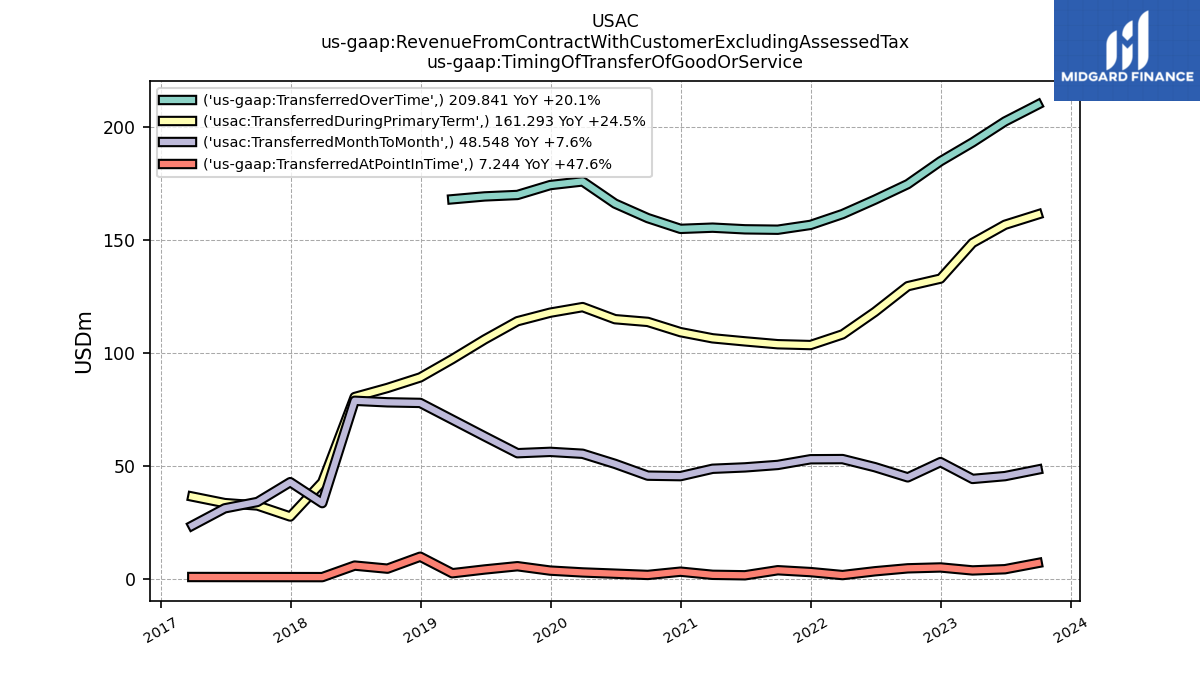
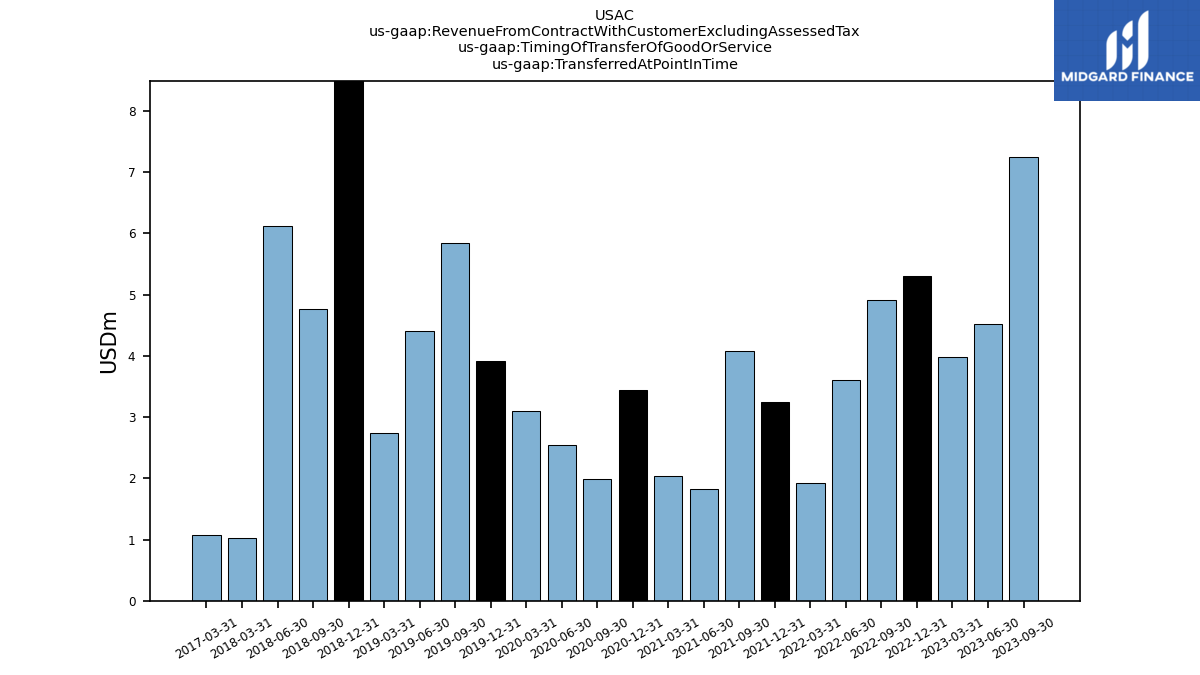
| Transferred At Point In Time | 7.24 | 4.52 | 3.98 | 5.30 | 4.91 | 3.61 | 1.93 | 3.25 | 4.07 | 1.83 | 2.04 | 3.44 | 1.98 | 2.55 | 3.10 | 3.91 | 5.84 | 4.40 | 2.74 | 10.05 | 4.76 | 6.12 | 1.02 | NA | NA | NA | 1.08 | NA | NA | NA | NA | NA | NA | NA | NA | NA | NA | NA | NA | NA | NA | NA | NA | NA | NA | NA | NA | |
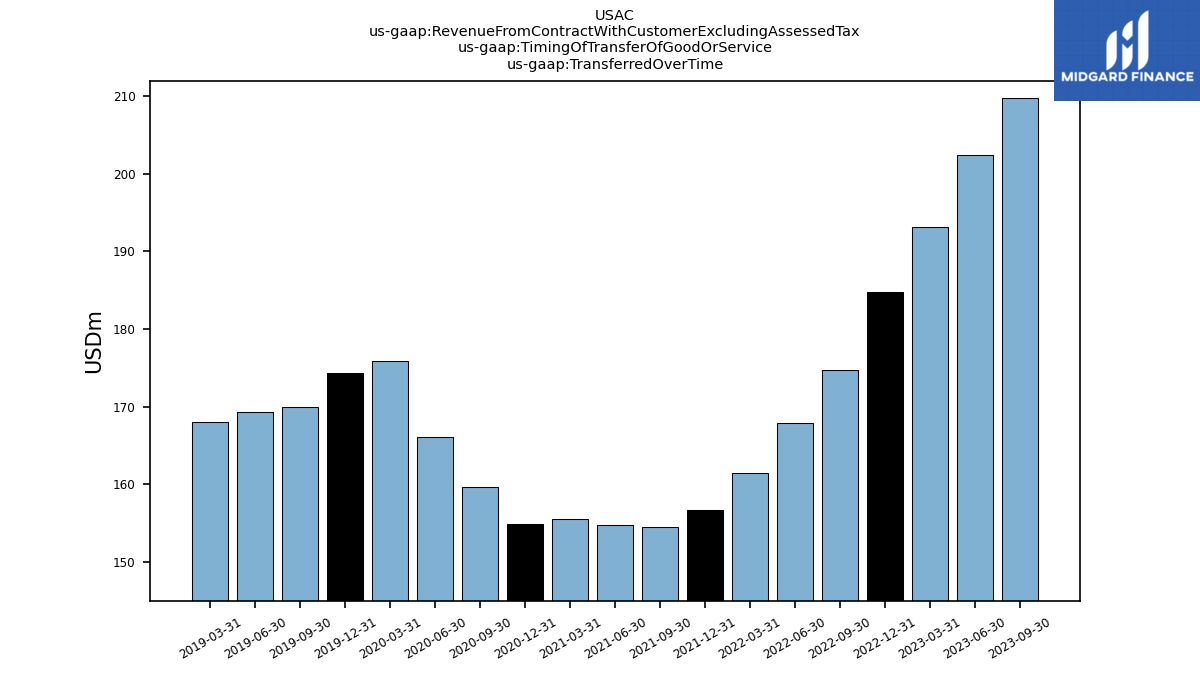
| Transferred Over Time | 209.84 | 202.40 | 193.14 | 184.81 | 174.70 | 167.85 | 161.49 | 156.69 | 154.55 | 154.73 | 155.47 | 154.93 | 159.68 | 166.10 | 175.90 | 174.28 | 169.91 | 169.27 | 168.01 | NA | NA | NA | NA | NA | NA | NA | NA | NA | NA | NA | NA | NA | NA | NA | NA | NA | NA | NA | NA | NA | NA | NA | NA | NA | NA | NA | NA | |
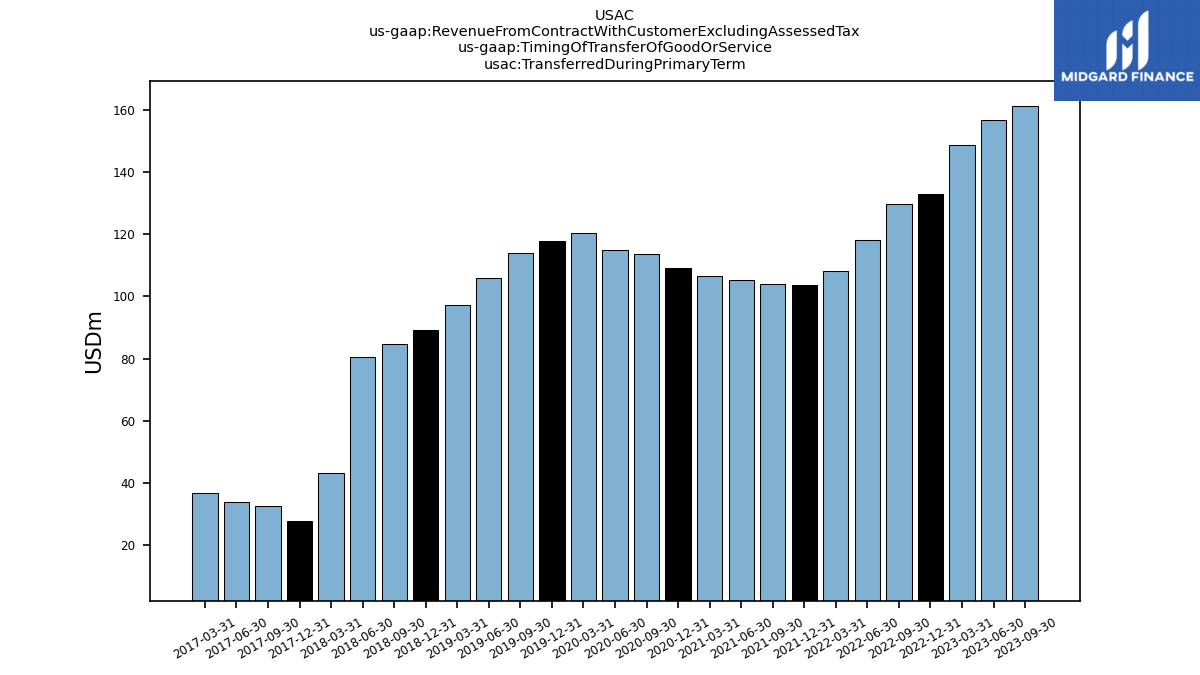
| Transferred During Primary Term | 161.29 | 156.74 | 148.73 | 132.95 | 129.60 | 118.25 | 108.30 | 103.58 | 103.95 | 105.21 | 106.56 | 109.28 | 113.82 | 115.02 | 120.36 | 117.90 | 114.12 | 106.07 | 97.36 | 89.27 | 84.62 | 80.61 | 43.00 | 27.80 | 32.67 | 33.74 | 36.63 | NA | NA | NA | NA | NA | NA | NA | NA | NA | NA | NA | NA | NA | NA | NA | NA | NA | NA | NA | NA | |
| Transferred Month To Month | 48.55 | 45.66 | 44.42 | 51.87 | 45.11 | 49.60 | 53.19 | 53.12 | 50.60 | 49.52 | 48.91 | 45.65 | 45.87 | 51.08 | 55.54 | 56.38 | 55.79 | 63.21 | 70.65 | 78.01 | 78.28 | 78.96 | 33.72 | 43.01 | 34.24 | 31.42 | 23.81 | NA | NA | NA | NA | NA | NA | NA | NA | NA | NA | NA | NA | NA | NA | NA | NA | NA | NA | NA | NA | |
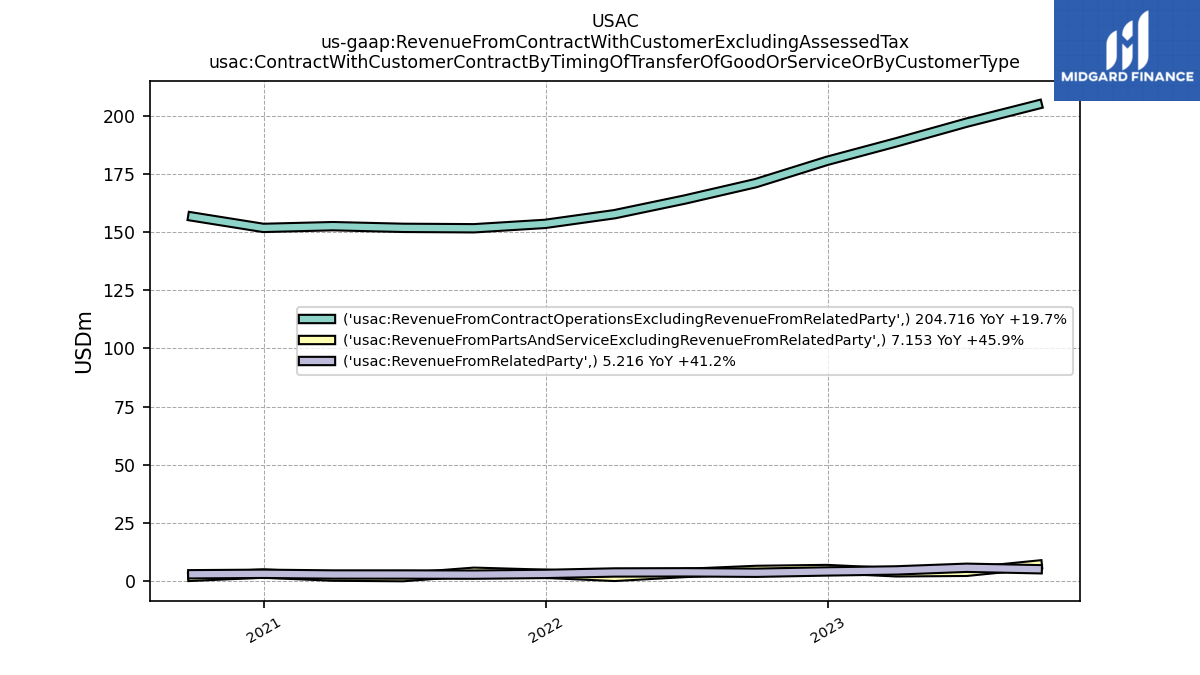
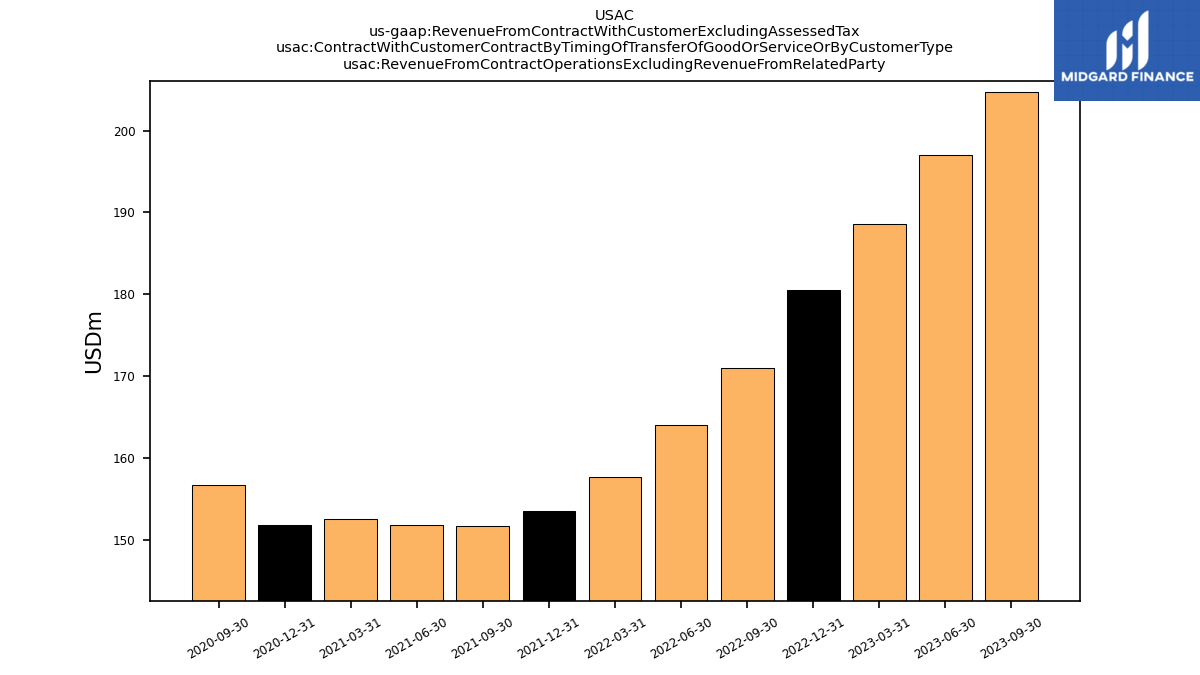
| Revenue From Contract Operations Excluding Revenue From Related Party | 204.72 | 196.98 | 188.54 | 180.56 | 171.02 | 163.97 | 157.67 | 153.50 | 151.62 | 151.80 | 152.53 | 151.78 | 156.63 | NA | NA | NA | NA | NA | NA | NA | NA | NA | NA | NA | NA | NA | NA | NA | NA | NA | NA | NA | NA | NA | NA | NA | NA | NA | NA | NA | NA | NA | NA | NA | NA | NA | NA | |
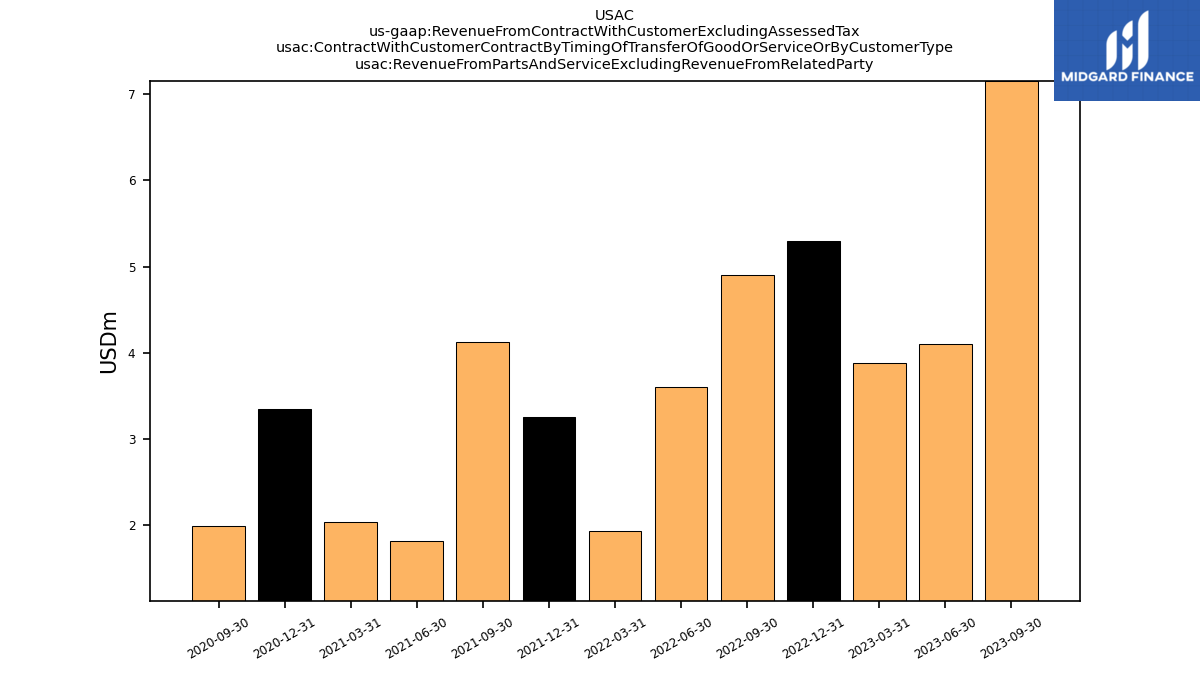
| Revenue From Parts And Service Excluding Revenue From Related Party | 7.15 | 4.10 | 3.88 | 5.30 | 4.90 | 3.60 | 1.93 | 3.25 | 4.12 | 1.82 | 2.04 | 3.35 | 1.99 | NA | NA | NA | NA | NA | NA | NA | NA | NA | NA | NA | NA | NA | NA | NA | NA | NA | NA | NA | NA | NA | NA | NA | NA | NA | NA | NA | NA | NA | NA | NA | NA | NA | NA | |
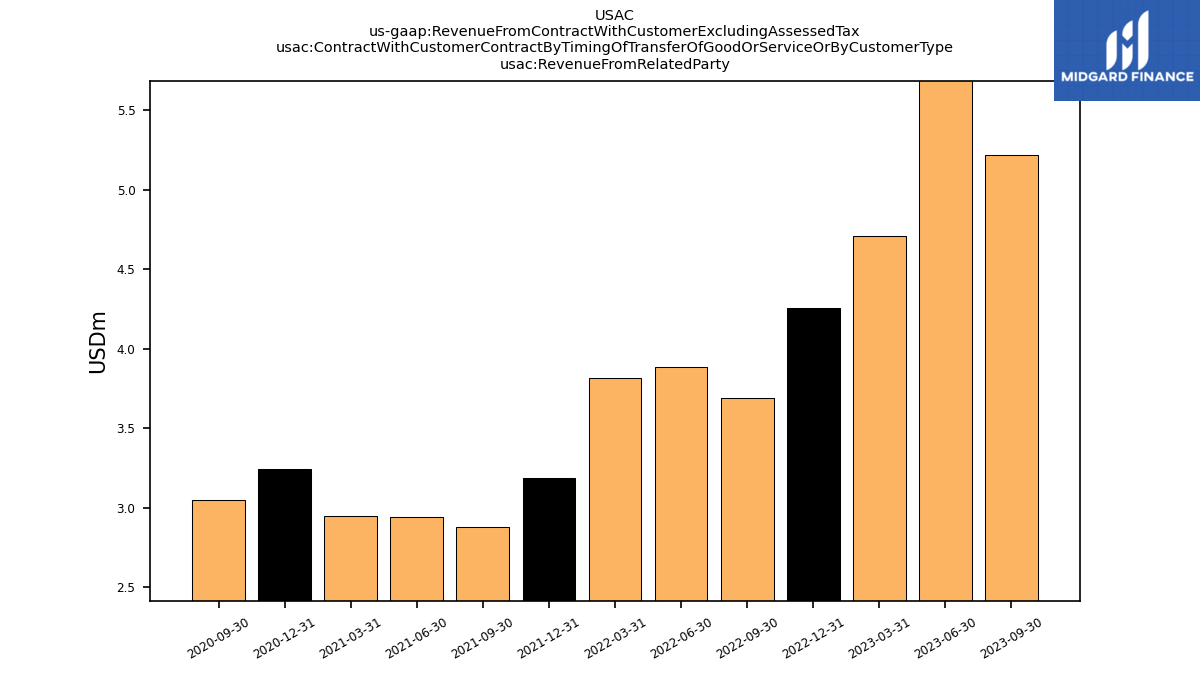
| Revenue From Related Party | 5.22 | 5.84 | 4.71 | 4.26 | 3.69 | 3.89 | 3.82 | 3.19 | 2.88 | 2.94 | 2.95 | 3.25 | 3.05 | NA | NA | NA | NA | NA | NA | NA | NA | NA | NA | NA | NA | NA | NA | NA | NA | NA | NA | NA | NA | NA | NA | NA | NA | NA | NA | NA | NA | NA | NA | NA | NA | NA | NA | |
| Revenue From Contract With Customer Including Assessed Tax | 217.09 | 206.92 | 197.12 | 190.11 | 179.61 | 171.46 | 163.41 | 159.94 | 158.63 | 156.56 | 157.51 | 158.37 | 161.67 | 168.65 | 172.79 | 178.19 | 166.20 | 162.94 | 163.98 | 171.98 | 158.66 | 155.26 | 69.81 | 72.94 | 62.65 | 67.37 | 65.27 | 74.91 | 61.13 | 63.51 | 66.37 | 68.61 | 70.54 | 66.39 | 65.00 | 60.99 | 57.05 | 53.27 | 50.20 | 48.64 | 38.36 | 33.31 | 32.60 | 31.77 | 31.02 | 28.87 | 27.12 |


