
| 2023-09-30 | 2023-06-30 | 2023-03-31 | 2022-12-31 | 2022-09-30 | 2022-06-30 | 2022-03-31 | 2021-12-31 | 2021-09-30 | 2021-06-30 | 2021-03-31 | 2020-12-31 | 2020-09-30 | 2020-06-30 | 2020-03-31 | 2019-12-31 | 2019-09-30 | 2019-06-30 | 2019-03-31 | 2018-12-31 | 2018-09-30 | 2018-06-30 | 2018-03-31 | 2017-12-31 | 2017-09-30 | 2017-06-30 | 2017-03-31 | 2016-12-31 | 2016-09-30 | 2016-06-30 | 2016-03-31 | 2015-12-31 | 2015-09-30 | 2015-06-30 | 2015-03-31 | ||
|---|---|---|---|---|---|---|---|---|---|---|---|---|---|---|---|---|---|---|---|---|---|---|---|---|---|---|---|---|---|---|---|---|---|---|---|---|
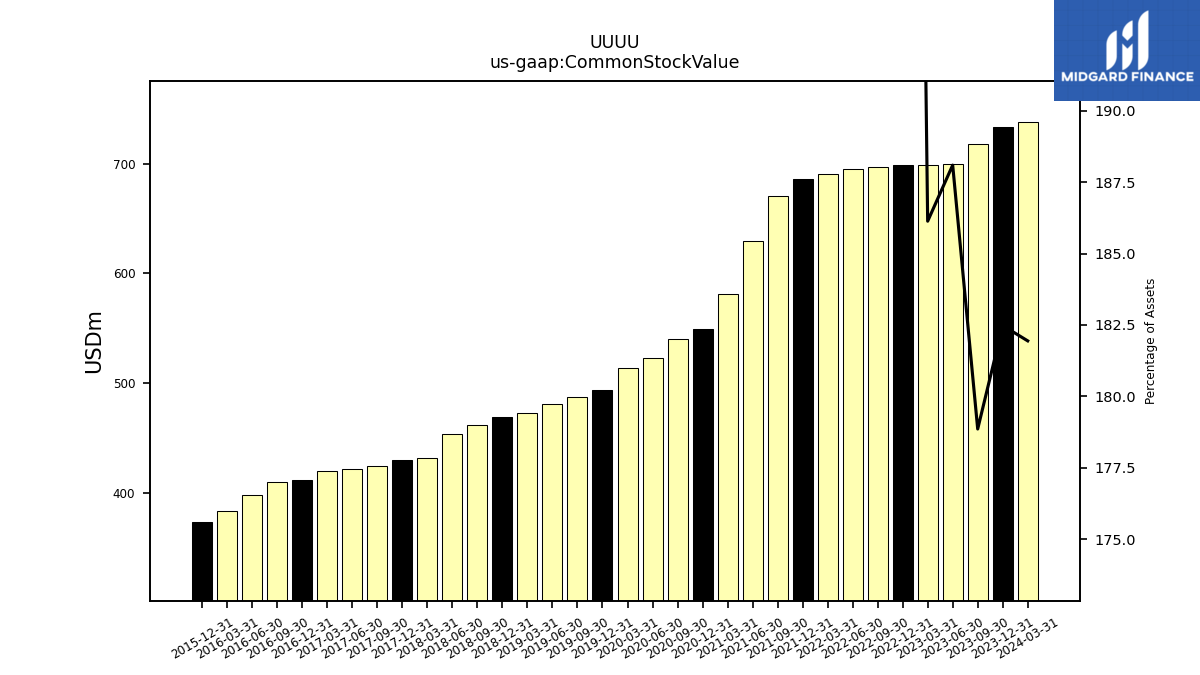
| Common Stock Value | 717.56 | 699.85 | 698.83 | 698.49 | 696.81 | 695.40 | 690.42 | 685.90 | 670.86 | 629.62 | 581.13 | 549.32 | 540.69 | 523.20 | 513.69 | 493.96 | 487.67 | 481.05 | 472.99 | 469.30 | 462.32 | 453.56 | 431.82 | 430.38 | 425.12 | 421.95 | 420.56 | 412.33 | 410.24 | 398.56 | 384.05 | 373.93 | NA | NA | NA | |
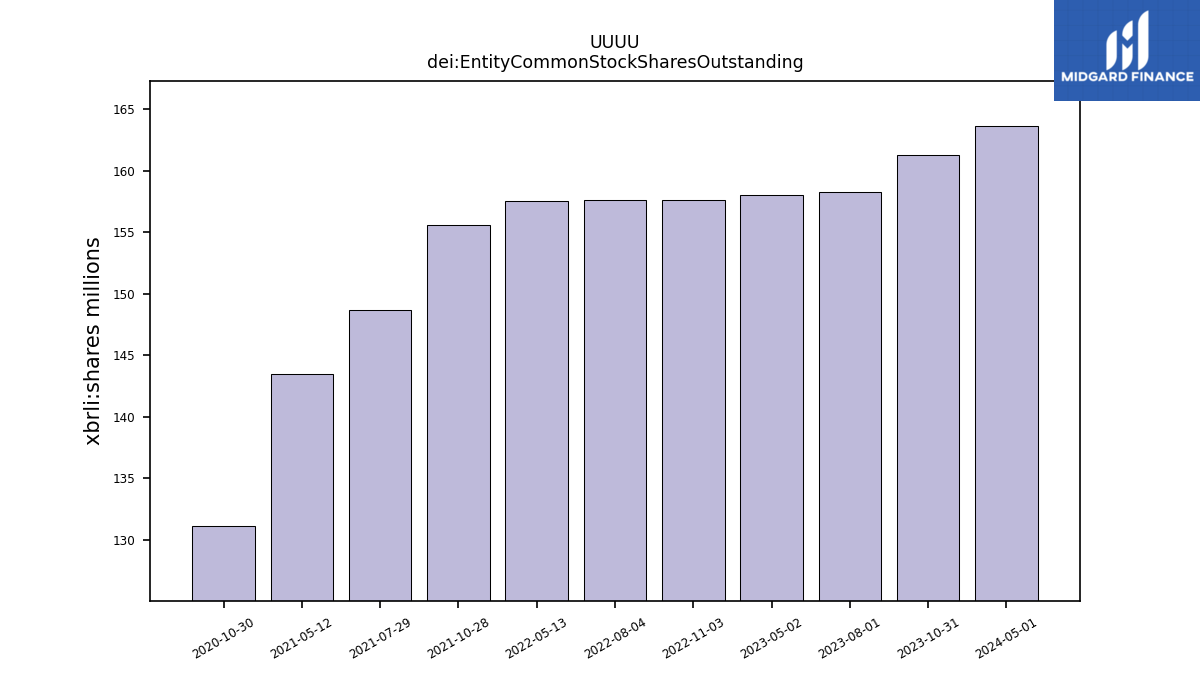
| dei: Entity Common Stock Shares Outstanding | NA | NA | NA | NA | NA | NA | NA | NA | NA | NA | NA | NA | NA | NA | NA | NA | NA | NA | NA | NA | NA | NA | NA | NA | NA | NA | NA | NA | NA | NA | NA | NA | NA | NA | NA | |
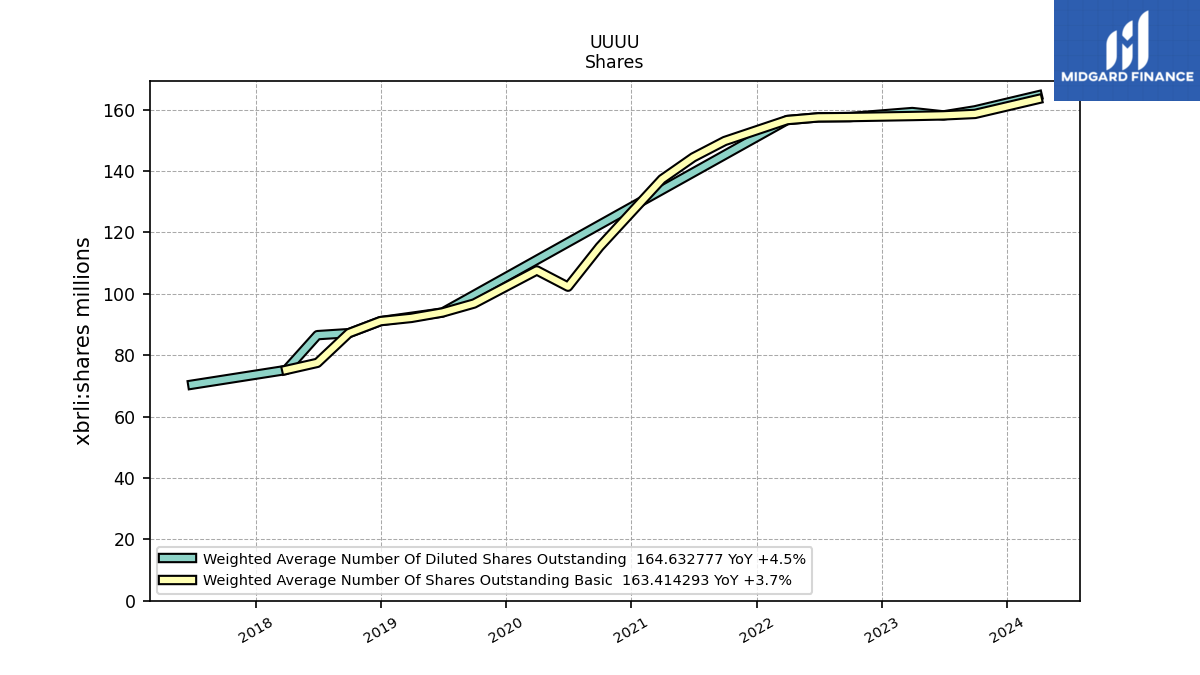
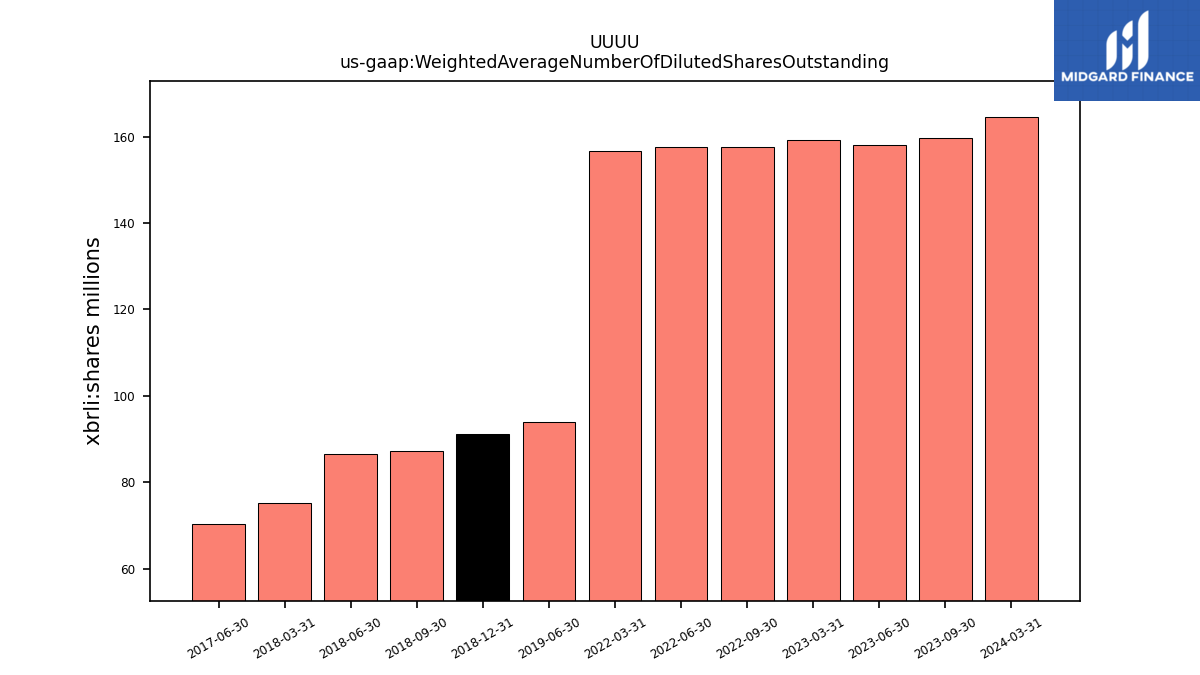
| Weighted Average Number Of Diluted Shares Outstanding | 159.78 | 158.14 | 159.23 | NA | 157.59 | 157.49 | 156.61 | NA | NA | NA | NA | NA | NA | NA | NA | NA | NA | 93.92 | NA | 91.11 | 87.20 | 86.53 | 75.21 | NA | NA | 70.42 | NA | NA | NA | NA | NA | NA | NA | NA | NA | |
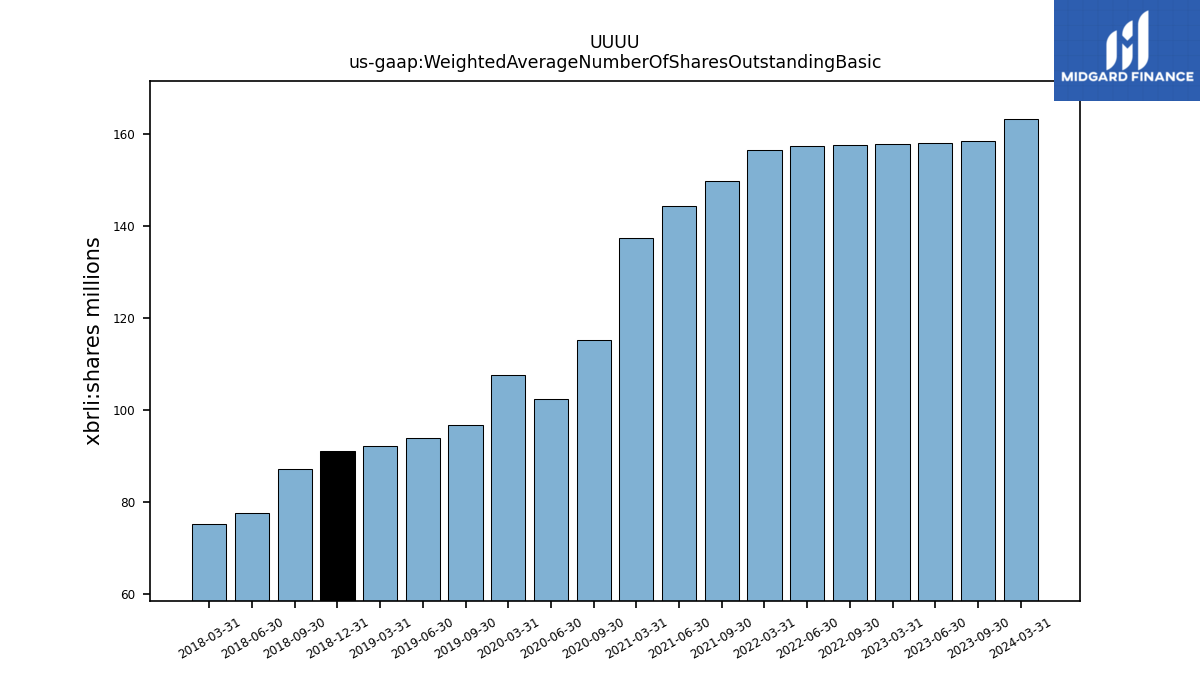
| Weighted Average Number Of Shares Outstanding Basic | 158.62 | 158.14 | 157.93 | NA | 157.59 | 157.49 | 156.61 | NA | 149.79 | 144.45 | 137.36 | NA | 115.30 | 102.32 | 107.62 | NA | 96.84 | 93.92 | 92.15 | 91.11 | 87.20 | 77.51 | 75.21 | NA | NA | NA | NA | NA | NA | NA | NA | NA | NA | NA | NA | |
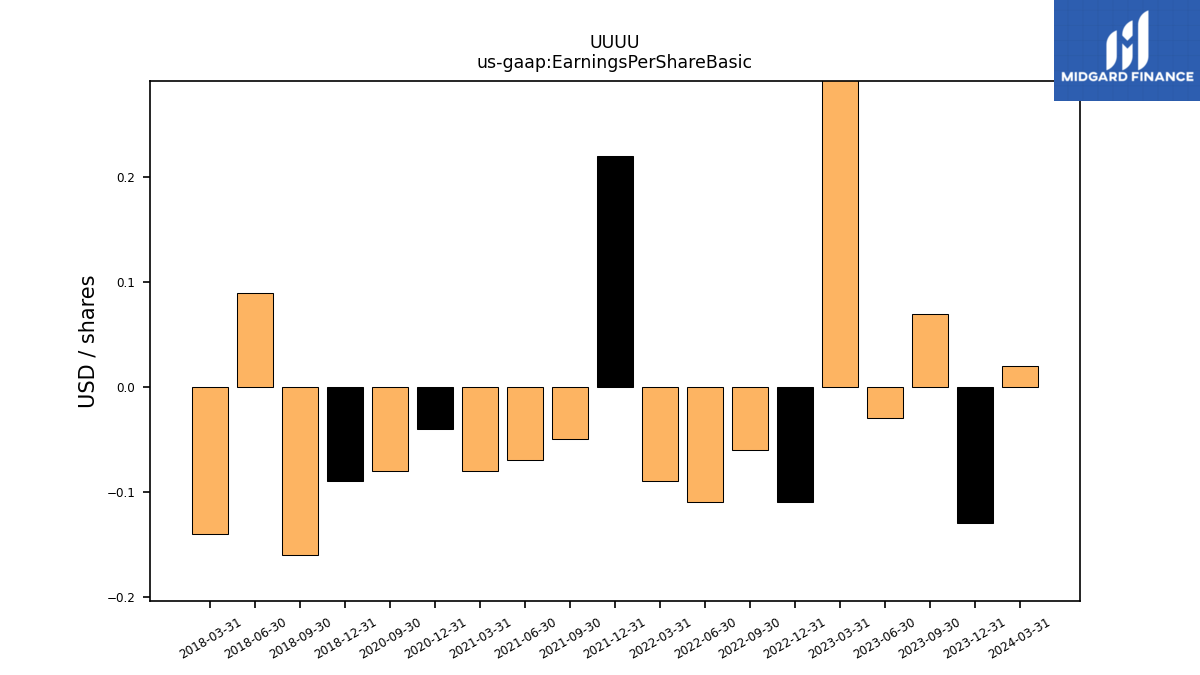
| Earnings Per Share Basic | 0.07 | -0.03 | 0.72 | -0.11 | -0.06 | -0.11 | -0.09 | 0.22 | -0.05 | -0.07 | -0.08 | -0.04 | -0.08 | NA | NA | NA | NA | NA | NA | -0.09 | -0.16 | 0.09 | -0.14 | NA | NA | NA | NA | NA | NA | NA | NA | NA | NA | NA | NA | |
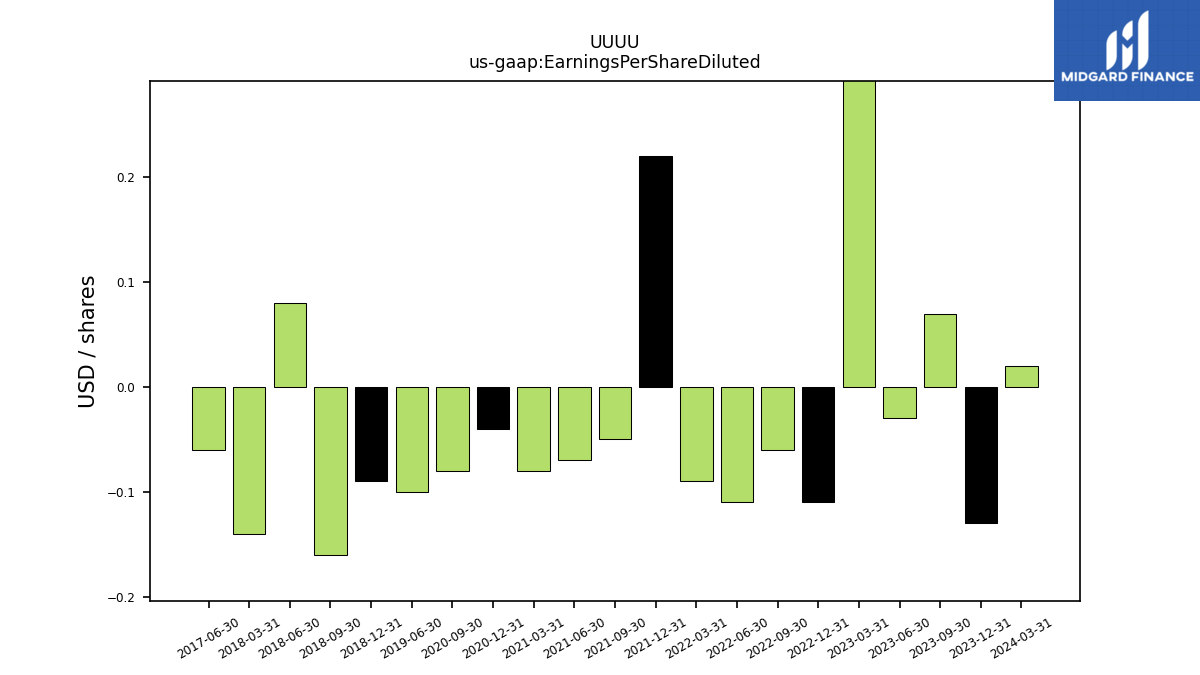
| Earnings Per Share Diluted | 0.07 | -0.03 | 0.72 | -0.11 | -0.06 | -0.11 | -0.09 | 0.22 | -0.05 | -0.07 | -0.08 | -0.04 | -0.08 | NA | NA | NA | NA | -0.10 | NA | -0.09 | -0.16 | 0.08 | -0.14 | NA | NA | -0.06 | NA | NA | NA | NA | NA | NA | NA | NA | NA | |
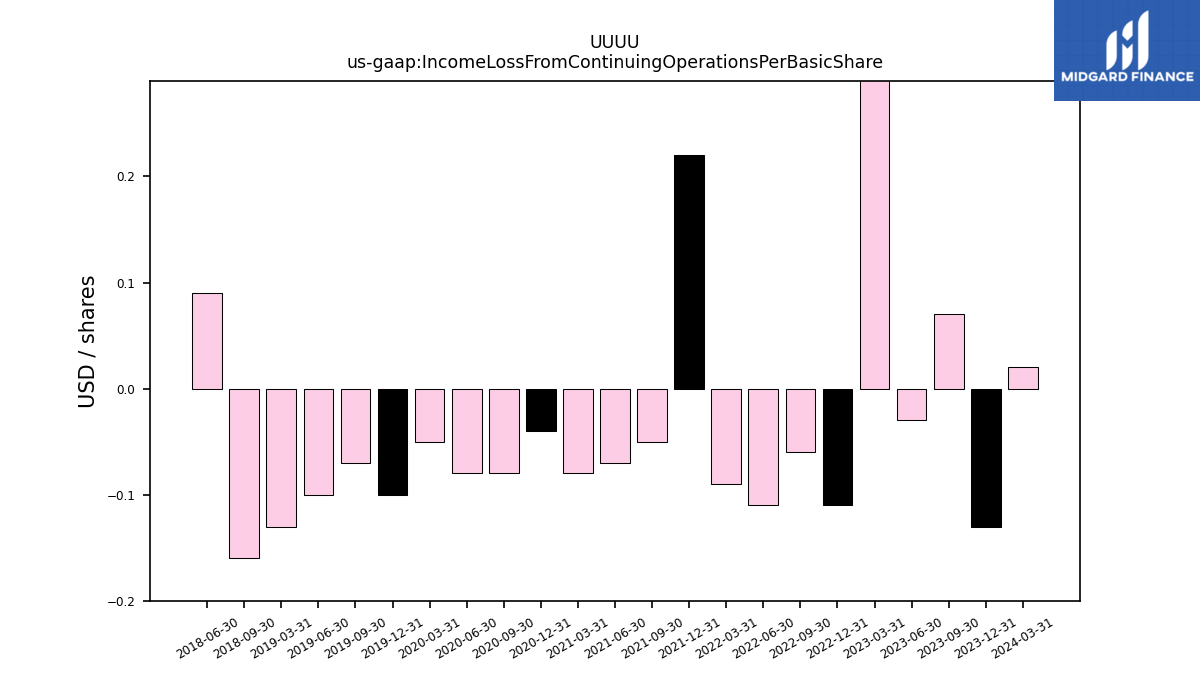
| Income Loss From Continuing Operations Per Basic Share | 0.00 | -0.00 | 0.00 | -0.00 | -0.00 | -0.00 | -0.00 | 0.00 | -0.00 | -0.00 | -0.00 | -0.00 | -0.00 | -0.00 | -0.00 | -0.00 | -0.00 | -0.00 | -0.00 | NA | -0.00 | 0.00 | NA | NA | NA | NA | NA | NA | NA | NA | NA | NA | NA | NA | NA | |
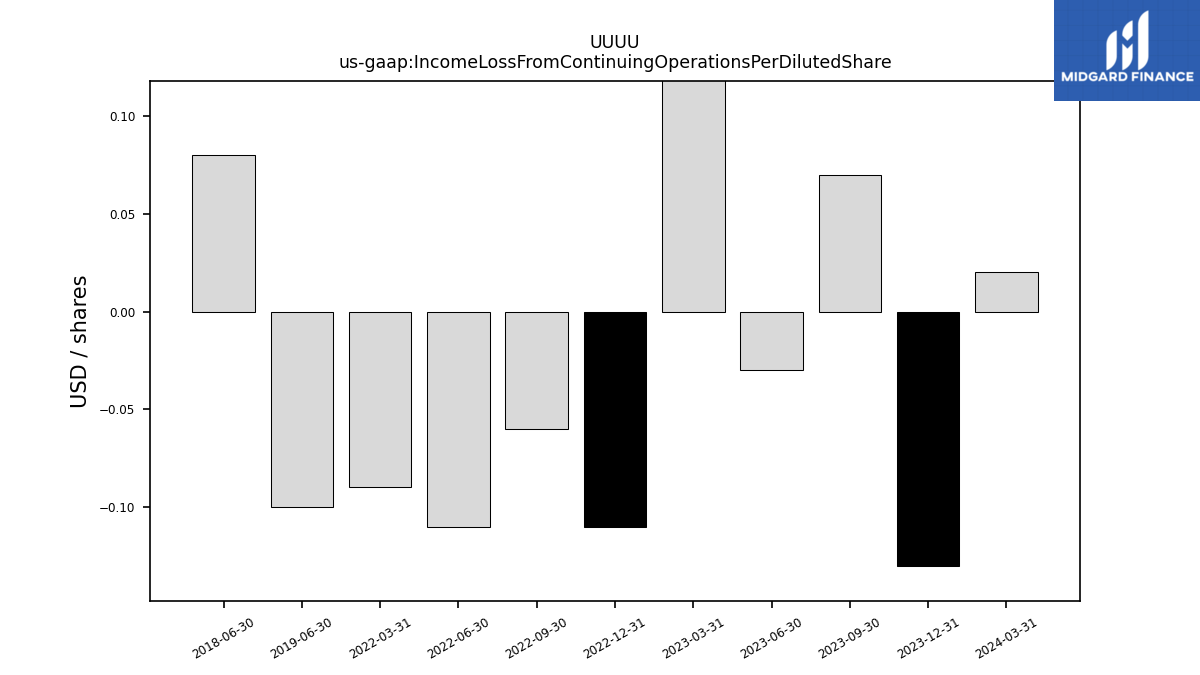
| Income Loss From Continuing Operations Per Diluted Share | 0.00 | -0.00 | 0.00 | -0.00 | -0.00 | -0.00 | -0.00 | NA | NA | NA | NA | NA | NA | NA | NA | NA | NA | -0.00 | NA | NA | NA | 0.00 | NA | NA | NA | NA | NA | NA | NA | NA | NA | NA | NA | NA | NA |
| 2023-09-30 | 2023-06-30 | 2023-03-31 | 2022-12-31 | 2022-09-30 | 2022-06-30 | 2022-03-31 | 2021-12-31 | 2021-09-30 | 2021-06-30 | 2021-03-31 | 2020-12-31 | 2020-09-30 | 2020-06-30 | 2020-03-31 | 2019-12-31 | 2019-09-30 | 2019-06-30 | 2019-03-31 | 2018-12-31 | 2018-09-30 | 2018-06-30 | 2018-03-31 | 2017-12-31 | 2017-09-30 | 2017-06-30 | 2017-03-31 | 2016-12-31 | 2016-09-30 | 2016-06-30 | 2016-03-31 | 2015-12-31 | 2015-09-30 | 2015-06-30 | 2015-03-31 | ||
|---|---|---|---|---|---|---|---|---|---|---|---|---|---|---|---|---|---|---|---|---|---|---|---|---|---|---|---|---|---|---|---|---|---|---|---|---|
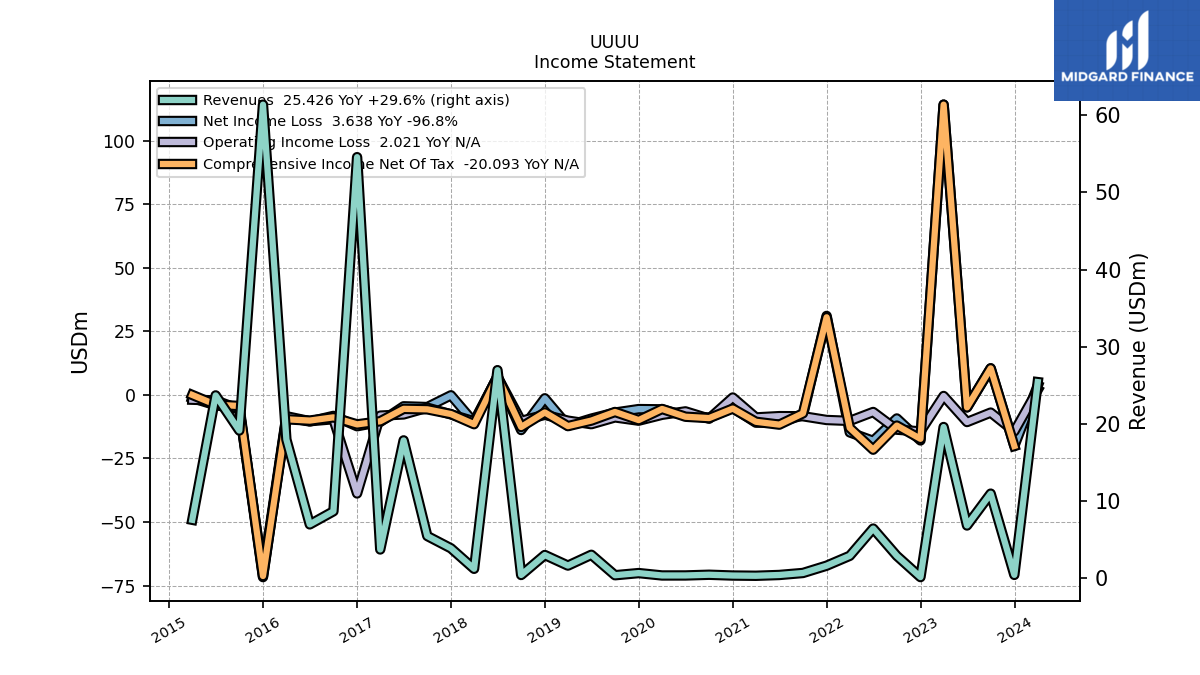
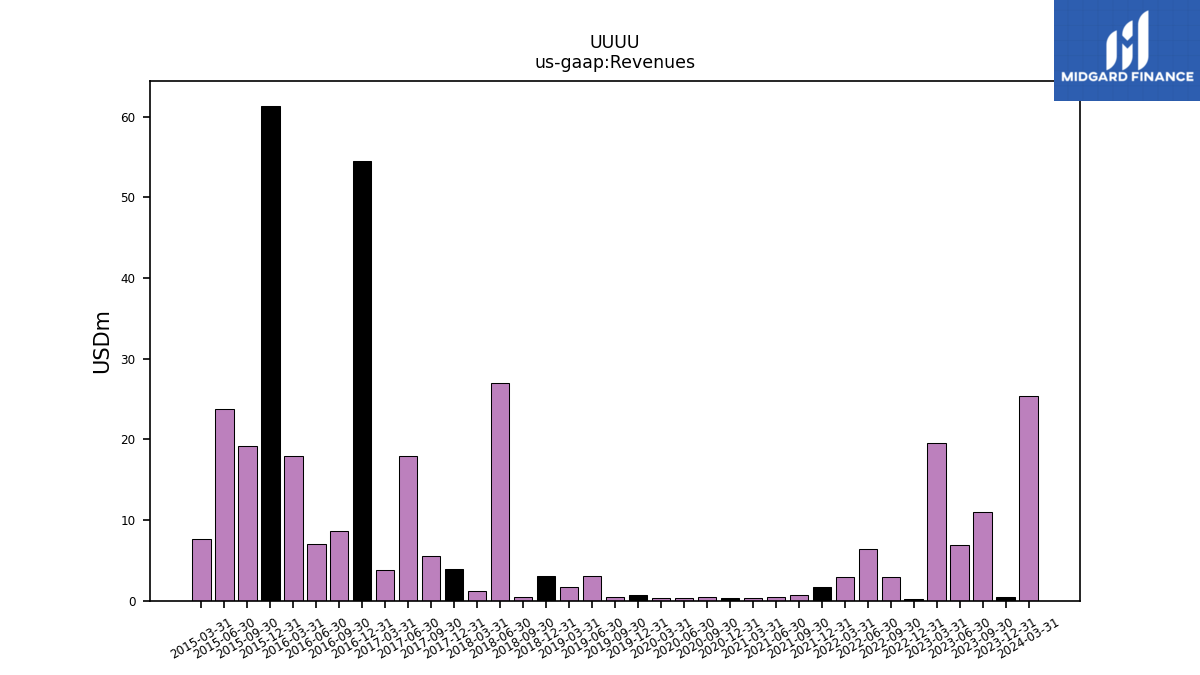
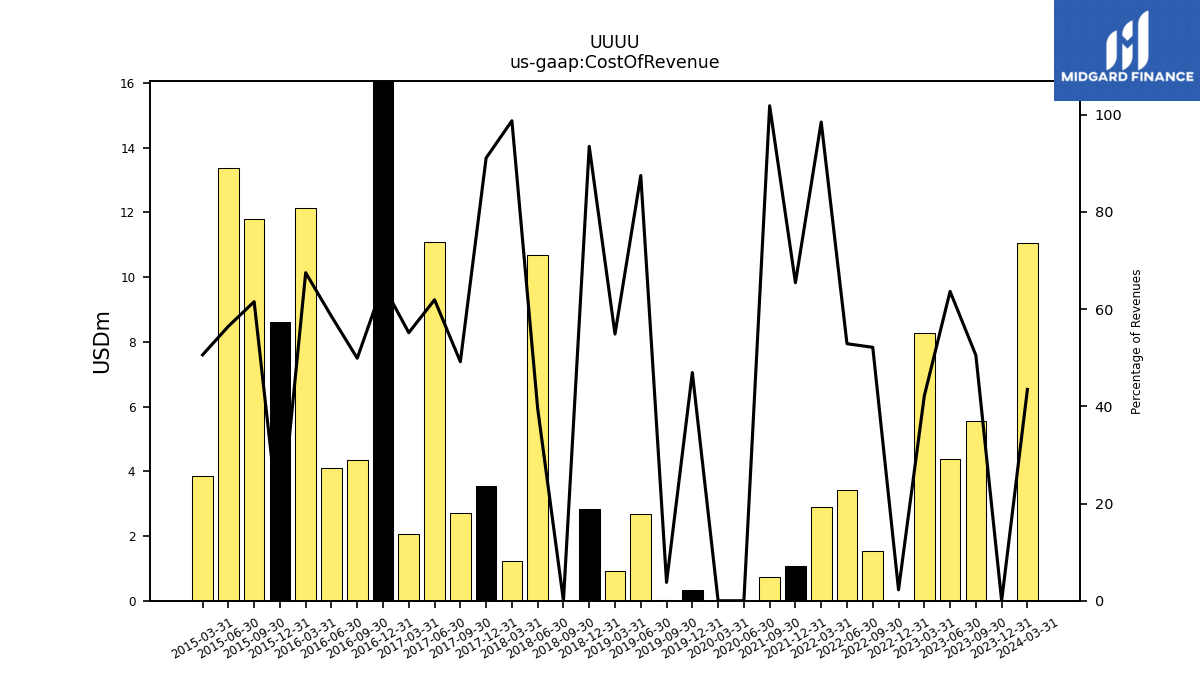
| Revenues | 10.99 | 6.86 | 19.61 | 0.18 | 2.93 | 6.47 | 2.94 | 1.66 | 0.71 | 0.46 | 0.35 | 0.38 | 0.49 | 0.40 | 0.39 | 0.70 | 0.42 | 3.07 | 1.67 | 3.04 | 0.45 | 26.97 | 1.25 | 3.91 | 5.50 | 17.88 | 3.76 | 54.55 | 8.70 | 7.01 | 18.00 | 61.35 | 19.16 | 23.70 | 7.60 | |
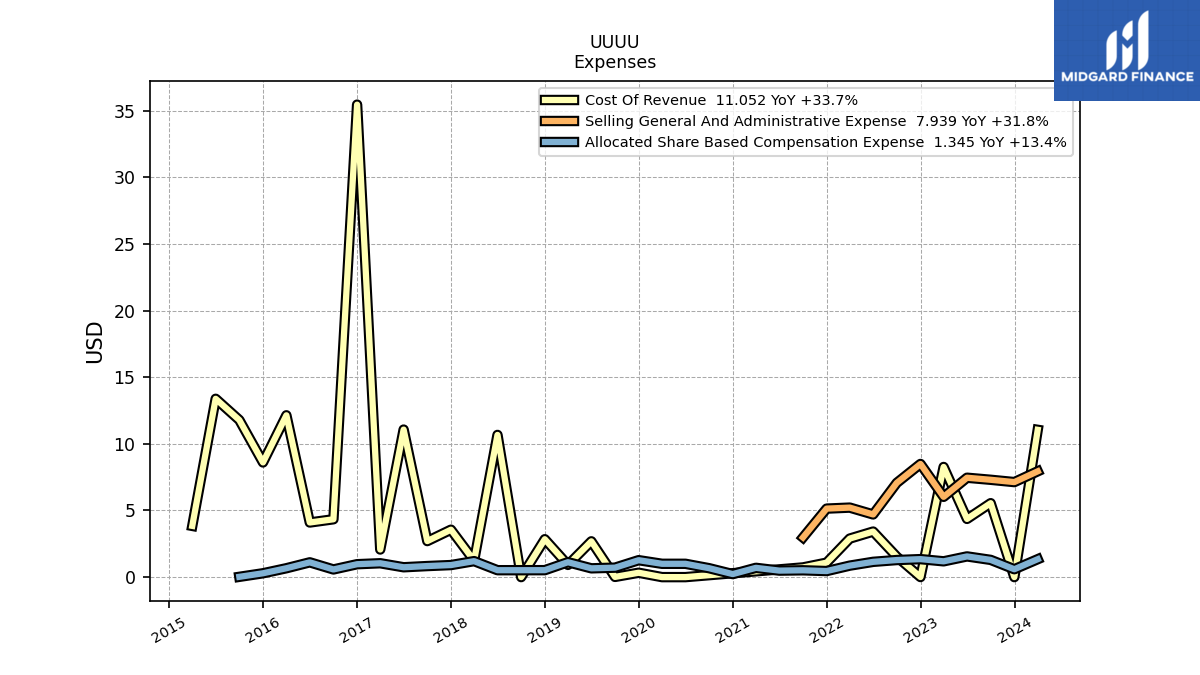
| Cost Of Revenue | 5.55 | 4.37 | 8.27 | 0.00 | 1.53 | 3.42 | 2.89 | 1.09 | 0.73 | NA | NA | NA | NA | 0.00 | 0.00 | 0.33 | 0.02 | 2.69 | 0.92 | 2.84 | 0.00 | 10.67 | 1.24 | 3.56 | 2.70 | 11.07 | 2.07 | 35.45 | 4.34 | 4.10 | 12.14 | 8.61 | 11.79 | 13.38 | 3.84 | |
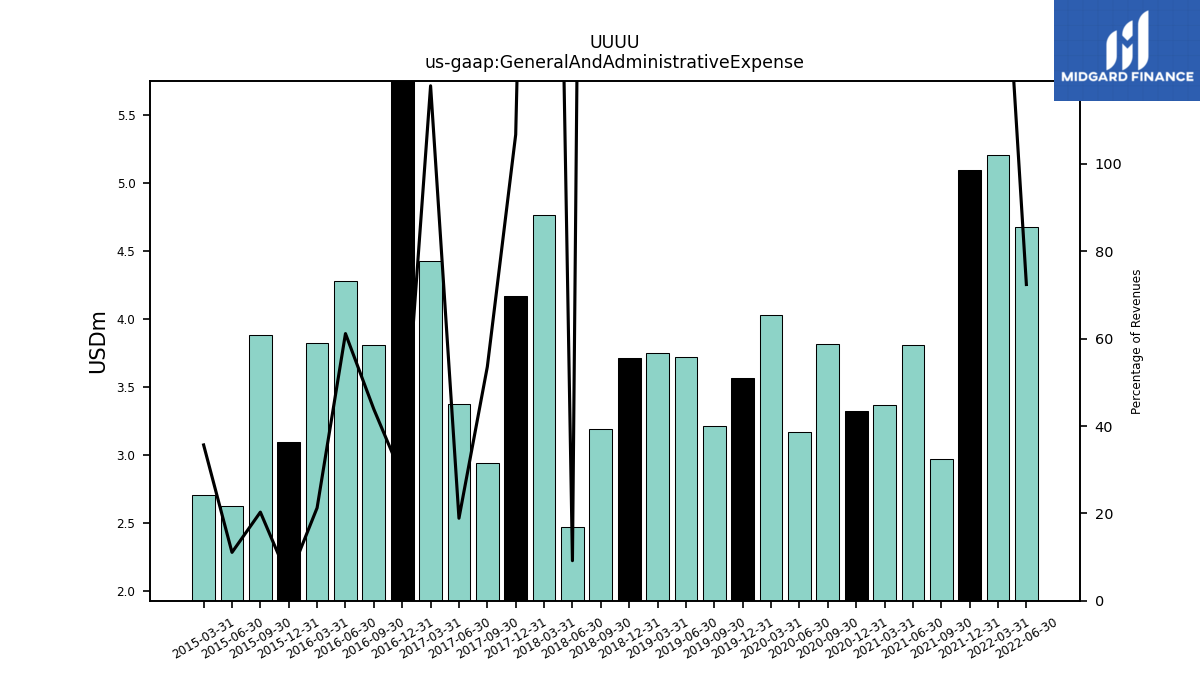
| General And Administrative Expense | NA | NA | NA | NA | NA | 4.68 | 5.21 | 5.10 | 2.97 | 3.81 | 3.37 | 3.32 | 3.82 | 3.17 | 4.03 | 3.57 | 3.22 | 3.73 | 3.75 | 3.72 | 3.19 | 2.48 | 4.77 | 4.17 | 2.95 | 3.38 | 4.43 | 15.52 | 3.81 | 4.29 | 3.83 | 3.10 | 3.89 | 2.62 | 2.71 | |
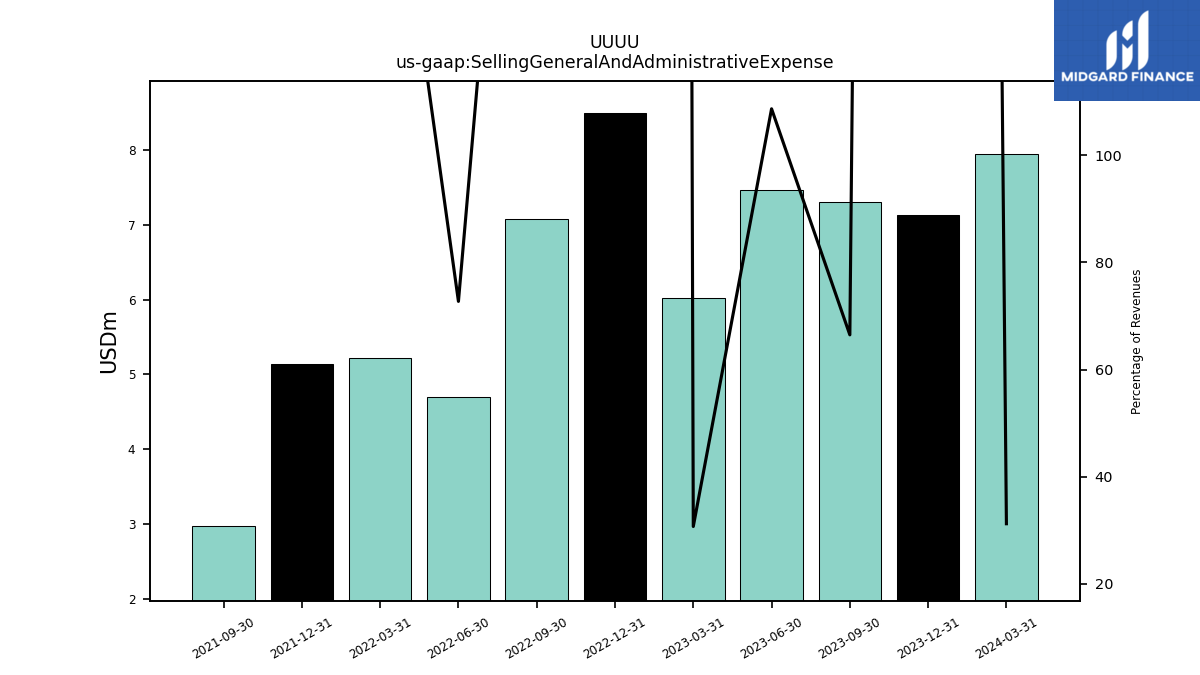
| Selling General And Administrative Expense | 7.30 | 7.46 | 6.02 | 8.49 | 7.08 | 4.70 | 5.22 | 5.14 | 2.97 | NA | NA | NA | NA | NA | NA | NA | NA | NA | NA | NA | NA | NA | NA | NA | NA | NA | NA | NA | NA | NA | NA | NA | NA | NA | NA | |
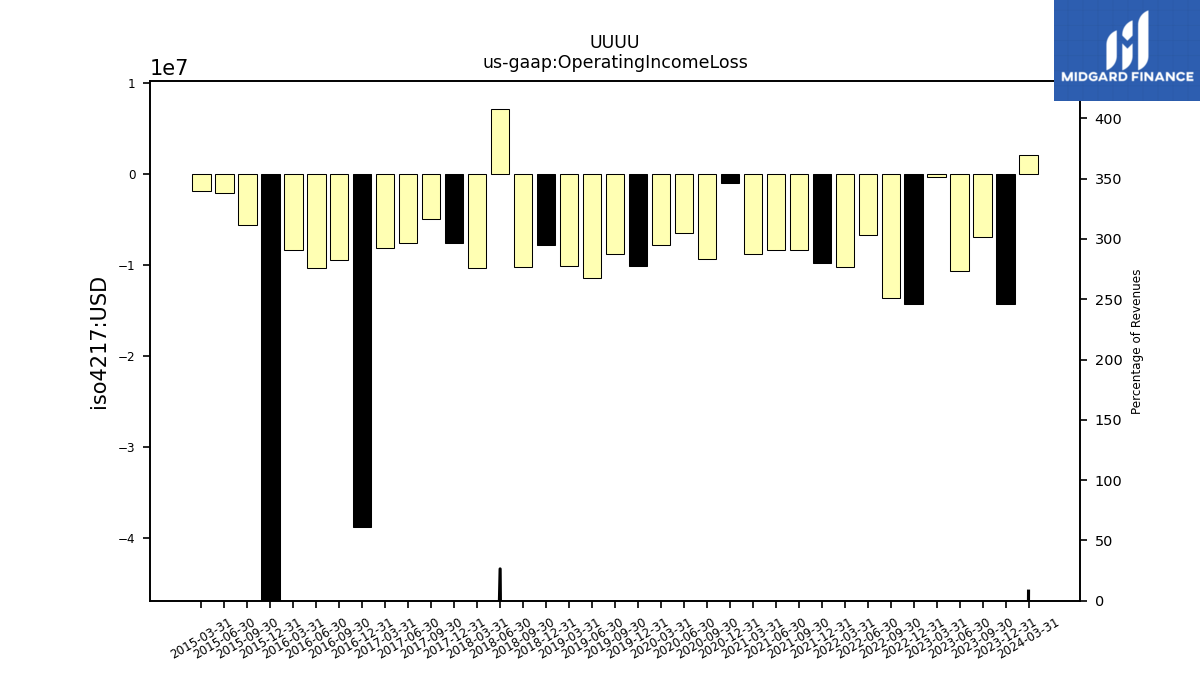
| Operating Income Loss | -6.94 | -10.66 | -0.41 | -14.35 | -13.66 | -6.71 | -10.21 | -9.86 | -8.38 | -8.34 | -8.85 | -1.00 | -9.35 | -6.47 | -7.81 | -10.12 | -8.83 | -11.50 | -10.12 | -7.82 | -10.21 | 7.12 | -10.40 | -7.65 | -5.01 | -7.66 | -8.14 | -38.77 | -9.54 | -10.33 | -8.38 | -70.26 | -5.61 | -2.16 | -1.88 | |
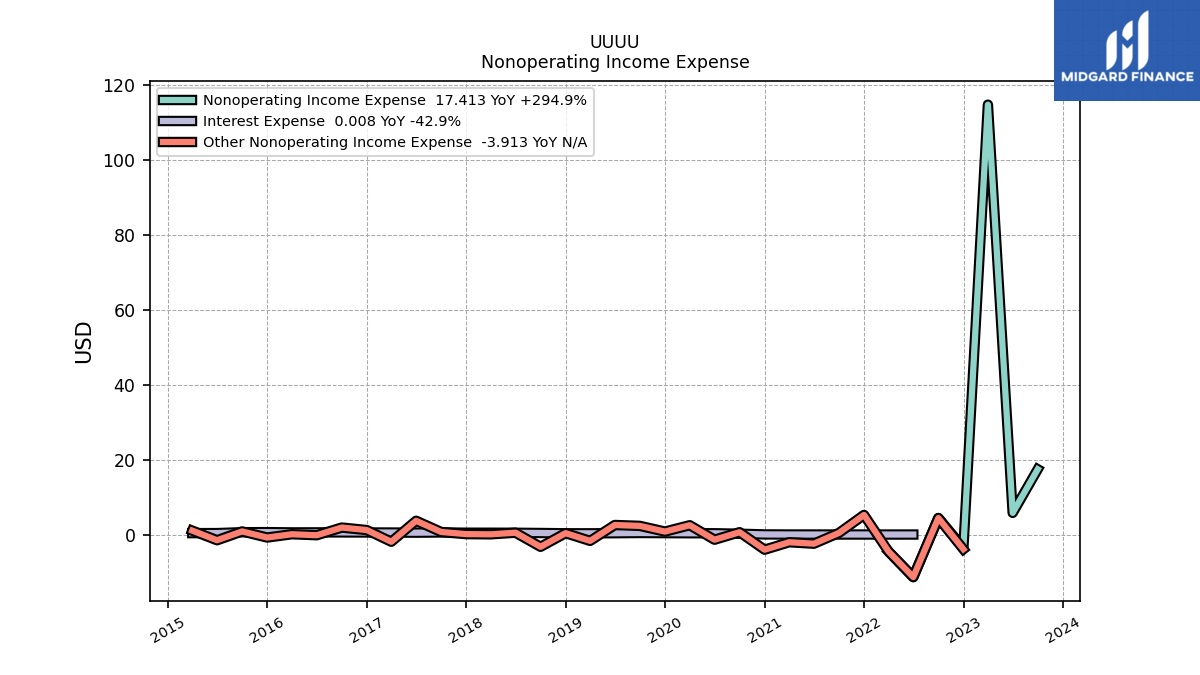
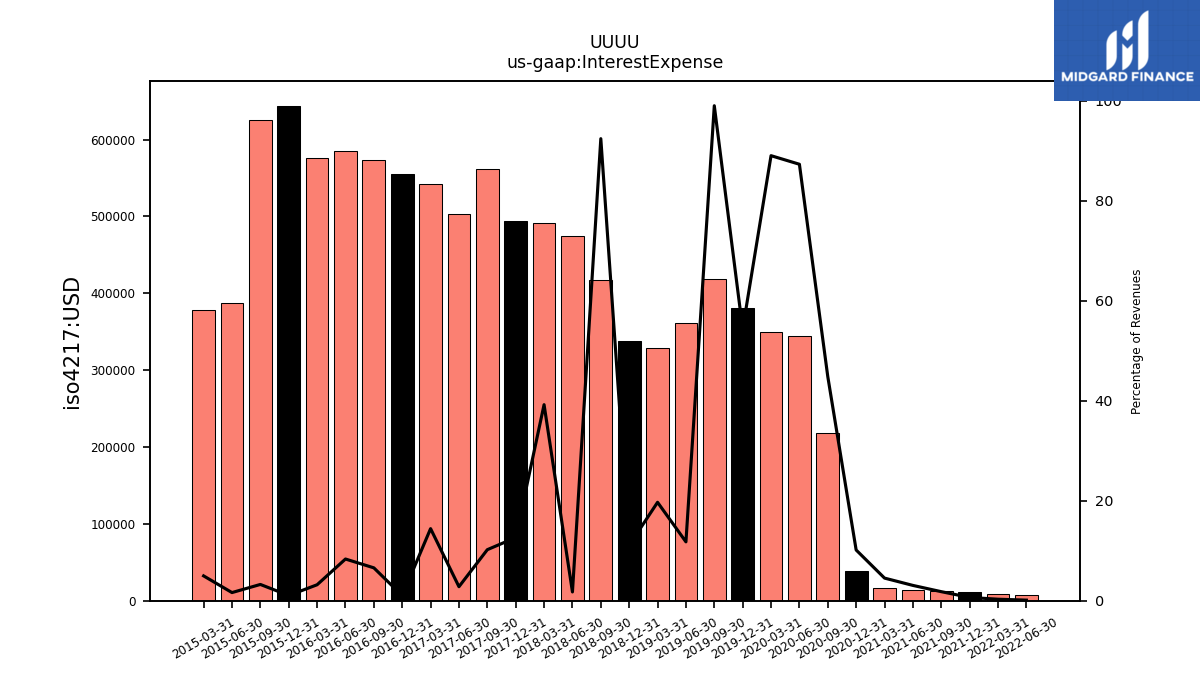
| Interest Expense | NA | NA | NA | NA | NA | 0.01 | 0.01 | 0.01 | 0.01 | 0.01 | 0.02 | 0.04 | 0.22 | 0.34 | 0.35 | 0.38 | 0.42 | 0.36 | 0.33 | 0.34 | 0.42 | 0.47 | 0.49 | 0.49 | 0.56 | 0.50 | 0.54 | 0.56 | 0.57 | 0.58 | 0.58 | 0.64 | 0.62 | 0.39 | 0.38 | |
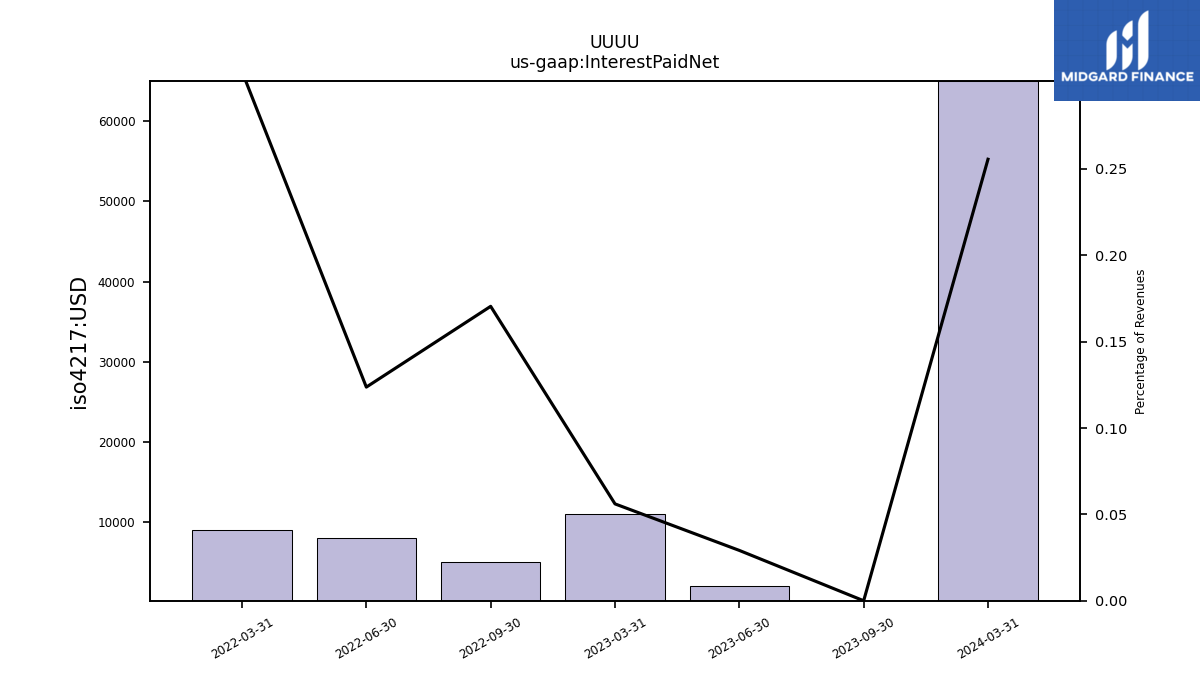
| Interest Paid Net | 0.00 | 0.00 | 0.01 | NA | 0.01 | 0.01 | 0.01 | NA | NA | NA | NA | NA | NA | NA | NA | NA | NA | NA | NA | NA | NA | NA | NA | NA | NA | NA | NA | NA | NA | NA | NA | NA | NA | NA | NA | |
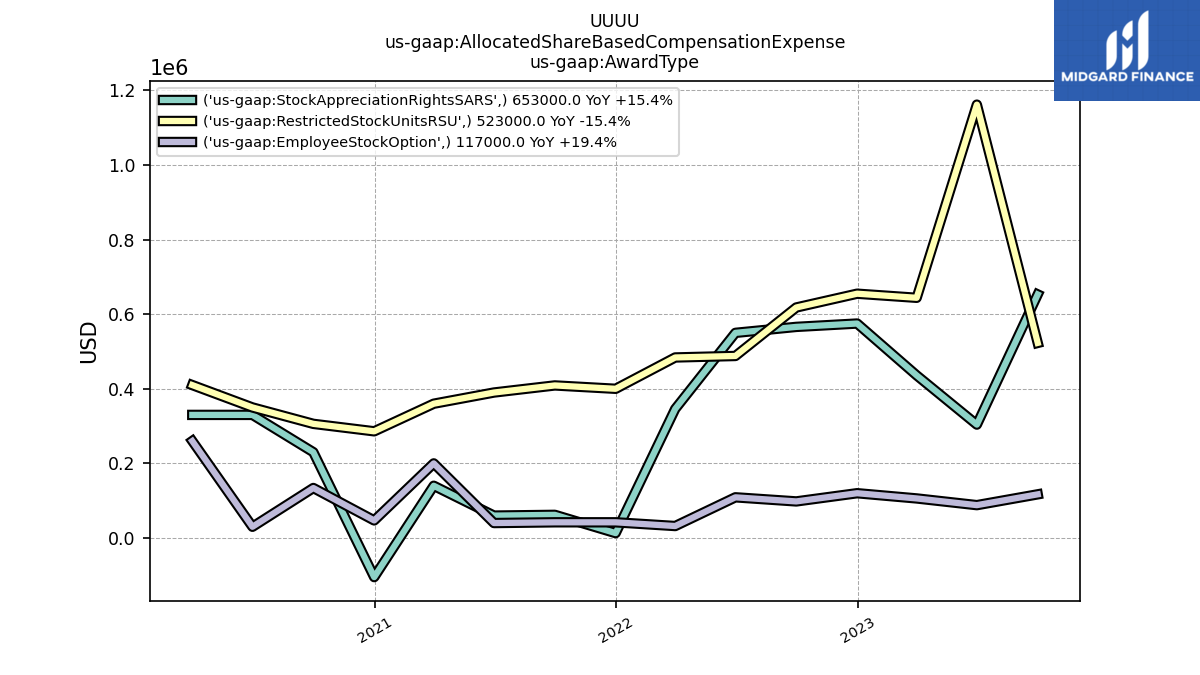
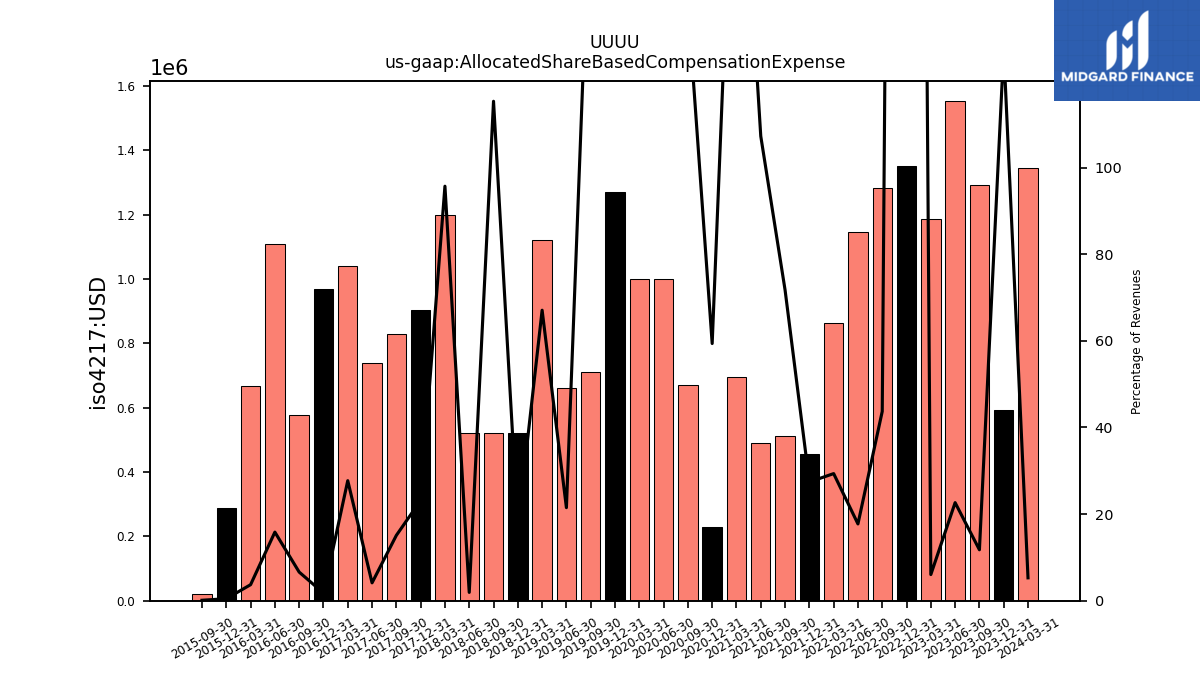
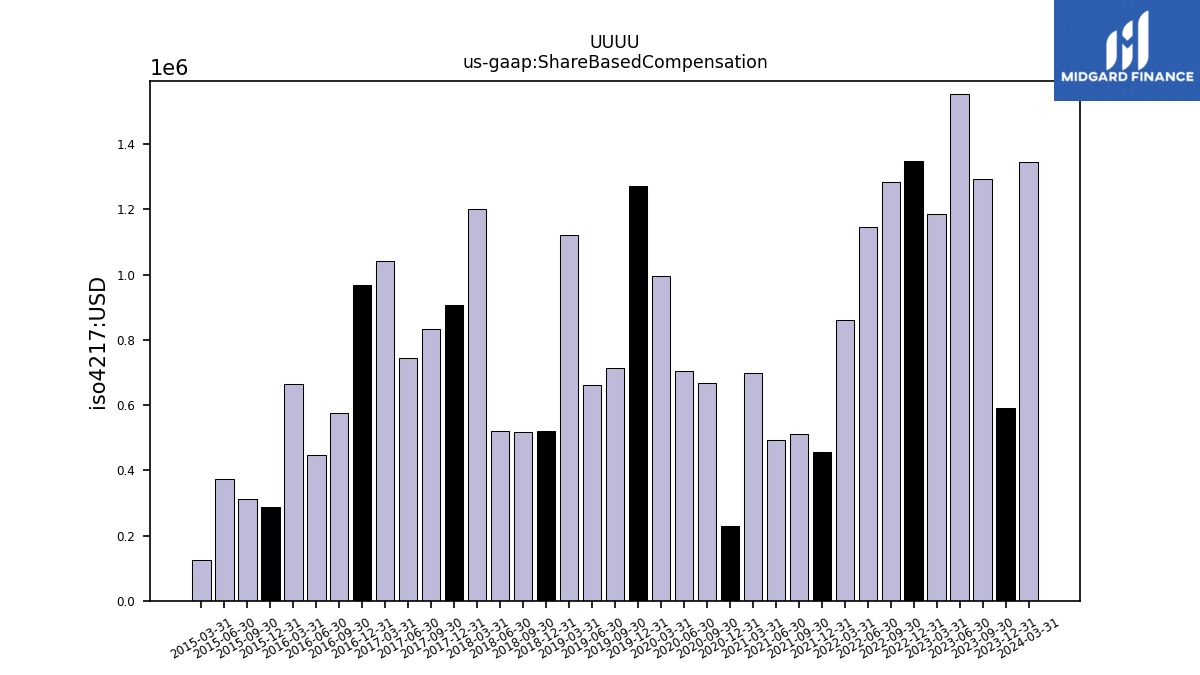
| Allocated Share Based Compensation Expense | 1.29 | 1.55 | 1.19 | 1.35 | 1.28 | 1.15 | 0.86 | 0.46 | 0.51 | 0.49 | 0.70 | 0.23 | 0.67 | 1.00 | 1.00 | 1.27 | 0.71 | 0.66 | 1.12 | 0.52 | 0.52 | 0.52 | 1.20 | 0.91 | 0.83 | 0.74 | 1.04 | 0.97 | 0.58 | 1.11 | 0.67 | 0.29 | 0.02 | NA | NA | |
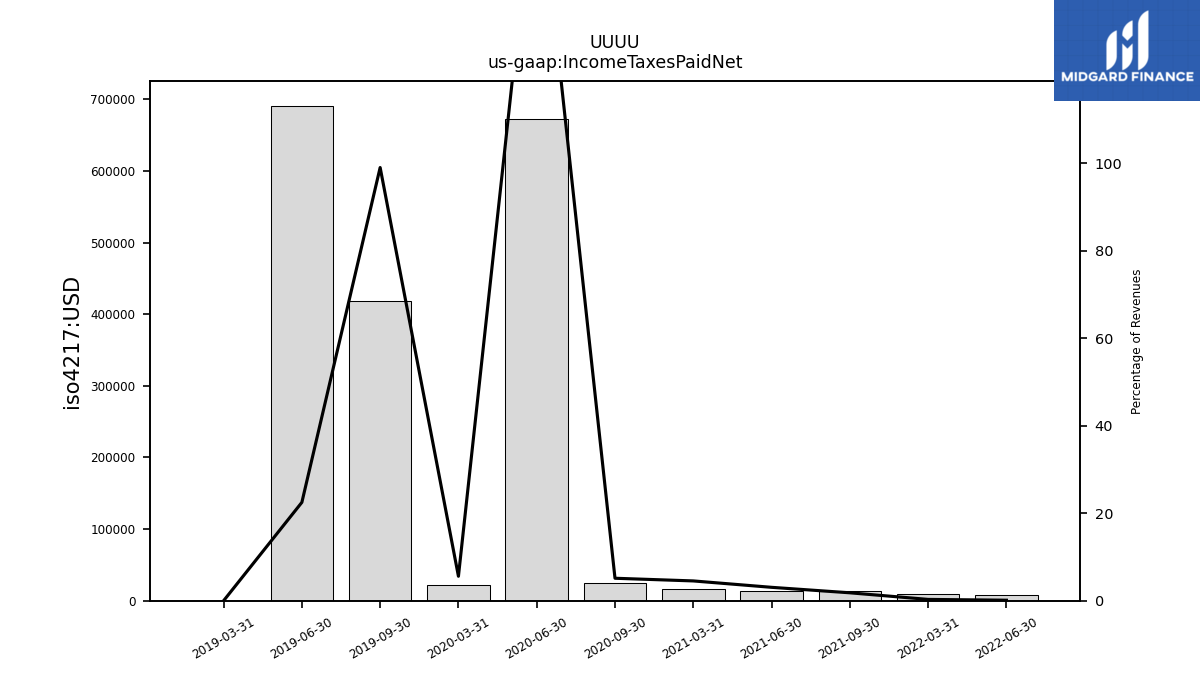
| Income Taxes Paid Net | NA | NA | NA | NA | NA | 0.01 | 0.01 | NA | 0.01 | 0.01 | 0.02 | NA | 0.03 | 0.67 | 0.02 | NA | 0.42 | 0.69 | 0.00 | NA | NA | NA | NA | NA | NA | NA | NA | NA | NA | NA | NA | NA | NA | NA | NA | |
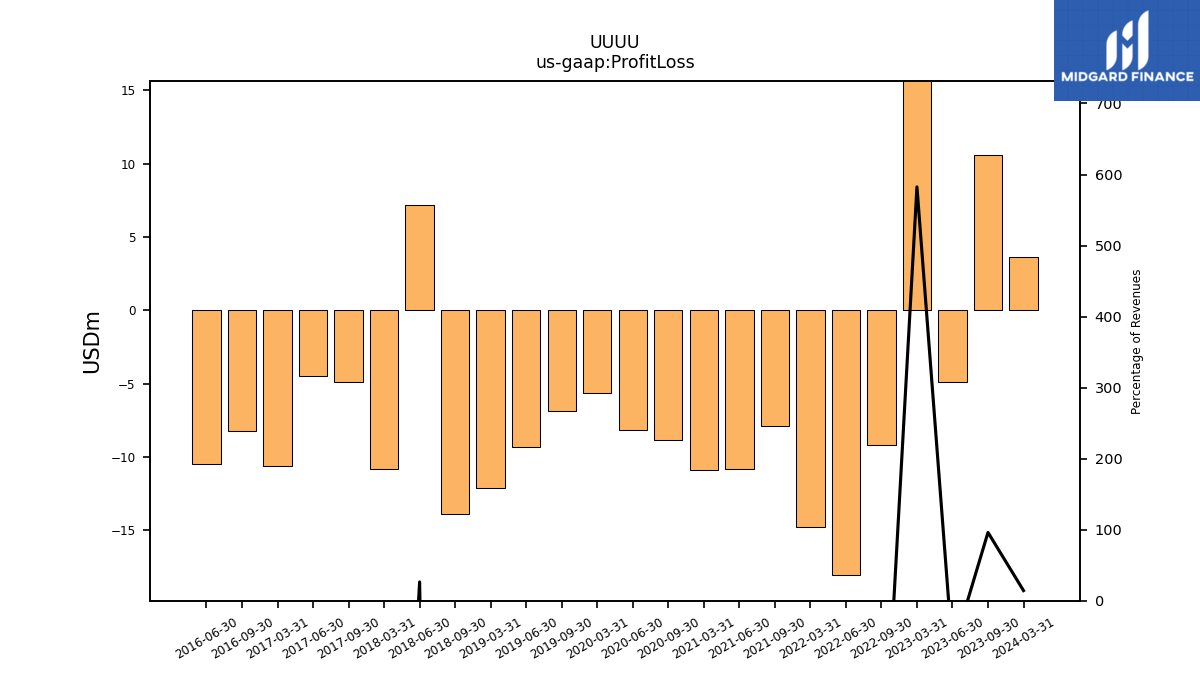
| Profit Loss | 10.56 | -4.86 | 114.27 | NA | -9.17 | -18.05 | -14.73 | NA | -7.87 | -10.78 | -10.91 | NA | -8.86 | -8.19 | -5.66 | NA | -6.84 | -9.31 | -12.13 | NA | -13.90 | 7.14 | -10.83 | NA | -4.88 | -4.48 | -10.60 | NA | -8.24 | -10.44 | NA | NA | NA | NA | NA | |
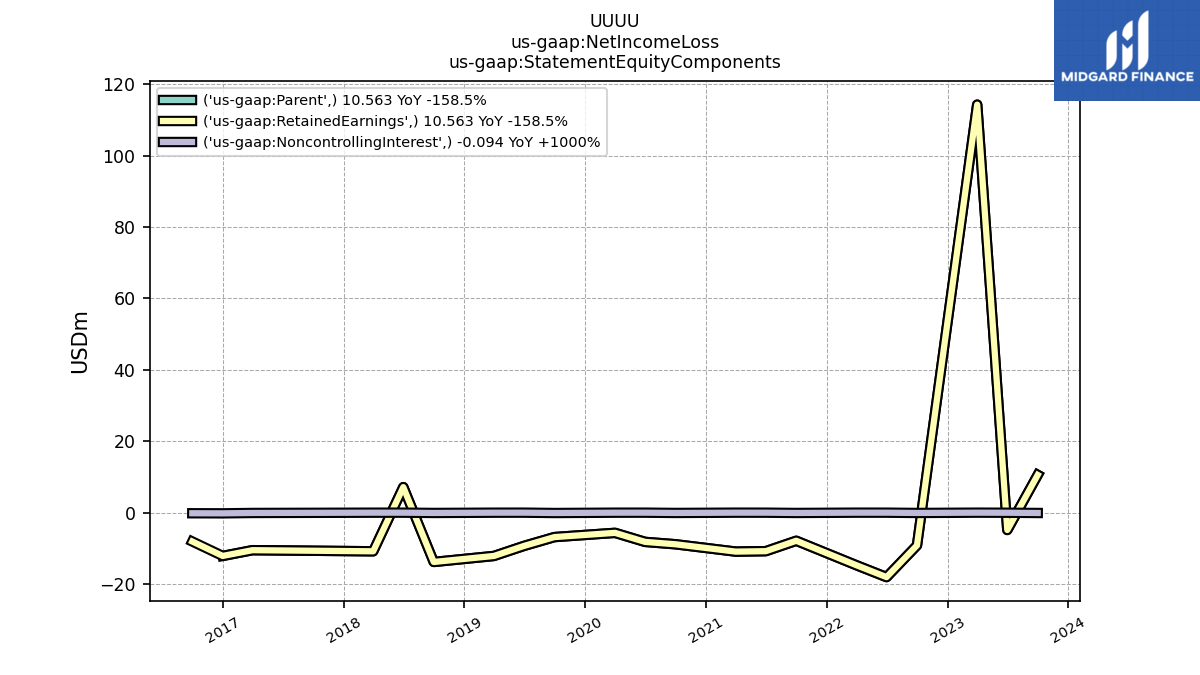
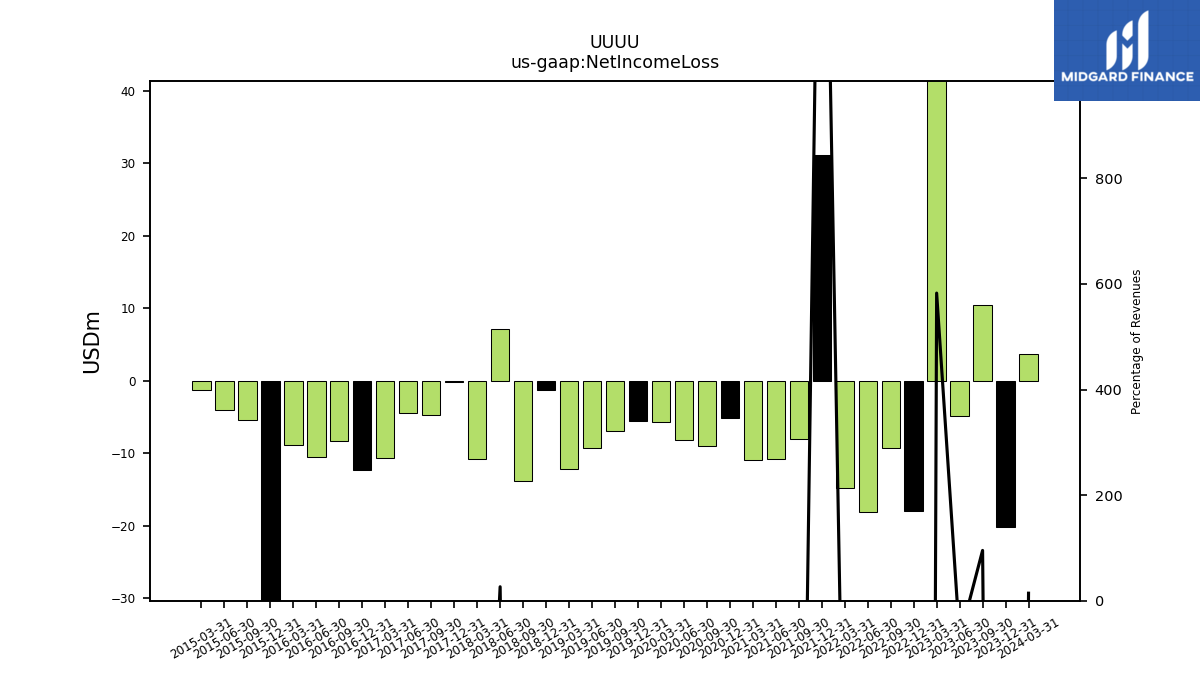
| Net Income Loss | 10.47 | -4.88 | 114.26 | -17.90 | -9.25 | -18.06 | -14.73 | 31.11 | -7.96 | -10.79 | -10.91 | -5.08 | -8.94 | -8.19 | -5.66 | -5.57 | -6.94 | -9.31 | -12.13 | -1.32 | -13.81 | 7.15 | -10.82 | -0.14 | -4.77 | -4.47 | -10.60 | -12.31 | -8.24 | -10.44 | -8.87 | -71.70 | -5.39 | -4.06 | -1.20 | |
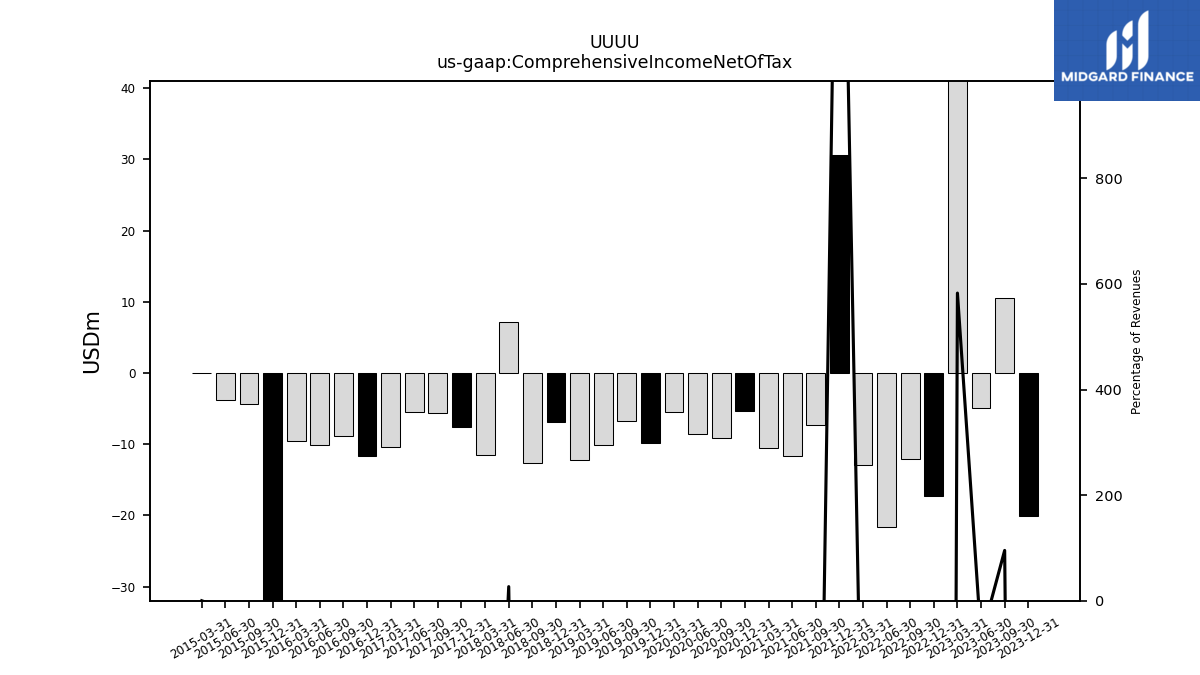
| Comprehensive Income Net Of Tax | 10.47 | -4.88 | 114.26 | -17.27 | -12.06 | -21.55 | -12.96 | 30.57 | -7.24 | -11.69 | -10.56 | -5.36 | -9.11 | -8.57 | -5.51 | -9.89 | -6.70 | -10.09 | -12.27 | -6.88 | -12.62 | 7.21 | -11.52 | -7.52 | -5.66 | -5.48 | -10.35 | -11.59 | -8.81 | -10.08 | -9.58 | -71.26 | -4.35 | -3.83 | 0.00 | |
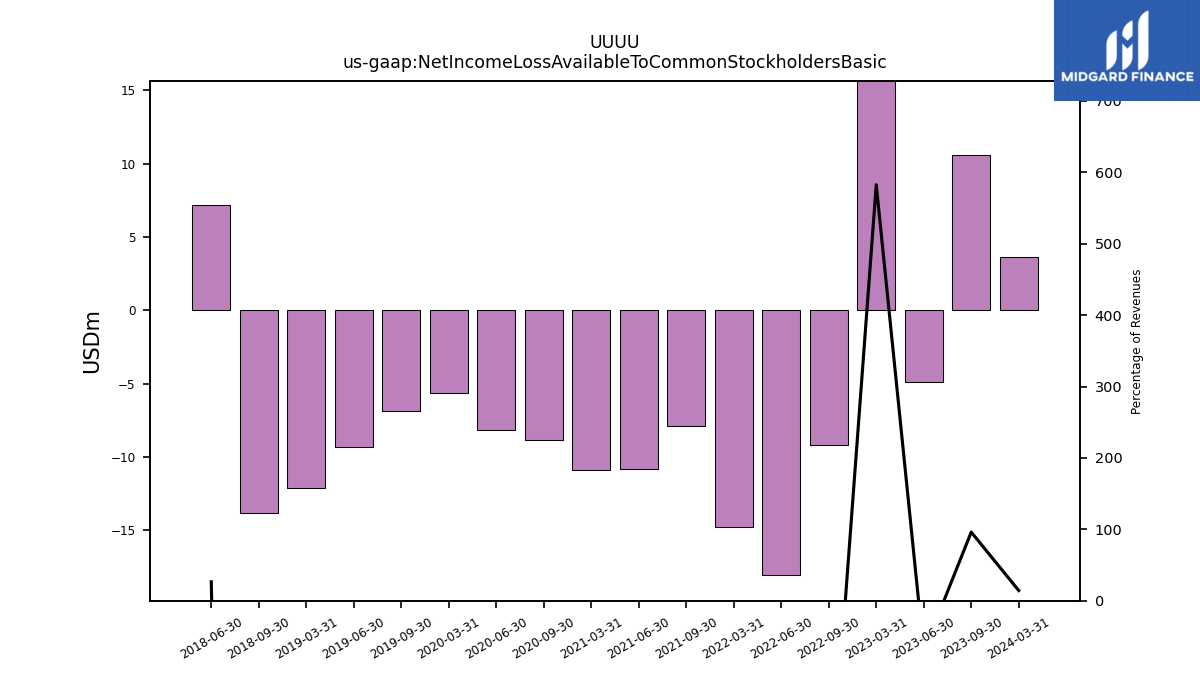
| Net Income Loss Available To Common Stockholders Basic | 10.56 | -4.86 | 114.27 | NA | -9.17 | -18.05 | -14.73 | NA | -7.87 | -10.78 | -10.91 | NA | -8.86 | -8.19 | -5.66 | NA | -6.84 | -9.31 | -12.13 | NA | -13.81 | 7.15 | NA | NA | NA | NA | NA | NA | NA | NA | NA | NA | NA | NA | NA |
| 2023-09-30 | 2023-06-30 | 2023-03-31 | 2022-12-31 | 2022-09-30 | 2022-06-30 | 2022-03-31 | 2021-12-31 | 2021-09-30 | 2021-06-30 | 2021-03-31 | 2020-12-31 | 2020-09-30 | 2020-06-30 | 2020-03-31 | 2019-12-31 | 2019-09-30 | 2019-06-30 | 2019-03-31 | 2018-12-31 | 2018-09-30 | 2018-06-30 | 2018-03-31 | 2017-12-31 | 2017-09-30 | 2017-06-30 | 2017-03-31 | 2016-12-31 | 2016-09-30 | 2016-06-30 | 2016-03-31 | 2015-12-31 | 2015-09-30 | 2015-06-30 | 2015-03-31 | ||
|---|---|---|---|---|---|---|---|---|---|---|---|---|---|---|---|---|---|---|---|---|---|---|---|---|---|---|---|---|---|---|---|---|---|---|---|---|
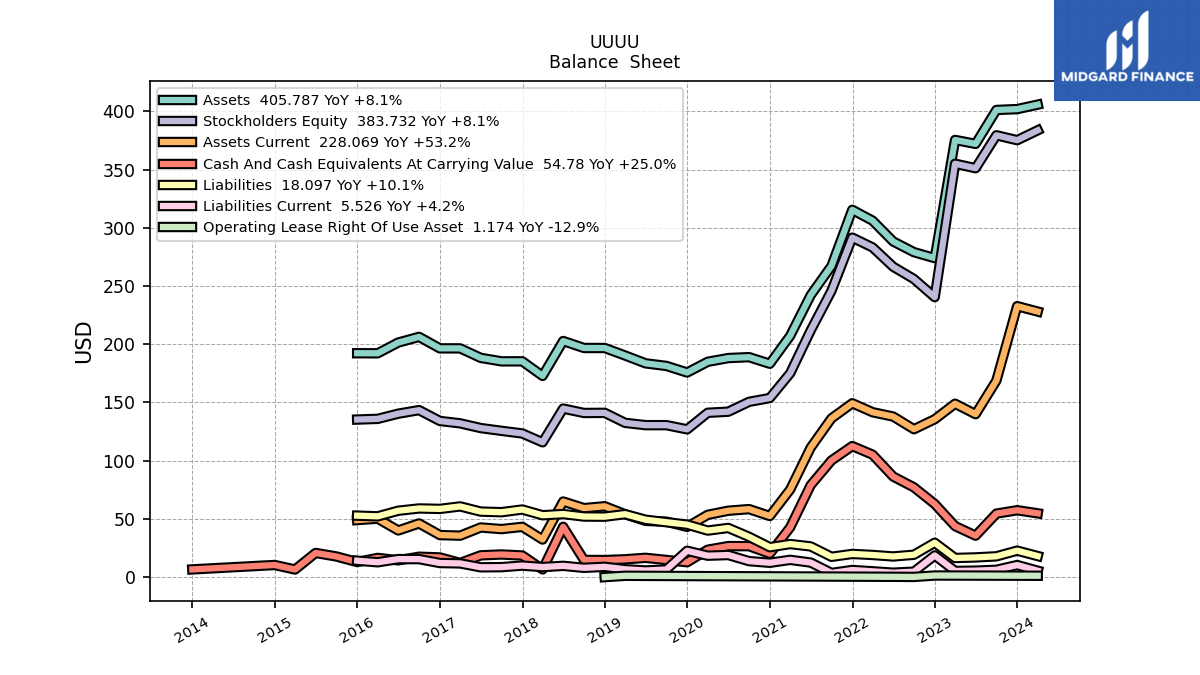
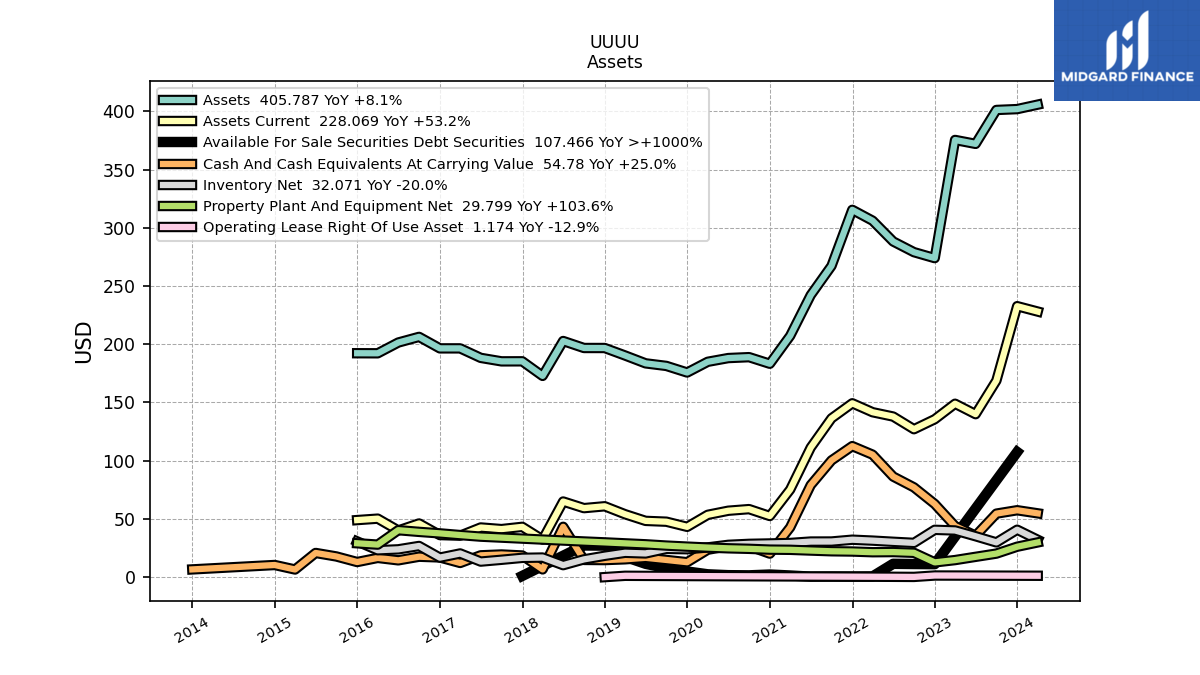
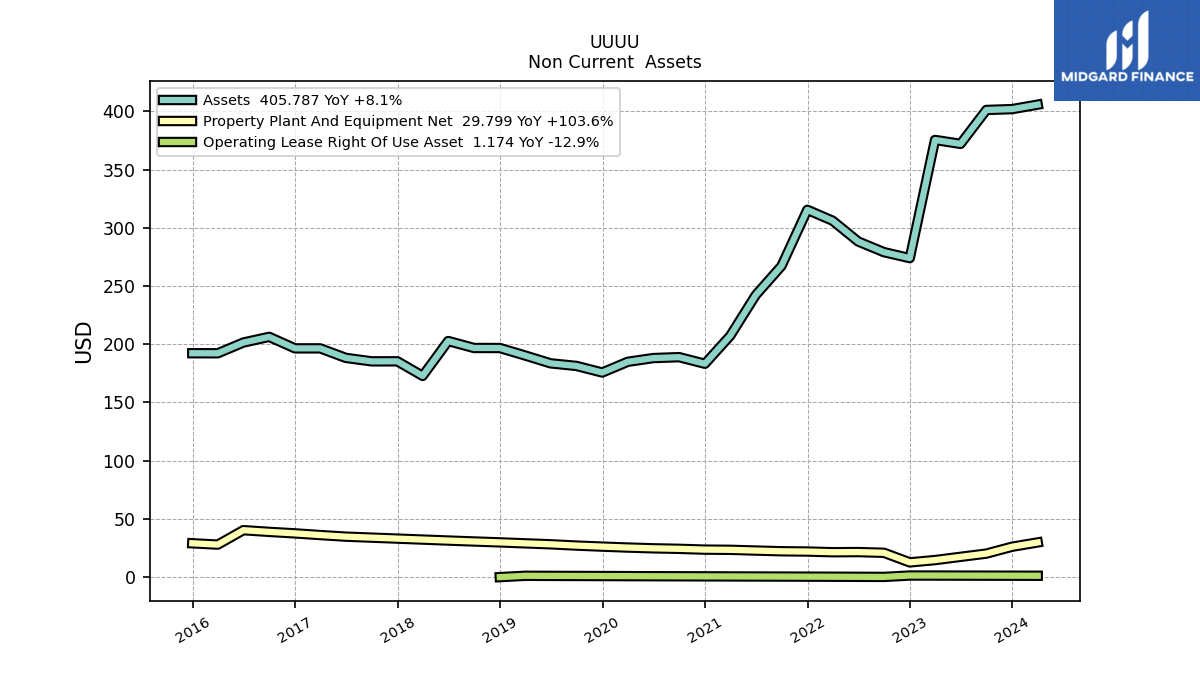
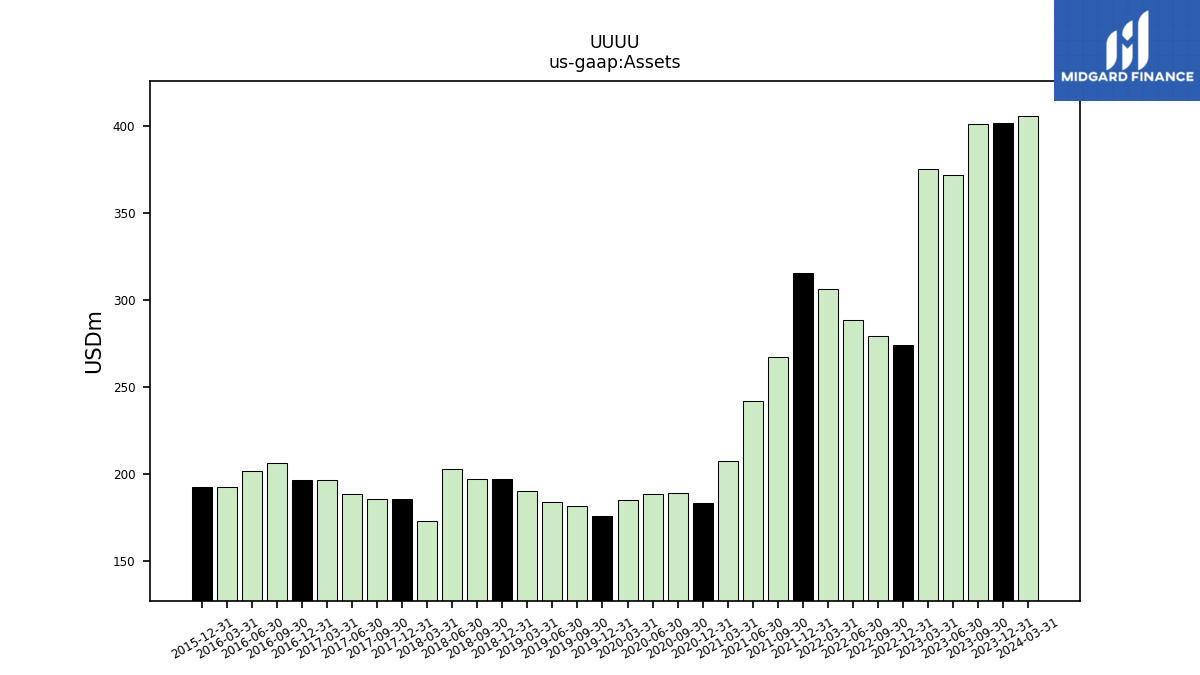
| Assets | 401.19 | 372.07 | 375.45 | 273.95 | 279.08 | 288.26 | 306.10 | 315.45 | 267.28 | 242.18 | 207.22 | 183.24 | 188.91 | 188.12 | 184.93 | 175.72 | 181.37 | 183.59 | 190.34 | 196.77 | 196.78 | 202.78 | 172.80 | 185.34 | 185.30 | 188.30 | 196.46 | 196.46 | 206.33 | 201.47 | 192.23 | 192.28 | NA | NA | NA | |
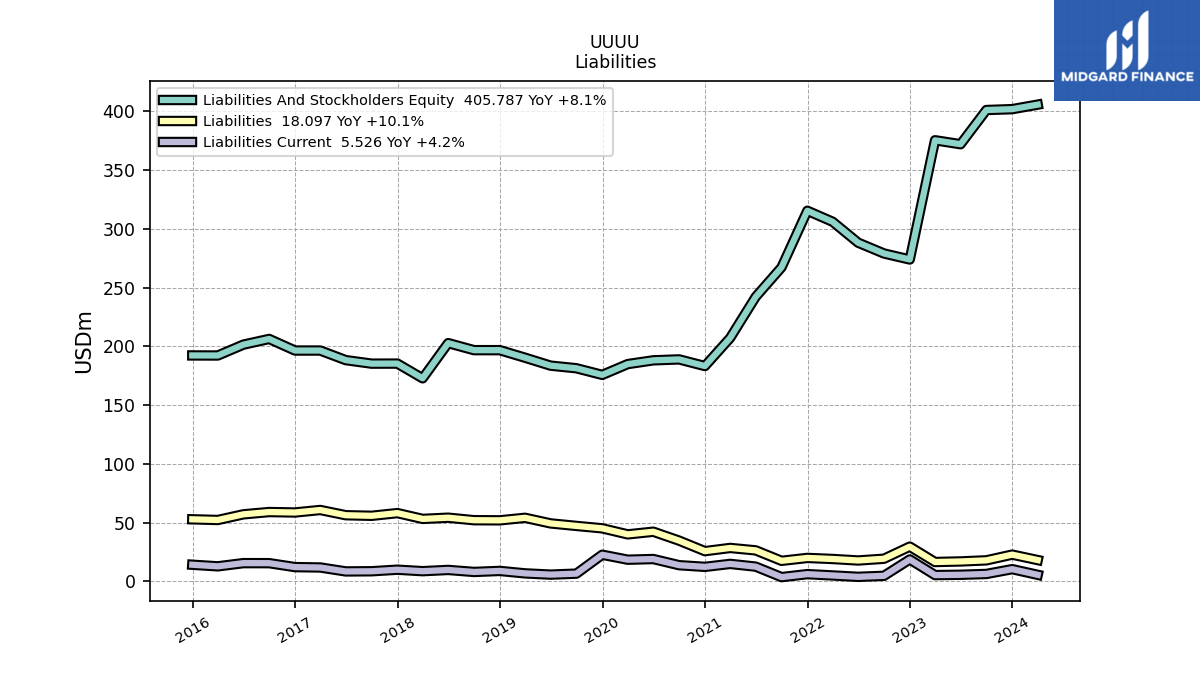
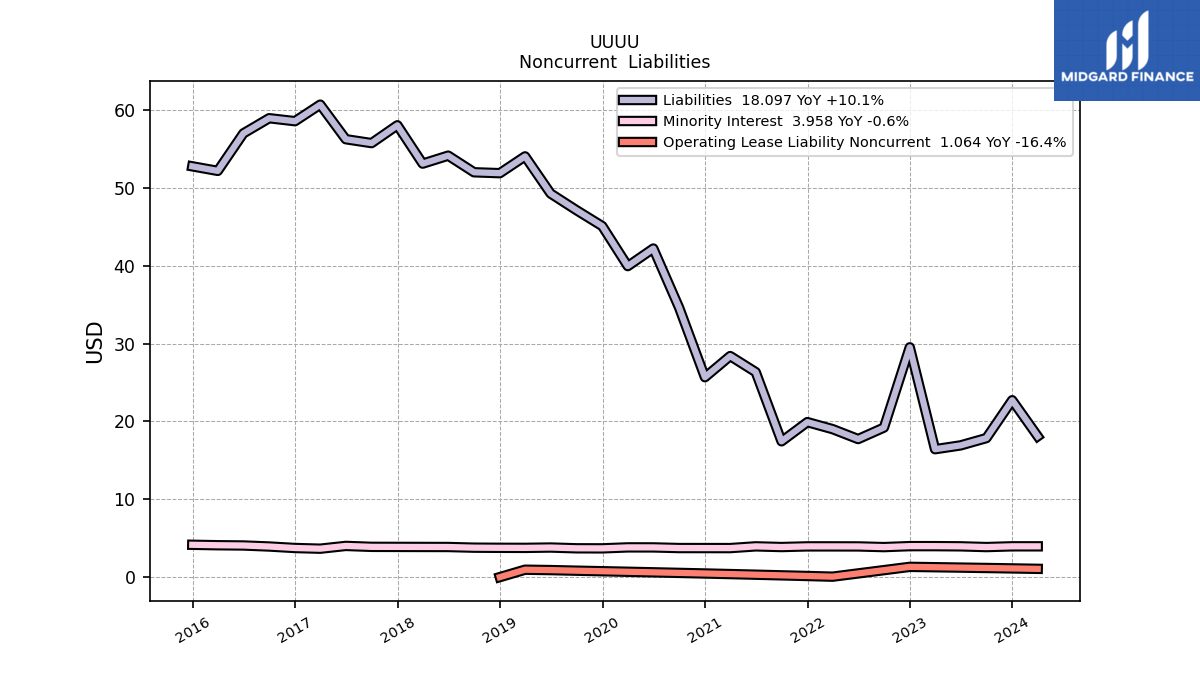
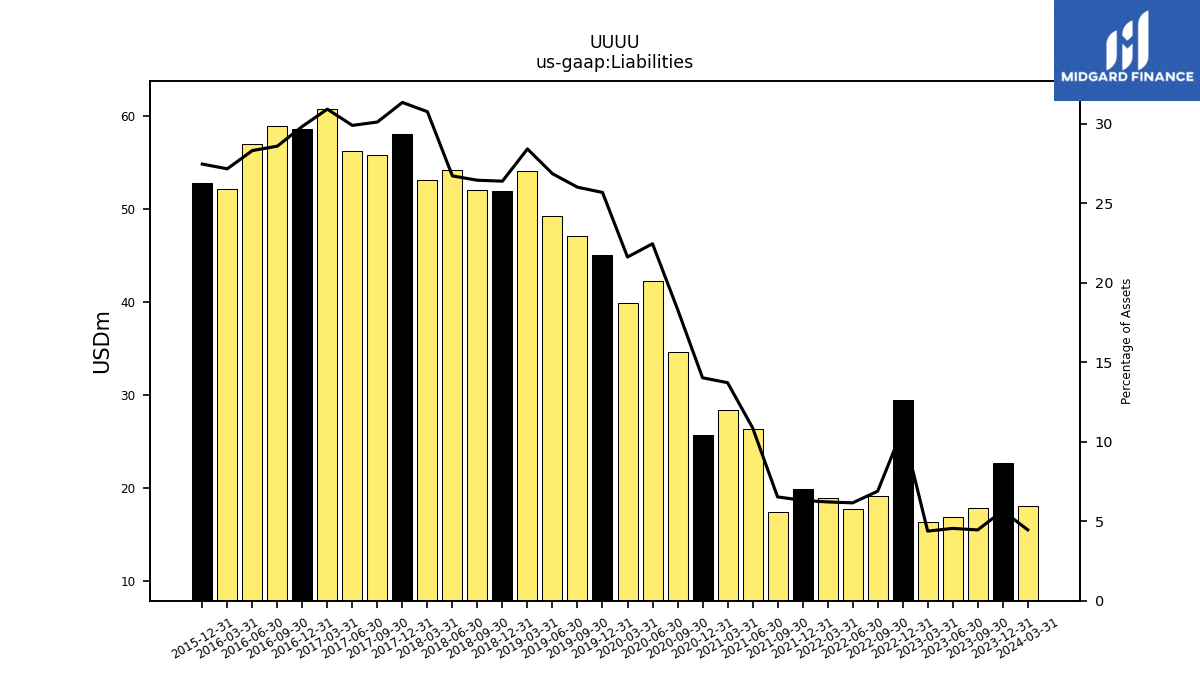
| Liabilities | 17.87 | 16.93 | 16.44 | 29.54 | 19.22 | 17.74 | 19.02 | 19.92 | 17.45 | 26.35 | 28.41 | 25.69 | 34.63 | 42.23 | 39.97 | 45.11 | 47.16 | 49.30 | 54.07 | 51.91 | 52.03 | 54.16 | 53.14 | 58.07 | 55.77 | 56.28 | 60.72 | 58.59 | 58.98 | 57.02 | 52.21 | 52.79 | NA | NA | NA | |
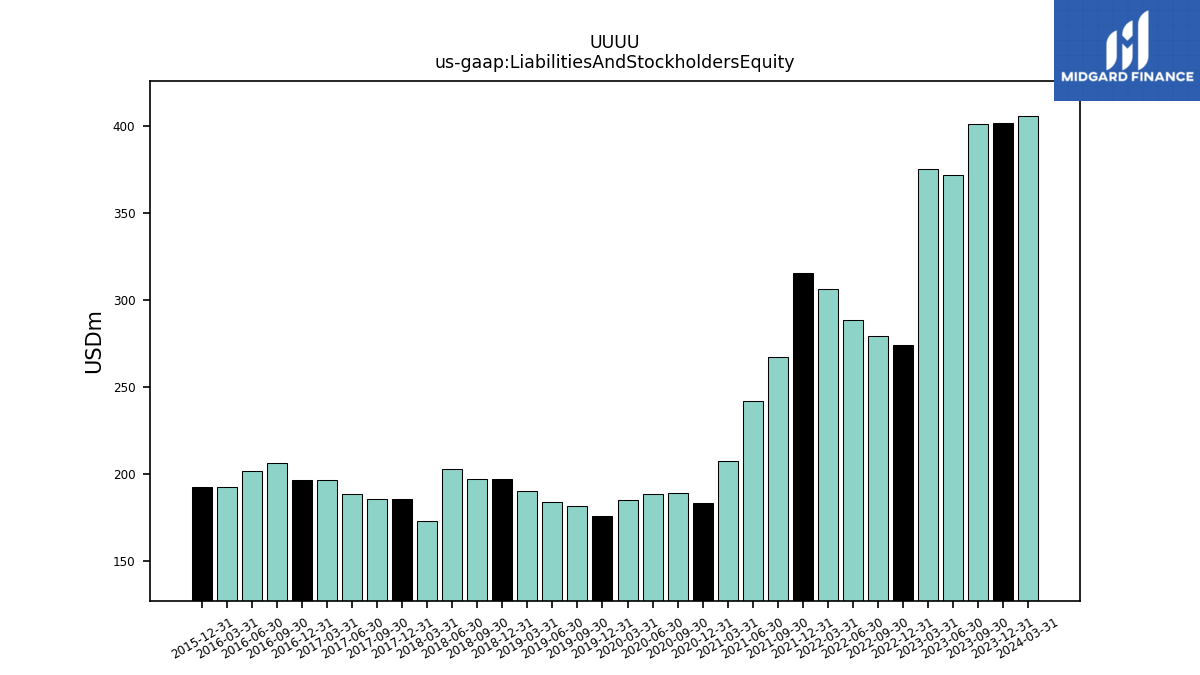
| Liabilities And Stockholders Equity | 401.19 | 372.07 | 375.45 | 273.95 | 279.08 | 288.26 | 306.10 | 315.45 | 267.28 | 242.18 | 207.22 | 183.24 | 188.91 | 188.12 | 184.93 | 175.72 | 181.37 | 183.59 | 190.34 | 196.77 | 196.78 | 202.78 | 172.80 | 185.34 | 185.30 | 188.30 | 196.46 | 196.46 | 206.33 | 201.47 | 192.23 | 192.28 | NA | NA | NA | |
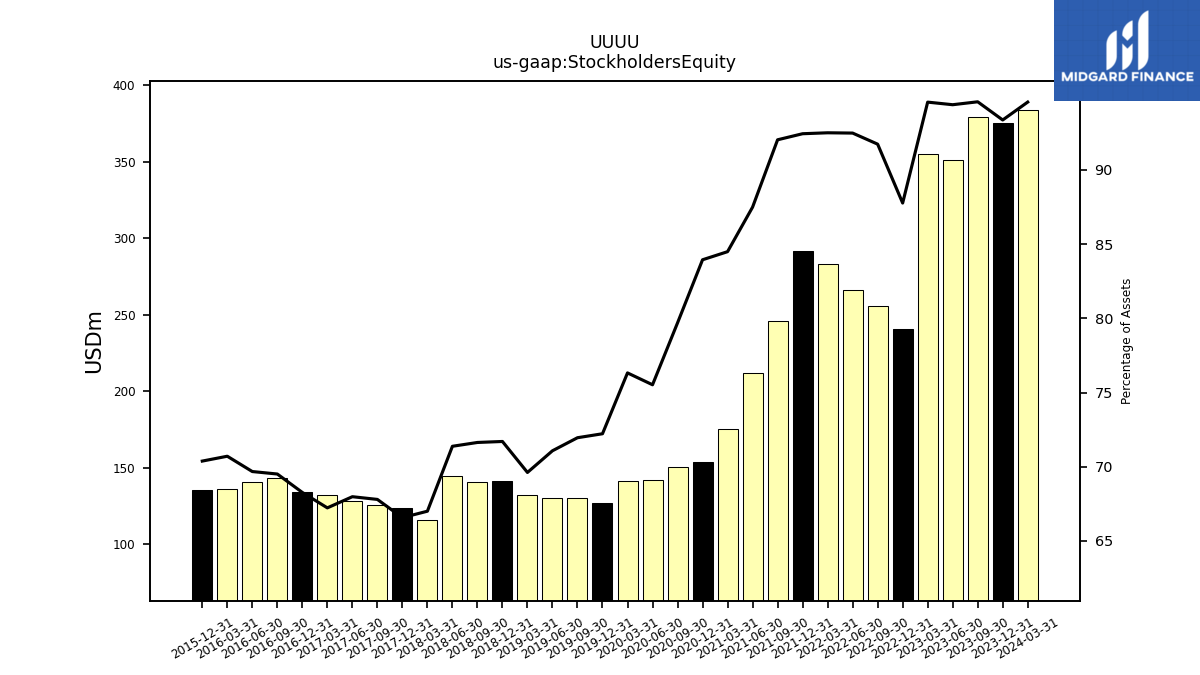
| Stockholders Equity | 379.46 | 351.19 | 355.03 | 240.43 | 256.01 | 266.57 | 283.13 | 291.57 | 245.97 | 211.88 | 175.08 | 153.81 | 150.55 | 142.08 | 141.14 | 126.91 | 130.51 | 130.49 | 132.51 | 141.09 | 140.97 | 144.74 | 115.78 | 123.39 | 125.63 | 128.01 | 132.08 | 134.12 | 143.42 | 140.38 | 135.92 | 135.33 | NA | NA | NA |
| 2023-09-30 | 2023-06-30 | 2023-03-31 | 2022-12-31 | 2022-09-30 | 2022-06-30 | 2022-03-31 | 2021-12-31 | 2021-09-30 | 2021-06-30 | 2021-03-31 | 2020-12-31 | 2020-09-30 | 2020-06-30 | 2020-03-31 | 2019-12-31 | 2019-09-30 | 2019-06-30 | 2019-03-31 | 2018-12-31 | 2018-09-30 | 2018-06-30 | 2018-03-31 | 2017-12-31 | 2017-09-30 | 2017-06-30 | 2017-03-31 | 2016-12-31 | 2016-09-30 | 2016-06-30 | 2016-03-31 | 2015-12-31 | 2015-09-30 | 2015-06-30 | 2015-03-31 | ||
|---|---|---|---|---|---|---|---|---|---|---|---|---|---|---|---|---|---|---|---|---|---|---|---|---|---|---|---|---|---|---|---|---|---|---|---|---|
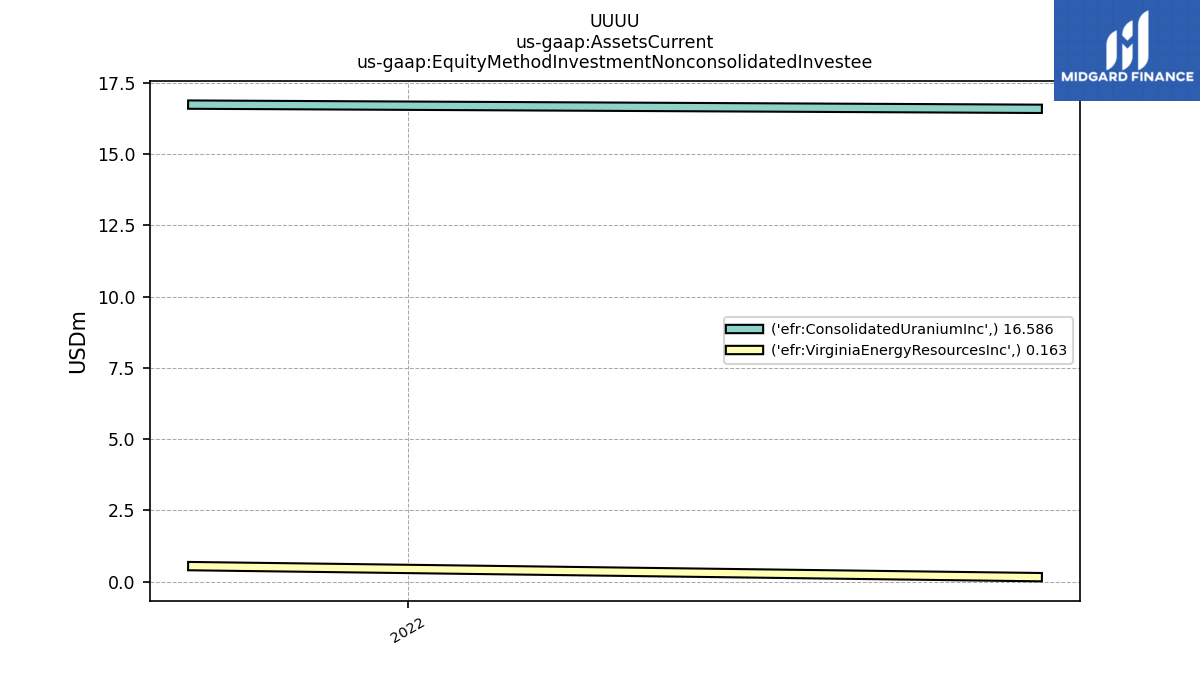
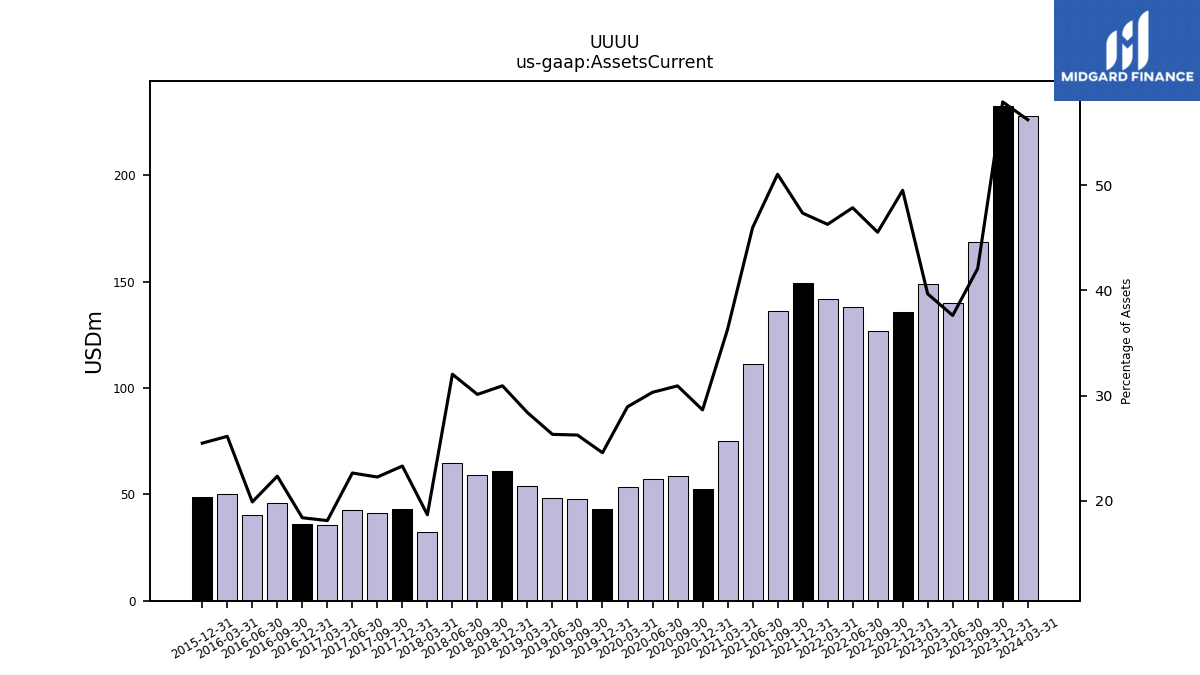
| Assets Current | 168.77 | 139.93 | 148.91 | 135.59 | 127.02 | 137.90 | 141.62 | 149.31 | 136.37 | 111.27 | 75.20 | 52.47 | 58.41 | 57.02 | 53.50 | 43.17 | 47.60 | 48.31 | 54.02 | 60.85 | 59.25 | 64.94 | 32.27 | 43.19 | 41.25 | 42.63 | 35.60 | 36.13 | 46.10 | 40.08 | 50.22 | 48.99 | NA | NA | NA | |
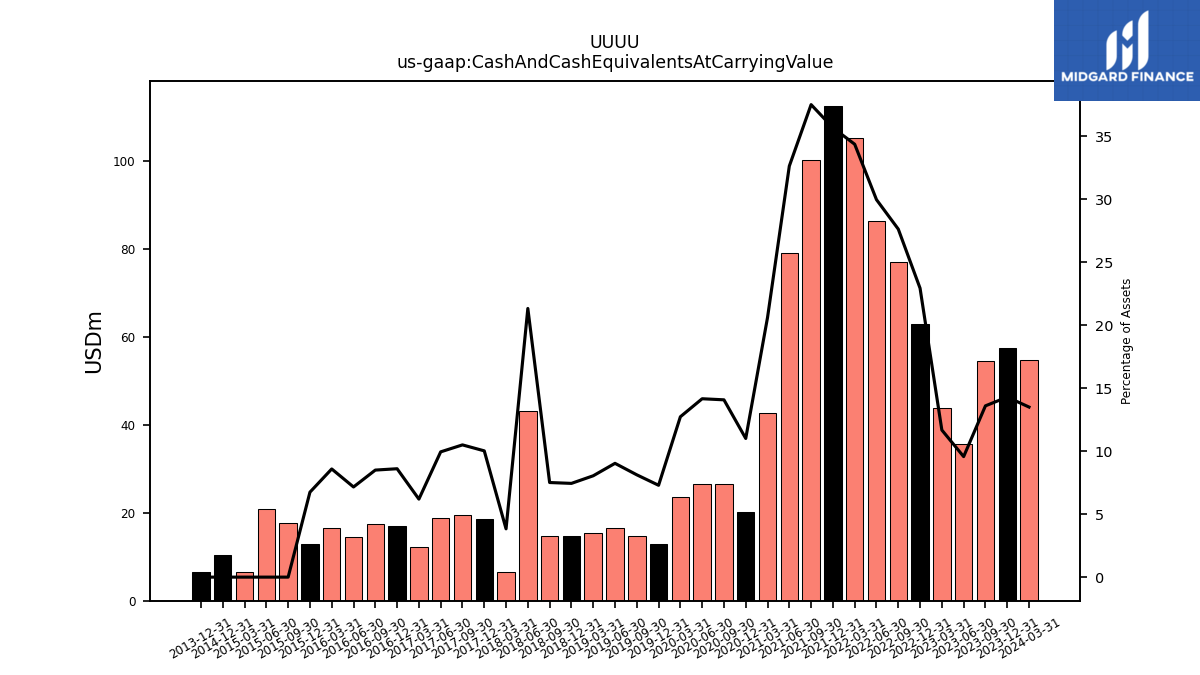
| Cash And Cash Equivalents At Carrying Value | 54.54 | 35.59 | 43.83 | 62.82 | 77.09 | 86.36 | 105.17 | 112.52 | 100.24 | 79.02 | 42.70 | 20.17 | 26.58 | 26.64 | 23.54 | 12.81 | 14.73 | 16.58 | 15.31 | 14.64 | 14.78 | 43.24 | 6.62 | 18.57 | 19.45 | 18.72 | 12.16 | 16.90 | 17.53 | 14.42 | 16.50 | 12.96 | 17.74 | 20.76 | 6.54 | |
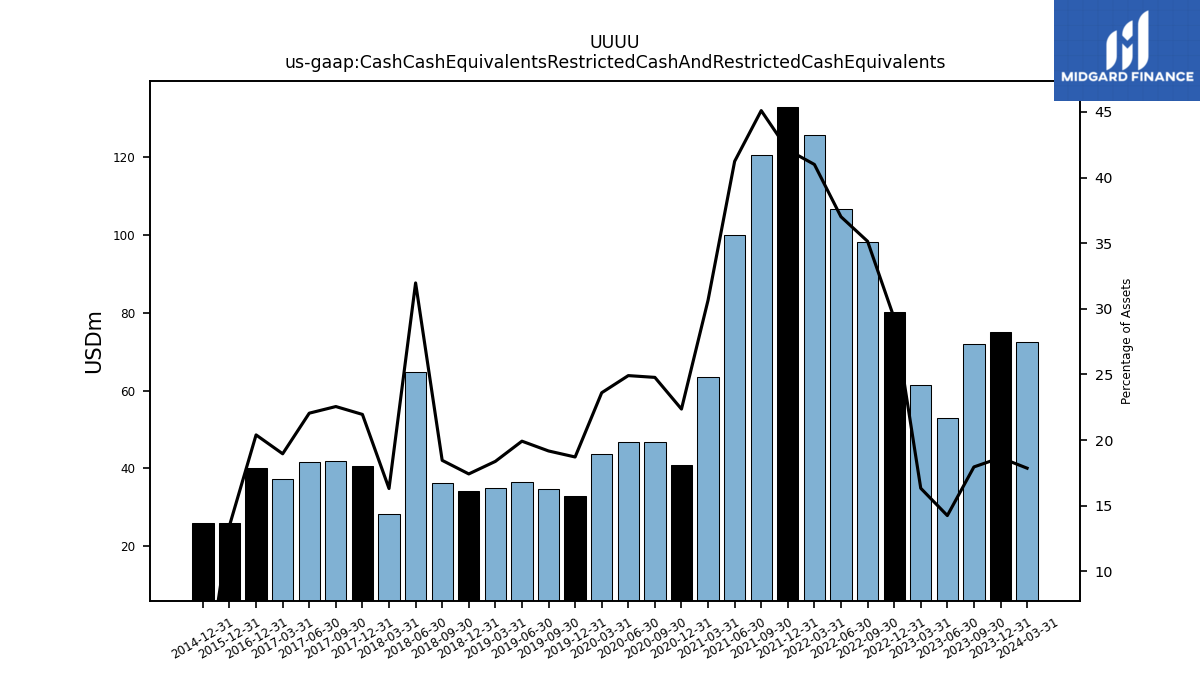
| Cash Cash Equivalents Restricted Cash And Restricted Cash Equivalents | 72.06 | 53.05 | 61.34 | 80.27 | 98.08 | 106.69 | 125.48 | 132.82 | 120.53 | 99.86 | 63.53 | 40.98 | 46.81 | 46.87 | 43.66 | 32.89 | 34.78 | 36.58 | 34.99 | 34.29 | 36.33 | 64.83 | 28.20 | 40.70 | 41.80 | 41.53 | 37.25 | 40.08 | NA | NA | NA | 25.95 | NA | NA | NA | |
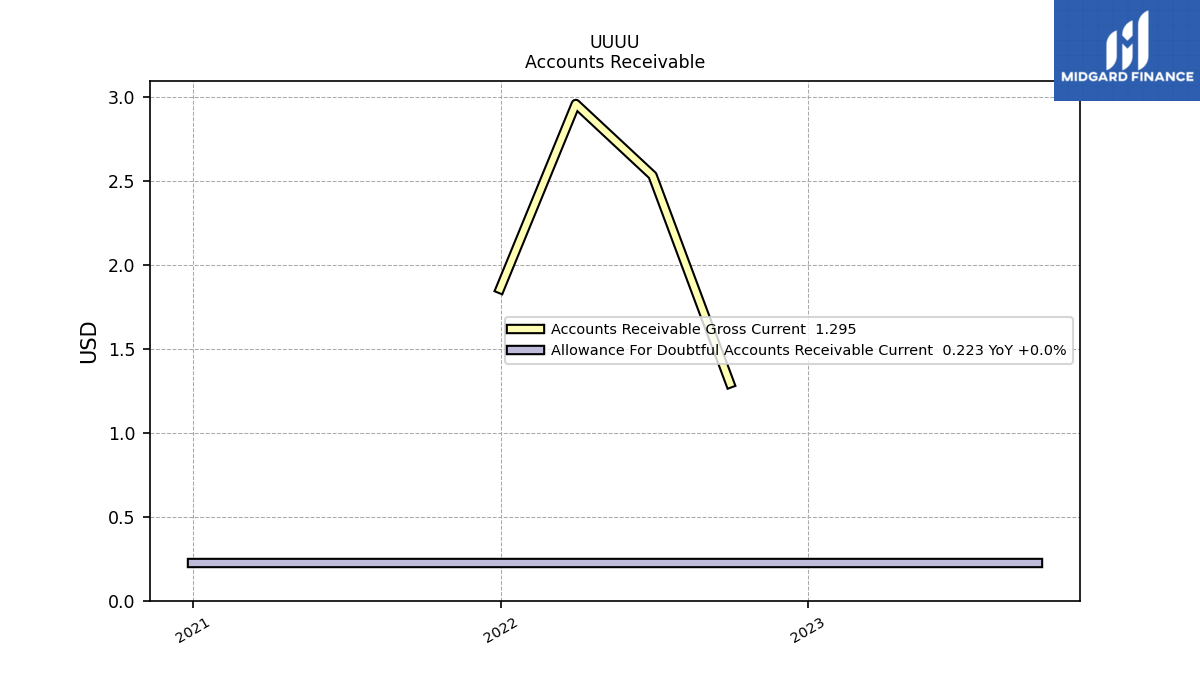
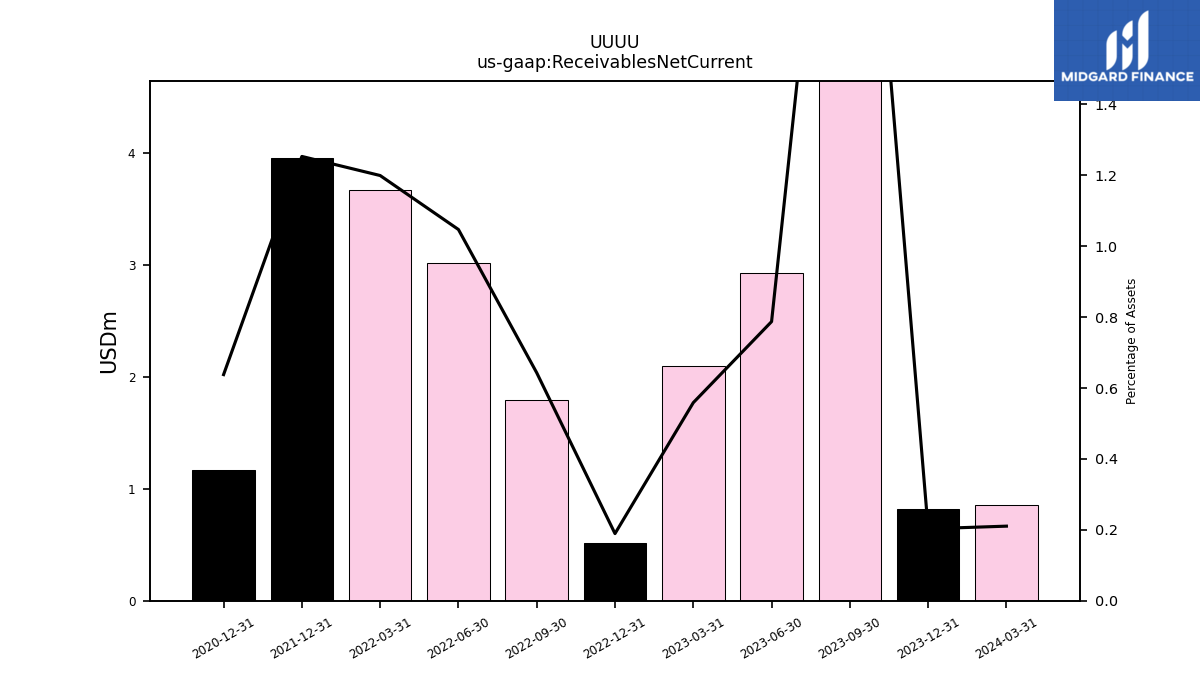
| Receivables Net Current | 11.46 | 2.93 | 2.10 | 0.52 | 1.79 | 3.02 | 3.67 | 3.95 | NA | NA | NA | 1.17 | NA | NA | NA | NA | NA | NA | NA | NA | NA | NA | NA | NA | NA | NA | NA | NA | NA | NA | NA | NA | NA | NA | NA | |
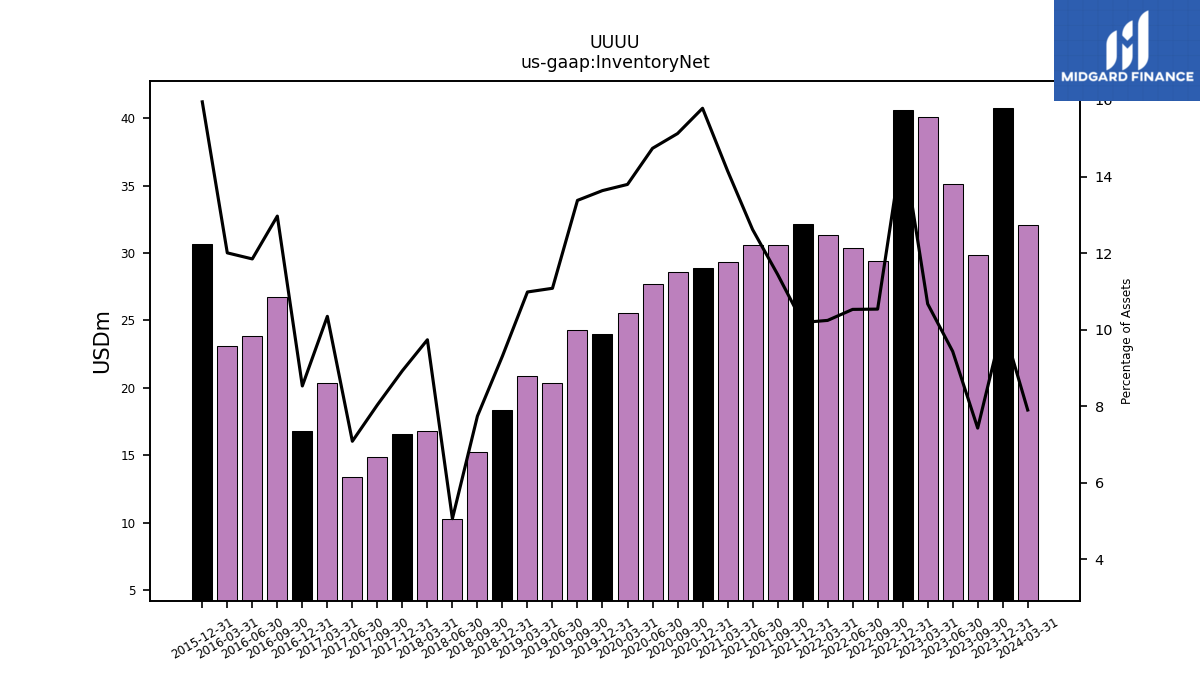
| Inventory Net | 29.81 | 35.10 | 40.08 | 40.62 | 29.41 | 30.36 | 31.36 | 32.14 | 30.59 | 30.56 | 29.32 | 28.92 | 28.57 | 27.73 | 25.51 | 23.96 | 24.26 | 20.35 | 20.91 | 18.32 | 15.24 | 10.27 | 16.83 | 16.55 | 14.89 | 13.35 | 20.33 | 16.76 | 26.75 | 23.87 | 23.08 | 30.67 | NA | NA | NA | |
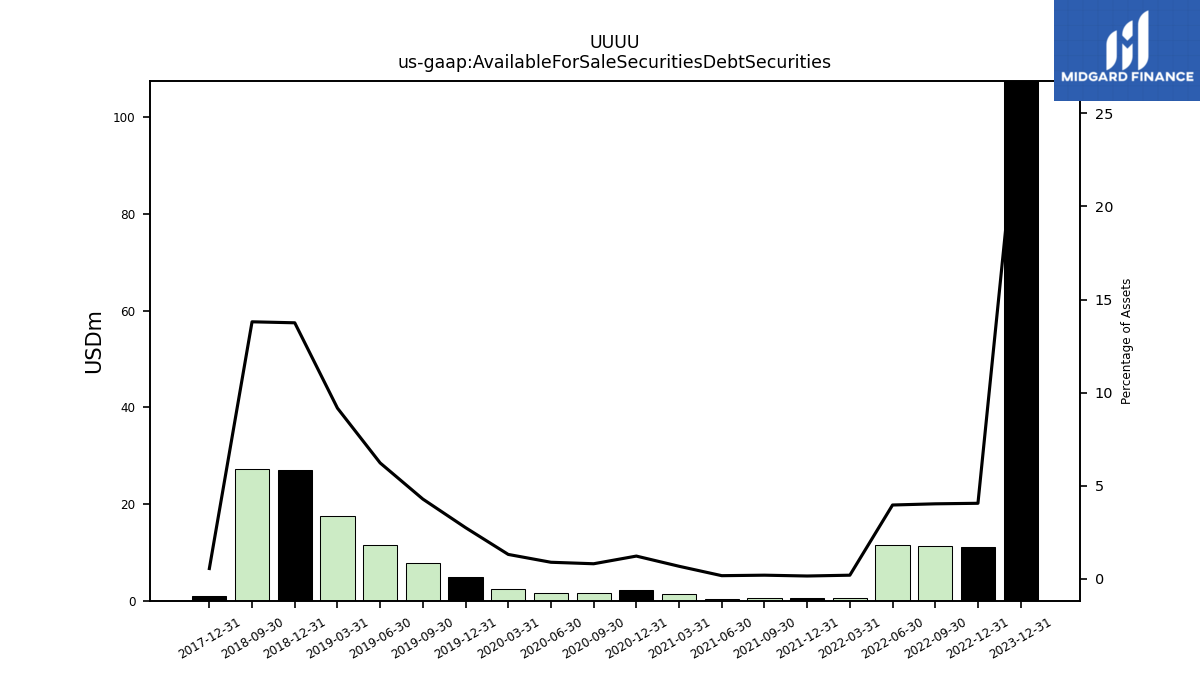
| Available For Sale Securities Debt Securities | NA | NA | NA | 11.12 | 11.25 | 11.44 | 0.61 | 0.49 | 0.54 | 0.42 | 1.41 | 2.25 | 1.54 | 1.68 | 2.43 | 4.84 | 7.78 | 11.43 | 17.45 | 27.06 | 27.17 | NA | NA | 1.03 | NA | NA | NA | NA | NA | NA | NA | NA | NA | NA | NA |
| 2023-09-30 | 2023-06-30 | 2023-03-31 | 2022-12-31 | 2022-09-30 | 2022-06-30 | 2022-03-31 | 2021-12-31 | 2021-09-30 | 2021-06-30 | 2021-03-31 | 2020-12-31 | 2020-09-30 | 2020-06-30 | 2020-03-31 | 2019-12-31 | 2019-09-30 | 2019-06-30 | 2019-03-31 | 2018-12-31 | 2018-09-30 | 2018-06-30 | 2018-03-31 | 2017-12-31 | 2017-09-30 | 2017-06-30 | 2017-03-31 | 2016-12-31 | 2016-09-30 | 2016-06-30 | 2016-03-31 | 2015-12-31 | 2015-09-30 | 2015-06-30 | 2015-03-31 | ||
|---|---|---|---|---|---|---|---|---|---|---|---|---|---|---|---|---|---|---|---|---|---|---|---|---|---|---|---|---|---|---|---|---|---|---|---|---|
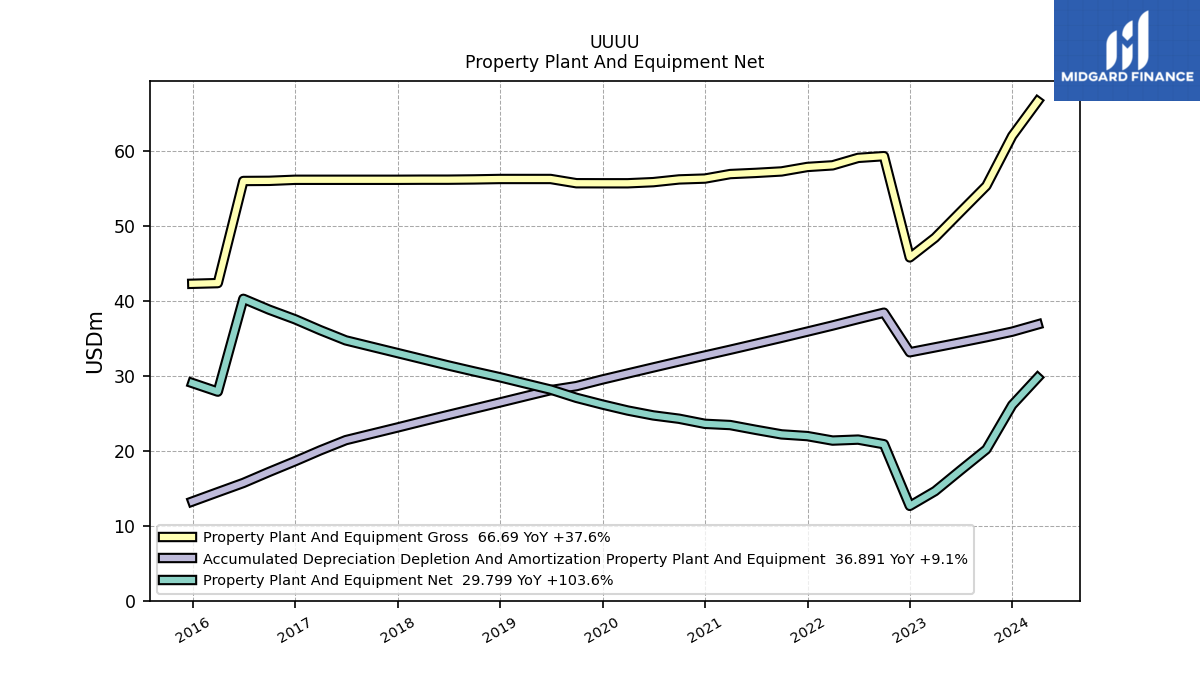
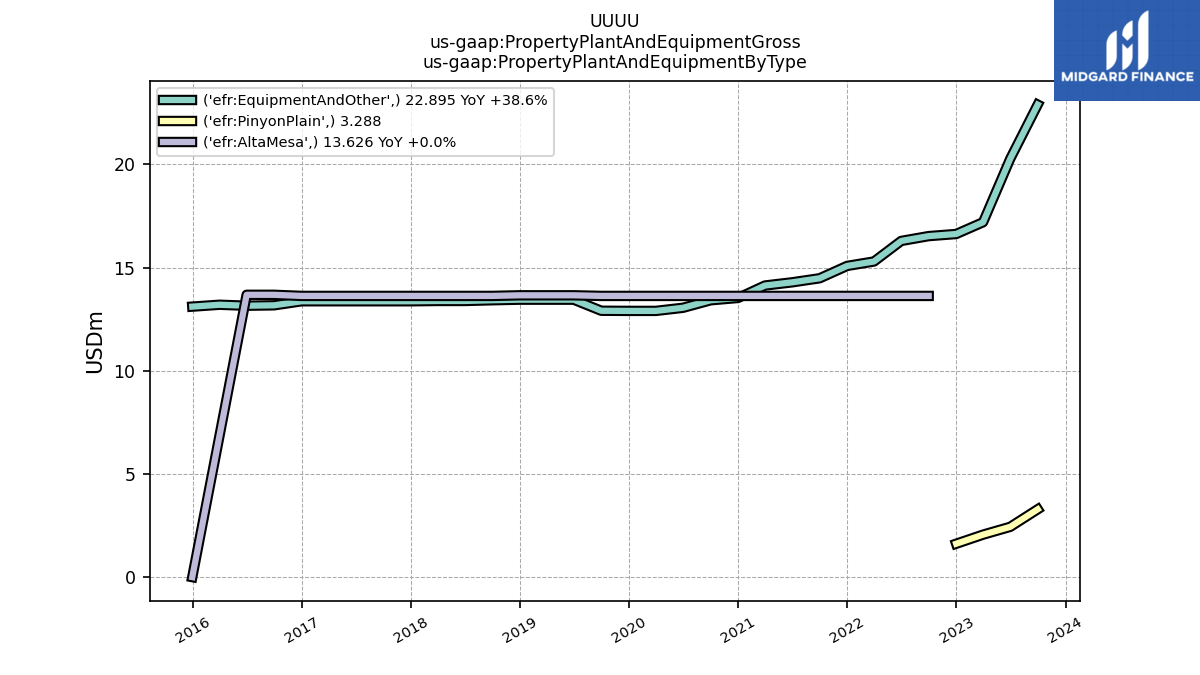
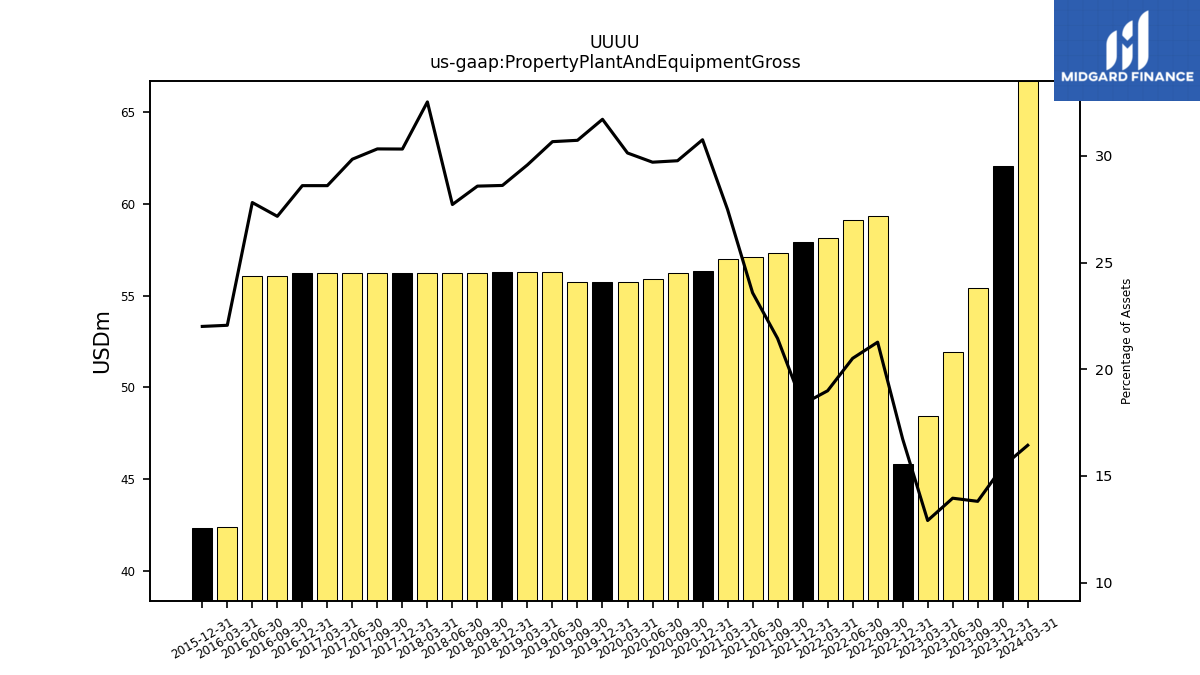
| Property Plant And Equipment Gross | 55.39 | 51.92 | 48.46 | 45.84 | 59.36 | 59.13 | 58.13 | 57.91 | 57.32 | 57.12 | 56.97 | 56.36 | 56.25 | 55.89 | 55.74 | 55.74 | 55.74 | 56.31 | 56.31 | 56.31 | 56.25 | 56.22 | 56.22 | 56.20 | 56.20 | 56.20 | 56.20 | 56.20 | 56.06 | 56.04 | 42.41 | 42.32 | NA | NA | NA | |
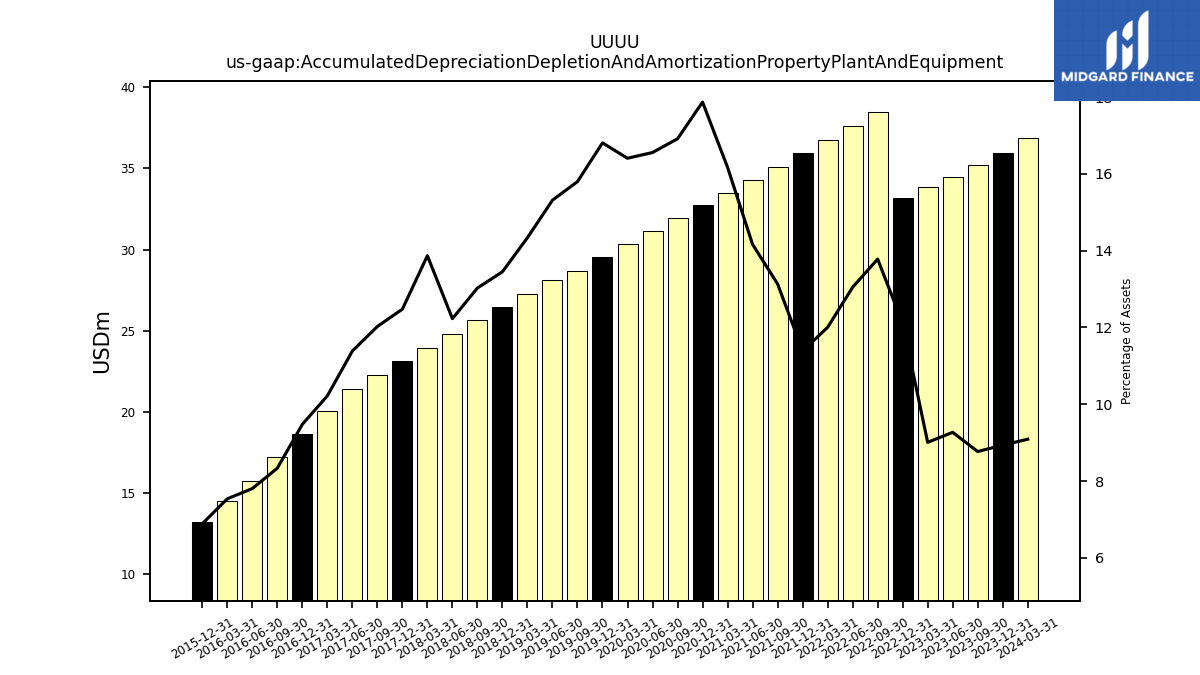
| Accumulated Depreciation Depletion And Amortization Property Plant And Equipment | 35.19 | 34.49 | 33.83 | 33.17 | 38.46 | 37.61 | 36.75 | 35.93 | 35.11 | 34.30 | 33.51 | 32.74 | 31.95 | 31.15 | 30.34 | 29.53 | 28.65 | 28.12 | 27.29 | 26.47 | 25.64 | 24.80 | 23.97 | 23.13 | 22.29 | 21.44 | 20.08 | 18.62 | 17.20 | 15.73 | 14.49 | 13.25 | NA | NA | NA | |
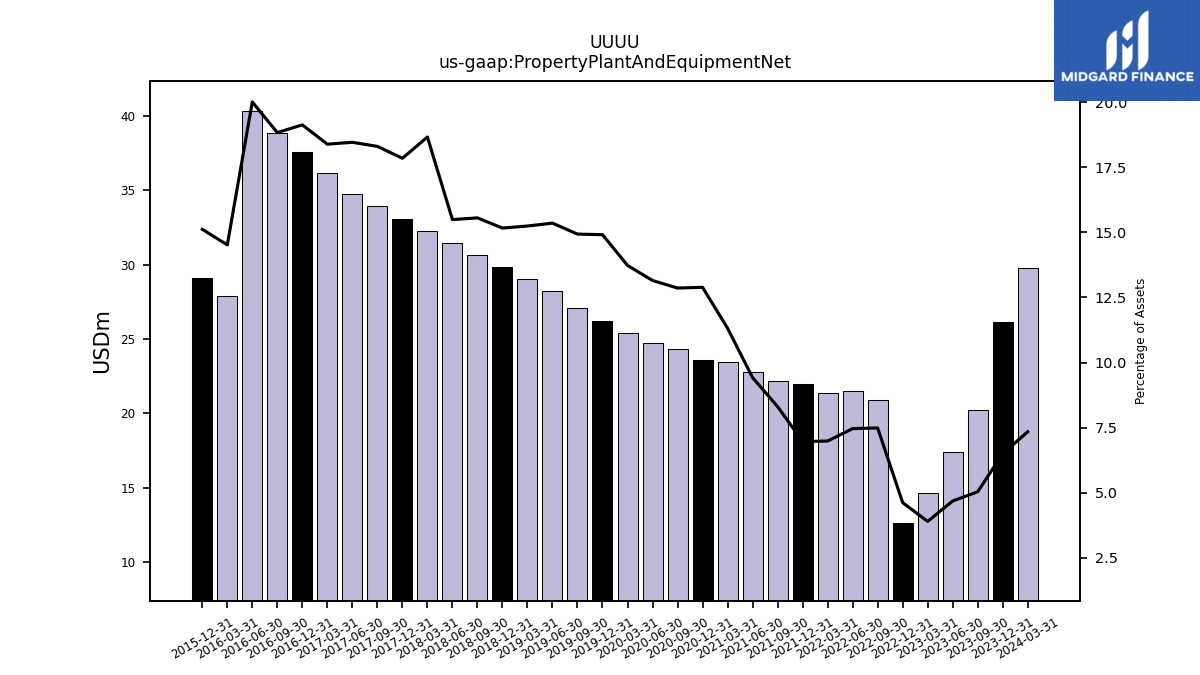
| Property Plant And Equipment Net | 20.21 | 17.43 | 14.63 | 12.66 | 20.90 | 21.52 | 21.39 | 21.98 | 22.21 | 22.82 | 23.46 | 23.62 | 24.30 | 24.74 | 25.39 | 26.20 | 27.09 | 28.19 | 29.02 | 29.84 | 30.62 | 31.42 | 32.25 | 33.08 | 33.92 | 34.76 | 36.13 | 37.58 | 38.86 | 40.31 | 27.91 | 29.07 | NA | NA | NA | |
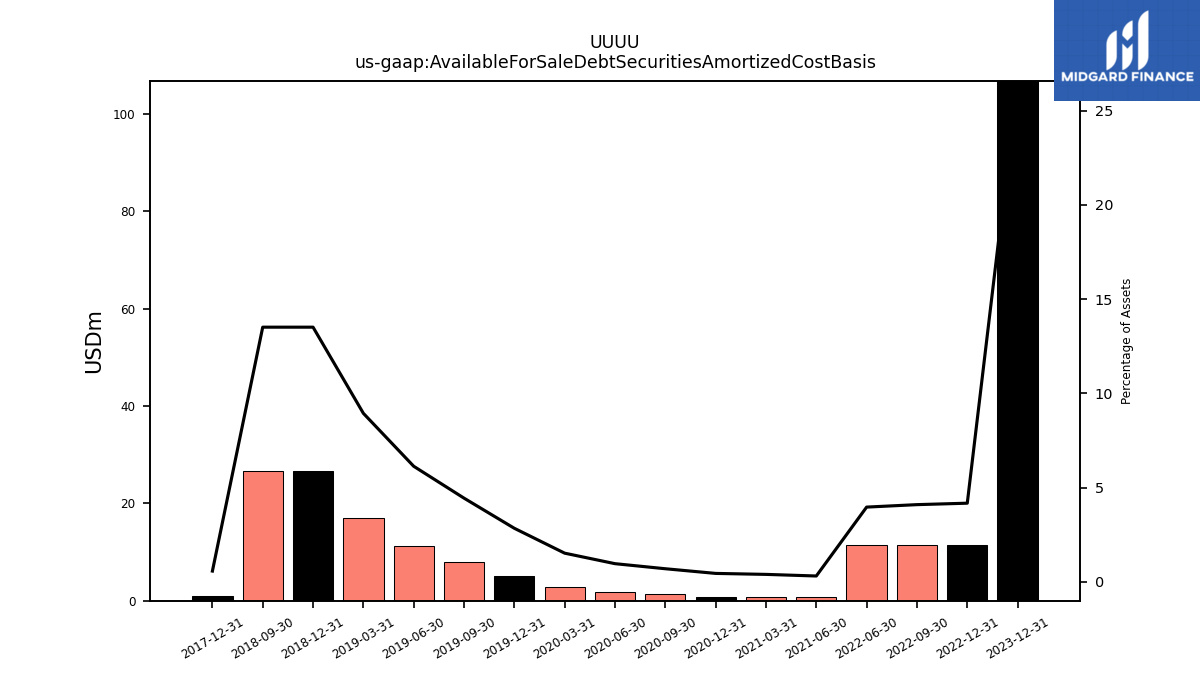
| Available For Sale Debt Securities Amortized Cost Basis | NA | NA | NA | 11.44 | 11.44 | 11.44 | NA | NA | NA | 0.76 | 0.82 | 0.82 | 1.32 | 1.82 | 2.82 | 5.00 | 8.06 | 11.26 | 17.02 | 26.59 | 26.59 | NA | NA | 1.06 | NA | NA | NA | NA | NA | NA | NA | NA | NA | NA | NA |
| 2023-09-30 | 2023-06-30 | 2023-03-31 | 2022-12-31 | 2022-09-30 | 2022-06-30 | 2022-03-31 | 2021-12-31 | 2021-09-30 | 2021-06-30 | 2021-03-31 | 2020-12-31 | 2020-09-30 | 2020-06-30 | 2020-03-31 | 2019-12-31 | 2019-09-30 | 2019-06-30 | 2019-03-31 | 2018-12-31 | 2018-09-30 | 2018-06-30 | 2018-03-31 | 2017-12-31 | 2017-09-30 | 2017-06-30 | 2017-03-31 | 2016-12-31 | 2016-09-30 | 2016-06-30 | 2016-03-31 | 2015-12-31 | 2015-09-30 | 2015-06-30 | 2015-03-31 | ||
|---|---|---|---|---|---|---|---|---|---|---|---|---|---|---|---|---|---|---|---|---|---|---|---|---|---|---|---|---|---|---|---|---|---|---|---|---|
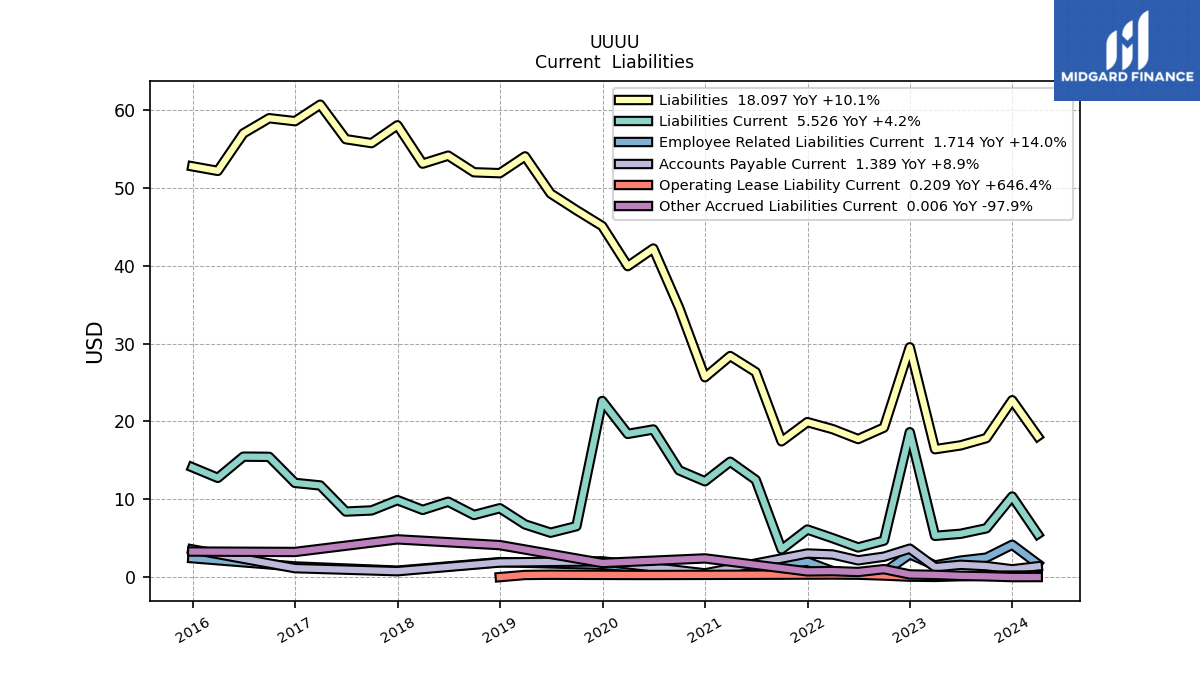
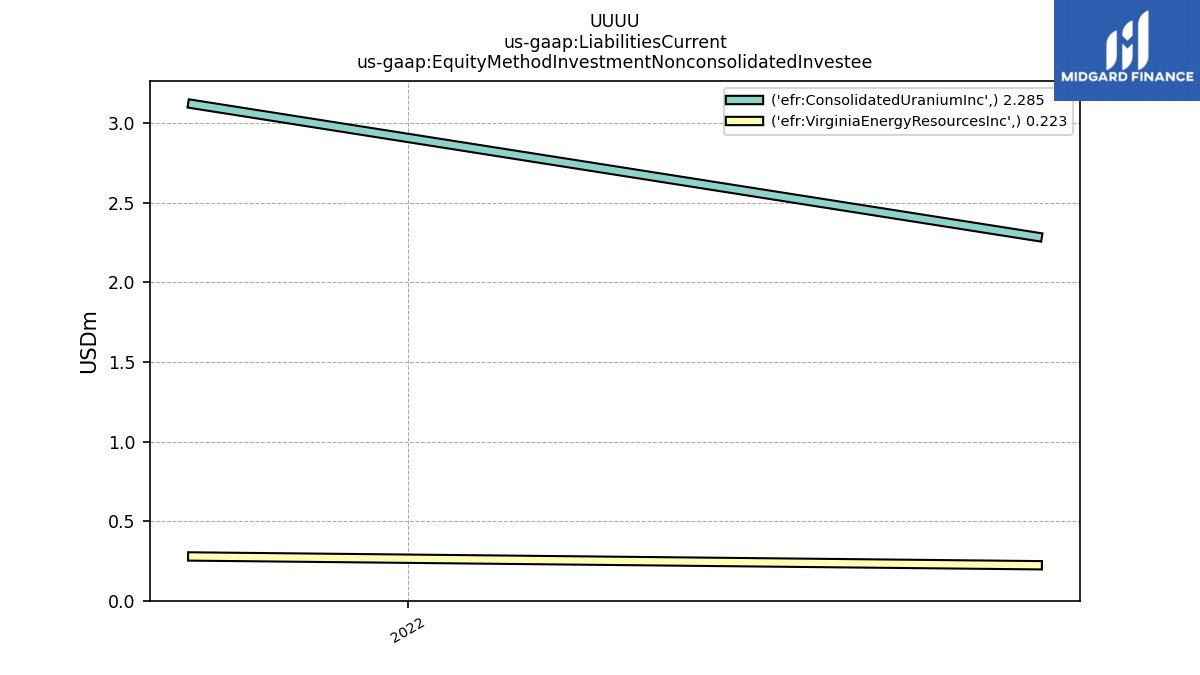
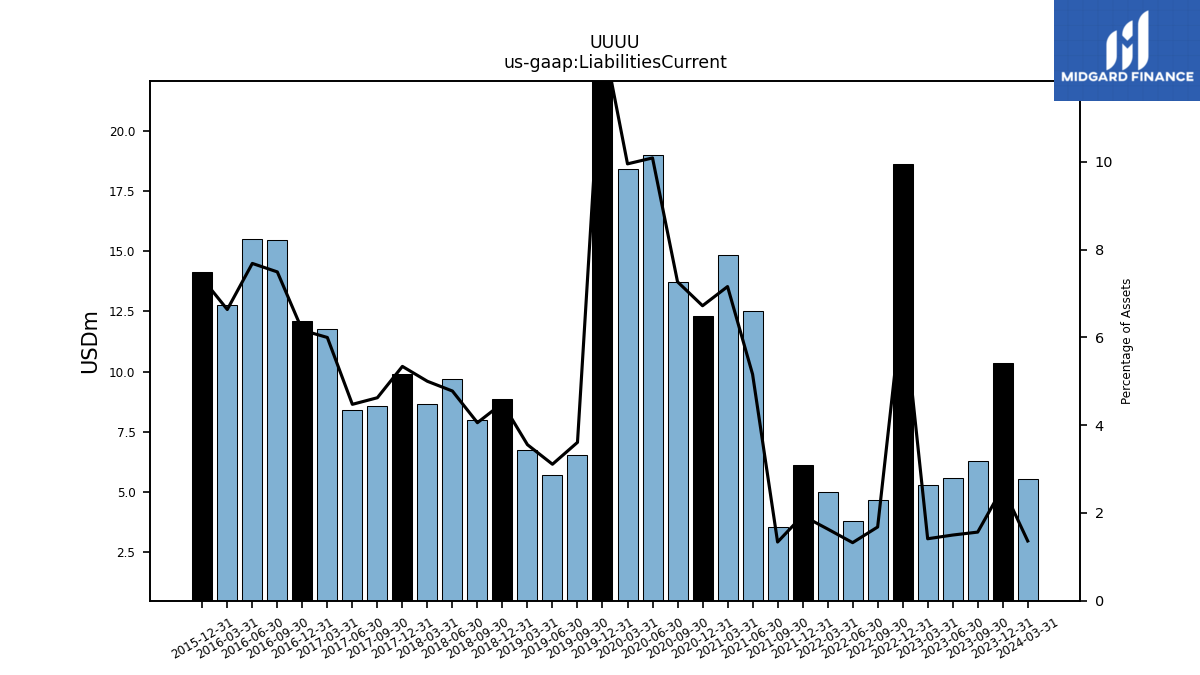
| Liabilities Current | 6.27 | 5.57 | 5.30 | 18.62 | 4.69 | 3.81 | 5.00 | 6.12 | 3.58 | 12.50 | 14.83 | 12.31 | 13.73 | 18.98 | 18.41 | 22.64 | 6.54 | 5.71 | 6.77 | 8.85 | 7.98 | 9.69 | 8.64 | 9.89 | 8.57 | 8.43 | 11.78 | 12.11 | 15.46 | 15.48 | 12.75 | 14.12 | NA | NA | NA | |
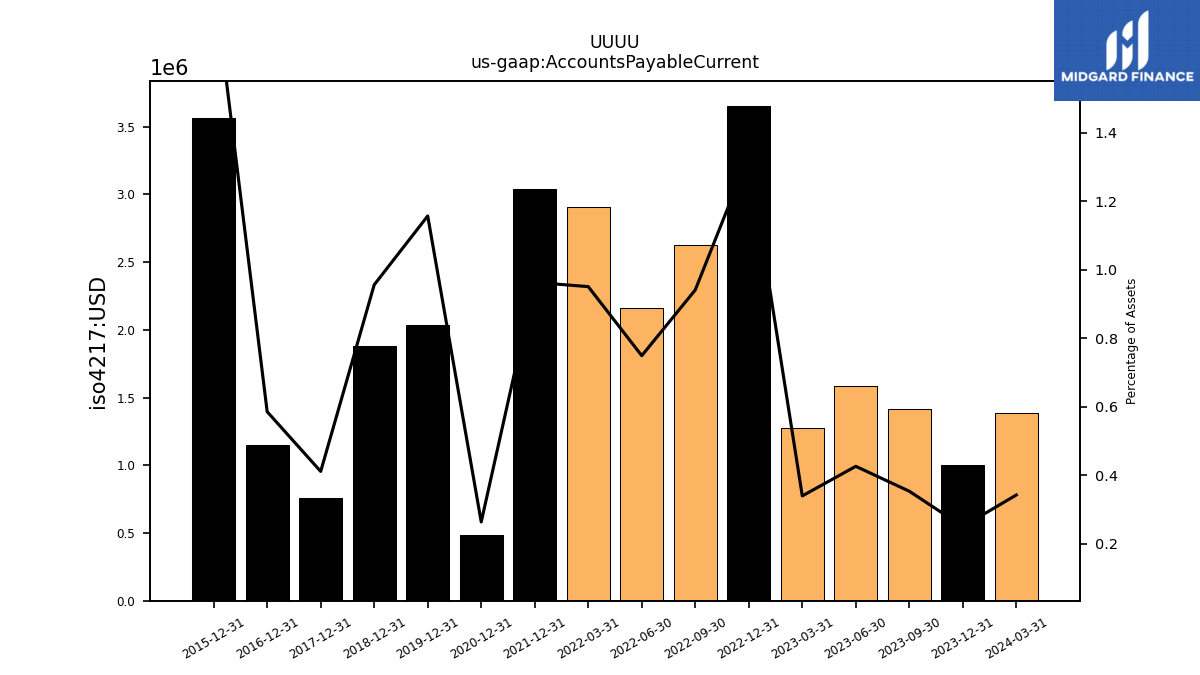
| Accounts Payable Current | 1.42 | 1.58 | 1.27 | 3.65 | 2.63 | 2.16 | 2.91 | 3.04 | NA | NA | NA | 0.48 | NA | NA | NA | 2.03 | NA | NA | NA | 1.88 | NA | NA | NA | 0.76 | NA | NA | NA | 1.15 | NA | NA | NA | 3.56 | NA | NA | NA | |
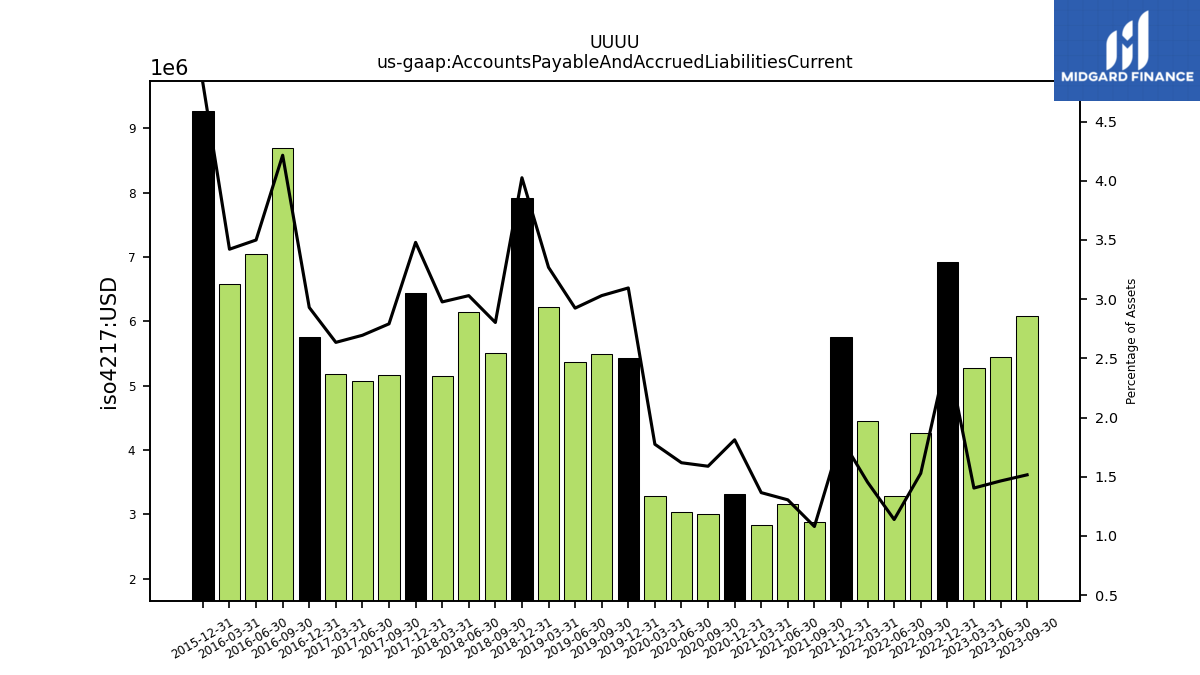
| Accounts Payable And Accrued Liabilities Current | 6.08 | 5.45 | 5.28 | 6.93 | 4.27 | 3.28 | 4.45 | 5.76 | 2.89 | 3.16 | 2.83 | 3.32 | 3.00 | 3.04 | 3.28 | 5.44 | 5.50 | 5.37 | 6.22 | 7.92 | 5.52 | 6.14 | 5.14 | 6.45 | 5.17 | 5.08 | 5.18 | 5.76 | 8.70 | 7.05 | 6.58 | 9.27 | NA | NA | NA | |
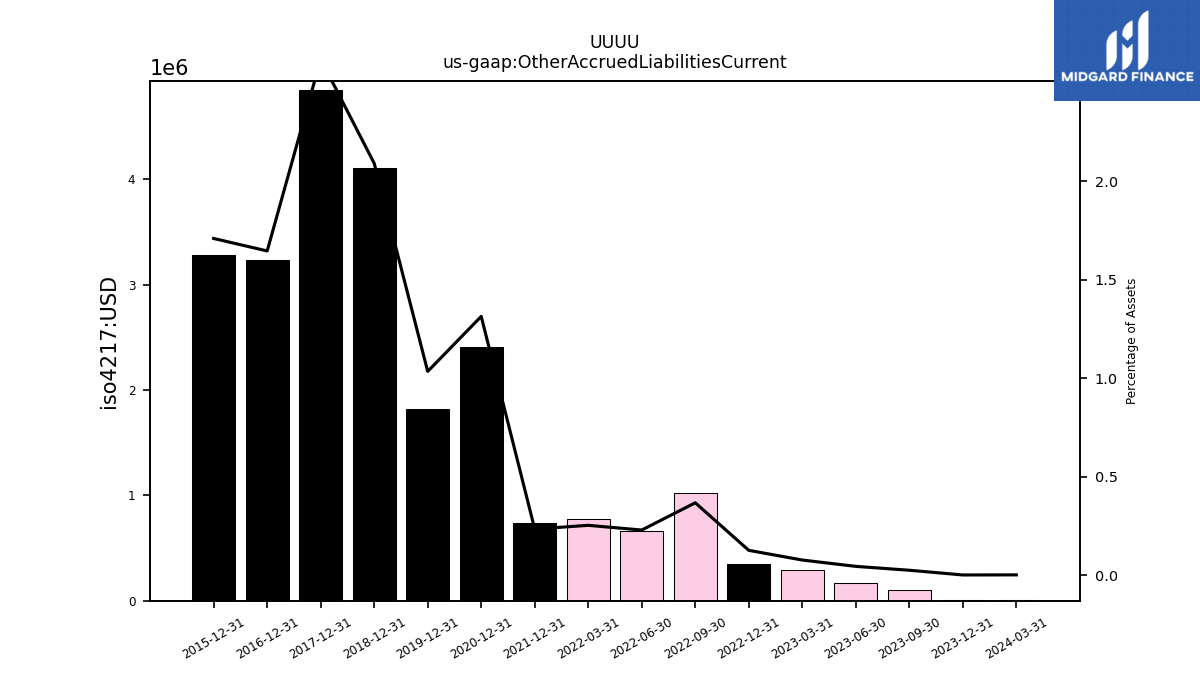
| Other Accrued Liabilities Current | 0.10 | 0.17 | 0.29 | 0.34 | 1.02 | 0.66 | 0.77 | 0.74 | NA | NA | NA | 2.41 | NA | NA | NA | 1.82 | NA | NA | NA | 4.11 | NA | NA | NA | 4.85 | NA | NA | NA | 3.23 | NA | NA | NA | 3.29 | NA | NA | NA | |
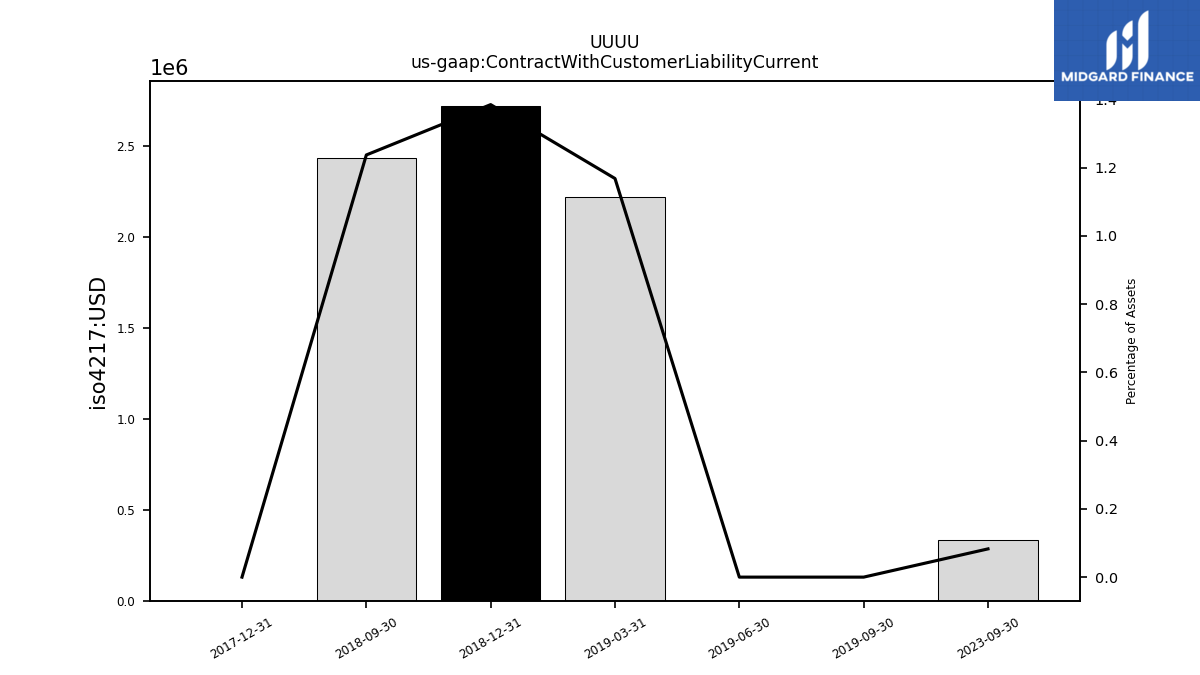
| Contract With Customer Liability Current | 0.33 | NA | NA | NA | NA | NA | NA | NA | NA | NA | NA | NA | NA | NA | NA | NA | 0.00 | 0.00 | 2.22 | 2.72 | 2.43 | NA | NA | 0.00 | NA | NA | NA | NA | NA | NA | NA | NA | NA | NA | NA |
| 2023-09-30 | 2023-06-30 | 2023-03-31 | 2022-12-31 | 2022-09-30 | 2022-06-30 | 2022-03-31 | 2021-12-31 | 2021-09-30 | 2021-06-30 | 2021-03-31 | 2020-12-31 | 2020-09-30 | 2020-06-30 | 2020-03-31 | 2019-12-31 | 2019-09-30 | 2019-06-30 | 2019-03-31 | 2018-12-31 | 2018-09-30 | 2018-06-30 | 2018-03-31 | 2017-12-31 | 2017-09-30 | 2017-06-30 | 2017-03-31 | 2016-12-31 | 2016-09-30 | 2016-06-30 | 2016-03-31 | 2015-12-31 | 2015-09-30 | 2015-06-30 | 2015-03-31 | ||
|---|---|---|---|---|---|---|---|---|---|---|---|---|---|---|---|---|---|---|---|---|---|---|---|---|---|---|---|---|---|---|---|---|---|---|---|---|
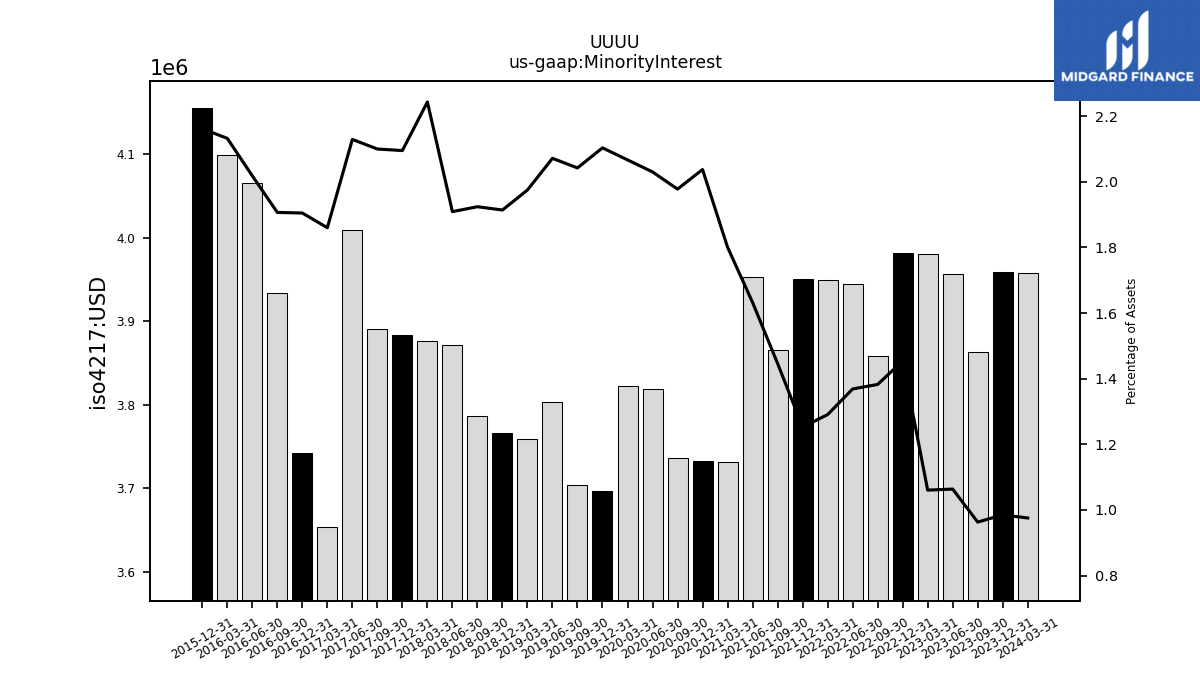
| Minority Interest | 3.86 | 3.96 | 3.98 | 3.98 | 3.86 | 3.94 | 3.95 | 3.95 | 3.87 | 3.95 | 3.73 | 3.73 | 3.74 | 3.82 | 3.82 | 3.70 | 3.70 | 3.80 | 3.76 | 3.77 | 3.79 | 3.87 | 3.88 | 3.88 | 3.89 | 4.01 | 3.65 | 3.74 | 3.93 | 4.07 | 4.10 | 4.16 | NA | NA | NA | |
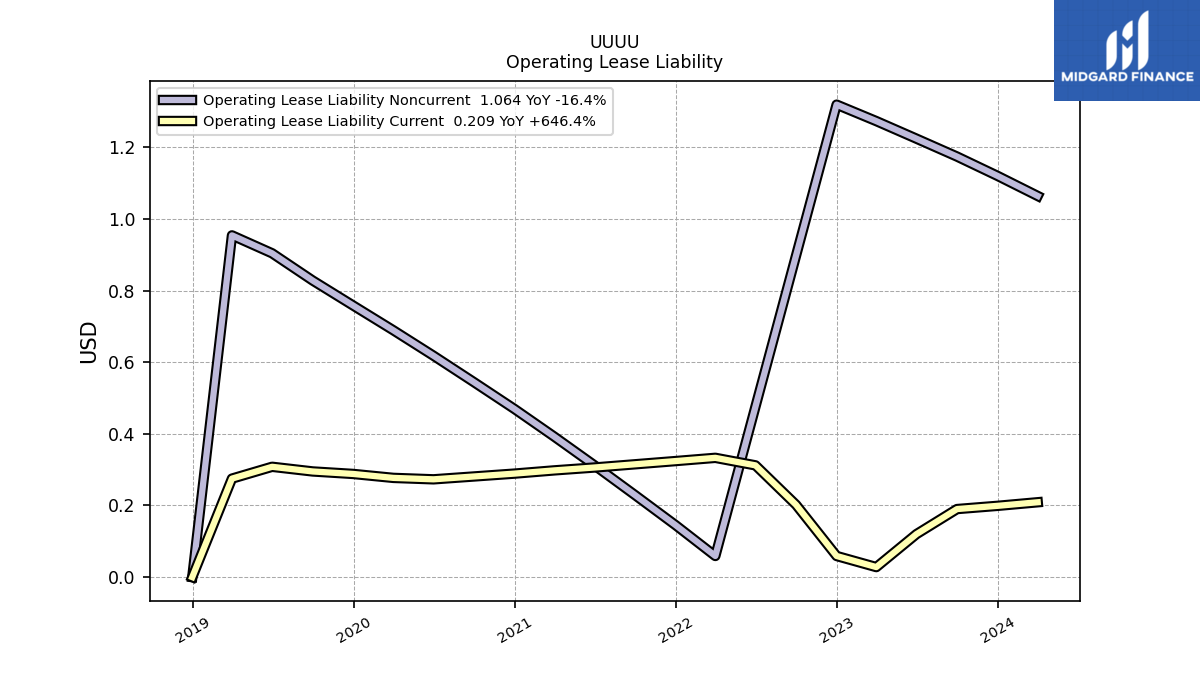
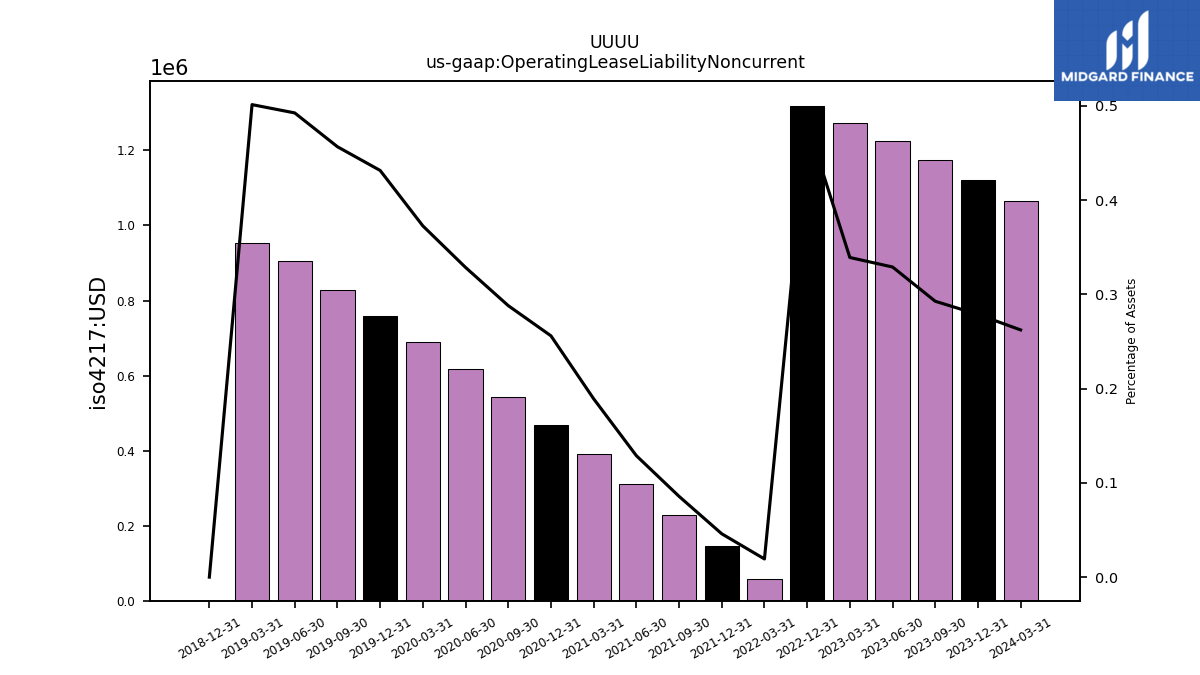
| Operating Lease Liability Noncurrent | 1.17 | 1.22 | 1.27 | 1.32 | NA | NA | 0.06 | 0.14 | 0.23 | 0.31 | 0.39 | 0.47 | 0.54 | 0.62 | 0.69 | 0.76 | 0.83 | 0.90 | 0.95 | 0.00 | NA | NA | NA | NA | NA | NA | NA | NA | NA | NA | NA | NA | NA | NA | NA |
| 2023-09-30 | 2023-06-30 | 2023-03-31 | 2022-12-31 | 2022-09-30 | 2022-06-30 | 2022-03-31 | 2021-12-31 | 2021-09-30 | 2021-06-30 | 2021-03-31 | 2020-12-31 | 2020-09-30 | 2020-06-30 | 2020-03-31 | 2019-12-31 | 2019-09-30 | 2019-06-30 | 2019-03-31 | 2018-12-31 | 2018-09-30 | 2018-06-30 | 2018-03-31 | 2017-12-31 | 2017-09-30 | 2017-06-30 | 2017-03-31 | 2016-12-31 | 2016-09-30 | 2016-06-30 | 2016-03-31 | 2015-12-31 | 2015-09-30 | 2015-06-30 | 2015-03-31 | ||
|---|---|---|---|---|---|---|---|---|---|---|---|---|---|---|---|---|---|---|---|---|---|---|---|---|---|---|---|---|---|---|---|---|---|---|---|---|
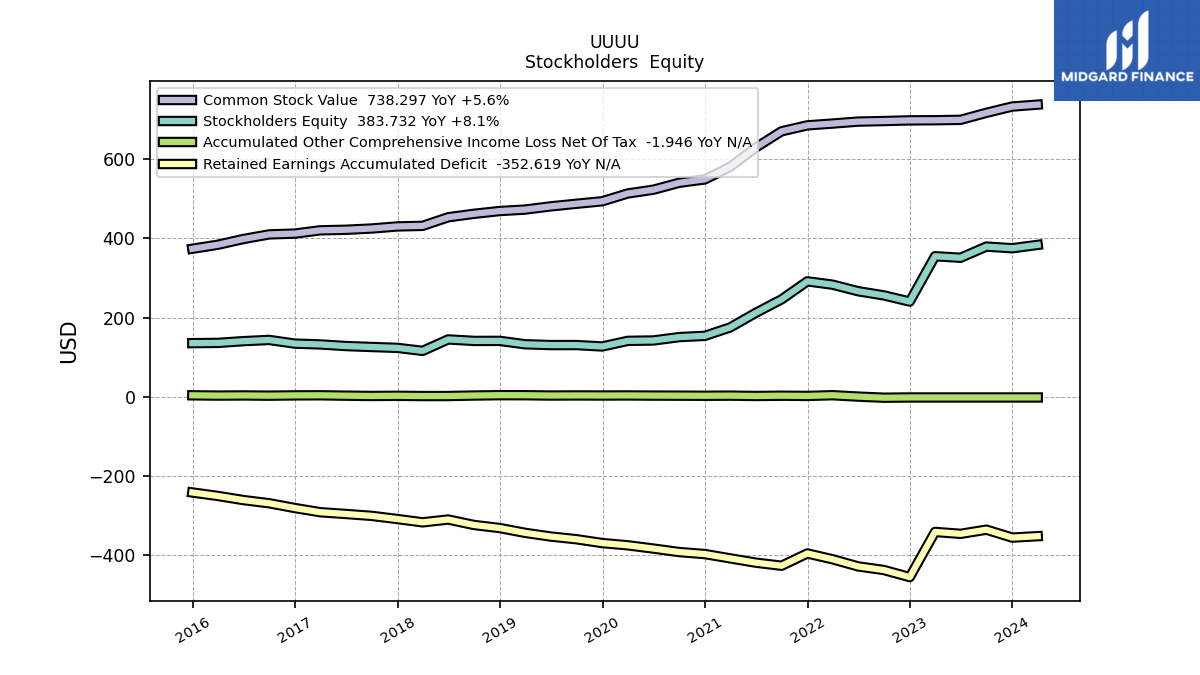
| Stockholders Equity | 379.46 | 351.19 | 355.03 | 240.43 | 256.01 | 266.57 | 283.13 | 291.57 | 245.97 | 211.88 | 175.08 | 153.81 | 150.55 | 142.08 | 141.14 | 126.91 | 130.51 | 130.49 | 132.51 | 141.09 | 140.97 | 144.74 | 115.78 | 123.39 | 125.63 | 128.01 | 132.08 | 134.12 | 143.42 | 140.38 | 135.92 | 135.33 | NA | NA | NA | |
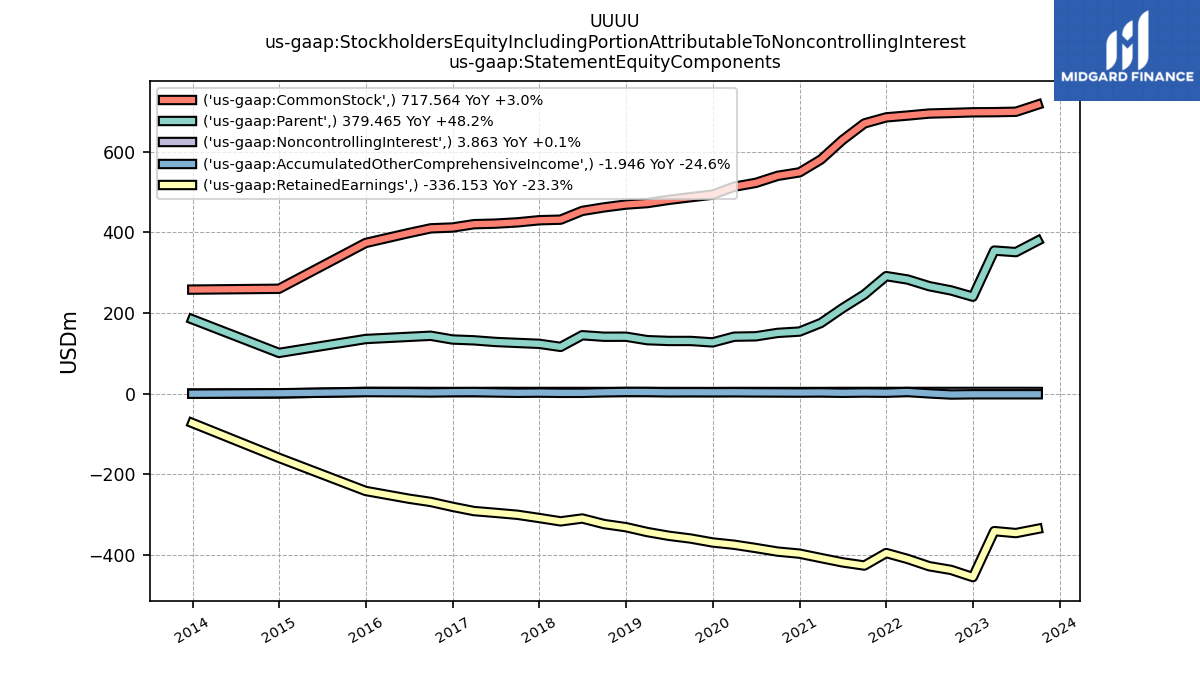
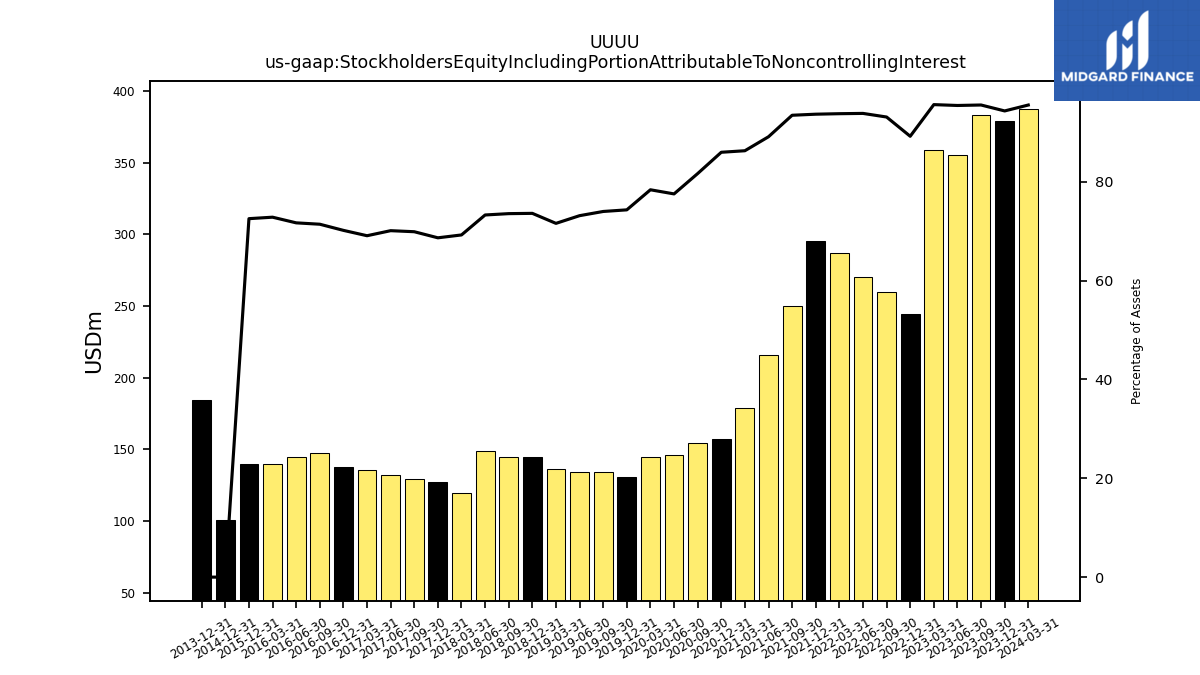
| Stockholders Equity Including Portion Attributable To Noncontrolling Interest | 383.33 | 355.15 | 359.01 | 244.41 | 259.86 | 270.52 | 287.08 | 295.53 | 249.83 | 215.83 | 178.81 | 157.55 | 154.28 | 145.90 | 144.96 | 130.61 | 134.21 | 134.29 | 136.27 | 144.85 | 144.75 | 148.61 | 119.66 | 127.27 | 129.53 | 132.02 | 135.73 | 137.86 | 147.36 | 144.44 | 140.02 | 139.49 | NA | NA | NA | |
| Common Stock Value | 717.56 | 699.85 | 698.83 | 698.49 | 696.81 | 695.40 | 690.42 | 685.90 | 670.86 | 629.62 | 581.13 | 549.32 | 540.69 | 523.20 | 513.69 | 493.96 | 487.67 | 481.05 | 472.99 | 469.30 | 462.32 | 453.56 | 431.82 | 430.38 | 425.12 | 421.95 | 420.56 | 412.33 | 410.24 | 398.56 | 384.05 | 373.93 | NA | NA | NA | |
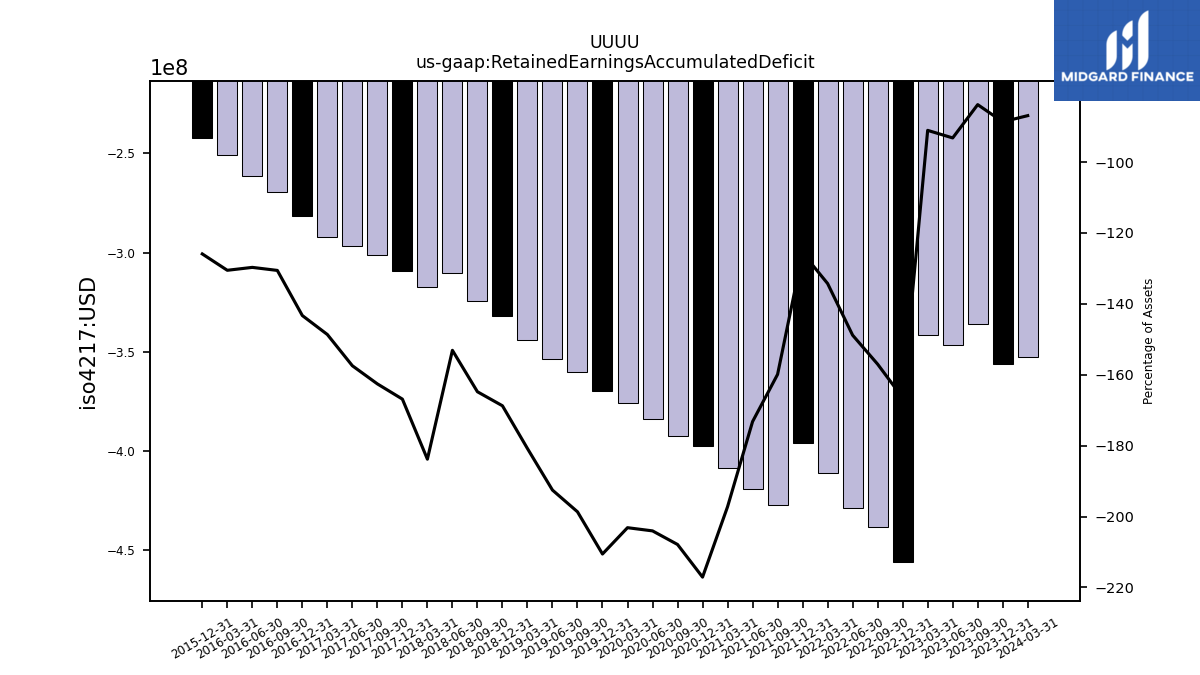
| Retained Earnings Accumulated Deficit | -336.15 | -346.72 | -341.86 | -456.12 | -438.22 | -429.05 | -411.00 | -396.27 | -427.37 | -419.50 | -408.72 | -397.81 | -392.74 | -383.88 | -375.69 | -370.04 | -360.34 | -353.50 | -344.19 | -332.06 | -324.30 | -310.49 | -317.63 | -309.29 | -301.26 | -296.50 | -292.03 | -281.52 | -269.40 | -261.32 | -250.92 | -242.11 | NA | NA | NA | |
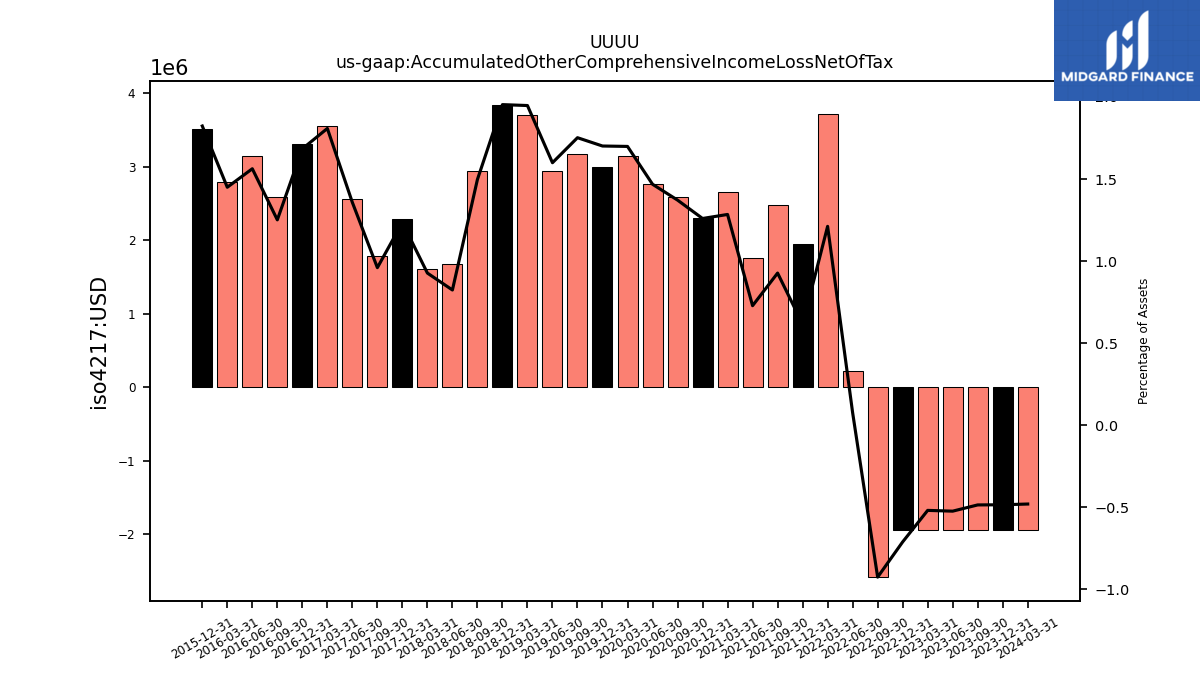
| Accumulated Other Comprehensive Income Loss Net Of Tax | -1.95 | -1.95 | -1.95 | -1.95 | -2.58 | 0.22 | 3.71 | 1.94 | 2.48 | 1.76 | 2.66 | 2.31 | 2.59 | 2.76 | 3.14 | 2.99 | 3.18 | 2.94 | 3.71 | 3.84 | 2.95 | 1.67 | 1.60 | 2.29 | 1.78 | 2.56 | 3.55 | 3.31 | 2.58 | 3.15 | 2.79 | 3.50 | NA | NA | NA | |
| Minority Interest | 3.86 | 3.96 | 3.98 | 3.98 | 3.86 | 3.94 | 3.95 | 3.95 | 3.87 | 3.95 | 3.73 | 3.73 | 3.74 | 3.82 | 3.82 | 3.70 | 3.70 | 3.80 | 3.76 | 3.77 | 3.79 | 3.87 | 3.88 | 3.88 | 3.89 | 4.01 | 3.65 | 3.74 | 3.93 | 4.07 | 4.10 | 4.16 | NA | NA | NA |
| 2023-09-30 | 2023-06-30 | 2023-03-31 | 2022-12-31 | 2022-09-30 | 2022-06-30 | 2022-03-31 | 2021-12-31 | 2021-09-30 | 2021-06-30 | 2021-03-31 | 2020-12-31 | 2020-09-30 | 2020-06-30 | 2020-03-31 | 2019-12-31 | 2019-09-30 | 2019-06-30 | 2019-03-31 | 2018-12-31 | 2018-09-30 | 2018-06-30 | 2018-03-31 | 2017-12-31 | 2017-09-30 | 2017-06-30 | 2017-03-31 | 2016-12-31 | 2016-09-30 | 2016-06-30 | 2016-03-31 | 2015-12-31 | 2015-09-30 | 2015-06-30 | 2015-03-31 | ||
|---|---|---|---|---|---|---|---|---|---|---|---|---|---|---|---|---|---|---|---|---|---|---|---|---|---|---|---|---|---|---|---|---|---|---|---|---|
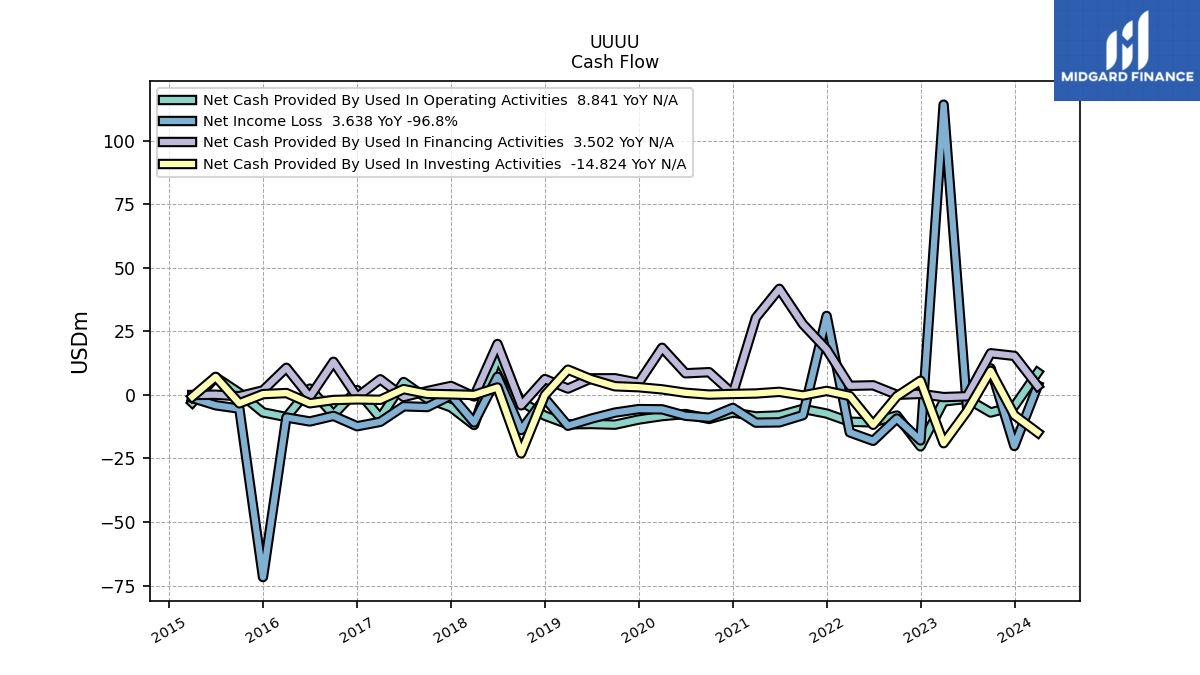
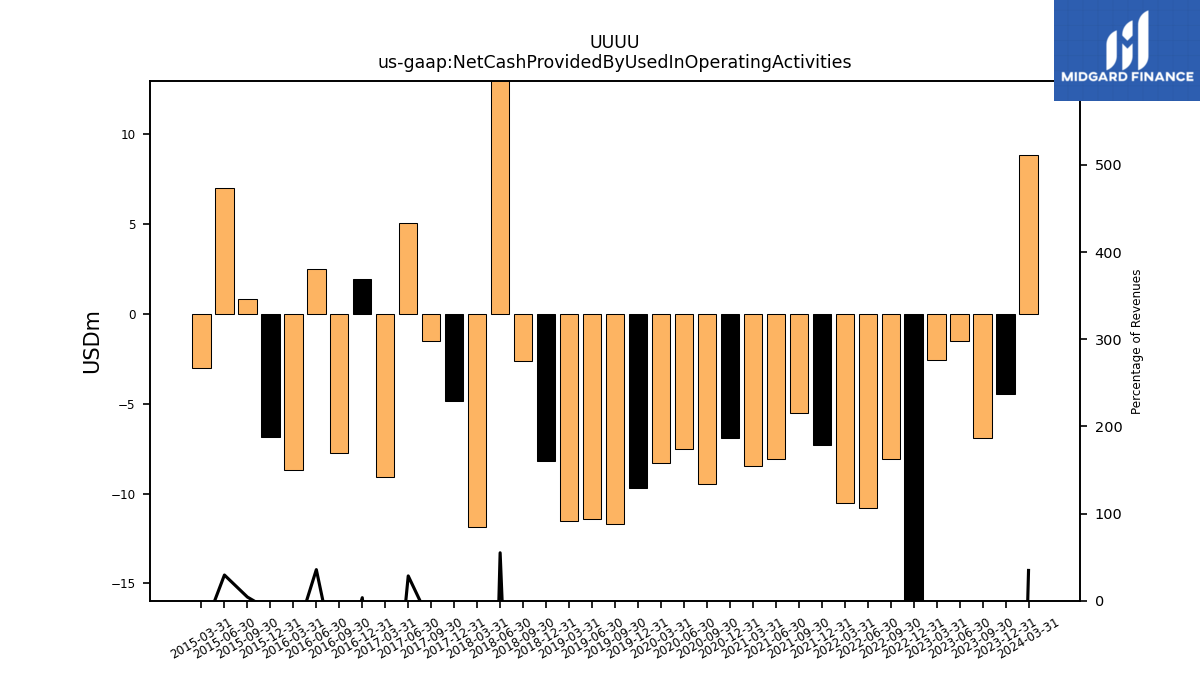
| Net Cash Provided By Used In Operating Activities | -6.91 | -1.49 | -2.58 | -20.25 | -8.10 | -10.81 | -10.55 | -7.31 | -5.49 | -8.05 | -8.45 | -6.90 | -9.45 | -7.51 | -8.32 | -9.68 | -11.71 | -11.44 | -11.55 | -8.17 | -2.62 | 14.85 | -11.83 | -4.87 | -1.49 | 5.09 | -9.08 | 1.93 | -7.76 | 2.50 | -8.70 | -6.86 | 0.81 | 7.00 | -3.03 | |
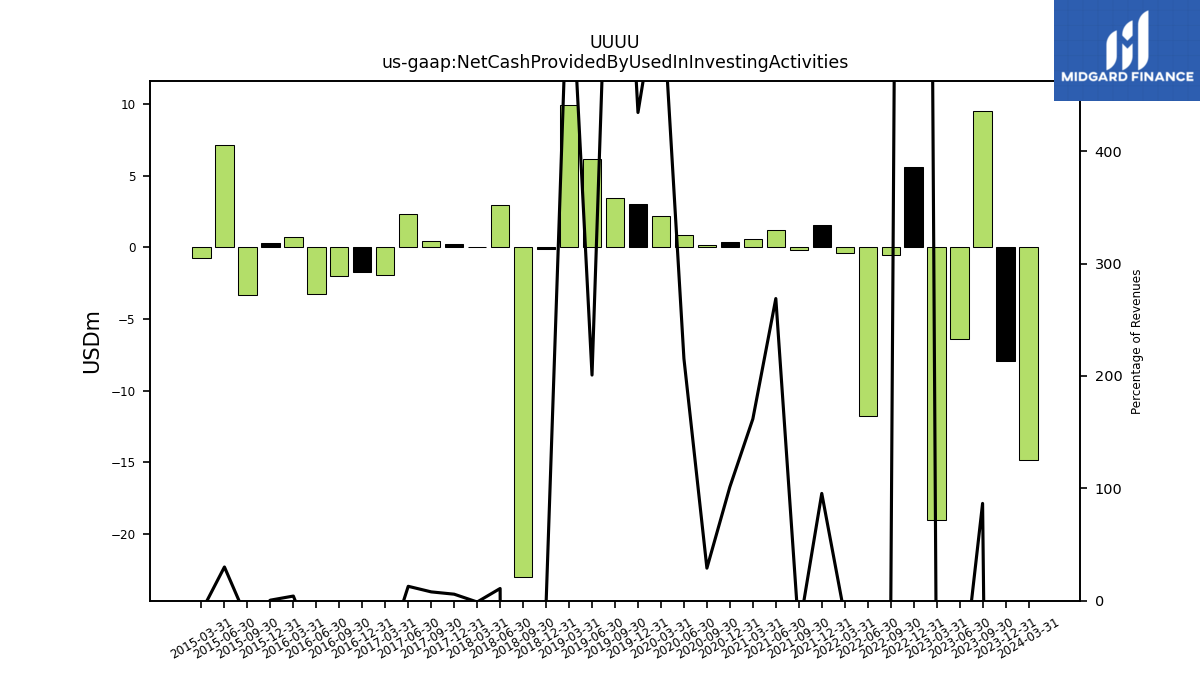
| Net Cash Provided By Used In Investing Activities | 9.52 | -6.41 | -19.00 | 5.61 | -0.53 | -11.74 | -0.40 | 1.58 | -0.20 | 1.23 | 0.57 | 0.39 | 0.14 | 0.85 | 2.20 | 3.04 | 3.41 | 6.17 | 9.95 | -0.09 | -23.00 | 2.94 | -0.01 | 0.23 | 0.43 | 2.30 | -1.91 | -1.74 | -1.99 | -3.29 | 0.75 | 0.32 | -3.30 | 7.12 | -0.72 | |
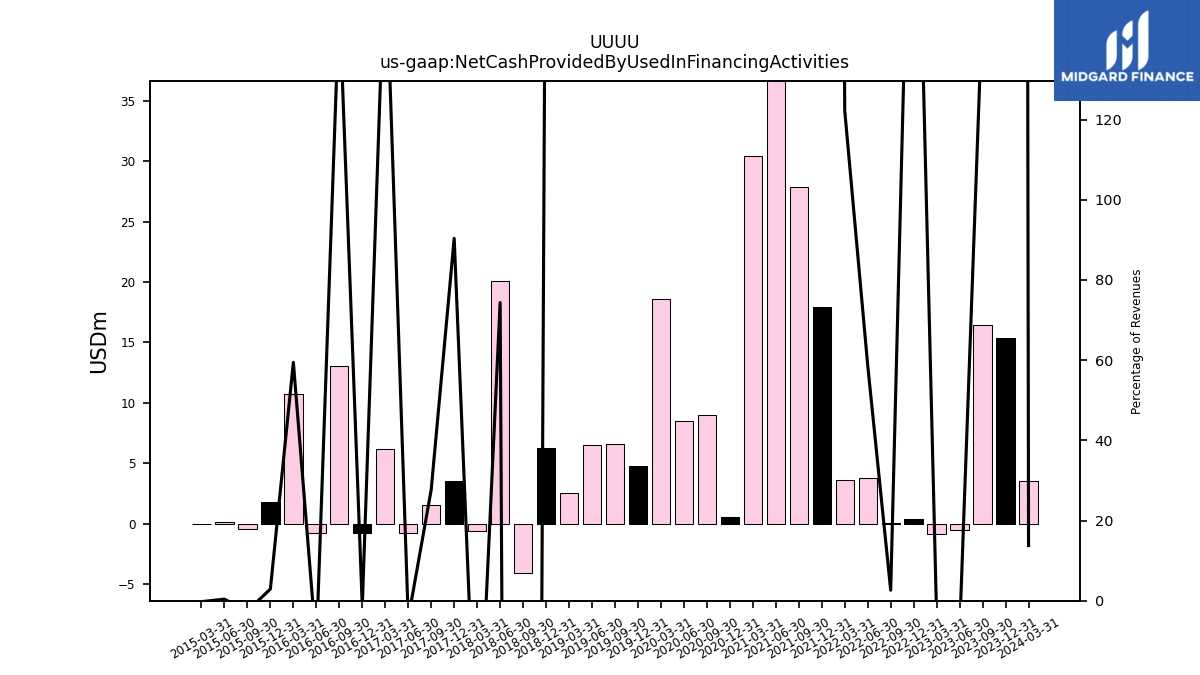
| Net Cash Provided By Used In Financing Activities | 16.42 | -0.54 | -0.85 | 0.41 | 0.08 | 3.80 | 3.59 | 17.95 | 27.83 | 41.77 | 30.39 | 0.53 | 8.96 | 8.52 | 18.57 | 4.74 | 6.57 | 6.54 | 2.51 | 6.26 | -4.10 | 20.06 | -0.60 | 3.53 | 1.52 | -0.81 | 6.18 | -0.78 | 13.05 | -0.80 | 10.70 | 1.80 | -0.49 | 0.10 | -0.02 |
| 2023-09-30 | 2023-06-30 | 2023-03-31 | 2022-12-31 | 2022-09-30 | 2022-06-30 | 2022-03-31 | 2021-12-31 | 2021-09-30 | 2021-06-30 | 2021-03-31 | 2020-12-31 | 2020-09-30 | 2020-06-30 | 2020-03-31 | 2019-12-31 | 2019-09-30 | 2019-06-30 | 2019-03-31 | 2018-12-31 | 2018-09-30 | 2018-06-30 | 2018-03-31 | 2017-12-31 | 2017-09-30 | 2017-06-30 | 2017-03-31 | 2016-12-31 | 2016-09-30 | 2016-06-30 | 2016-03-31 | 2015-12-31 | 2015-09-30 | 2015-06-30 | 2015-03-31 | ||
|---|---|---|---|---|---|---|---|---|---|---|---|---|---|---|---|---|---|---|---|---|---|---|---|---|---|---|---|---|---|---|---|---|---|---|---|---|
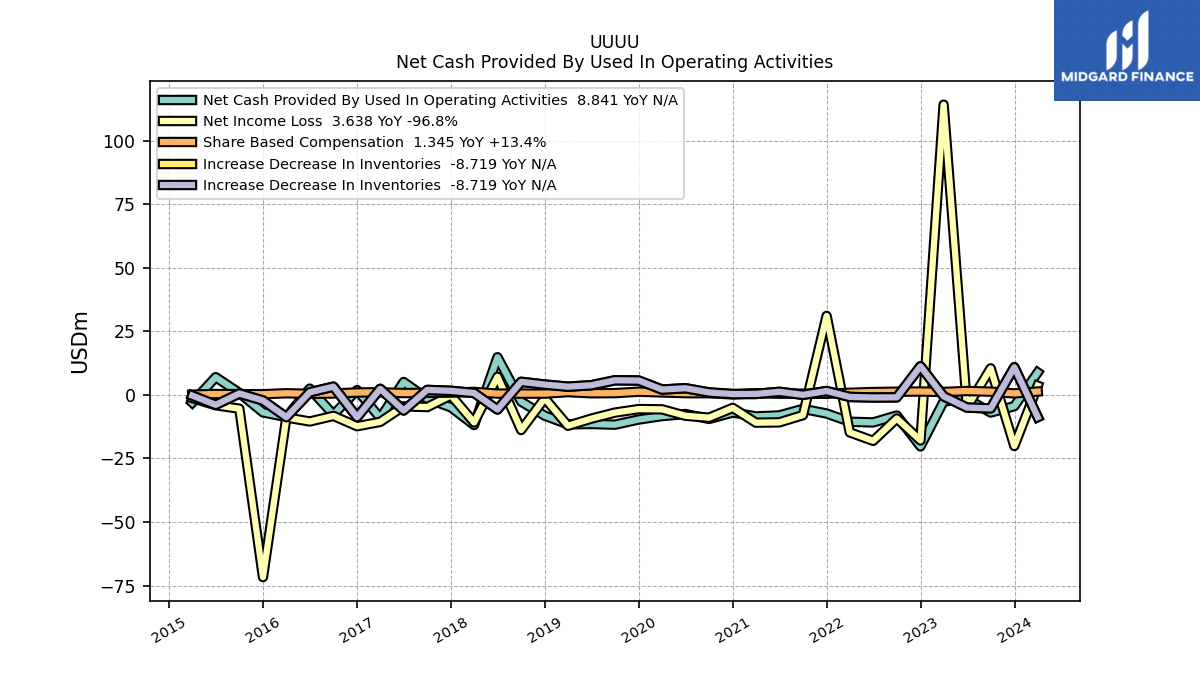
| Net Cash Provided By Used In Operating Activities | -6.91 | -1.49 | -2.58 | -20.25 | -8.10 | -10.81 | -10.55 | -7.31 | -5.49 | -8.05 | -8.45 | -6.90 | -9.45 | -7.51 | -8.32 | -9.68 | -11.71 | -11.44 | -11.55 | -8.17 | -2.62 | 14.85 | -11.83 | -4.87 | -1.49 | 5.09 | -9.08 | 1.93 | -7.76 | 2.50 | -8.70 | -6.86 | 0.81 | 7.00 | -3.03 | |
| Net Income Loss | 10.47 | -4.88 | 114.26 | -17.90 | -9.25 | -18.06 | -14.73 | 31.11 | -7.96 | -10.79 | -10.91 | -5.08 | -8.94 | -8.19 | -5.66 | -5.57 | -6.94 | -9.31 | -12.13 | -1.32 | -13.81 | 7.15 | -10.82 | -0.14 | -4.77 | -4.47 | -10.60 | -12.31 | -8.24 | -10.44 | -8.87 | -71.70 | -5.39 | -4.06 | -1.20 | |
| Profit Loss | 10.56 | -4.86 | 114.27 | NA | -9.17 | -18.05 | -14.73 | NA | -7.87 | -10.78 | -10.91 | NA | -8.86 | -8.19 | -5.66 | NA | -6.84 | -9.31 | -12.13 | NA | -13.90 | 7.14 | -10.83 | NA | -4.88 | -4.48 | -10.60 | NA | -8.24 | -10.44 | NA | NA | NA | NA | NA | |
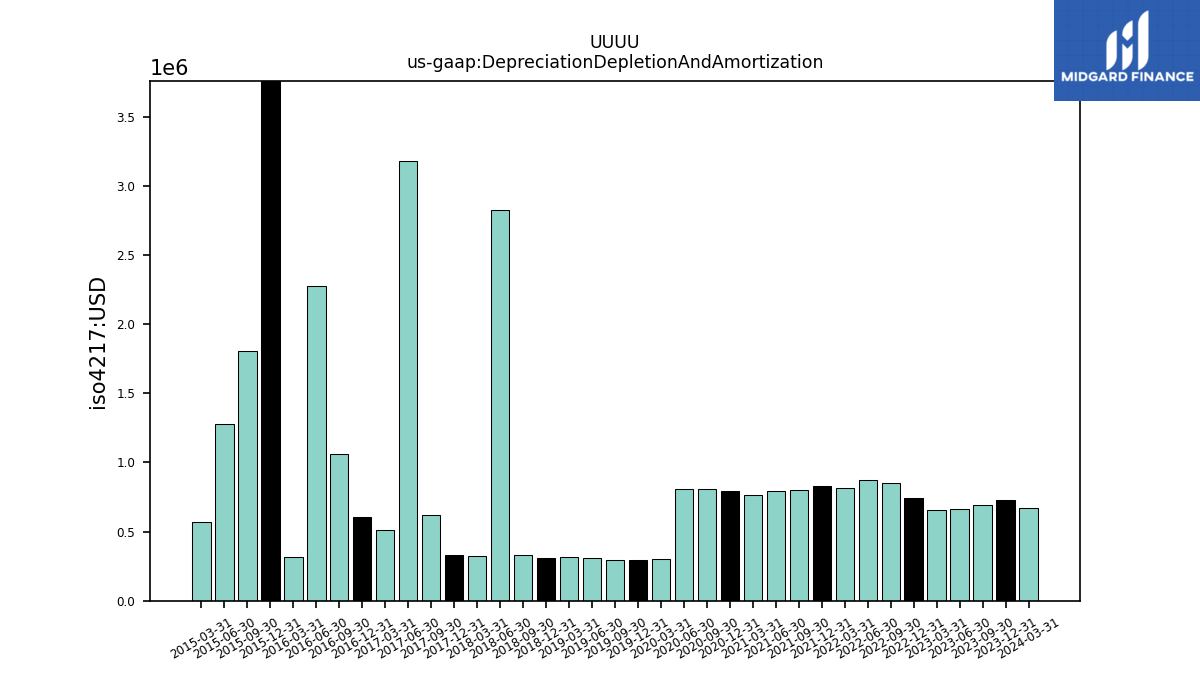
| Depreciation Depletion And Amortization | 0.69 | 0.66 | 0.66 | 0.74 | 0.85 | 0.87 | 0.81 | 0.83 | 0.80 | 0.79 | 0.77 | 0.79 | 0.81 | 0.81 | 0.30 | 0.29 | 0.30 | 0.31 | 0.31 | 0.31 | 0.33 | 2.82 | 0.33 | 0.33 | 0.62 | 3.18 | 0.51 | 0.61 | 1.06 | 2.27 | 0.32 | 4.13 | 1.81 | 1.28 | 0.57 | |
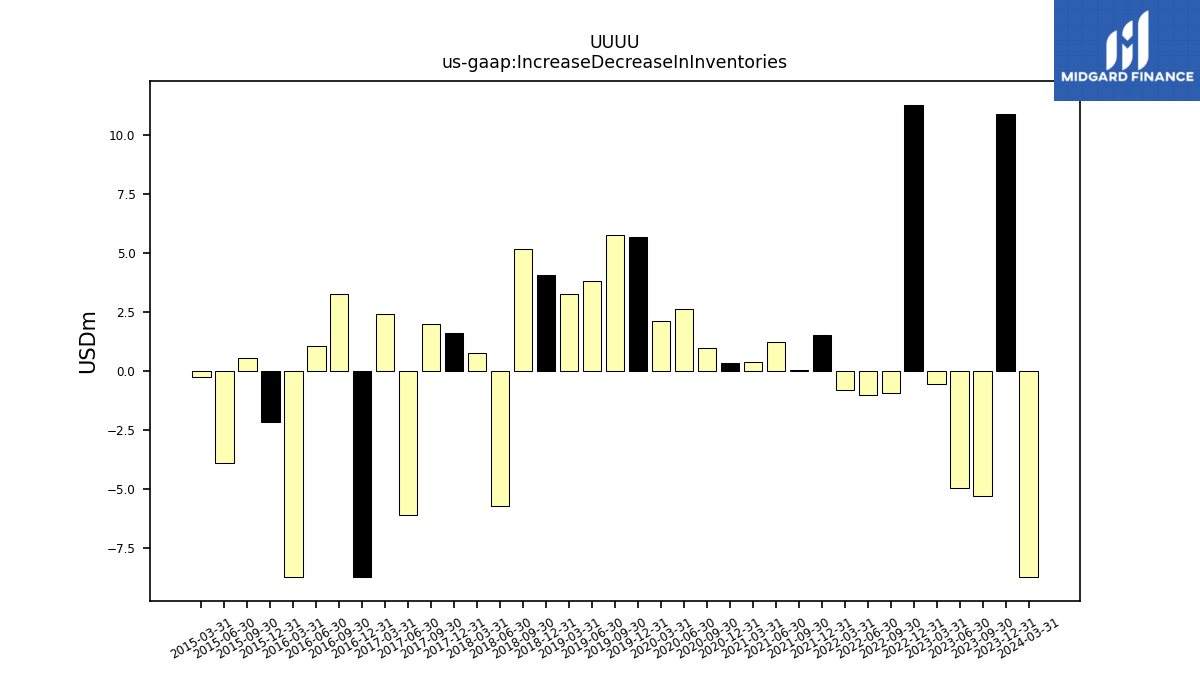
| Increase Decrease In Inventories | -5.29 | -4.98 | -0.54 | 11.30 | -0.94 | -1.00 | -0.78 | 1.55 | 0.04 | 1.23 | 0.40 | 0.35 | 0.98 | 2.64 | 2.12 | 5.68 | 5.78 | 3.83 | 3.25 | 4.08 | 5.17 | -5.73 | 0.78 | 1.63 | 1.98 | -6.10 | 2.42 | -8.74 | 3.26 | 1.05 | -8.74 | -2.18 | 0.56 | -3.89 | -0.24 | |
| Share Based Compensation | 1.29 | 1.55 | 1.19 | 1.35 | 1.28 | 1.15 | 0.86 | 0.46 | 0.51 | 0.49 | 0.70 | 0.23 | 0.67 | 0.70 | 1.00 | 1.27 | 0.71 | 0.66 | 1.12 | 0.52 | 0.52 | 0.52 | 1.20 | 0.91 | 0.83 | 0.74 | 1.04 | 0.97 | 0.58 | 0.45 | 0.67 | 0.29 | 0.31 | 0.37 | 0.12 |
| 2023-09-30 | 2023-06-30 | 2023-03-31 | 2022-12-31 | 2022-09-30 | 2022-06-30 | 2022-03-31 | 2021-12-31 | 2021-09-30 | 2021-06-30 | 2021-03-31 | 2020-12-31 | 2020-09-30 | 2020-06-30 | 2020-03-31 | 2019-12-31 | 2019-09-30 | 2019-06-30 | 2019-03-31 | 2018-12-31 | 2018-09-30 | 2018-06-30 | 2018-03-31 | 2017-12-31 | 2017-09-30 | 2017-06-30 | 2017-03-31 | 2016-12-31 | 2016-09-30 | 2016-06-30 | 2016-03-31 | 2015-12-31 | 2015-09-30 | 2015-06-30 | 2015-03-31 | ||
|---|---|---|---|---|---|---|---|---|---|---|---|---|---|---|---|---|---|---|---|---|---|---|---|---|---|---|---|---|---|---|---|---|---|---|---|---|
| Net Cash Provided By Used In Investing Activities | 9.52 | -6.41 | -19.00 | 5.61 | -0.53 | -11.74 | -0.40 | 1.58 | -0.20 | 1.23 | 0.57 | 0.39 | 0.14 | 0.85 | 2.20 | 3.04 | 3.41 | 6.17 | 9.95 | -0.09 | -23.00 | 2.94 | -0.01 | 0.23 | 0.43 | 2.30 | -1.91 | -1.74 | -1.99 | -3.29 | 0.75 | 0.32 | -3.30 | 7.12 | -0.72 |
| 2023-09-30 | 2023-06-30 | 2023-03-31 | 2022-12-31 | 2022-09-30 | 2022-06-30 | 2022-03-31 | 2021-12-31 | 2021-09-30 | 2021-06-30 | 2021-03-31 | 2020-12-31 | 2020-09-30 | 2020-06-30 | 2020-03-31 | 2019-12-31 | 2019-09-30 | 2019-06-30 | 2019-03-31 | 2018-12-31 | 2018-09-30 | 2018-06-30 | 2018-03-31 | 2017-12-31 | 2017-09-30 | 2017-06-30 | 2017-03-31 | 2016-12-31 | 2016-09-30 | 2016-06-30 | 2016-03-31 | 2015-12-31 | 2015-09-30 | 2015-06-30 | 2015-03-31 | ||
|---|---|---|---|---|---|---|---|---|---|---|---|---|---|---|---|---|---|---|---|---|---|---|---|---|---|---|---|---|---|---|---|---|---|---|---|---|
| Net Cash Provided By Used In Financing Activities | 16.42 | -0.54 | -0.85 | 0.41 | 0.08 | 3.80 | 3.59 | 17.95 | 27.83 | 41.77 | 30.39 | 0.53 | 8.96 | 8.52 | 18.57 | 4.74 | 6.57 | 6.54 | 2.51 | 6.26 | -4.10 | 20.06 | -0.60 | 3.53 | 1.52 | -0.81 | 6.18 | -0.78 | 13.05 | -0.80 | 10.70 | 1.80 | -0.49 | 0.10 | -0.02 |
| 2023-09-30 | 2023-06-30 | 2023-03-31 | 2022-12-31 | 2022-09-30 | 2022-06-30 | 2022-03-31 | 2021-12-31 | 2021-09-30 | 2021-06-30 | 2021-03-31 | 2020-12-31 | 2020-09-30 | 2020-06-30 | 2020-03-31 | 2019-12-31 | 2019-09-30 | 2019-06-30 | 2019-03-31 | 2018-12-31 | 2018-09-30 | 2018-06-30 | 2018-03-31 | 2017-12-31 | 2017-09-30 | 2017-06-30 | 2017-03-31 | 2016-12-31 | 2016-09-30 | 2016-06-30 | 2016-03-31 | 2015-12-31 | 2015-09-30 | 2015-06-30 | 2015-03-31 | ||
|---|---|---|---|---|---|---|---|---|---|---|---|---|---|---|---|---|---|---|---|---|---|---|---|---|---|---|---|---|---|---|---|---|---|---|---|---|
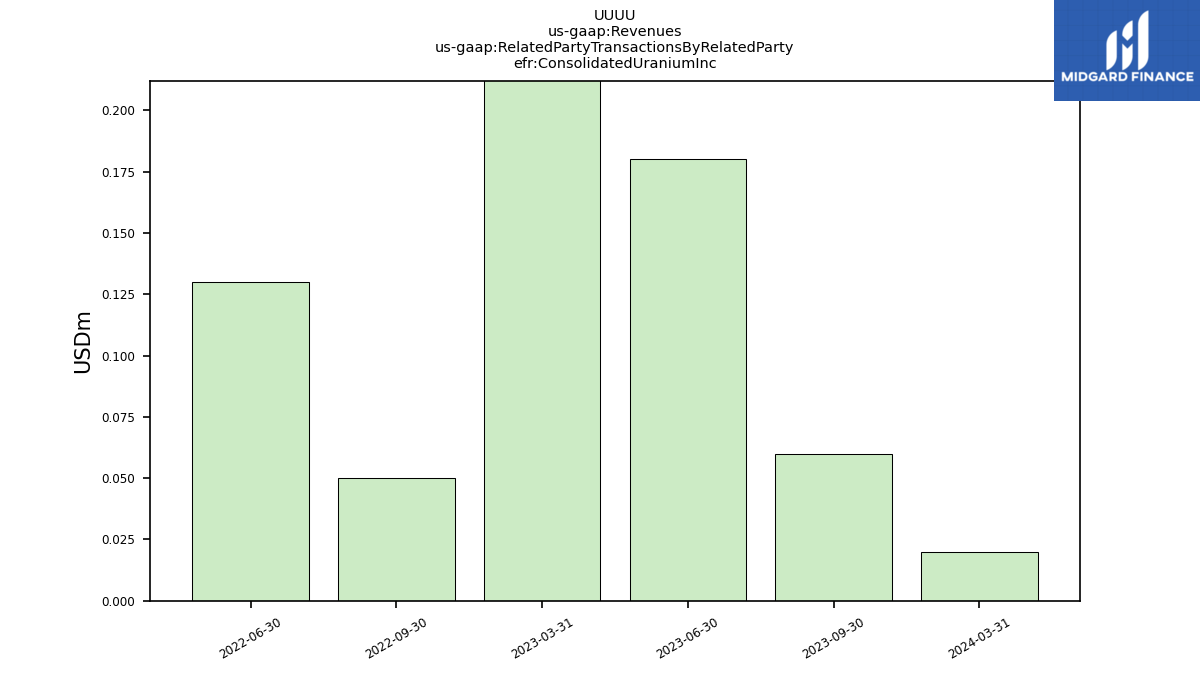
| Revenues | 10.99 | 6.86 | 19.61 | 0.18 | 2.93 | 6.47 | 2.94 | 1.66 | 0.71 | 0.46 | 0.35 | 0.38 | 0.49 | 0.40 | 0.39 | 0.70 | 0.42 | 3.07 | 1.67 | 3.04 | 0.45 | 26.97 | 1.25 | 3.91 | 5.50 | 17.88 | 3.76 | 54.55 | 8.70 | 7.01 | 18.00 | 61.35 | 19.16 | 23.70 | 7.60 | |
| Consolidated Uranium Inc | 0.06 | 0.18 | NA | NA | 0.05 | 0.13 | NA | NA | NA | NA | NA | NA | NA | NA | NA | NA | NA | NA | NA | NA | NA | NA | NA | NA | NA | NA | NA | NA | NA | NA | NA | NA | NA | NA | NA |


