
| 2023-12-31 | 2023-09-30 | 2023-06-30 | 2023-03-31 | 2022-12-31 | 2022-09-30 | 2022-06-30 | 2022-03-31 | 2021-12-31 | 2021-09-30 | 2021-06-30 | 2021-03-31 | 2020-12-31 | 2020-09-30 | 2020-06-30 | 2020-03-31 | 2019-12-31 | 2019-09-30 | 2019-06-30 | 2019-03-31 | 2018-12-31 | 2018-09-30 | 2018-06-30 | 2018-03-31 | 2017-12-31 | 2017-09-30 | 2017-06-30 | ||
|---|---|---|---|---|---|---|---|---|---|---|---|---|---|---|---|---|---|---|---|---|---|---|---|---|---|---|---|---|
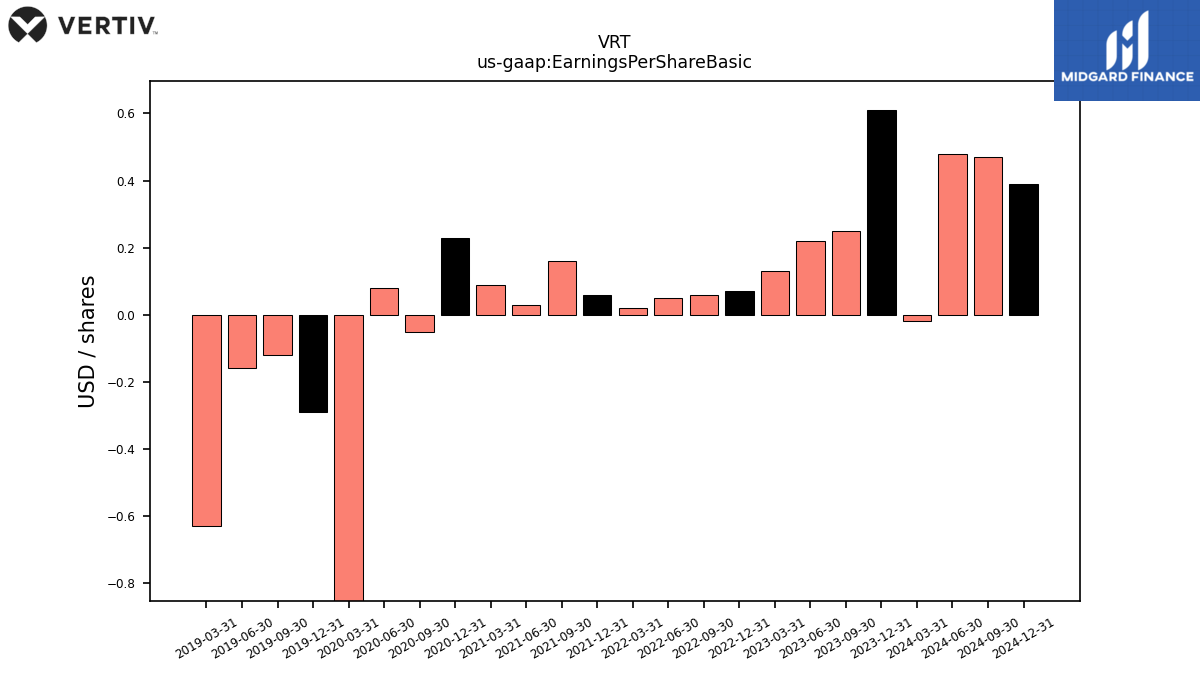
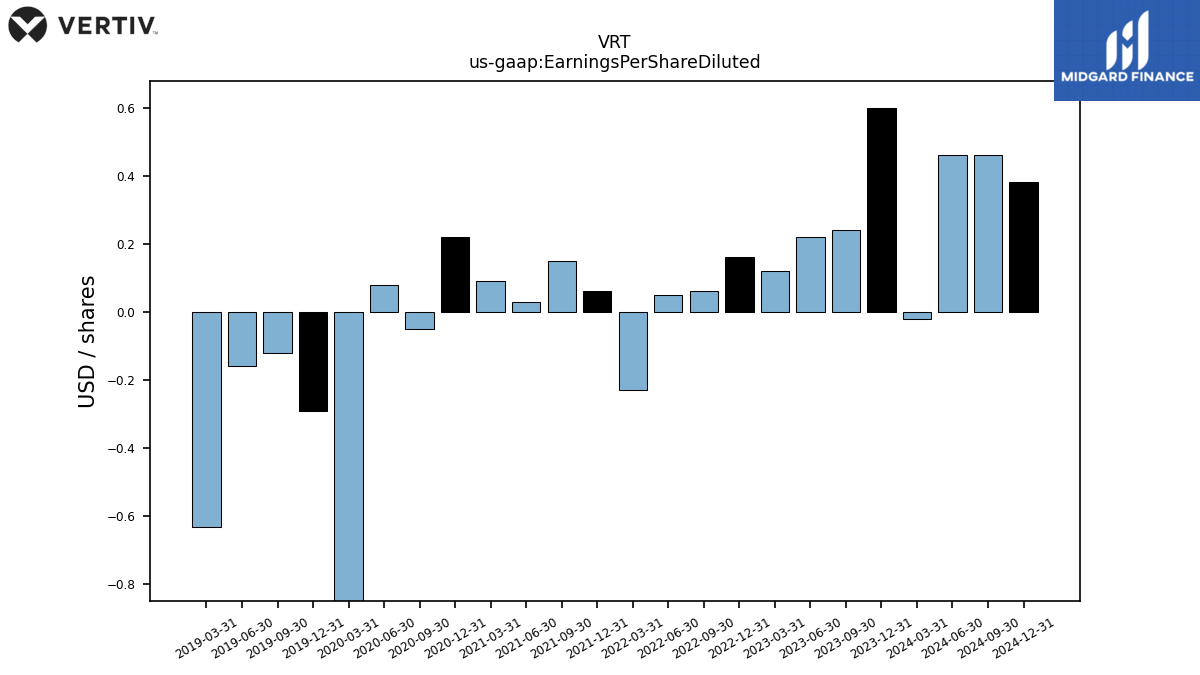
| Earnings Per Share Basic | 0.61 | 0.25 | 0.22 | 0.13 | 0.07 | 0.06 | 0.05 | 0.02 | 0.06 | 0.16 | 0.03 | 0.09 | 0.23 | -0.05 | 0.08 | -1.12 | -0.29 | -0.12 | -0.16 | -0.63 | NA | NA | NA | NA | NA | NA | NA | |
| Earnings Per Share Diluted | 0.60 | 0.24 | 0.22 | 0.12 | 0.16 | 0.06 | 0.05 | -0.23 | 0.06 | 0.15 | 0.03 | 0.09 | 0.22 | -0.05 | 0.08 | -1.12 | -0.29 | -0.12 | -0.16 | -0.63 | NA | NA | NA | NA | NA | NA | NA |
| 2023-12-31 | 2023-09-30 | 2023-06-30 | 2023-03-31 | 2022-12-31 | 2022-09-30 | 2022-06-30 | 2022-03-31 | 2021-12-31 | 2021-09-30 | 2021-06-30 | 2021-03-31 | 2020-12-31 | 2020-09-30 | 2020-06-30 | 2020-03-31 | 2019-12-31 | 2019-09-30 | 2019-06-30 | 2019-03-31 | 2018-12-31 | 2018-09-30 | 2018-06-30 | 2018-03-31 | 2017-12-31 | 2017-09-30 | 2017-06-30 | ||
|---|---|---|---|---|---|---|---|---|---|---|---|---|---|---|---|---|---|---|---|---|---|---|---|---|---|---|---|---|
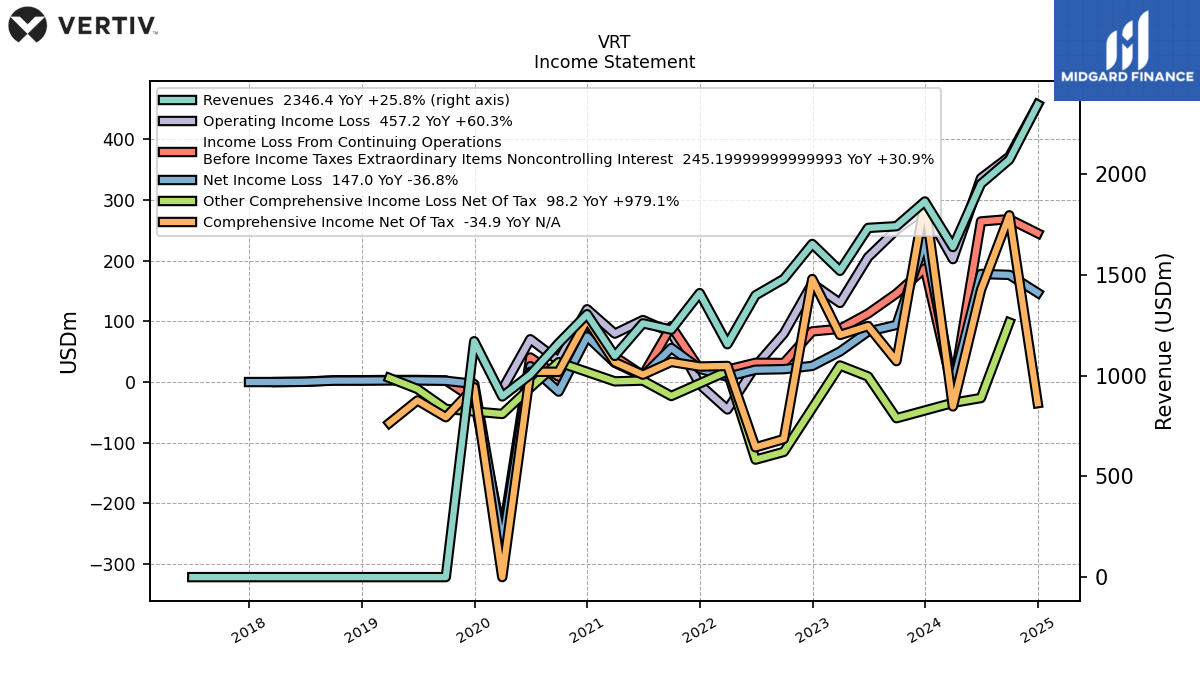
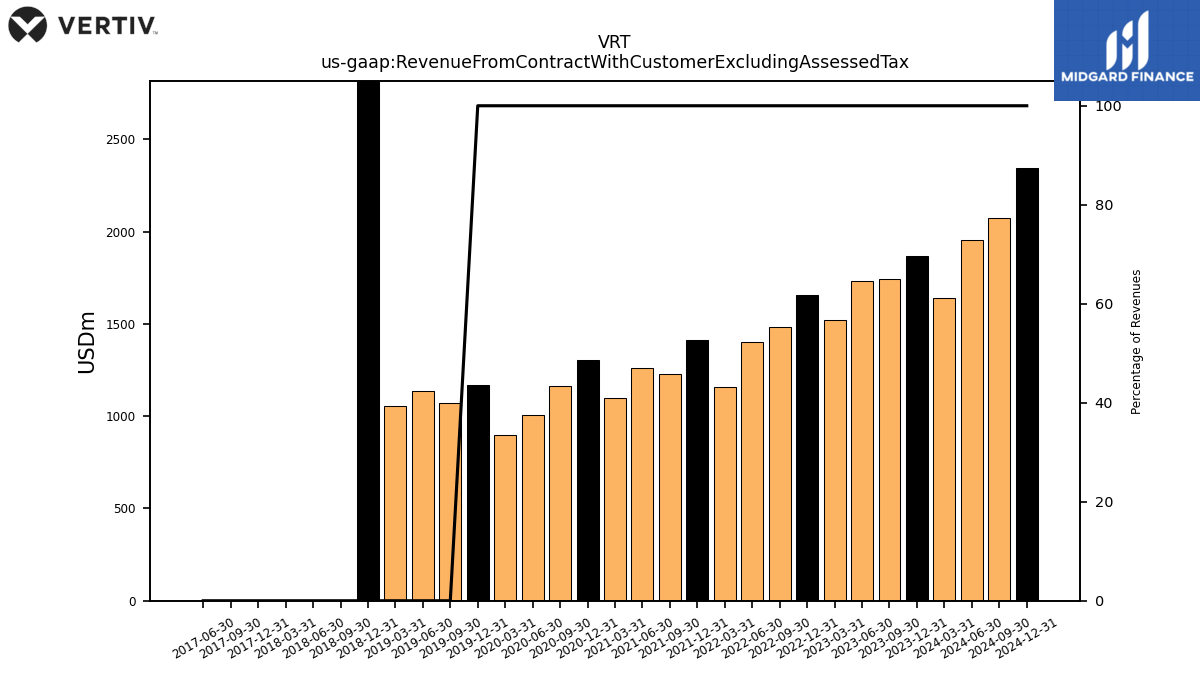
| Revenue From Contract With Customer Excluding Assessed Tax | 1865.40 | 1742.60 | 1734.10 | 1521.10 | 1654.60 | 1481.10 | 1399.40 | 1156.40 | 1410.50 | 1228.90 | 1260.30 | 1098.40 | 1305.50 | 1162.00 | 1005.70 | 897.30 | 1171.50 | 1070.70 | 1134.10 | 1054.80 | 4285.60 | 0.00 | 0.00 | 0.00 | 0.00 | 0.00 | 0.00 | |
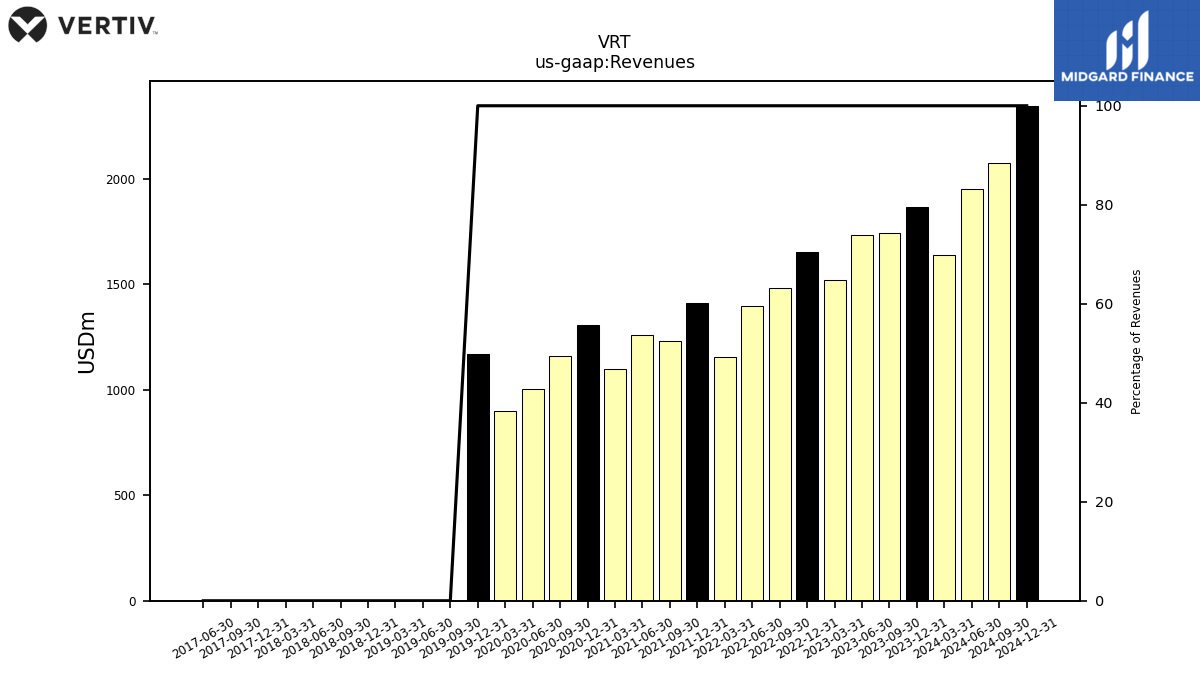
| Revenues | 1865.40 | 1742.60 | 1734.10 | 1521.10 | 1654.60 | 1481.10 | 1399.40 | 1156.40 | 1410.50 | 1228.90 | 1260.30 | 1098.40 | 1305.50 | 1162.00 | 1005.70 | 897.30 | 1171.50 | 0.00 | 0.00 | 0.00 | 0.00 | 0.00 | 0.00 | 0.00 | 0.00 | 0.00 | 0.00 | |
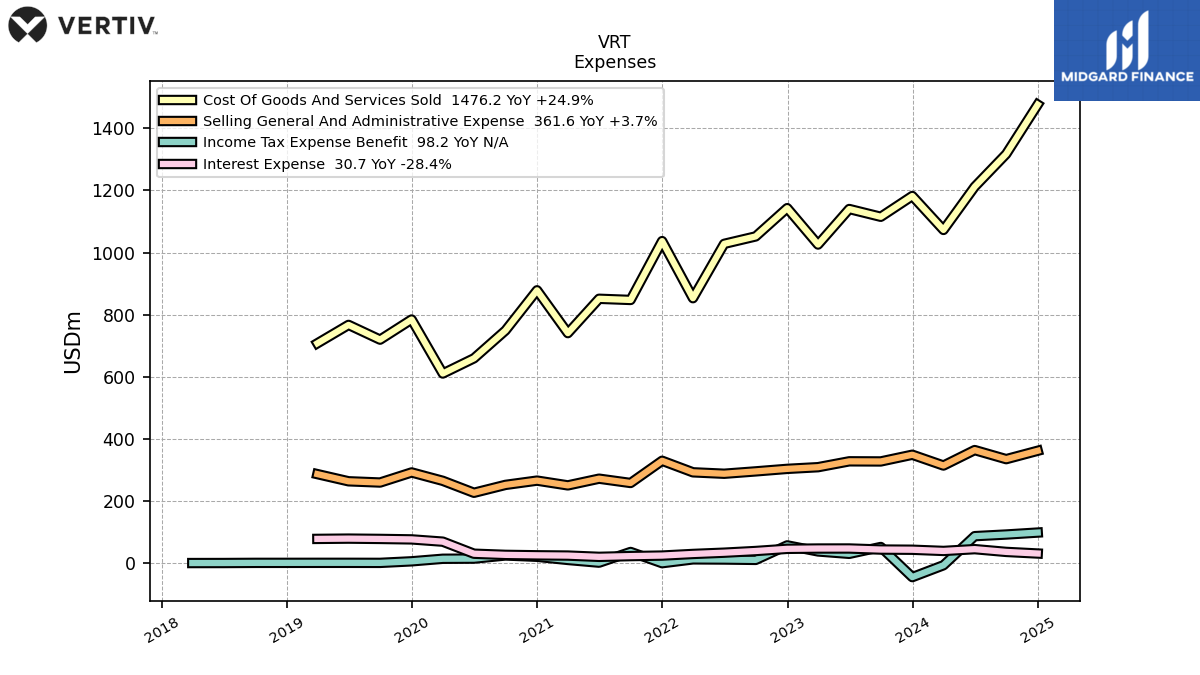
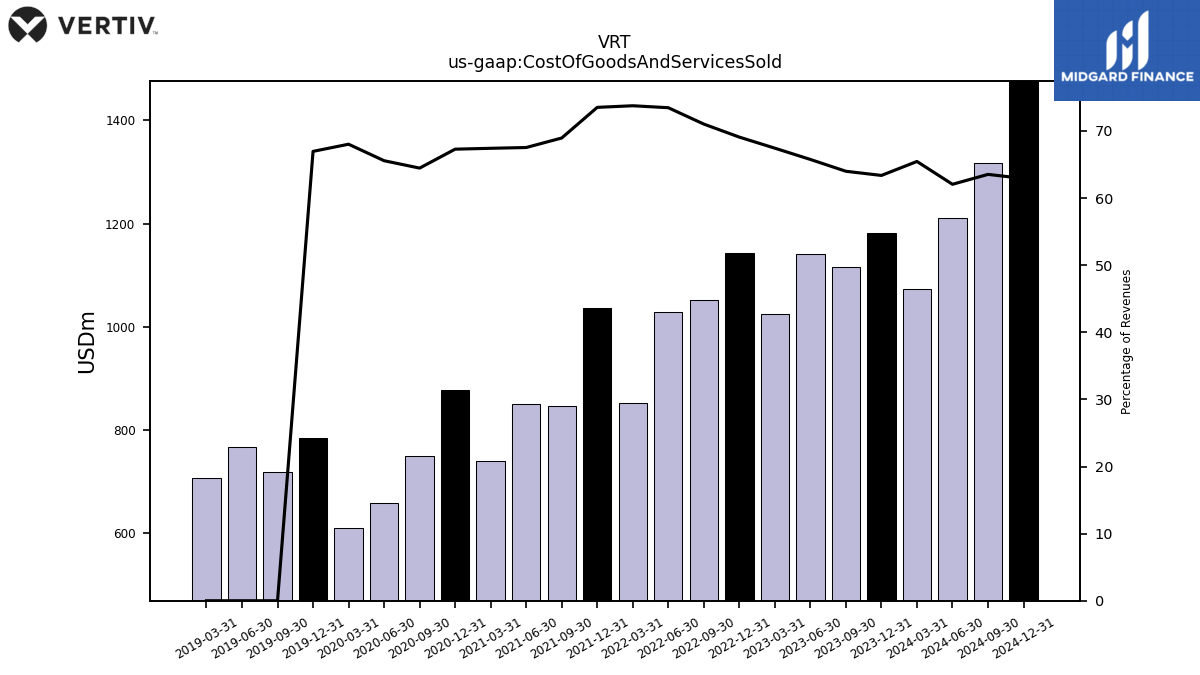
| Cost Of Goods And Services Sold | 1182.00 | 1115.00 | 1140.10 | 1025.60 | 1142.90 | 1051.80 | 1027.90 | 852.80 | 1036.80 | 847.20 | 851.00 | 740.40 | 878.30 | 749.00 | 659.30 | 610.30 | 784.30 | 719.40 | 766.90 | 707.60 | NA | NA | NA | NA | NA | NA | NA | |
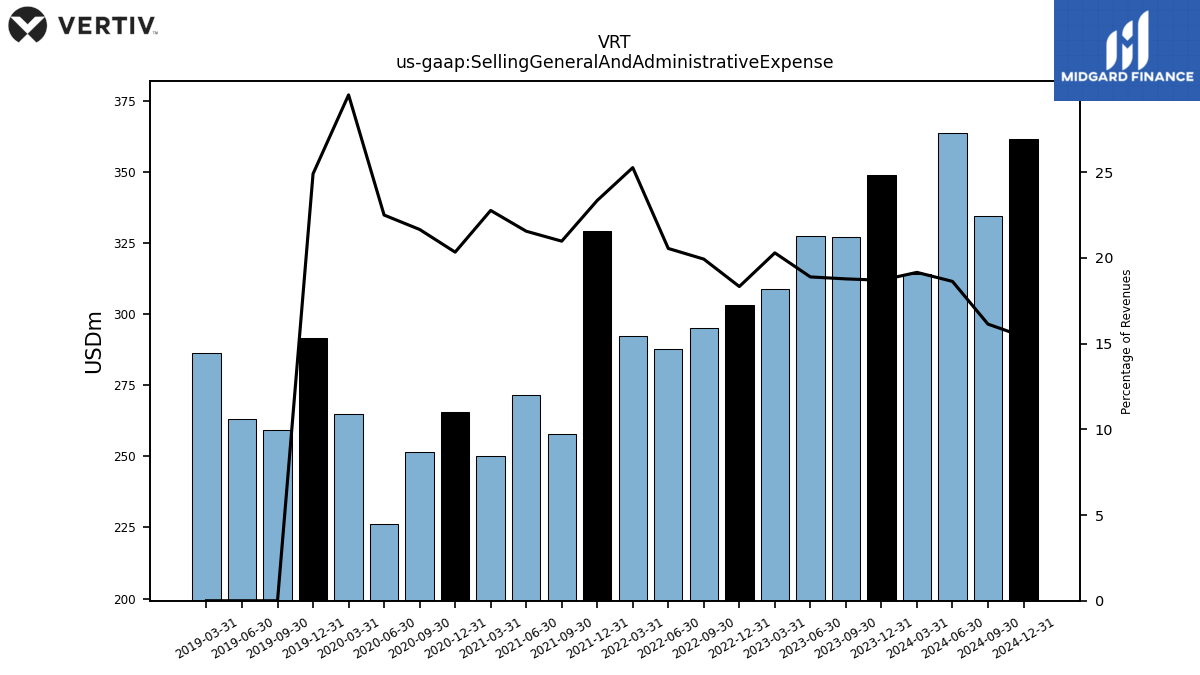
| Selling General And Administrative Expense | 348.80 | 327.20 | 327.60 | 308.70 | 303.30 | 295.20 | 287.60 | 292.20 | 329.40 | 257.80 | 271.70 | 250.10 | 265.50 | 251.70 | 226.30 | 264.80 | 291.80 | 259.30 | 263.30 | 286.40 | NA | NA | NA | NA | NA | NA | NA | |
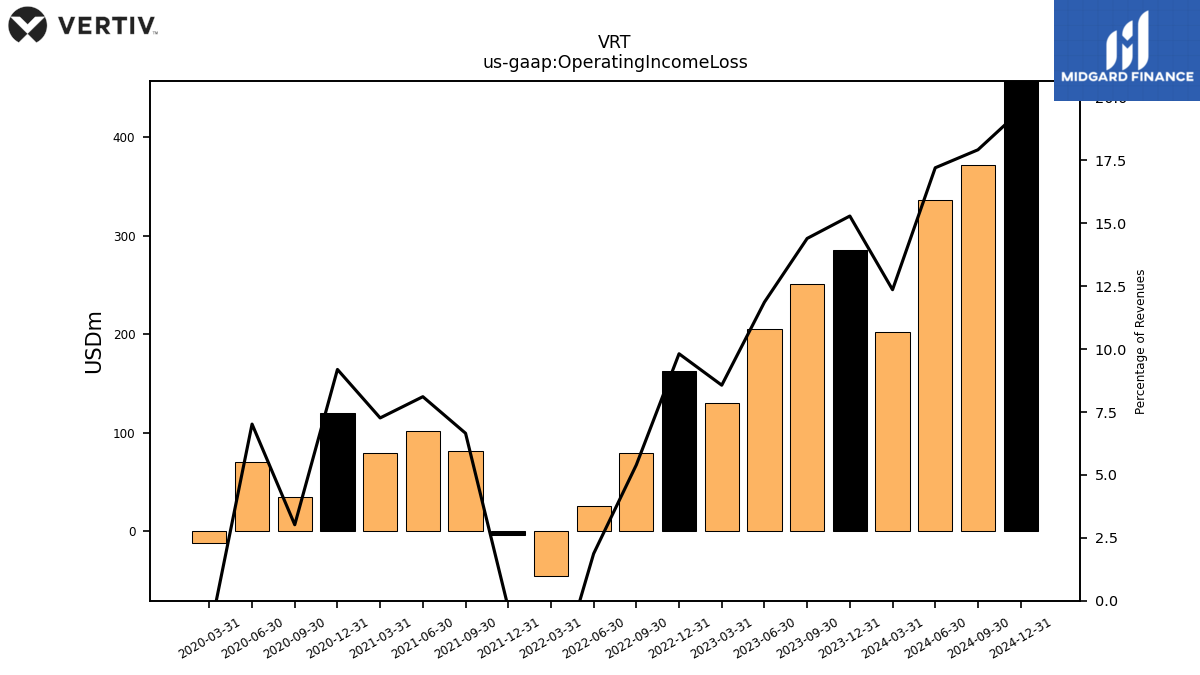
| Operating Income Loss | 285.20 | 250.90 | 205.80 | 130.30 | 162.40 | 80.00 | 26.20 | -45.20 | -3.90 | 81.80 | 102.20 | 79.80 | 120.00 | 35.10 | 70.60 | -12.20 | NA | NA | NA | NA | NA | NA | NA | NA | NA | NA | NA | |
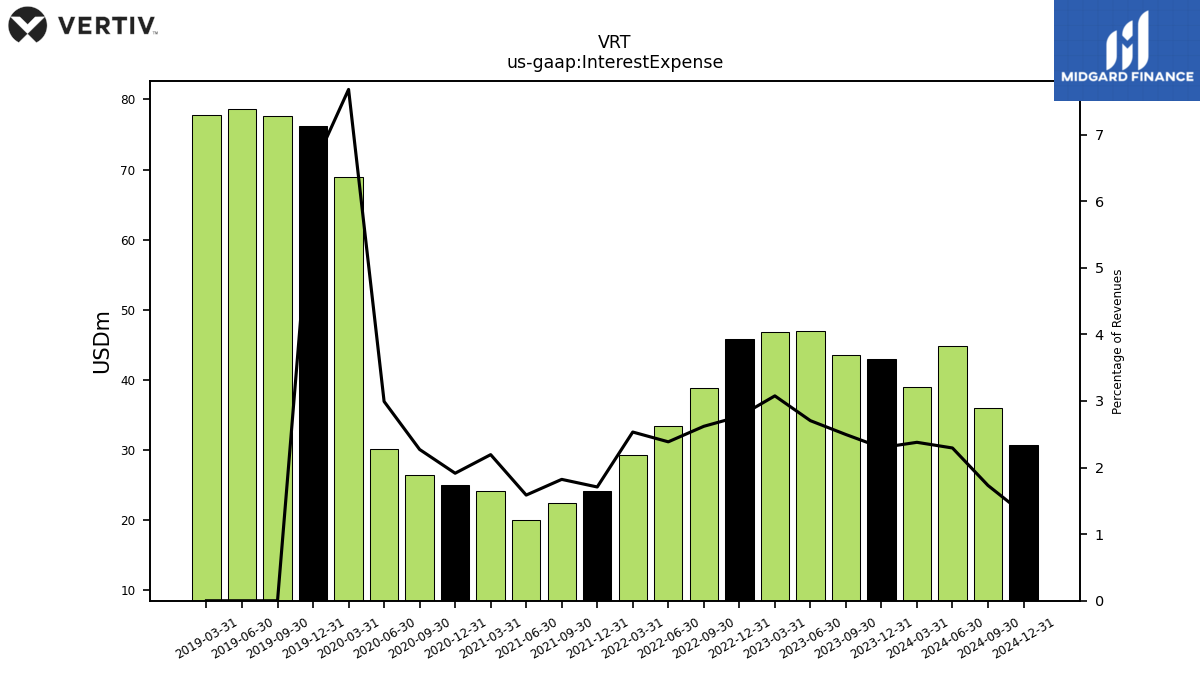
| Interest Expense | 42.90 | 43.50 | 46.90 | 46.80 | 45.80 | 38.80 | 33.40 | 29.30 | 24.10 | 22.40 | 20.00 | 24.10 | 25.00 | 26.40 | 30.10 | 68.90 | 76.20 | 77.70 | 78.70 | 77.80 | NA | NA | NA | NA | NA | NA | NA | |
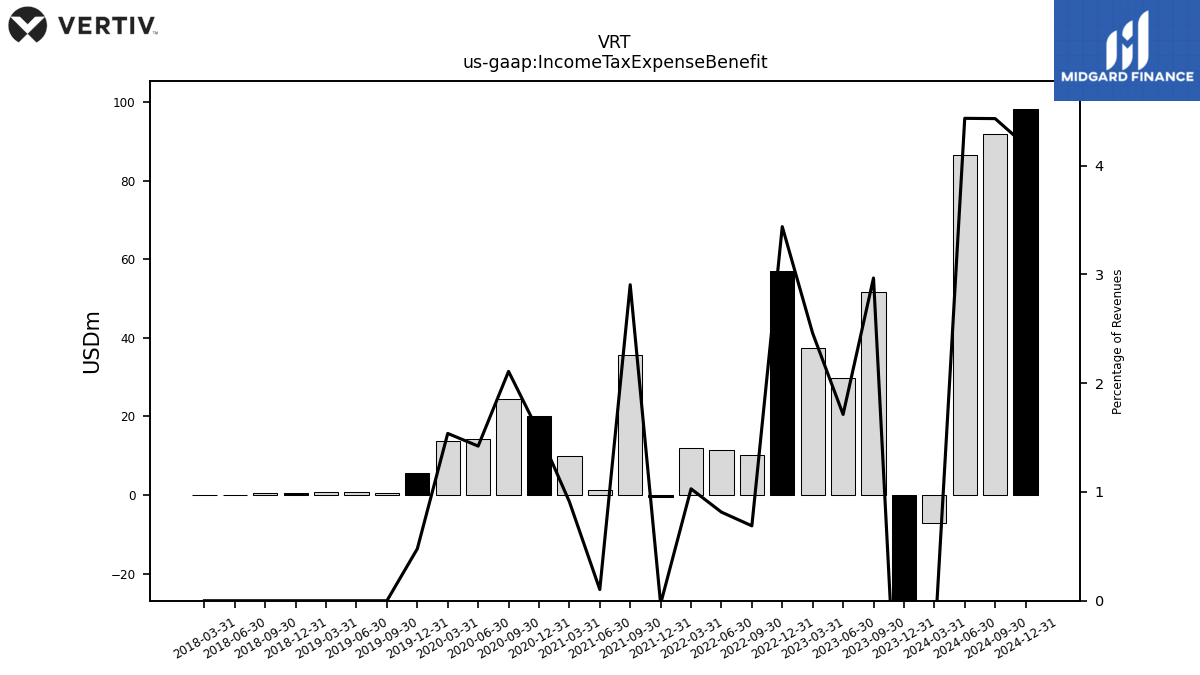
| Income Tax Expense Benefit | -45.30 | 51.70 | 29.70 | 37.40 | 56.90 | 10.20 | 11.40 | 11.90 | -0.40 | 35.70 | 1.30 | 10.00 | 20.20 | 24.50 | 14.30 | 13.80 | 5.60 | 0.56 | 0.73 | 0.72 | 0.63 | 0.61 | 0.10 | -0.00 | NA | NA | NA | |
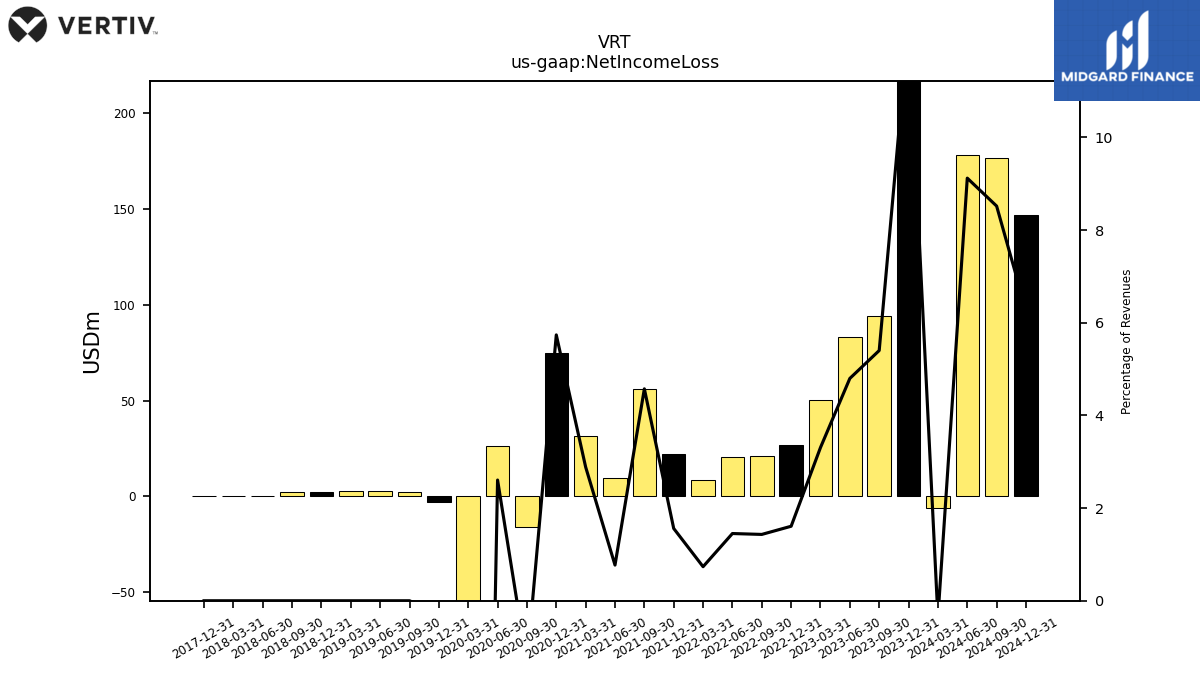
| Net Income Loss | 232.60 | 94.10 | 83.20 | 50.30 | 26.60 | 21.20 | 20.30 | 8.50 | 22.00 | 56.20 | 9.70 | 31.70 | 74.90 | -15.80 | 26.20 | -268.90 | -3.18 | 2.12 | 2.75 | 2.69 | 2.35 | 2.30 | 0.39 | -0.00 | -0.00 | NA | NA | |
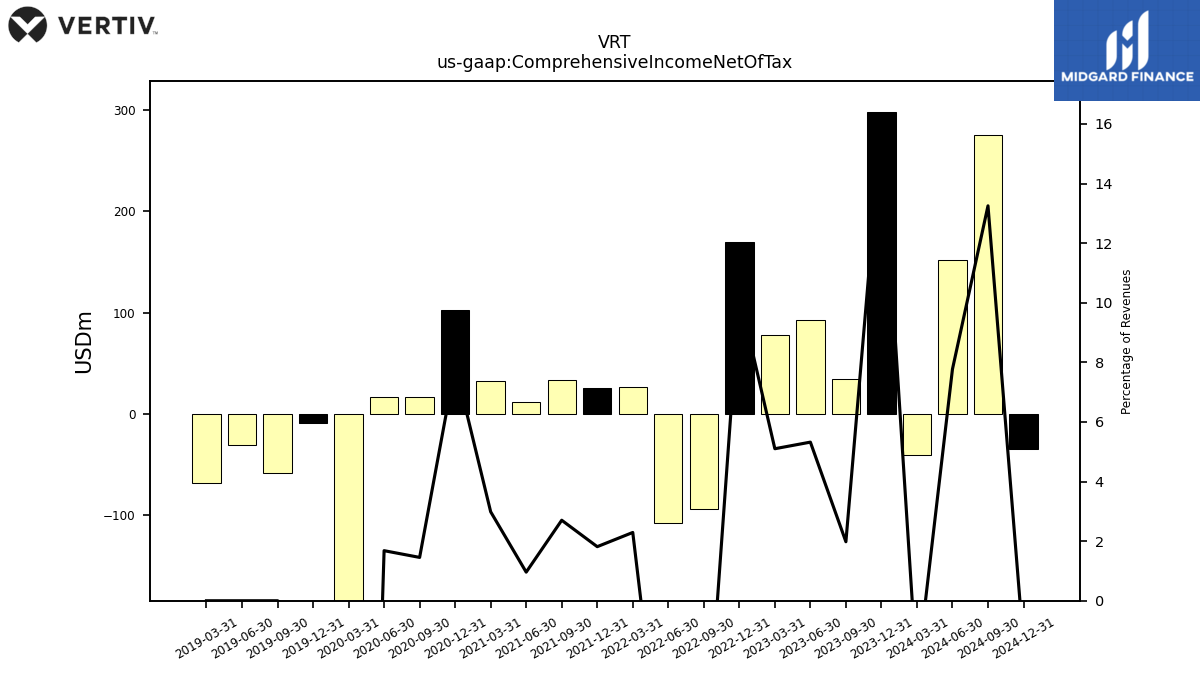
| Comprehensive Income Net Of Tax | 297.50 | 34.50 | 92.30 | 77.60 | 169.80 | -93.90 | -107.60 | 26.50 | 25.60 | 33.20 | 12.10 | 32.80 | 103.10 | 16.90 | 16.90 | -321.50 | -8.60 | -58.00 | -30.30 | -67.60 | NA | NA | NA | NA | NA | NA | NA | |
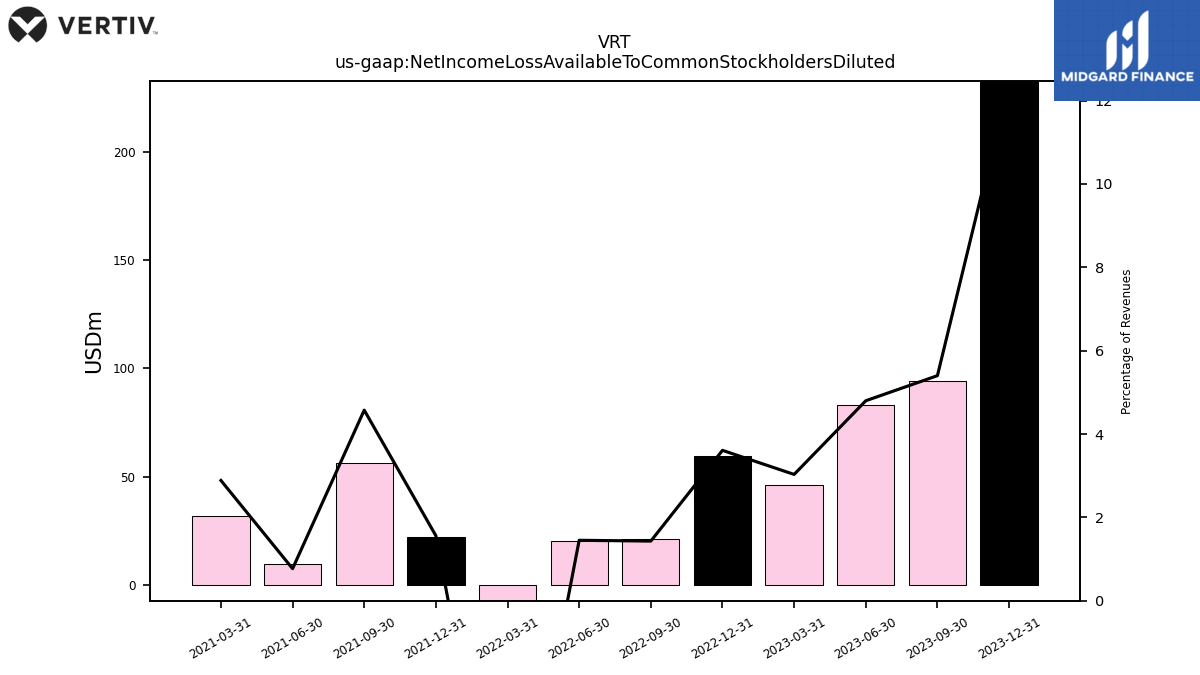
| Net Income Loss Available To Common Stockholders Diluted | 232.60 | 94.10 | 83.20 | 46.10 | 59.70 | 21.20 | 20.30 | -86.40 | 22.00 | 56.20 | 9.70 | 31.70 | NA | NA | NA | NA | NA | NA | NA | NA | NA | NA | NA | NA | NA | NA | NA |
| 2023-12-31 | 2023-09-30 | 2023-06-30 | 2023-03-31 | 2022-12-31 | 2022-09-30 | 2022-06-30 | 2022-03-31 | 2021-12-31 | 2021-09-30 | 2021-06-30 | 2021-03-31 | 2020-12-31 | 2020-09-30 | 2020-06-30 | 2020-03-31 | 2019-12-31 | 2019-09-30 | 2019-06-30 | 2019-03-31 | 2018-12-31 | 2018-09-30 | 2018-06-30 | 2018-03-31 | 2017-12-31 | 2017-09-30 | 2017-06-30 | ||
|---|---|---|---|---|---|---|---|---|---|---|---|---|---|---|---|---|---|---|---|---|---|---|---|---|---|---|---|---|
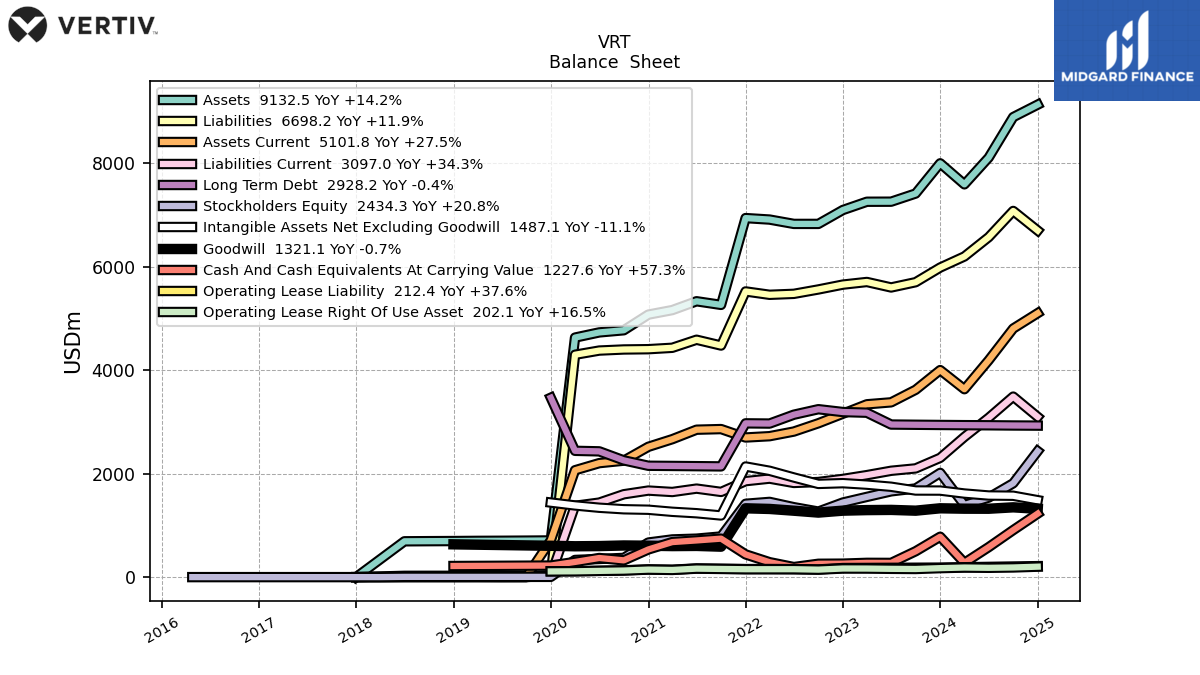
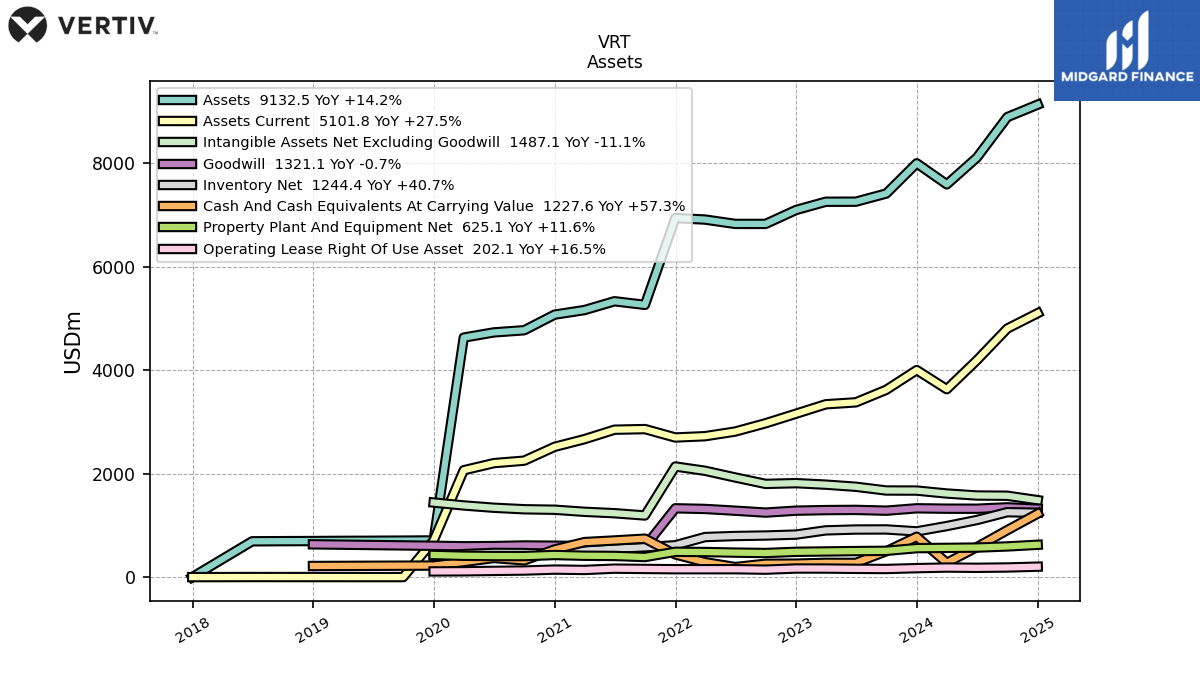
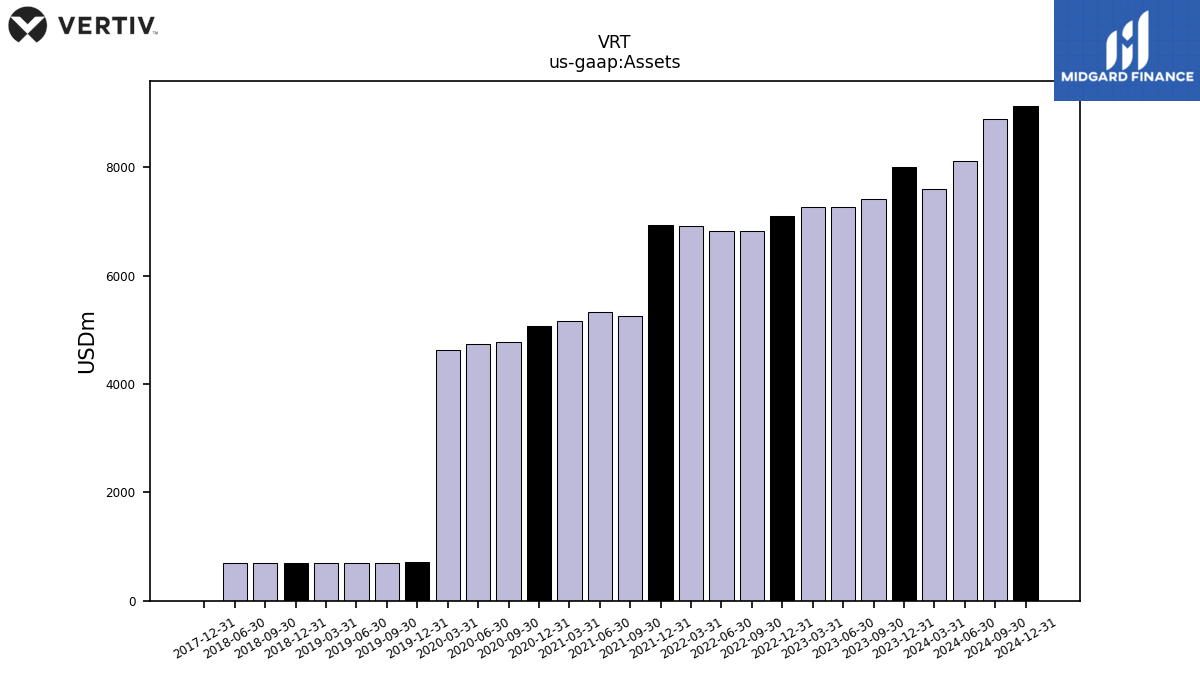
| Assets | 7998.50 | 7414.30 | 7256.60 | 7255.40 | 7095.70 | 6827.00 | 6827.10 | 6911.00 | 6939.60 | 5261.70 | 5332.00 | 5161.40 | 5073.80 | 4771.70 | 4729.90 | 4629.90 | 709.05 | 705.56 | 702.72 | 700.88 | 697.34 | 695.16 | 692.42 | NA | 0.03 | NA | NA | |
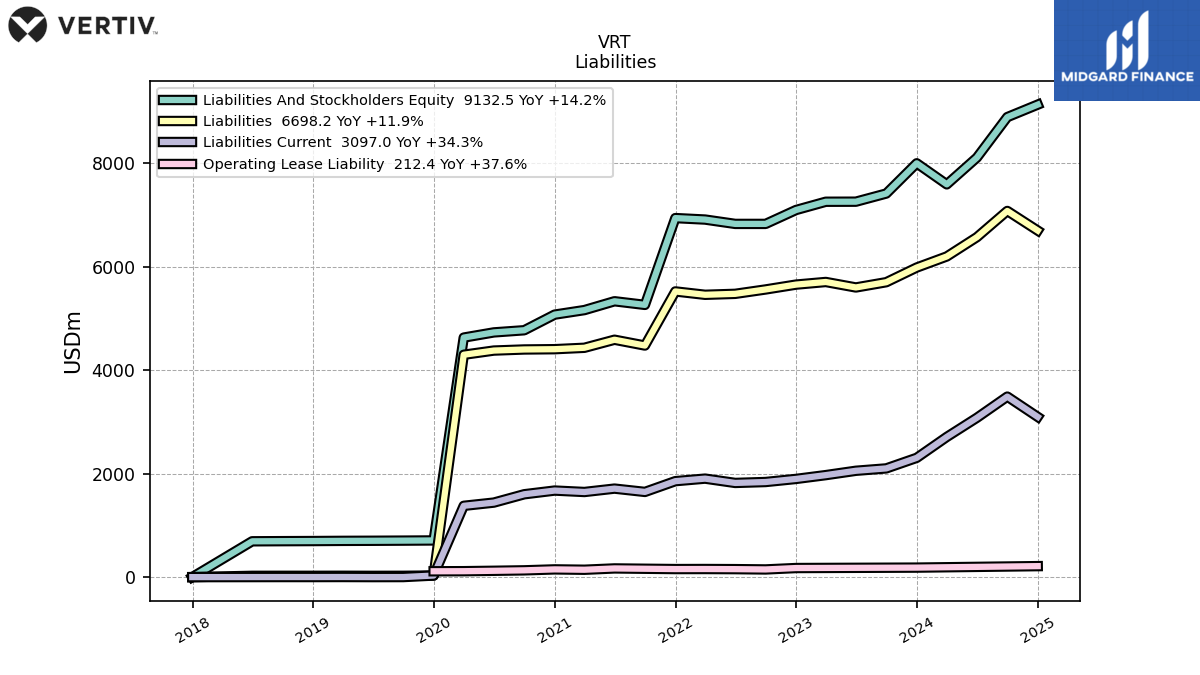
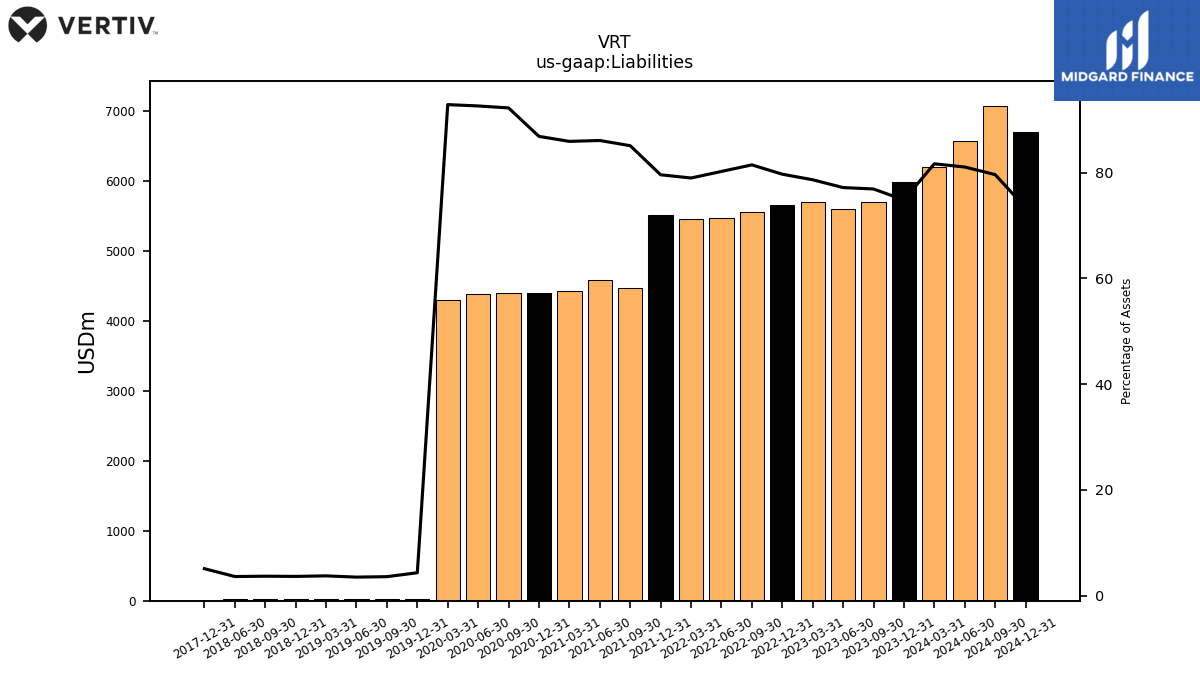
| Liabilities | 5983.60 | 5700.40 | 5598.50 | 5704.60 | 5653.80 | 5559.90 | 5475.40 | 5456.90 | 5521.90 | 4476.00 | 4588.30 | 4432.70 | 4405.50 | 4400.00 | 4379.00 | 4298.00 | 30.75 | 25.38 | 24.66 | 26.27 | 25.43 | 25.60 | 25.07 | NA | 0.00 | NA | NA | |
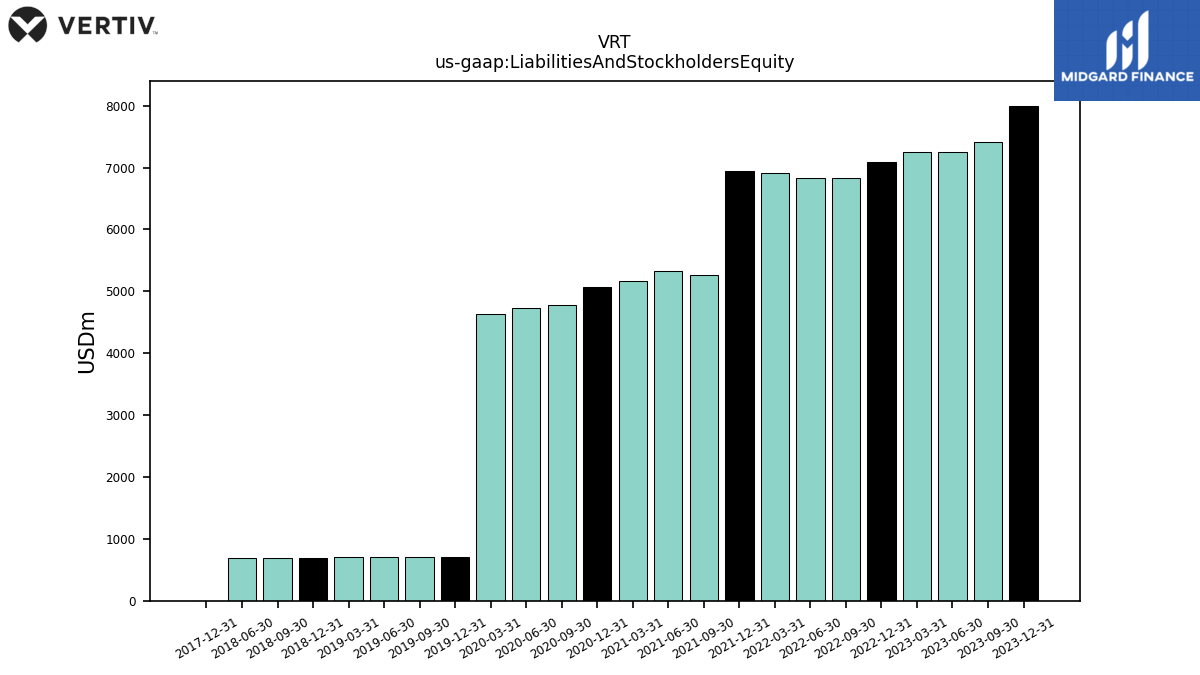
| Liabilities And Stockholders Equity | 7998.50 | 7414.30 | 7256.60 | 7255.40 | 7095.70 | 6827.00 | 6827.10 | 6911.00 | 6939.60 | 5261.70 | 5332.00 | 5161.40 | 5073.80 | 4771.70 | 4729.90 | 4629.90 | 709.05 | 705.56 | 702.72 | 700.88 | 697.34 | 695.16 | 692.42 | NA | 0.03 | NA | NA | |
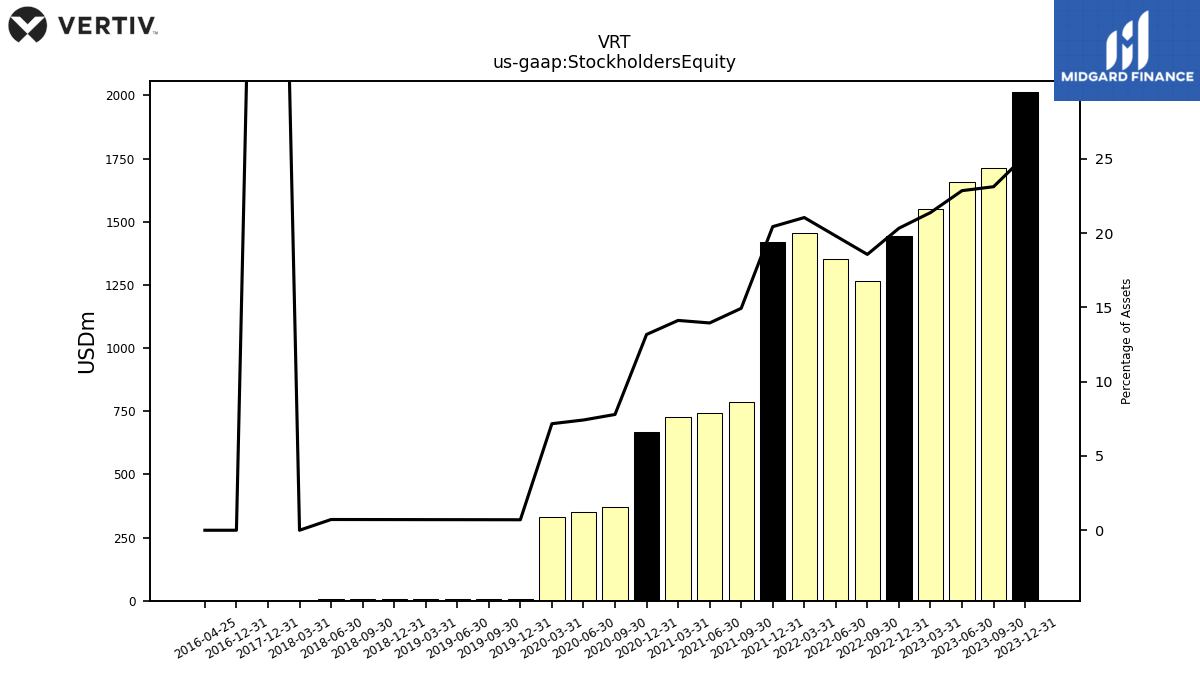
| Stockholders Equity | 2014.90 | 1713.90 | 1658.10 | 1550.80 | 1441.90 | 1267.10 | 1351.70 | 1454.10 | 1417.70 | 785.70 | 743.70 | 728.70 | 668.30 | 371.70 | 350.90 | 331.90 | 5.00 | 5.00 | 5.00 | 5.00 | 5.00 | 5.00 | 5.00 | 0.02 | 0.02 | NA | NA |
| 2023-12-31 | 2023-09-30 | 2023-06-30 | 2023-03-31 | 2022-12-31 | 2022-09-30 | 2022-06-30 | 2022-03-31 | 2021-12-31 | 2021-09-30 | 2021-06-30 | 2021-03-31 | 2020-12-31 | 2020-09-30 | 2020-06-30 | 2020-03-31 | 2019-12-31 | 2019-09-30 | 2019-06-30 | 2019-03-31 | 2018-12-31 | 2018-09-30 | 2018-06-30 | 2018-03-31 | 2017-12-31 | 2017-09-30 | 2017-06-30 | ||
|---|---|---|---|---|---|---|---|---|---|---|---|---|---|---|---|---|---|---|---|---|---|---|---|---|---|---|---|---|
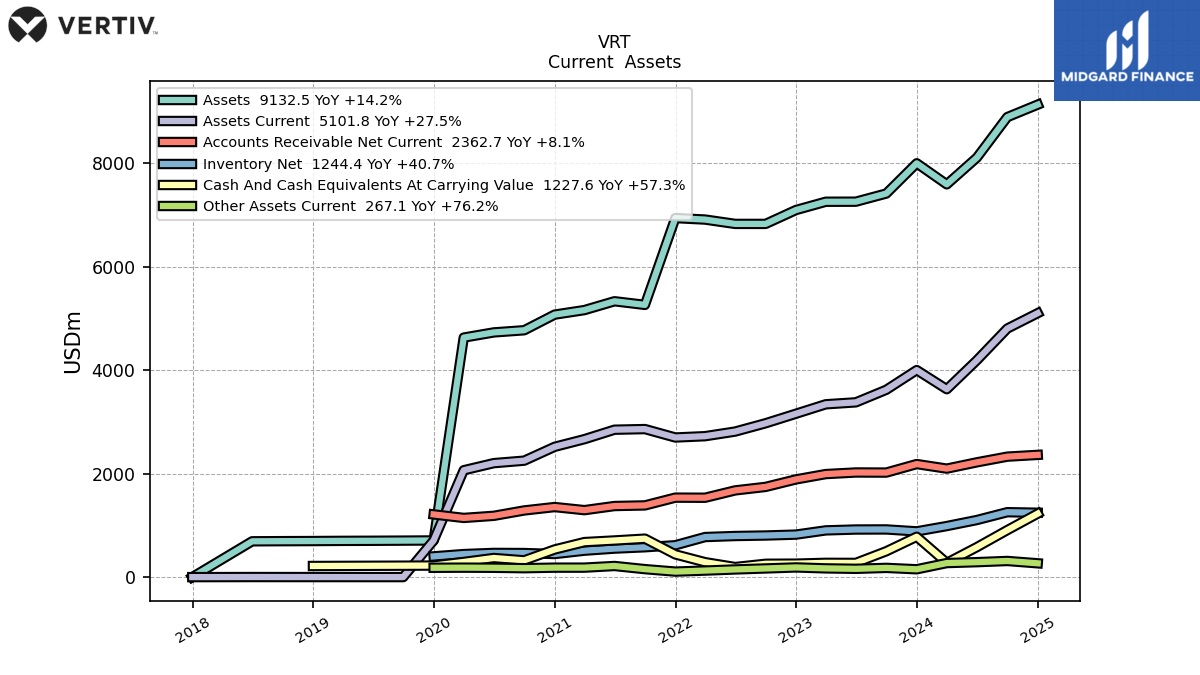
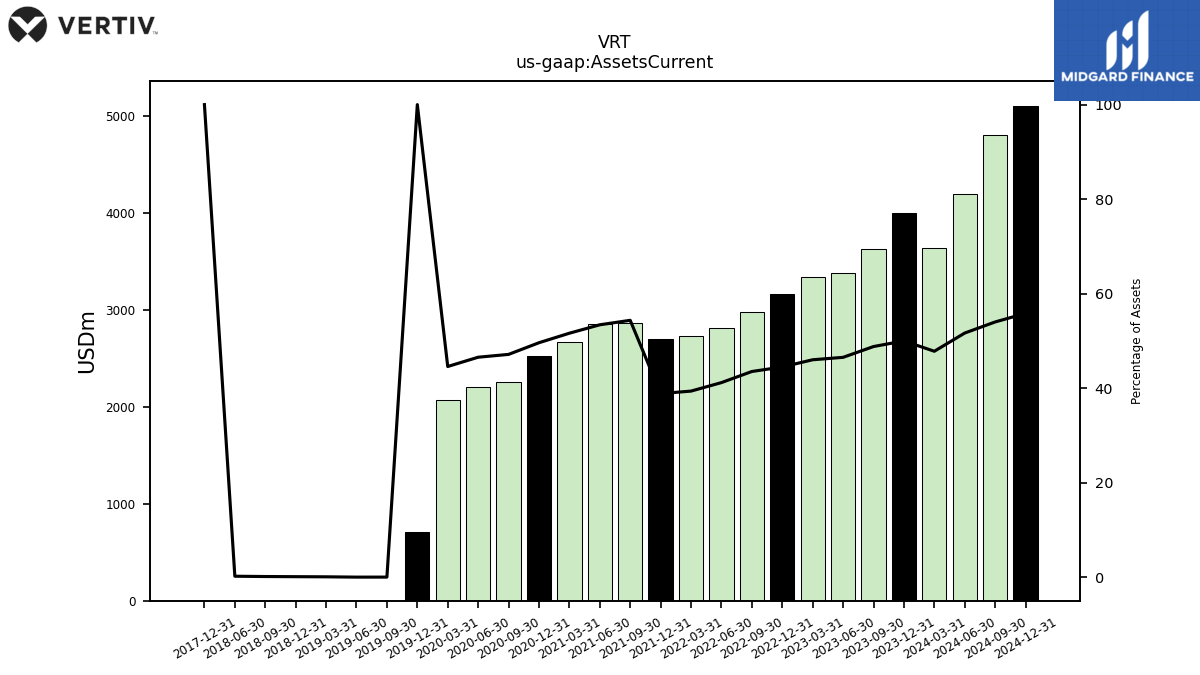
| Assets Current | 4001.50 | 3621.00 | 3378.30 | 3340.60 | 3158.70 | 2973.80 | 2813.60 | 2724.00 | 2698.60 | 2861.50 | 2849.40 | 2666.20 | 2518.80 | 2251.10 | 2203.20 | 2065.70 | 709.05 | 0.55 | 0.52 | 0.97 | 1.18 | 1.39 | 1.81 | NA | 0.03 | NA | NA | |
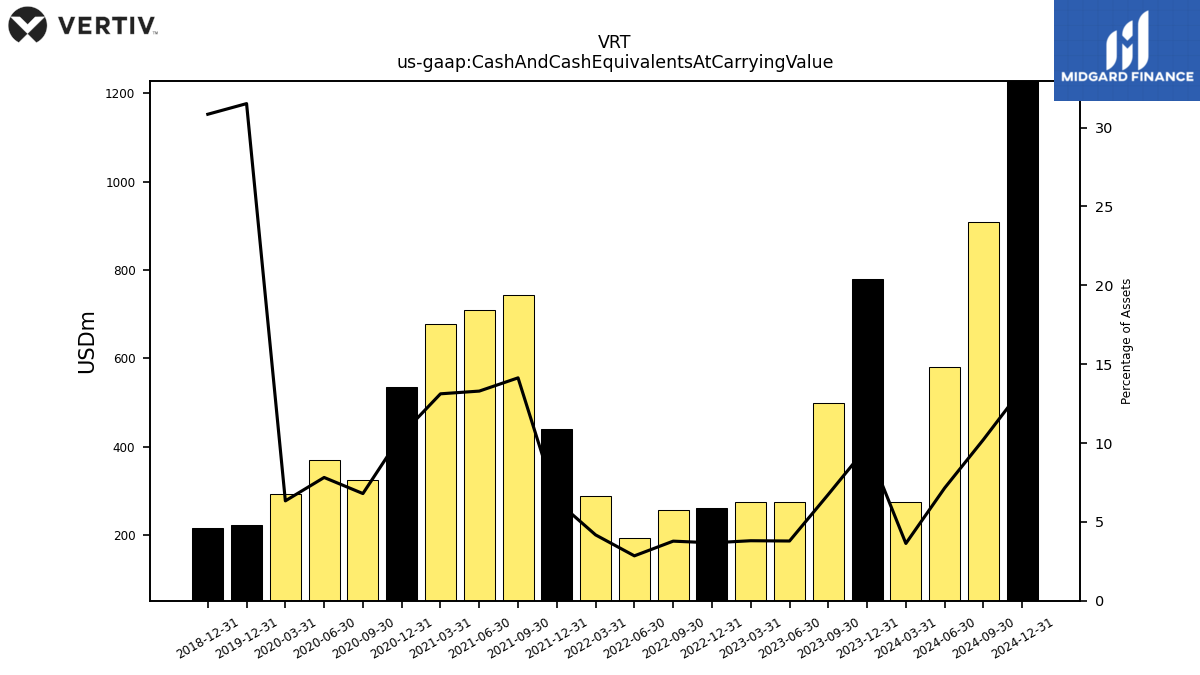
| Cash And Cash Equivalents At Carrying Value | 780.40 | 500.00 | 274.90 | 276.10 | 260.60 | 258.00 | 194.40 | 288.50 | 439.10 | 743.60 | 708.80 | 677.20 | 534.60 | 324.30 | 369.70 | 293.20 | 223.50 | NA | NA | NA | 215.10 | NA | NA | NA | NA | NA | NA | |
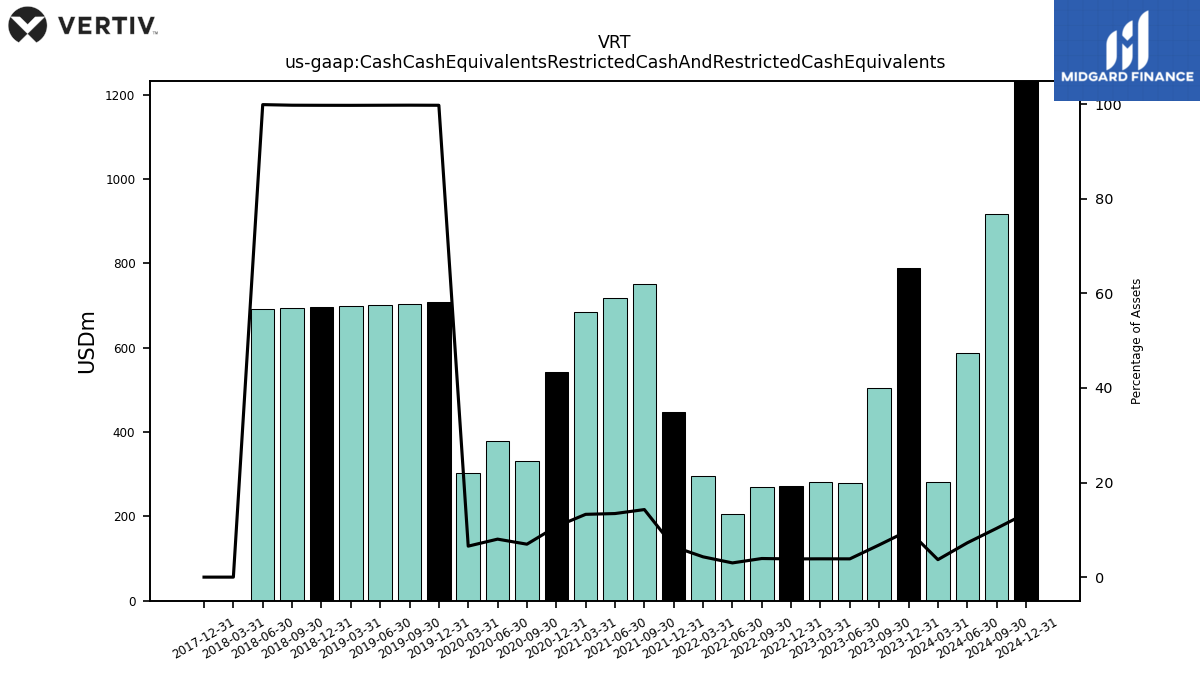
| Cash Cash Equivalents Restricted Cash And Restricted Cash Equivalents | 788.60 | 505.00 | 280.20 | 280.80 | 273.20 | 268.70 | 205.30 | 296.50 | 447.10 | 751.60 | 716.80 | 685.20 | 542.60 | 332.30 | 379.90 | 303.40 | 707.44 | 704.11 | 701.16 | 699.20 | 695.72 | 693.68 | 691.81 | 0.00 | 0.00 | NA | NA | |
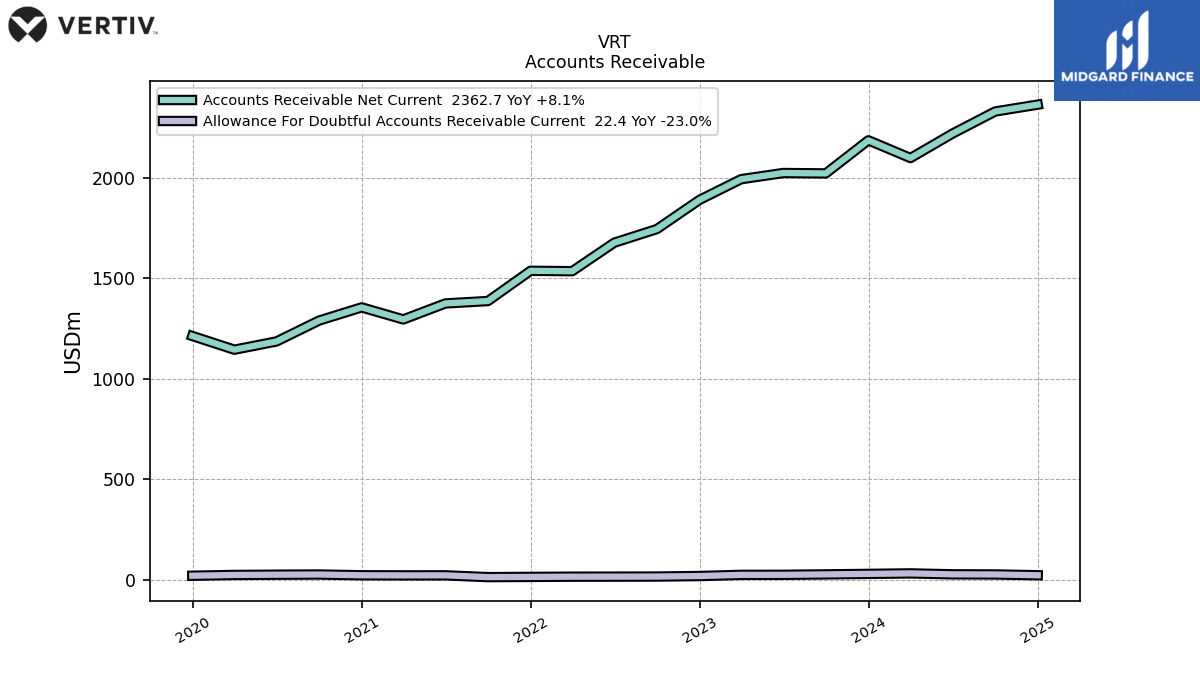
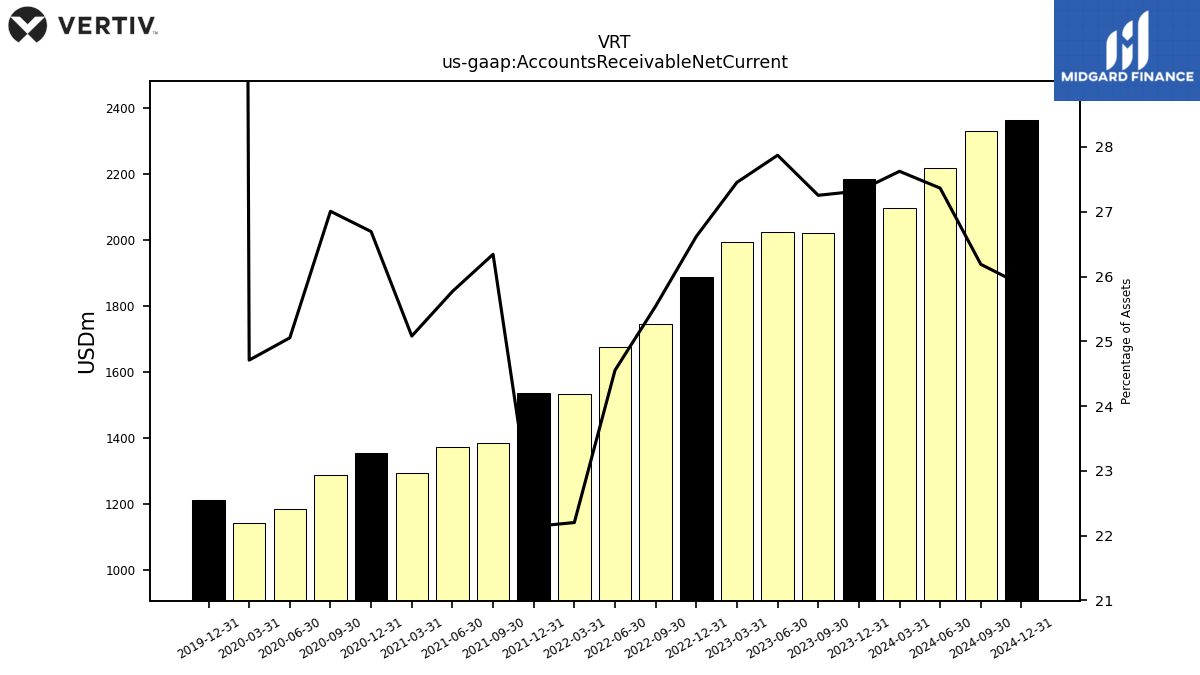
| Accounts Receivable Net Current | 2185.20 | 2020.70 | 2022.60 | 1991.90 | 1888.80 | 1743.80 | 1676.20 | 1534.30 | 1536.40 | 1386.10 | 1374.00 | 1294.50 | 1354.40 | 1288.70 | 1185.00 | 1144.00 | 1212.20 | NA | NA | NA | NA | NA | NA | NA | NA | NA | NA | |
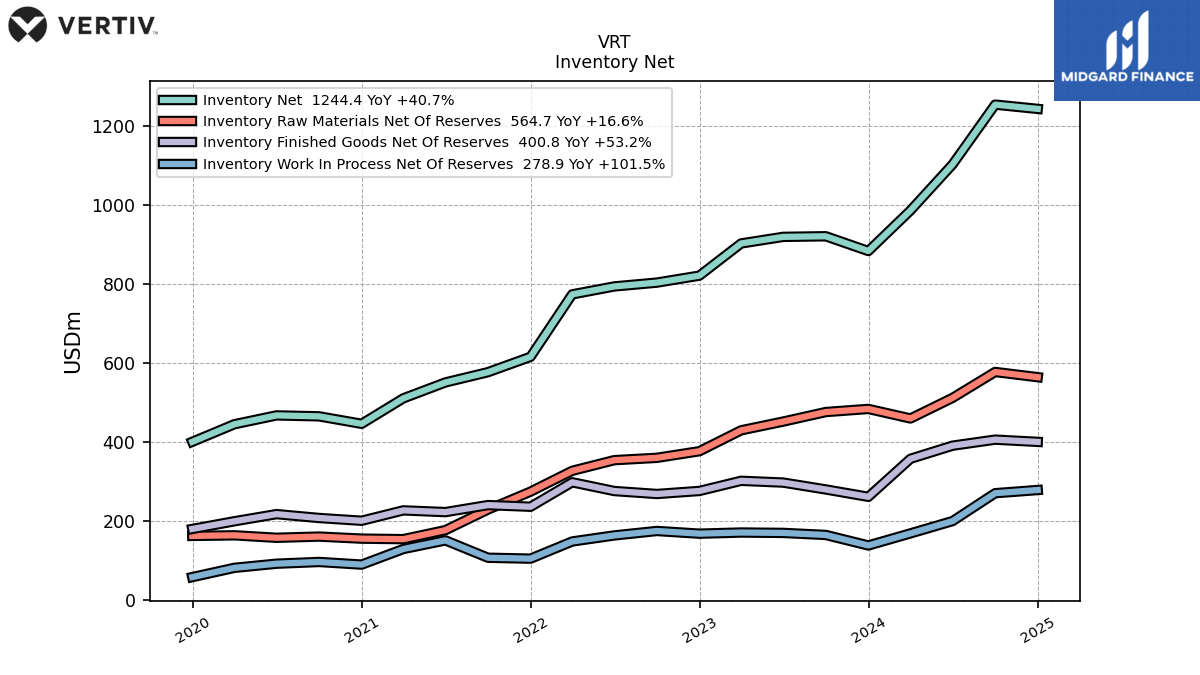
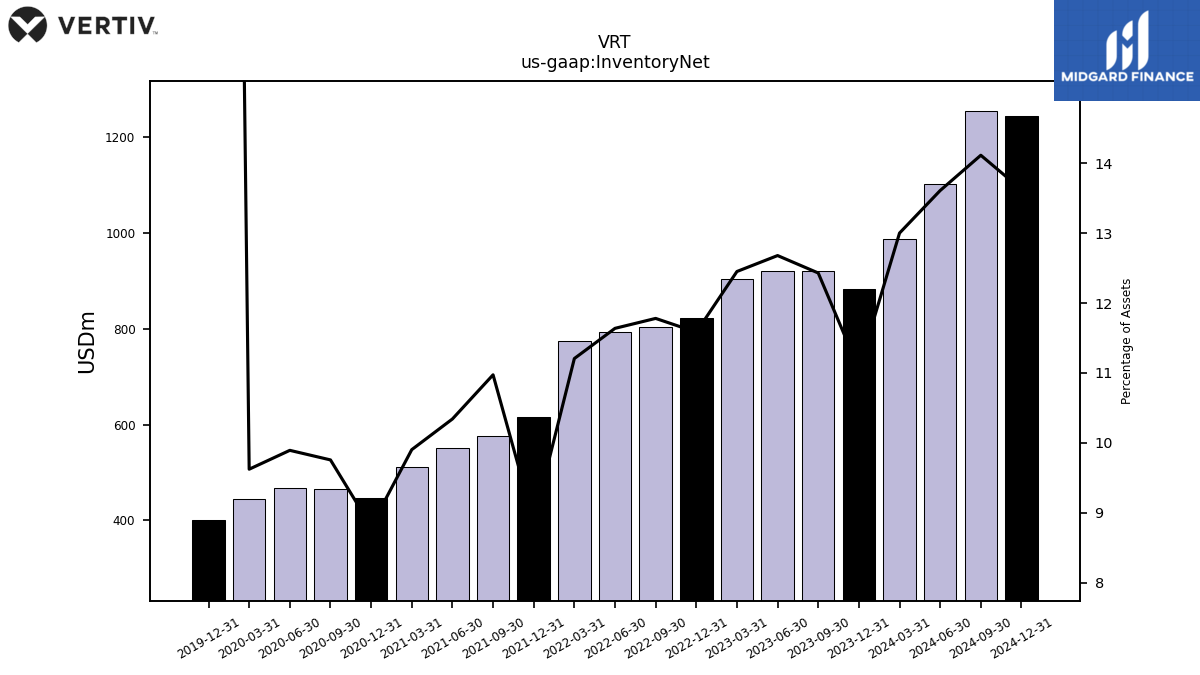
| Inventory Net | 884.30 | 921.70 | 920.20 | 903.50 | 822.00 | 804.30 | 794.60 | 774.50 | 616.30 | 577.40 | 551.40 | 511.10 | 446.60 | 465.50 | 467.90 | 445.50 | 401.00 | NA | NA | NA | NA | NA | NA | NA | NA | NA | NA | |
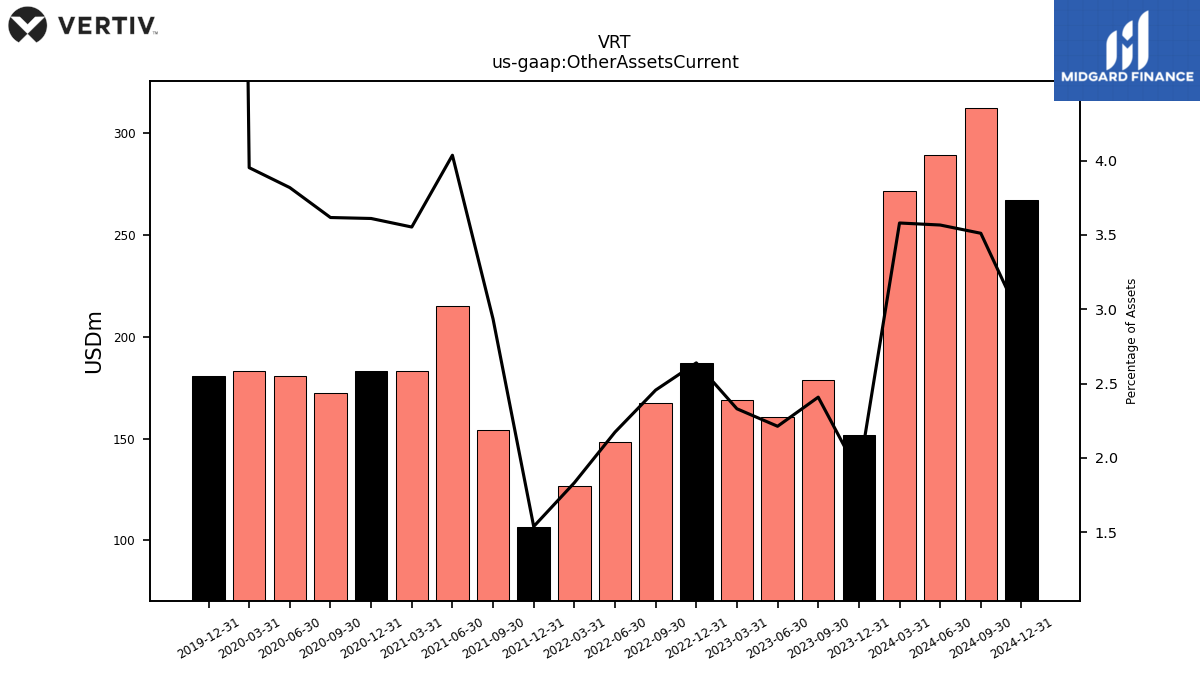
| Other Assets Current | 151.60 | 178.60 | 160.60 | 169.10 | 187.30 | 167.70 | 148.40 | 126.70 | 106.80 | 154.40 | 215.20 | 183.40 | 183.20 | 172.60 | 180.60 | 183.00 | 180.70 | NA | NA | NA | NA | NA | NA | NA | NA | NA | NA |
| 2023-12-31 | 2023-09-30 | 2023-06-30 | 2023-03-31 | 2022-12-31 | 2022-09-30 | 2022-06-30 | 2022-03-31 | 2021-12-31 | 2021-09-30 | 2021-06-30 | 2021-03-31 | 2020-12-31 | 2020-09-30 | 2020-06-30 | 2020-03-31 | 2019-12-31 | 2019-09-30 | 2019-06-30 | 2019-03-31 | 2018-12-31 | 2018-09-30 | 2018-06-30 | 2018-03-31 | 2017-12-31 | 2017-09-30 | 2017-06-30 | ||
|---|---|---|---|---|---|---|---|---|---|---|---|---|---|---|---|---|---|---|---|---|---|---|---|---|---|---|---|---|
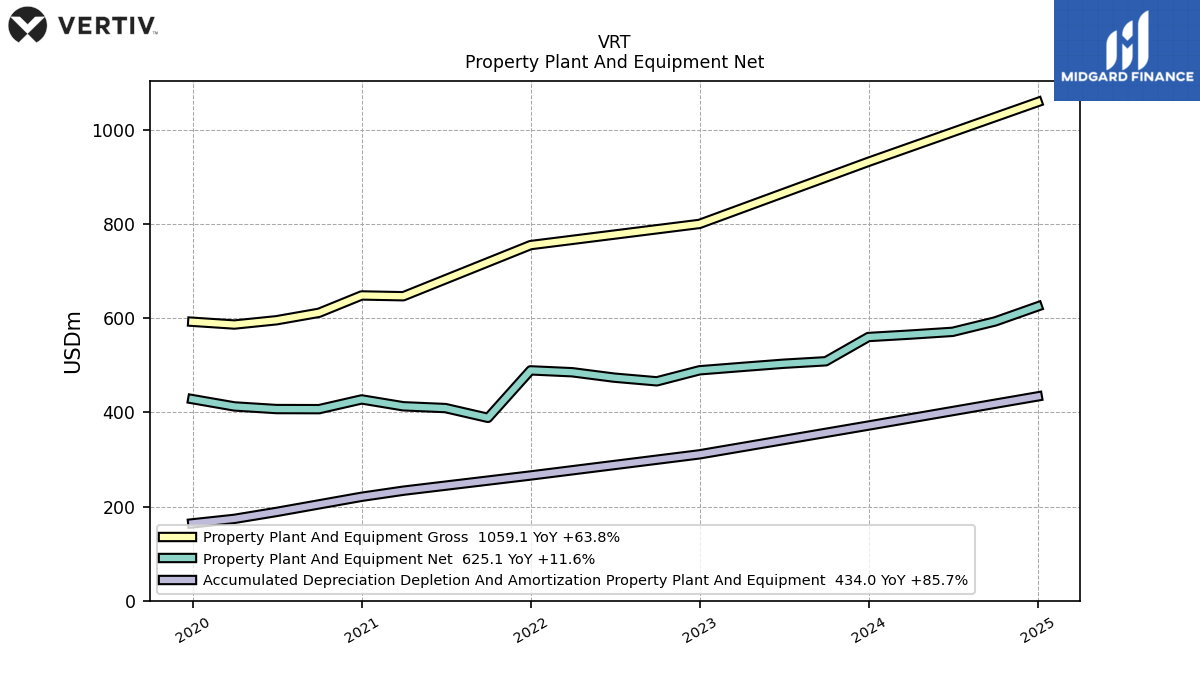
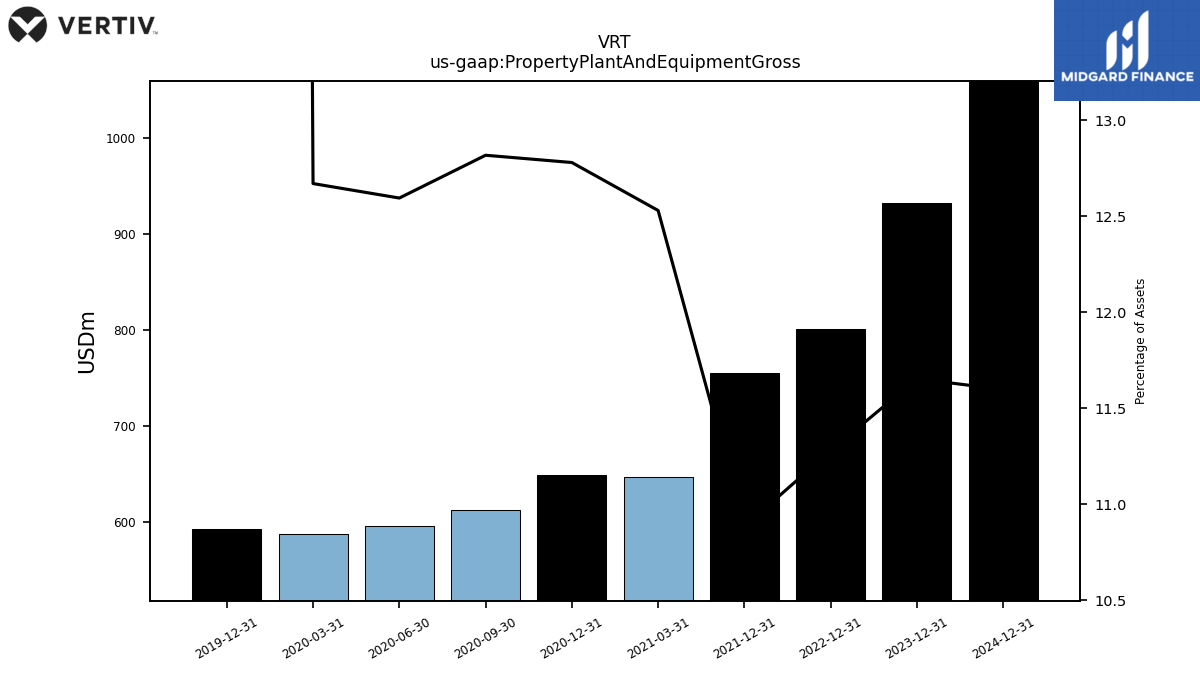
| Property Plant And Equipment Gross | 932.10 | NA | NA | NA | 800.30 | NA | NA | NA | 755.30 | NA | NA | 646.70 | 648.40 | 611.60 | 595.70 | 586.60 | 592.50 | NA | NA | NA | NA | NA | NA | NA | NA | NA | NA | |
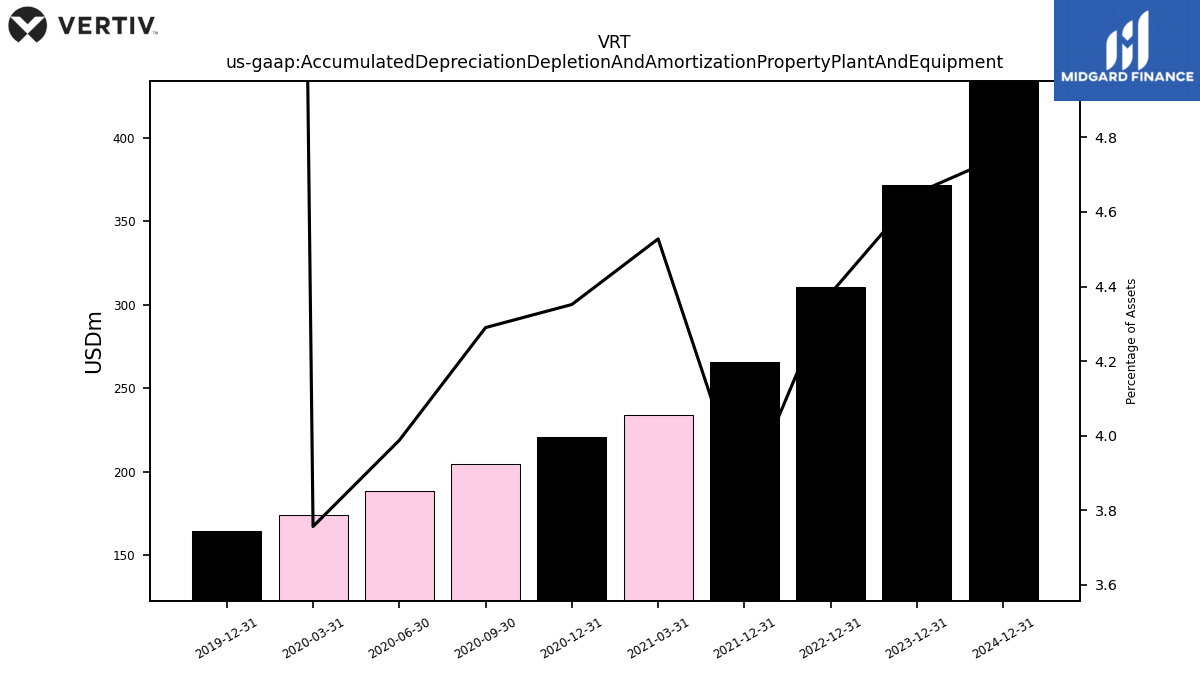
| Accumulated Depreciation Depletion And Amortization Property Plant And Equipment | 372.00 | NA | NA | NA | 310.90 | NA | NA | NA | 266.00 | NA | NA | 233.70 | 220.80 | 204.70 | 188.60 | 173.90 | 164.30 | NA | NA | NA | NA | NA | NA | NA | NA | NA | NA | |
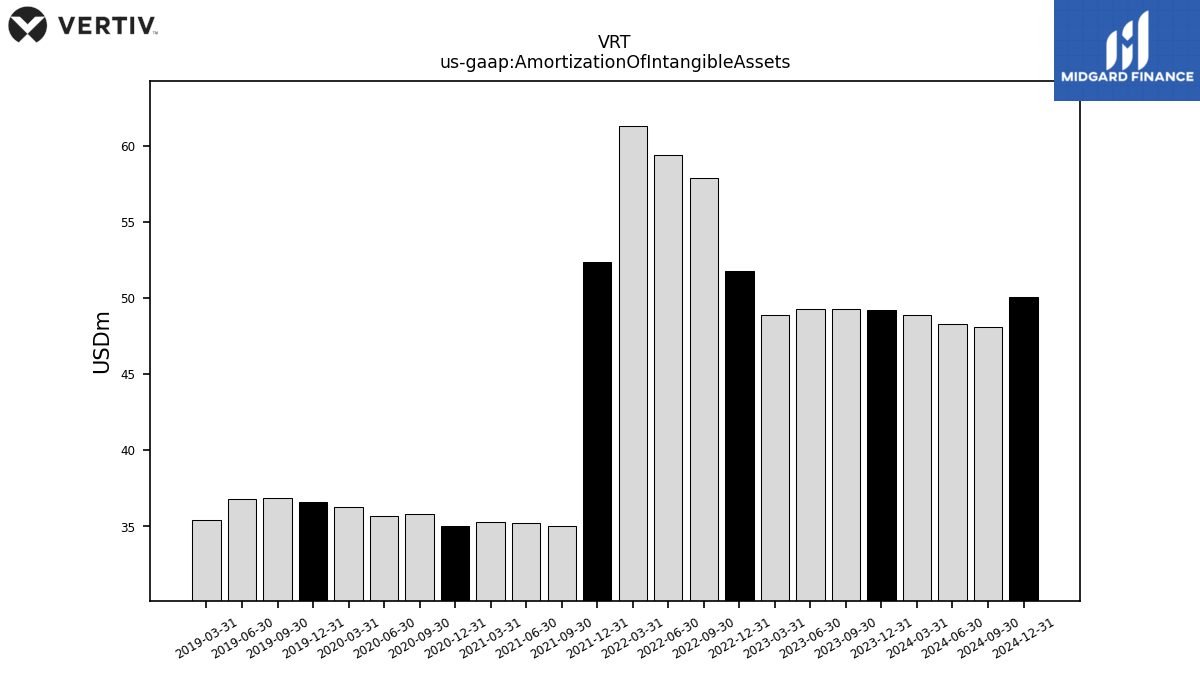
| Amortization Of Intangible Assets | 49.20 | 49.30 | 49.30 | 48.90 | 51.80 | 57.90 | 59.40 | 61.30 | 52.40 | 35.00 | 35.20 | 35.30 | 35.00 | 35.80 | 35.70 | 36.30 | 36.60 | 36.90 | 36.80 | 35.40 | NA | NA | NA | NA | NA | NA | NA | |
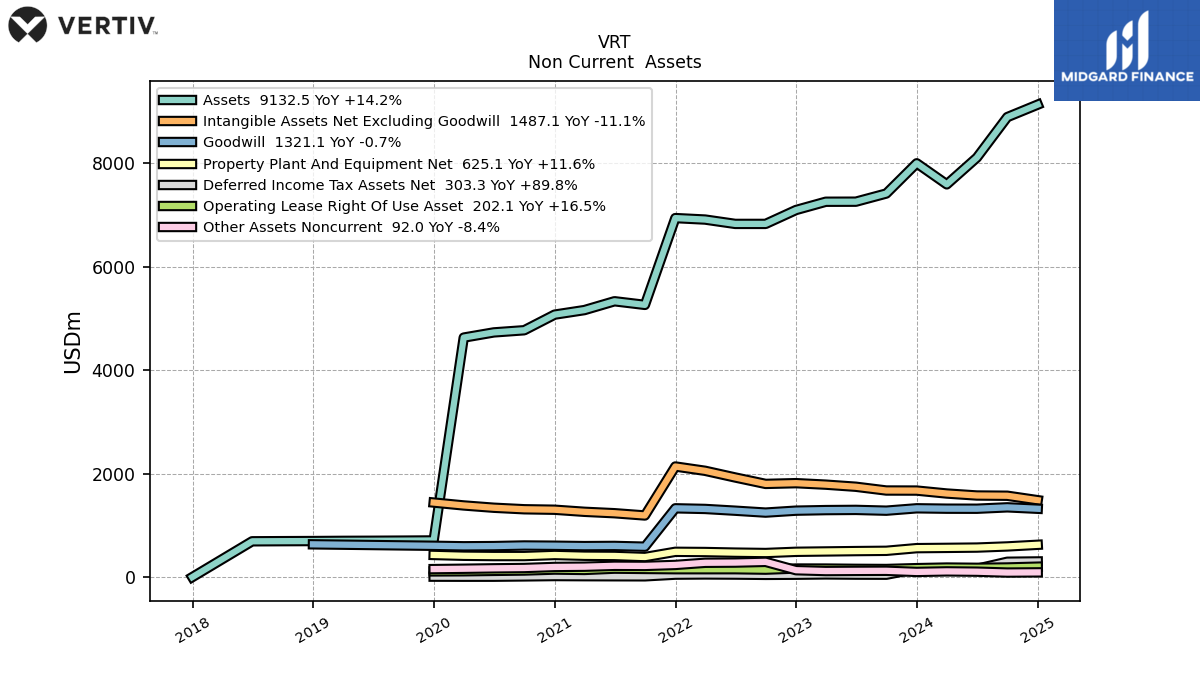
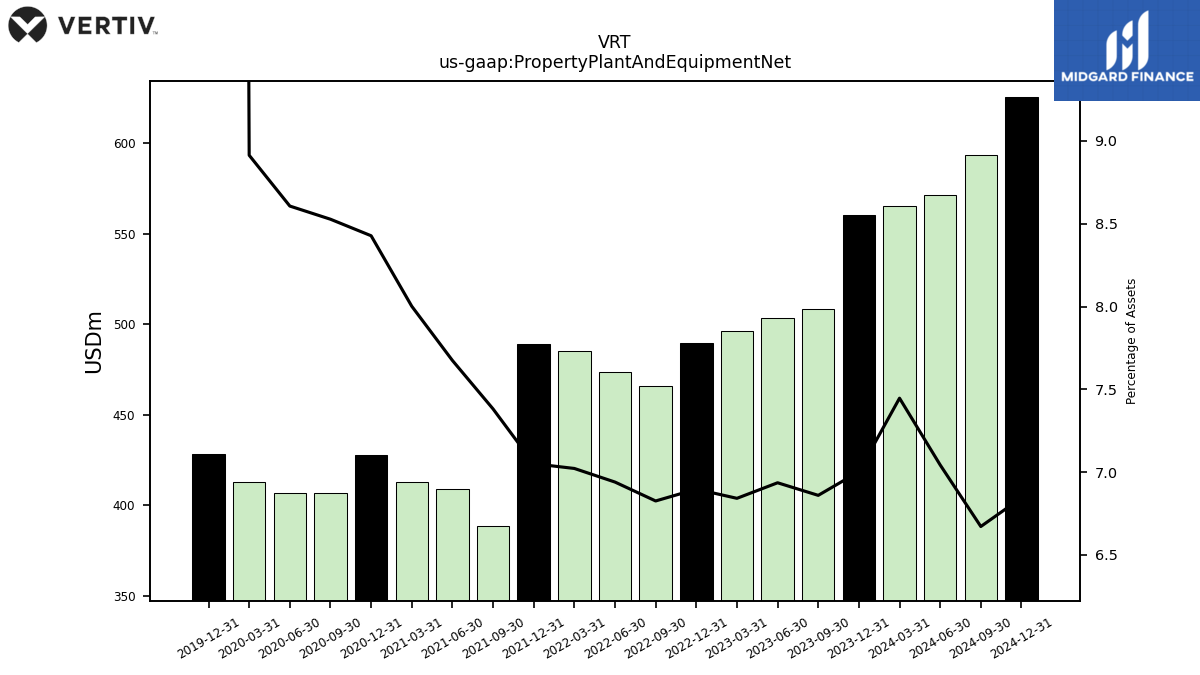
| Property Plant And Equipment Net | 560.10 | 508.60 | 503.30 | 496.40 | 489.40 | 466.00 | 473.80 | 485.30 | 489.30 | 388.40 | 409.20 | 413.00 | 427.60 | 406.90 | 407.10 | 412.70 | 428.20 | NA | NA | NA | NA | NA | NA | NA | NA | NA | NA | |
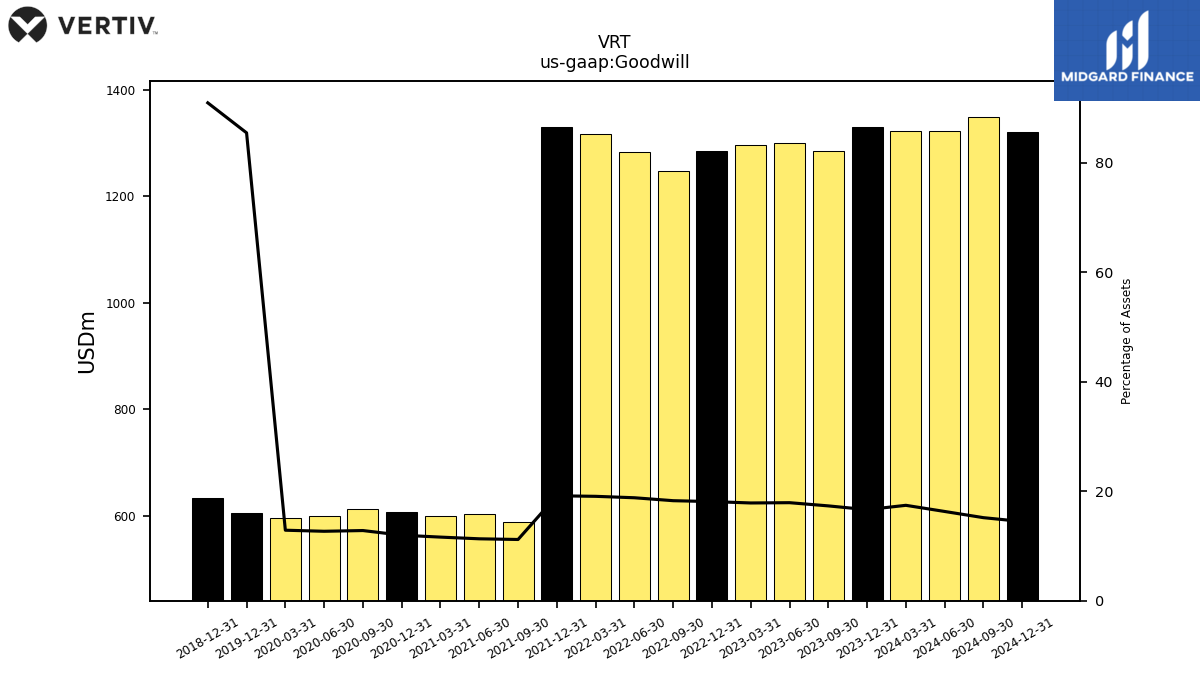
| Goodwill | 1330.30 | 1284.30 | 1299.40 | 1295.40 | 1284.70 | 1247.30 | 1283.90 | 1317.70 | 1330.10 | 588.60 | 603.10 | 599.80 | 607.20 | 611.70 | 600.00 | 596.30 | 605.80 | NA | NA | NA | 634.00 | NA | NA | NA | NA | NA | NA | |
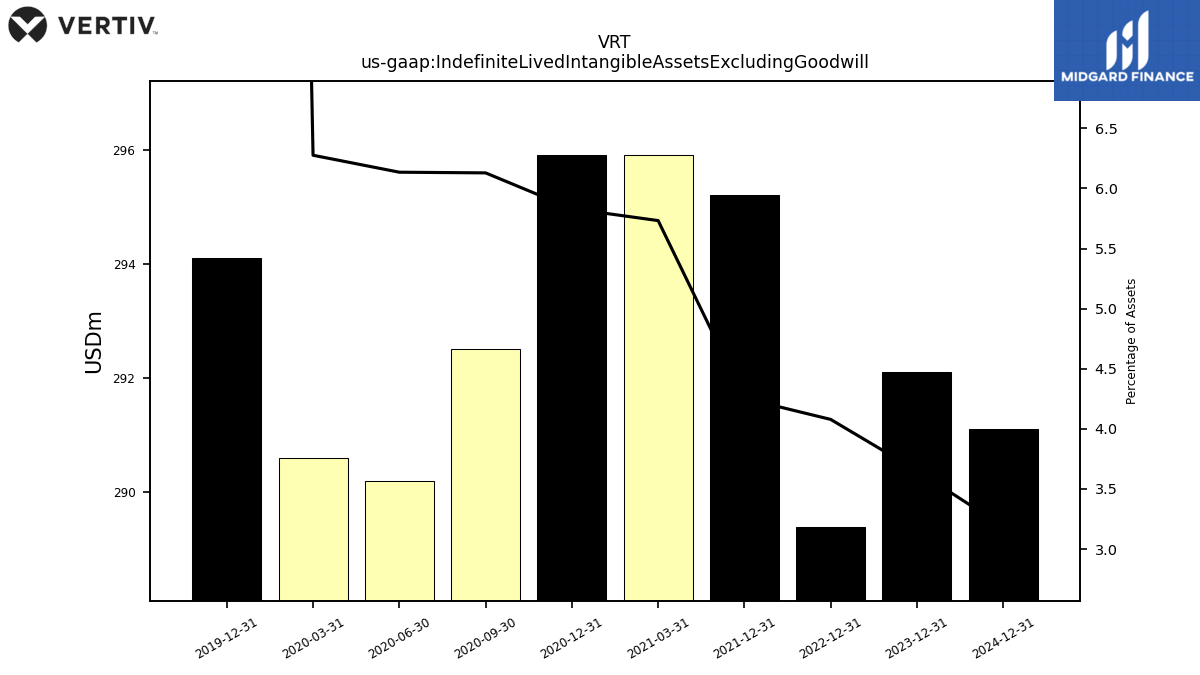
| Indefinite Lived Intangible Assets Excluding Goodwill | 292.10 | NA | NA | NA | 289.40 | NA | NA | NA | 295.20 | NA | NA | 295.90 | 295.90 | 292.50 | 290.20 | 290.60 | 294.10 | NA | NA | NA | NA | NA | NA | NA | NA | NA | NA | |
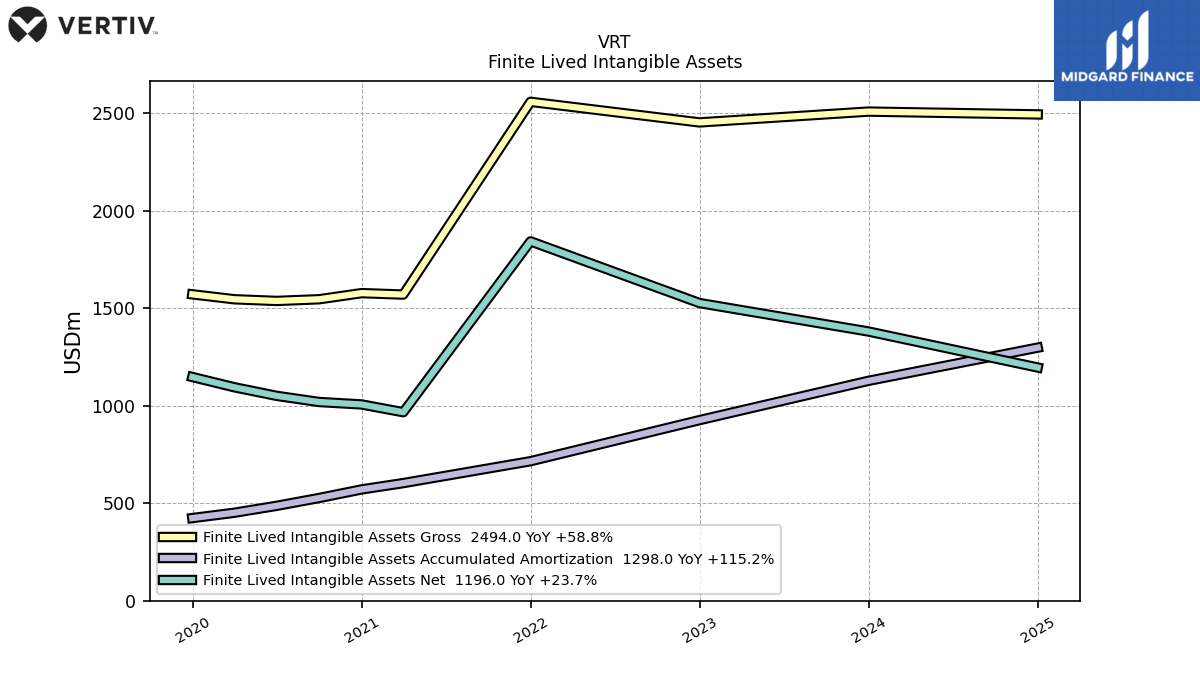
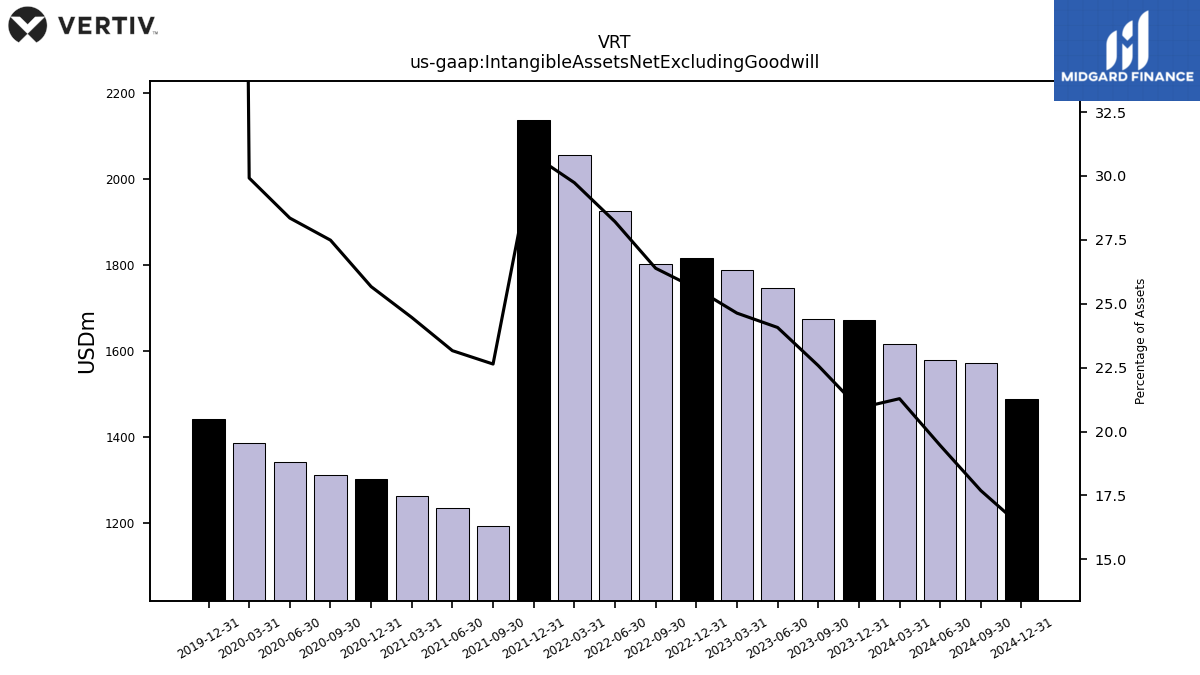
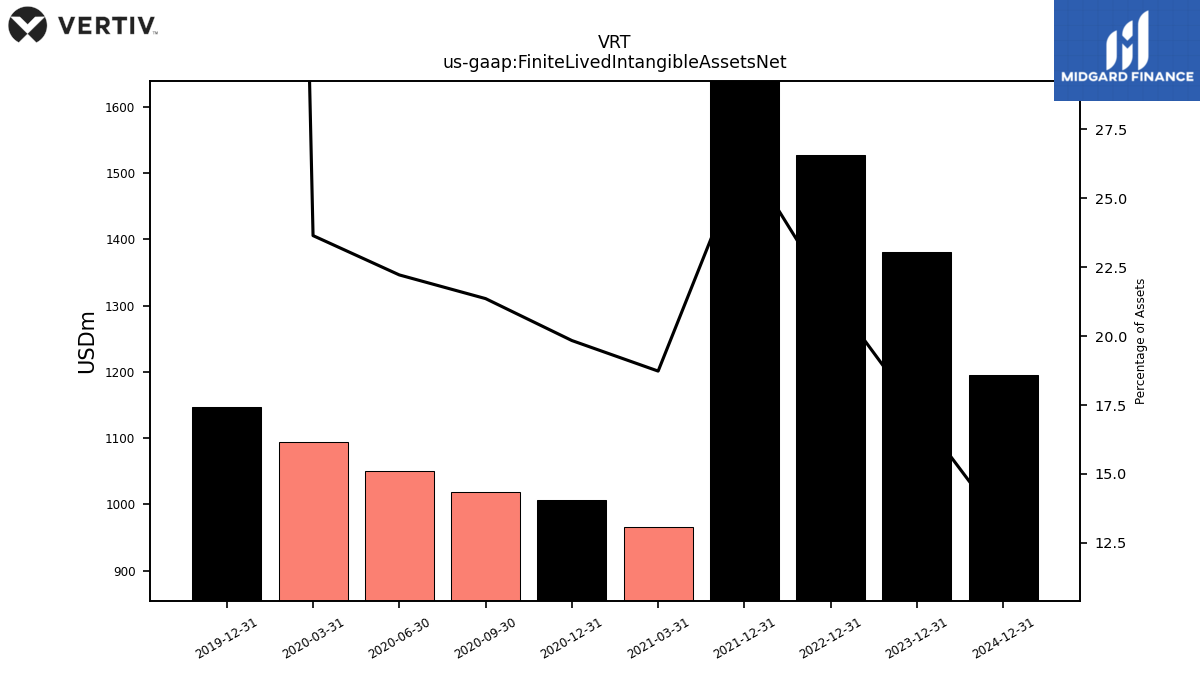
| Intangible Assets Net Excluding Goodwill | 1672.90 | 1674.10 | 1746.80 | 1787.30 | 1816.10 | 1801.60 | 1926.00 | 2055.20 | 2138.20 | 1191.30 | 1235.10 | 1262.70 | 1302.50 | 1311.70 | 1341.10 | 1385.30 | 1441.60 | NA | NA | NA | NA | NA | NA | NA | NA | NA | NA | |
| Finite Lived Intangible Assets Net | 1380.80 | NA | NA | NA | 1526.70 | NA | NA | NA | 1843.00 | NA | NA | 966.80 | 1006.60 | 1019.20 | 1050.90 | 1094.70 | 1147.50 | NA | NA | NA | NA | NA | NA | NA | NA | NA | NA | |
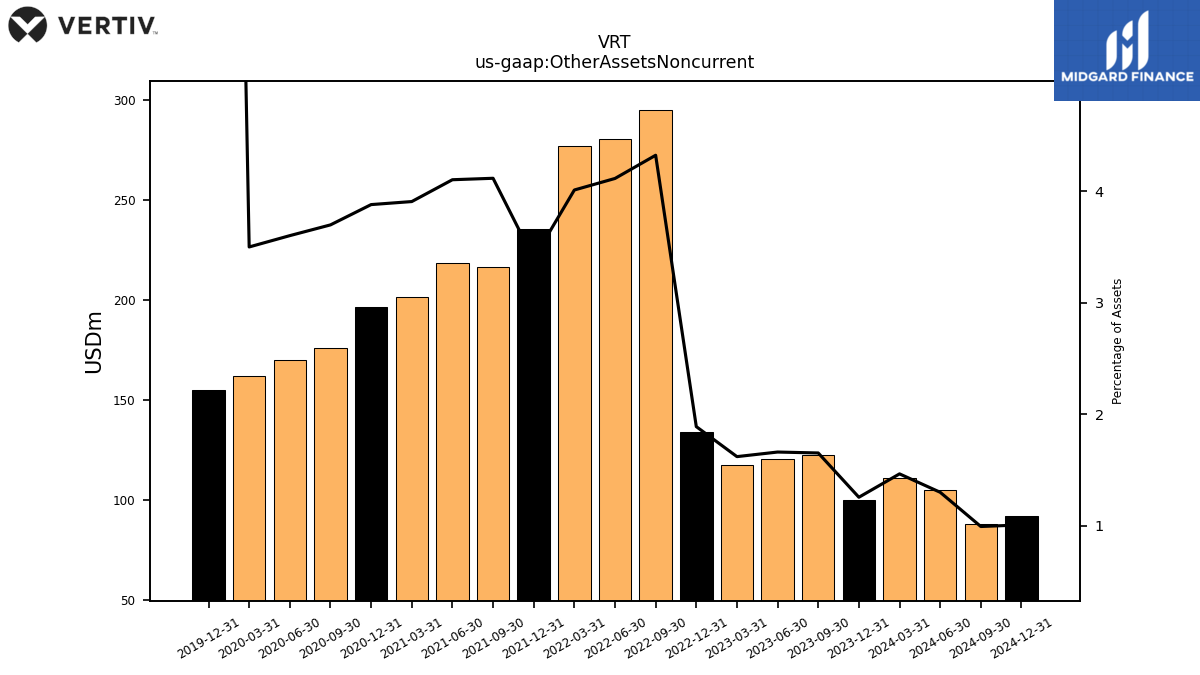
| Other Assets Noncurrent | 100.40 | 122.50 | 120.50 | 117.50 | 134.00 | 295.00 | 280.80 | 277.10 | 235.50 | 216.50 | 218.70 | 201.60 | 196.80 | 176.40 | 170.30 | 162.00 | 155.40 | NA | NA | NA | NA | NA | NA | NA | NA | NA | NA |
| 2023-12-31 | 2023-09-30 | 2023-06-30 | 2023-03-31 | 2022-12-31 | 2022-09-30 | 2022-06-30 | 2022-03-31 | 2021-12-31 | 2021-09-30 | 2021-06-30 | 2021-03-31 | 2020-12-31 | 2020-09-30 | 2020-06-30 | 2020-03-31 | 2019-12-31 | 2019-09-30 | 2019-06-30 | 2019-03-31 | 2018-12-31 | 2018-09-30 | 2018-06-30 | 2018-03-31 | 2017-12-31 | 2017-09-30 | 2017-06-30 | ||
|---|---|---|---|---|---|---|---|---|---|---|---|---|---|---|---|---|---|---|---|---|---|---|---|---|---|---|---|---|
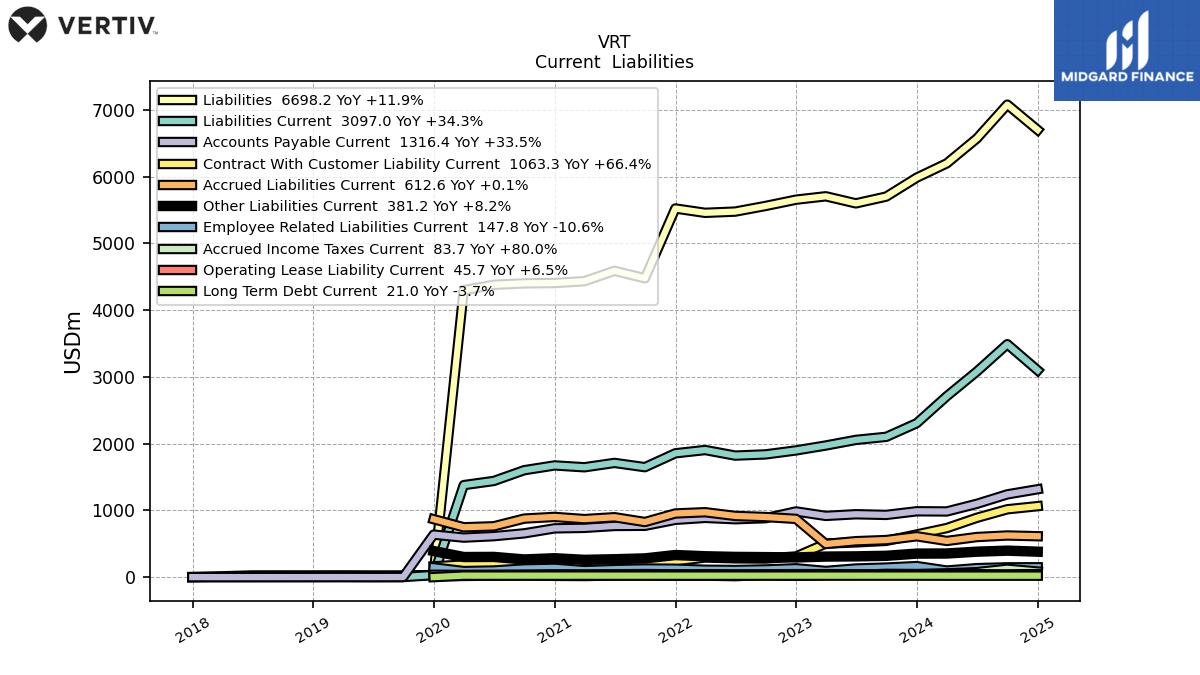
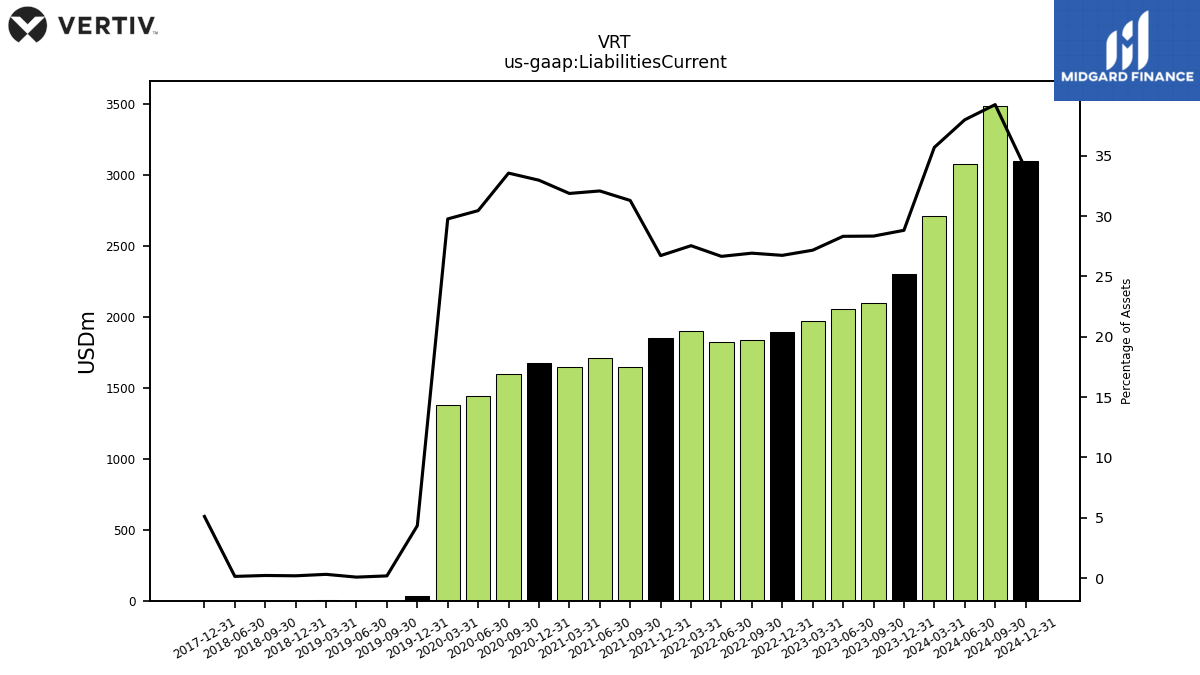
| Liabilities Current | 2305.40 | 2101.50 | 2055.50 | 1971.60 | 1897.90 | 1838.40 | 1820.40 | 1903.80 | 1854.80 | 1646.80 | 1710.80 | 1645.40 | 1673.10 | 1601.60 | 1440.50 | 1378.20 | 30.75 | 1.23 | 0.51 | 2.12 | 1.28 | 1.45 | 0.92 | NA | 0.00 | NA | NA | |
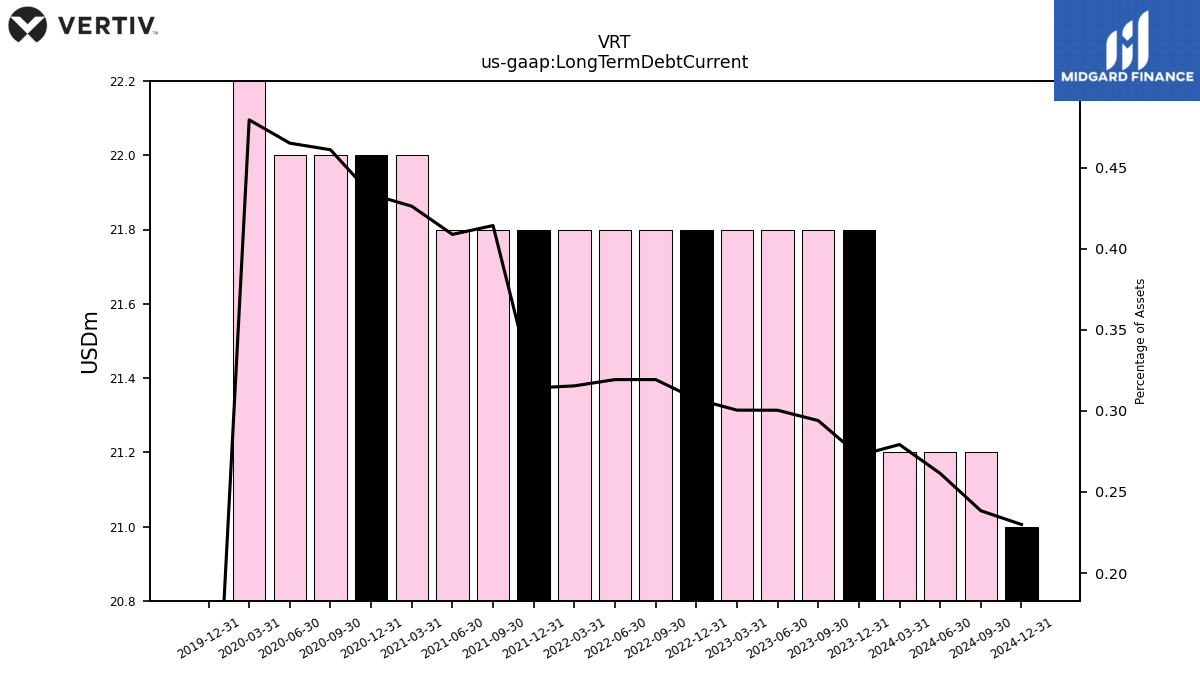
| Long Term Debt Current | 21.80 | 21.80 | 21.80 | 21.80 | 21.80 | 21.80 | 21.80 | 21.80 | 21.80 | 21.80 | 21.80 | 22.00 | 22.00 | 22.00 | 22.00 | 22.20 | 0.00 | NA | NA | NA | NA | NA | NA | NA | NA | NA | NA | |
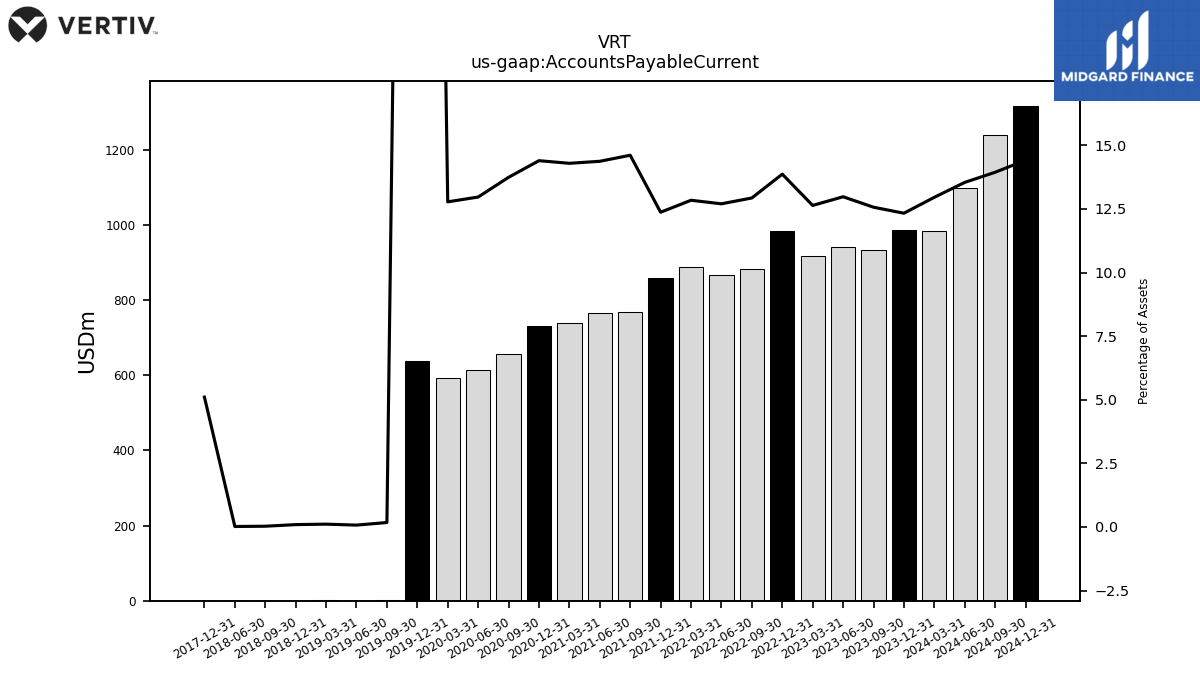
| Accounts Payable Current | 986.40 | 931.90 | 941.90 | 917.00 | 984.00 | 882.90 | 867.20 | 887.50 | 858.50 | 768.80 | 766.40 | 737.80 | 730.50 | 655.80 | 613.40 | 591.70 | 636.80 | 1.23 | 0.51 | 0.77 | 0.64 | 0.20 | 0.13 | NA | 0.00 | NA | NA | |
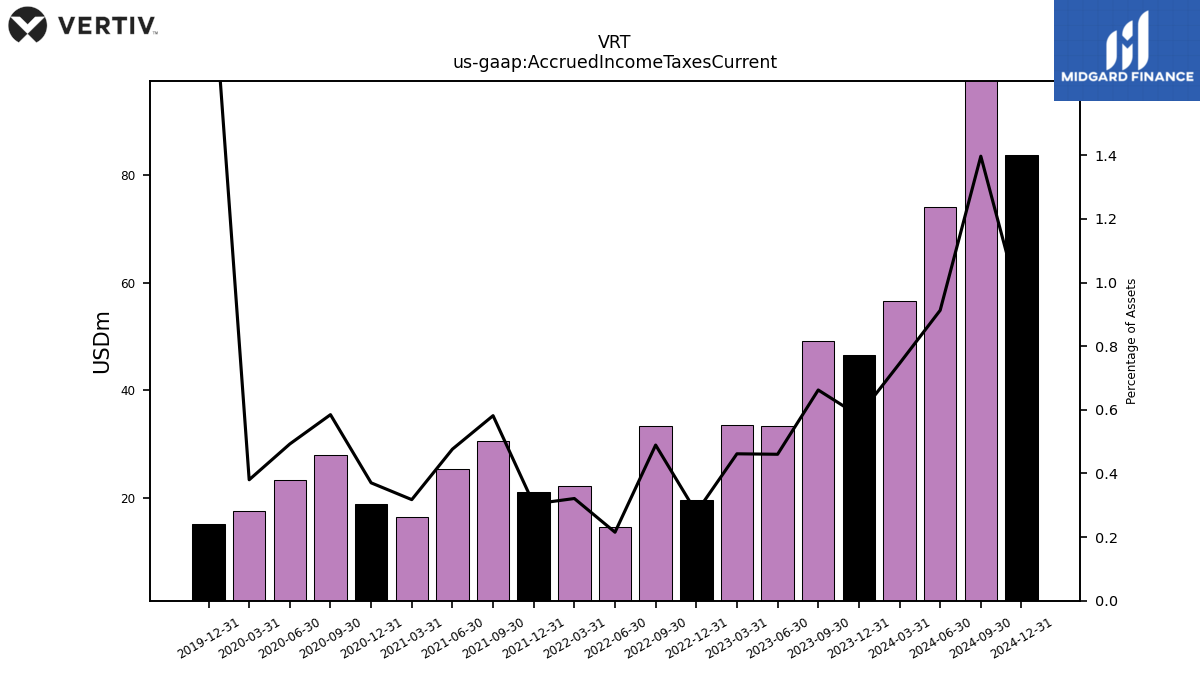
| Accrued Income Taxes Current | 46.50 | 49.10 | 33.40 | 33.50 | 19.70 | 33.40 | 14.70 | 22.20 | 21.10 | 30.60 | 25.40 | 16.40 | 18.80 | 27.90 | 23.30 | 17.60 | 15.20 | NA | NA | NA | NA | NA | NA | NA | NA | NA | NA | |
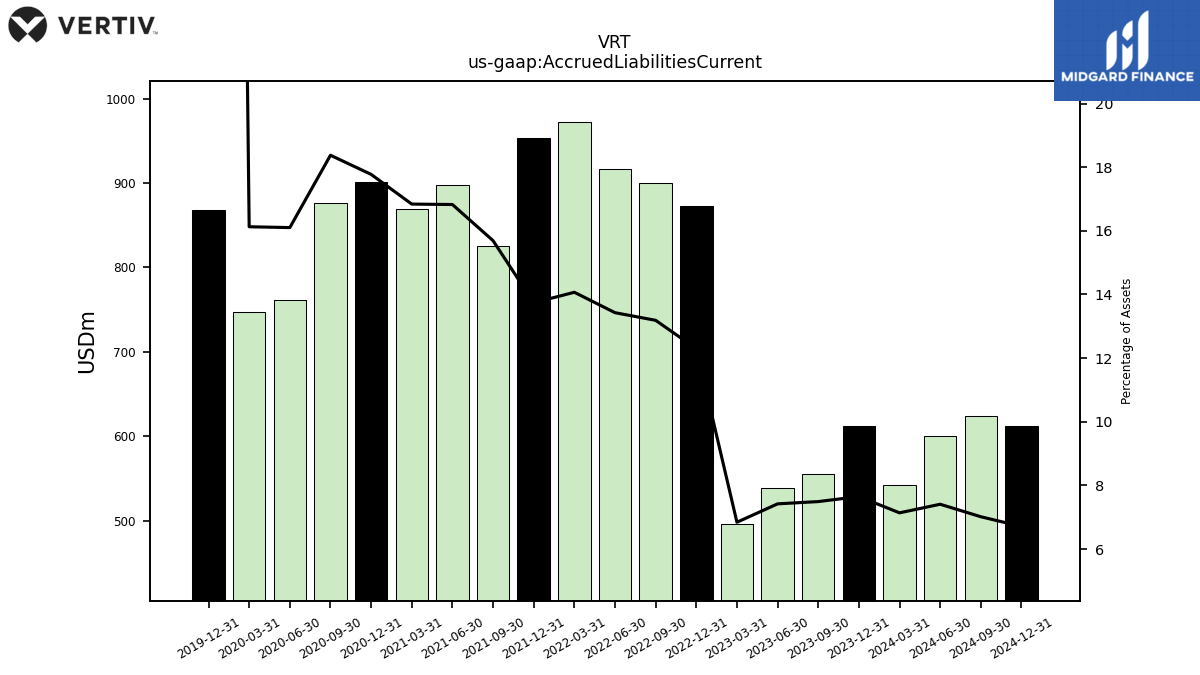
| Accrued Liabilities Current | 611.80 | 555.40 | 538.40 | 496.40 | 872.40 | 900.30 | 916.70 | 972.30 | 953.40 | 825.60 | 897.20 | 869.20 | 901.80 | 876.80 | 761.60 | 746.70 | 867.70 | NA | NA | NA | NA | NA | NA | NA | NA | NA | NA | |
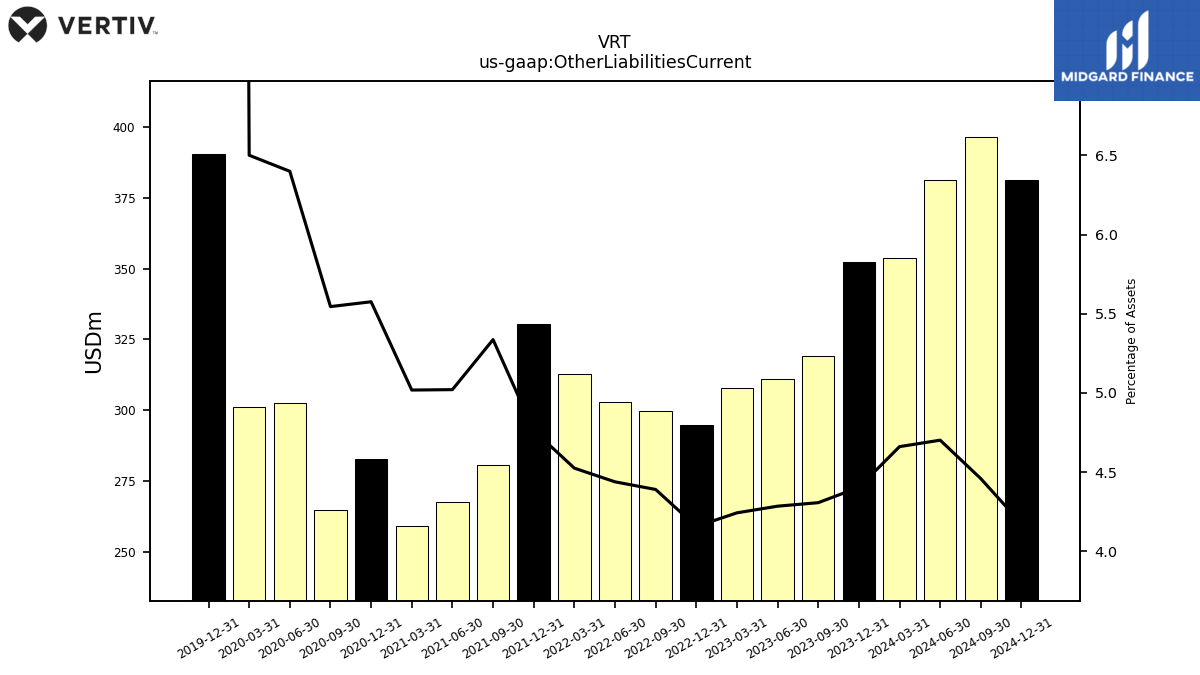
| Other Liabilities Current | 352.20 | 319.30 | 310.90 | 307.80 | 294.90 | 299.70 | 303.00 | 312.70 | 330.50 | 280.80 | 267.70 | 259.00 | 282.90 | 264.60 | 302.70 | 301.00 | 390.30 | NA | NA | NA | NA | NA | NA | NA | NA | NA | NA | |
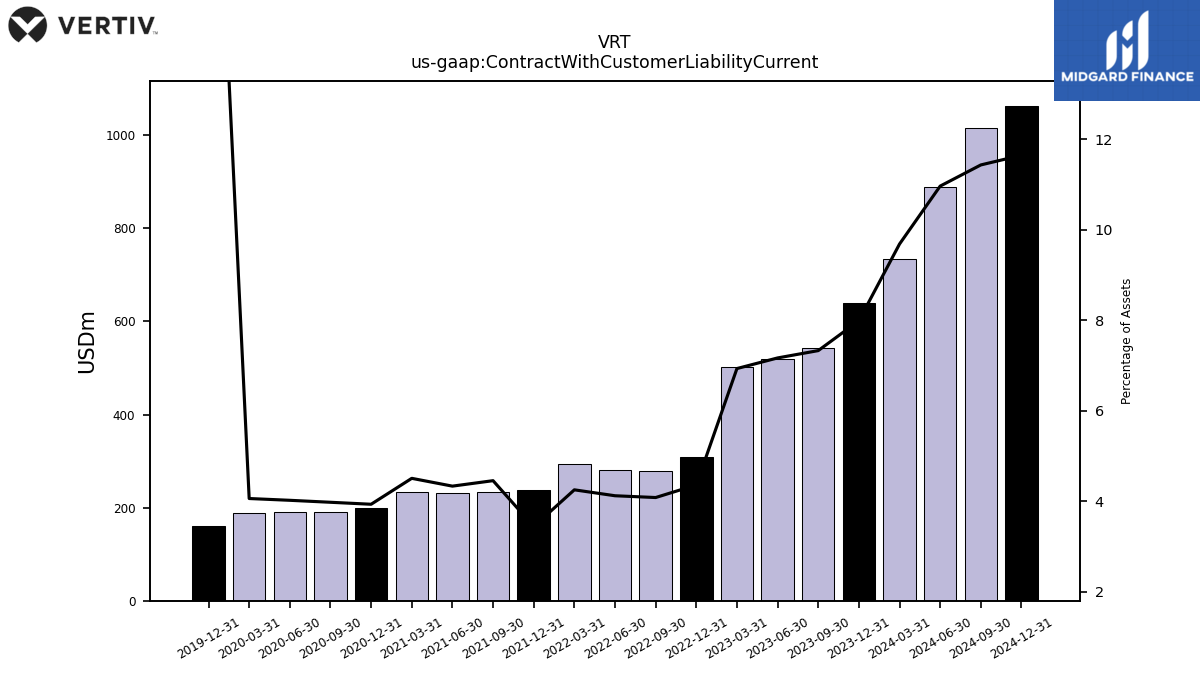
| Contract With Customer Liability Current | 638.90 | 543.30 | 520.00 | 502.90 | 309.40 | 278.70 | 281.40 | 293.90 | 238.90 | 234.40 | 231.10 | 232.60 | 199.60 | 189.80 | 190.20 | 188.00 | 160.90 | NA | NA | NA | NA | NA | NA | NA | NA | NA | NA |
| 2023-12-31 | 2023-09-30 | 2023-06-30 | 2023-03-31 | 2022-12-31 | 2022-09-30 | 2022-06-30 | 2022-03-31 | 2021-12-31 | 2021-09-30 | 2021-06-30 | 2021-03-31 | 2020-12-31 | 2020-09-30 | 2020-06-30 | 2020-03-31 | 2019-12-31 | 2019-09-30 | 2019-06-30 | 2019-03-31 | 2018-12-31 | 2018-09-30 | 2018-06-30 | 2018-03-31 | 2017-12-31 | 2017-09-30 | 2017-06-30 | ||
|---|---|---|---|---|---|---|---|---|---|---|---|---|---|---|---|---|---|---|---|---|---|---|---|---|---|---|---|---|
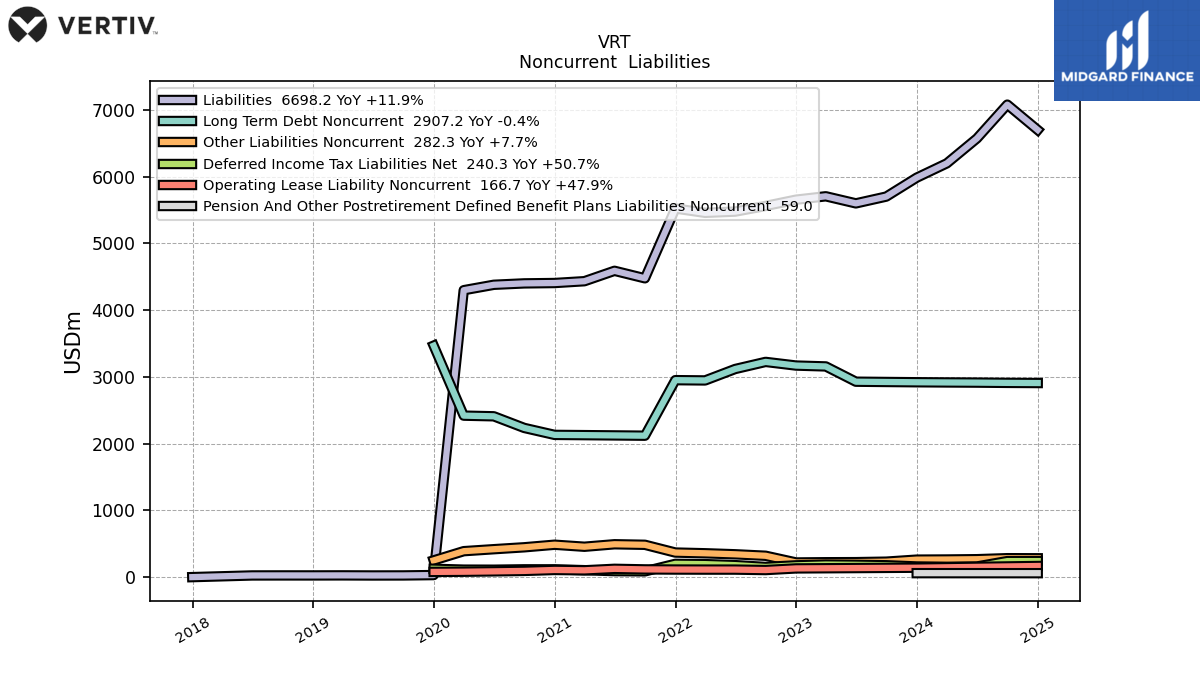
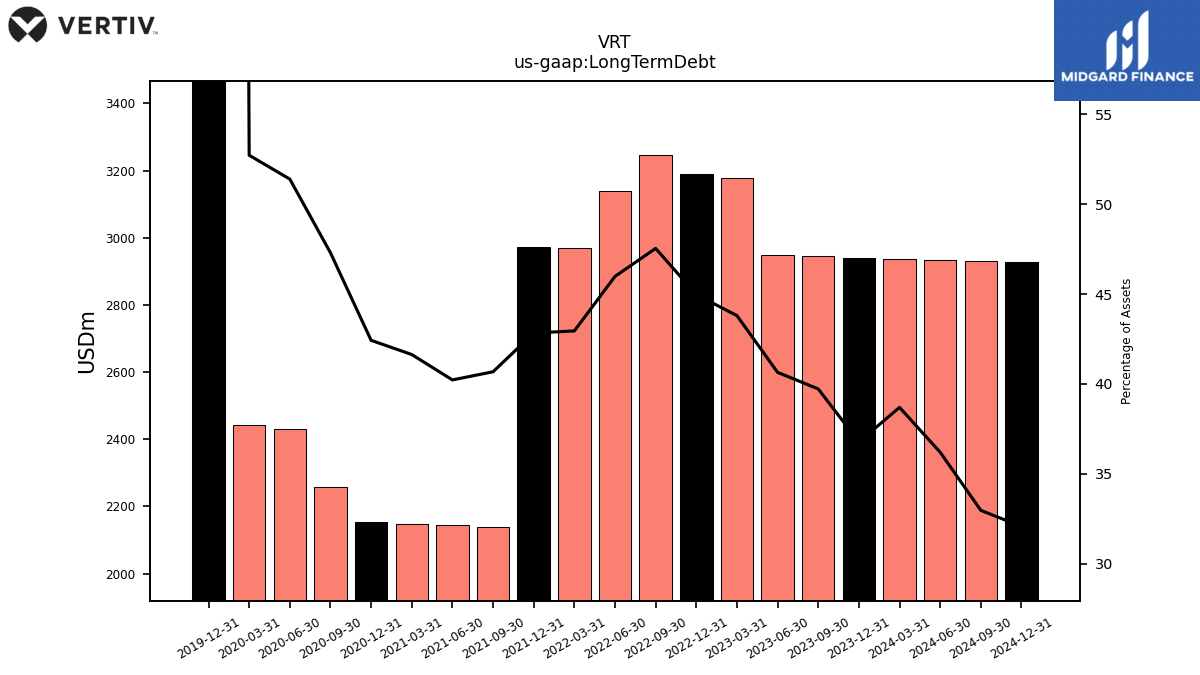
| Long Term Debt | 2940.90 | 2944.90 | 2949.20 | 3177.80 | 3190.90 | 3245.60 | 3139.30 | 2968.10 | 2972.30 | 2140.20 | 2144.60 | 2148.90 | 2152.50 | 2256.80 | 2431.00 | 2441.10 | 3467.30 | NA | NA | NA | NA | NA | NA | NA | NA | NA | NA | |
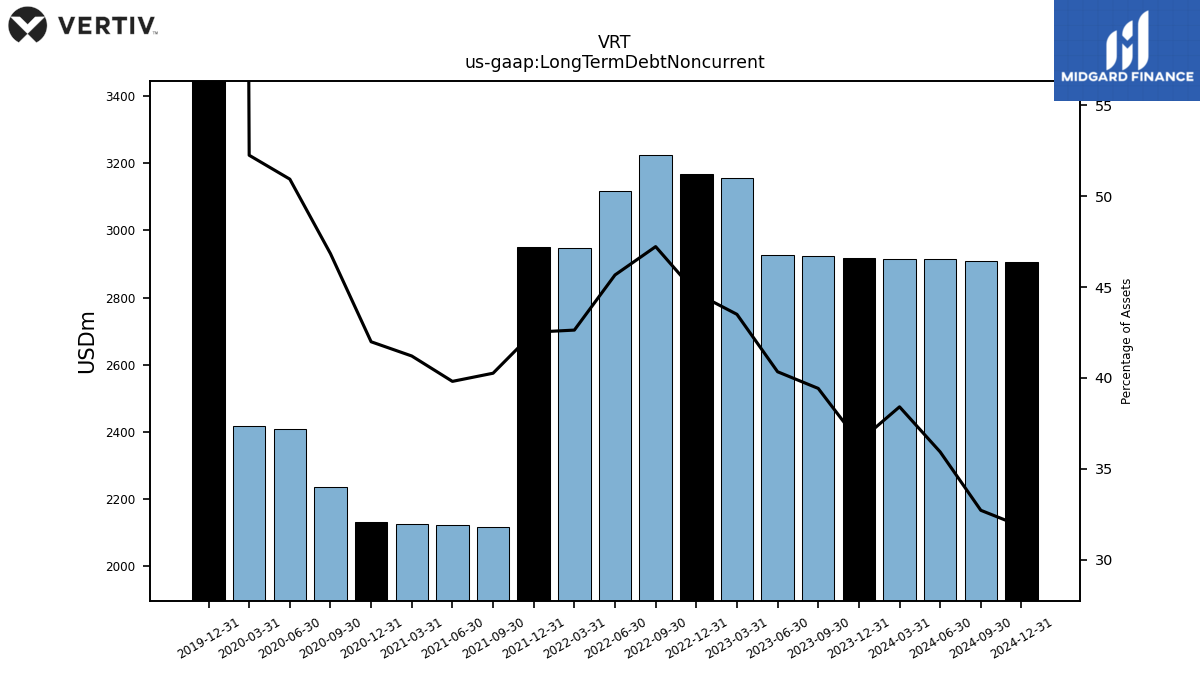
| Long Term Debt Noncurrent | 2919.10 | 2923.10 | 2927.40 | 3156.00 | 3169.10 | 3223.80 | 3117.50 | 2946.30 | 2950.50 | 2118.40 | 2122.80 | 2126.90 | 2130.50 | 2234.80 | 2409.00 | 2418.90 | 3467.30 | NA | NA | NA | NA | NA | NA | NA | NA | NA | NA | |
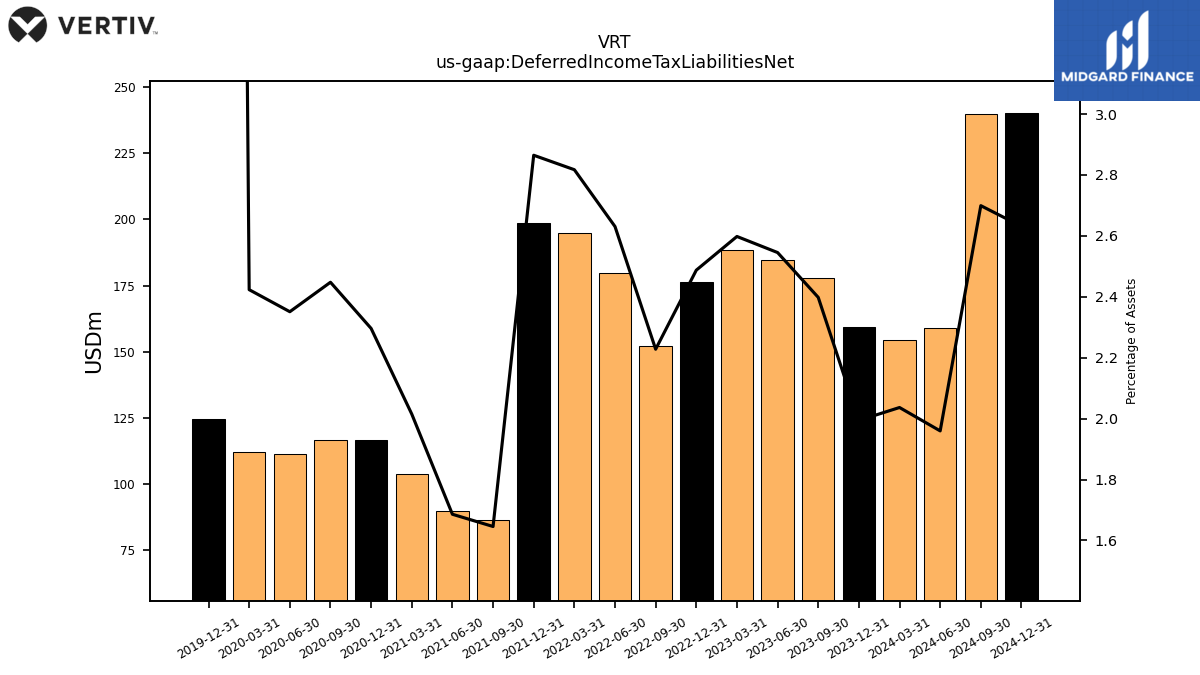
| Deferred Income Tax Liabilities Net | 159.50 | 177.80 | 184.70 | 188.50 | 176.50 | 152.10 | 179.60 | 194.70 | 198.80 | 86.60 | 89.90 | 104.00 | 116.50 | 116.80 | 111.20 | 112.20 | 124.70 | NA | NA | NA | NA | NA | NA | NA | NA | NA | NA | |
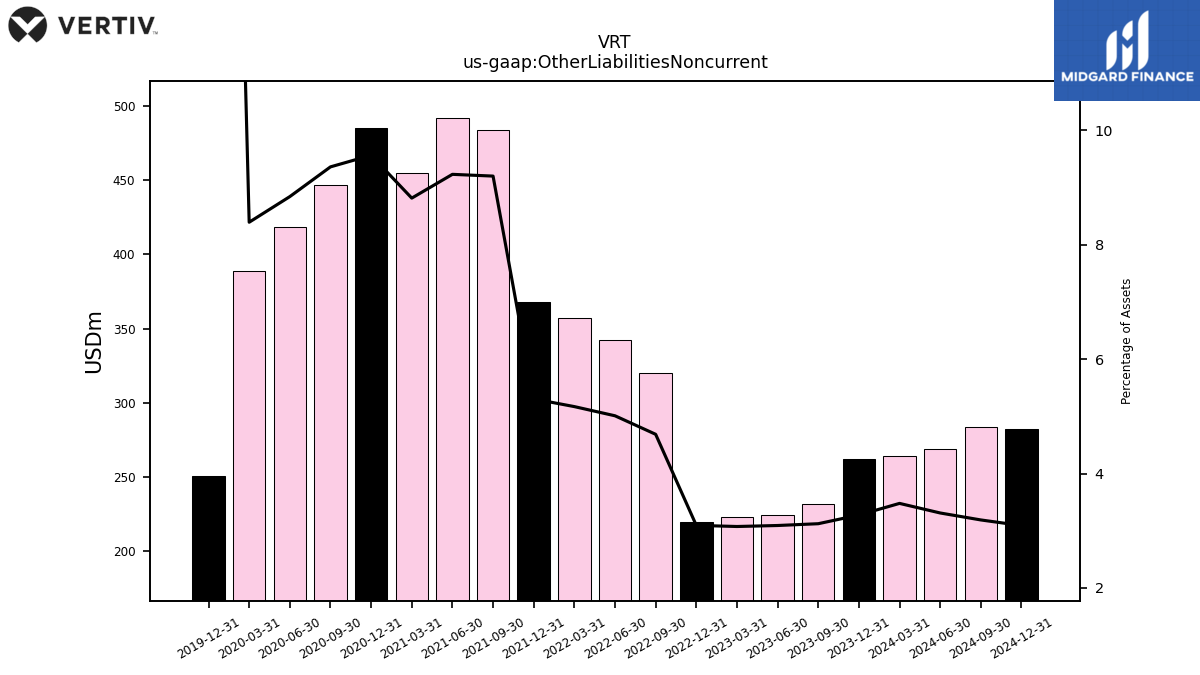
| Other Liabilities Noncurrent | 262.00 | 231.60 | 224.40 | 223.10 | 219.60 | 320.00 | 342.10 | 357.40 | 368.20 | 484.20 | 492.30 | 455.10 | 485.40 | 446.80 | 418.30 | 388.70 | 250.50 | NA | NA | NA | NA | NA | NA | NA | NA | NA | NA | |
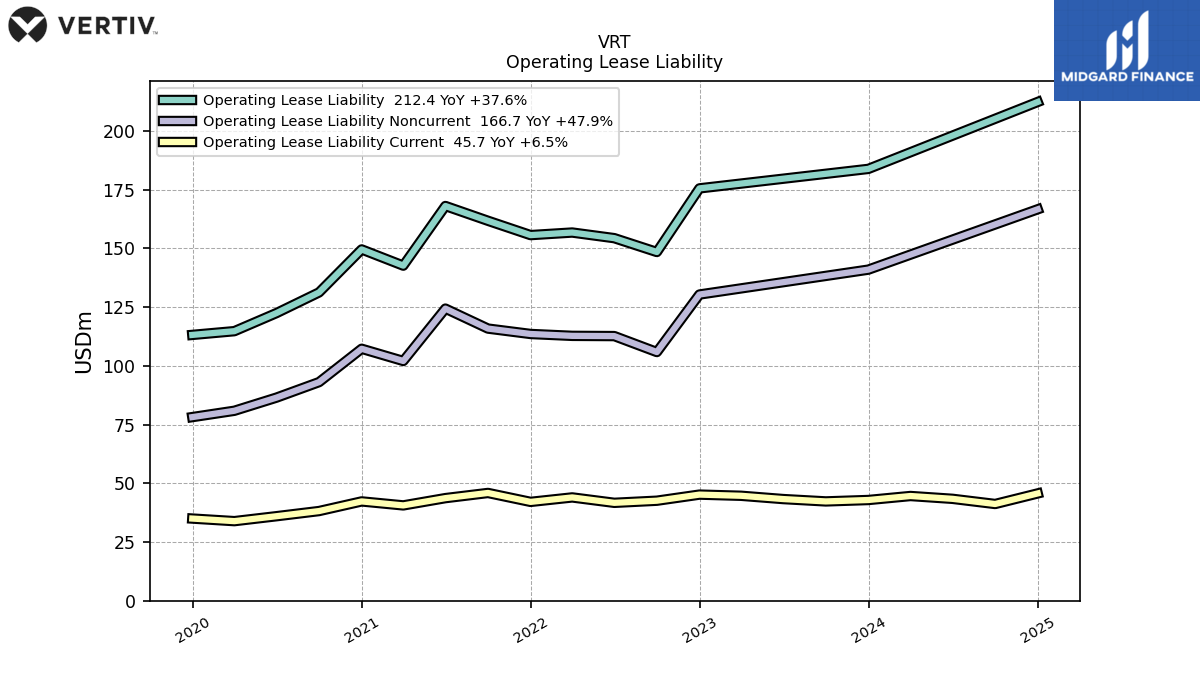
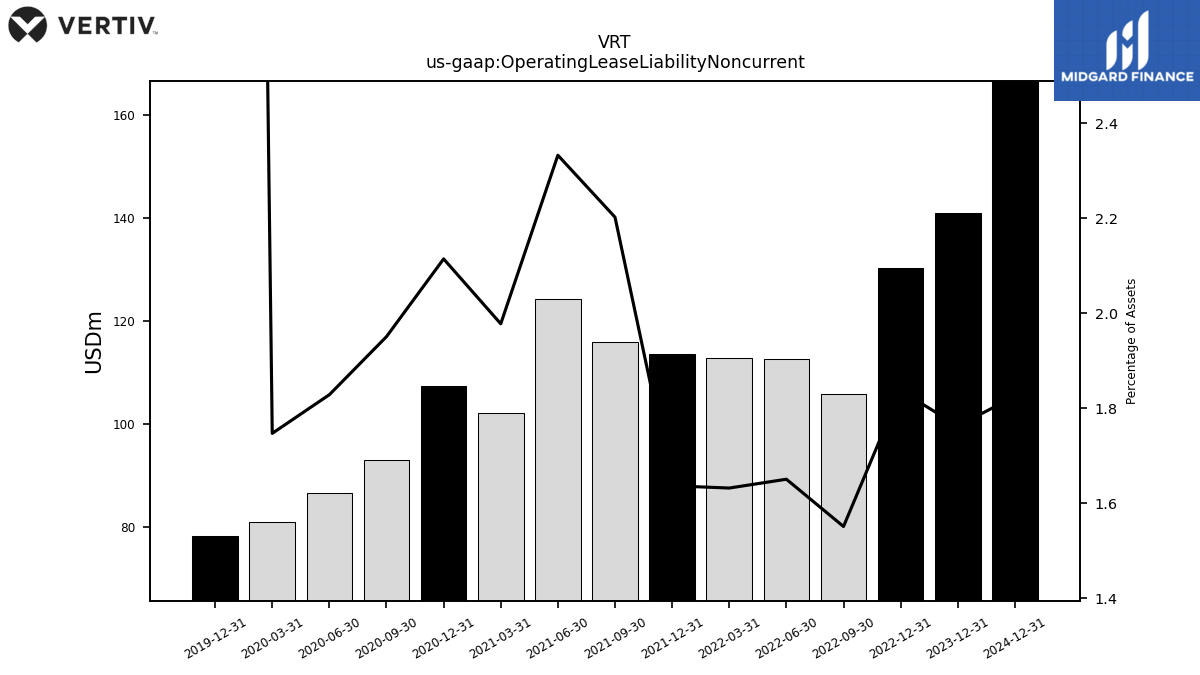
| Operating Lease Liability Noncurrent | 141.00 | NA | NA | NA | 130.40 | 105.90 | 112.70 | 112.80 | 113.60 | 115.90 | 124.40 | 102.10 | 107.30 | 93.10 | 86.50 | 80.90 | 78.20 | NA | NA | NA | NA | NA | NA | NA | NA | NA | NA |
| 2023-12-31 | 2023-09-30 | 2023-06-30 | 2023-03-31 | 2022-12-31 | 2022-09-30 | 2022-06-30 | 2022-03-31 | 2021-12-31 | 2021-09-30 | 2021-06-30 | 2021-03-31 | 2020-12-31 | 2020-09-30 | 2020-06-30 | 2020-03-31 | 2019-12-31 | 2019-09-30 | 2019-06-30 | 2019-03-31 | 2018-12-31 | 2018-09-30 | 2018-06-30 | 2018-03-31 | 2017-12-31 | 2017-09-30 | 2017-06-30 | ||
|---|---|---|---|---|---|---|---|---|---|---|---|---|---|---|---|---|---|---|---|---|---|---|---|---|---|---|---|---|
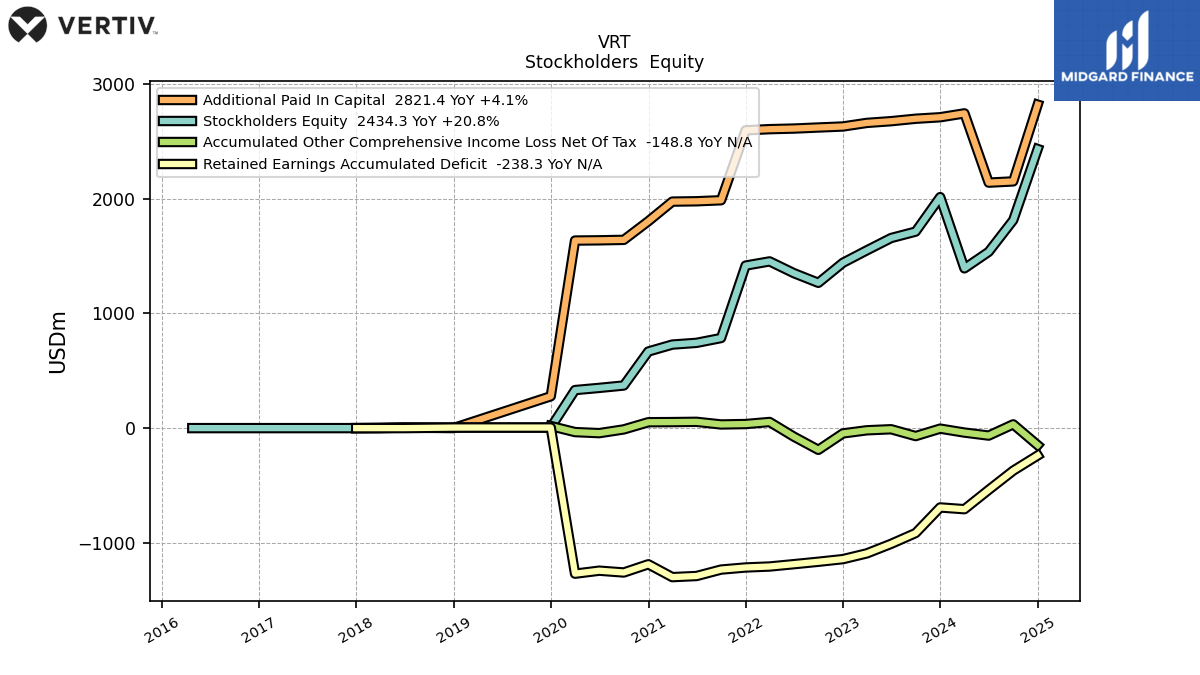
| Stockholders Equity | 2014.90 | 1713.90 | 1658.10 | 1550.80 | 1441.90 | 1267.10 | 1351.70 | 1454.10 | 1417.70 | 785.70 | 743.70 | 728.70 | 668.30 | 371.70 | 350.90 | 331.90 | 5.00 | 5.00 | 5.00 | 5.00 | 5.00 | 5.00 | 5.00 | 0.02 | 0.02 | NA | NA | |
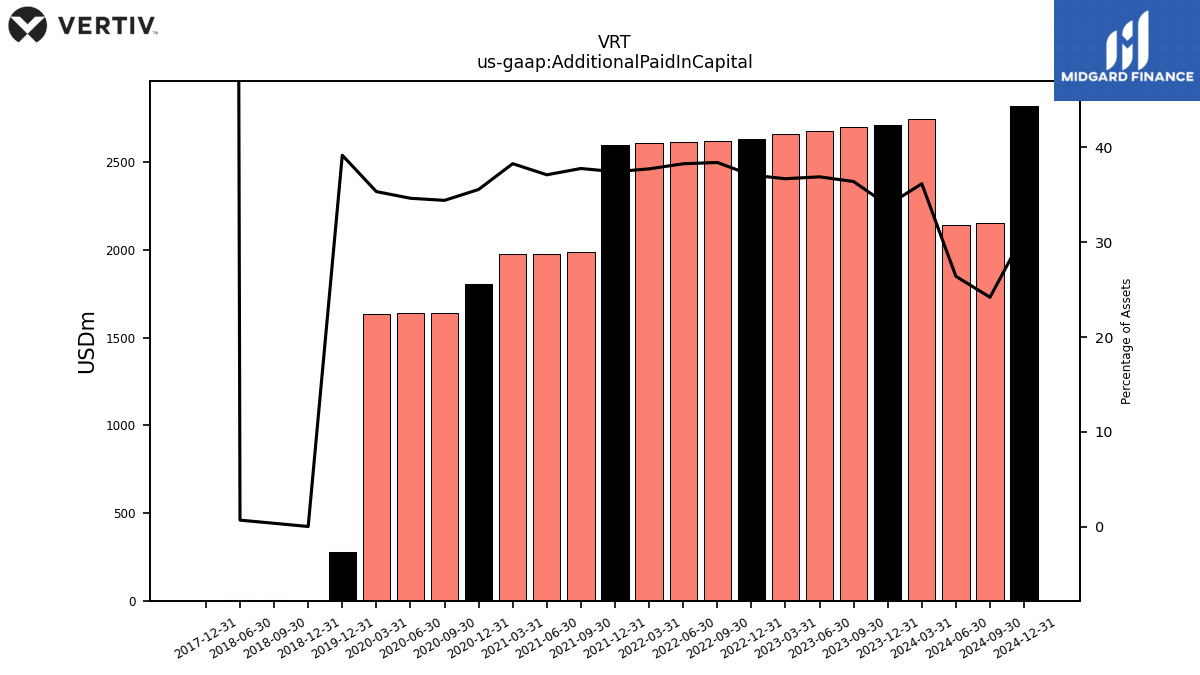
| Additional Paid In Capital | 2711.30 | 2698.30 | 2677.00 | 2662.00 | 2630.70 | 2621.90 | 2612.60 | 2607.40 | 2597.50 | 1987.30 | 1978.50 | 1975.60 | 1804.30 | 1641.90 | 1638.00 | 1635.90 | 277.70 | NA | NA | NA | 0.27 | 2.62 | 4.92 | NA | 0.33 | NA | NA | |
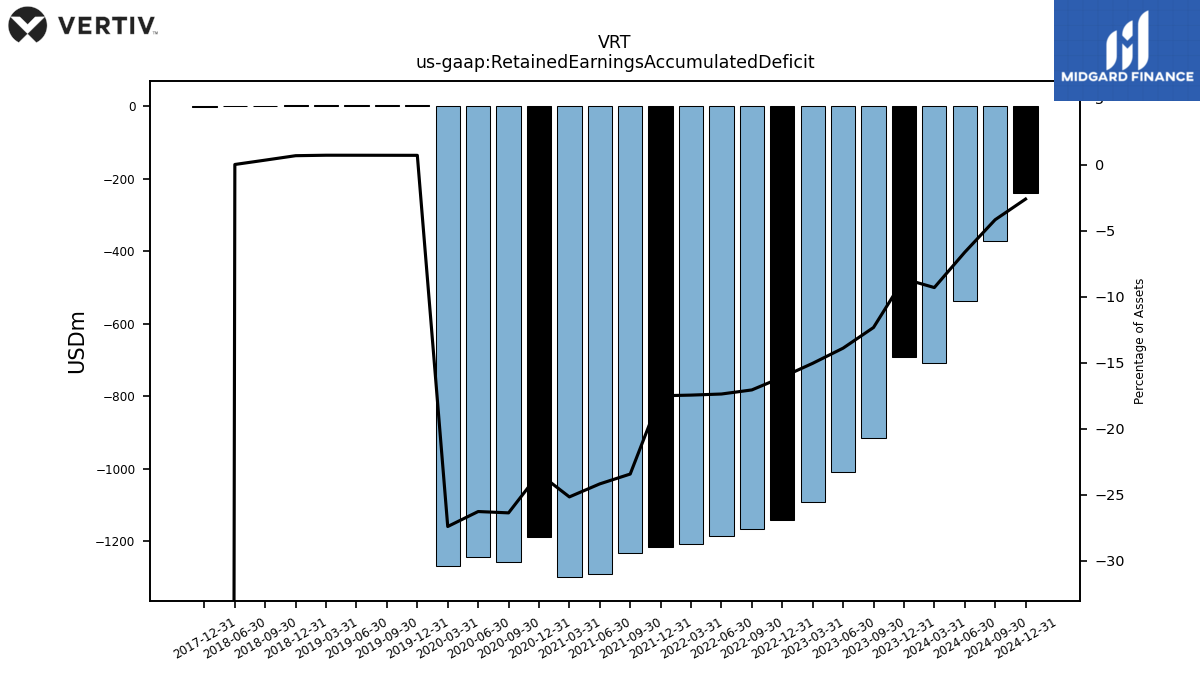
| Retained Earnings Accumulated Deficit | -691.90 | -915.00 | -1009.10 | -1092.30 | -1142.60 | -1165.40 | -1186.60 | -1206.90 | -1215.40 | -1233.60 | -1289.80 | -1299.50 | -1187.50 | -1259.10 | -1243.30 | -1269.50 | 5.00 | 5.00 | 5.00 | 5.00 | 4.73 | 2.38 | 0.08 | NA | -0.30 | NA | NA | |
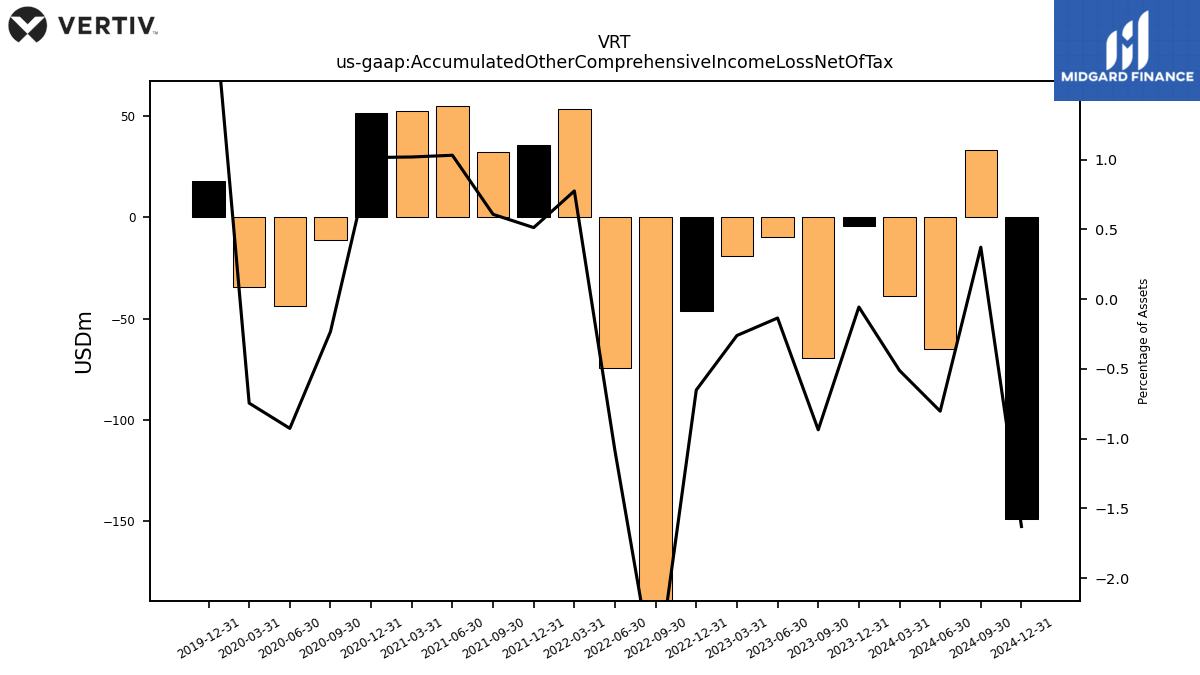
| Accumulated Other Comprehensive Income Loss Net Of Tax | -4.50 | -69.40 | -9.80 | -18.90 | -46.20 | -189.40 | -74.30 | 53.60 | 35.60 | 32.00 | 55.00 | 52.60 | 51.50 | -11.10 | -43.80 | -34.50 | 18.10 | NA | NA | NA | NA | NA | NA | NA | NA | NA | NA |
| 2023-12-31 | 2023-09-30 | 2023-06-30 | 2023-03-31 | 2022-12-31 | 2022-09-30 | 2022-06-30 | 2022-03-31 | 2021-12-31 | 2021-09-30 | 2021-06-30 | 2021-03-31 | 2020-12-31 | 2020-09-30 | 2020-06-30 | 2020-03-31 | 2019-12-31 | 2019-09-30 | 2019-06-30 | 2019-03-31 | 2018-12-31 | 2018-09-30 | 2018-06-30 | 2018-03-31 | 2017-12-31 | 2017-09-30 | 2017-06-30 | ||
|---|---|---|---|---|---|---|---|---|---|---|---|---|---|---|---|---|---|---|---|---|---|---|---|---|---|---|---|---|
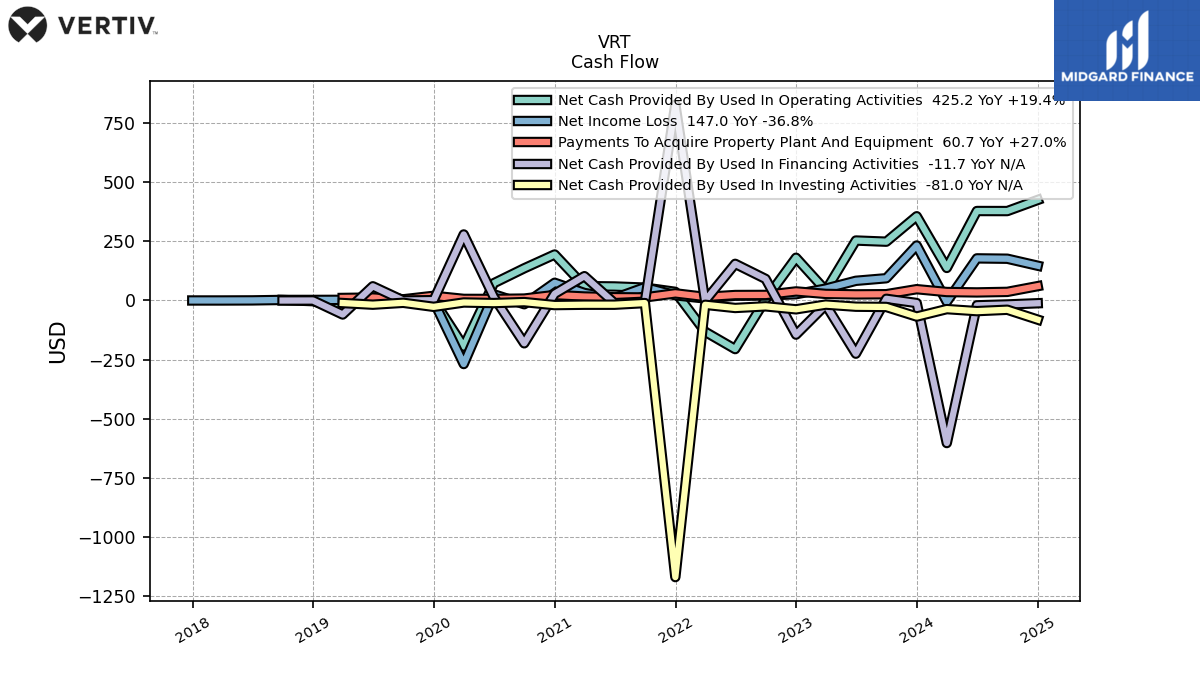
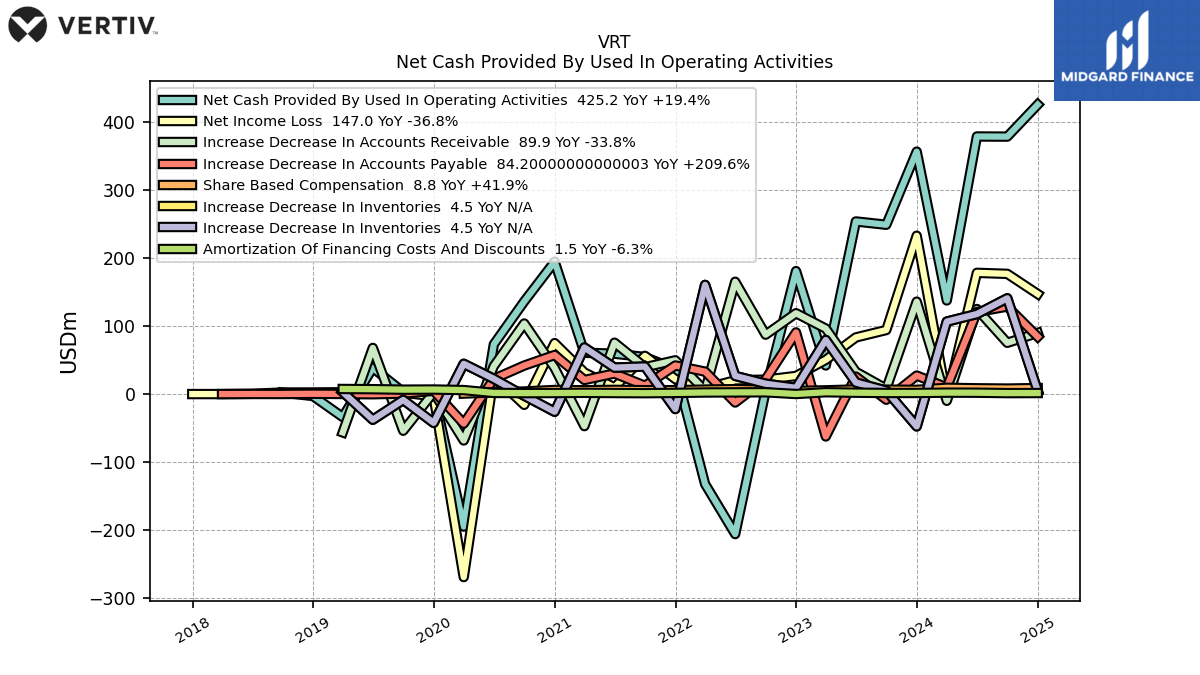
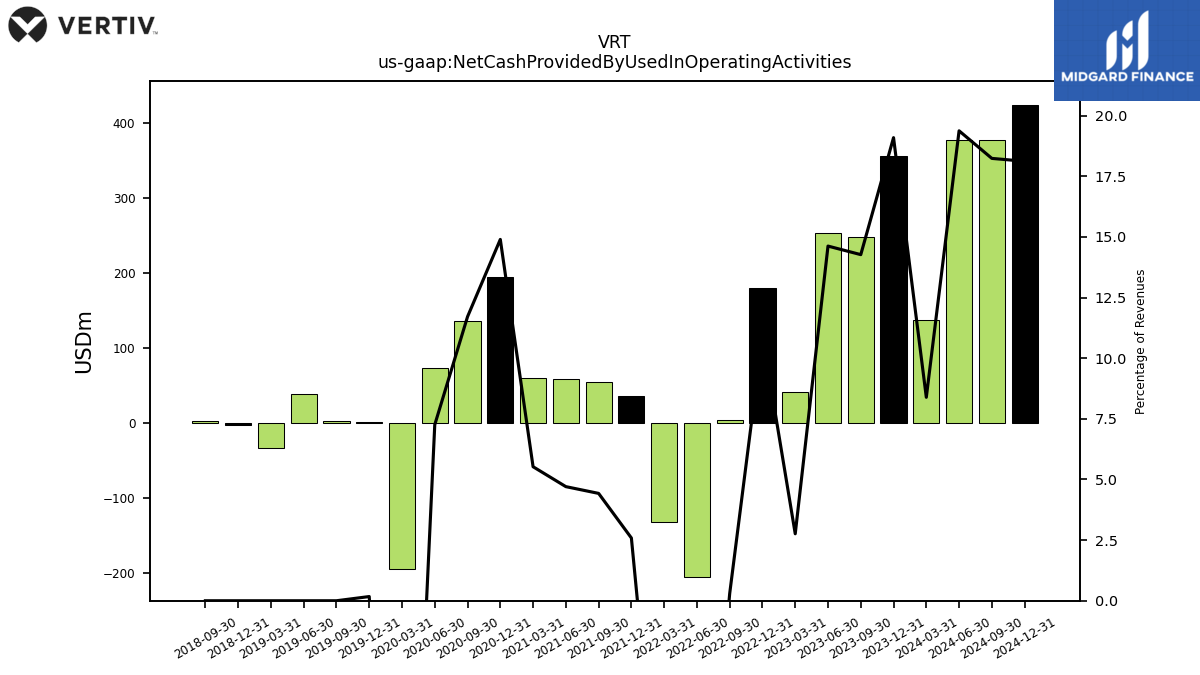
| Net Cash Provided By Used In Operating Activities | 356.20 | 248.70 | 253.60 | 42.00 | 180.70 | 4.40 | -205.70 | -132.20 | 36.50 | 54.40 | 59.30 | 60.70 | 194.50 | 136.10 | 73.00 | -194.70 | 2.03 | 2.96 | 38.44 | -33.70 | -2.85 | 2.11 | NA | NA | NA | NA | NA | |
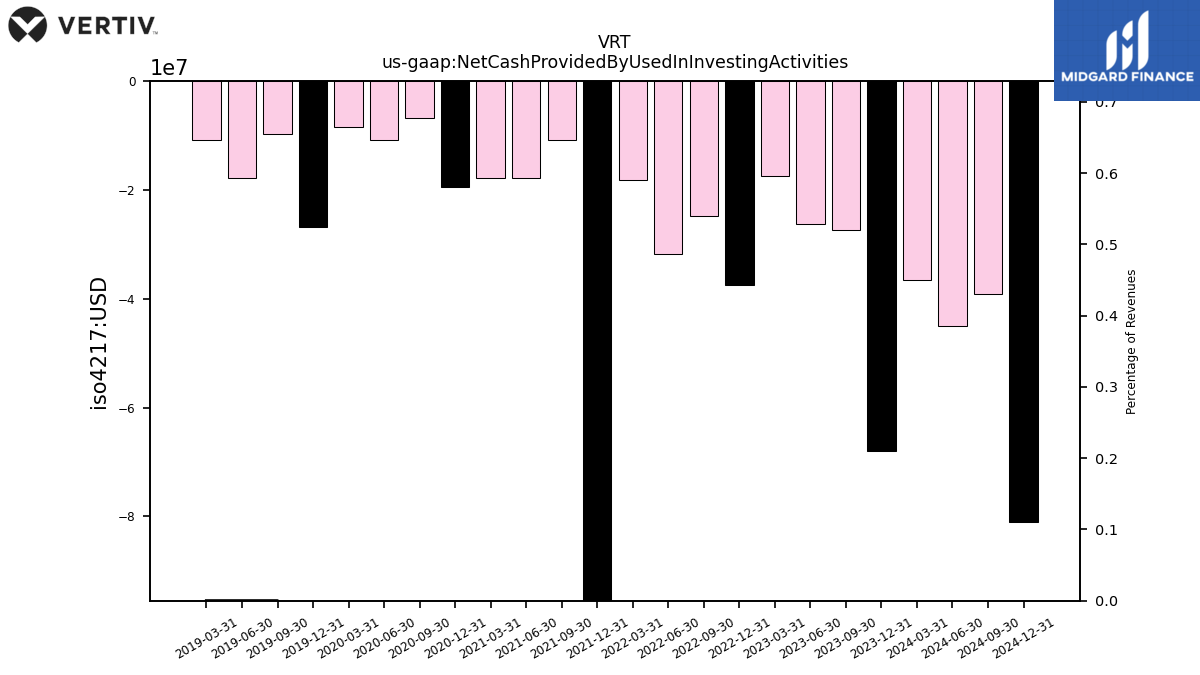
| Net Cash Provided By Used In Investing Activities | -68.00 | -27.40 | -26.30 | -17.40 | -37.40 | -24.80 | -31.70 | -18.20 | -1170.10 | -10.90 | -17.90 | -17.90 | -19.50 | -6.80 | -10.90 | -8.50 | -26.90 | -9.80 | -17.80 | -10.80 | NA | NA | NA | NA | NA | NA | NA | |
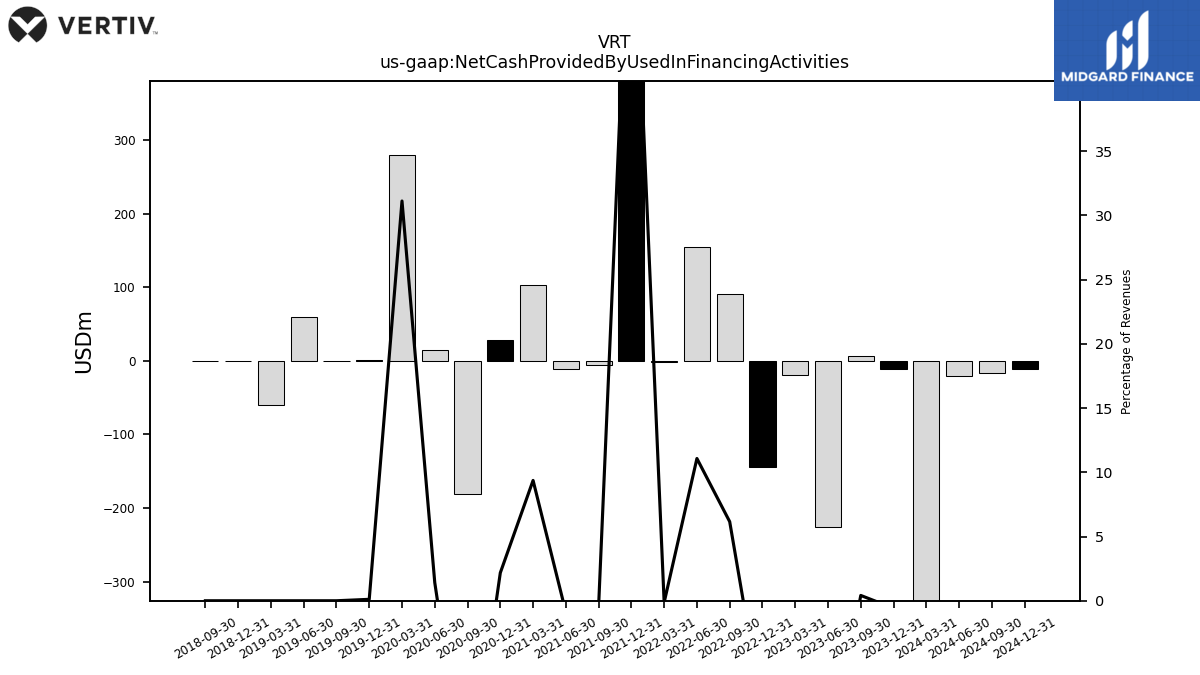
| Net Cash Provided By Used In Financing Activities | -10.80 | 7.20 | -225.10 | -18.80 | -144.50 | 91.20 | 155.00 | -1.50 | 828.40 | -5.20 | -11.20 | 102.90 | 28.40 | -181.20 | 14.20 | 279.30 | 1.30 | 0.00 | 60.10 | -59.40 | 0.00 | -0.24 | NA | NA | NA | NA | NA |
| 2023-12-31 | 2023-09-30 | 2023-06-30 | 2023-03-31 | 2022-12-31 | 2022-09-30 | 2022-06-30 | 2022-03-31 | 2021-12-31 | 2021-09-30 | 2021-06-30 | 2021-03-31 | 2020-12-31 | 2020-09-30 | 2020-06-30 | 2020-03-31 | 2019-12-31 | 2019-09-30 | 2019-06-30 | 2019-03-31 | 2018-12-31 | 2018-09-30 | 2018-06-30 | 2018-03-31 | 2017-12-31 | 2017-09-30 | 2017-06-30 | ||
|---|---|---|---|---|---|---|---|---|---|---|---|---|---|---|---|---|---|---|---|---|---|---|---|---|---|---|---|---|
| Net Cash Provided By Used In Operating Activities | 356.20 | 248.70 | 253.60 | 42.00 | 180.70 | 4.40 | -205.70 | -132.20 | 36.50 | 54.40 | 59.30 | 60.70 | 194.50 | 136.10 | 73.00 | -194.70 | 2.03 | 2.96 | 38.44 | -33.70 | -2.85 | 2.11 | NA | NA | NA | NA | NA | |
| Net Income Loss | 232.60 | 94.10 | 83.20 | 50.30 | 26.60 | 21.20 | 20.30 | 8.50 | 22.00 | 56.20 | 9.70 | 31.70 | 74.90 | -15.80 | 26.20 | -268.90 | -3.18 | 2.12 | 2.75 | 2.69 | 2.35 | 2.30 | 0.39 | -0.00 | -0.00 | NA | NA | |
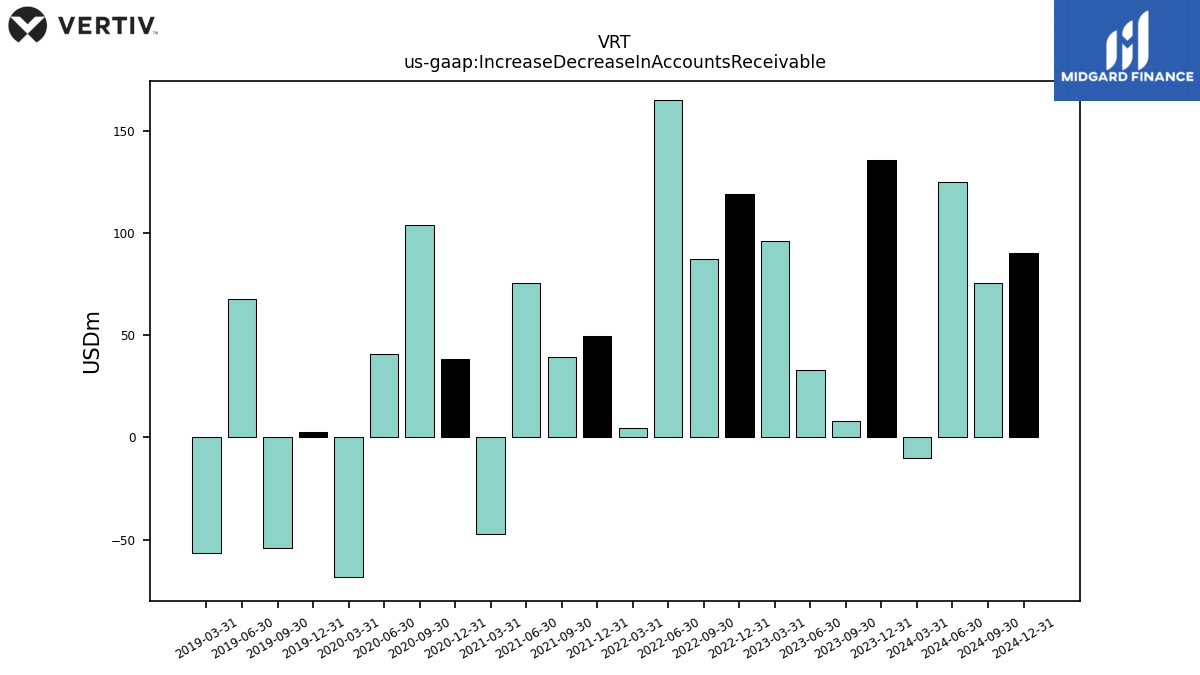
| Increase Decrease In Accounts Receivable | 135.80 | 7.80 | 32.70 | 96.20 | 118.80 | 87.20 | 165.00 | 4.80 | 49.60 | 39.40 | 75.50 | -47.10 | 38.30 | 103.70 | 41.00 | -68.20 | 2.60 | -53.90 | 67.80 | -56.30 | NA | NA | NA | NA | NA | NA | NA | |
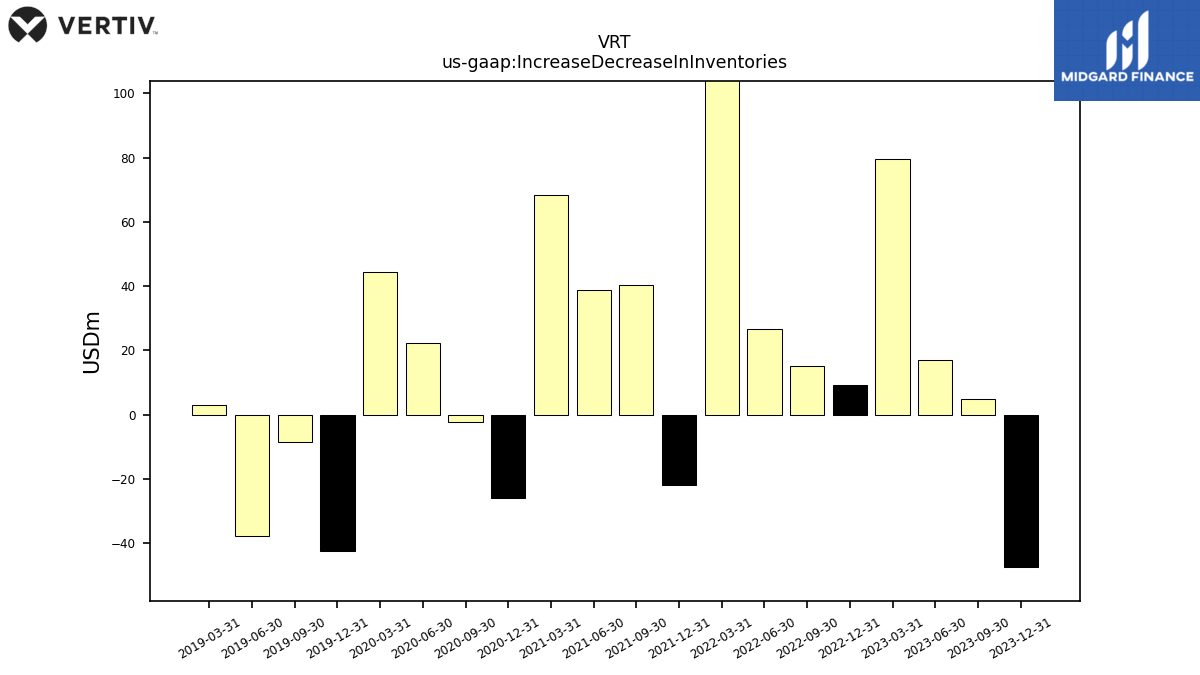
| Increase Decrease In Inventories | -47.50 | 5.00 | 17.00 | 79.50 | 9.10 | 15.20 | 26.70 | 160.40 | -22.00 | 40.40 | 38.90 | 68.40 | -26.00 | -2.40 | 22.40 | 44.50 | -42.30 | -8.60 | -37.70 | 3.10 | NA | NA | NA | NA | NA | NA | NA | |
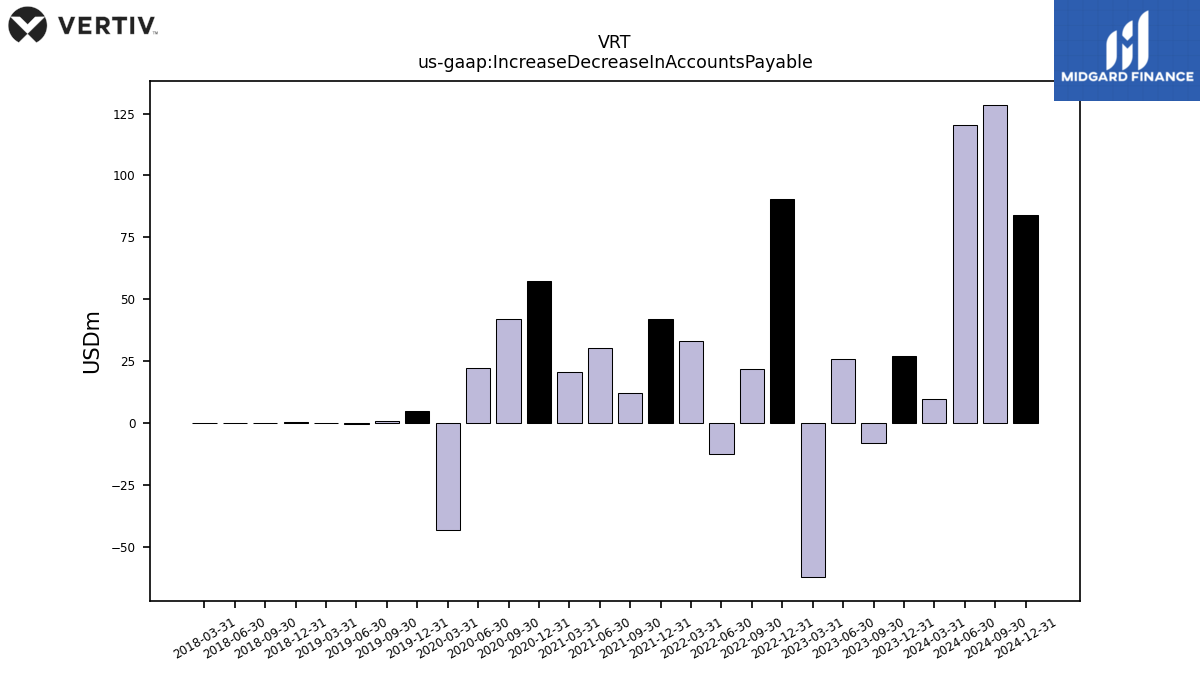
| Increase Decrease In Accounts Payable | 27.20 | -8.30 | 25.70 | -62.30 | 90.60 | 21.60 | -12.40 | 33.00 | 42.00 | 12.20 | 30.20 | 20.70 | 57.40 | 41.90 | 22.30 | -43.40 | 4.83 | 0.72 | -0.26 | 0.13 | 0.44 | 0.07 | 0.12 | 0.00 | NA | NA | NA | |
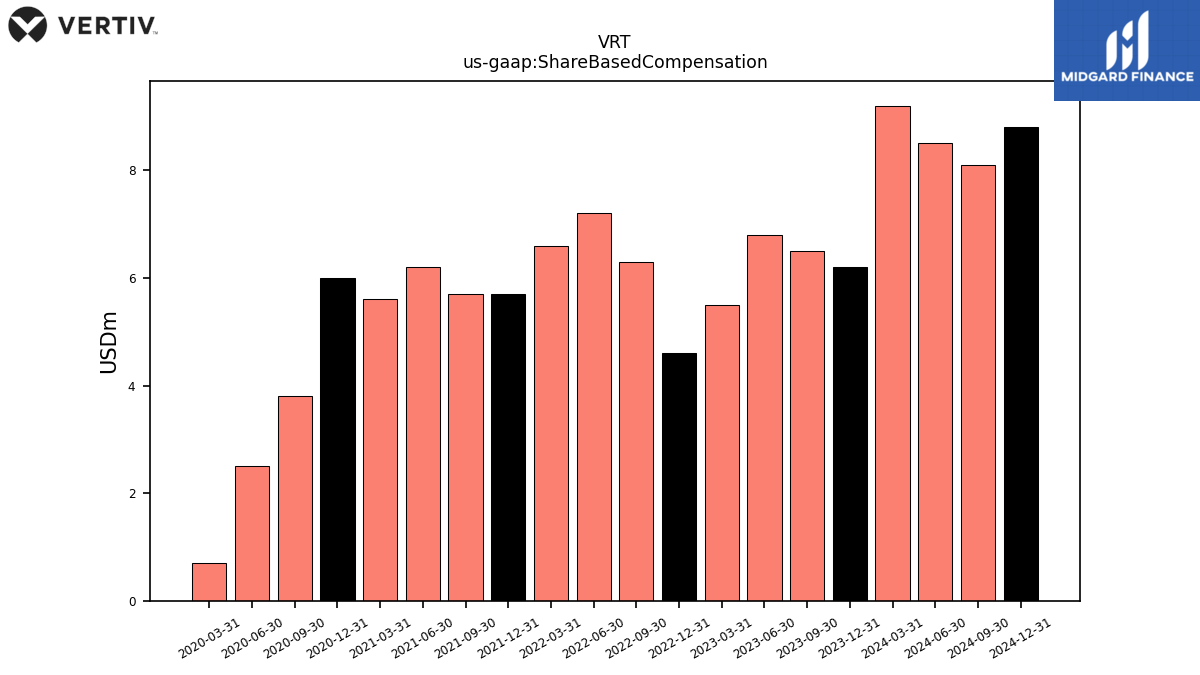
| Share Based Compensation | 6.20 | 6.50 | 6.80 | 5.50 | 4.60 | 6.30 | 7.20 | 6.60 | 5.70 | 5.70 | 6.20 | 5.60 | 6.00 | 3.80 | 2.50 | 0.70 | NA | NA | NA | NA | NA | NA | NA | NA | NA | NA | NA |
| 2023-12-31 | 2023-09-30 | 2023-06-30 | 2023-03-31 | 2022-12-31 | 2022-09-30 | 2022-06-30 | 2022-03-31 | 2021-12-31 | 2021-09-30 | 2021-06-30 | 2021-03-31 | 2020-12-31 | 2020-09-30 | 2020-06-30 | 2020-03-31 | 2019-12-31 | 2019-09-30 | 2019-06-30 | 2019-03-31 | 2018-12-31 | 2018-09-30 | 2018-06-30 | 2018-03-31 | 2017-12-31 | 2017-09-30 | 2017-06-30 | ||
|---|---|---|---|---|---|---|---|---|---|---|---|---|---|---|---|---|---|---|---|---|---|---|---|---|---|---|---|---|
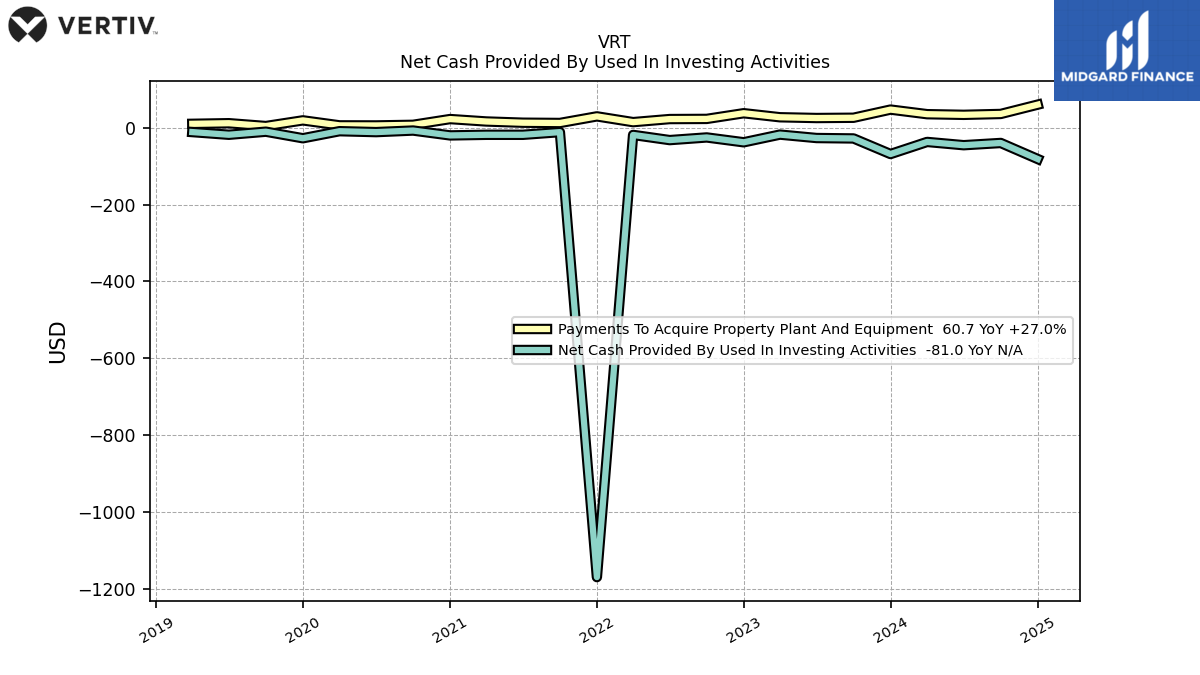
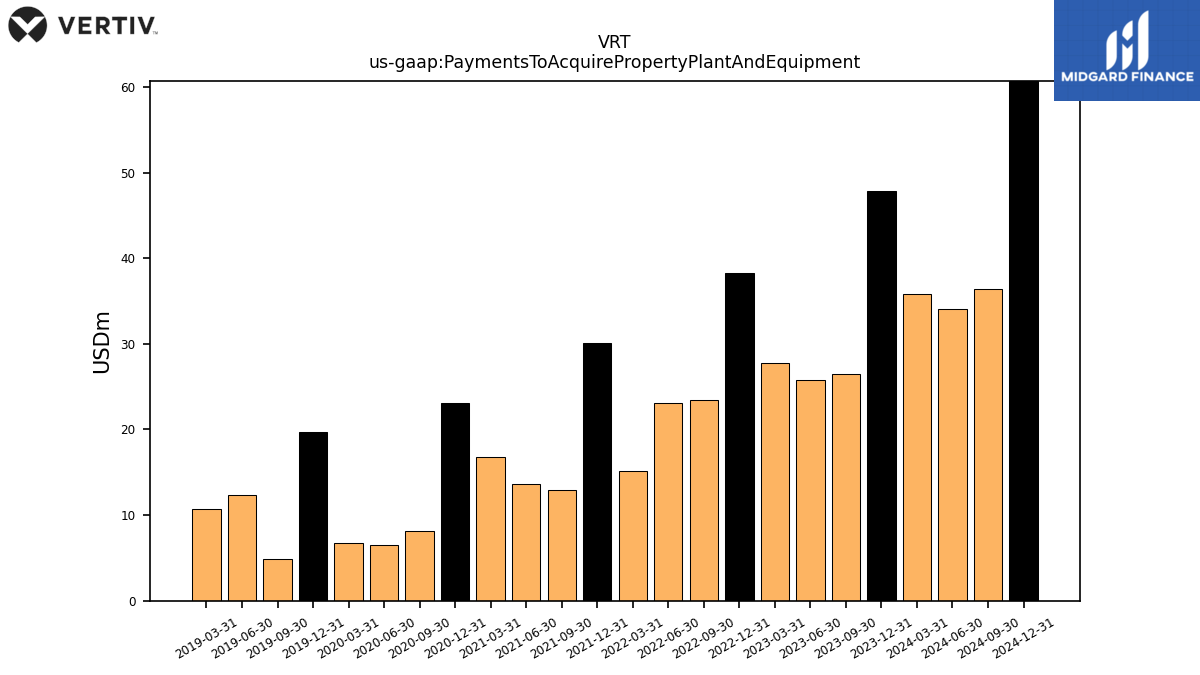
| Net Cash Provided By Used In Investing Activities | -68.00 | -27.40 | -26.30 | -17.40 | -37.40 | -24.80 | -31.70 | -18.20 | -1170.10 | -10.90 | -17.90 | -17.90 | -19.50 | -6.80 | -10.90 | -8.50 | -26.90 | -9.80 | -17.80 | -10.80 | NA | NA | NA | NA | NA | NA | NA | |
| Payments To Acquire Property Plant And Equipment | 47.80 | 26.50 | 25.80 | 27.80 | 38.30 | 23.50 | 23.10 | 15.10 | 30.10 | 12.90 | 13.60 | 16.80 | 23.10 | 8.10 | 6.50 | 6.70 | 19.70 | 4.90 | 12.30 | 10.70 | NA | NA | NA | NA | NA | NA | NA |
| 2023-12-31 | 2023-09-30 | 2023-06-30 | 2023-03-31 | 2022-12-31 | 2022-09-30 | 2022-06-30 | 2022-03-31 | 2021-12-31 | 2021-09-30 | 2021-06-30 | 2021-03-31 | 2020-12-31 | 2020-09-30 | 2020-06-30 | 2020-03-31 | 2019-12-31 | 2019-09-30 | 2019-06-30 | 2019-03-31 | 2018-12-31 | 2018-09-30 | 2018-06-30 | 2018-03-31 | 2017-12-31 | 2017-09-30 | 2017-06-30 | ||
|---|---|---|---|---|---|---|---|---|---|---|---|---|---|---|---|---|---|---|---|---|---|---|---|---|---|---|---|---|
| Net Cash Provided By Used In Financing Activities | -10.80 | 7.20 | -225.10 | -18.80 | -144.50 | 91.20 | 155.00 | -1.50 | 828.40 | -5.20 | -11.20 | 102.90 | 28.40 | -181.20 | 14.20 | 279.30 | 1.30 | 0.00 | 60.10 | -59.40 | 0.00 | -0.24 | NA | NA | NA | NA | NA |
| 2023-12-31 | 2023-09-30 | 2023-06-30 | 2023-03-31 | 2022-12-31 | 2022-09-30 | 2022-06-30 | 2022-03-31 | 2021-12-31 | 2021-09-30 | 2021-06-30 | 2021-03-31 | 2020-12-31 | 2020-09-30 | 2020-06-30 | 2020-03-31 | 2019-12-31 | 2019-09-30 | 2019-06-30 | 2019-03-31 | 2018-12-31 | 2018-09-30 | 2018-06-30 | 2018-03-31 | 2017-12-31 | 2017-09-30 | 2017-06-30 | ||
|---|---|---|---|---|---|---|---|---|---|---|---|---|---|---|---|---|---|---|---|---|---|---|---|---|---|---|---|---|
| Revenues | 1865.40 | 1742.60 | 1734.10 | 1521.10 | 1654.60 | 1481.10 | 1399.40 | 1156.40 | 1410.50 | 1228.90 | 1260.30 | 1098.40 | 1305.50 | 1162.00 | 1005.70 | 897.30 | 1171.50 | 0.00 | 0.00 | 0.00 | 0.00 | 0.00 | 0.00 | 0.00 | 0.00 | 0.00 | 0.00 | |
| Revenue From Contract With Customer Excluding Assessed Tax | 1865.40 | 1742.60 | 1734.10 | 1521.10 | 1654.60 | 1481.10 | 1399.40 | 1156.40 | 1410.50 | 1228.90 | 1260.30 | 1098.40 | 1305.50 | 1162.00 | 1005.70 | 897.30 | 1171.50 | 1070.70 | 1134.10 | 1054.80 | 4285.60 | 0.00 | 0.00 | 0.00 | 0.00 | 0.00 | 0.00 | |
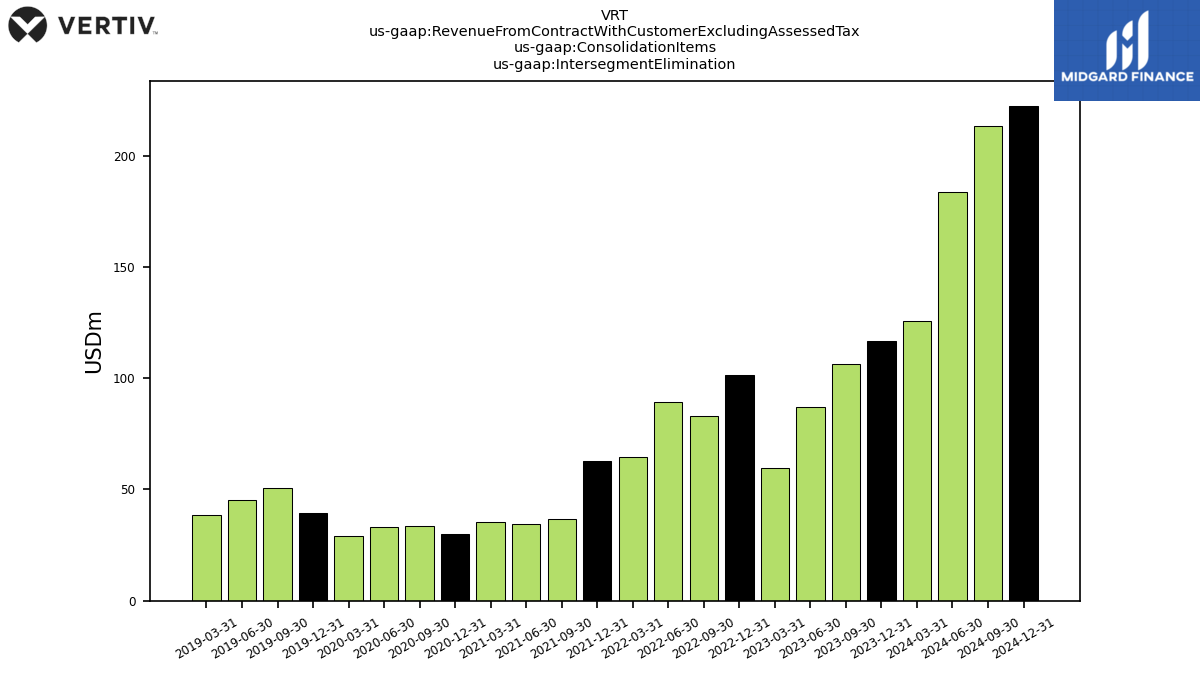
| Intersegment Elimination | 116.70 | 106.50 | 86.90 | 59.80 | 101.30 | 82.80 | 89.10 | 64.40 | 62.60 | 36.80 | 34.40 | 35.50 | 29.90 | 33.70 | 33.10 | 28.90 | 39.40 | 50.80 | 45.40 | 38.70 | NA | NA | NA | NA | NA | NA | NA | |
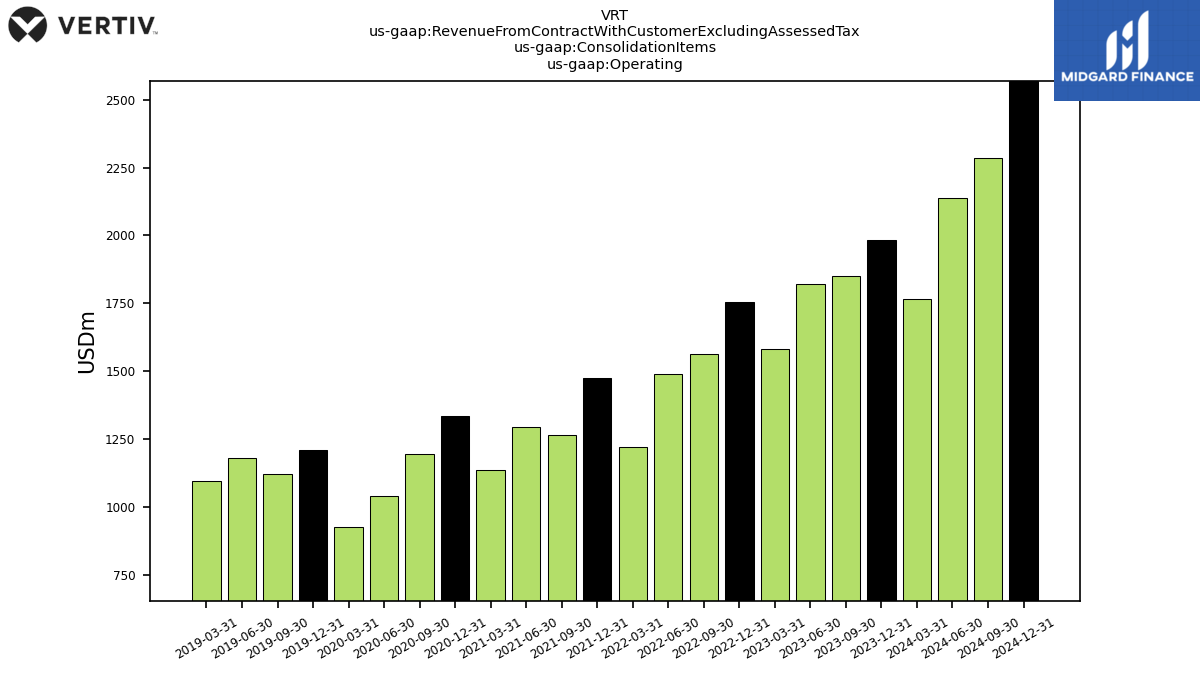
| Operating | 1982.10 | 1849.10 | 1821.00 | 1580.90 | 1755.90 | 1563.90 | 1488.50 | 1220.80 | 1473.10 | 1265.70 | 1294.70 | 1133.90 | 1335.60 | 1195.70 | 1038.80 | 926.20 | 1210.90 | 1121.50 | 1179.50 | 1093.50 | NA | NA | NA | NA | NA | NA | NA | |
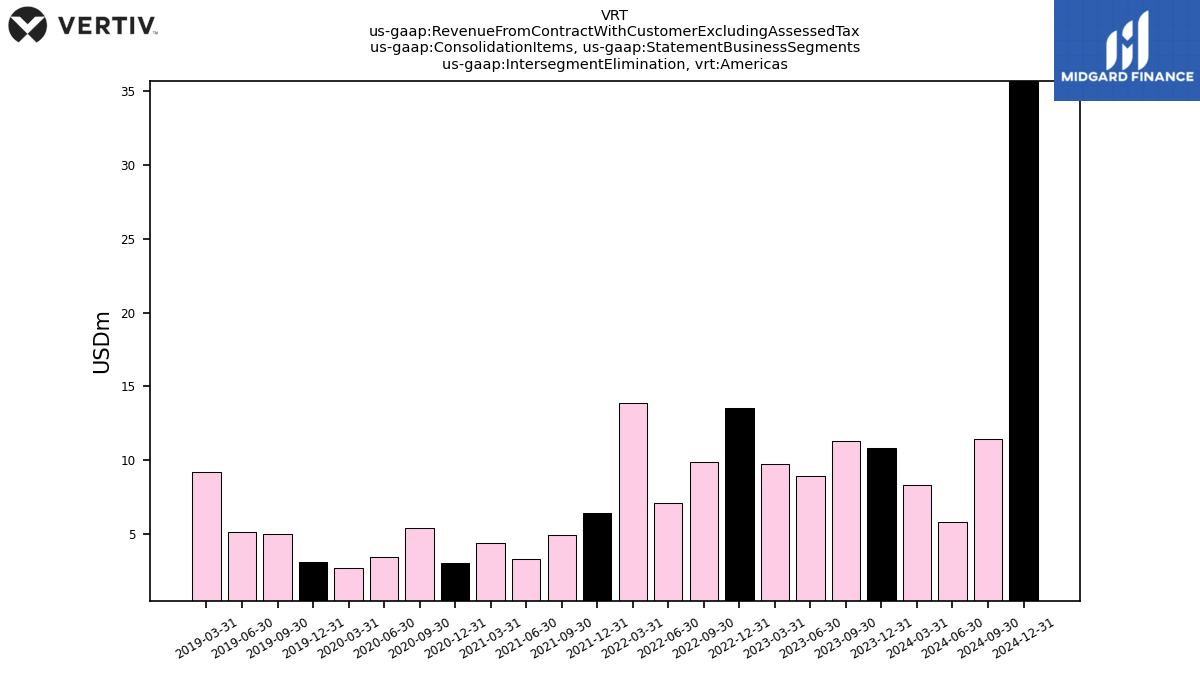
| Intersegment Elimination, Americas | 10.80 | 11.30 | 8.90 | 9.70 | 13.50 | 9.90 | 7.10 | 13.90 | 6.40 | 4.90 | 3.30 | 4.40 | 3.00 | 5.40 | 3.40 | 2.70 | 3.10 | 5.00 | 5.10 | 9.20 | NA | NA | NA | NA | NA | NA | NA | |
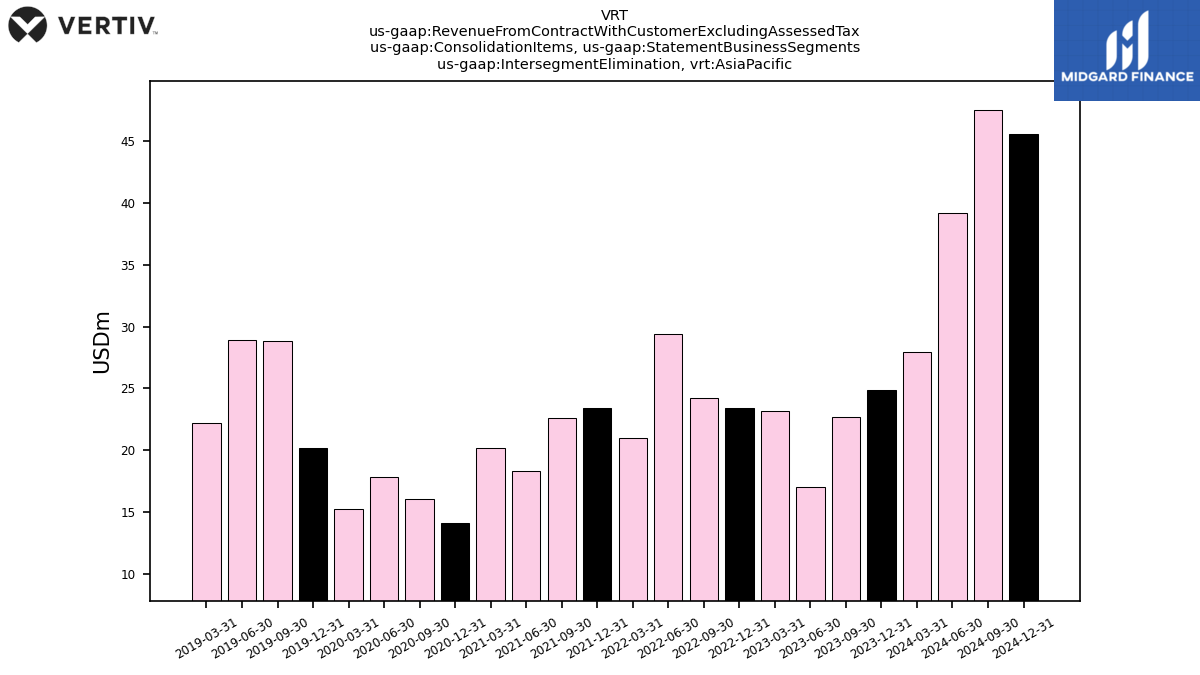
| Intersegment Elimination, Asia Pacific | 24.90 | 22.70 | 17.00 | 23.20 | 23.40 | 24.20 | 29.40 | 21.00 | 23.40 | 22.60 | 18.30 | 20.20 | 14.10 | 16.00 | 17.80 | 15.20 | 20.20 | 28.80 | 28.90 | 22.20 | NA | NA | NA | NA | NA | NA | NA | |
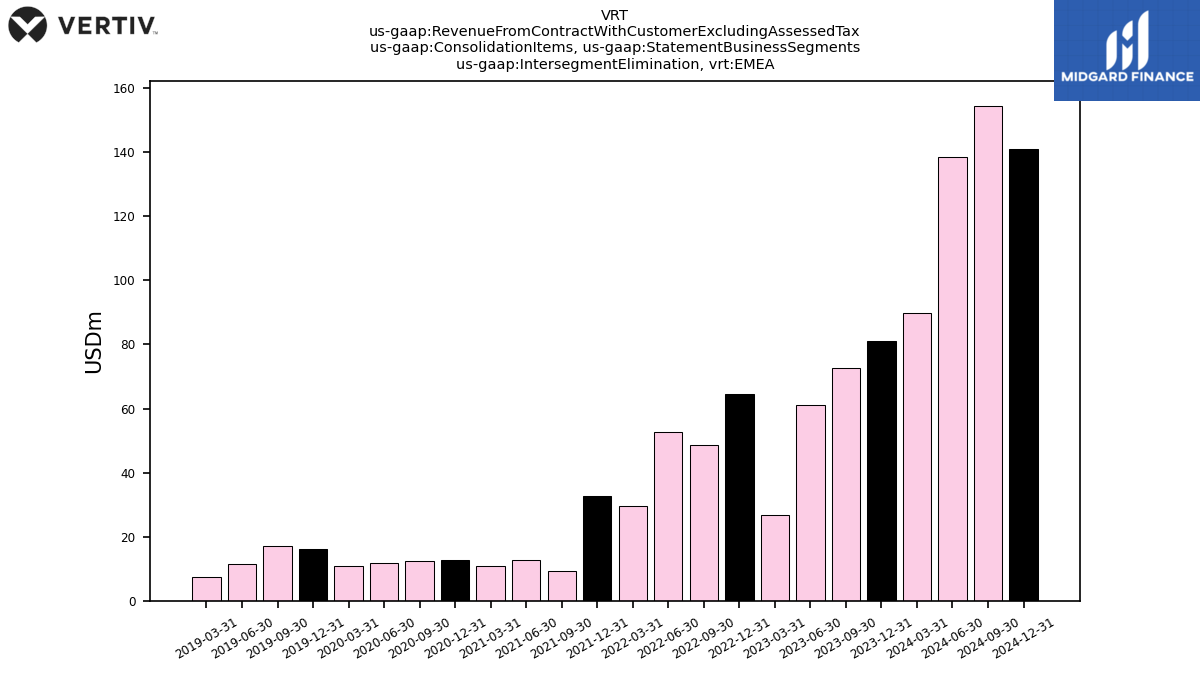
| Intersegment Elimination,EMEA | 81.00 | 72.50 | 61.00 | 26.90 | 64.40 | 48.70 | 52.60 | 29.50 | 32.80 | 9.30 | 12.80 | 10.90 | 12.80 | 12.30 | 11.90 | 11.00 | 16.10 | 17.00 | 11.40 | 7.30 | NA | NA | NA | NA | NA | NA | NA | |
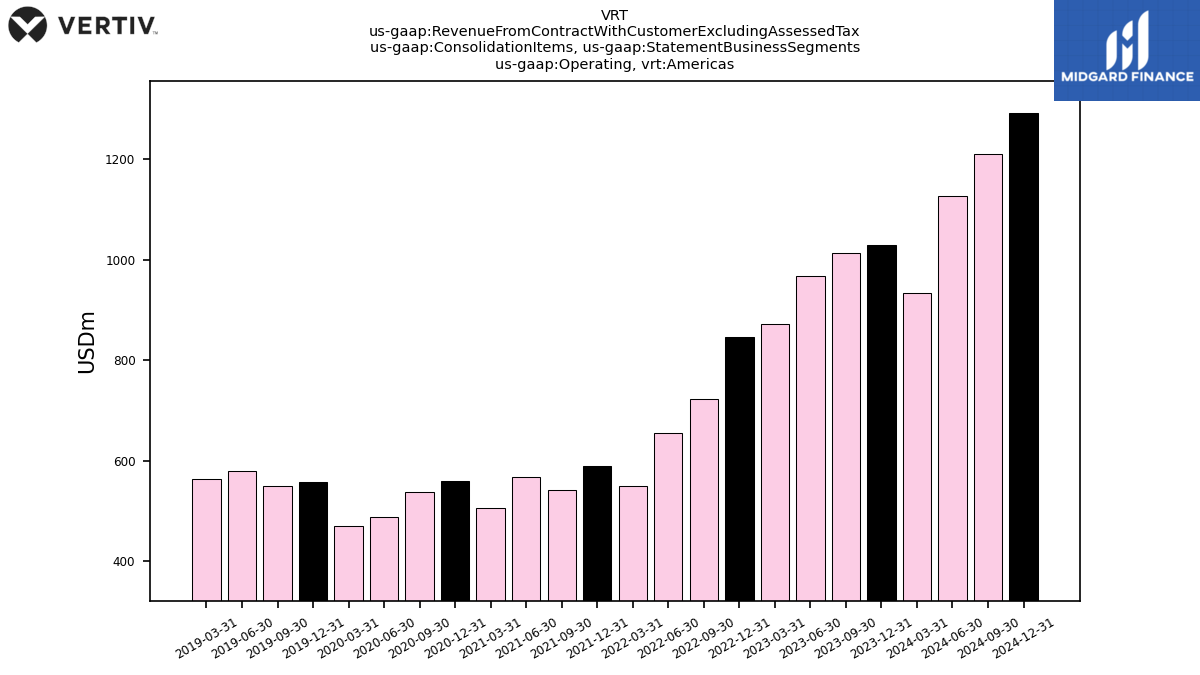
| Operating, Americas | 1030.40 | 1014.50 | 968.30 | 872.00 | 847.20 | 722.50 | 654.30 | 549.00 | 590.20 | 542.10 | 568.20 | 505.90 | 560.30 | 537.40 | 488.10 | 469.40 | 556.80 | 550.70 | 580.20 | 563.60 | NA | NA | NA | NA | NA | NA | NA | |
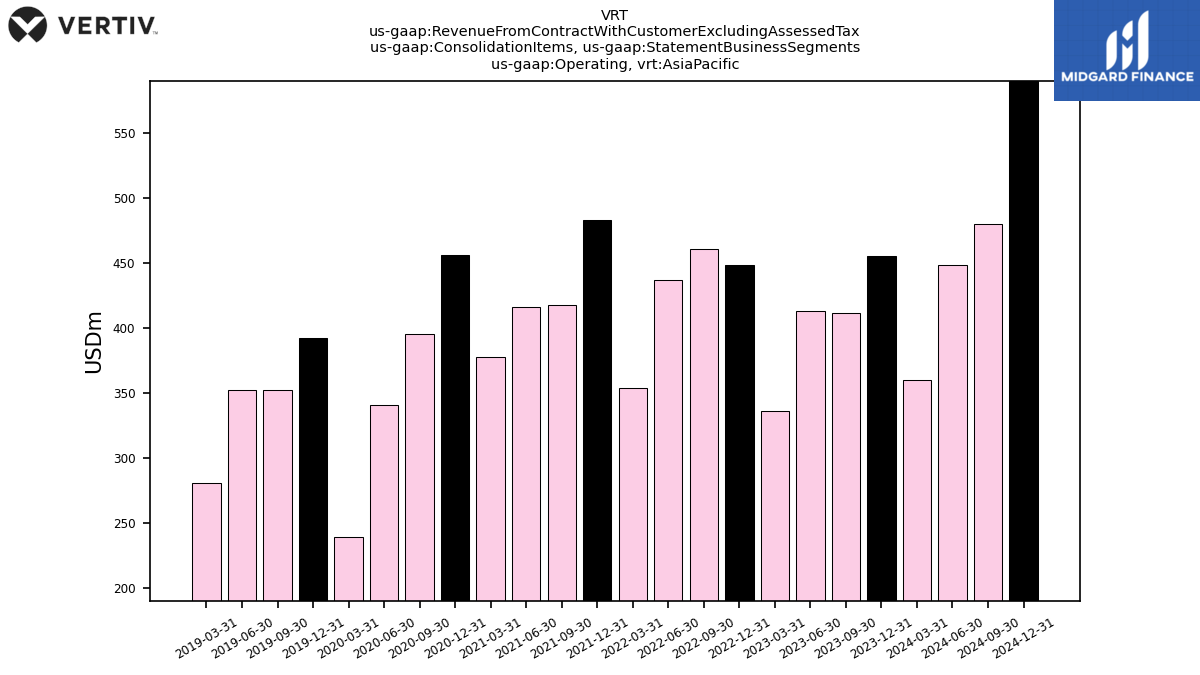
| Operating, Asia Pacific | 455.30 | 411.30 | 412.80 | 336.20 | 448.60 | 460.30 | 436.60 | 353.80 | 482.50 | 417.20 | 416.30 | 377.60 | 456.20 | 395.60 | 340.60 | 239.10 | 392.10 | 352.50 | 352.20 | 281.20 | NA | NA | NA | NA | NA | NA | NA | |
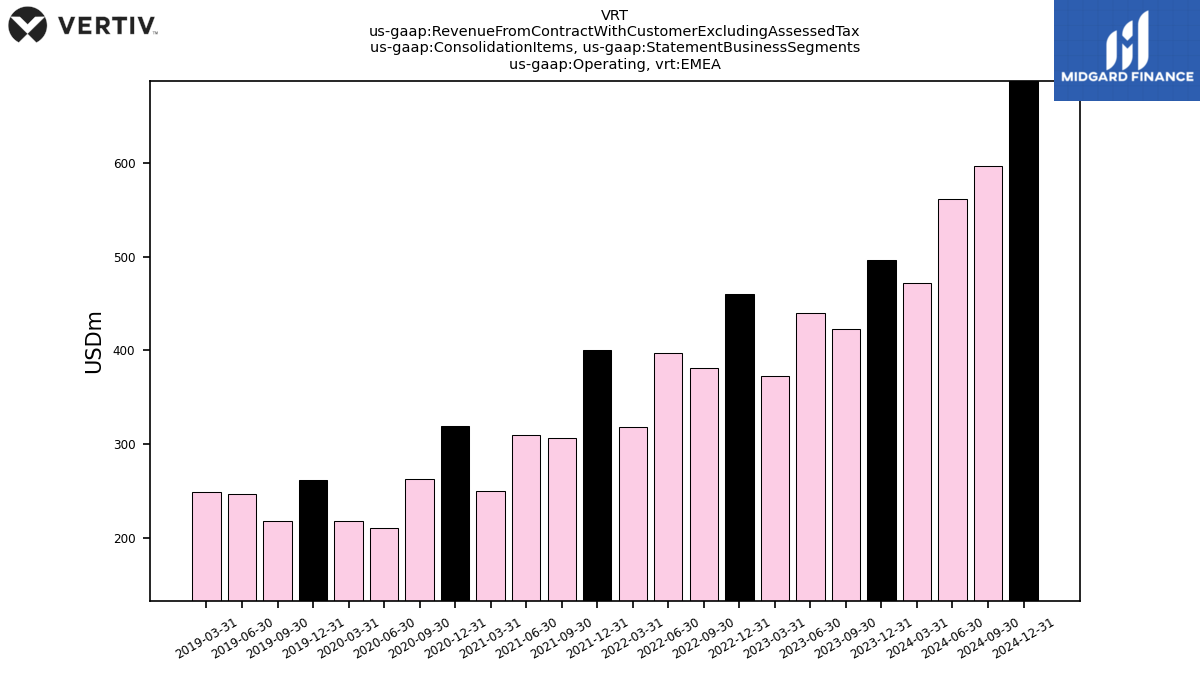
| Operating,EMEA | 496.40 | 423.30 | 439.90 | 372.70 | 460.10 | 381.10 | 397.60 | 318.00 | 400.40 | 306.40 | 310.20 | 250.40 | 319.10 | 262.70 | 210.10 | 217.70 | 262.00 | 218.30 | 247.10 | 248.70 | NA | NA | NA | NA | NA | NA | NA | |
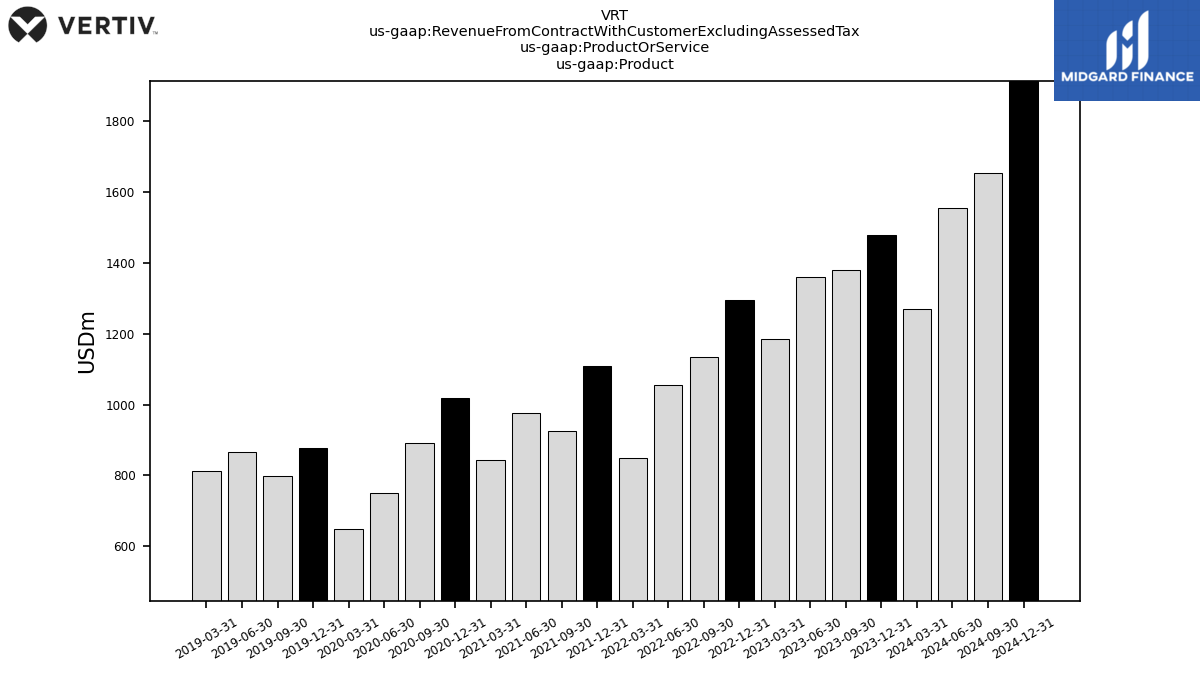
| Product | 1477.90 | 1381.30 | 1360.40 | 1186.50 | 1295.50 | 1135.40 | 1055.00 | 849.40 | 1108.00 | 926.00 | 976.50 | 844.00 | 1020.10 | 891.10 | 750.20 | 647.20 | 878.10 | 799.40 | 865.30 | 813.30 | NA | NA | NA | NA | NA | NA | NA | |
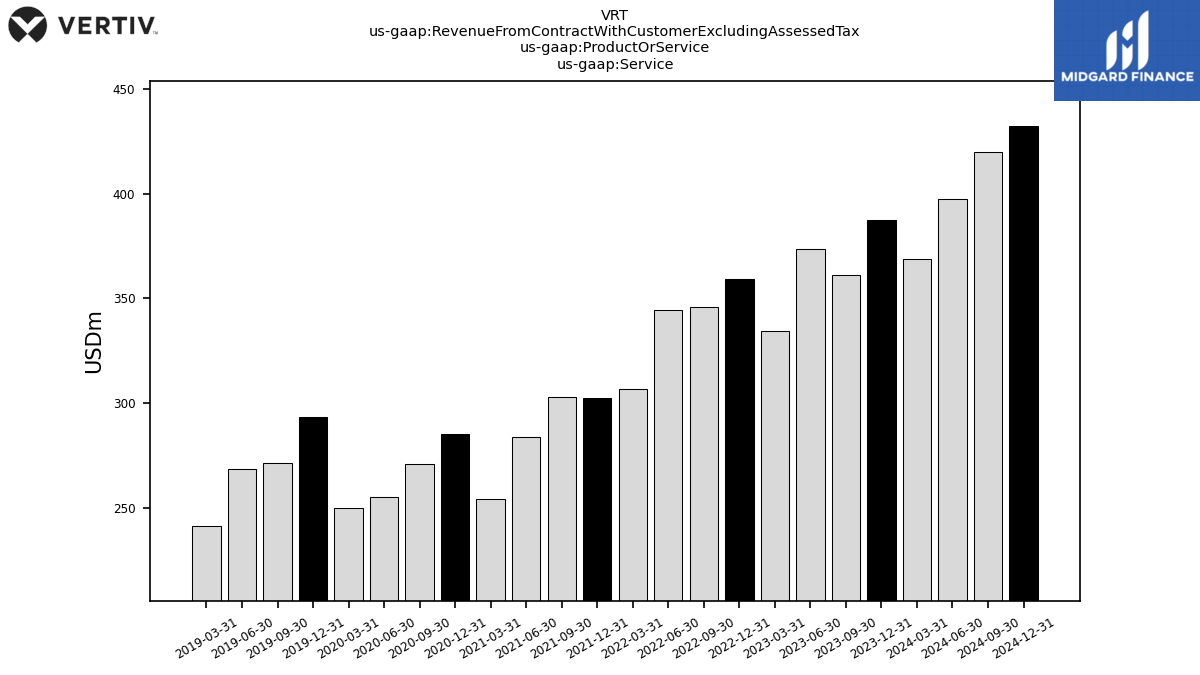
| Service | 387.50 | 361.30 | 373.70 | 334.60 | 359.10 | 345.70 | 344.40 | 307.00 | 302.50 | 302.90 | 283.80 | 254.40 | 285.40 | 270.90 | 255.50 | 250.10 | 293.40 | 271.30 | 268.80 | 241.50 | NA | NA | NA | NA | NA | NA | NA | |
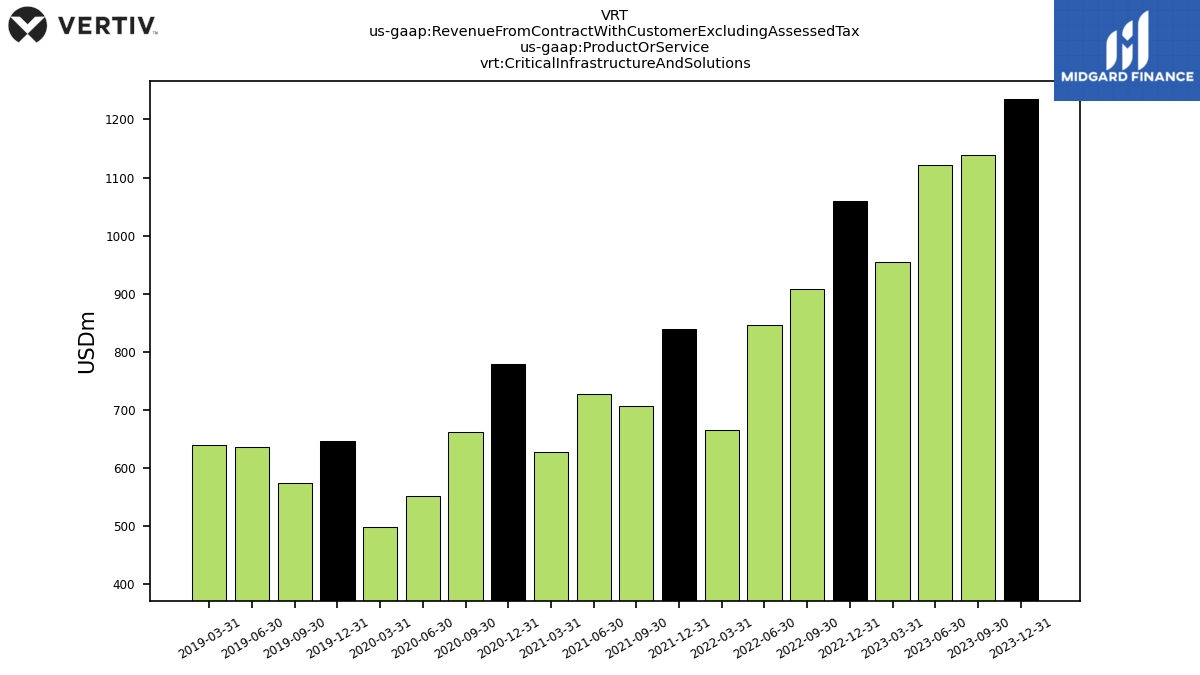
| Critical Infrastructure And Solutions | 1234.90 | 1138.30 | 1121.20 | 954.70 | 1059.70 | 907.30 | 846.70 | 664.90 | 839.10 | 706.30 | 726.80 | 627.90 | 779.60 | 662.30 | 552.20 | 499.40 | 647.10 | 574.90 | 636.40 | 638.80 | NA | NA | NA | NA | NA | NA | NA | |
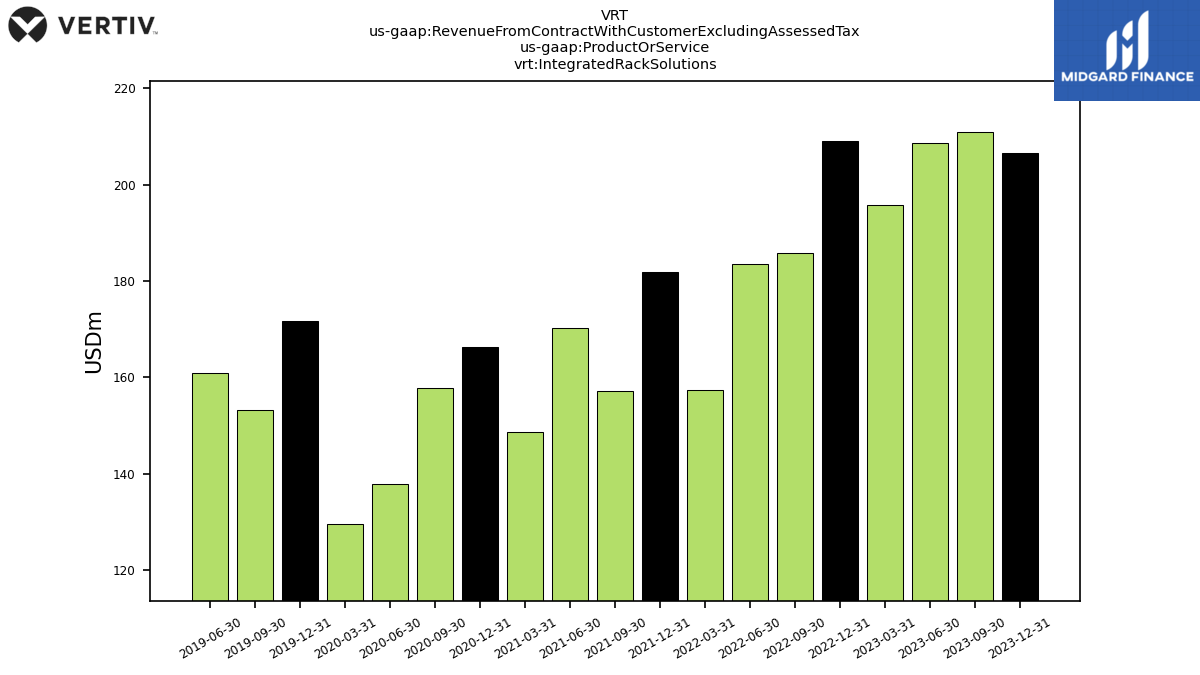
| Integrated Rack Solutions | 206.60 | 211.00 | 208.70 | 195.80 | 209.00 | 185.80 | 183.50 | 157.30 | 181.80 | 157.20 | 170.30 | 148.70 | 166.20 | 157.80 | 137.80 | 129.50 | 171.70 | 153.30 | 161.00 | NA | NA | NA | NA | NA | NA | NA | NA | |
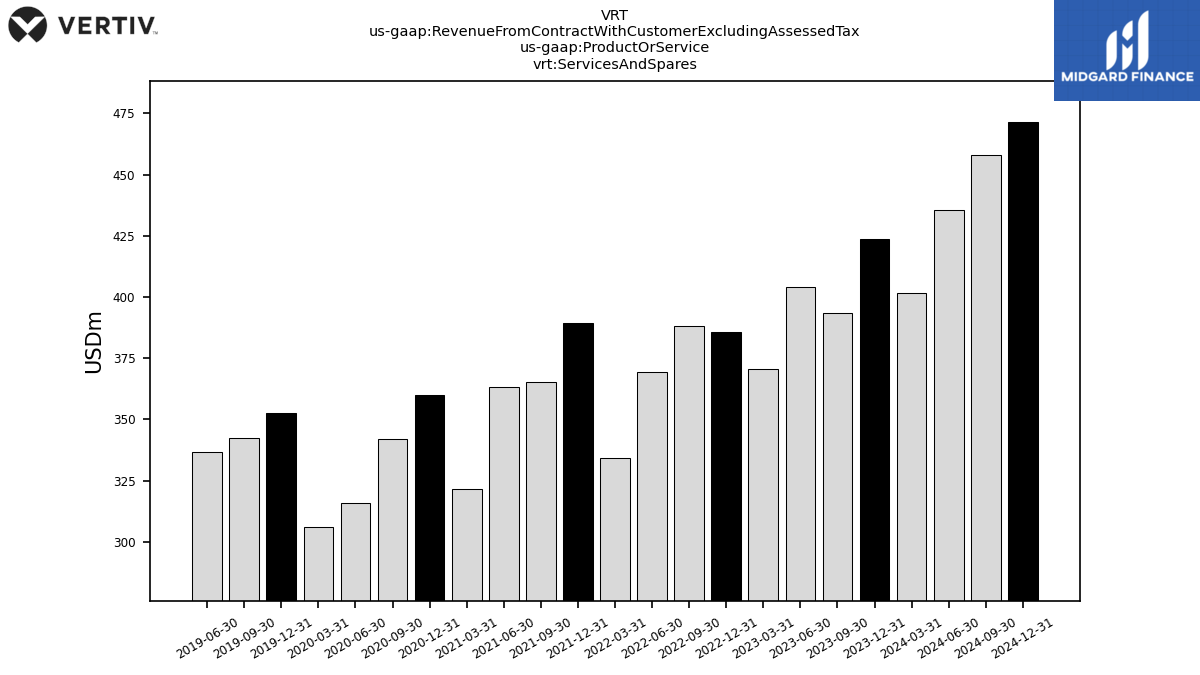
| Services And Spares | 423.90 | 393.30 | 404.20 | 370.60 | 385.90 | 388.00 | 369.20 | 334.20 | 389.60 | 365.40 | 363.20 | 321.80 | 359.90 | 341.90 | 315.70 | 306.30 | 352.70 | 342.50 | 336.70 | NA | NA | NA | NA | NA | NA | NA | NA | |
| Critical Infrastructure And Solutions, Americas | 692.30 | 670.80 | 636.00 | 561.40 | 527.90 | 417.30 | 368.90 | 294.30 | 312.40 | 291.90 | 305.30 | 279.20 | 304.30 | 278.70 | 250.60 | 264.10 | 288.50 | 286.30 | 317.40 | 359.40 | NA | NA | NA | NA | NA | NA | NA | |
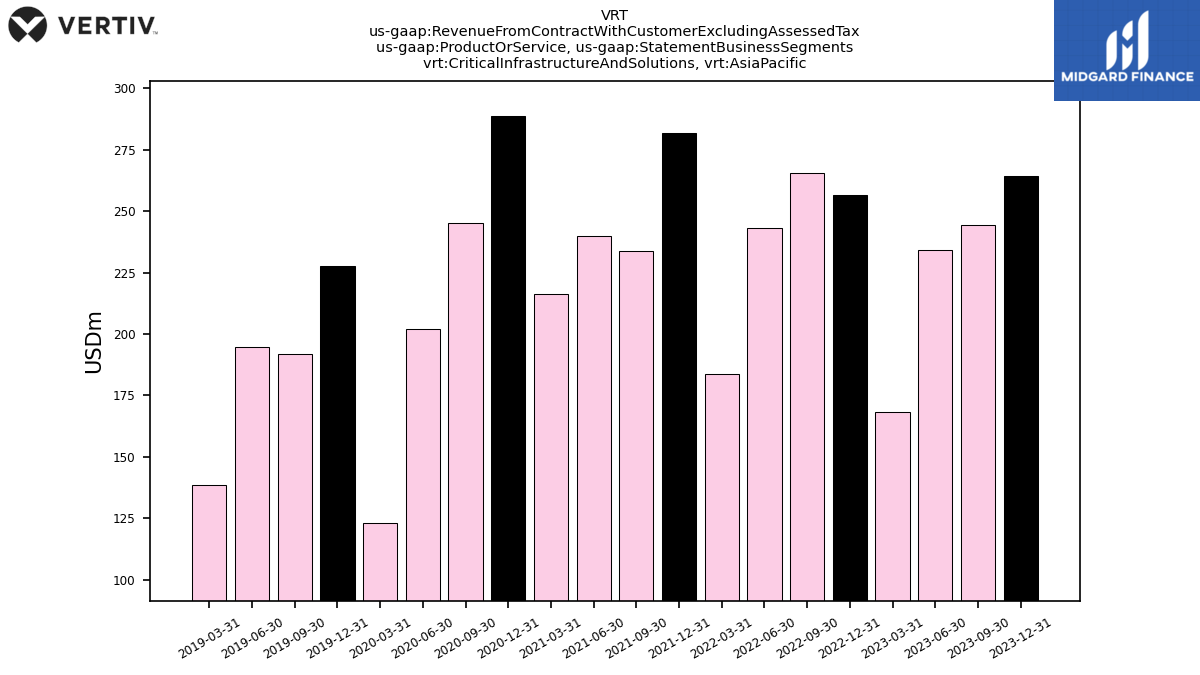
| Critical Infrastructure And Solutions, Asia Pacific | 264.50 | 244.30 | 234.30 | 168.30 | 256.80 | 265.70 | 243.00 | 183.80 | 281.70 | 234.00 | 239.80 | 216.30 | 288.60 | 245.30 | 202.20 | 123.10 | 227.60 | 191.70 | 194.70 | 138.40 | NA | NA | NA | NA | NA | NA | NA | |
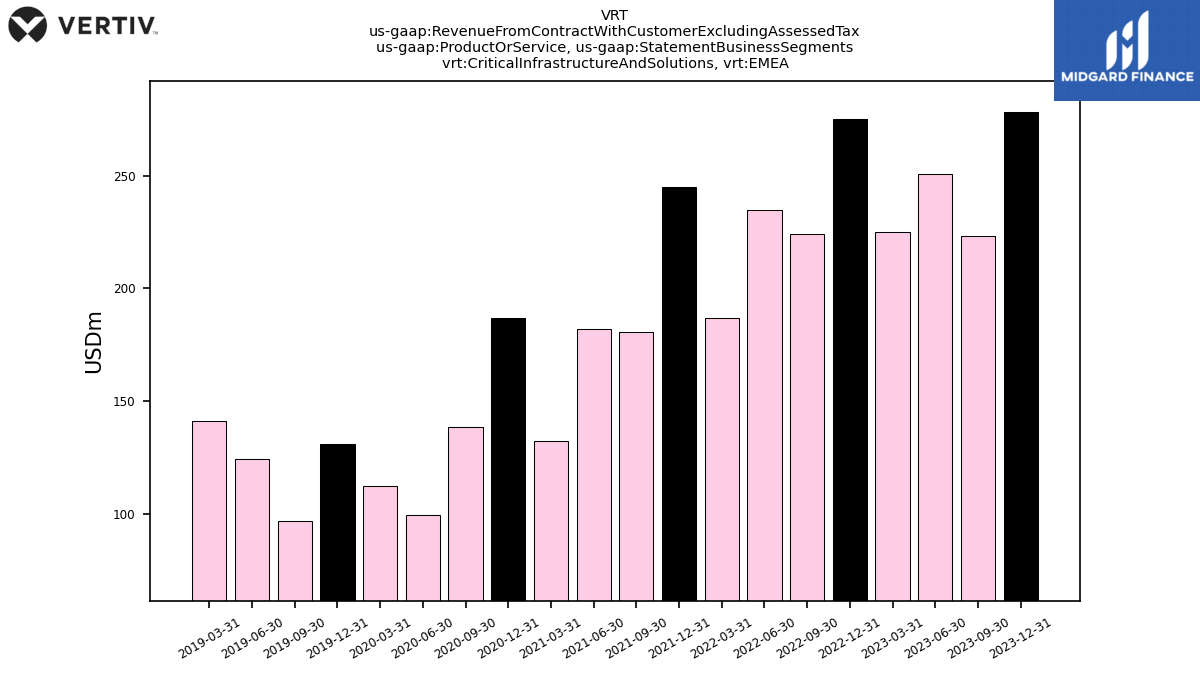
| Critical Infrastructure And Solutions,EMEA | 278.10 | 223.20 | 250.90 | 225.00 | 275.00 | 224.30 | 234.80 | 186.80 | 245.00 | 180.40 | 181.70 | 132.40 | 186.70 | 138.30 | 99.40 | 112.20 | 131.00 | 96.90 | 124.30 | 141.00 | NA | NA | NA | NA | NA | NA | NA | |
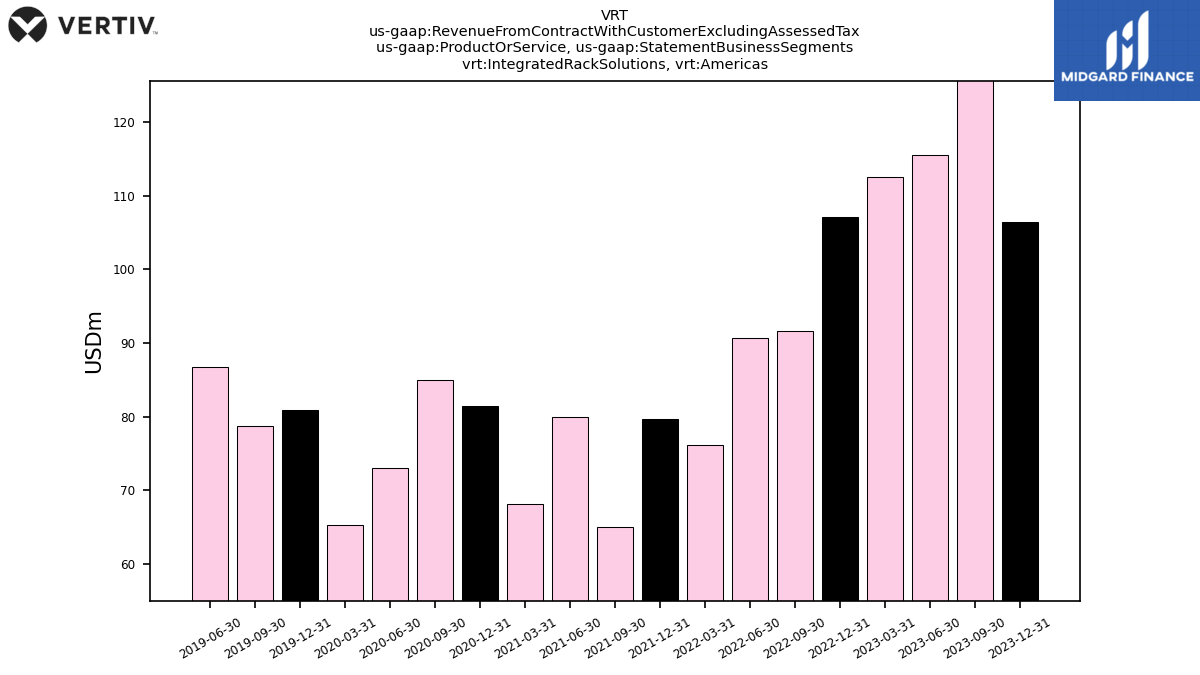
| Integrated Rack Solutions, Americas | 106.50 | 126.20 | 115.50 | 112.50 | 107.10 | 91.70 | 90.70 | 76.10 | 79.70 | 65.10 | 80.00 | 68.10 | 81.40 | 85.00 | 73.00 | 65.30 | 80.90 | 78.80 | 86.80 | NA | NA | NA | NA | NA | NA | NA | NA | |
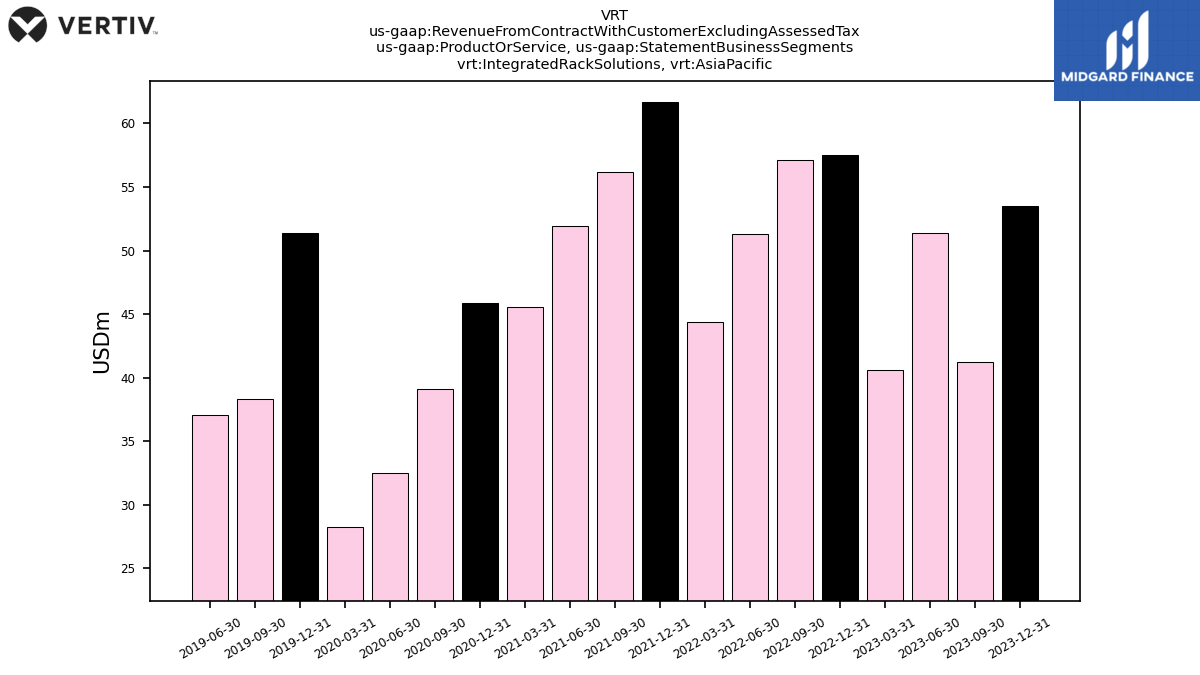
| Integrated Rack Solutions, Asia Pacific | 53.50 | 41.20 | 51.40 | 40.60 | 57.50 | 57.10 | 51.30 | 44.40 | 61.70 | 56.20 | 51.90 | 45.60 | 45.90 | 39.10 | 32.50 | 28.30 | 51.40 | 38.30 | 37.10 | NA | NA | NA | NA | NA | NA | NA | NA | |
| Integrated Rack Solutions,EMEA | 46.60 | 43.60 | 41.80 | 42.70 | 44.40 | 37.00 | 41.50 | 36.80 | 40.40 | 35.90 | 38.40 | 35.00 | 38.90 | 33.70 | 32.30 | 35.90 | 39.40 | 36.20 | 37.10 | NA | NA | NA | NA | NA | NA | NA | NA | |
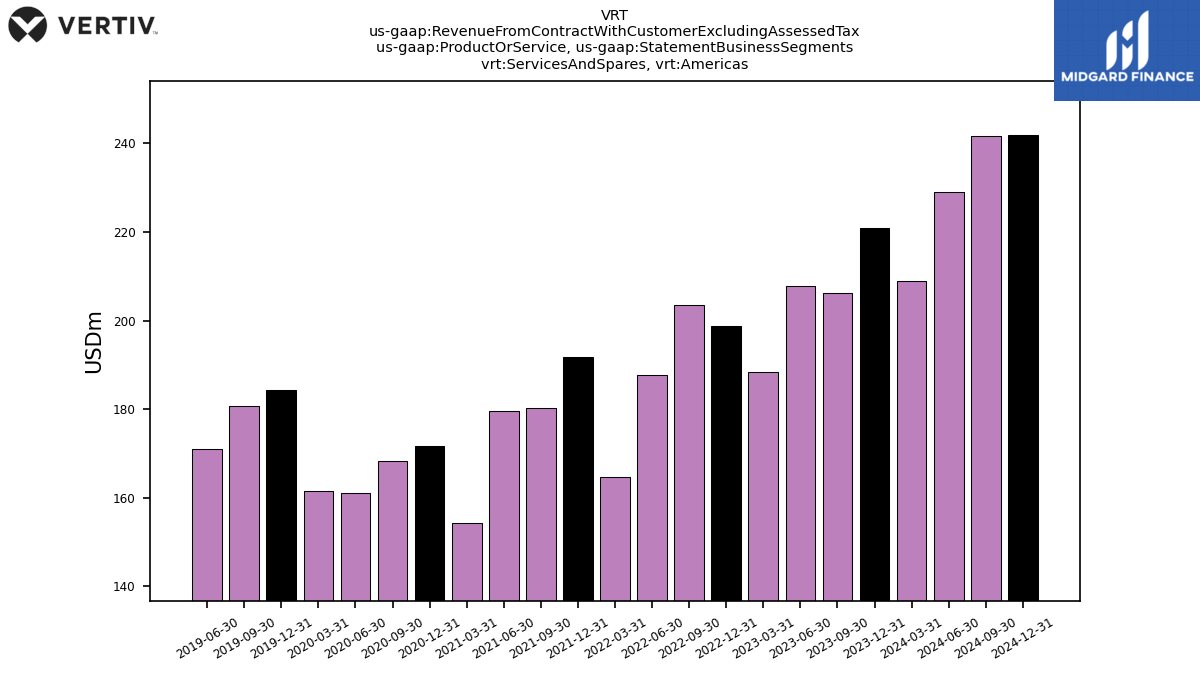
| Services And Spares, Americas | 220.80 | 206.20 | 207.90 | 188.40 | 198.70 | 203.60 | 187.60 | 164.70 | 191.70 | 180.20 | 179.60 | 154.20 | 171.60 | 168.30 | 161.10 | 161.60 | 184.30 | 180.60 | 170.90 | NA | NA | NA | NA | NA | NA | NA | NA | |
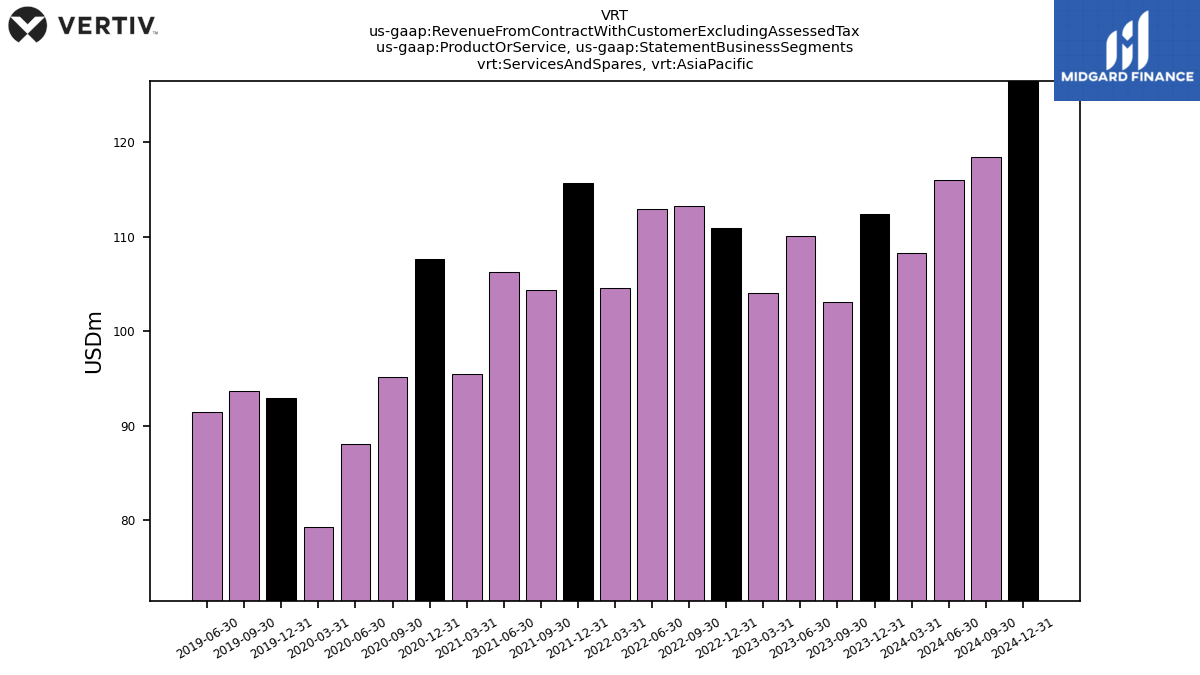
| Services And Spares, Asia Pacific | 112.40 | 103.10 | 110.10 | 104.10 | 110.90 | 113.30 | 112.90 | 104.60 | 115.70 | 104.40 | 106.30 | 95.50 | 107.60 | 95.20 | 88.10 | 79.30 | 92.90 | 93.70 | 91.50 | NA | NA | NA | NA | NA | NA | NA | NA | |
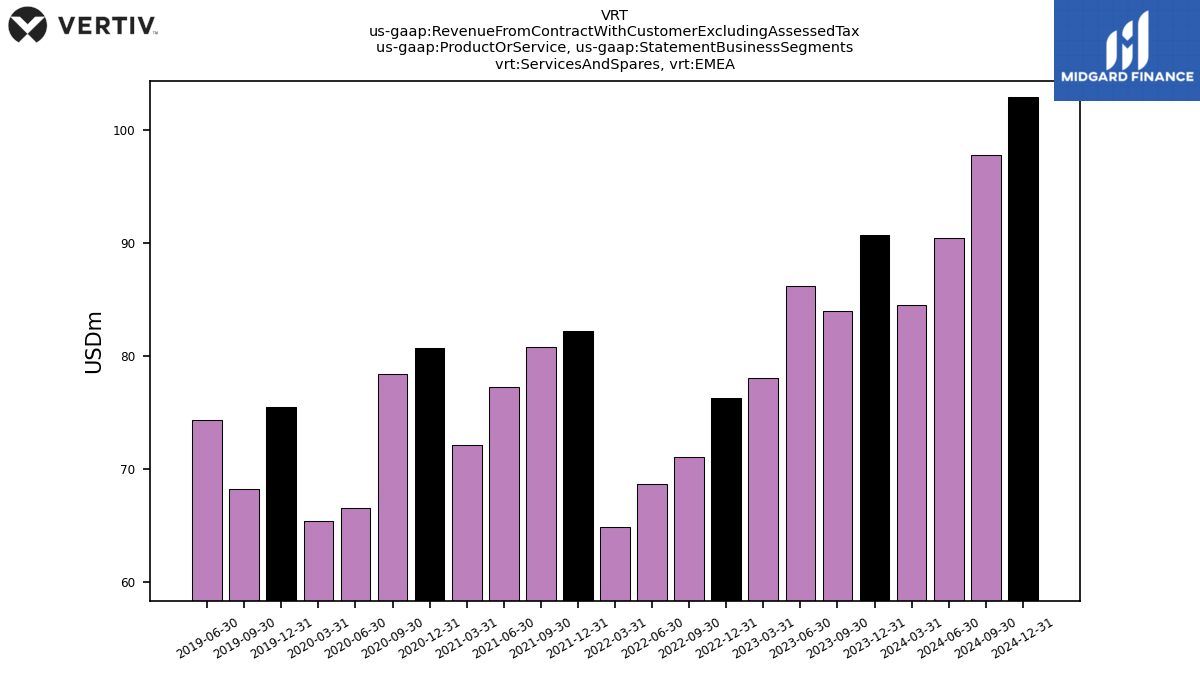
| Services And Spares,EMEA | 90.70 | 84.00 | 86.20 | 78.10 | 76.30 | 71.10 | 68.70 | 64.90 | 82.20 | 80.80 | 77.30 | 72.10 | 80.70 | 78.40 | 66.50 | 65.40 | 75.50 | 68.20 | 74.30 | NA | NA | NA | NA | NA | NA | NA | NA | |
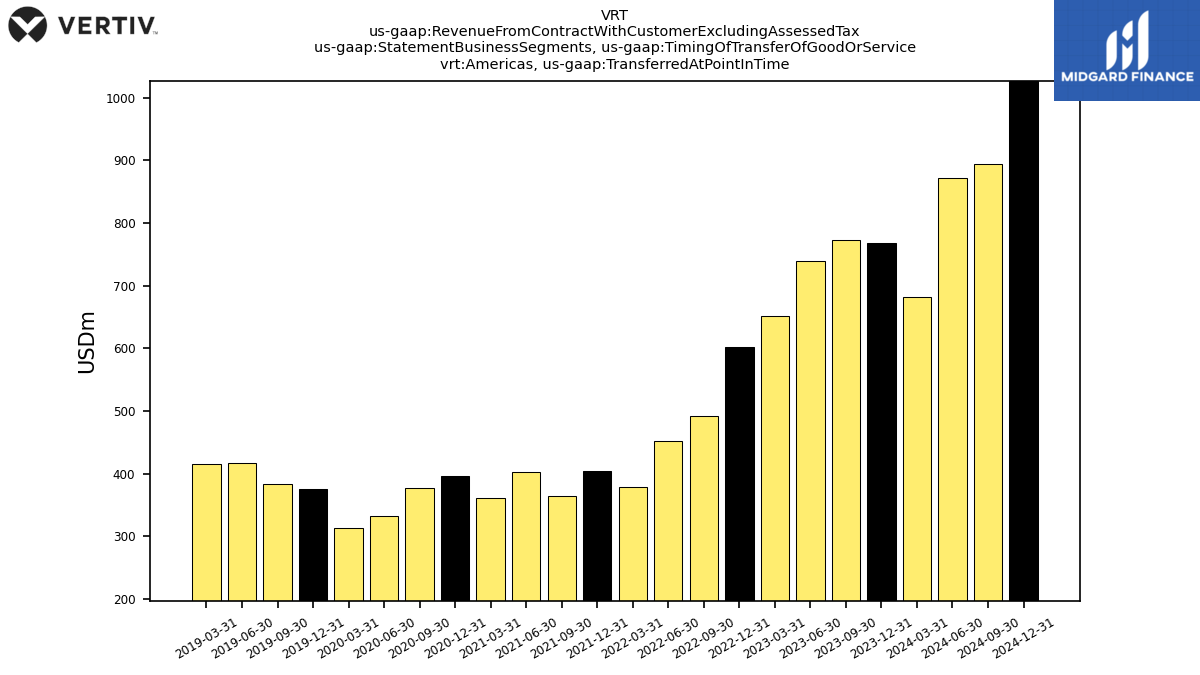
| Americas, Transferred At Point In Time | 768.10 | 772.80 | 739.30 | 652.10 | 601.70 | 492.70 | 452.40 | 378.10 | 403.50 | 363.50 | 403.10 | 360.50 | 396.60 | 376.70 | 332.40 | 313.20 | 375.30 | 383.70 | 417.30 | 415.90 | NA | NA | NA | NA | NA | NA | NA | |
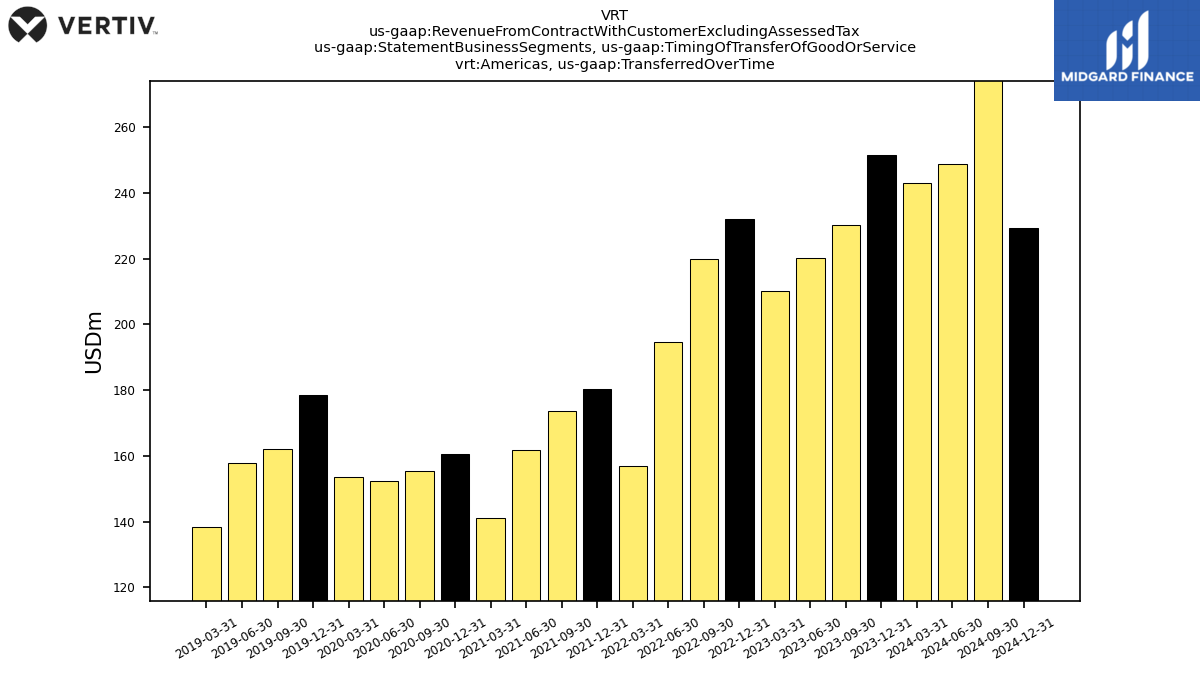
| Americas, Transferred Over Time | 251.50 | 230.40 | 220.10 | 210.20 | 232.00 | 219.90 | 194.80 | 157.00 | 180.30 | 173.70 | 161.80 | 141.00 | 160.70 | 155.30 | 152.30 | 153.50 | 178.40 | 162.00 | 157.80 | 138.50 | NA | NA | NA | NA | NA | NA | NA | |
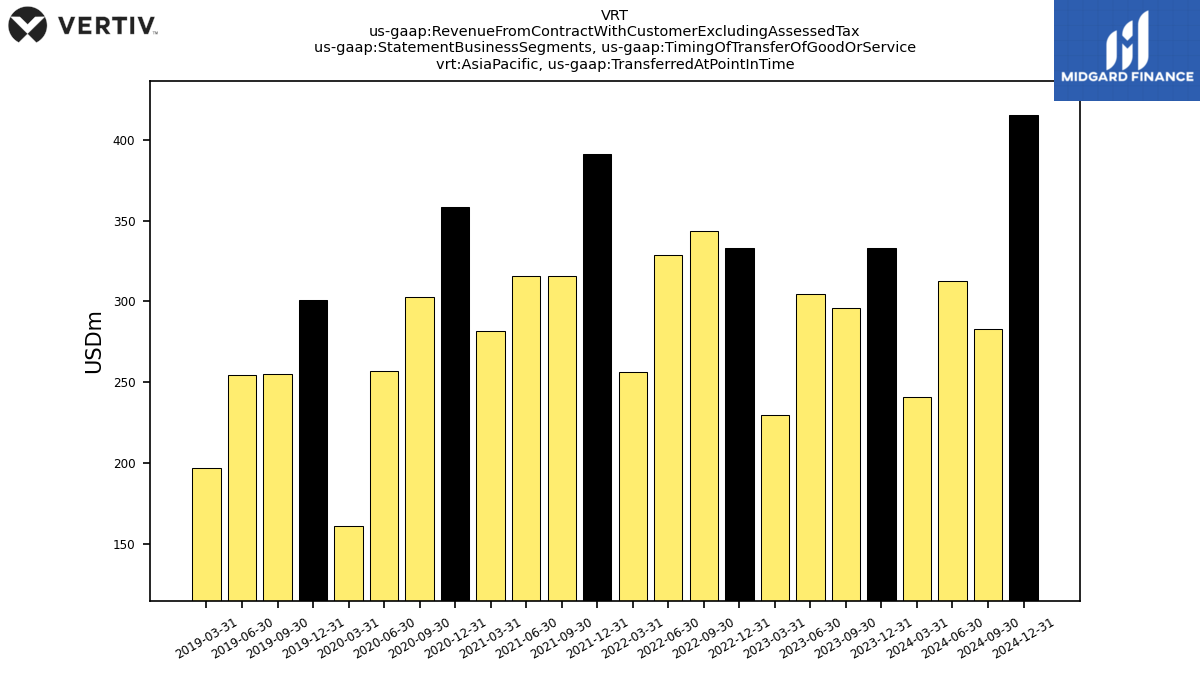
| Asia Pacific, Transferred At Point In Time | 333.30 | 296.00 | 304.60 | 230.00 | 333.10 | 343.40 | 328.50 | 256.40 | 391.00 | 316.00 | 315.80 | 281.60 | 358.20 | 302.60 | 256.80 | 160.90 | 300.60 | 255.00 | 254.70 | 196.70 | NA | NA | NA | NA | NA | NA | NA | |
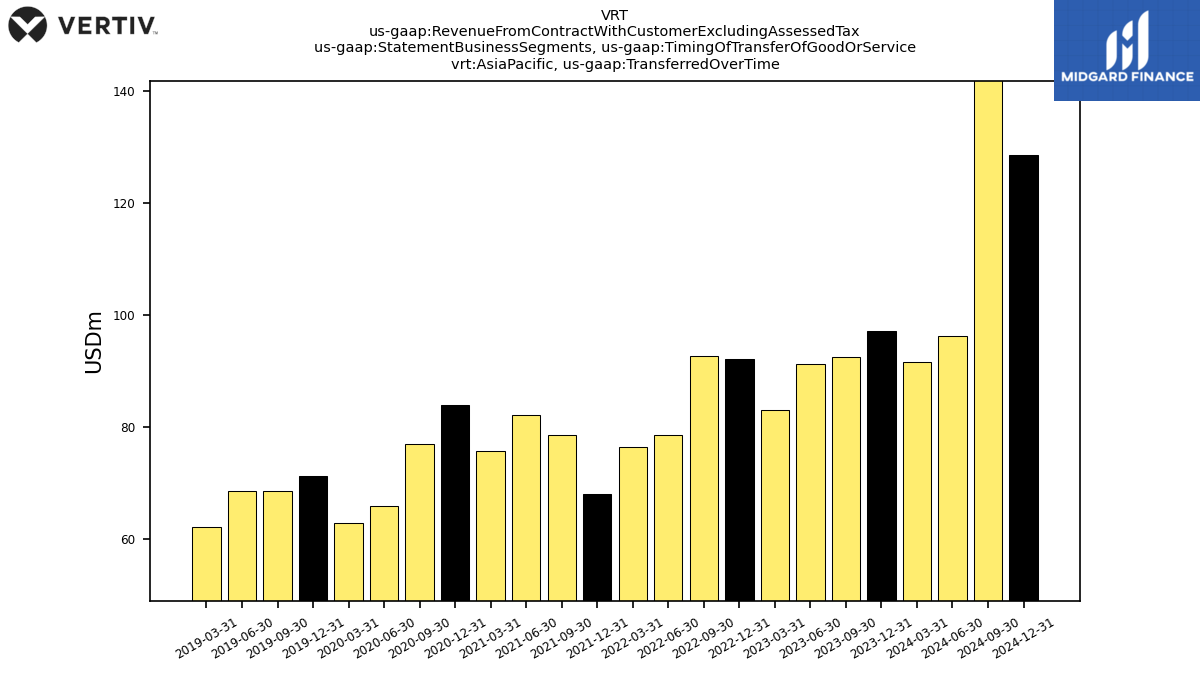
| Asia Pacific, Transferred Over Time | 97.10 | 92.60 | 91.20 | 83.00 | 92.10 | 92.70 | 78.70 | 76.40 | 68.10 | 78.60 | 82.20 | 75.80 | 83.90 | 77.00 | 66.00 | 63.00 | 71.30 | 68.70 | 68.60 | 62.30 | NA | NA | NA | NA | NA | NA | NA | |
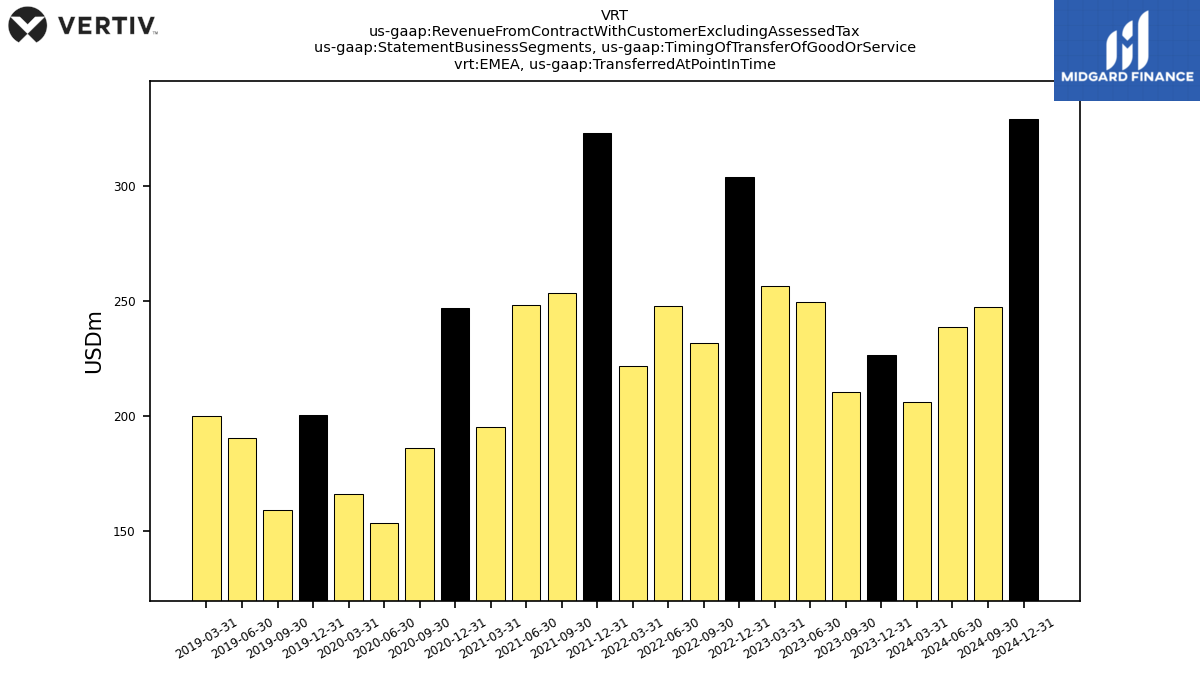
| EMEA, Transferred At Point In Time | 226.30 | 210.40 | 249.40 | 256.30 | 303.80 | 231.80 | 247.70 | 221.70 | 322.90 | 253.30 | 248.30 | 195.00 | 246.80 | 185.90 | 153.40 | 165.80 | 200.20 | 158.90 | 190.30 | 199.70 | NA | NA | NA | NA | NA | NA | NA | |
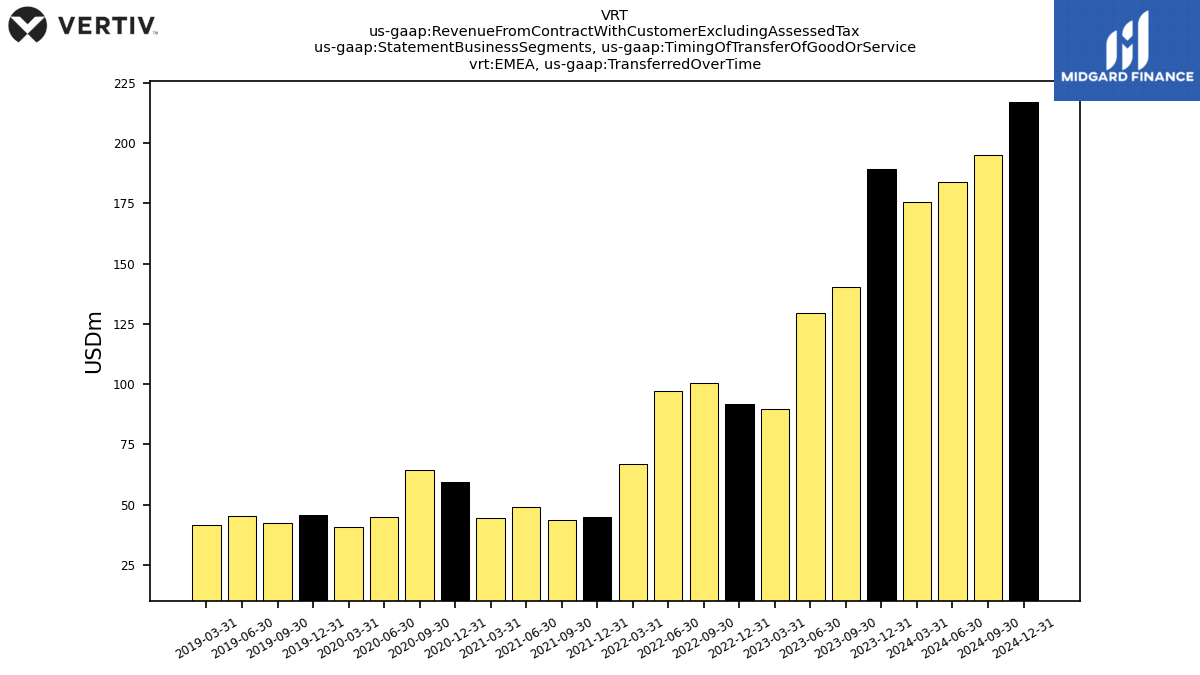
| EMEA, Transferred Over Time | 189.10 | 140.40 | 129.50 | 89.50 | 91.90 | 100.60 | 97.30 | 66.80 | 44.70 | 43.80 | 49.10 | 44.50 | 59.50 | 64.50 | 44.80 | 40.90 | 45.70 | 42.40 | 45.40 | 41.70 | NA | NA | NA | NA | NA | NA | NA | |
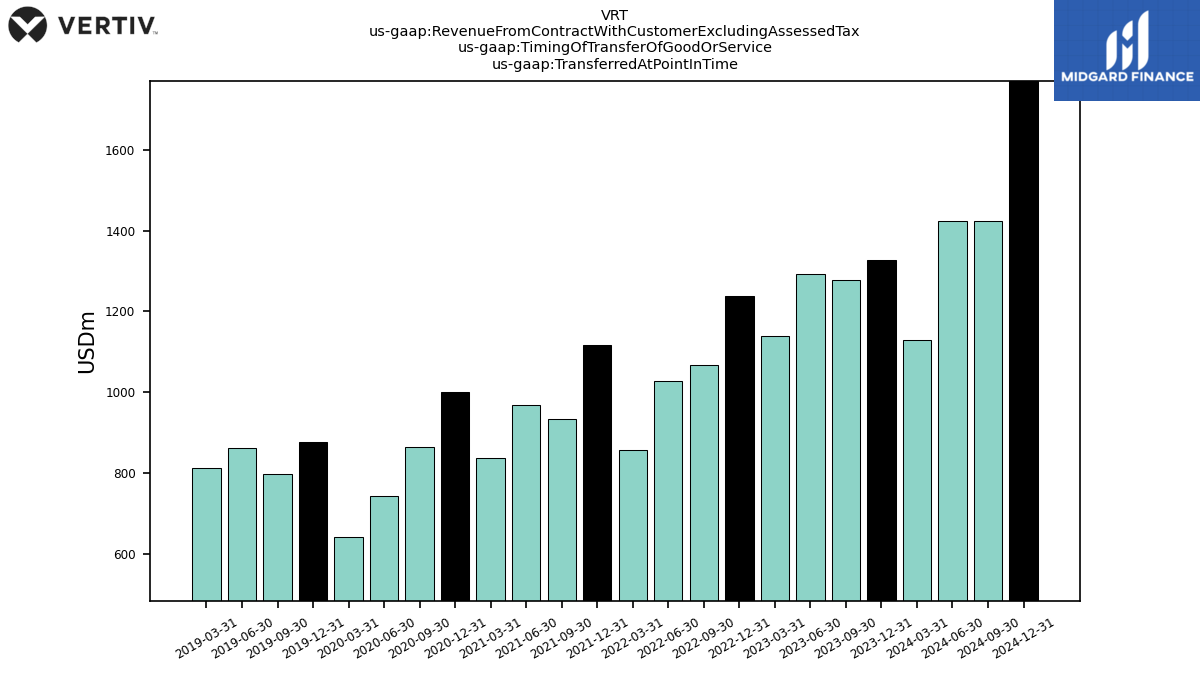
| Transferred At Point In Time | 1327.70 | 1279.20 | 1293.30 | 1138.40 | 1238.60 | 1067.90 | 1028.60 | 856.20 | 1117.40 | 932.80 | 967.20 | 837.10 | 1001.60 | 865.20 | 742.60 | 639.90 | 876.10 | 797.60 | 862.30 | 812.30 | NA | NA | NA | NA | NA | NA | NA | |
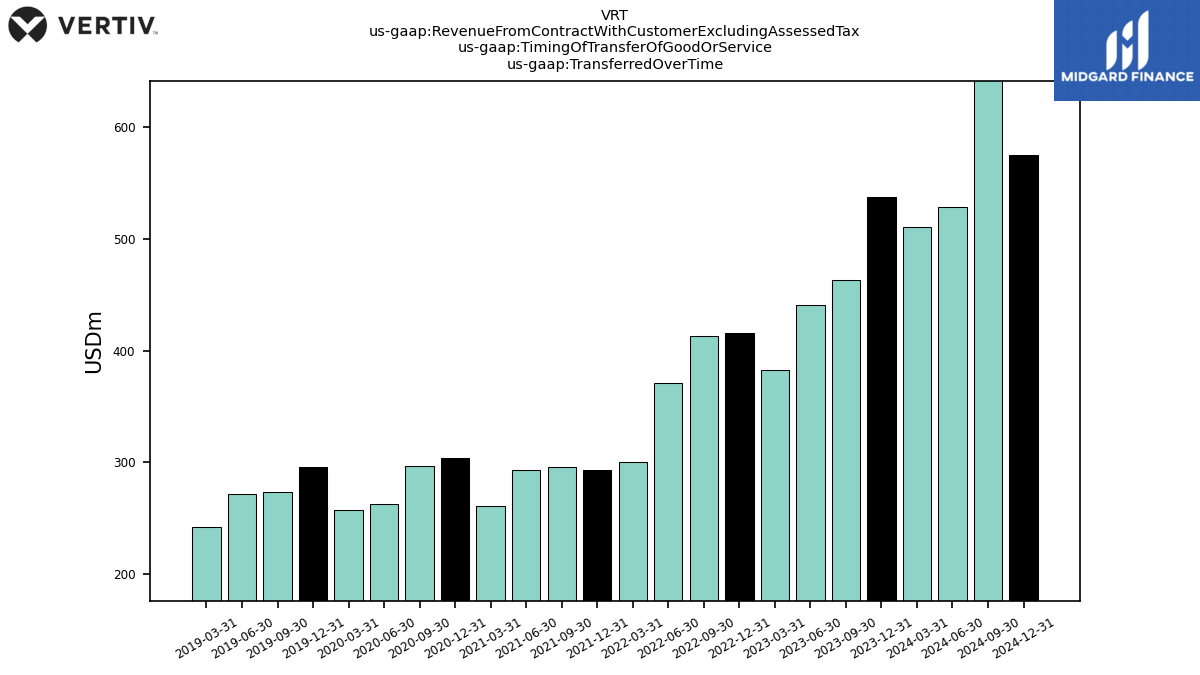
| Transferred Over Time | 537.70 | 463.40 | 440.80 | 382.70 | 416.00 | 413.20 | 370.80 | 300.20 | 293.10 | 296.10 | 293.10 | 261.30 | 304.10 | 296.80 | 263.10 | 257.40 | 295.40 | 273.10 | 271.80 | 242.50 | NA | NA | NA | NA | NA | NA | NA |