
| 2022-12-31 | 2022-09-30 | 2022-06-30 | 2022-03-31 | 2021-12-31 | 2021-09-30 | 2021-06-30 | 2021-03-31 | 2020-12-31 | 2020-09-30 | 2020-06-30 | 2020-03-31 | 2019-12-31 | 2019-09-30 | 2019-06-30 | 2019-03-31 | ||
|---|---|---|---|---|---|---|---|---|---|---|---|---|---|---|---|---|---|
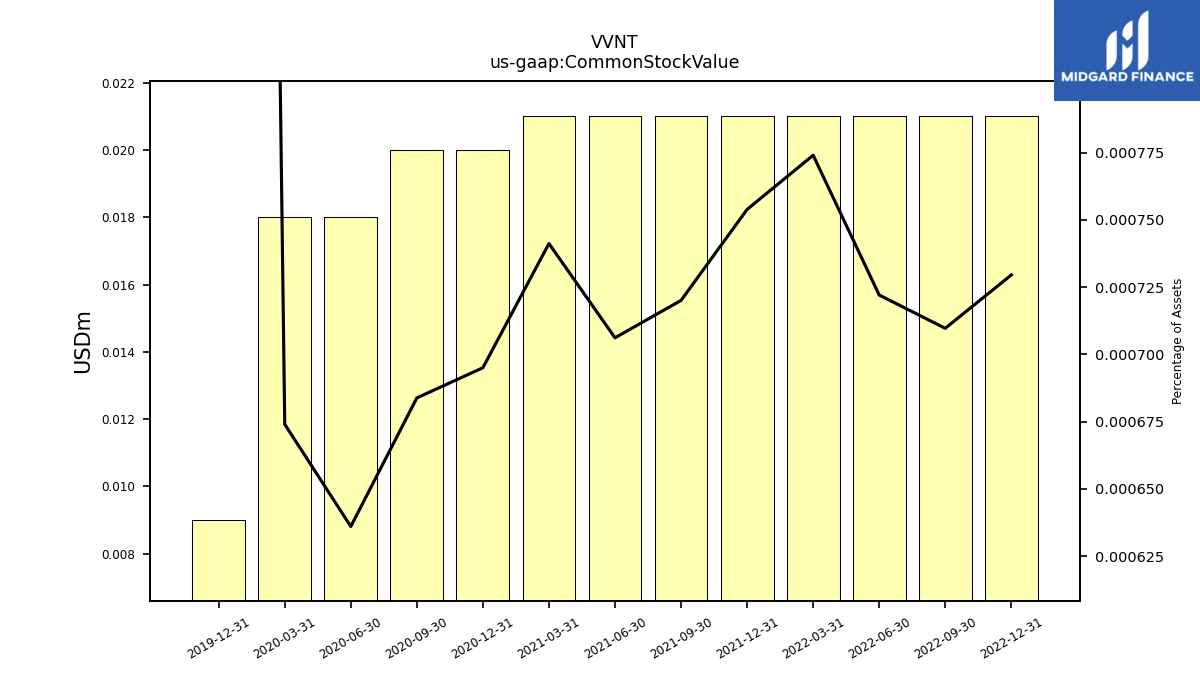
| Common Stock Value | 0.02 | 0.02 | 0.02 | 0.02 | 0.02 | 0.02 | 0.02 | 0.02 | 0.02 | 0.02 | 0.02 | 0.02 | 0.01 | NA | NA | NA | |
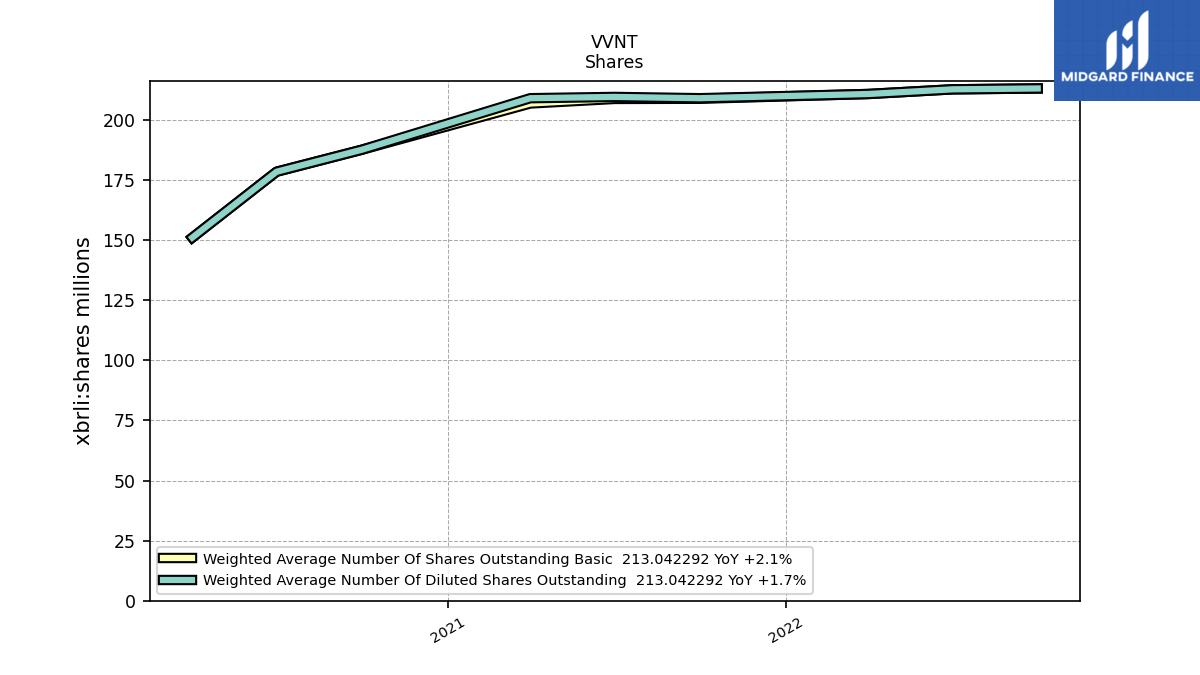
| Weighted Average Number Of Diluted Shares Outstanding | NA | 213.04 | 212.68 | 210.74 | NA | 208.99 | 209.52 | 208.99 | NA | 187.55 | 178.41 | 151.01 | NA | NA | NA | NA | |
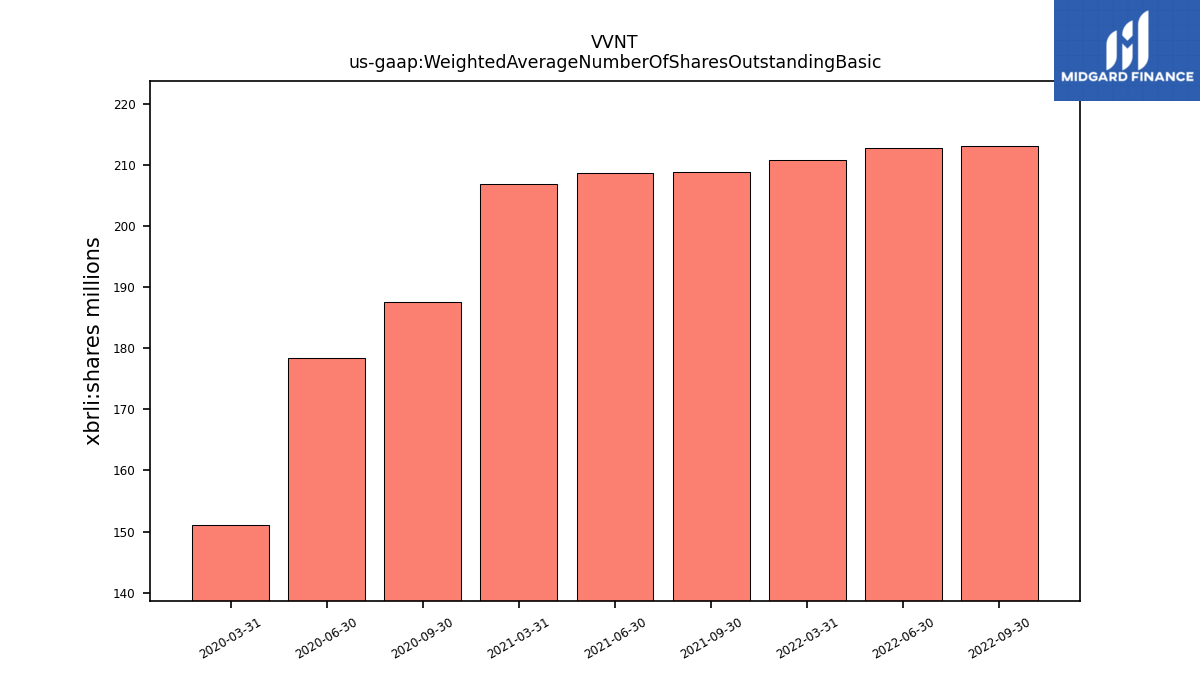
| Weighted Average Number Of Shares Outstanding Basic | NA | 213.04 | 212.68 | 210.74 | NA | 208.76 | 208.69 | 206.79 | NA | 187.55 | 178.41 | 151.01 | NA | NA | NA | NA | |
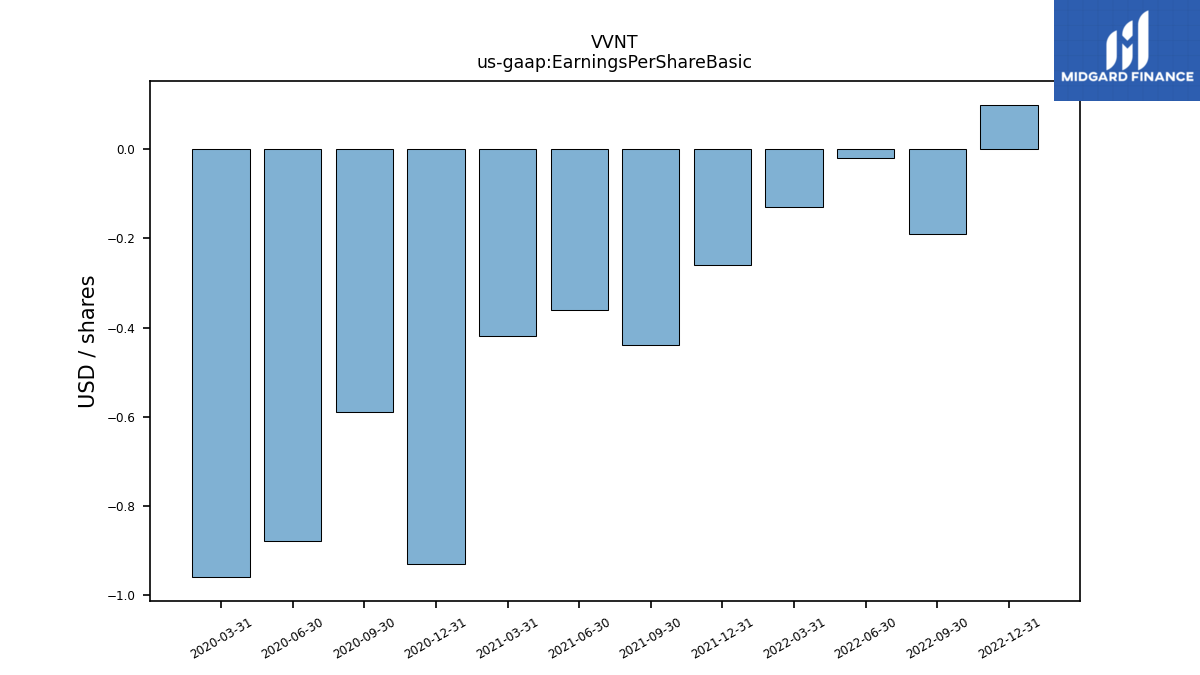
| Earnings Per Share Basic | 0.10 | -0.19 | -0.02 | -0.13 | -0.26 | -0.44 | -0.36 | -0.42 | -0.93 | -0.59 | -0.88 | -0.96 | NA | NA | NA | NA | |
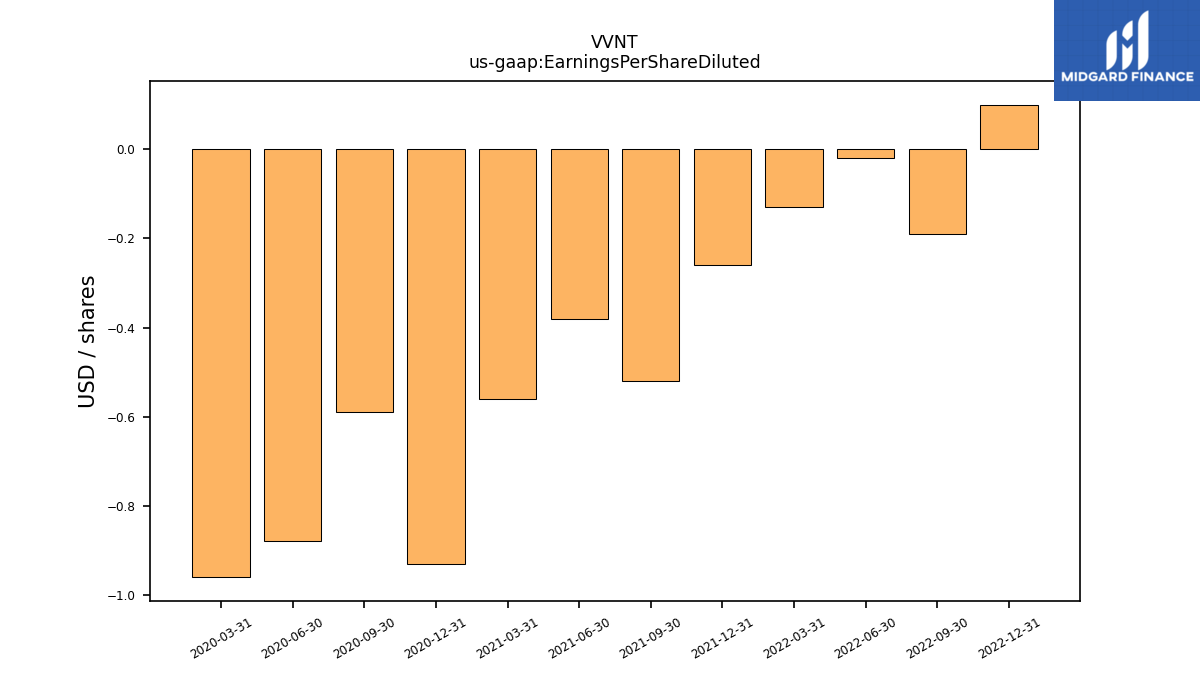
| Earnings Per Share Diluted | 0.10 | -0.19 | -0.02 | -0.13 | -0.26 | -0.52 | -0.38 | -0.56 | -0.93 | -0.59 | -0.88 | -0.96 | NA | NA | NA | NA |
| 2022-12-31 | 2022-09-30 | 2022-06-30 | 2022-03-31 | 2021-12-31 | 2021-09-30 | 2021-06-30 | 2021-03-31 | 2020-12-31 | 2020-09-30 | 2020-06-30 | 2020-03-31 | 2019-12-31 | 2019-09-30 | 2019-06-30 | 2019-03-31 | ||
|---|---|---|---|---|---|---|---|---|---|---|---|---|---|---|---|---|---|
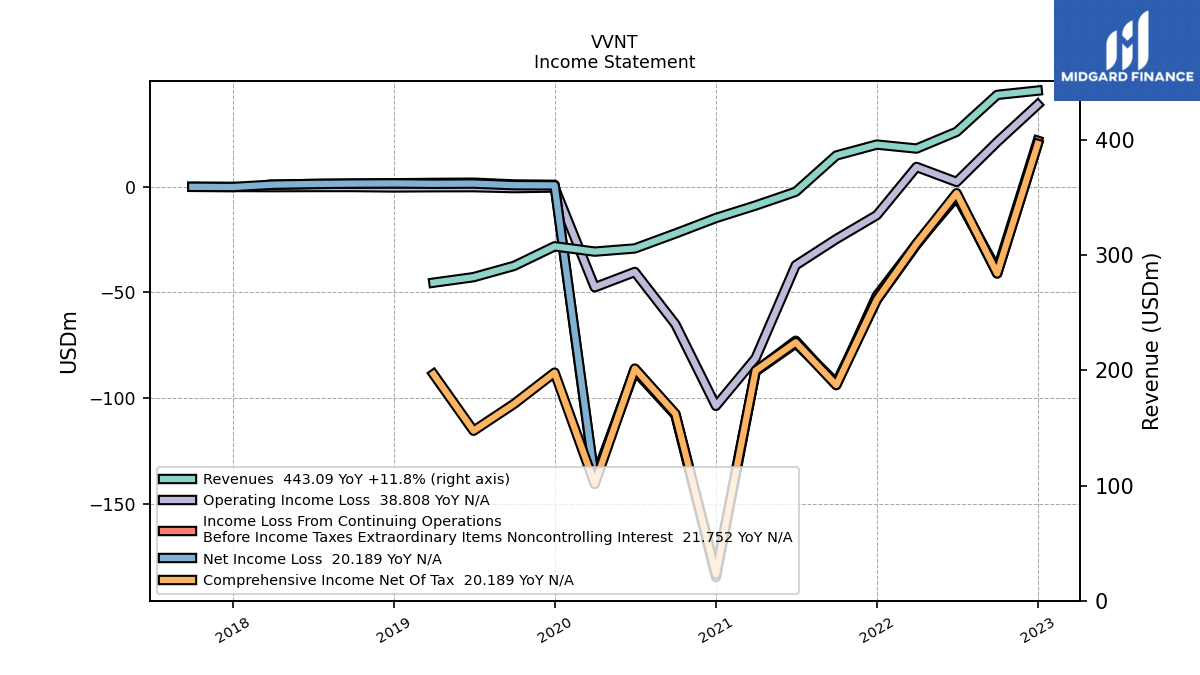
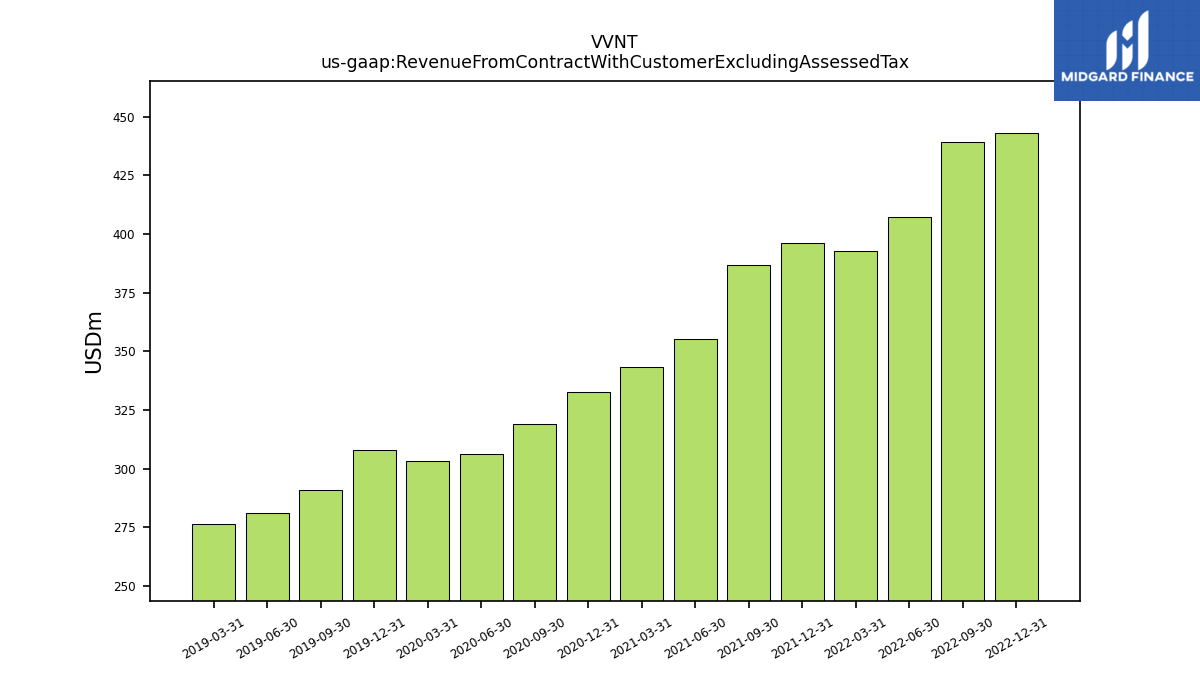
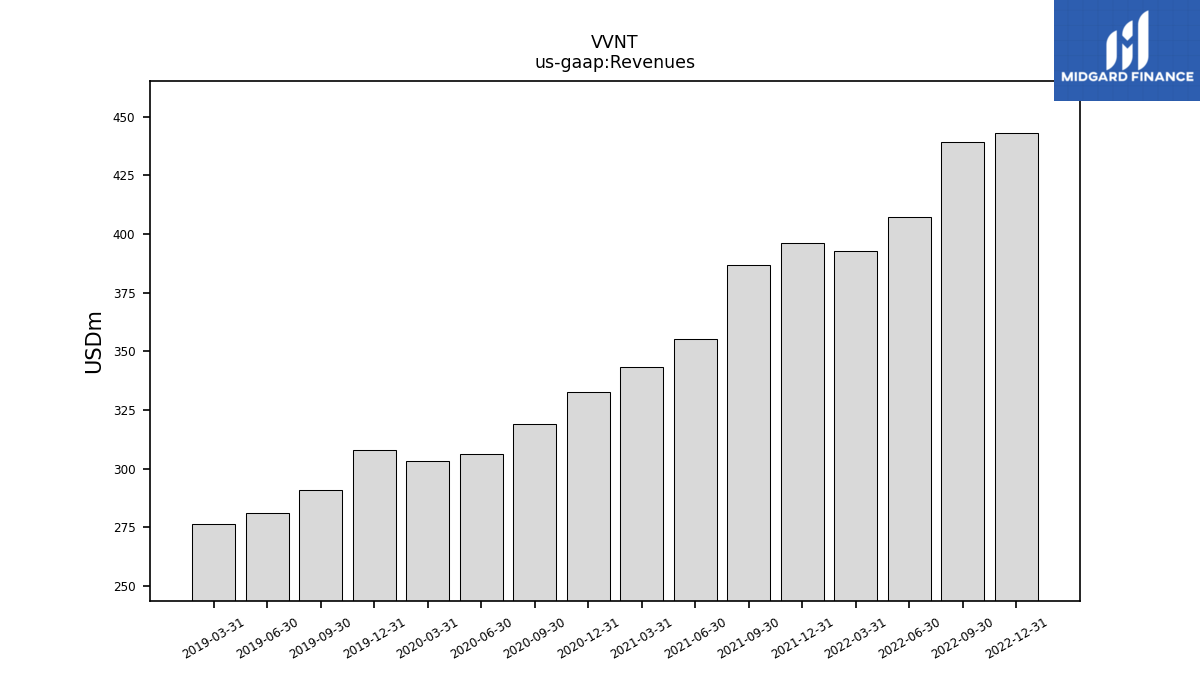
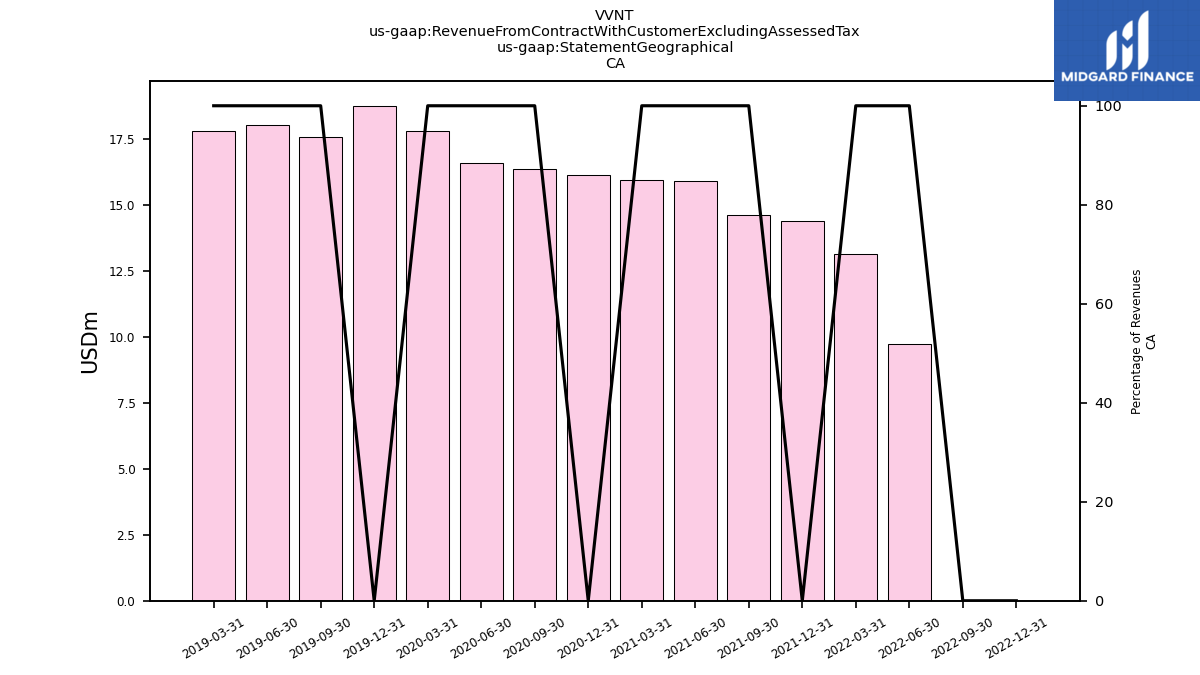
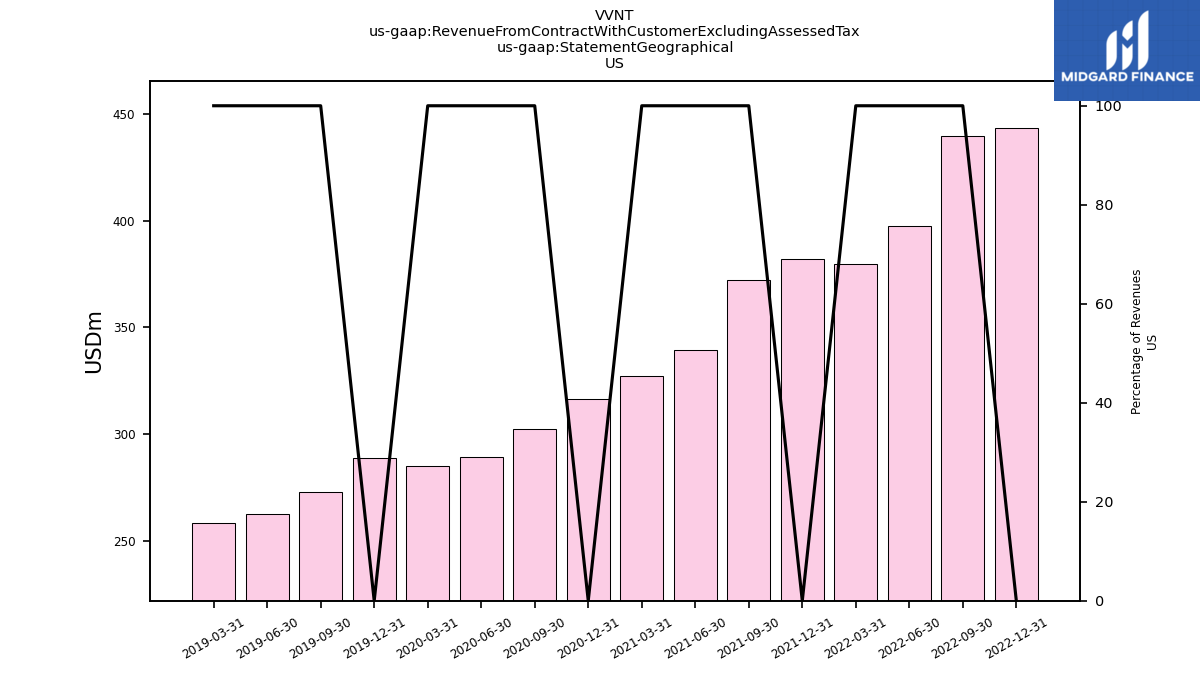
| Revenue From Contract With Customer Excluding Assessed Tax | 443.09 | 439.37 | 407.28 | 392.75 | 396.21 | 386.71 | 355.23 | 343.29 | 332.42 | 318.96 | 306.00 | 303.23 | 307.83 | 290.84 | 281.05 | 276.25 | |
| Revenues | 443.09 | 439.37 | 407.28 | 392.75 | 396.21 | 386.71 | 355.23 | 343.29 | 332.42 | 318.96 | 306.00 | 303.23 | 307.83 | 290.84 | 281.05 | 276.25 | |
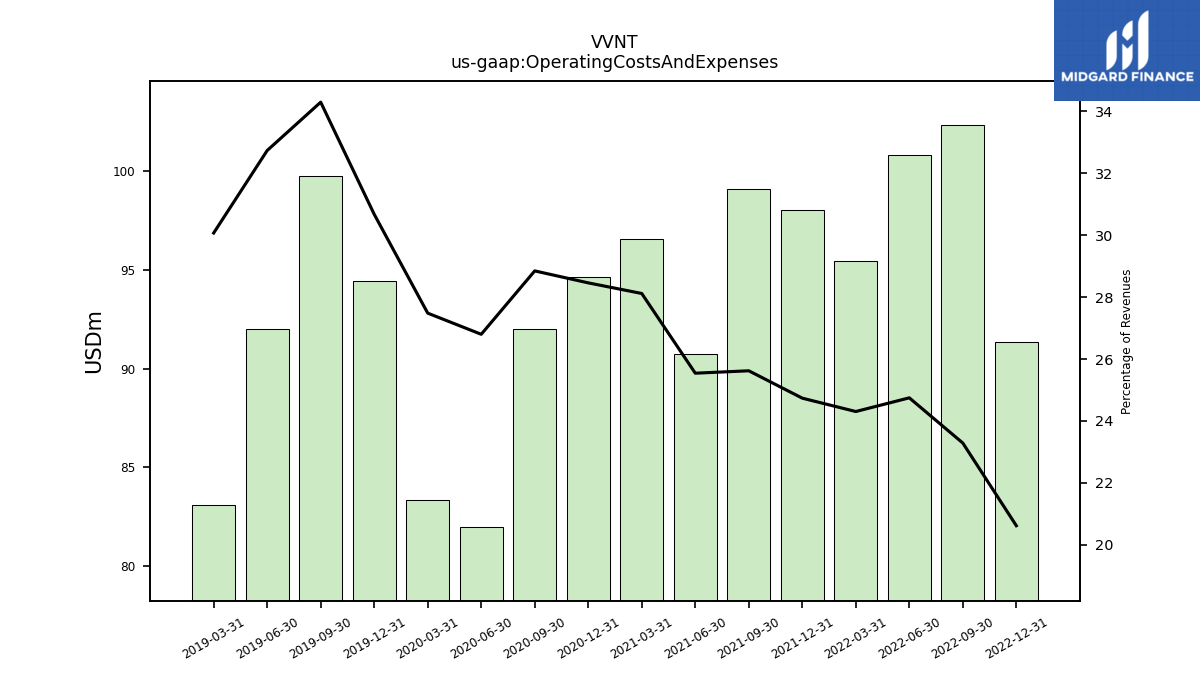
| Operating Costs And Expenses | 91.35 | 102.32 | 100.79 | 95.46 | 98.01 | 99.08 | 90.74 | 96.53 | 94.61 | 92.02 | 82.01 | 83.34 | 94.44 | 99.76 | 92.01 | 83.08 | |
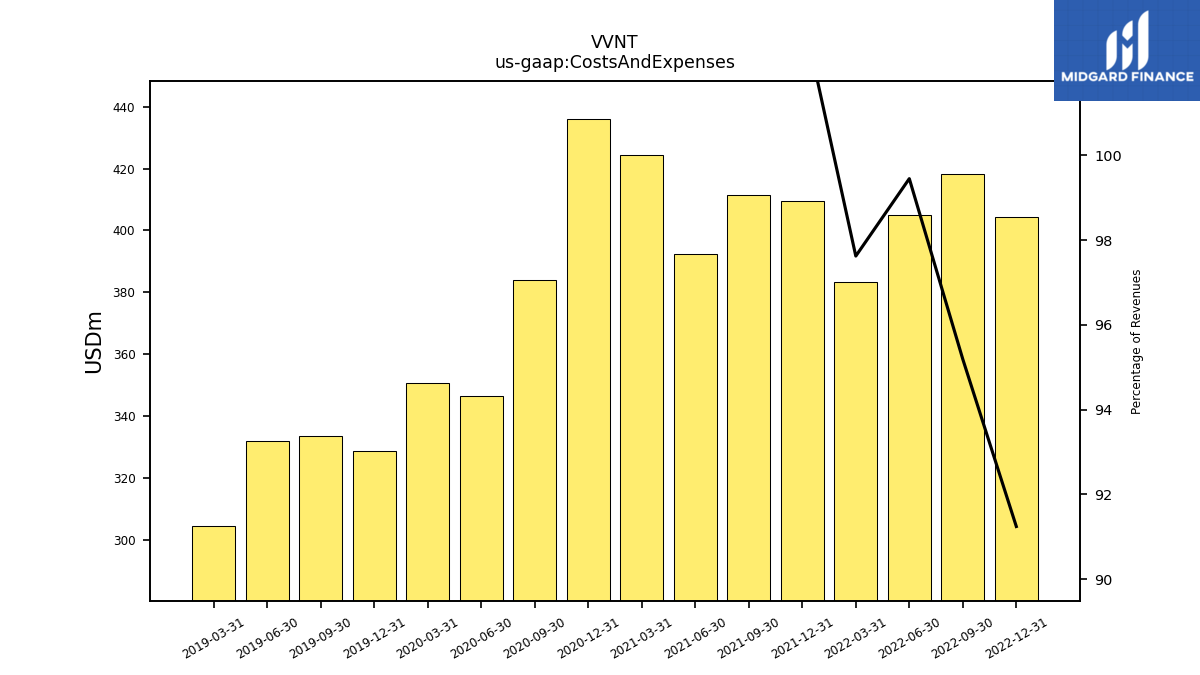
| Costs And Expenses | 404.28 | 418.22 | 405.03 | 383.41 | 409.66 | 411.46 | 392.37 | 424.33 | 436.05 | 383.99 | 346.30 | 350.77 | 328.71 | 333.45 | 331.88 | 304.23 | |
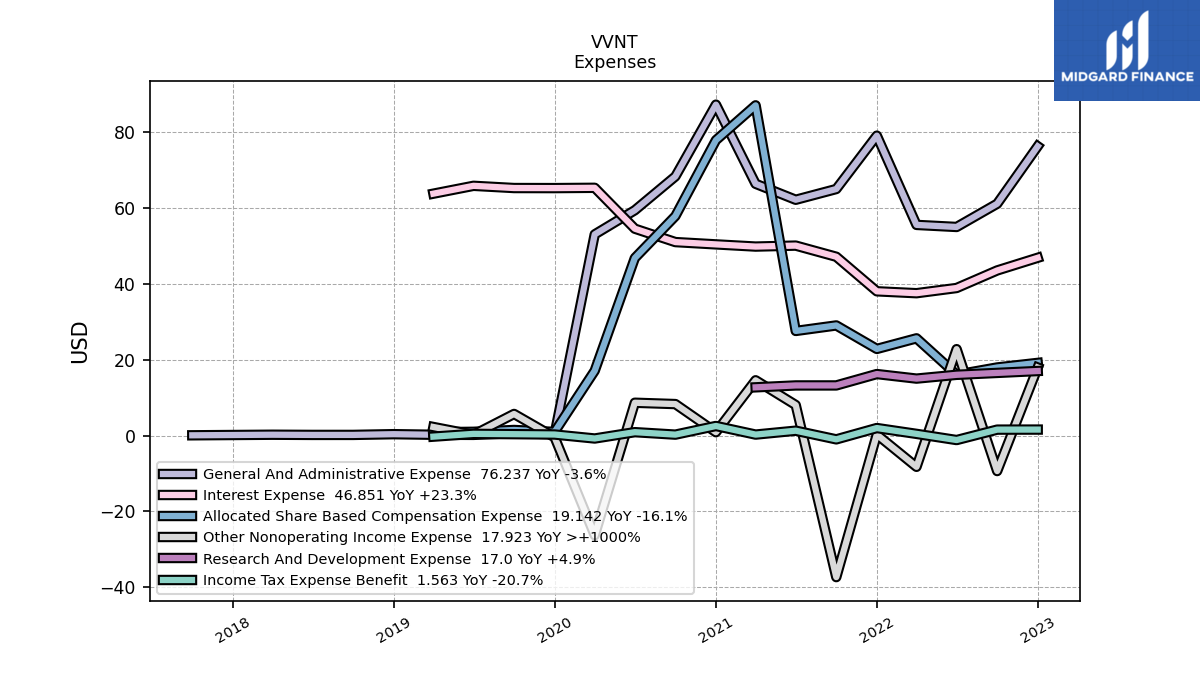
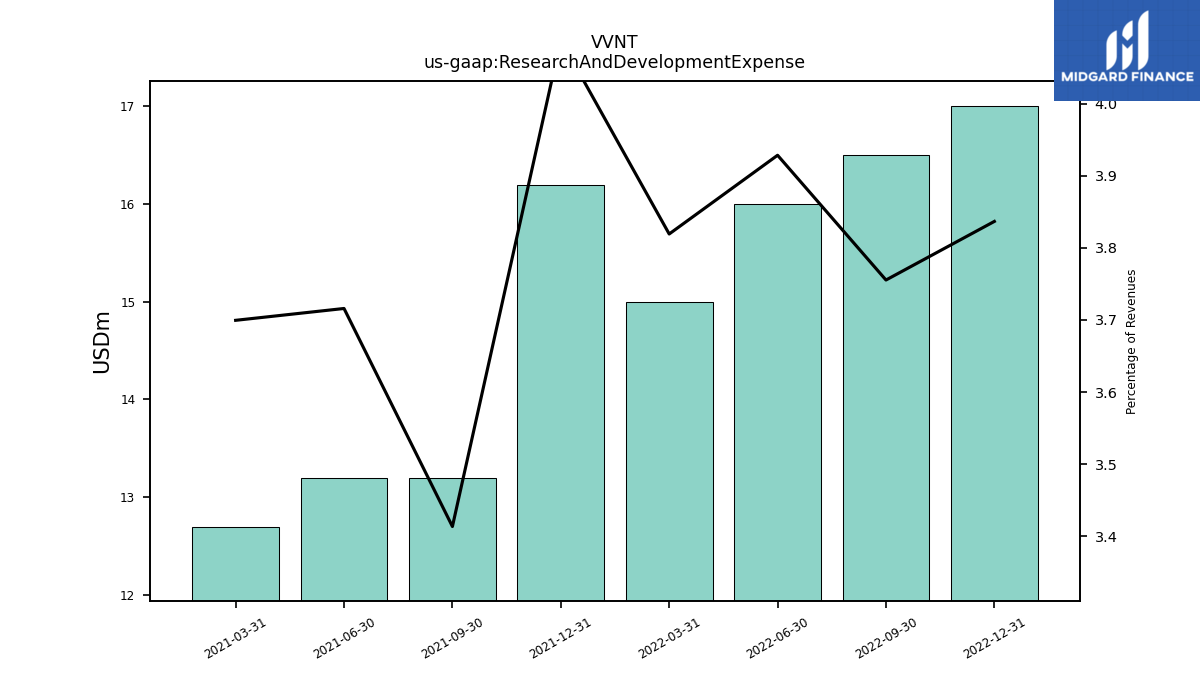
| Research And Development Expense | 17.00 | 16.50 | 16.00 | 15.00 | 16.20 | 13.20 | 13.20 | 12.70 | NA | NA | NA | NA | NA | NA | NA | NA | |
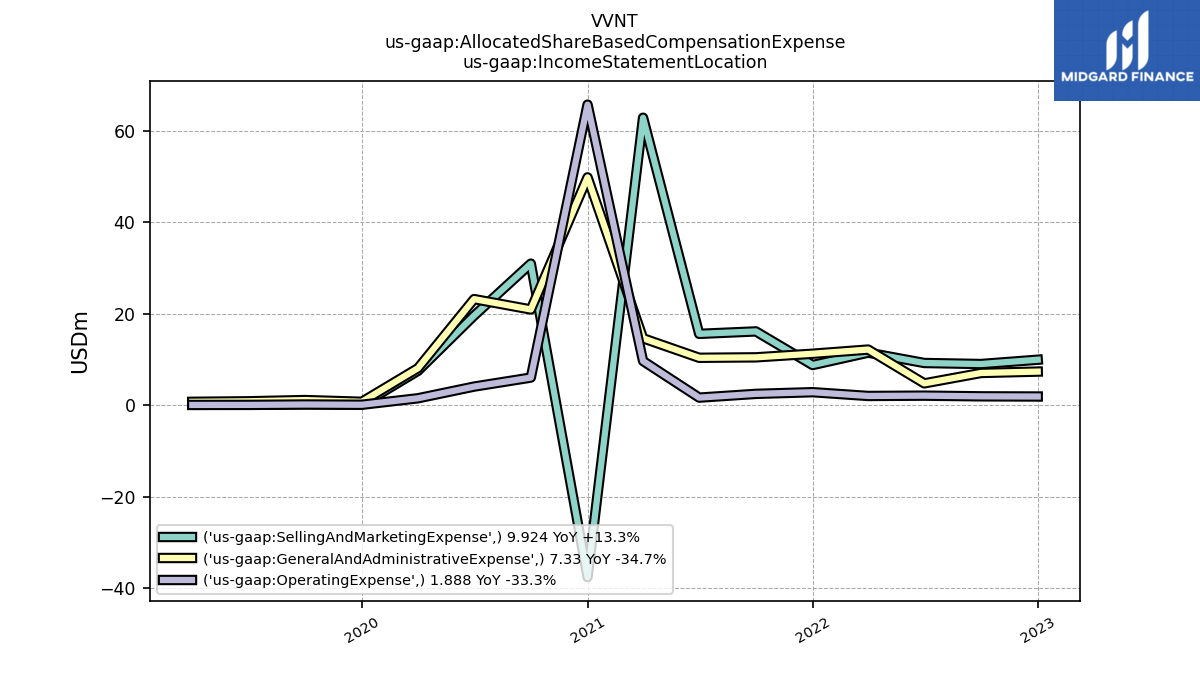
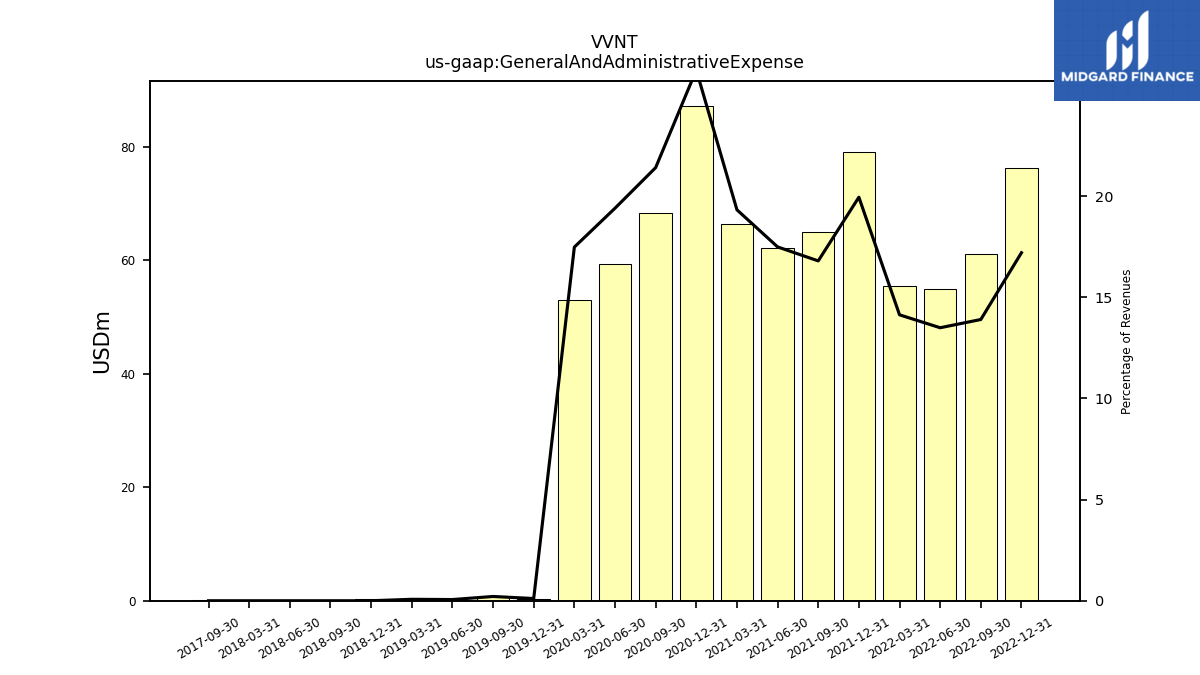
| General And Administrative Expense | 76.24 | 61.09 | 54.97 | 55.52 | 79.05 | 64.97 | 62.14 | 66.35 | 87.22 | 68.30 | 59.38 | 53.02 | 0.34 | 0.62 | 0.17 | 0.20 | |
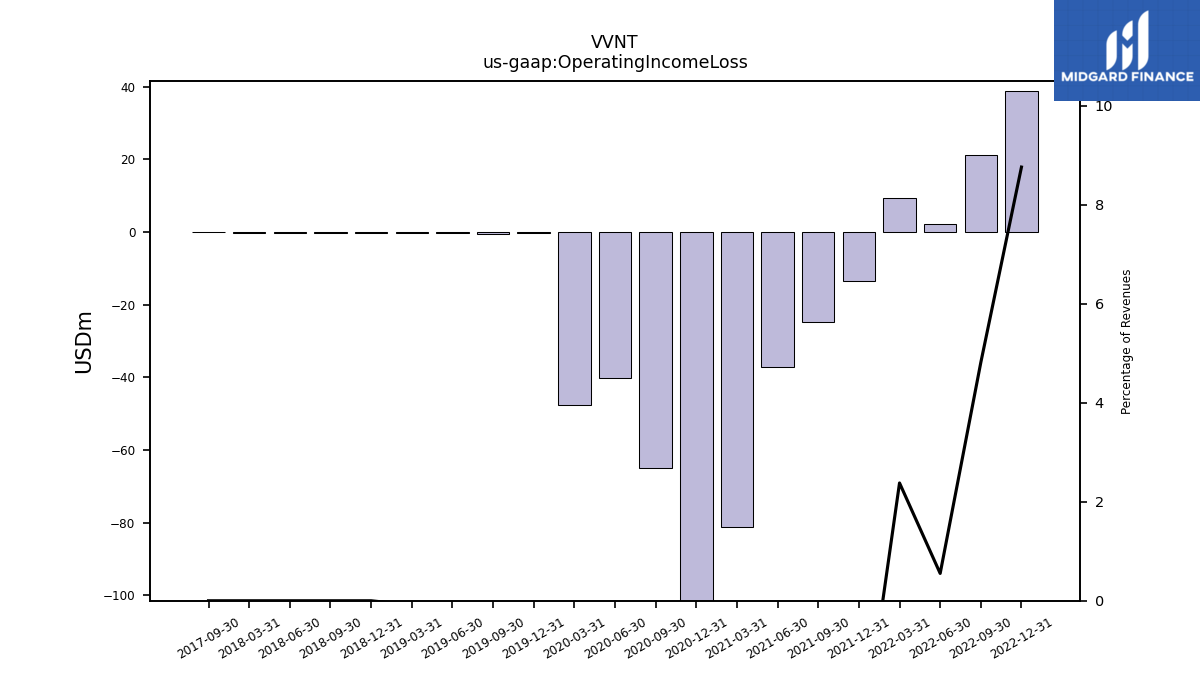
| Operating Income Loss | 38.81 | 21.15 | 2.25 | 9.34 | -13.45 | -24.75 | -37.13 | -81.04 | -103.63 | -65.03 | -40.30 | -47.54 | -0.39 | -0.67 | -0.22 | -0.24 | |
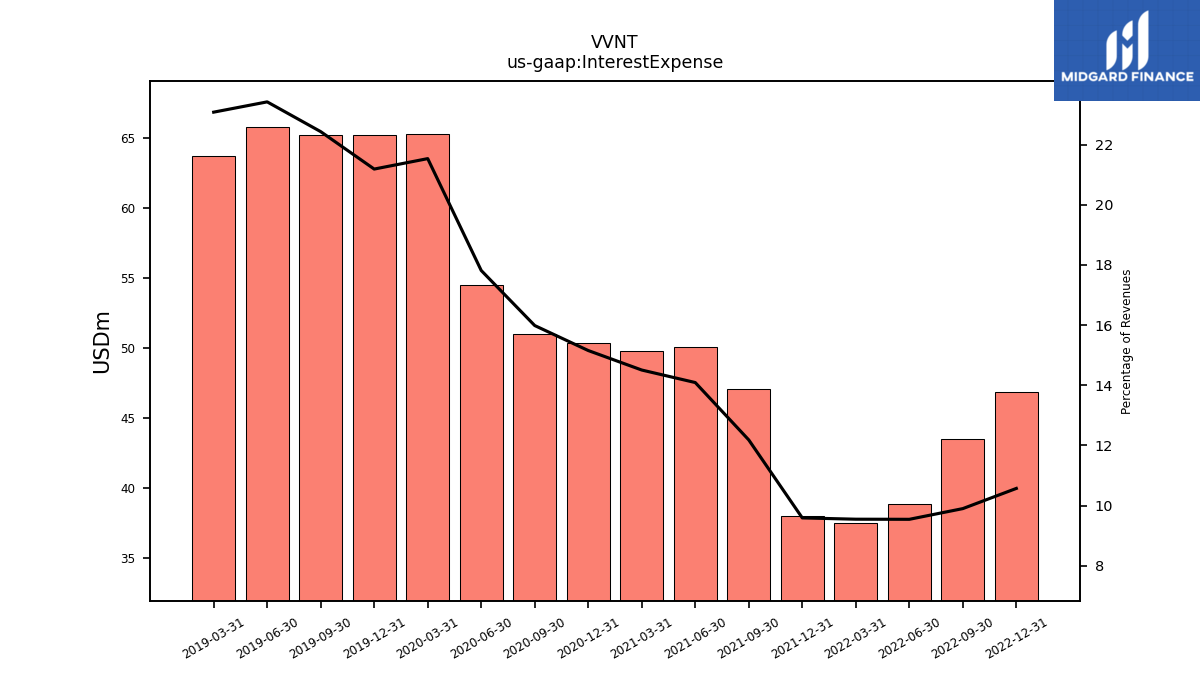
| Interest Expense | 46.85 | 43.51 | 38.88 | 37.51 | 38.01 | 47.12 | 50.06 | 49.80 | 50.38 | 50.99 | 54.52 | 65.29 | 65.22 | 65.23 | 65.82 | 63.75 | |
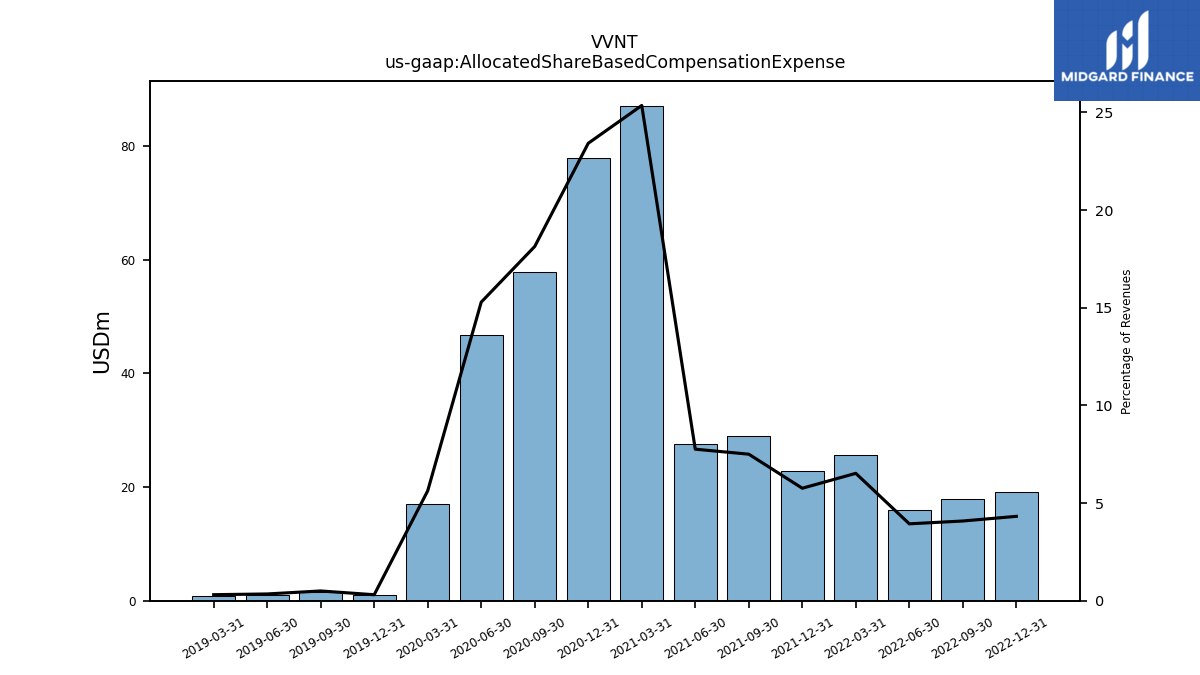
| Allocated Share Based Compensation Expense | 19.14 | 17.94 | 16.04 | 25.62 | 22.82 | 29.02 | 27.56 | 87.04 | 77.85 | 57.85 | 46.78 | 17.07 | 0.95 | 1.46 | 0.98 | 0.86 | |
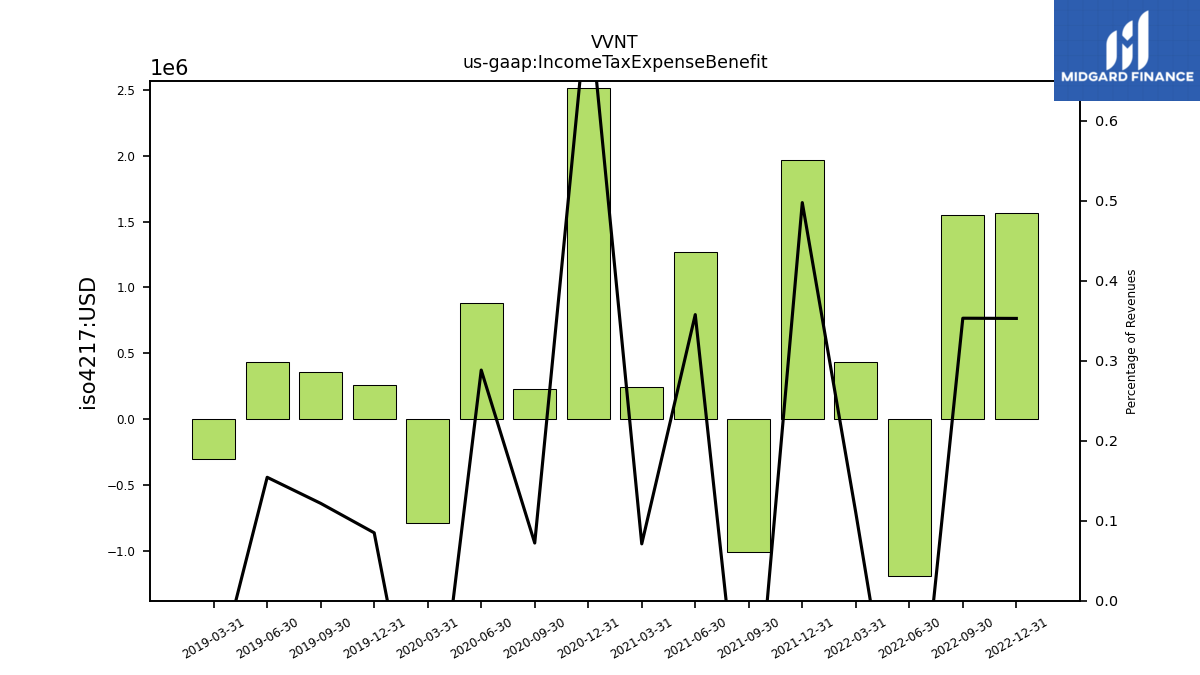
| Income Tax Expense Benefit | 1.56 | 1.55 | -1.20 | 0.43 | 1.97 | -1.01 | 1.27 | 0.24 | 2.51 | 0.23 | 0.88 | -0.79 | 0.26 | 0.35 | 0.43 | -0.30 | |
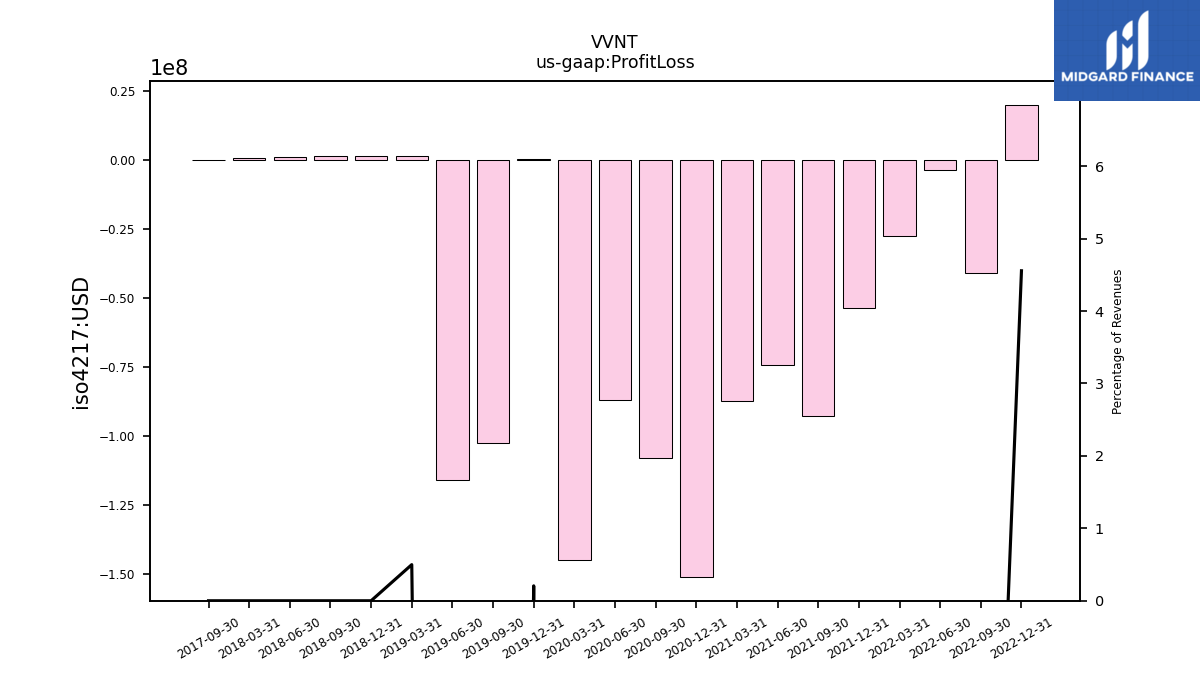
| Profit Loss | 20.19 | -41.01 | -3.49 | -27.43 | -53.46 | -92.74 | -74.10 | -87.38 | -151.15 | -107.94 | -87.03 | -145.10 | 0.63 | -102.41 | -115.90 | 1.38 | |
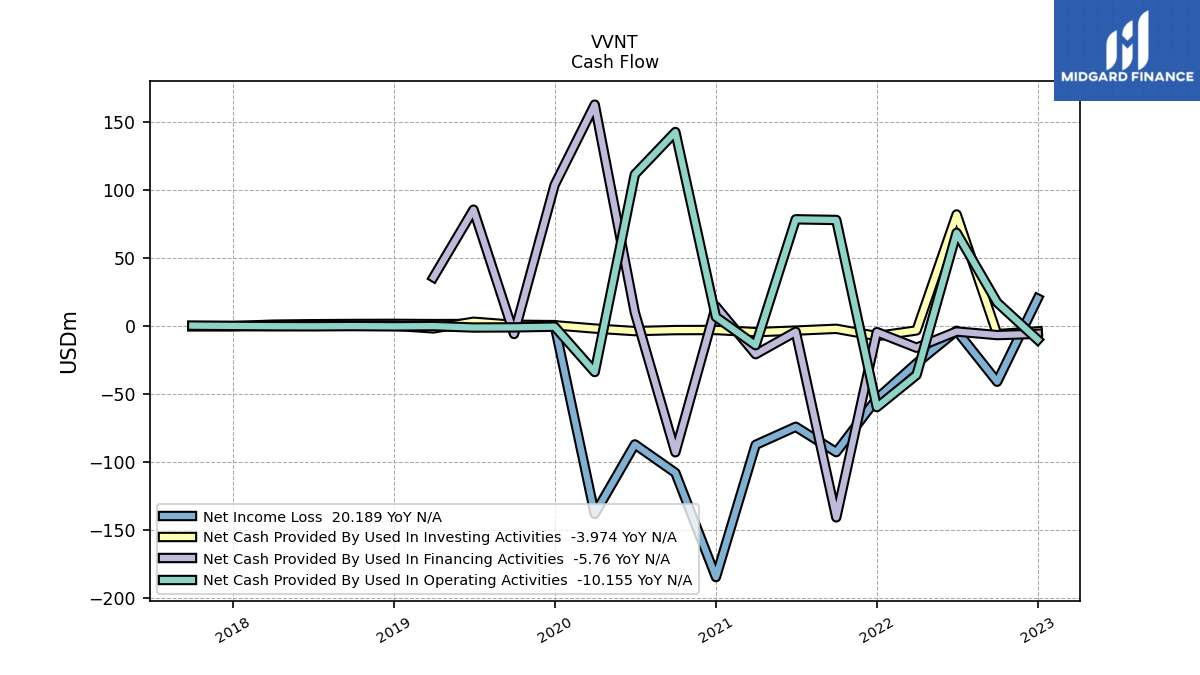
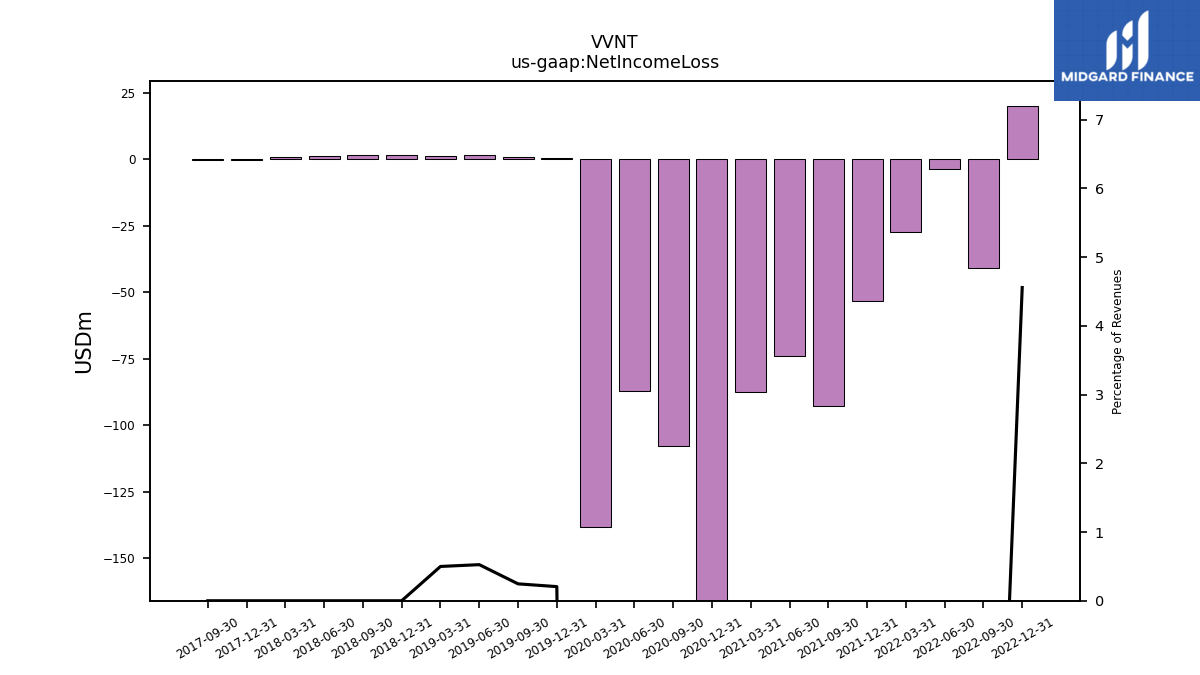
| Net Income Loss | 20.19 | -41.01 | -3.49 | -27.43 | -53.46 | -92.74 | -74.10 | -87.38 | -184.59 | -107.94 | -87.03 | -138.12 | 0.63 | 0.71 | 1.48 | 1.38 | |
| Comprehensive Income Net Of Tax | 20.19 | -41.01 | -3.07 | -26.97 | -53.41 | -93.81 | -73.56 | -86.99 | -183.30 | -107.35 | -86.01 | -140.55 | -87.90 | -102.68 | -115.39 | -88.59 |
| 2022-12-31 | 2022-09-30 | 2022-06-30 | 2022-03-31 | 2021-12-31 | 2021-09-30 | 2021-06-30 | 2021-03-31 | 2020-12-31 | 2020-09-30 | 2020-06-30 | 2020-03-31 | 2019-12-31 | 2019-09-30 | 2019-06-30 | 2019-03-31 | ||
|---|---|---|---|---|---|---|---|---|---|---|---|---|---|---|---|---|---|
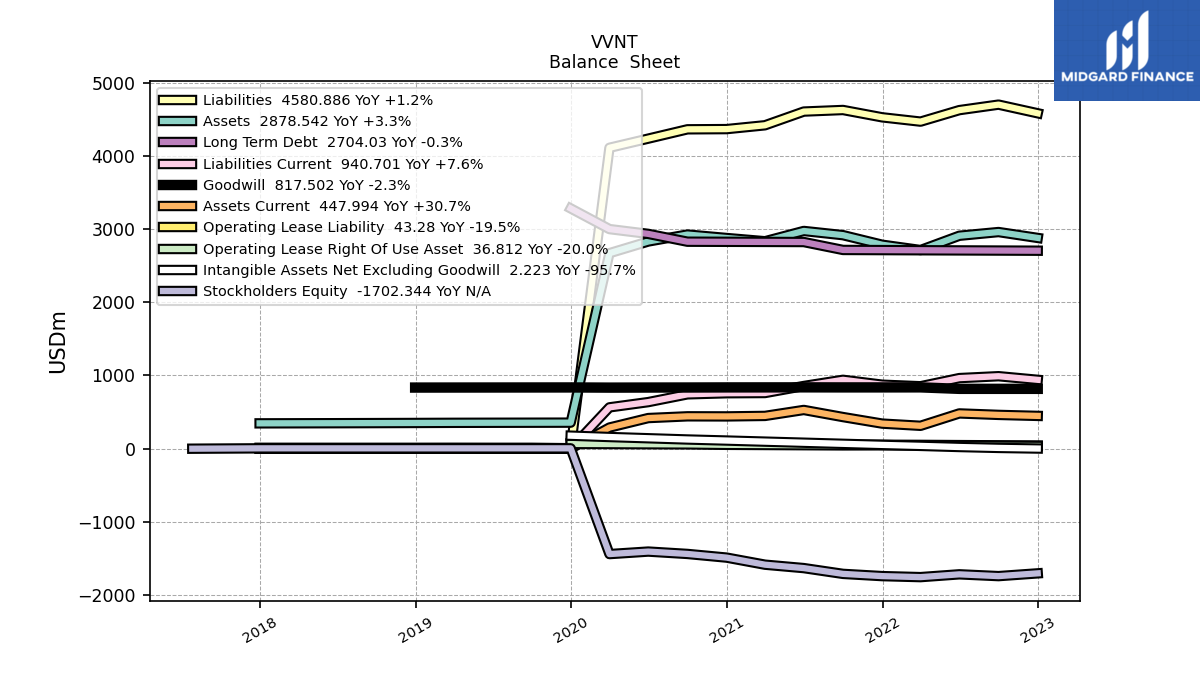
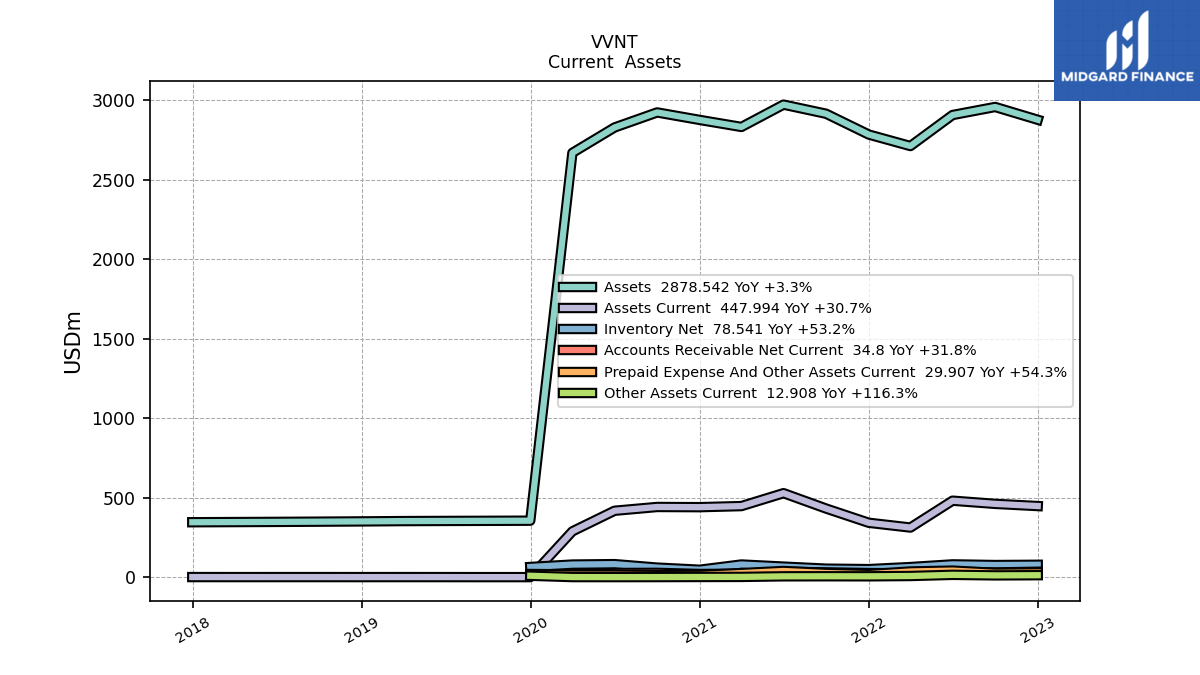
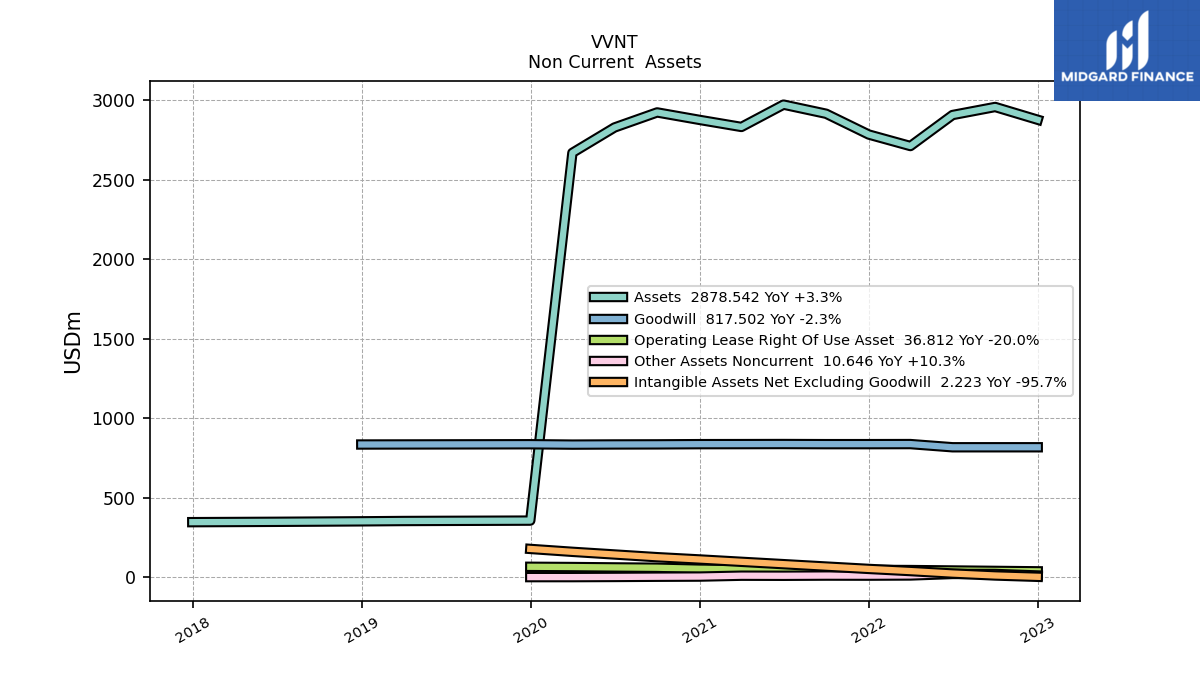
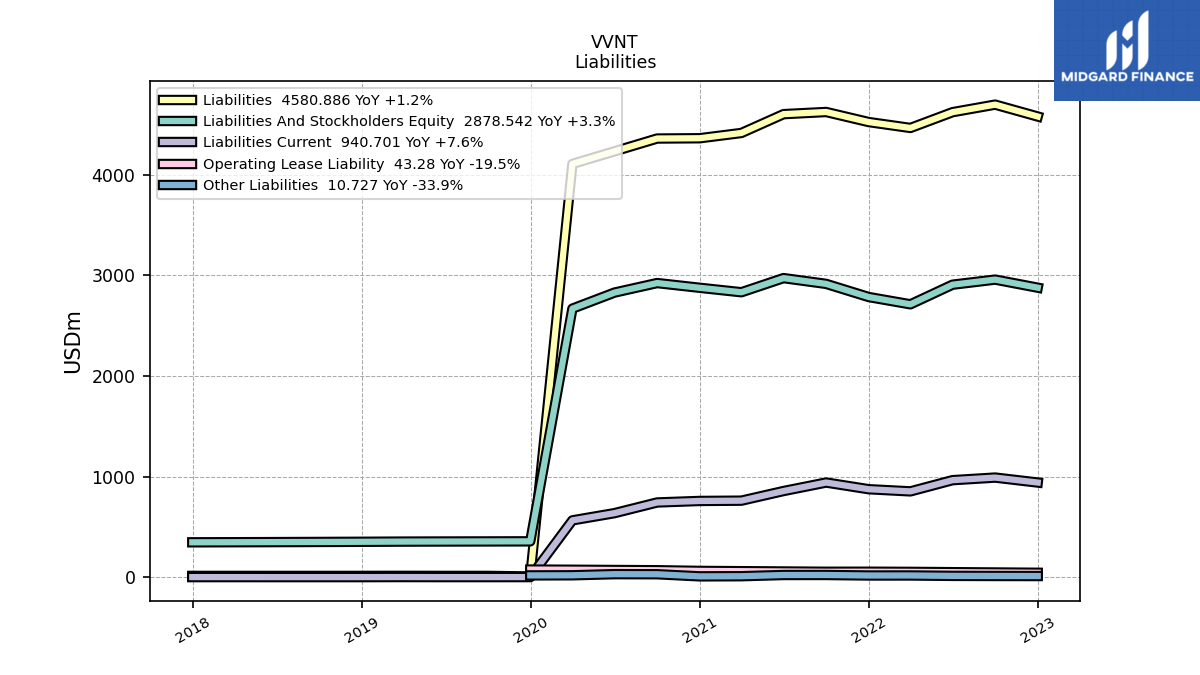
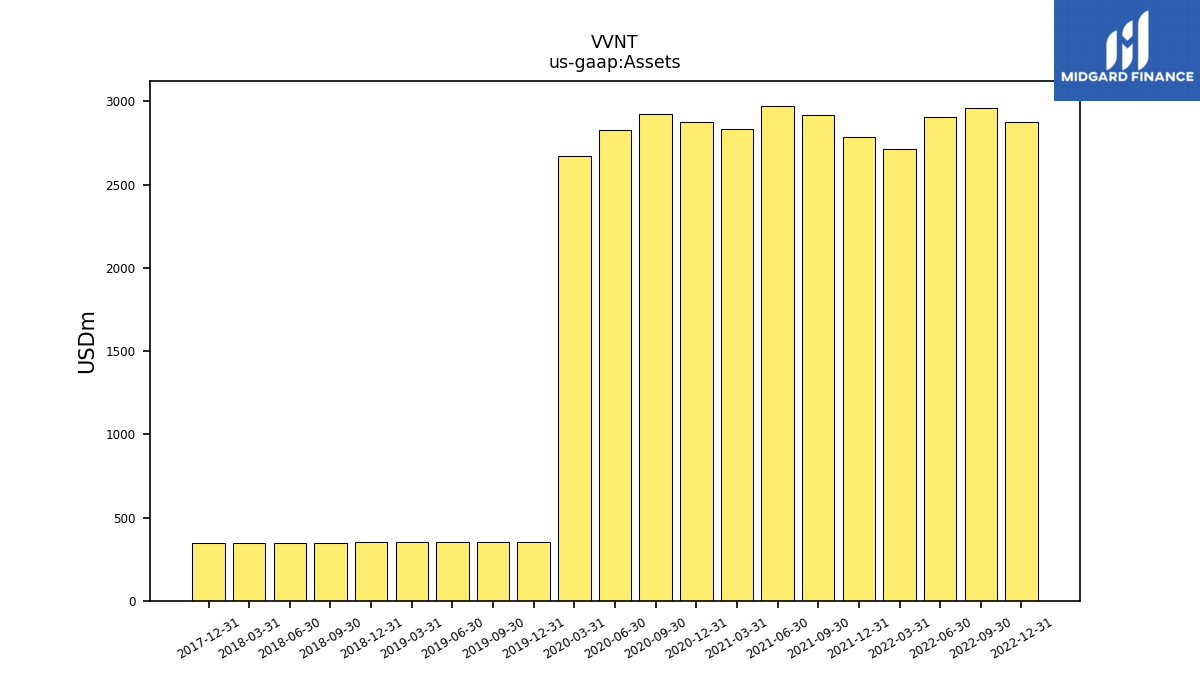
| Assets | 2878.54 | 2958.98 | 2908.33 | 2713.15 | 2785.63 | 2916.39 | 2973.80 | 2833.26 | 2877.49 | 2924.68 | 2829.95 | 2670.42 | 355.93 | 355.11 | 354.36 | 353.42 | |
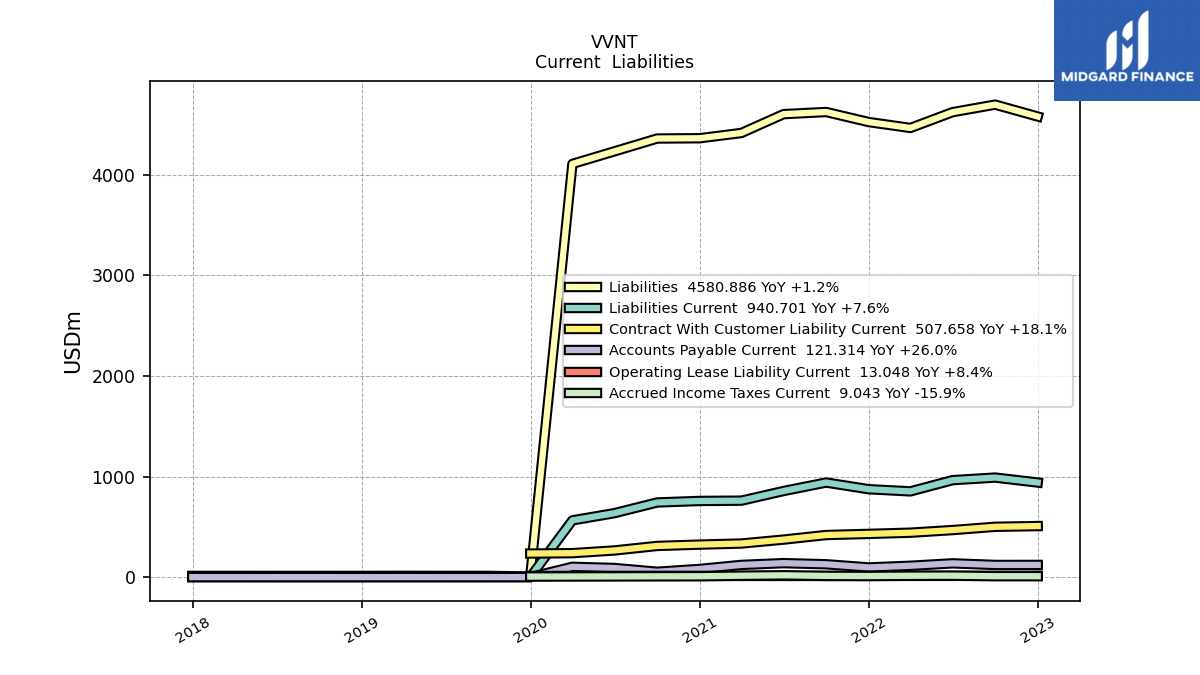
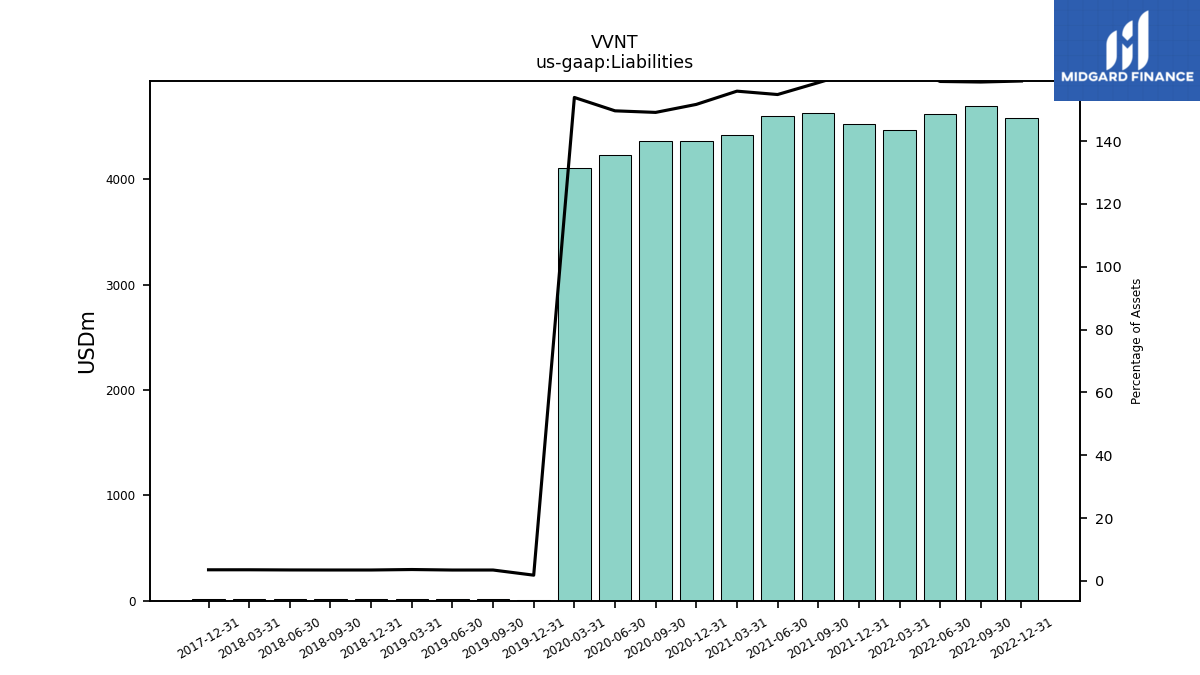
| Liabilities | 4580.89 | 4699.17 | 4623.97 | 4467.04 | 4525.73 | 4625.88 | 4604.41 | 4417.23 | 4364.84 | 4361.95 | 4234.82 | 4109.74 | 6.46 | 12.27 | 12.23 | 12.77 | |
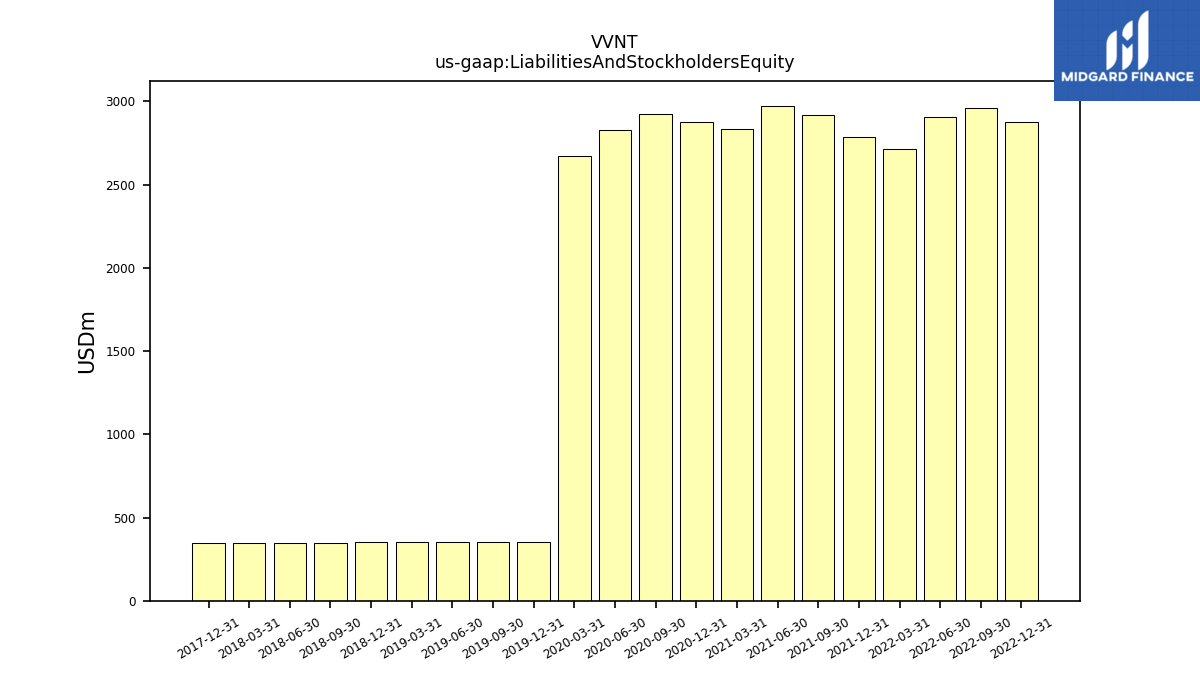
| Liabilities And Stockholders Equity | 2878.54 | 2958.98 | 2908.33 | 2713.15 | 2785.63 | 2916.39 | 2973.80 | 2833.26 | 2877.49 | 2924.68 | 2829.95 | 2670.42 | 355.93 | 355.11 | 354.36 | 353.42 | |
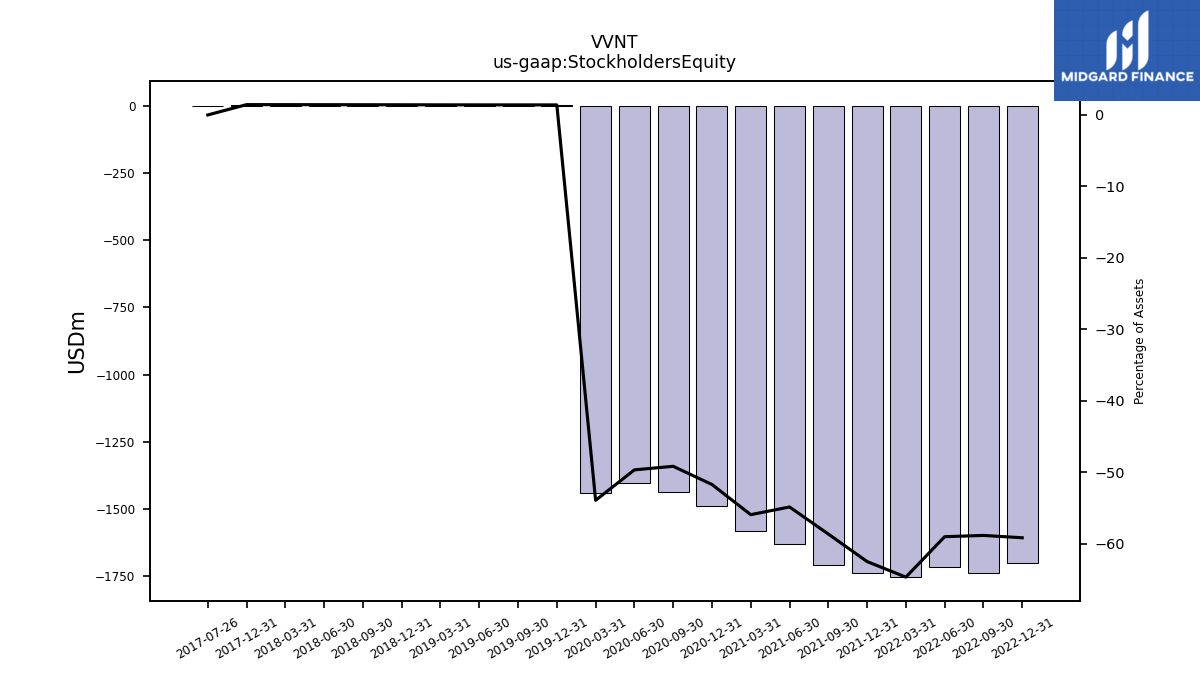
| Stockholders Equity | -1702.34 | -1740.19 | -1715.65 | -1753.89 | -1740.10 | -1709.50 | -1630.61 | -1583.97 | -1487.35 | -1437.27 | -1404.87 | -1439.31 | 5.00 | 5.00 | 5.00 | 5.00 |
| 2022-12-31 | 2022-09-30 | 2022-06-30 | 2022-03-31 | 2021-12-31 | 2021-09-30 | 2021-06-30 | 2021-03-31 | 2020-12-31 | 2020-09-30 | 2020-06-30 | 2020-03-31 | 2019-12-31 | 2019-09-30 | 2019-06-30 | 2019-03-31 | ||
|---|---|---|---|---|---|---|---|---|---|---|---|---|---|---|---|---|---|
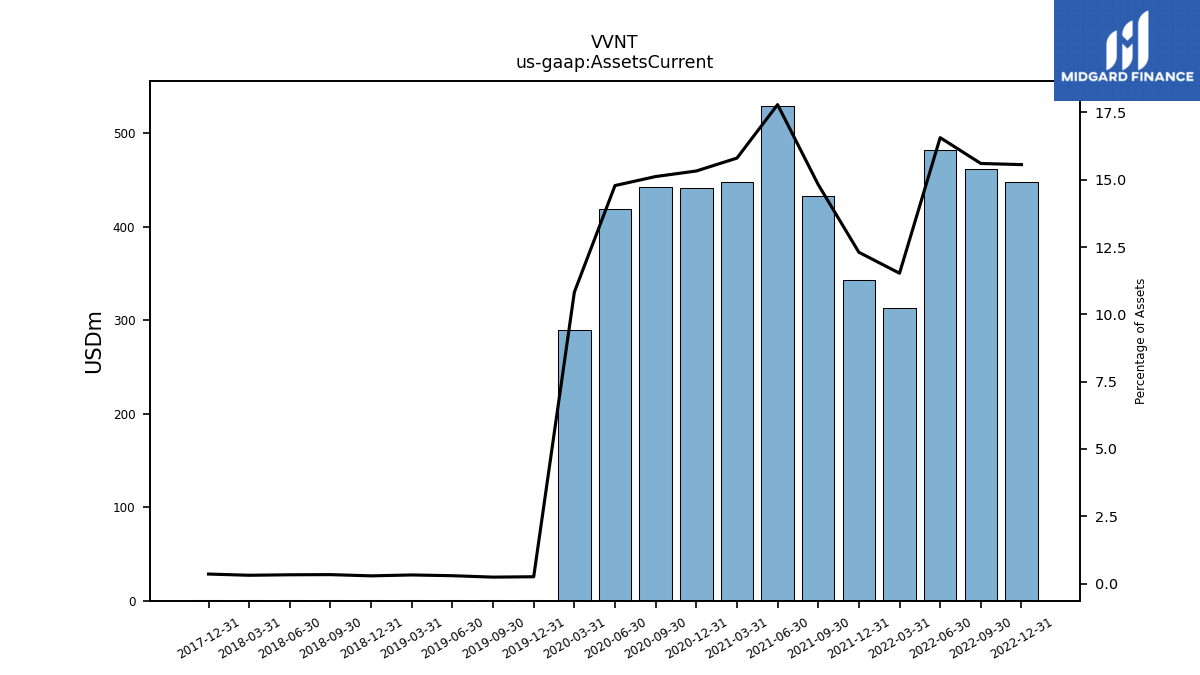
| Assets Current | 447.99 | 461.76 | 481.76 | 312.77 | 342.82 | 432.20 | 529.09 | 447.80 | 441.01 | 442.21 | 418.41 | 289.07 | 0.90 | 0.85 | 1.03 | 1.13 | |
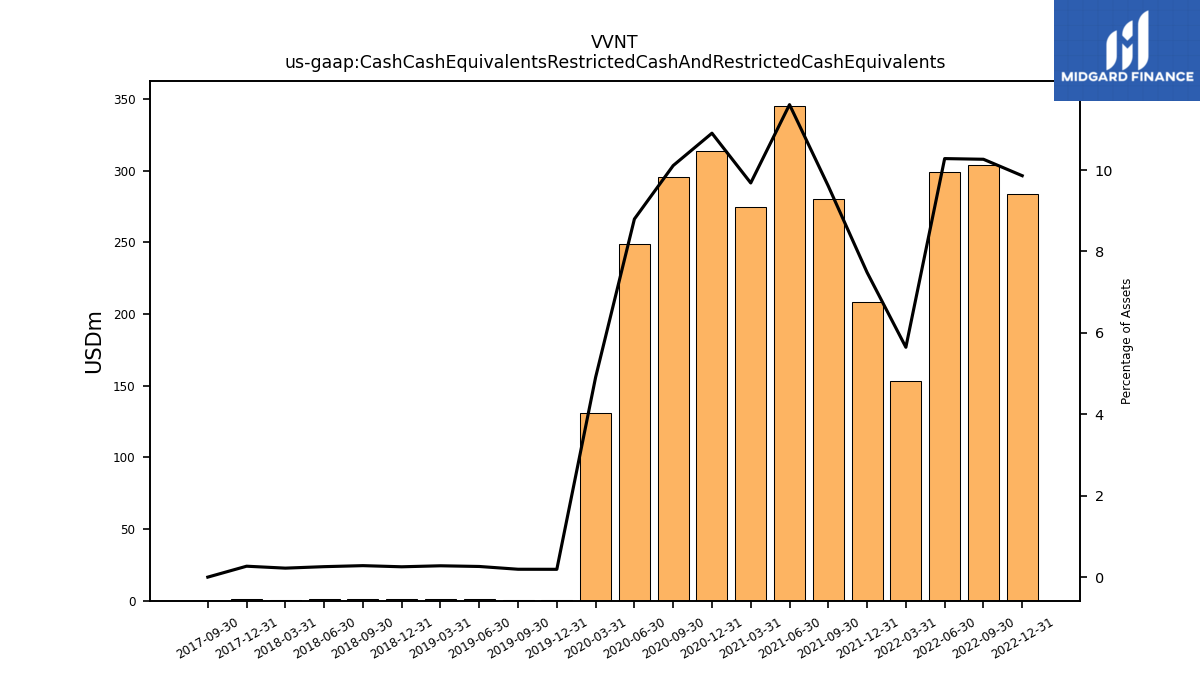
| Cash Cash Equivalents Restricted Cash And Restricted Cash Equivalents | 283.85 | 303.74 | 299.03 | 153.22 | 208.51 | 280.15 | 345.18 | 274.34 | 313.80 | 295.68 | 248.95 | 131.09 | 0.68 | 0.69 | 0.93 | 0.98 | |
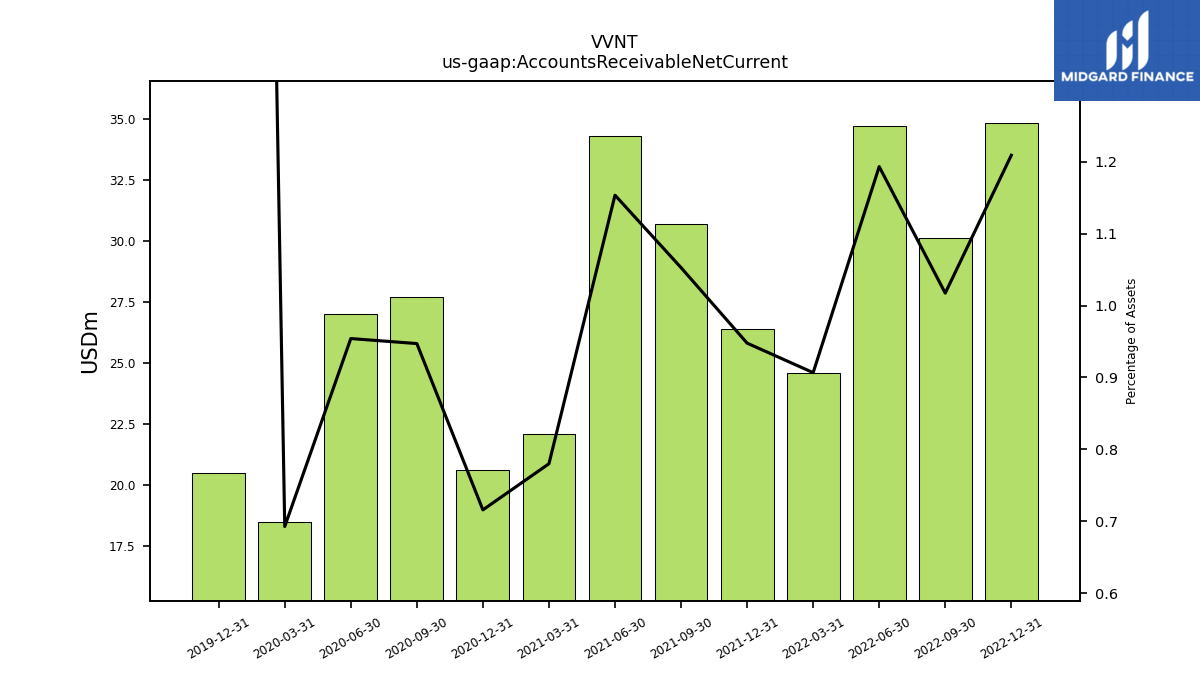
| Accounts Receivable Net Current | 34.80 | 30.10 | 34.70 | 24.60 | 26.40 | 30.70 | 34.30 | 22.10 | 20.60 | 27.70 | 27.00 | 18.50 | 20.50 | NA | NA | NA | |
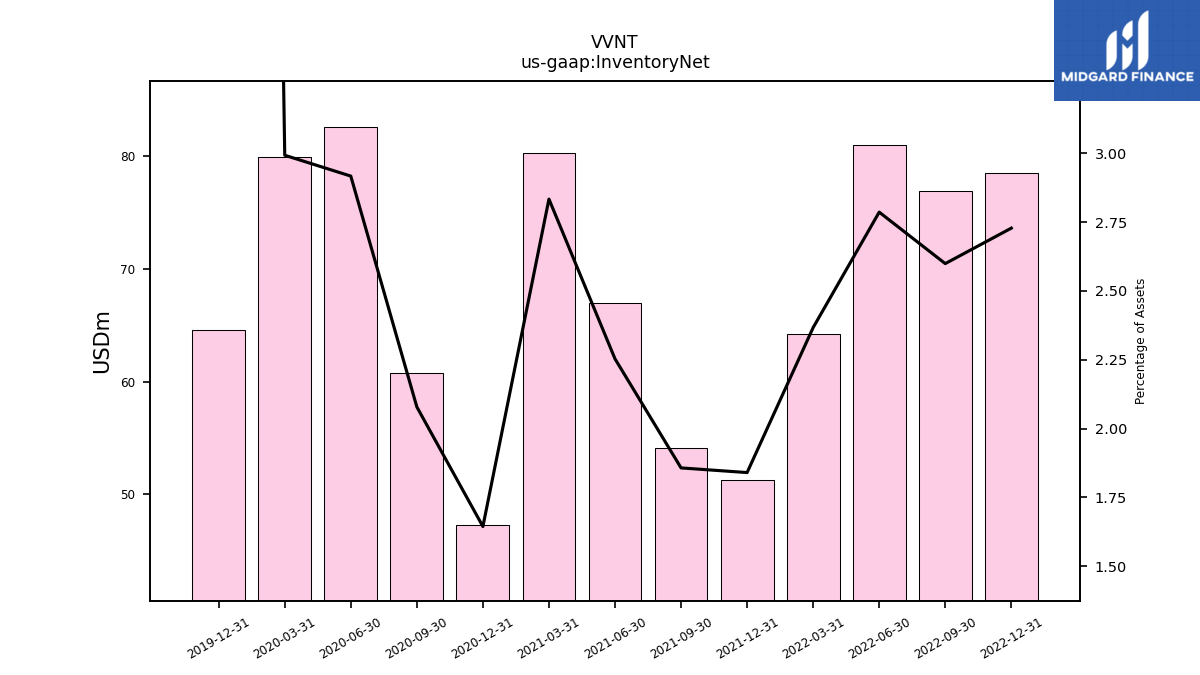
| Inventory Net | 78.54 | 76.92 | 81.05 | 64.22 | 51.25 | 54.15 | 67.01 | 80.30 | 47.30 | 60.79 | 82.57 | 79.94 | 64.62 | NA | NA | NA | |
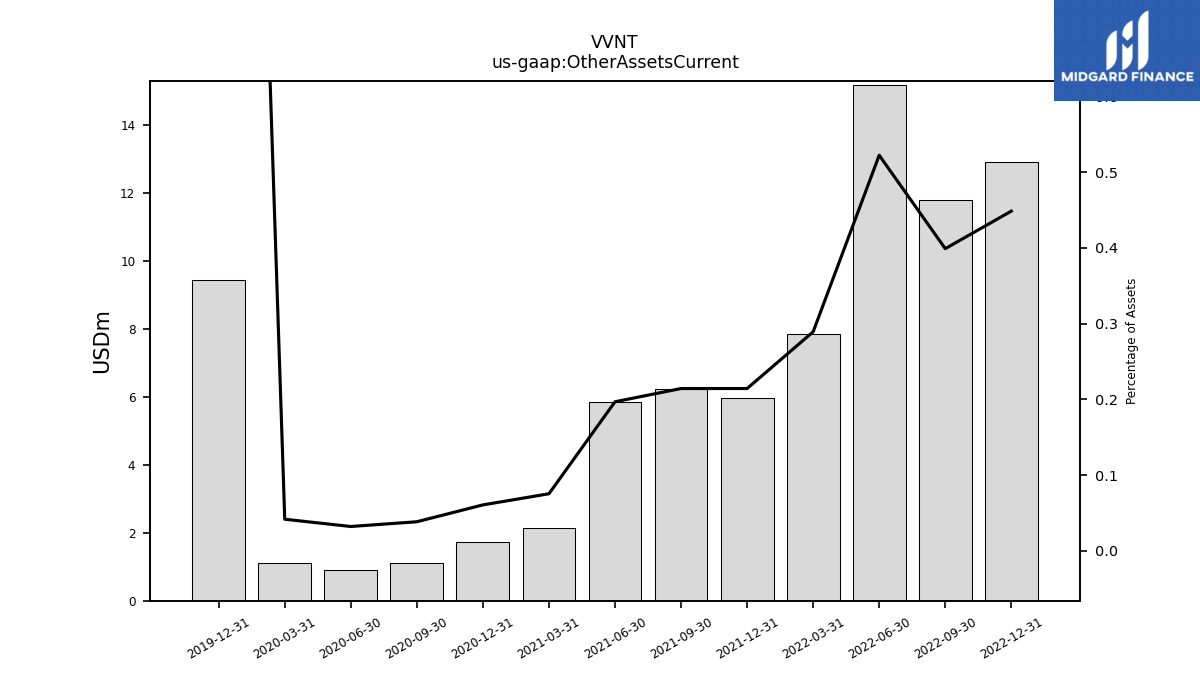
| Other Assets Current | 12.91 | 11.80 | 15.19 | 7.84 | 5.97 | 6.25 | 5.85 | 2.13 | 1.74 | 1.12 | 0.91 | 1.11 | 9.44 | NA | NA | NA | |
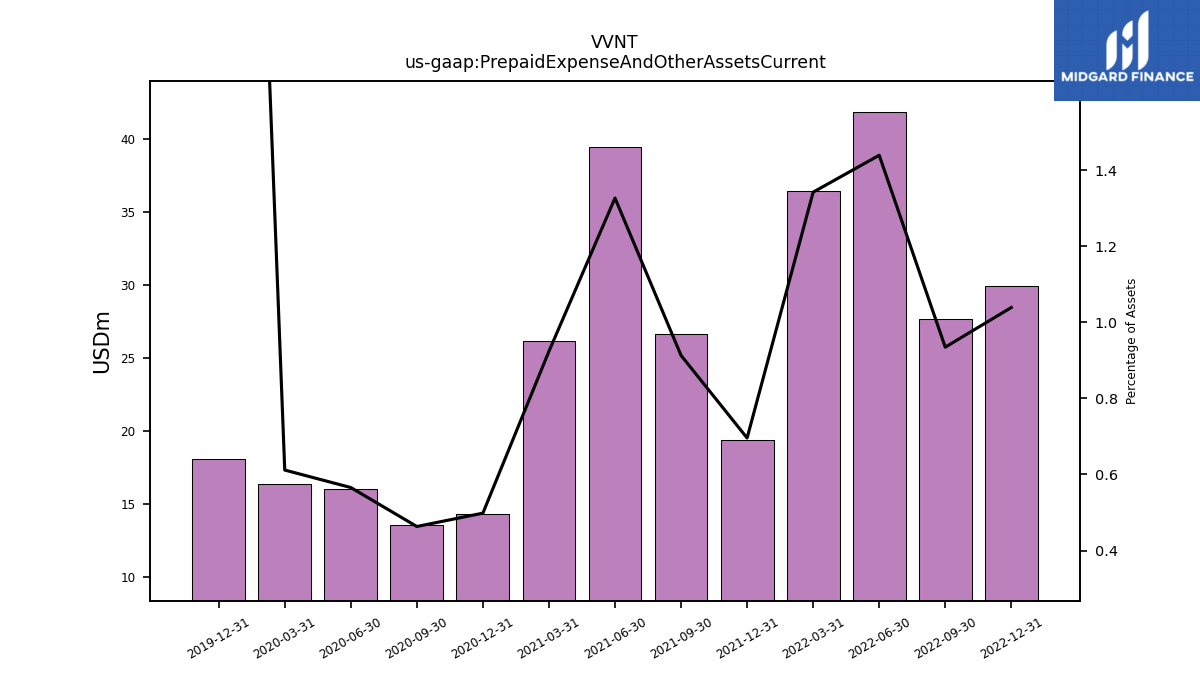
| Prepaid Expense And Other Assets Current | 29.91 | 27.66 | 41.86 | 36.42 | 19.39 | 26.62 | 39.45 | 26.18 | 14.34 | 13.55 | 16.01 | 16.33 | 18.06 | NA | NA | NA | |
| Available For Sale Securities Debt Securities | 1.70 | NA | NA | NA | 2.40 | NA | 345.18 | 274.34 | 313.80 | 295.68 | 248.95 | 131.09 | 4.54 | NA | NA | NA |
| 2022-12-31 | 2022-09-30 | 2022-06-30 | 2022-03-31 | 2021-12-31 | 2021-09-30 | 2021-06-30 | 2021-03-31 | 2020-12-31 | 2020-09-30 | 2020-06-30 | 2020-03-31 | 2019-12-31 | 2019-09-30 | 2019-06-30 | 2019-03-31 | ||
|---|---|---|---|---|---|---|---|---|---|---|---|---|---|---|---|---|---|
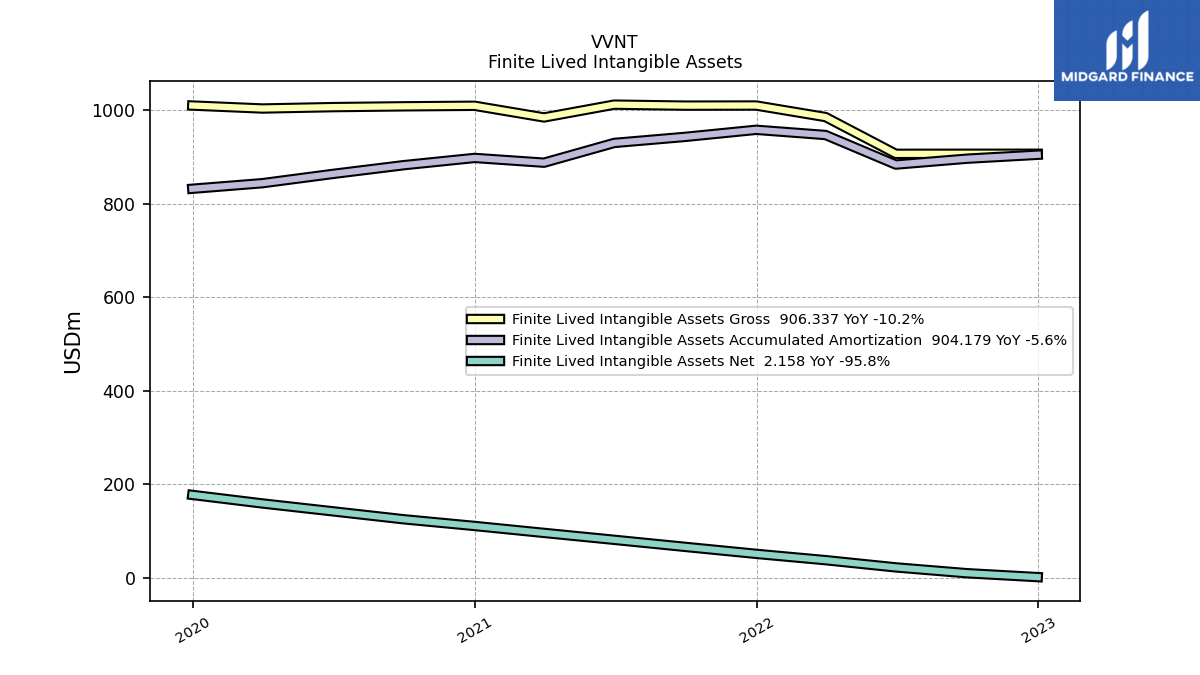
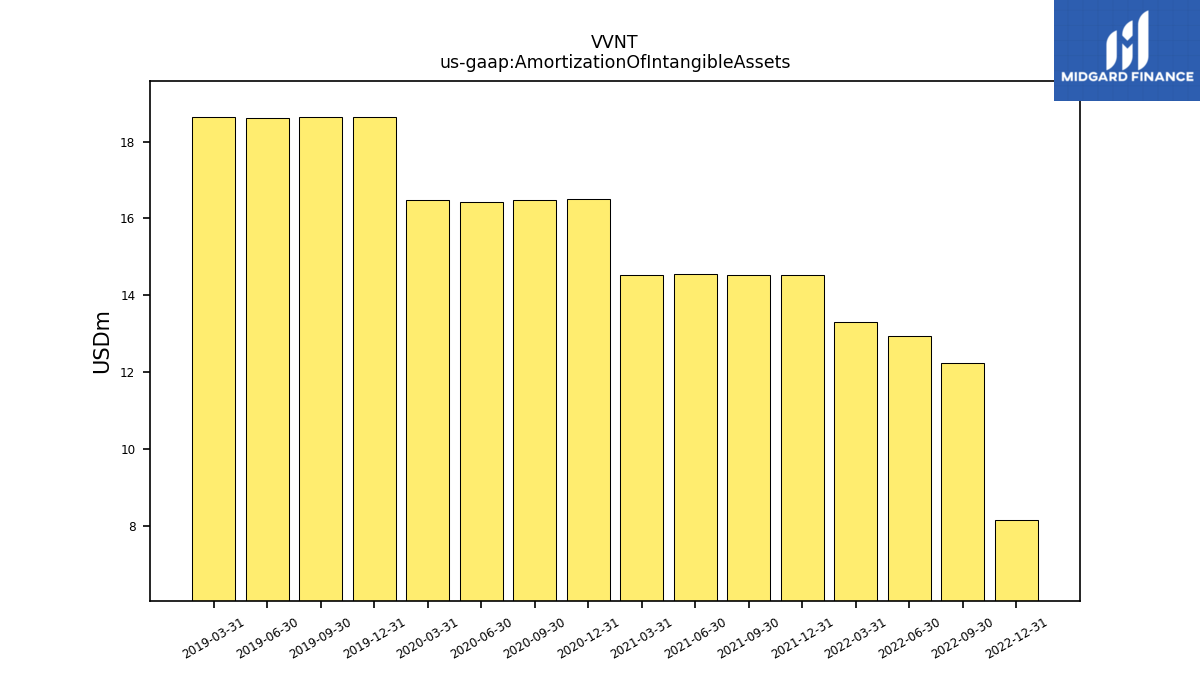
| Amortization Of Intangible Assets | 8.16 | 12.24 | 12.94 | 13.30 | 14.53 | 14.53 | 14.56 | 14.52 | 16.51 | 16.48 | 16.43 | 16.48 | 18.64 | 18.64 | 18.62 | 18.63 | |
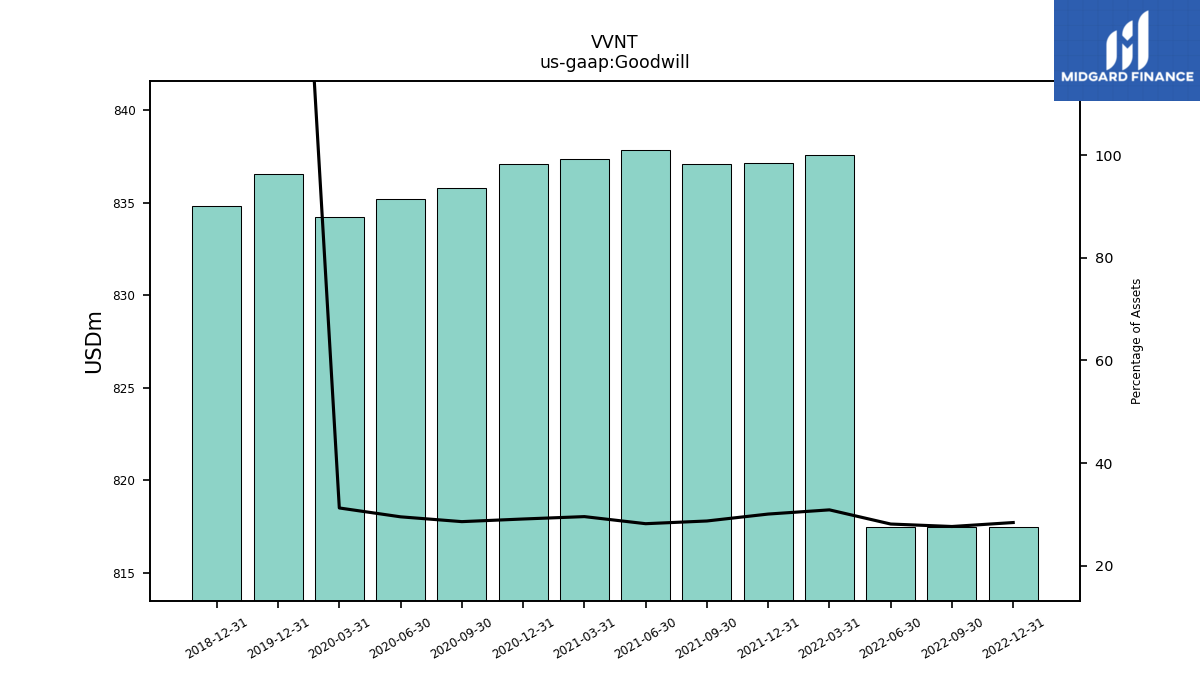
| Goodwill | 817.50 | 817.50 | 817.50 | 837.58 | 837.15 | 837.09 | 837.85 | 837.39 | 837.08 | 835.79 | 835.23 | 834.24 | 836.54 | NA | NA | NA | |
| Indefinite Lived Intangible Assets Excluding Goodwill | 0.07 | NA | NA | NA | 0.07 | NA | 0.07 | NA | 0.07 | NA | 0.06 | 0.06 | 0.06 | NA | NA | NA | |
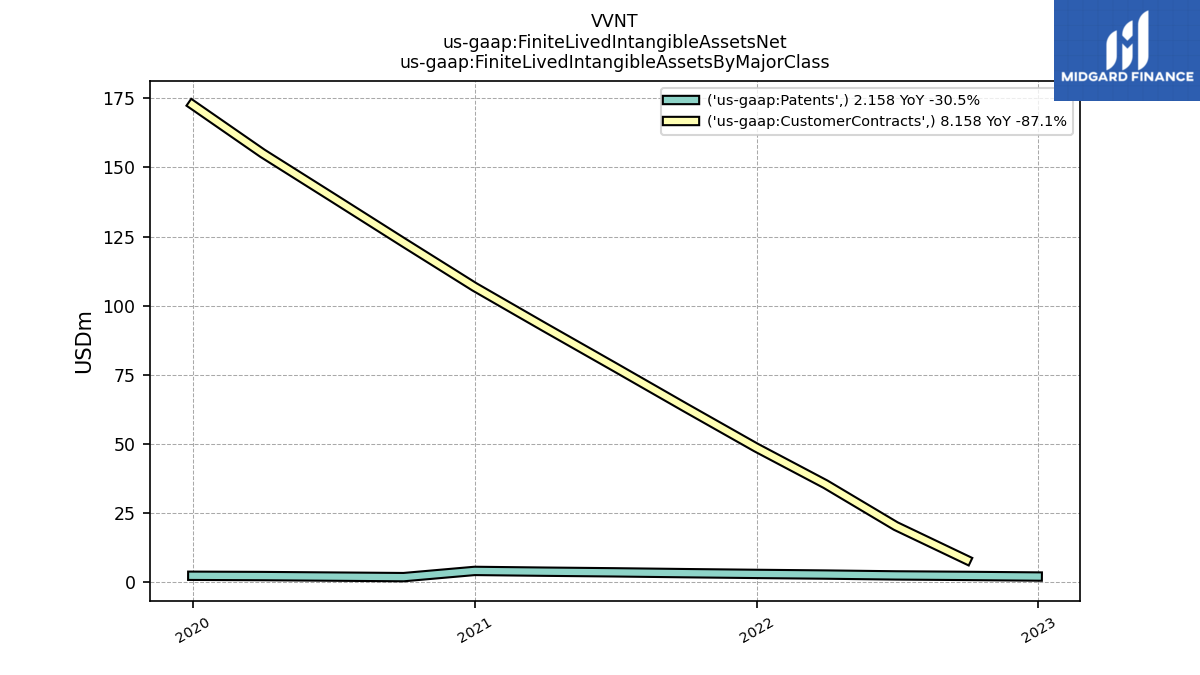
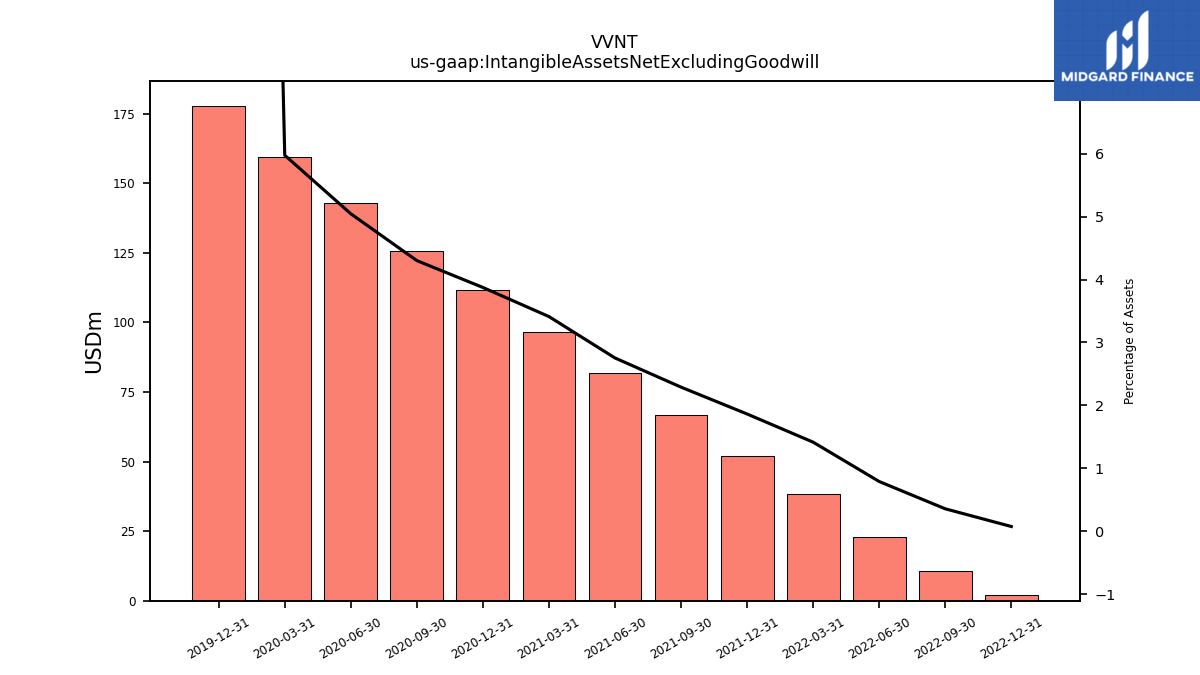
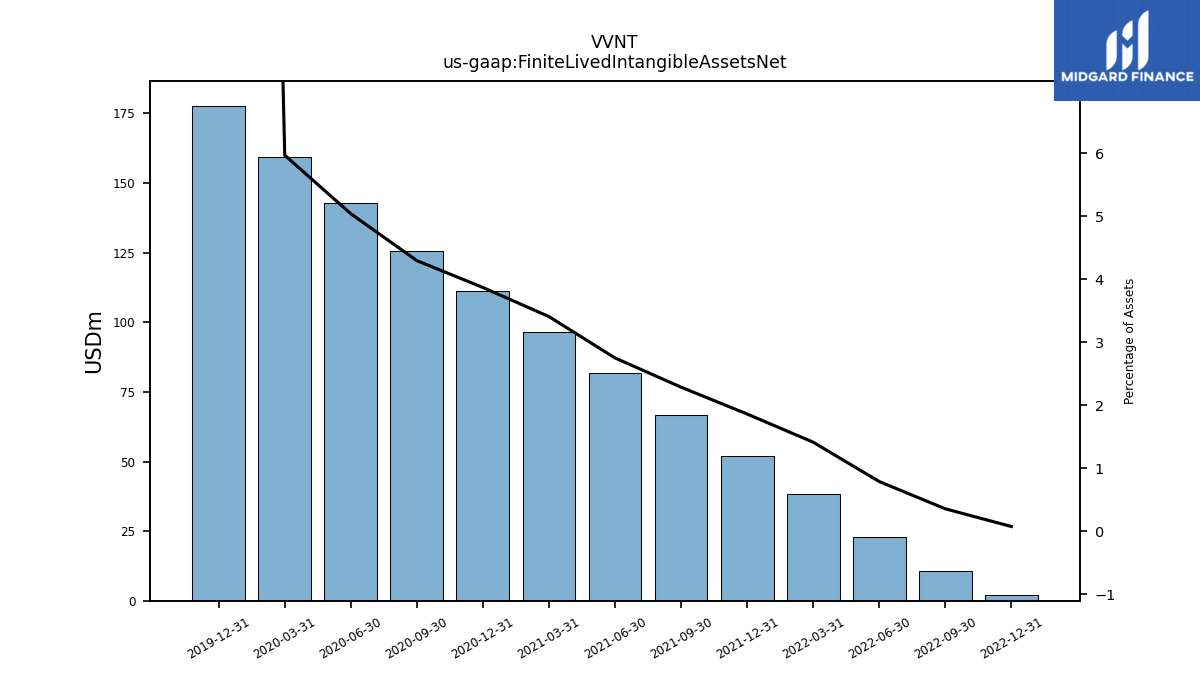
| Intangible Assets Net Excluding Goodwill | 2.22 | 10.60 | 23.02 | 38.44 | 51.93 | 66.81 | 81.90 | 96.67 | 111.47 | 125.78 | 142.77 | 159.54 | 177.81 | NA | NA | NA | |
| Finite Lived Intangible Assets Net | 2.16 | 10.54 | 22.96 | 38.37 | 51.86 | 66.74 | 81.84 | 96.60 | 111.41 | 125.72 | 142.71 | 159.48 | 177.75 | NA | NA | NA | |
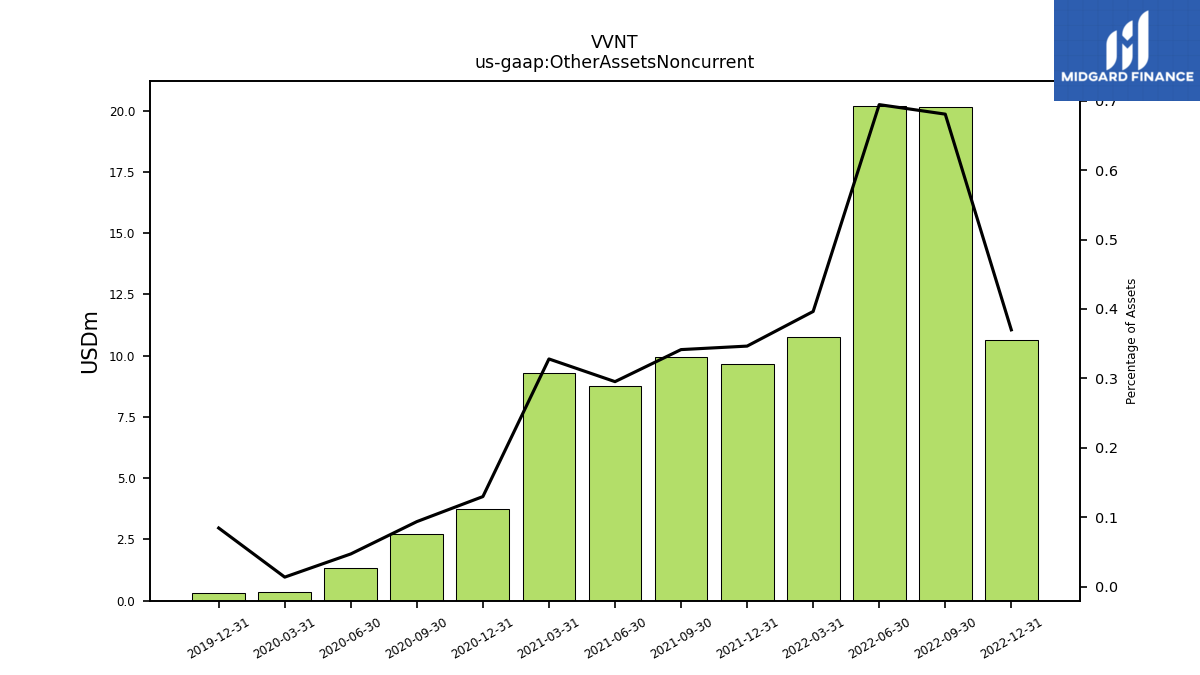
| Other Assets Noncurrent | 10.65 | 20.14 | 20.20 | 10.75 | 9.65 | 9.96 | 8.78 | 9.29 | 3.73 | 2.73 | 1.33 | 0.36 | 0.30 | NA | NA | NA |
| 2022-12-31 | 2022-09-30 | 2022-06-30 | 2022-03-31 | 2021-12-31 | 2021-09-30 | 2021-06-30 | 2021-03-31 | 2020-12-31 | 2020-09-30 | 2020-06-30 | 2020-03-31 | 2019-12-31 | 2019-09-30 | 2019-06-30 | 2019-03-31 | ||
|---|---|---|---|---|---|---|---|---|---|---|---|---|---|---|---|---|---|
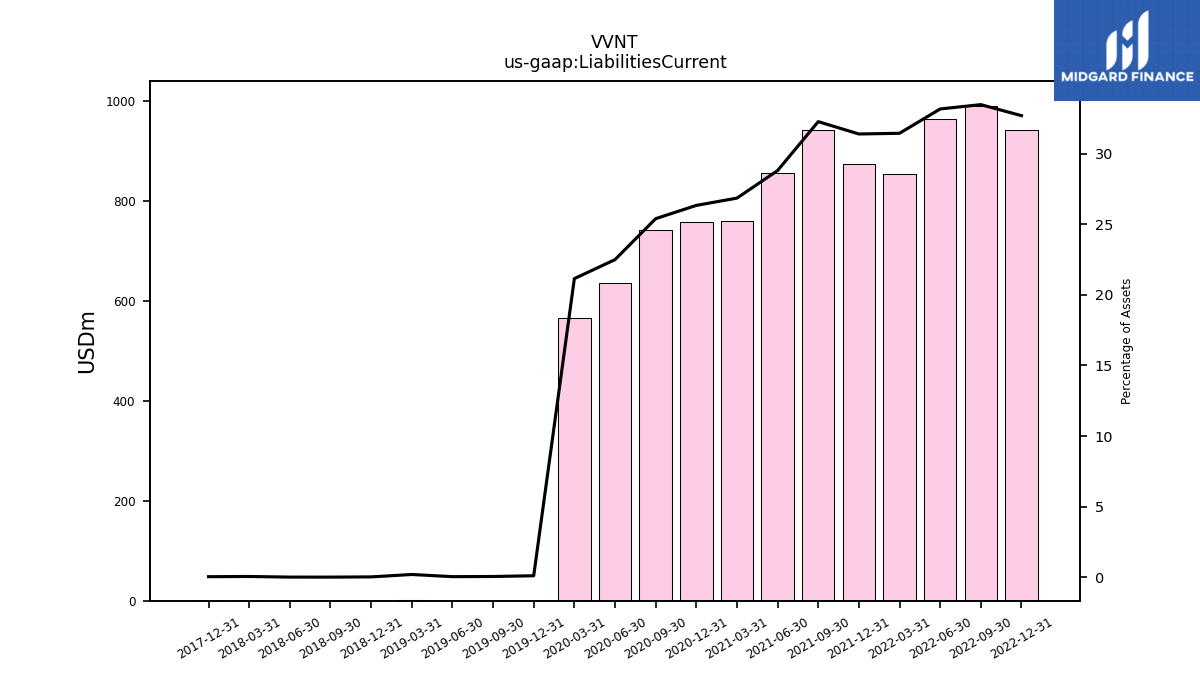
| Liabilities Current | 940.70 | 990.12 | 964.25 | 852.80 | 874.20 | 940.75 | 856.26 | 760.51 | 757.55 | 742.48 | 636.38 | 564.63 | 0.38 | 0.20 | 0.16 | 0.69 | |
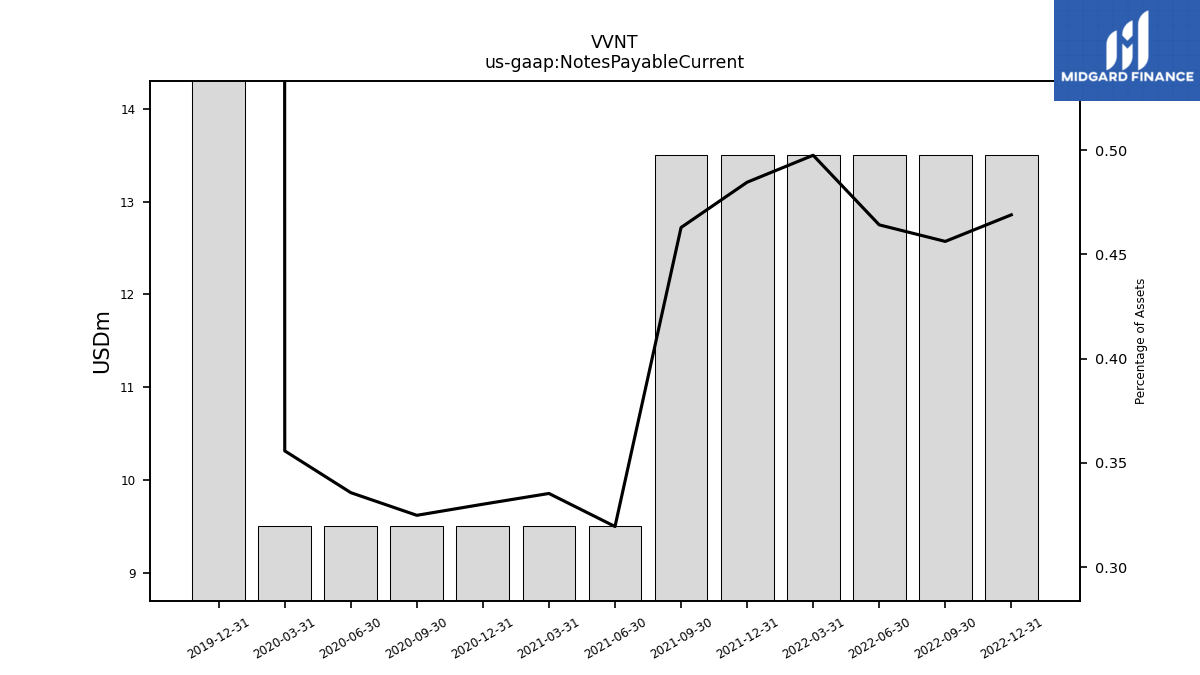
| Notes Payable Current | 13.50 | 13.50 | 13.50 | 13.50 | 13.50 | 13.50 | 9.50 | 9.50 | 9.50 | 9.50 | 9.50 | 9.50 | 461.42 | NA | NA | NA | |
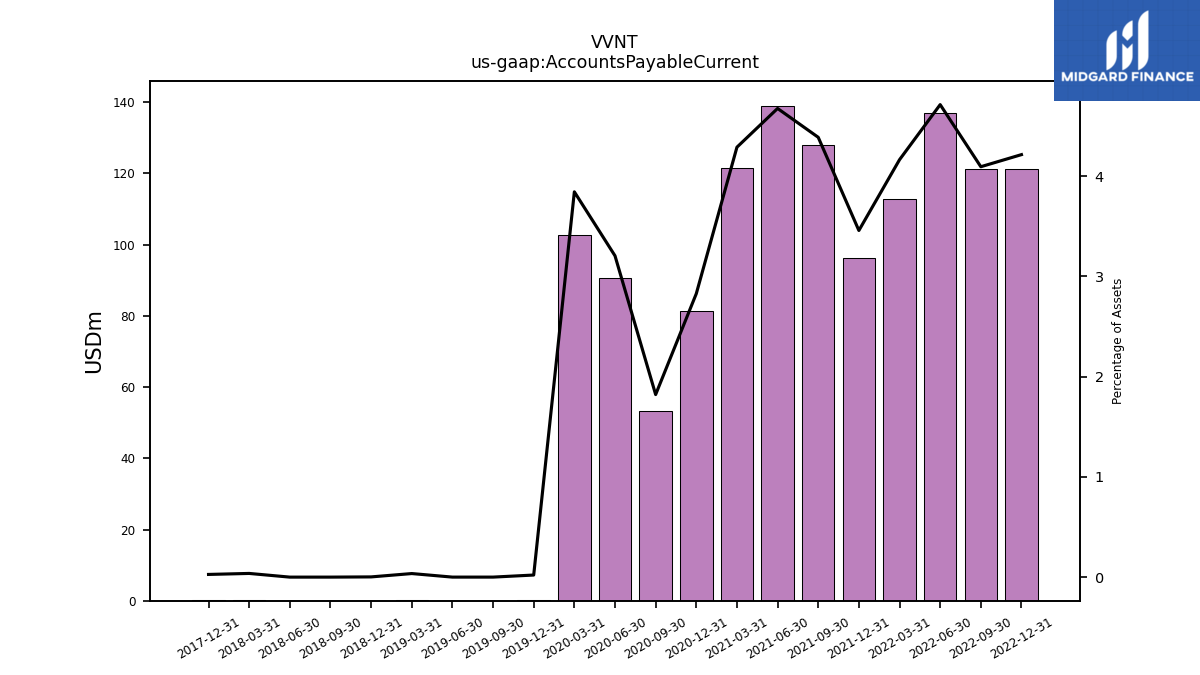
| Accounts Payable Current | 121.31 | 121.13 | 137.07 | 112.97 | 96.32 | 127.94 | 139.02 | 121.50 | 81.36 | 53.27 | 90.71 | 102.63 | 0.08 | 0.00 | 0.00 | 0.13 | |
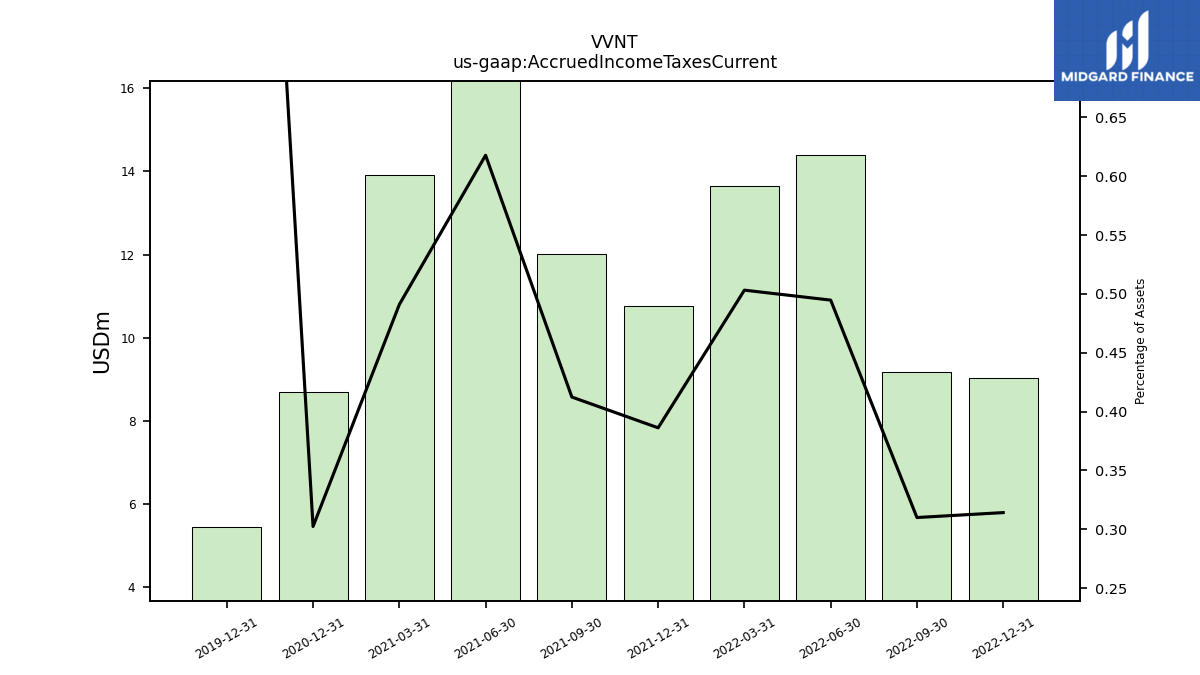
| Accrued Income Taxes Current | 9.04 | 9.17 | 14.39 | 13.65 | 10.76 | 12.03 | 18.37 | 13.91 | 8.70 | NA | NA | NA | 5.46 | NA | NA | NA | |
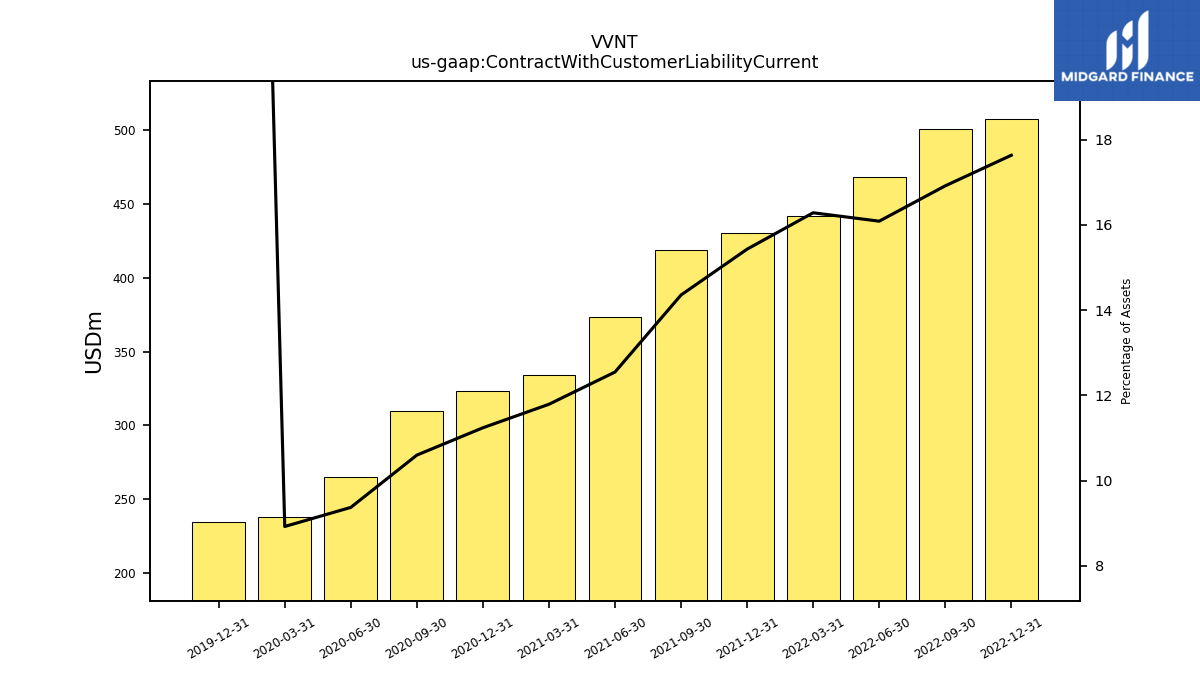
| Contract With Customer Liability Current | 507.66 | 500.61 | 467.93 | 441.87 | 429.90 | 418.72 | 373.21 | 334.15 | 323.49 | 310.04 | 265.28 | 238.36 | 234.61 | NA | NA | NA |
| 2022-12-31 | 2022-09-30 | 2022-06-30 | 2022-03-31 | 2021-12-31 | 2021-09-30 | 2021-06-30 | 2021-03-31 | 2020-12-31 | 2020-09-30 | 2020-06-30 | 2020-03-31 | 2019-12-31 | 2019-09-30 | 2019-06-30 | 2019-03-31 | ||
|---|---|---|---|---|---|---|---|---|---|---|---|---|---|---|---|---|---|
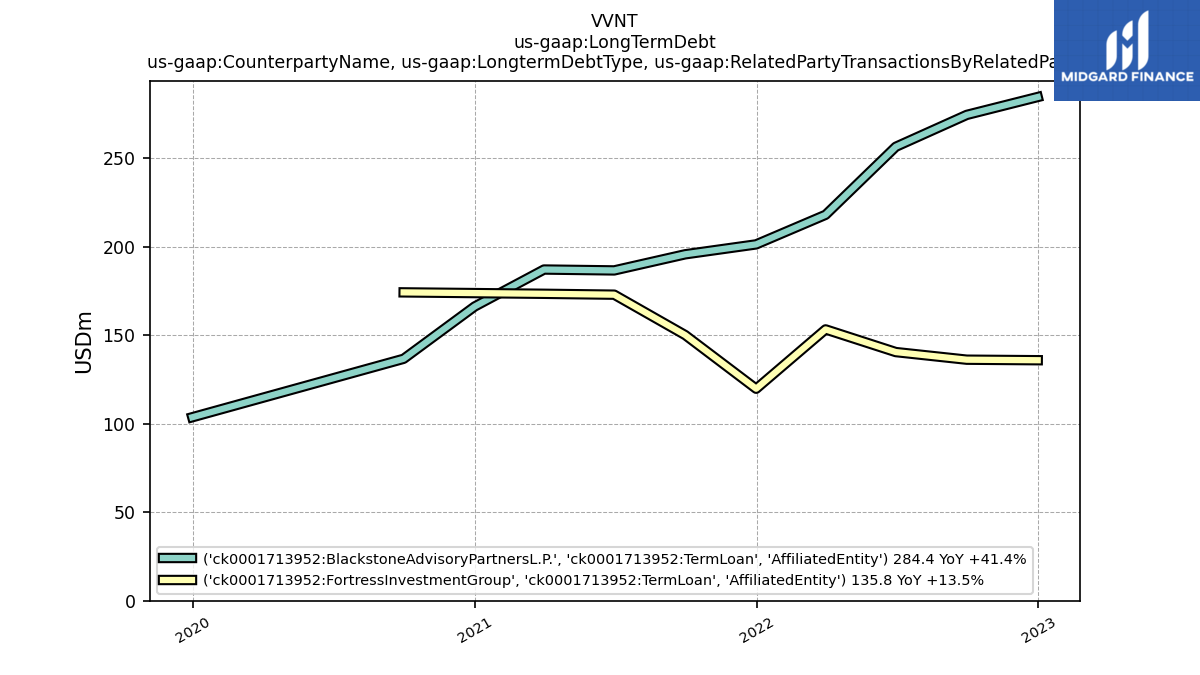
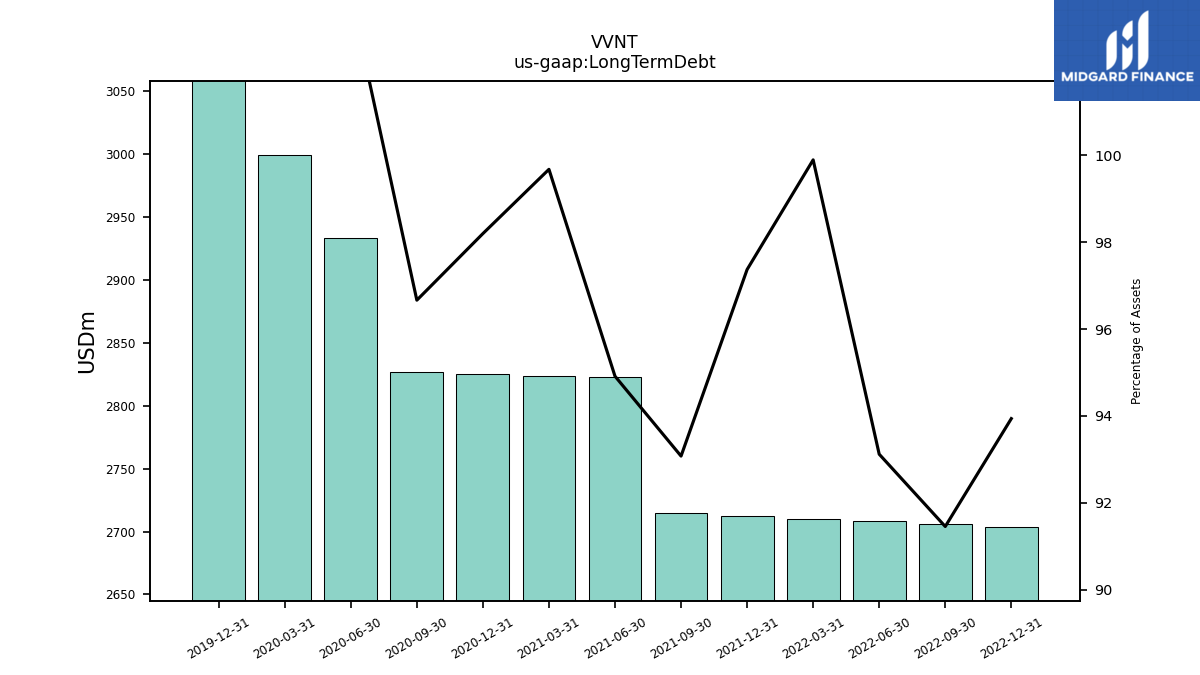
| Long Term Debt | 2704.03 | 2706.11 | 2708.19 | 2710.27 | 2712.34 | 2714.42 | 2822.54 | 2824.07 | 2825.60 | 2827.11 | 2933.80 | 2999.26 | 3281.71 | NA | NA | NA | |
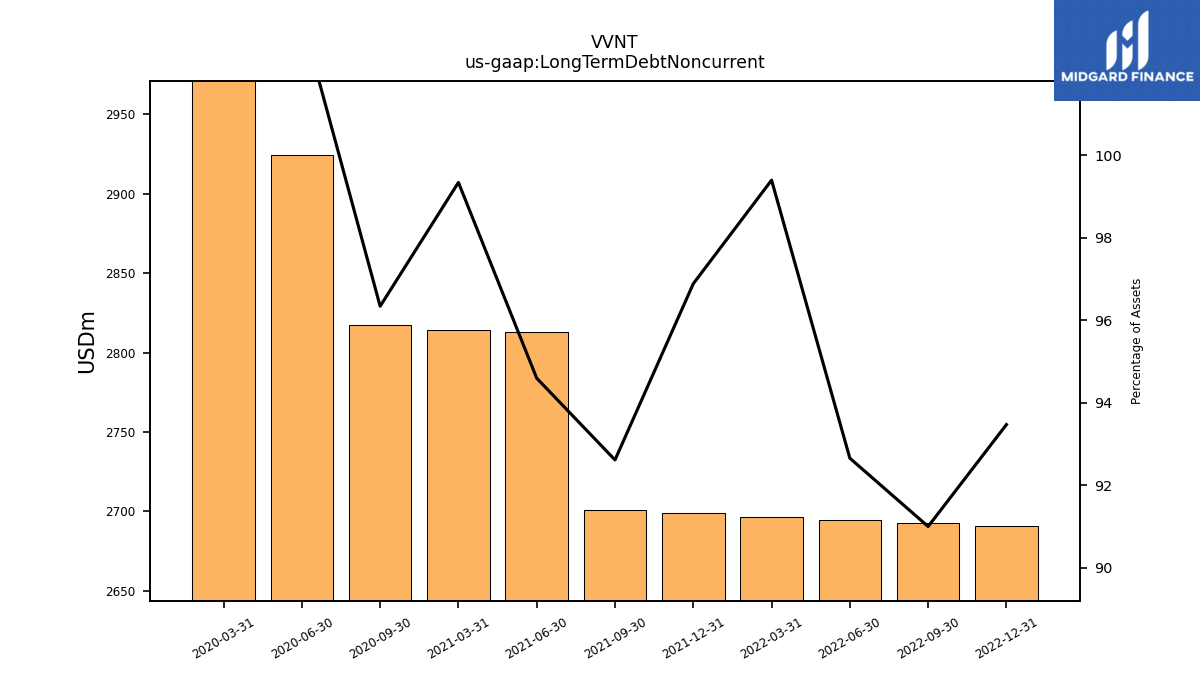
| Long Term Debt Noncurrent | 2690.53 | 2692.61 | 2694.69 | 2696.77 | 2698.84 | 2700.92 | 2813.04 | 2814.57 | NA | 2817.61 | 2924.30 | 2989.76 | NA | NA | NA | NA | |
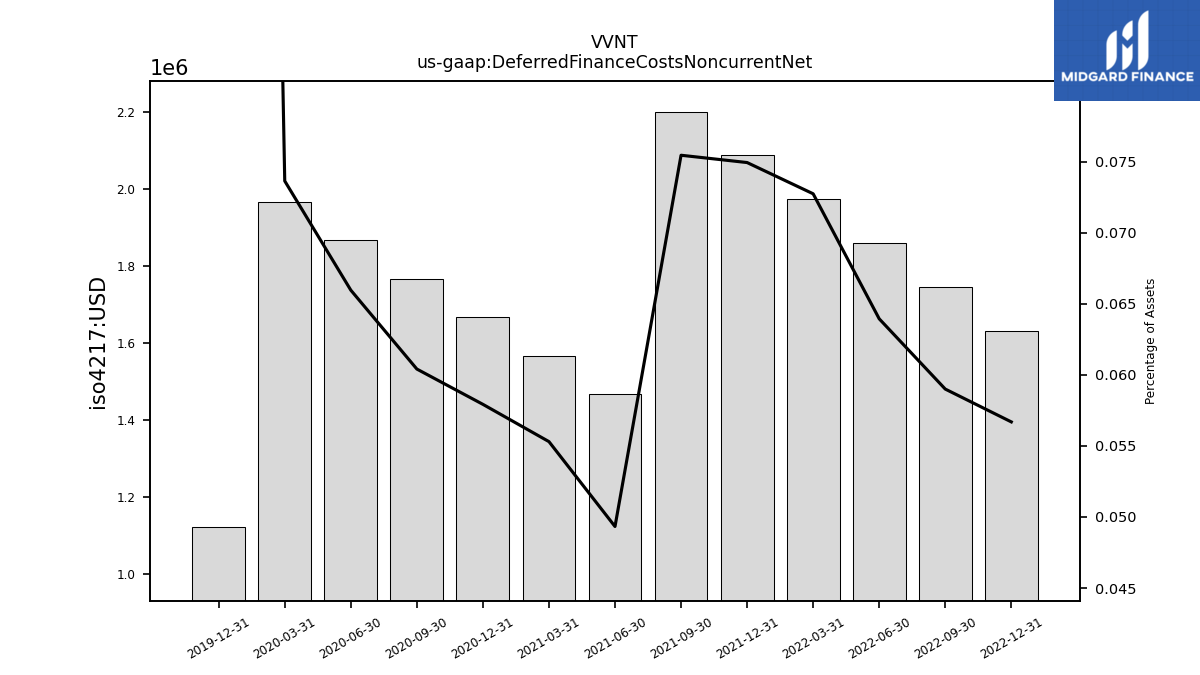
| Deferred Finance Costs Noncurrent Net | 1.63 | 1.75 | 1.86 | 1.97 | 2.09 | 2.20 | 1.47 | 1.57 | 1.67 | 1.77 | 1.87 | 1.97 | 1.12 | NA | NA | NA | |
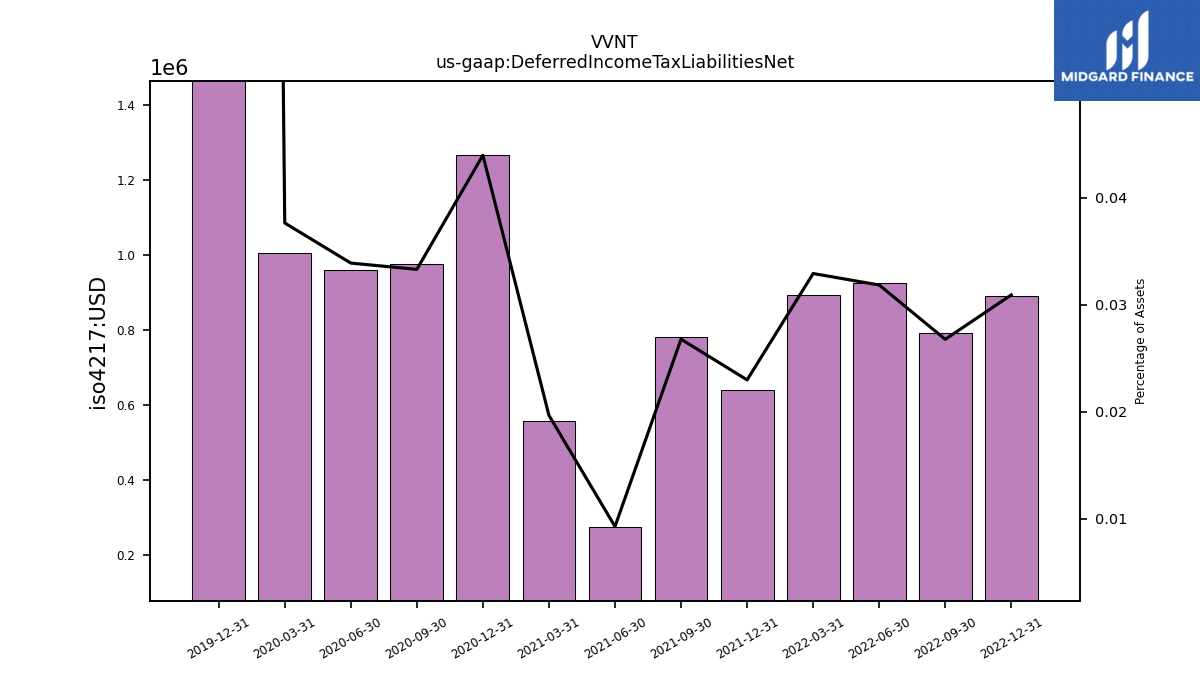
| Deferred Income Tax Liabilities Net | 0.89 | 0.79 | 0.93 | 0.89 | 0.64 | 0.78 | 0.28 | 0.56 | 1.26 | 0.97 | 0.96 | 1.00 | 2.23 | NA | NA | NA | |
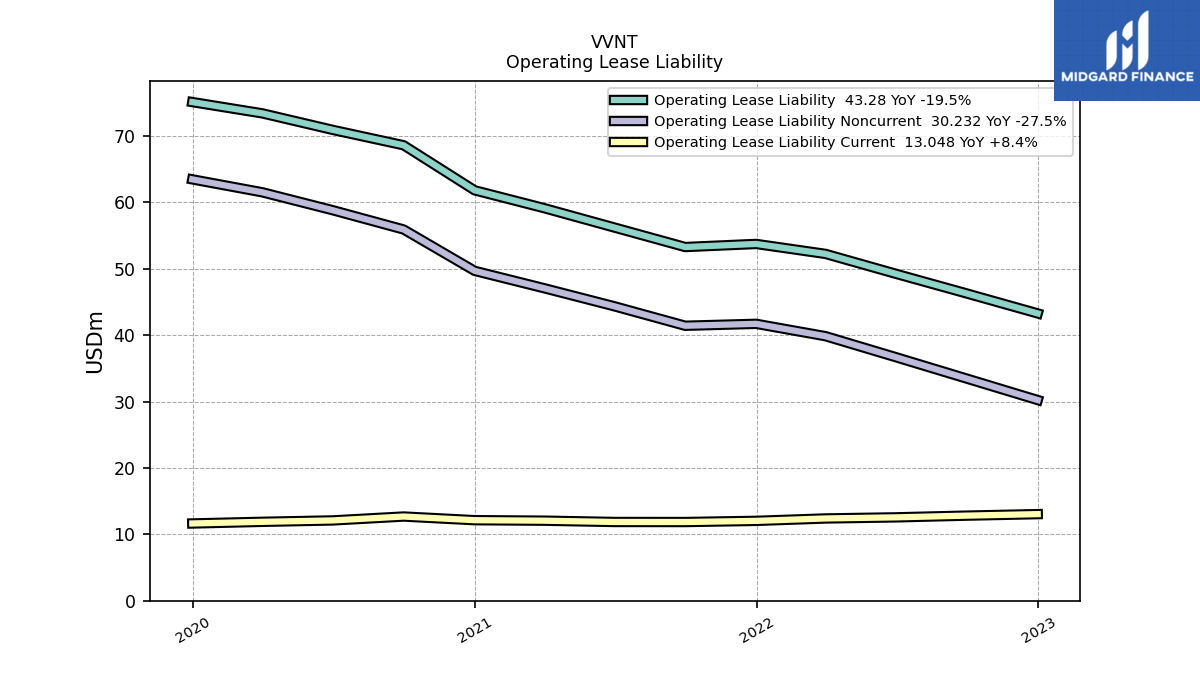
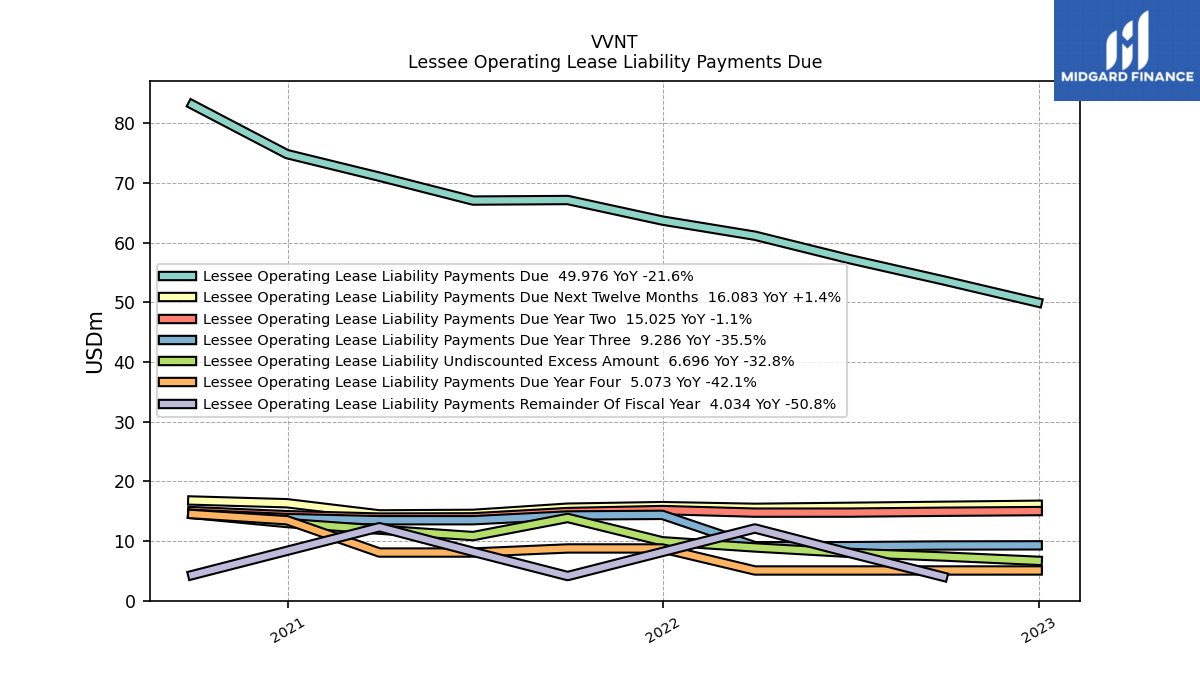
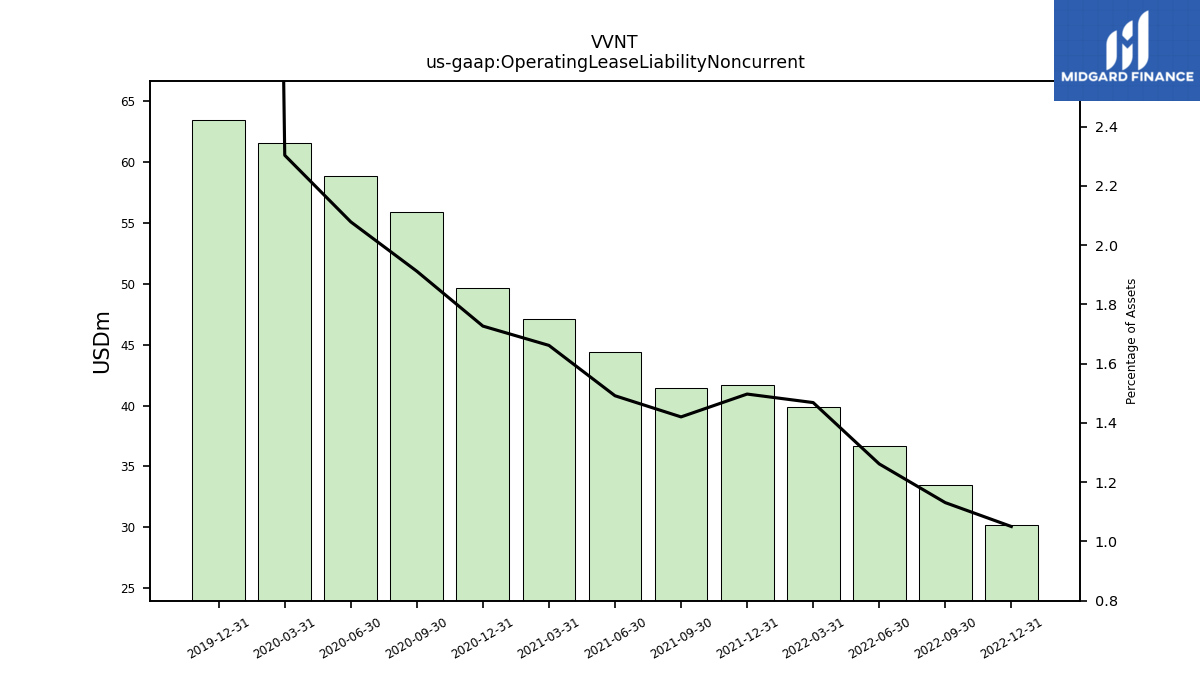
| Operating Lease Liability Noncurrent | 30.23 | 33.46 | 36.69 | 39.85 | 41.71 | 41.42 | 44.36 | 47.08 | 49.69 | 55.92 | 58.83 | 61.52 | 63.48 | NA | NA | NA |
| 2022-12-31 | 2022-09-30 | 2022-06-30 | 2022-03-31 | 2021-12-31 | 2021-09-30 | 2021-06-30 | 2021-03-31 | 2020-12-31 | 2020-09-30 | 2020-06-30 | 2020-03-31 | 2019-12-31 | 2019-09-30 | 2019-06-30 | 2019-03-31 | ||
|---|---|---|---|---|---|---|---|---|---|---|---|---|---|---|---|---|---|
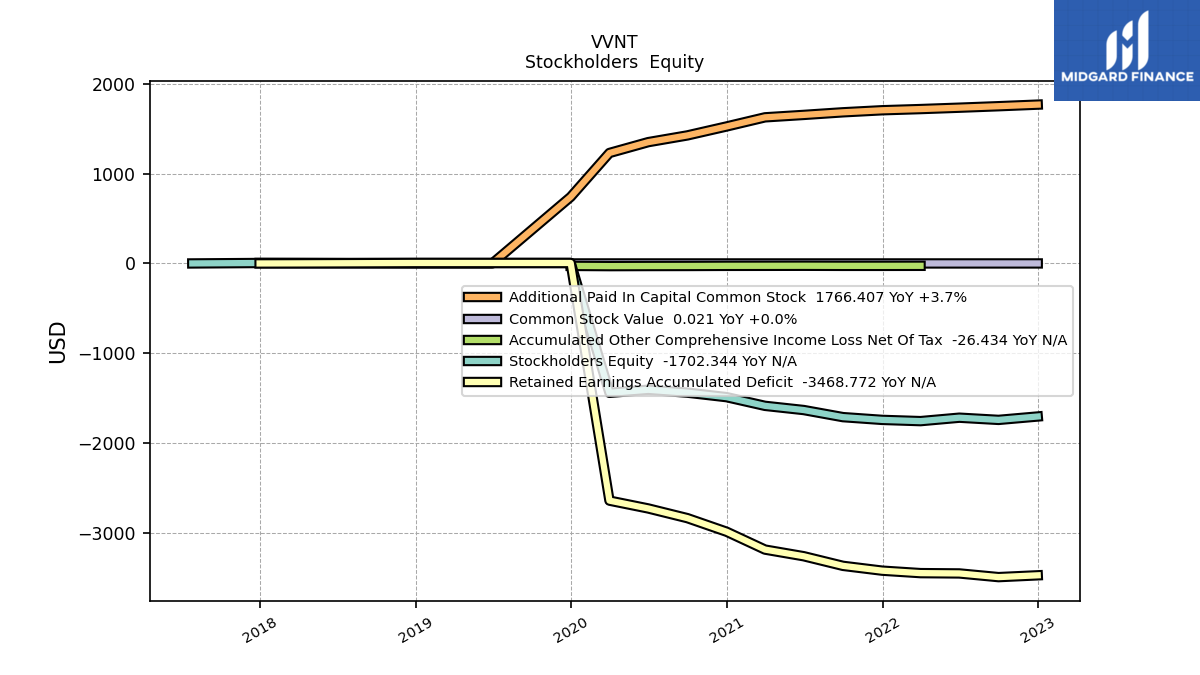
| Stockholders Equity | -1702.34 | -1740.19 | -1715.65 | -1753.89 | -1740.10 | -1709.50 | -1630.61 | -1583.97 | -1487.35 | -1437.27 | -1404.87 | -1439.31 | 5.00 | 5.00 | 5.00 | 5.00 | |
| Common Stock Value | 0.02 | 0.02 | 0.02 | 0.02 | 0.02 | 0.02 | 0.02 | 0.02 | 0.02 | 0.02 | 0.02 | 0.02 | 0.01 | NA | NA | NA | |
| Additional Paid In Capital Common Stock | 1766.41 | 1748.75 | 1732.29 | 1717.00 | 1703.82 | 1681.00 | 1651.95 | 1625.03 | 1523.70 | 1424.11 | 1349.16 | 1228.71 | 740.12 | NA | 0.00 | 0.00 | |
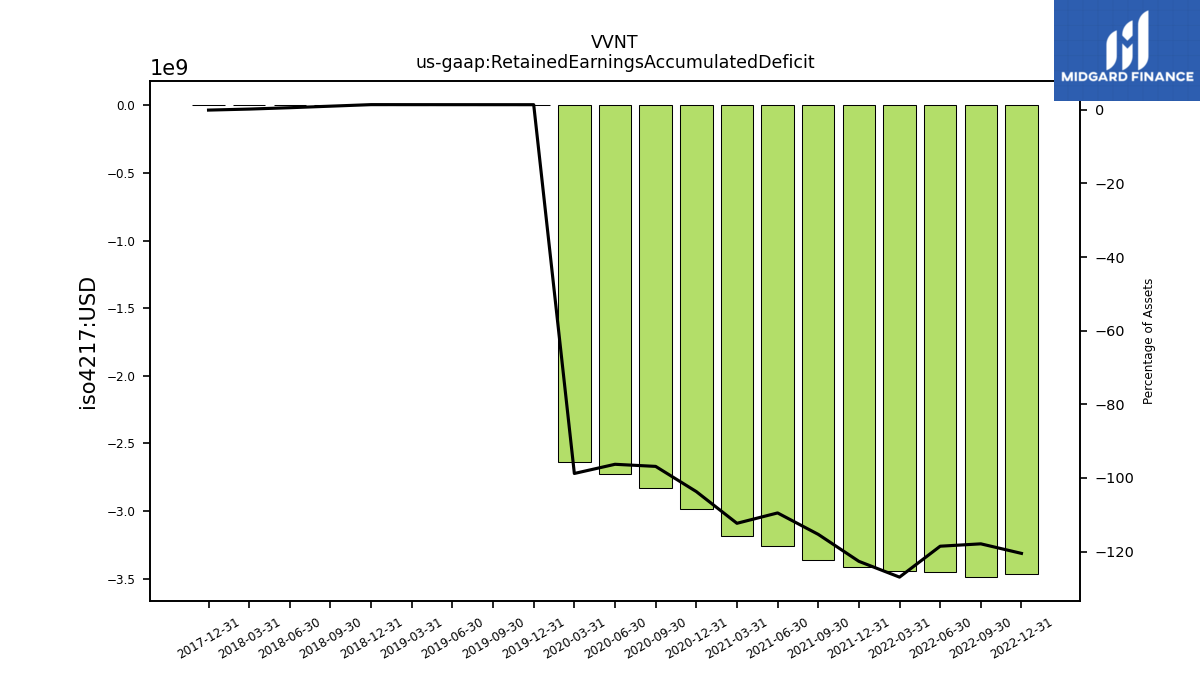
| Retained Earnings Accumulated Deficit | -3468.77 | -3488.96 | -3447.95 | -3444.47 | -3417.04 | -3363.57 | -3256.70 | -3182.60 | -2984.26 | -2833.11 | -2725.17 | -2638.15 | 5.00 | 5.00 | 5.00 | 5.00 | |
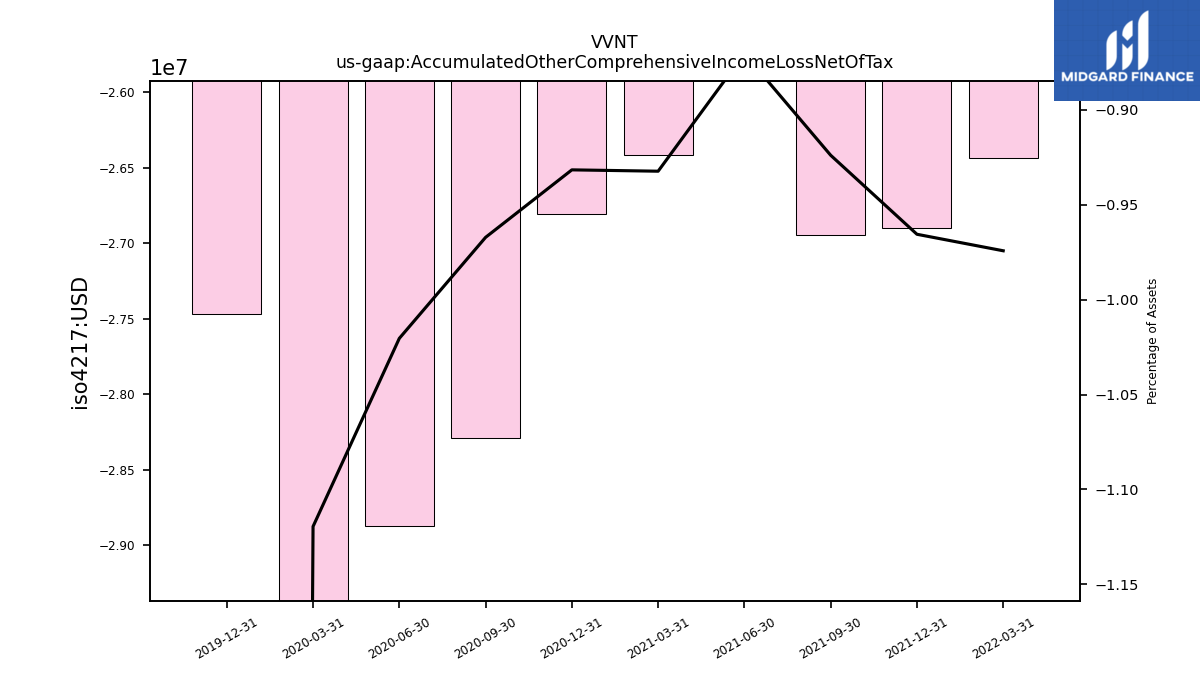
| Accumulated Other Comprehensive Income Loss Net Of Tax | NA | NA | NA | -26.43 | -26.90 | -26.95 | -25.89 | -26.42 | -26.81 | -28.29 | -28.88 | -29.89 | -27.47 | NA | NA | NA | |
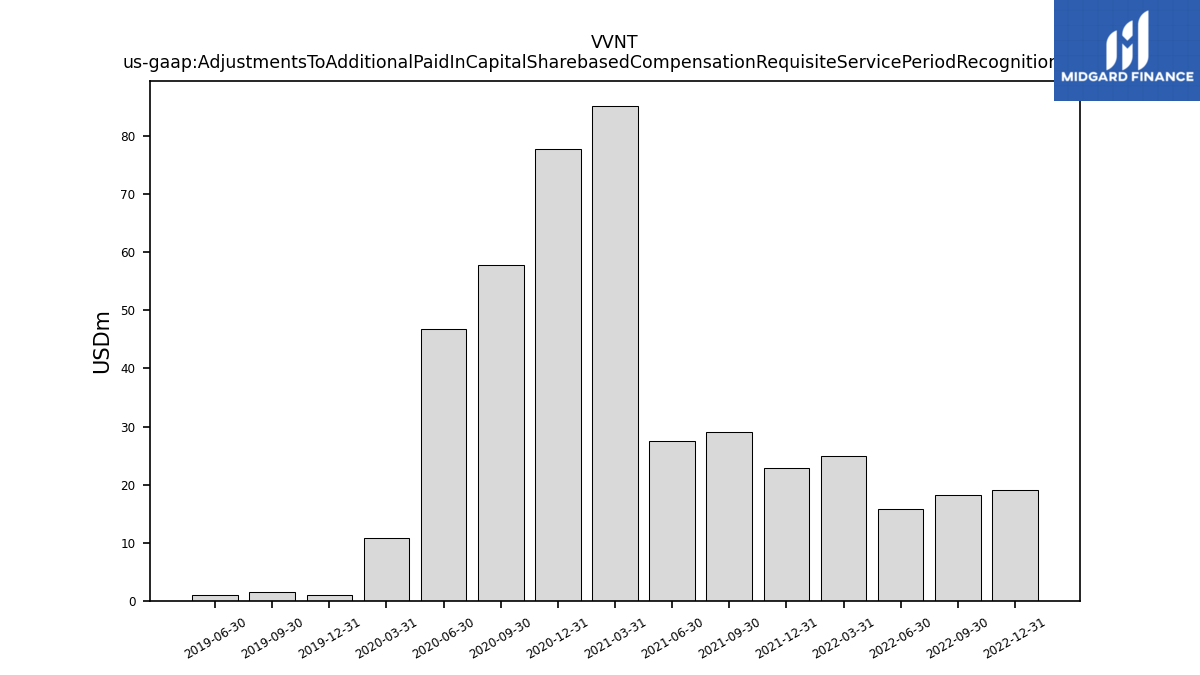
| Adjustments To Additional Paid In Capital Sharebased Compensation Requisite Service Period Recognition Value | 19.09 | 18.23 | 15.75 | 24.88 | 22.84 | 29.05 | 27.56 | 85.23 | 77.85 | 57.85 | 46.75 | 10.79 | 0.95 | 1.46 | 0.98 | NA |
| 2022-12-31 | 2022-09-30 | 2022-06-30 | 2022-03-31 | 2021-12-31 | 2021-09-30 | 2021-06-30 | 2021-03-31 | 2020-12-31 | 2020-09-30 | 2020-06-30 | 2020-03-31 | 2019-12-31 | 2019-09-30 | 2019-06-30 | 2019-03-31 | ||
|---|---|---|---|---|---|---|---|---|---|---|---|---|---|---|---|---|---|
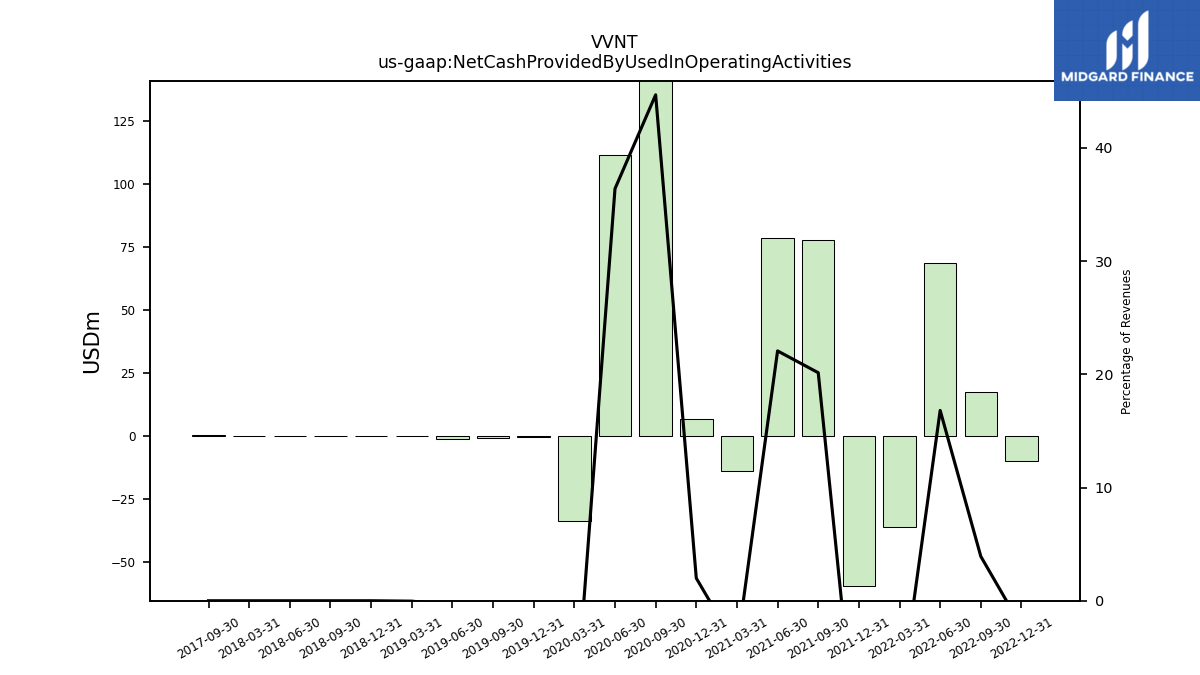
| Net Cash Provided By Used In Operating Activities | -10.15 | 17.20 | 68.47 | -36.09 | -59.68 | 77.89 | 78.39 | -14.16 | 6.62 | 142.54 | 111.38 | -33.88 | -0.52 | -1.04 | -1.15 | -0.10 | |
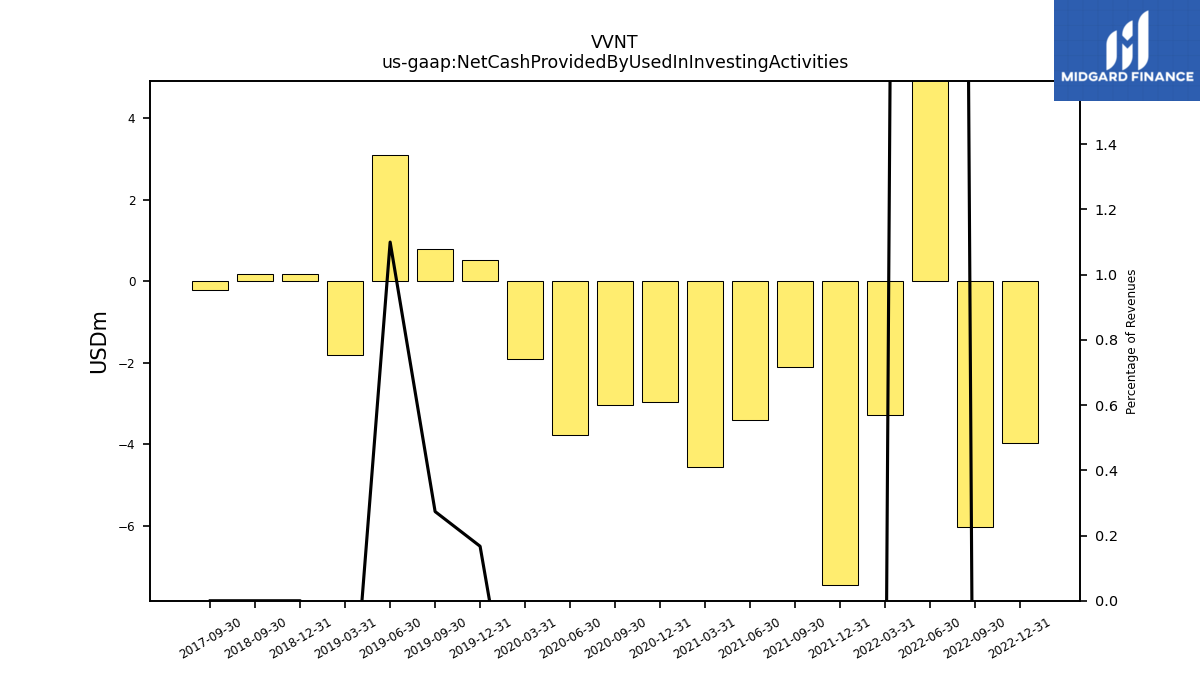
| Net Cash Provided By Used In Investing Activities | -3.97 | -6.02 | 81.97 | -3.28 | -7.44 | -2.09 | -3.40 | -4.55 | -2.96 | -3.04 | -3.77 | -1.90 | 0.51 | 0.80 | 3.09 | -1.81 | |
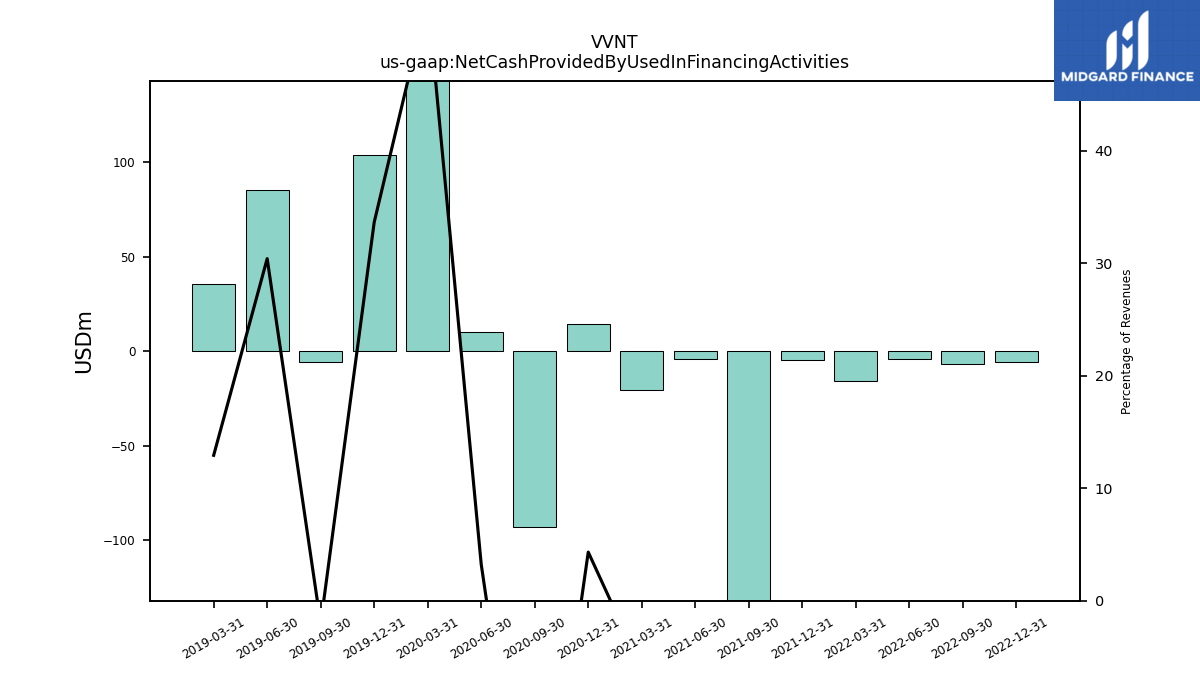
| Net Cash Provided By Used In Financing Activities | -5.76 | -6.71 | -4.08 | -15.99 | -4.50 | -140.69 | -4.26 | -20.76 | 14.38 | -92.85 | 9.90 | 162.67 | 103.62 | -5.91 | 85.49 | 35.72 |
| 2022-12-31 | 2022-09-30 | 2022-06-30 | 2022-03-31 | 2021-12-31 | 2021-09-30 | 2021-06-30 | 2021-03-31 | 2020-12-31 | 2020-09-30 | 2020-06-30 | 2020-03-31 | 2019-12-31 | 2019-09-30 | 2019-06-30 | 2019-03-31 | ||
|---|---|---|---|---|---|---|---|---|---|---|---|---|---|---|---|---|---|
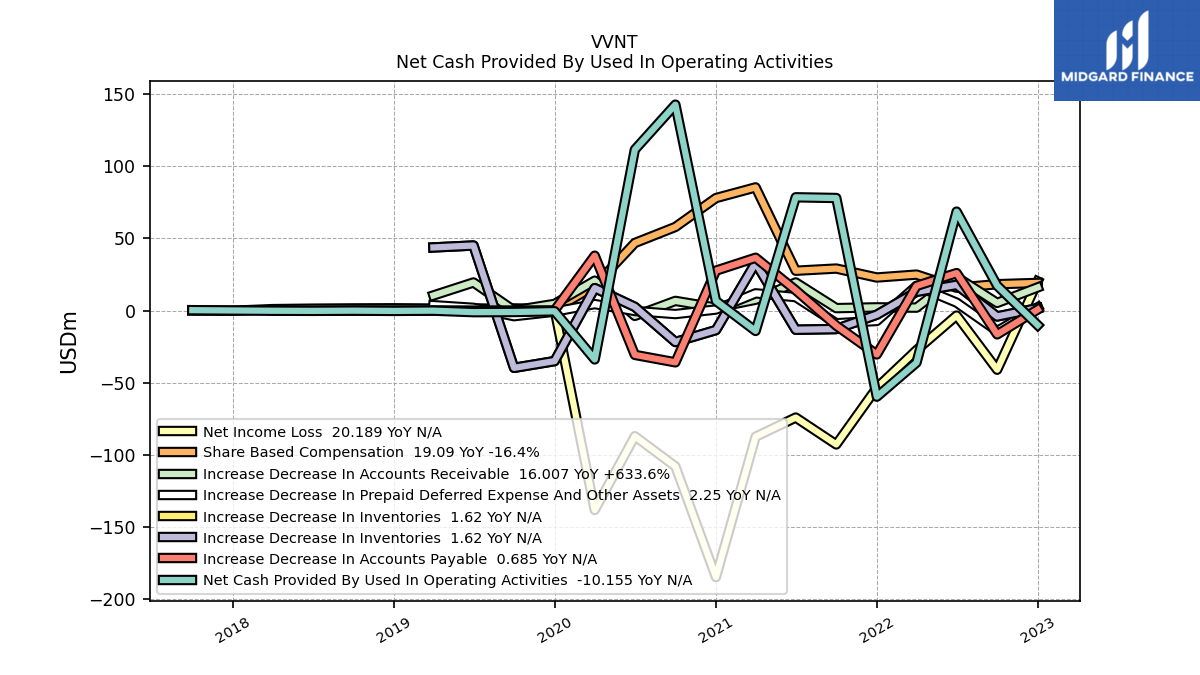
| Net Cash Provided By Used In Operating Activities | -10.15 | 17.20 | 68.47 | -36.09 | -59.68 | 77.89 | 78.39 | -14.16 | 6.62 | 142.54 | 111.38 | -33.88 | -0.52 | -1.04 | -1.15 | -0.10 | |
| Net Income Loss | 20.19 | -41.01 | -3.49 | -27.43 | -53.46 | -92.74 | -74.10 | -87.38 | -184.59 | -107.94 | -87.03 | -138.12 | 0.63 | 0.71 | 1.48 | 1.38 | |
| Profit Loss | 20.19 | -41.01 | -3.49 | -27.43 | -53.46 | -92.74 | -74.10 | -87.38 | -151.15 | -107.94 | -87.03 | -145.10 | 0.63 | -102.41 | -115.90 | 1.38 | |
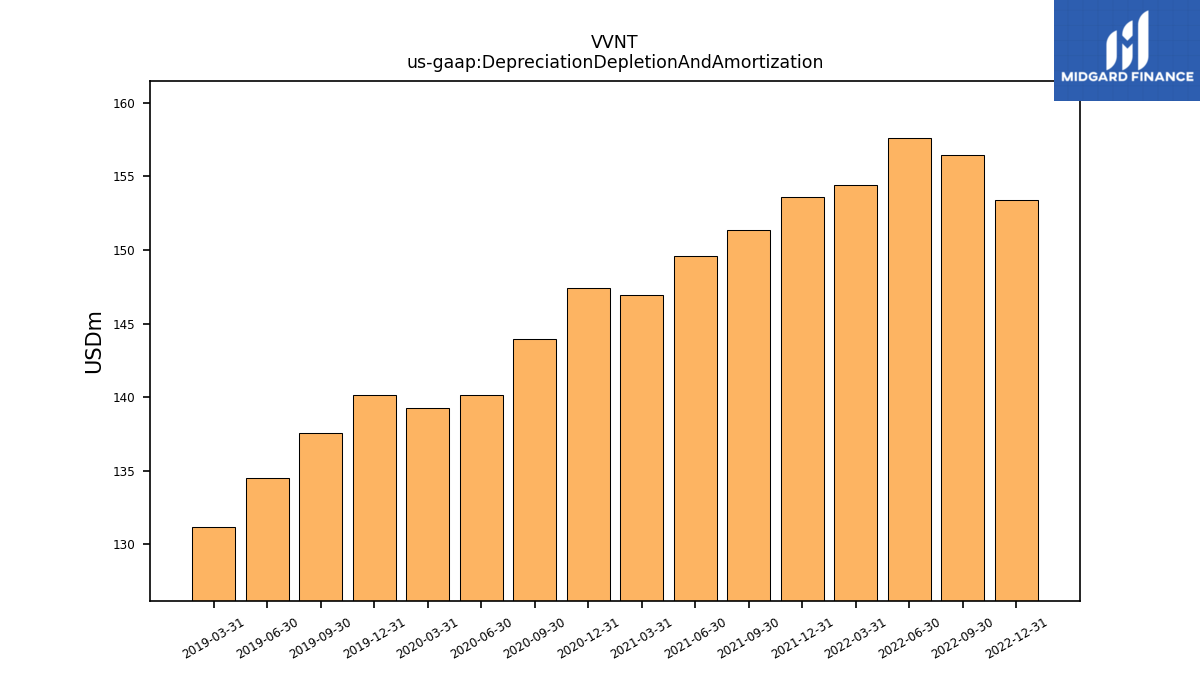
| Depreciation Depletion And Amortization | 153.38 | 156.43 | 157.62 | 154.39 | 153.59 | 151.33 | 149.62 | 146.91 | 147.44 | 143.97 | 140.18 | 139.25 | 140.18 | 137.54 | 134.50 | 131.22 | |
| Increase Decrease In Accounts Receivable | 16.01 | 5.25 | 23.23 | 1.99 | 2.18 | 1.66 | 19.43 | 7.45 | 1.98 | 6.65 | -3.73 | 20.66 | 4.59 | 0.05 | 19.42 | 10.42 | |
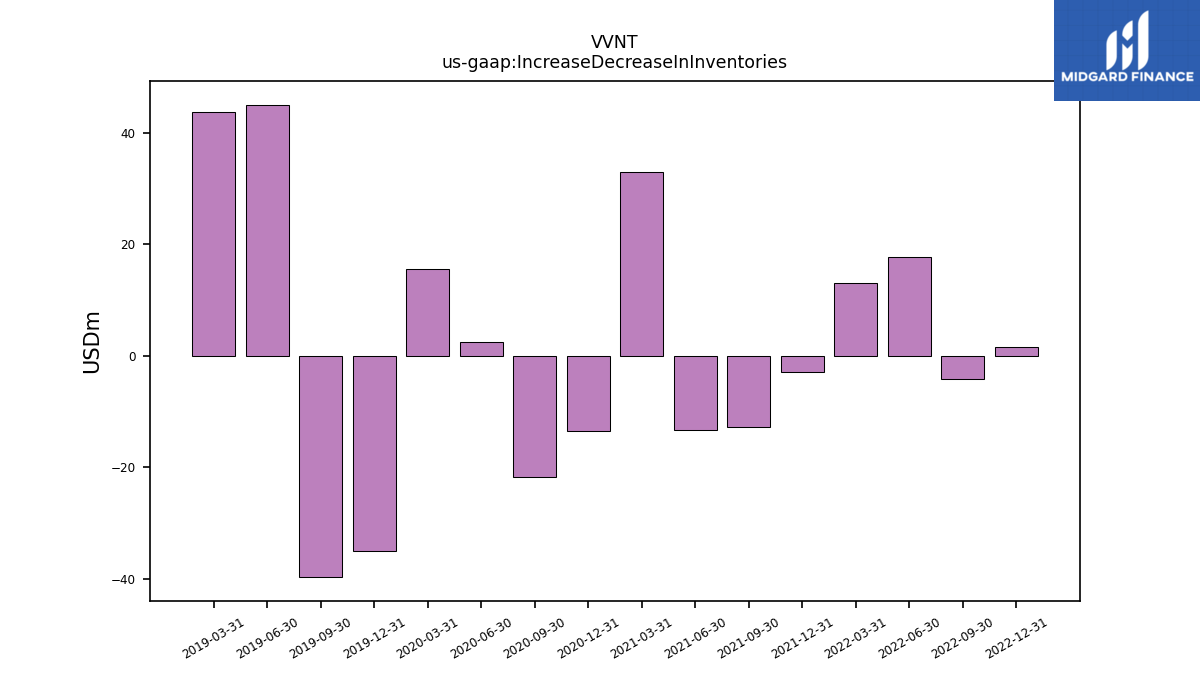
| Increase Decrease In Inventories | 1.62 | -4.12 | 17.74 | 12.95 | -2.90 | -12.83 | -13.30 | 32.98 | -13.55 | -21.82 | 2.54 | 15.53 | -35.02 | -39.70 | 45.01 | 43.67 | |
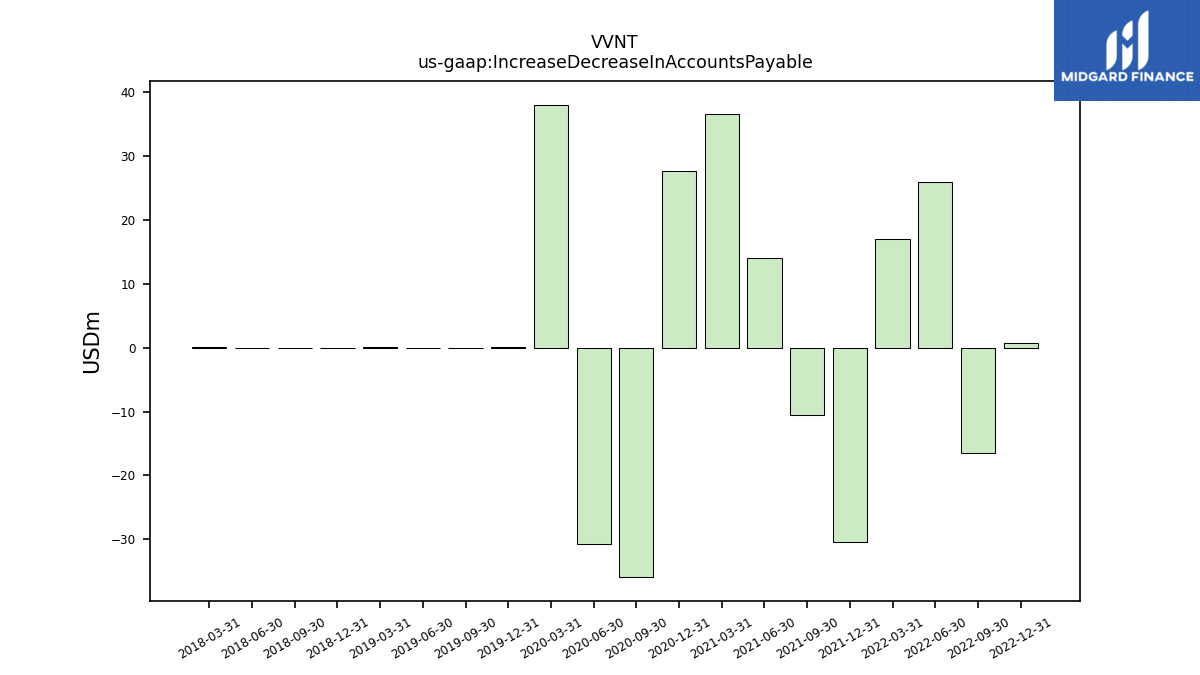
| Increase Decrease In Accounts Payable | 0.69 | -16.53 | 25.92 | 17.01 | -30.43 | -10.49 | 14.03 | 36.52 | 27.60 | -35.89 | -30.73 | 37.98 | 0.07 | 0.00 | -0.04 | 0.04 | |
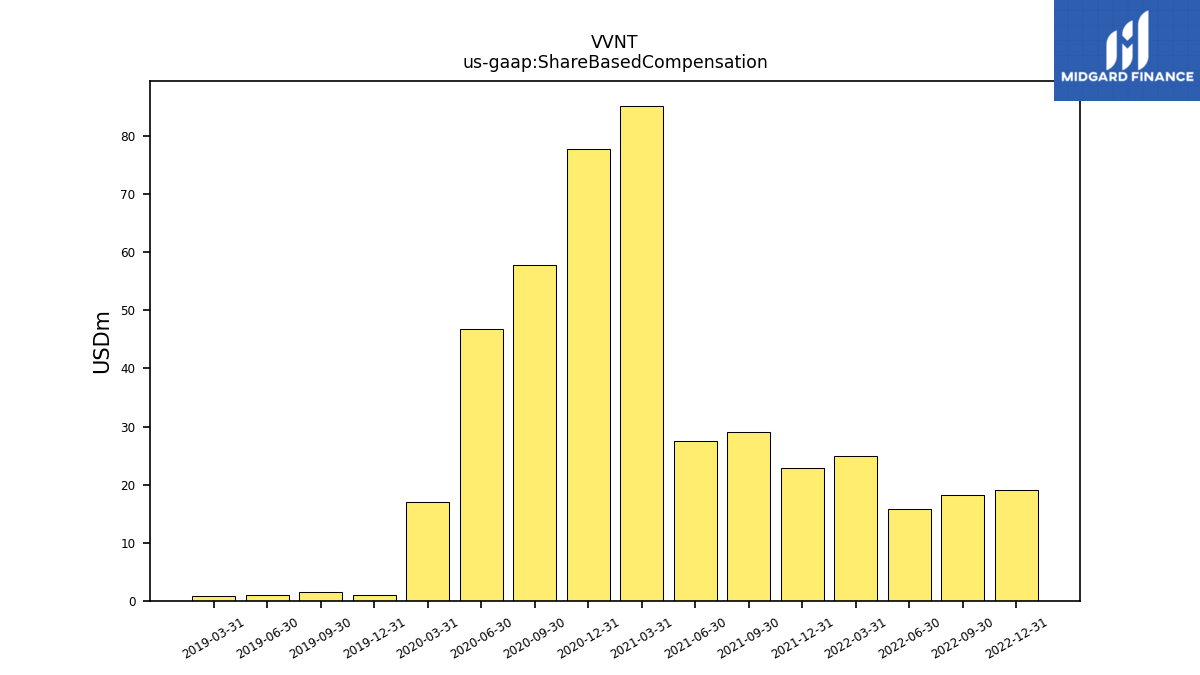
| Share Based Compensation | 19.09 | 18.23 | 15.76 | 24.87 | 22.84 | 29.05 | 27.54 | 85.25 | 77.85 | 57.85 | 46.75 | 17.07 | 0.95 | 1.46 | 0.98 | 0.86 | |
| Amortization Of Financing Costs | 1.41 | 1.41 | 1.41 | 1.41 | 1.41 | 1.33 | 0.94 | 0.95 | 0.97 | 0.98 | 1.06 | 0.95 | 1.18 | 1.19 | 1.16 | 1.18 |
| 2022-12-31 | 2022-09-30 | 2022-06-30 | 2022-03-31 | 2021-12-31 | 2021-09-30 | 2021-06-30 | 2021-03-31 | 2020-12-31 | 2020-09-30 | 2020-06-30 | 2020-03-31 | 2019-12-31 | 2019-09-30 | 2019-06-30 | 2019-03-31 | ||
|---|---|---|---|---|---|---|---|---|---|---|---|---|---|---|---|---|---|
| Net Cash Provided By Used In Investing Activities | -3.97 | -6.02 | 81.97 | -3.28 | -7.44 | -2.09 | -3.40 | -4.55 | -2.96 | -3.04 | -3.77 | -1.90 | 0.51 | 0.80 | 3.09 | -1.81 |
| 2022-12-31 | 2022-09-30 | 2022-06-30 | 2022-03-31 | 2021-12-31 | 2021-09-30 | 2021-06-30 | 2021-03-31 | 2020-12-31 | 2020-09-30 | 2020-06-30 | 2020-03-31 | 2019-12-31 | 2019-09-30 | 2019-06-30 | 2019-03-31 | ||
|---|---|---|---|---|---|---|---|---|---|---|---|---|---|---|---|---|---|
| Net Cash Provided By Used In Financing Activities | -5.76 | -6.71 | -4.08 | -15.99 | -4.50 | -140.69 | -4.26 | -20.76 | 14.38 | -92.85 | 9.90 | 162.67 | 103.62 | -5.91 | 85.49 | 35.72 |
| 2022-12-31 | 2022-09-30 | 2022-06-30 | 2022-03-31 | 2021-12-31 | 2021-09-30 | 2021-06-30 | 2021-03-31 | 2020-12-31 | 2020-09-30 | 2020-06-30 | 2020-03-31 | 2019-12-31 | 2019-09-30 | 2019-06-30 | 2019-03-31 | ||
|---|---|---|---|---|---|---|---|---|---|---|---|---|---|---|---|---|---|
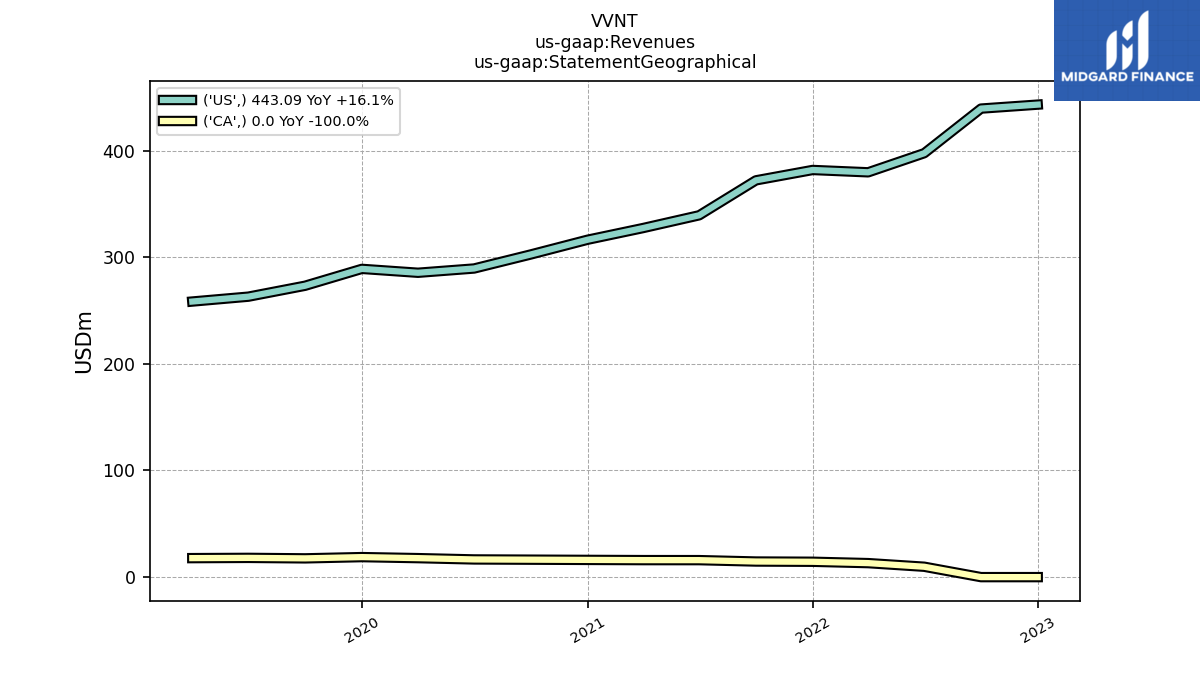
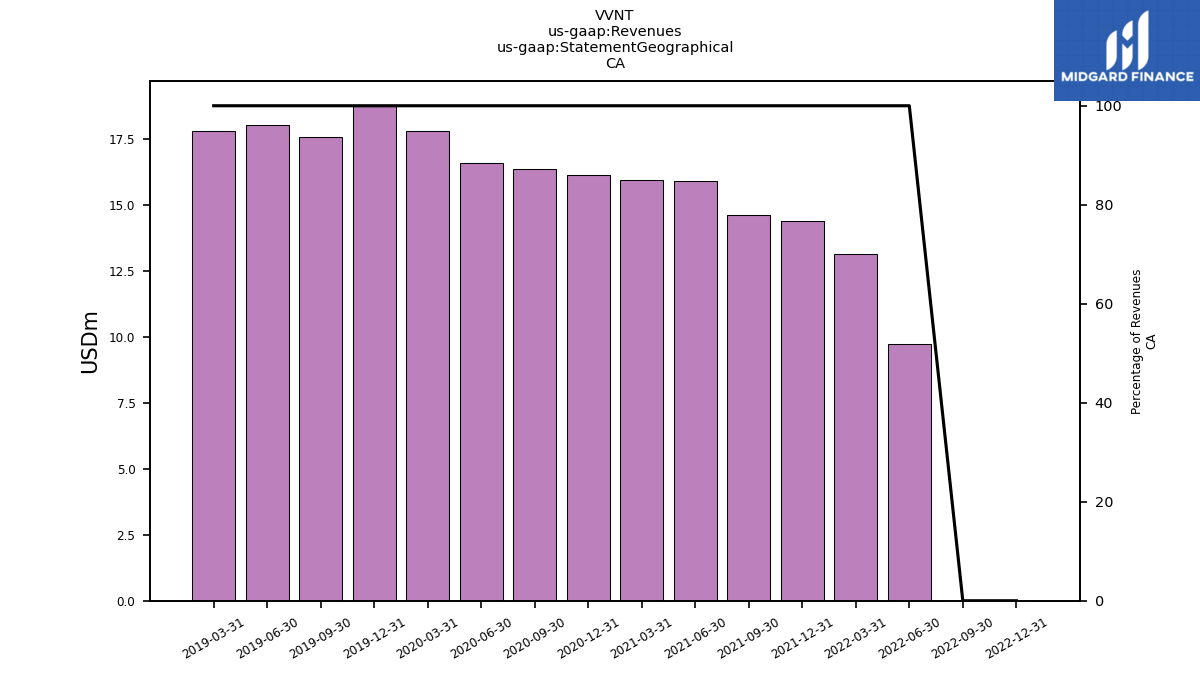
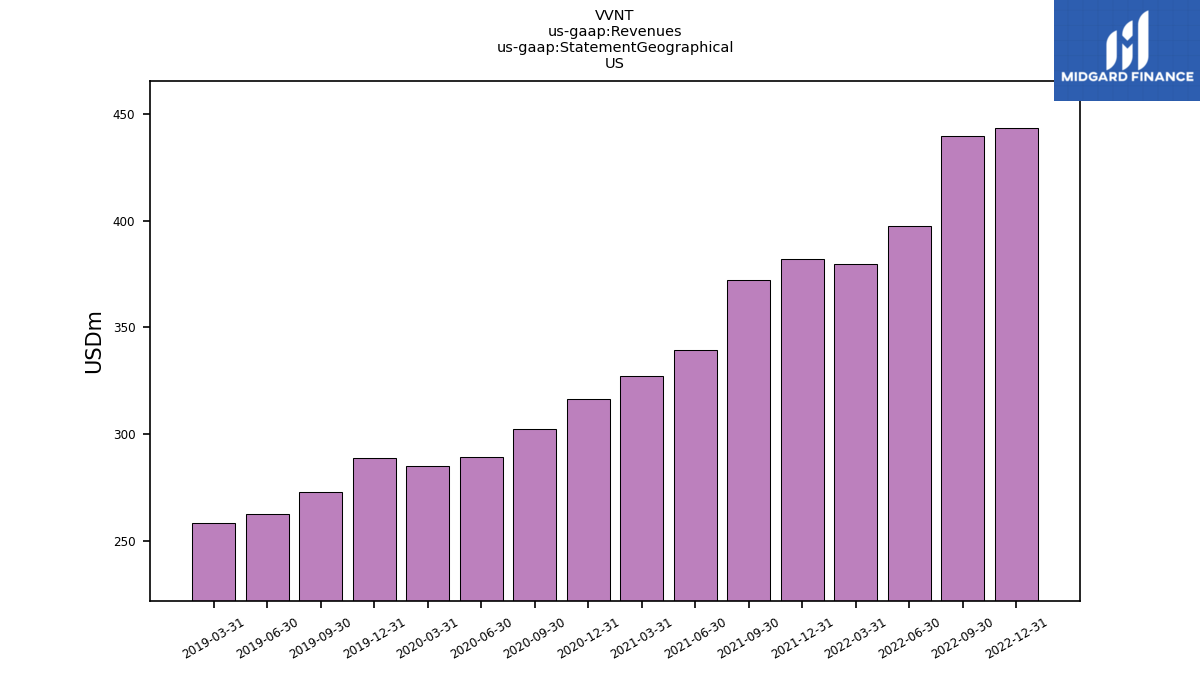
| Revenues | 443.09 | 439.37 | 407.28 | 392.75 | 396.21 | 386.71 | 355.23 | 343.29 | 332.42 | 318.96 | 306.00 | 303.23 | 307.83 | 290.84 | 281.05 | 276.25 | |
| 0.00 | 0.00 | 9.74 | 13.13 | 14.41 | 14.63 | 15.93 | 15.95 | 16.15 | 16.37 | 16.59 | 17.81 | 18.77 | 17.59 | 18.05 | 17.81 | ||
| US | 443.09 | 439.37 | 397.54 | 379.62 | 381.81 | 372.08 | 339.30 | 327.35 | 316.38 | 302.59 | 289.41 | 285.42 | 289.06 | 273.25 | 263.01 | 258.44 | |
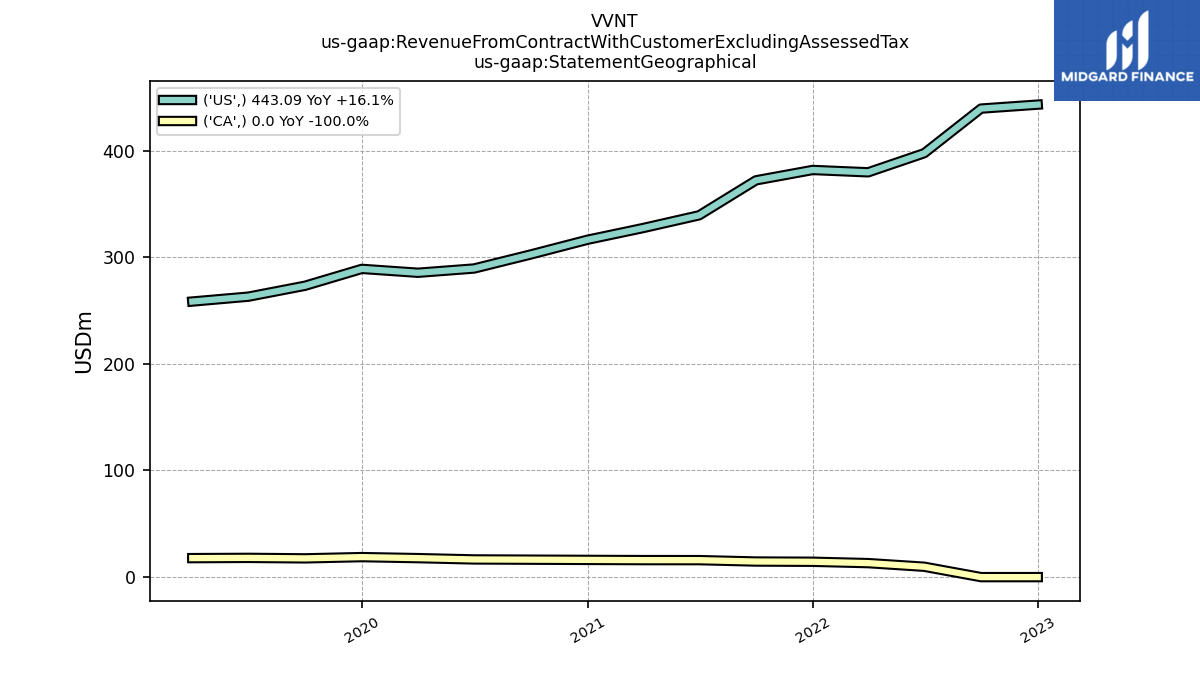
| Revenue From Contract With Customer Excluding Assessed Tax | 443.09 | 439.37 | 407.28 | 392.75 | 396.21 | 386.71 | 355.23 | 343.29 | 332.42 | 318.96 | 306.00 | 303.23 | 307.83 | 290.84 | 281.05 | 276.25 | |
| 0.00 | 0.00 | 9.74 | 13.13 | 14.41 | 14.63 | 15.93 | 15.95 | 16.15 | 16.37 | 16.59 | 17.81 | 18.77 | 17.59 | 18.05 | 17.81 | ||
| US | 443.09 | 439.37 | 397.54 | 379.62 | 381.81 | 372.08 | 339.30 | 327.35 | 316.38 | 302.59 | 289.41 | 285.42 | 289.06 | 273.25 | 263.01 | 258.44 |


