
| 2023-10-31 | 2023-07-31 | 2023-04-30 | 2023-01-31 | 2022-10-31 | 2022-07-31 | 2022-04-30 | 2022-01-31 | 2021-10-31 | 2021-07-31 | 2021-04-30 | 2021-01-31 | 2020-10-31 | 2020-07-31 | 2020-04-30 | 2020-01-31 | 2019-10-31 | 2019-07-31 | 2019-04-30 | 2019-01-31 | 2018-10-31 | 2018-07-31 | 2018-04-30 | 2018-01-31 | 2017-10-31 | 2017-07-31 | 2017-04-30 | 2017-01-31 | 2016-10-31 | 2016-07-31 | 2016-04-30 | 2016-01-31 | 2015-10-31 | 2015-07-31 | 2015-04-30 | 2015-01-31 | 2014-10-31 | 2014-07-31 | 2014-04-30 | 2014-01-31 | 2013-10-31 | 2013-07-31 | 2013-04-30 | 2013-01-31 | 2012-10-31 | 2012-07-31 | 2012-04-30 | 2012-01-31 | 2011-10-31 | 2011-07-31 | 2011-04-30 | 2011-01-31 | ||
|---|---|---|---|---|---|---|---|---|---|---|---|---|---|---|---|---|---|---|---|---|---|---|---|---|---|---|---|---|---|---|---|---|---|---|---|---|---|---|---|---|---|---|---|---|---|---|---|---|---|---|---|---|---|
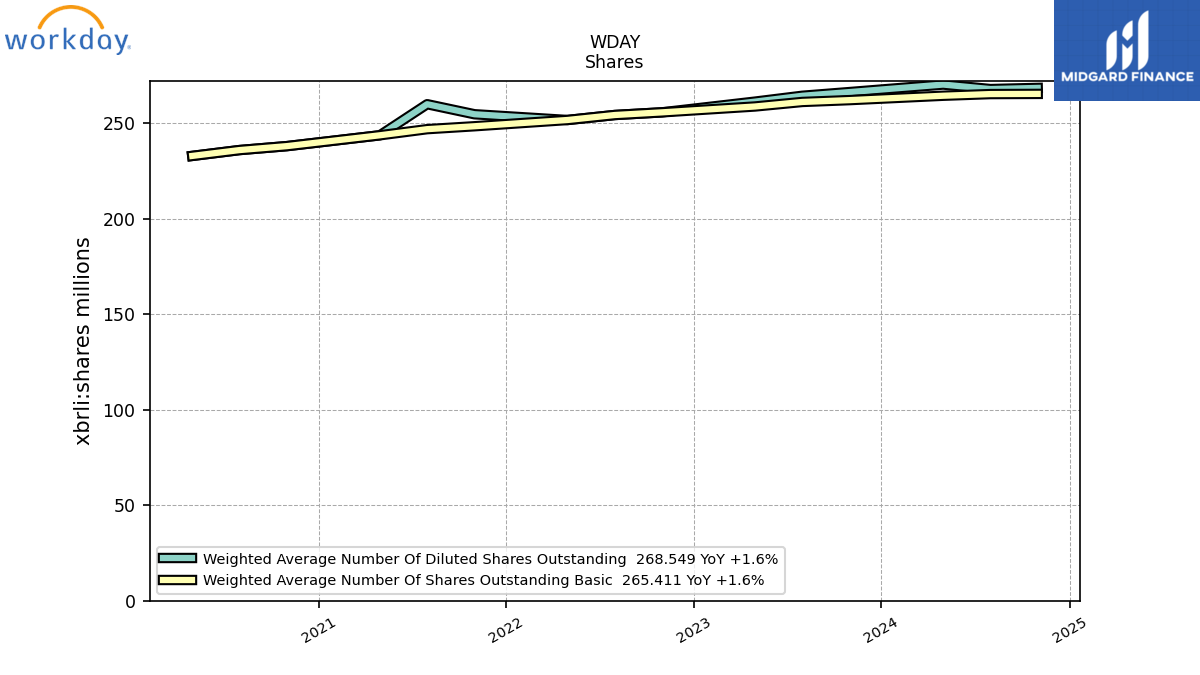
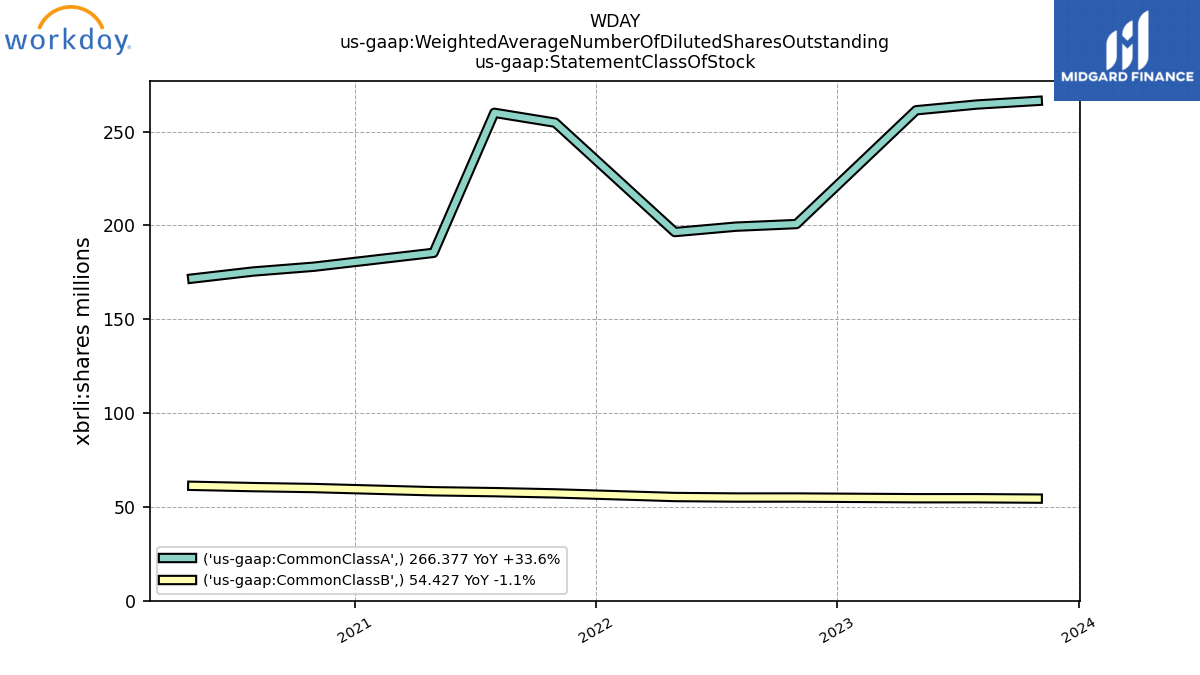
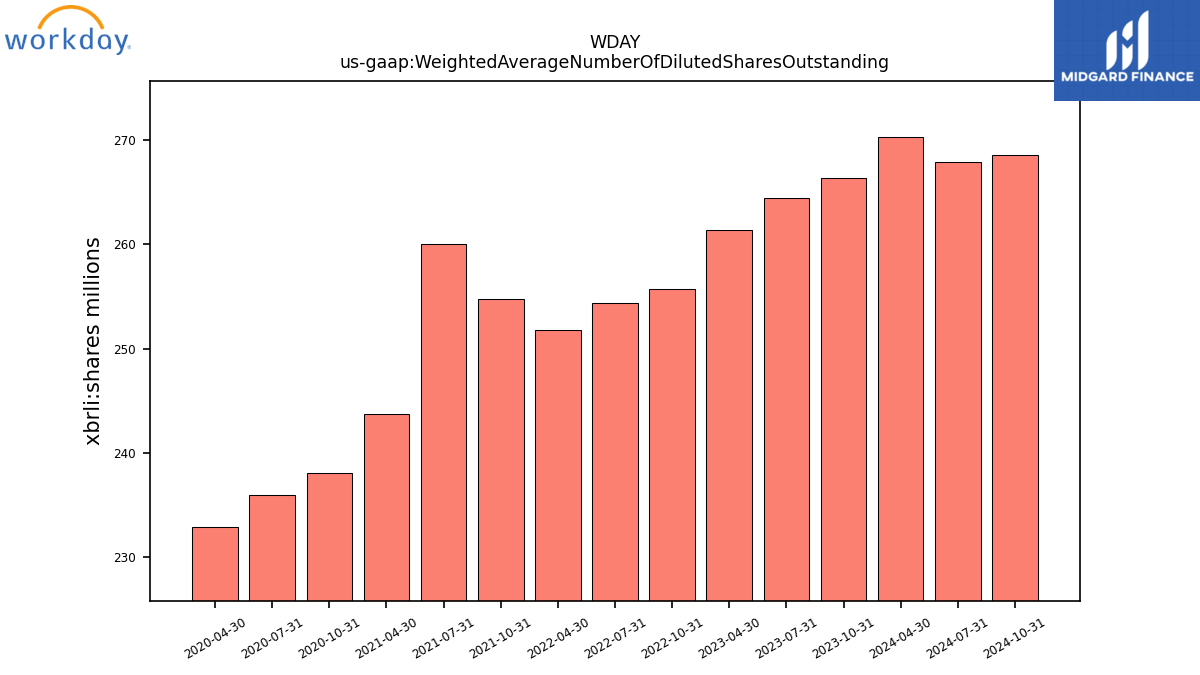
| Weighted Average Number Of Diluted Shares Outstanding | 266.38 | 264.44 | 261.37 | NA | 255.75 | 254.35 | 251.74 | NA | 254.76 | 260.02 | 243.74 | NA | 238.06 | 236.00 | 232.94 | NA | NA | NA | NA | NA | NA | NA | NA | NA | NA | NA | NA | NA | NA | NA | NA | NA | NA | NA | NA | NA | NA | NA | NA | NA | NA | NA | NA | NA | NA | NA | NA | NA | NA | NA | NA | NA | |
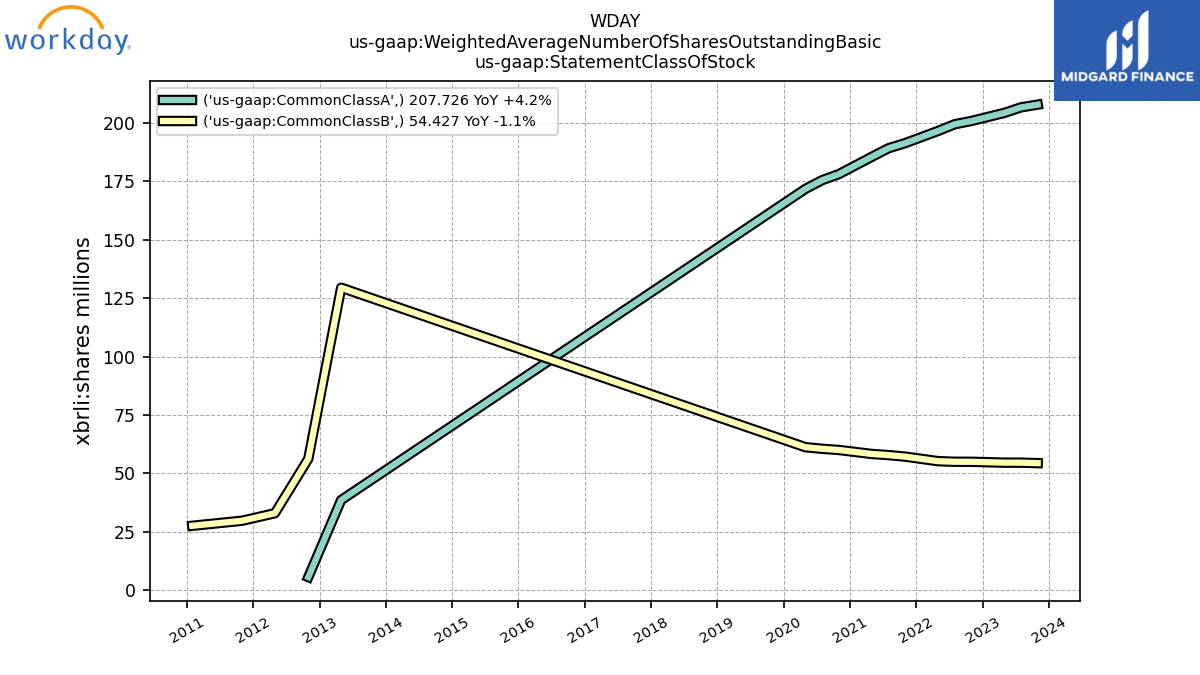
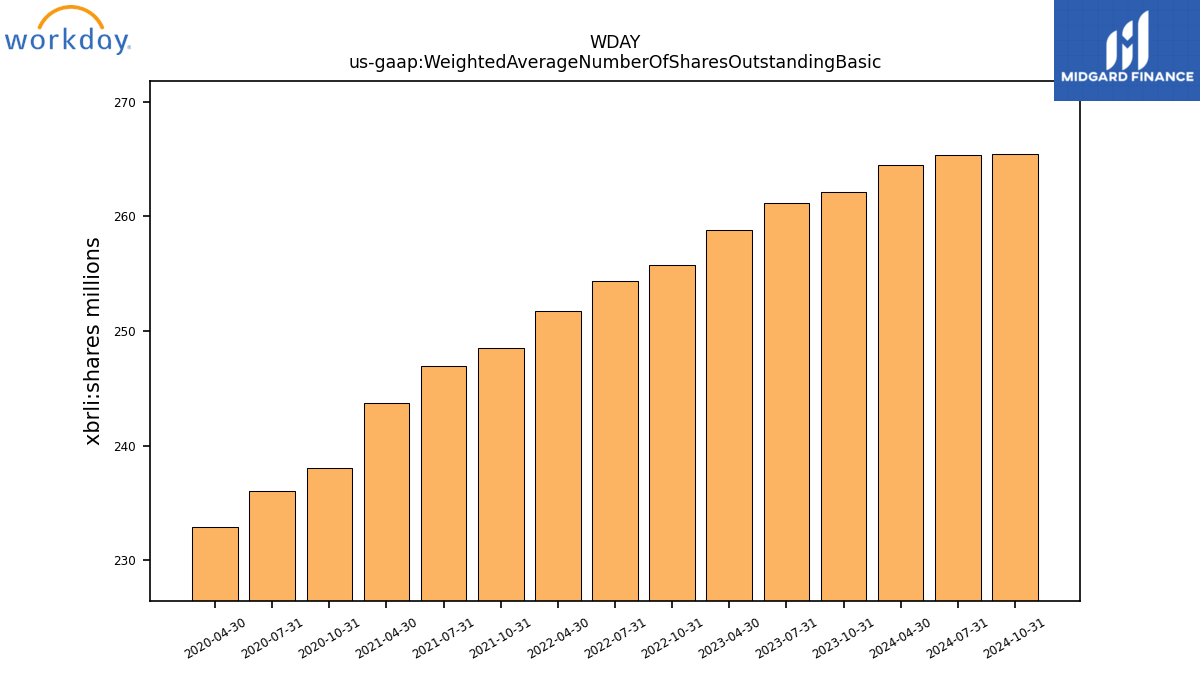
| Weighted Average Number Of Shares Outstanding Basic | 262.15 | 261.19 | 258.82 | NA | 255.75 | 254.35 | 251.74 | NA | 248.47 | 246.94 | 243.74 | NA | 238.06 | 236.00 | 232.94 | NA | NA | NA | NA | NA | NA | NA | NA | NA | NA | NA | NA | NA | NA | NA | NA | NA | NA | NA | NA | NA | NA | NA | NA | NA | NA | NA | NA | NA | NA | NA | NA | NA | NA | NA | NA | NA | |
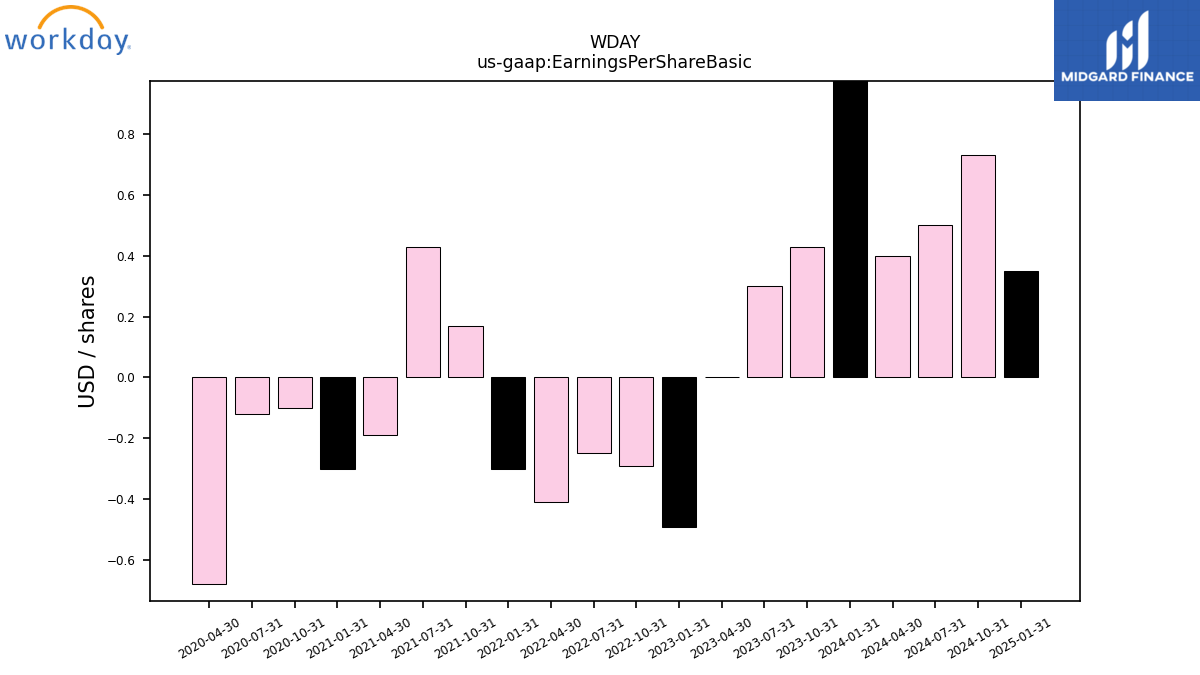
| Earnings Per Share Basic | 0.43 | 0.30 | 0.00 | -0.49 | -0.29 | -0.25 | -0.41 | -0.30 | 0.17 | 0.43 | -0.19 | -0.30 | -0.10 | -0.12 | -0.68 | NA | NA | NA | NA | NA | NA | NA | NA | NA | NA | NA | NA | NA | NA | NA | NA | NA | NA | NA | NA | NA | NA | NA | NA | NA | NA | NA | NA | NA | NA | NA | NA | NA | NA | NA | NA | NA | |
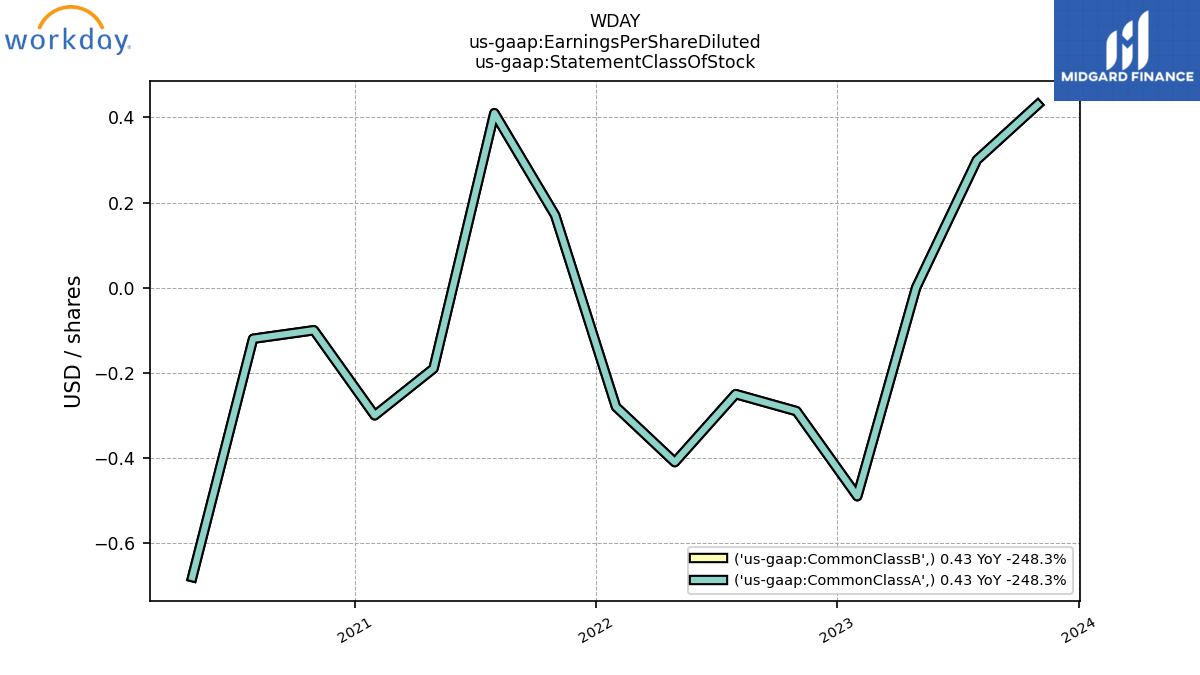
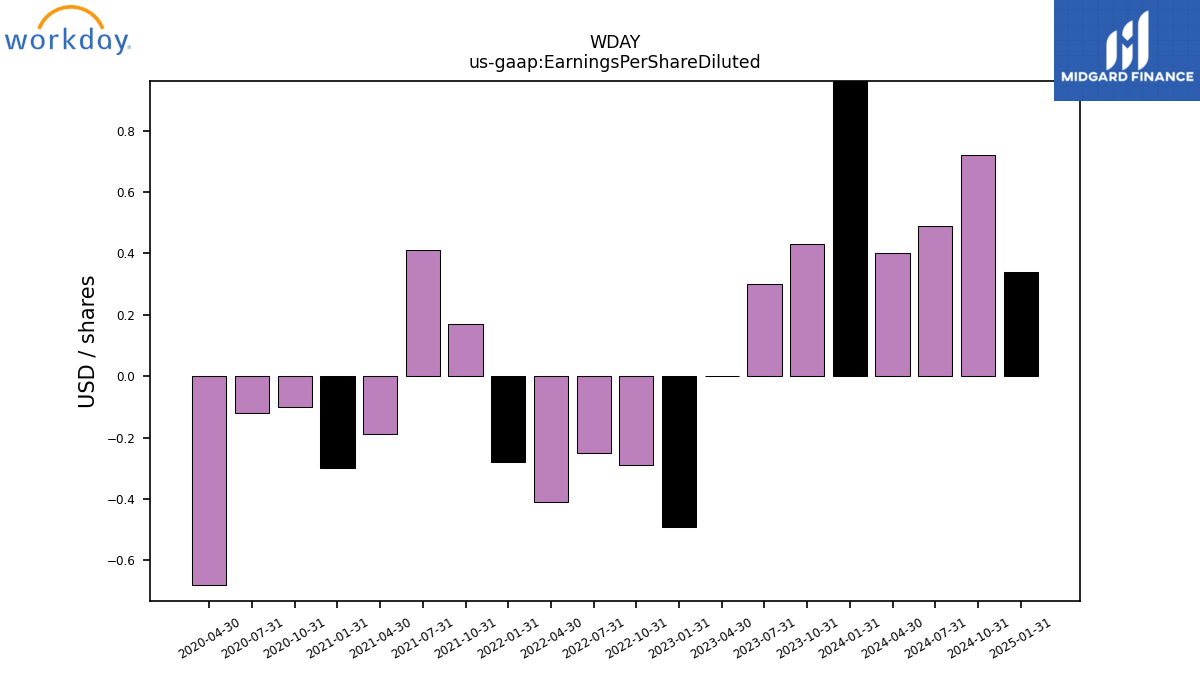
| Earnings Per Share Diluted | 0.43 | 0.30 | 0.00 | -0.49 | -0.29 | -0.25 | -0.41 | -0.28 | 0.17 | 0.41 | -0.19 | -0.30 | -0.10 | -0.12 | -0.68 | NA | NA | NA | NA | NA | NA | NA | NA | NA | NA | NA | NA | NA | NA | NA | NA | NA | NA | NA | NA | NA | NA | NA | NA | NA | NA | NA | NA | NA | NA | NA | NA | NA | NA | NA | NA | NA |
| 2023-10-31 | 2023-07-31 | 2023-04-30 | 2023-01-31 | 2022-10-31 | 2022-07-31 | 2022-04-30 | 2022-01-31 | 2021-10-31 | 2021-07-31 | 2021-04-30 | 2021-01-31 | 2020-10-31 | 2020-07-31 | 2020-04-30 | 2020-01-31 | 2019-10-31 | 2019-07-31 | 2019-04-30 | 2019-01-31 | 2018-10-31 | 2018-07-31 | 2018-04-30 | 2018-01-31 | 2017-10-31 | 2017-07-31 | 2017-04-30 | 2017-01-31 | 2016-10-31 | 2016-07-31 | 2016-04-30 | 2016-01-31 | 2015-10-31 | 2015-07-31 | 2015-04-30 | 2015-01-31 | 2014-10-31 | 2014-07-31 | 2014-04-30 | 2014-01-31 | 2013-10-31 | 2013-07-31 | 2013-04-30 | 2013-01-31 | 2012-10-31 | 2012-07-31 | 2012-04-30 | 2012-01-31 | 2011-10-31 | 2011-07-31 | 2011-04-30 | 2011-01-31 | ||
|---|---|---|---|---|---|---|---|---|---|---|---|---|---|---|---|---|---|---|---|---|---|---|---|---|---|---|---|---|---|---|---|---|---|---|---|---|---|---|---|---|---|---|---|---|---|---|---|---|---|---|---|---|---|
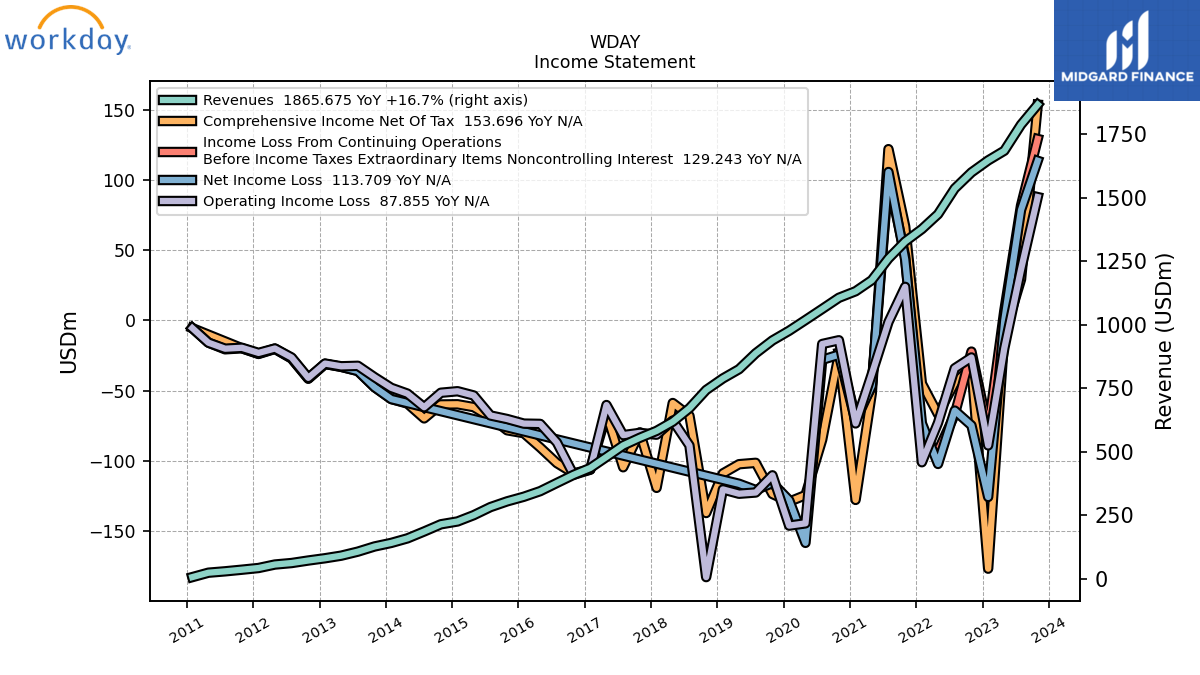
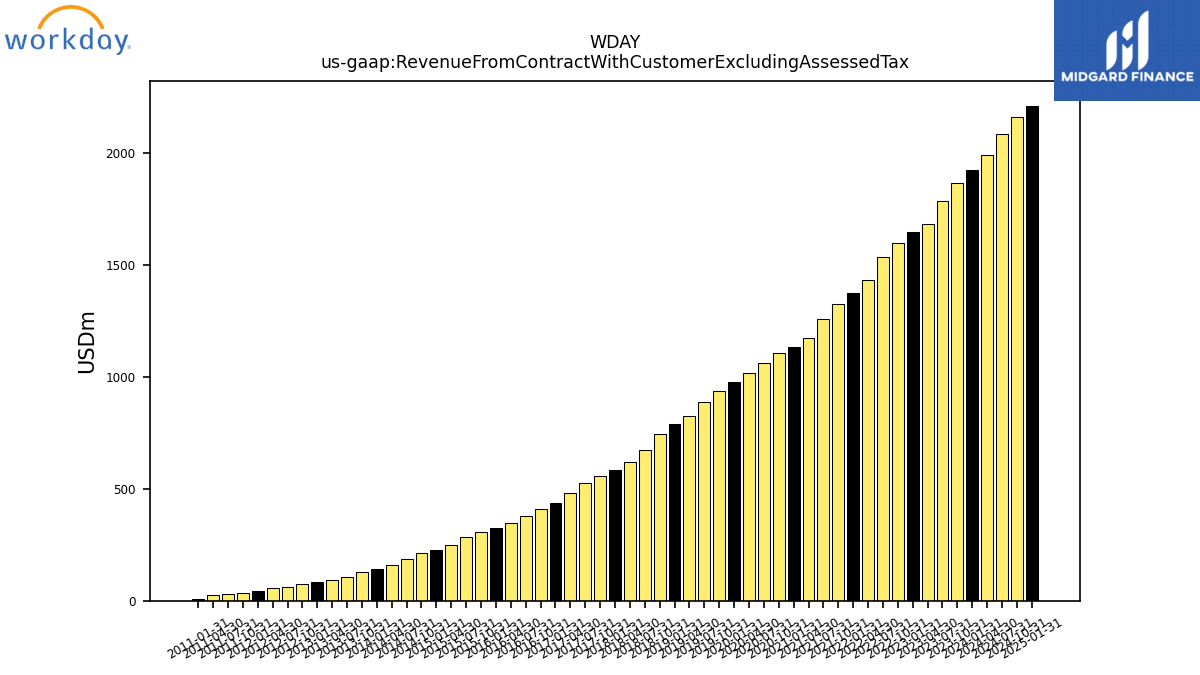
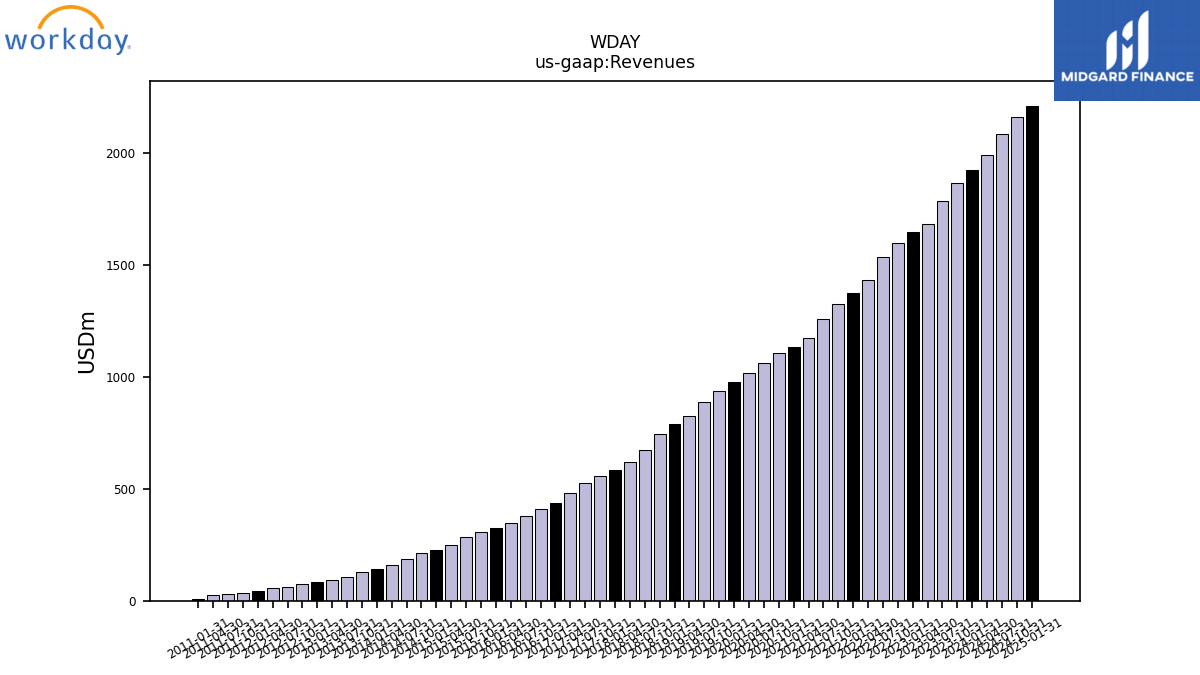
| Revenue From Contract With Customer Excluding Assessed Tax | 1865.67 | 1786.77 | 1684.31 | 1646.26 | 1599.10 | 1535.80 | 1434.66 | 1376.14 | 1327.26 | 1260.36 | 1175.03 | 1131.68 | 1105.96 | 1061.97 | 1018.38 | 976.30 | 938.10 | 887.75 | 825.05 | 788.63 | 743.19 | 671.72 | 618.64 | 582.48 | 555.39 | 525.32 | 479.86 | 436.67 | 409.58 | 377.72 | 345.43 | 323.43 | 305.27 | 282.70 | 250.96 | 226.27 | 215.07 | 186.78 | 159.74 | 141.87 | 127.87 | 107.56 | 91.64 | 81.52 | 72.62 | 62.70 | 56.82 | 43.16 | 36.45 | 30.13 | 24.69 | 7.28 | |
| Revenues | 1865.67 | 1786.77 | 1684.31 | 1646.26 | 1599.10 | 1535.80 | 1434.66 | 1376.14 | 1327.26 | 1260.36 | 1175.03 | 1131.68 | 1105.96 | 1061.97 | 1018.38 | 976.30 | 938.10 | 887.75 | 825.05 | 788.63 | 743.19 | 671.72 | 618.64 | 582.48 | 555.39 | 525.32 | 479.86 | 436.67 | 409.58 | 377.72 | 345.43 | 323.43 | 305.27 | 282.70 | 250.96 | 226.27 | 215.07 | 186.78 | 159.74 | 141.87 | 127.87 | 107.56 | 91.64 | 81.52 | 72.62 | 62.70 | 56.82 | 43.16 | 36.45 | 30.13 | 24.69 | 7.28 | |
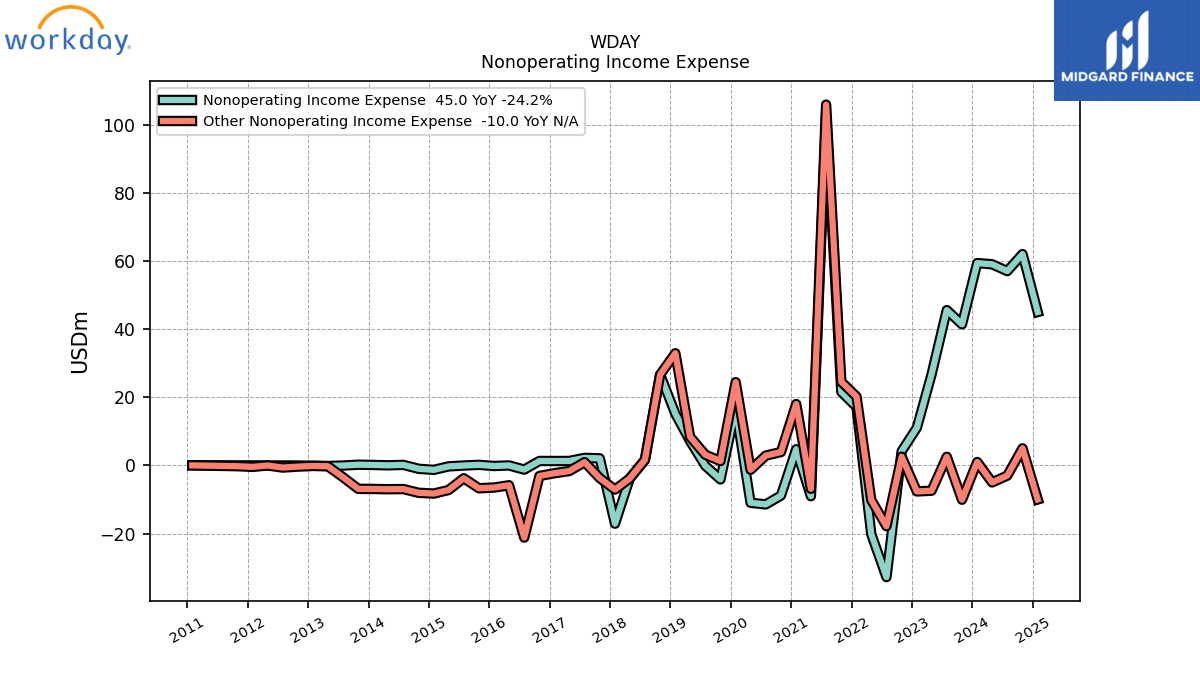
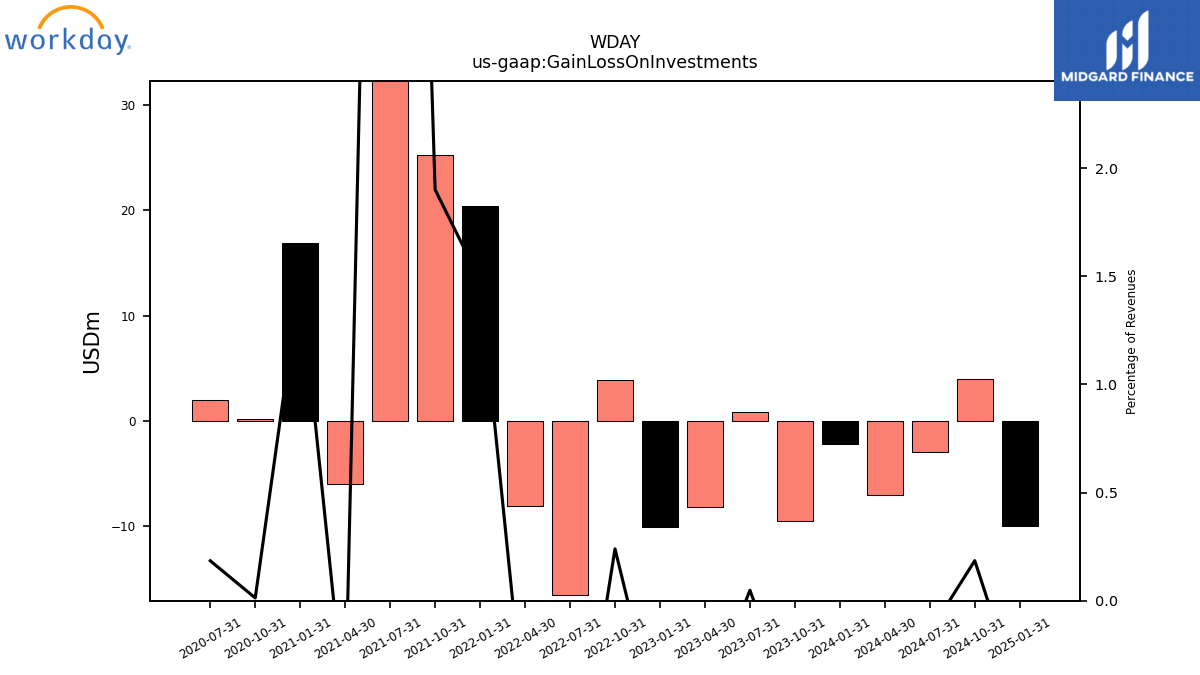
| Gain Loss On Investments | -9.49 | 0.86 | -8.14 | -10.03 | 3.83 | -16.50 | -8.08 | 20.37 | 25.22 | 106.28 | -6.02 | 16.91 | 0.14 | 1.96 | NA | NA | NA | NA | NA | NA | NA | NA | NA | NA | NA | NA | NA | NA | NA | NA | NA | NA | NA | NA | NA | NA | NA | NA | NA | NA | NA | NA | NA | NA | NA | NA | NA | NA | NA | NA | NA | NA | |
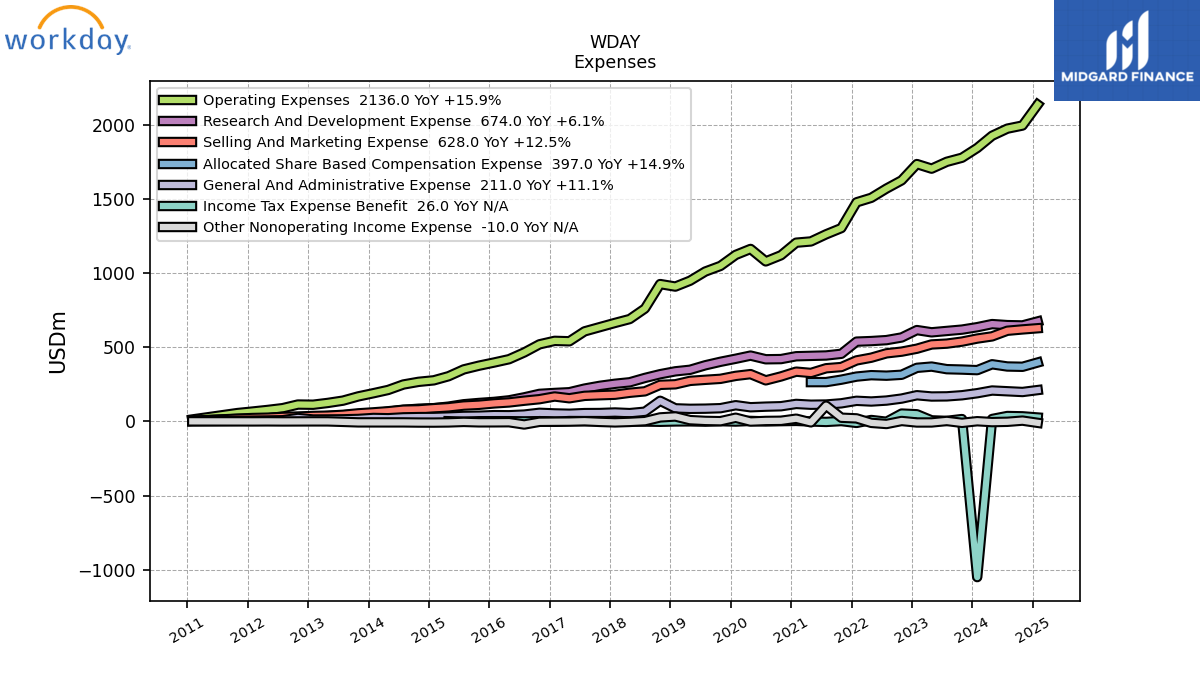
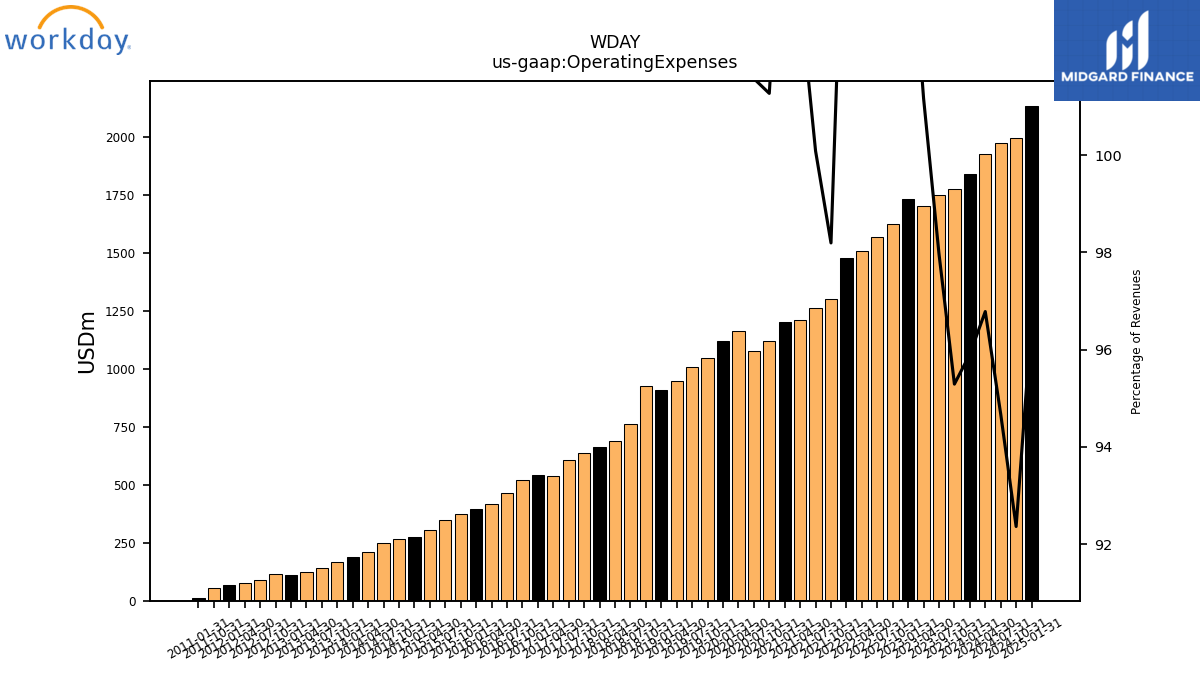
| Operating Expenses | 1777.82 | 1750.51 | 1704.11 | 1735.22 | 1625.42 | 1569.88 | 1507.50 | 1477.10 | 1303.32 | 1261.48 | 1213.35 | 1204.99 | 1120.04 | 1078.72 | 1162.84 | 1122.40 | 1048.35 | 1010.25 | 948.44 | 908.91 | 925.94 | 760.70 | 689.91 | 663.82 | 635.45 | 606.95 | 540.06 | 542.91 | 519.47 | 464.62 | 419.08 | 396.87 | 375.44 | 350.34 | 304.36 | 276.66 | 266.54 | 248.55 | 211.82 | 189.84 | 168.27 | 139.84 | 124.27 | 112.20 | 113.49 | 89.06 | 76.78 | 66.25 | 55.89 | NA | NA | 12.71 | |
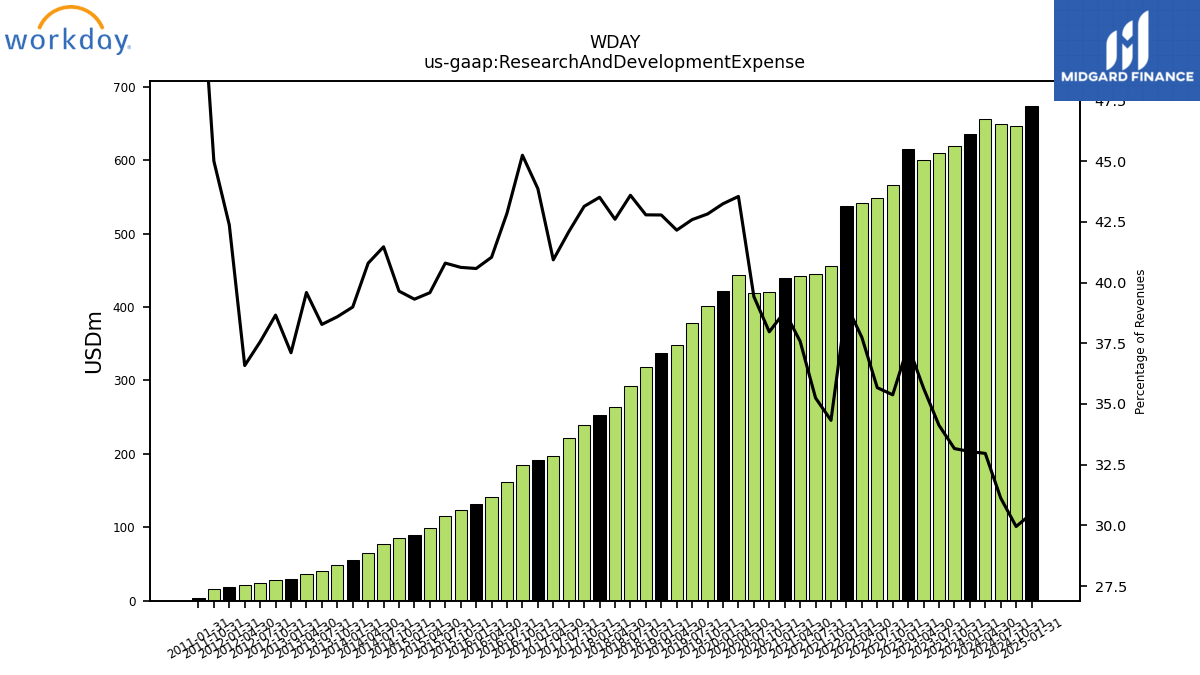
| Research And Development Expense | 618.74 | 609.68 | 600.46 | 615.59 | 565.73 | 547.84 | 541.51 | 537.74 | 455.62 | 444.25 | 441.62 | 439.10 | 419.96 | 418.68 | 443.48 | 422.21 | 401.74 | 378.12 | 347.83 | 337.40 | 318.00 | 292.84 | 263.58 | 253.45 | 239.59 | 221.10 | 196.44 | 191.56 | 185.31 | 161.89 | 141.78 | 131.24 | 124.02 | 115.34 | 99.33 | 88.96 | 85.27 | 77.46 | 65.17 | 55.32 | 49.35 | 41.17 | 36.28 | 30.25 | 28.07 | 23.55 | 20.79 | 18.29 | 16.40 | NA | NA | 3.96 | |
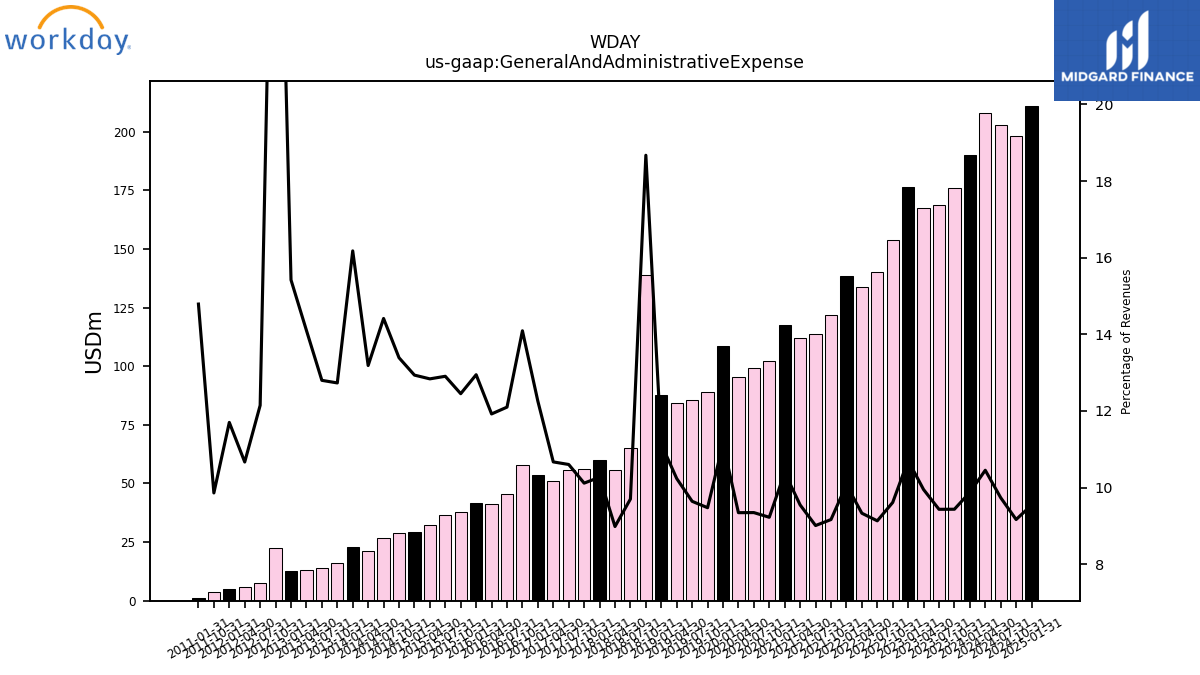
| General And Administrative Expense | 176.03 | 168.55 | 167.57 | 176.25 | 153.71 | 140.25 | 133.87 | 138.62 | 121.66 | 113.55 | 112.18 | 117.61 | 102.02 | 99.27 | 95.17 | 108.79 | 88.88 | 85.59 | 84.45 | 87.80 | 138.78 | 65.17 | 55.58 | 59.82 | 56.18 | 55.70 | 51.20 | 53.51 | 57.72 | 45.70 | 41.18 | 41.87 | 38.01 | 36.48 | 32.22 | 29.27 | 28.80 | 26.92 | 21.06 | 22.95 | 16.28 | 13.77 | 12.92 | 12.57 | 22.63 | 7.62 | 6.06 | 5.05 | 3.59 | NA | NA | 1.08 | |
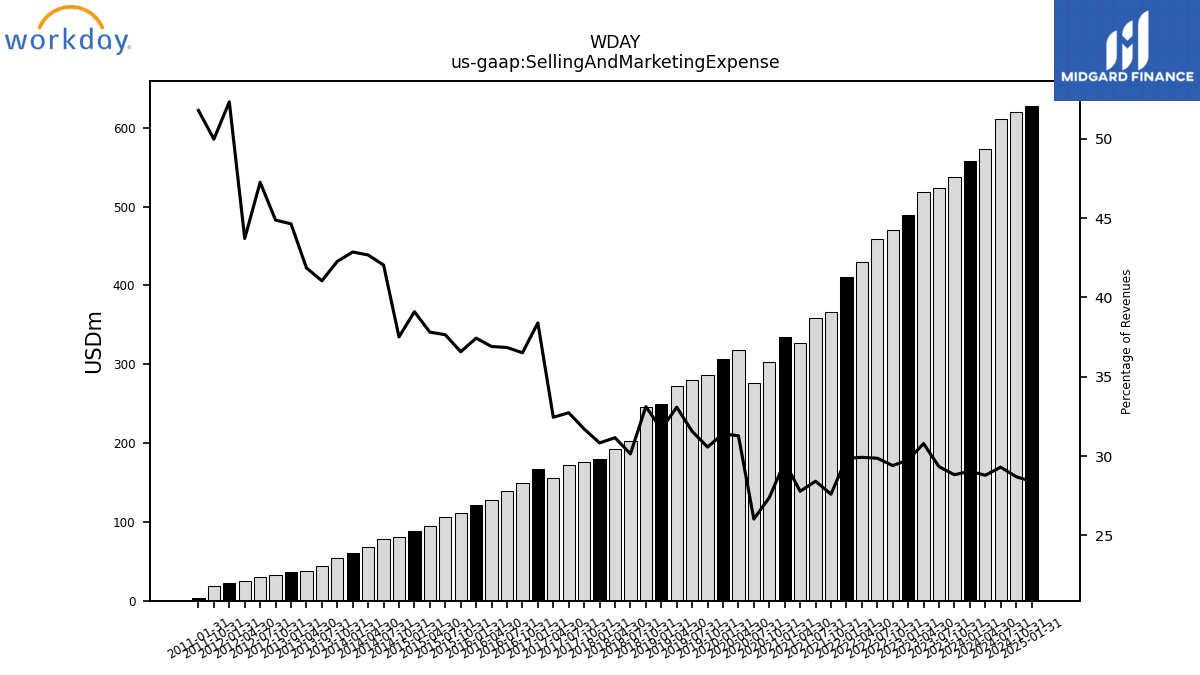
| Selling And Marketing Expense | 537.82 | 524.19 | 518.64 | 489.89 | 470.20 | 458.70 | 429.30 | 410.95 | 366.32 | 358.16 | 326.49 | 335.25 | 302.87 | 276.50 | 318.56 | 306.62 | 286.79 | 280.20 | 272.94 | 249.95 | 246.16 | 202.46 | 192.77 | 179.59 | 176.12 | 171.95 | 155.71 | 167.66 | 149.55 | 139.18 | 127.49 | 121.07 | 111.66 | 106.43 | 94.89 | 88.47 | 80.68 | 78.52 | 68.17 | 60.81 | 54.05 | 44.15 | 38.36 | 36.39 | 32.58 | 29.63 | 24.84 | 22.58 | 18.21 | NA | NA | 3.77 | |
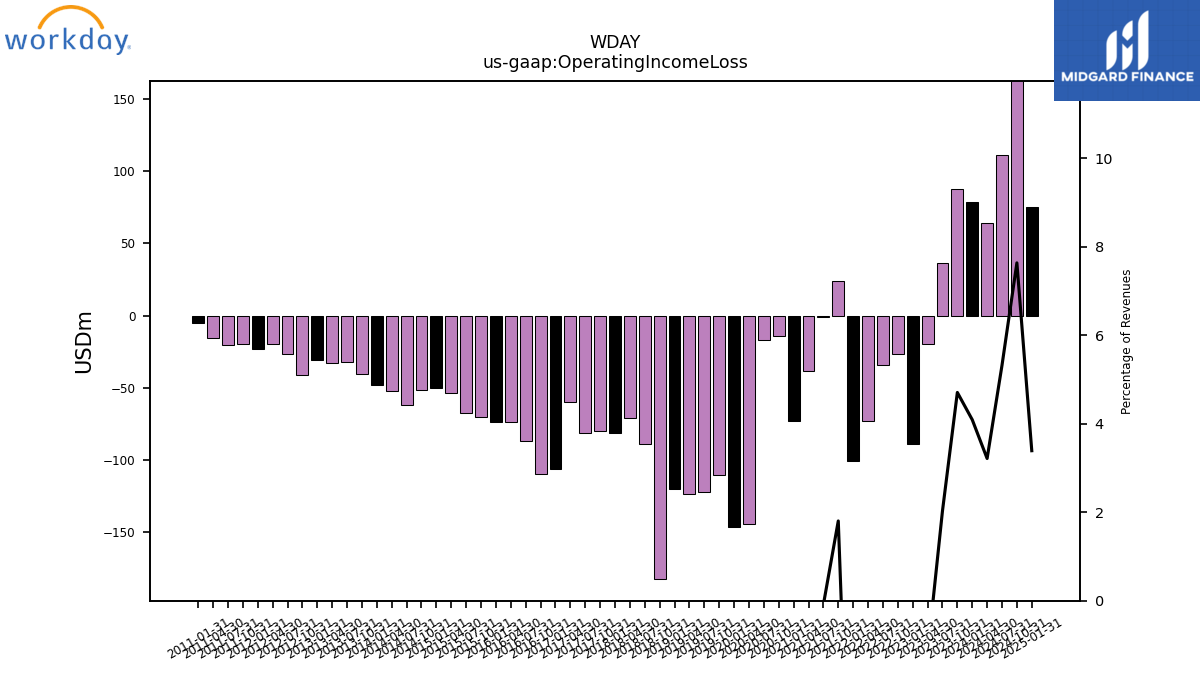
| Operating Income Loss | 87.86 | 36.26 | -19.80 | -88.96 | -26.32 | -34.08 | -72.84 | -100.96 | 23.95 | -1.12 | -38.31 | -73.31 | -14.08 | -16.75 | -144.46 | -146.10 | -110.25 | -122.50 | -123.39 | -120.28 | -182.75 | -88.98 | -71.26 | -81.33 | -80.06 | -81.63 | -60.20 | -106.23 | -109.88 | -86.90 | -73.65 | -73.44 | -70.17 | -67.64 | -53.40 | -50.38 | -51.47 | -61.77 | -52.08 | -47.98 | -40.40 | -32.28 | -32.62 | -30.68 | -40.87 | -26.36 | -19.96 | -23.09 | -19.44 | -20.09 | -15.82 | -5.43 | |
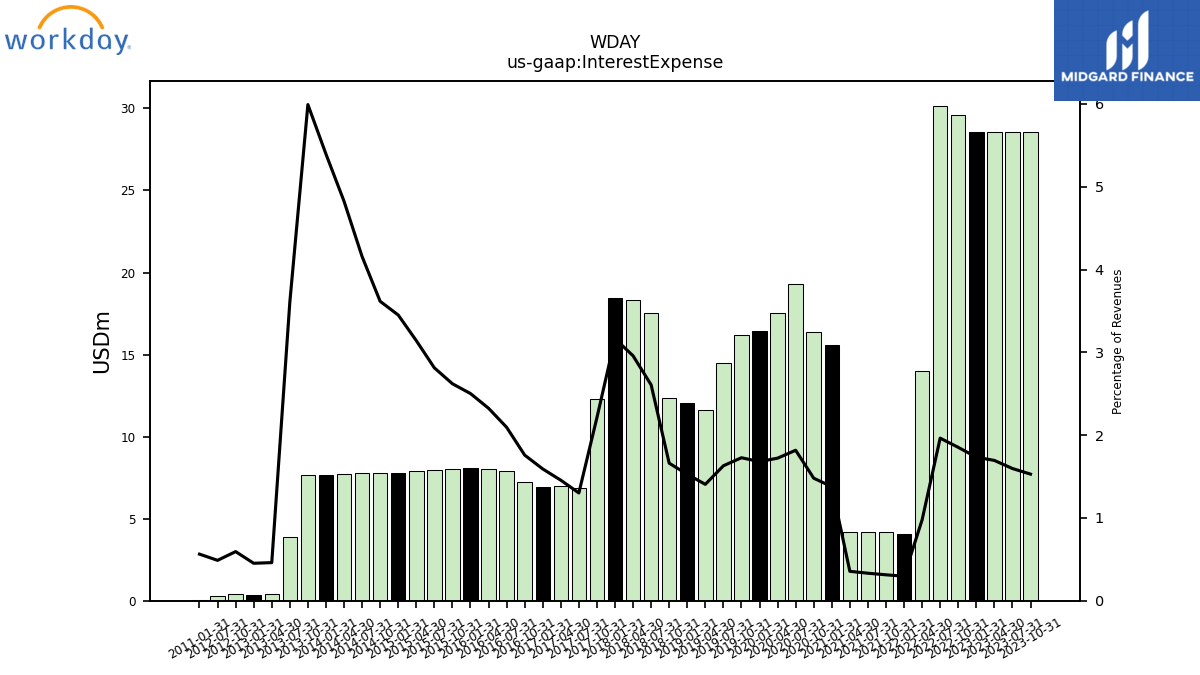
| Interest Expense | 28.54 | 28.54 | 28.55 | 28.55 | 29.63 | 30.16 | 14.02 | 4.08 | 4.16 | 4.19 | 4.18 | 15.60 | 16.37 | 19.30 | 17.54 | 16.41 | 16.20 | 14.47 | 11.60 | 12.04 | 12.35 | 17.52 | 18.30 | 18.44 | 12.29 | 6.84 | 6.99 | 6.95 | 7.21 | 7.91 | 8.03 | 8.09 | 8.00 | 7.95 | 7.88 | 7.81 | 7.78 | 7.76 | 7.71 | 7.65 | 7.66 | 3.88 | 0.42 | 0.37 | 0.43 | 0.31 | NA | NA | NA | NA | NA | 0.04 | |
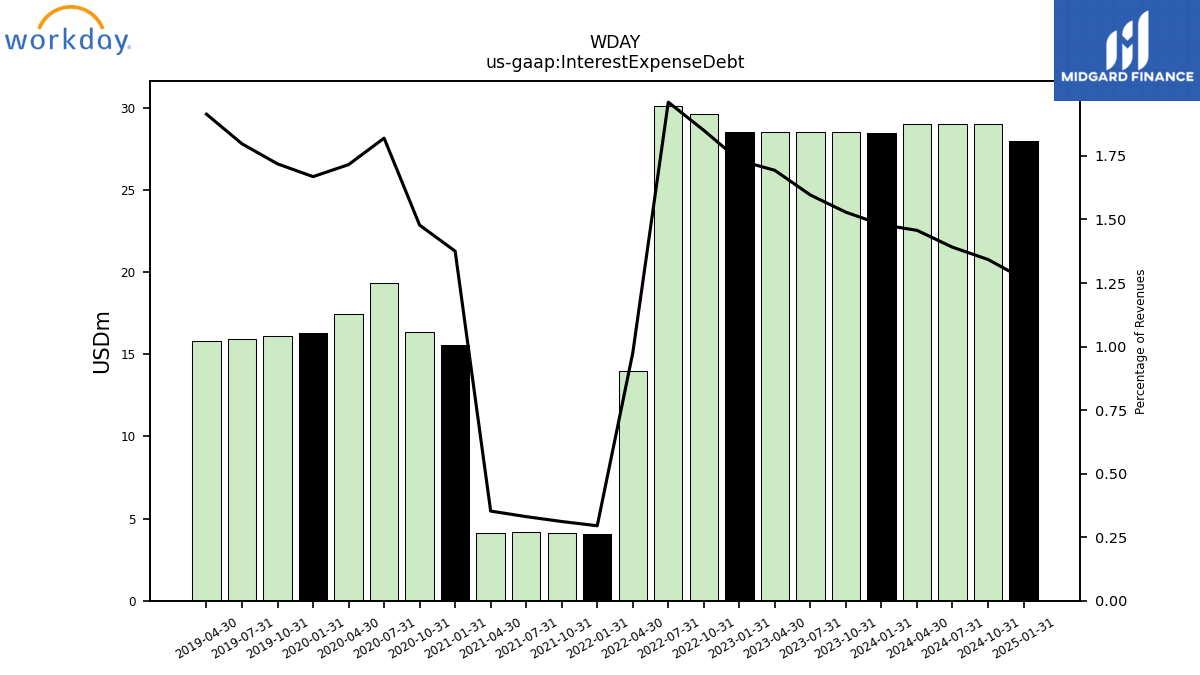
| Interest Expense Debt | 28.52 | 28.52 | 28.52 | 28.52 | 29.59 | 30.12 | 13.99 | 4.06 | 4.14 | 4.17 | 4.14 | 15.56 | 16.34 | 19.33 | 17.47 | 16.29 | 16.12 | 15.96 | 15.79 | NA | NA | NA | NA | NA | NA | NA | NA | NA | NA | NA | NA | NA | NA | NA | NA | NA | NA | NA | NA | NA | NA | NA | NA | NA | NA | NA | NA | NA | NA | NA | NA | NA | |
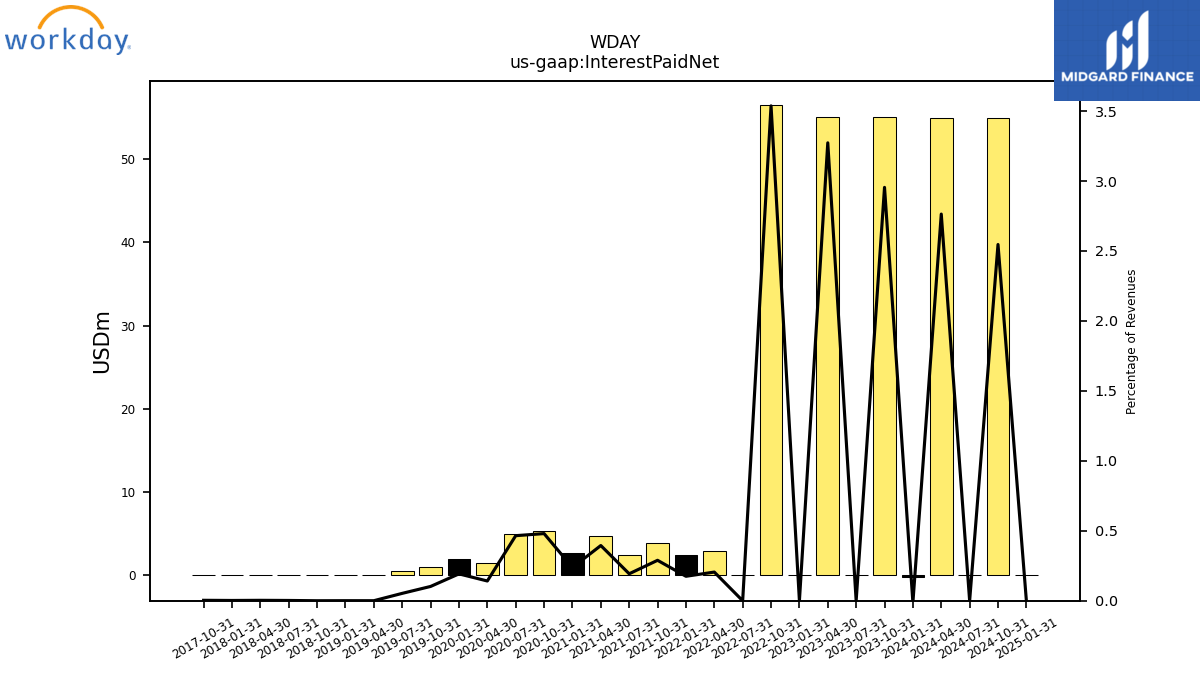
| Interest Paid Net | 55.12 | 0.00 | 55.13 | 0.00 | 56.57 | 0.00 | 2.94 | 2.41 | 3.84 | 2.43 | 4.64 | 2.69 | 5.31 | 4.94 | 1.44 | 1.88 | 0.96 | 0.47 | 0.00 | 0.00 | 0.00 | 0.01 | 0.02 | 0.01 | 0.02 | NA | NA | NA | NA | NA | NA | NA | NA | NA | NA | NA | NA | NA | NA | NA | NA | NA | NA | NA | NA | NA | NA | NA | NA | NA | NA | NA | |
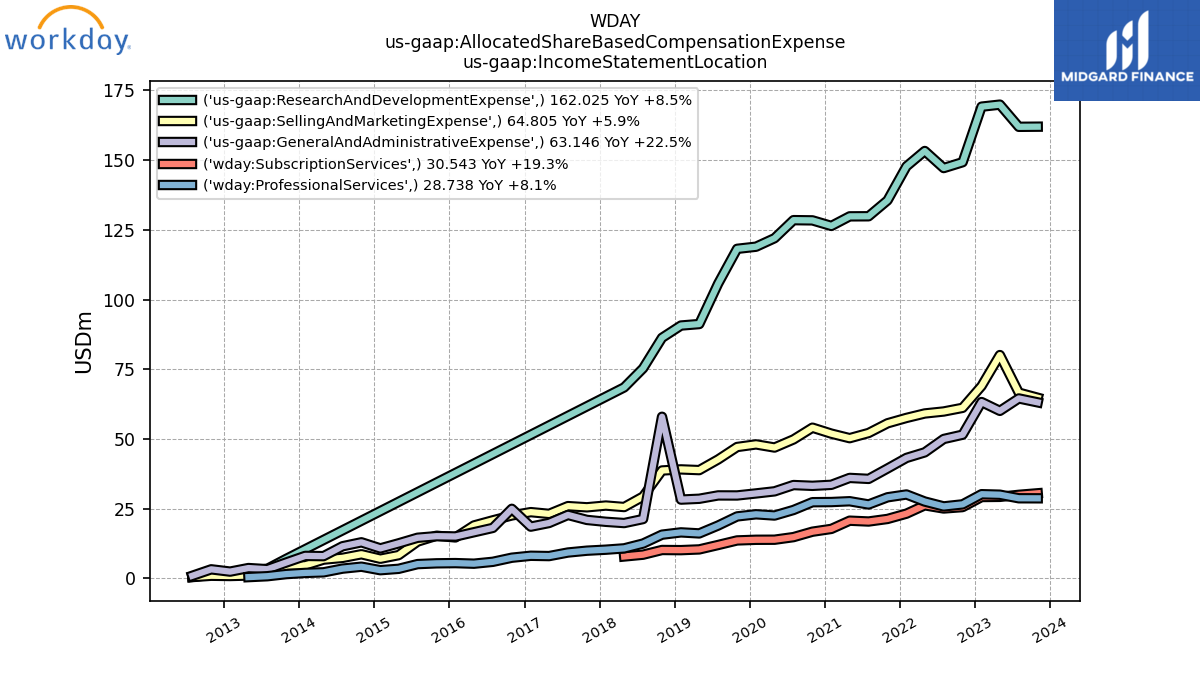
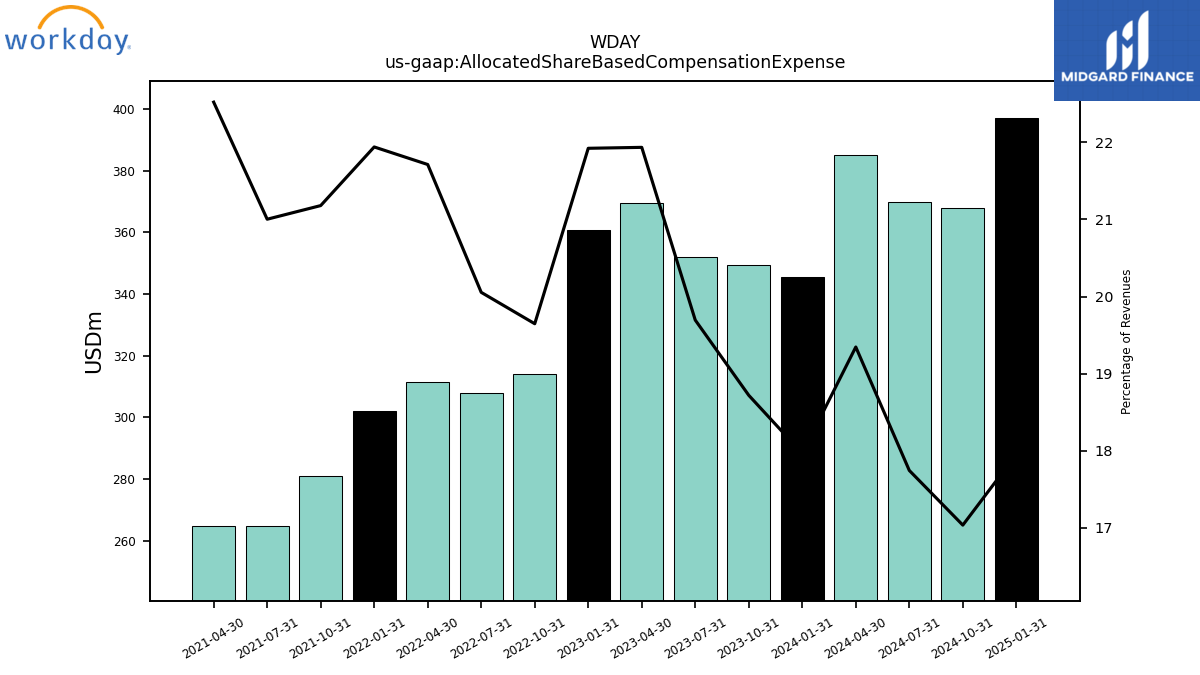
| Allocated Share Based Compensation Expense | 349.26 | 351.91 | 369.46 | 360.91 | 314.20 | 308.01 | 311.51 | 301.93 | 281.12 | 264.72 | 264.63 | NA | NA | NA | NA | NA | NA | NA | NA | NA | NA | NA | NA | NA | NA | NA | NA | NA | NA | NA | NA | NA | NA | NA | NA | NA | NA | NA | NA | NA | NA | NA | NA | NA | NA | NA | NA | NA | NA | NA | NA | NA | |
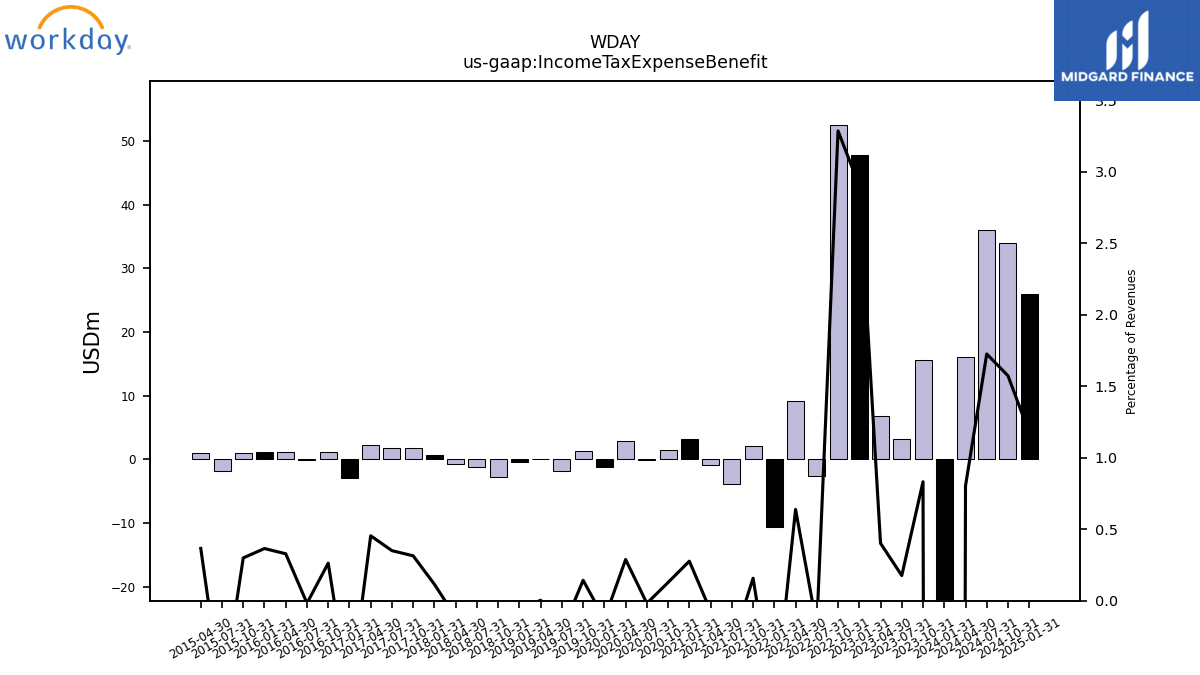
| Income Tax Expense Benefit | 15.53 | 3.15 | 6.77 | 47.78 | 52.56 | -2.71 | 9.17 | -10.57 | 2.09 | -3.87 | -0.84 | 3.13 | 1.42 | -0.19 | 2.94 | -1.25 | 1.34 | -1.89 | 0.03 | -0.49 | -2.81 | -1.21 | -0.70 | 0.67 | 1.75 | 1.84 | 2.18 | -2.96 | 1.08 | -0.07 | 1.14 | 1.18 | 0.92 | -1.92 | 0.92 | NA | NA | NA | NA | NA | NA | NA | NA | NA | NA | NA | NA | NA | NA | NA | NA | NA | |
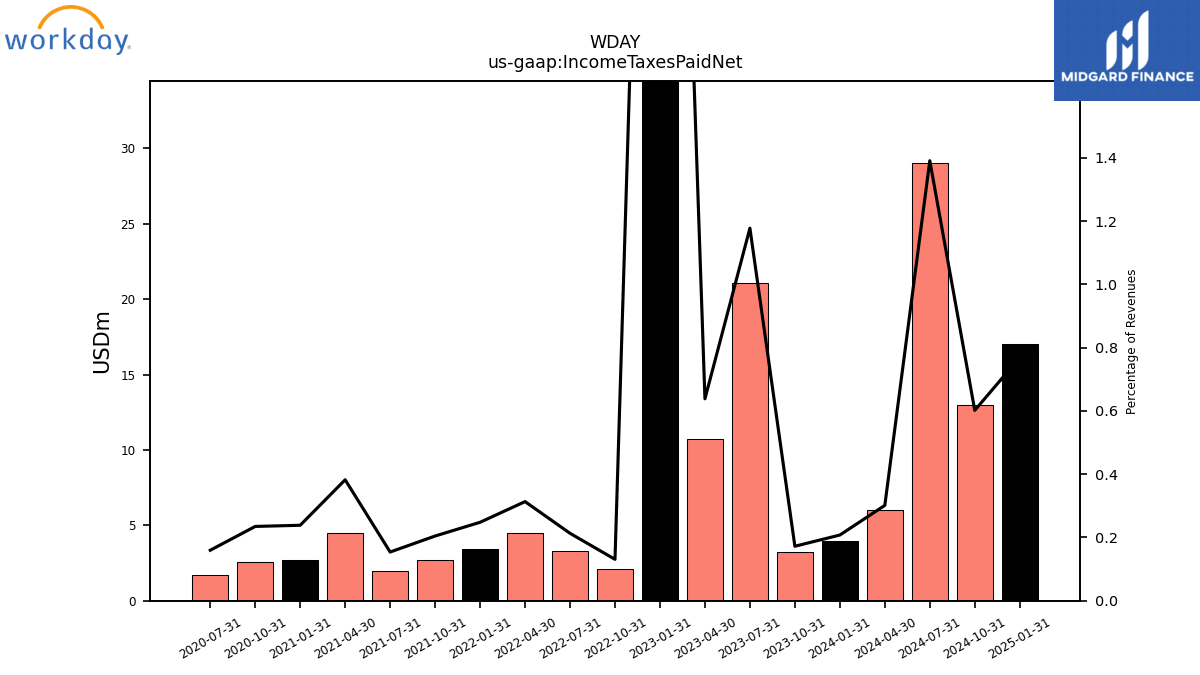
| Income Taxes Paid Net | 3.21 | 21.04 | 10.75 | 78.71 | 2.09 | 3.27 | 4.50 | 3.41 | 2.72 | 1.94 | 4.49 | 2.70 | 2.60 | 1.70 | NA | NA | NA | NA | NA | NA | NA | NA | NA | NA | NA | NA | NA | NA | NA | NA | NA | NA | NA | NA | NA | NA | NA | NA | NA | NA | NA | NA | NA | NA | NA | NA | NA | NA | NA | NA | NA | NA | |
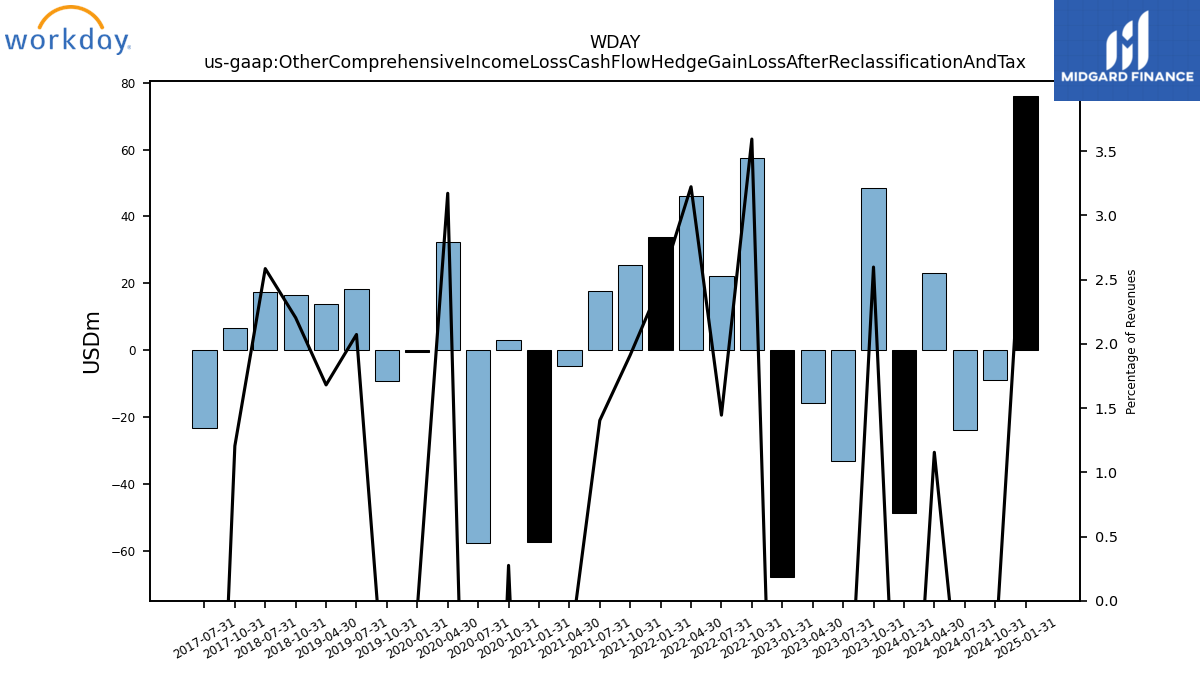
| Other Comprehensive Income Loss Cash Flow Hedge Gain Loss After Reclassification And Tax | 48.47 | -33.09 | -15.71 | -67.83 | 57.48 | 22.19 | 46.25 | 33.94 | 25.39 | 17.70 | -4.77 | -57.47 | 3.04 | -57.84 | 32.31 | -0.58 | -9.21 | 18.40 | 13.87 | NA | 16.38 | 17.37 | NA | NA | 6.69 | -23.40 | NA | NA | NA | NA | NA | NA | NA | NA | NA | NA | NA | NA | NA | NA | NA | NA | NA | NA | NA | NA | NA | NA | NA | NA | NA | NA | |
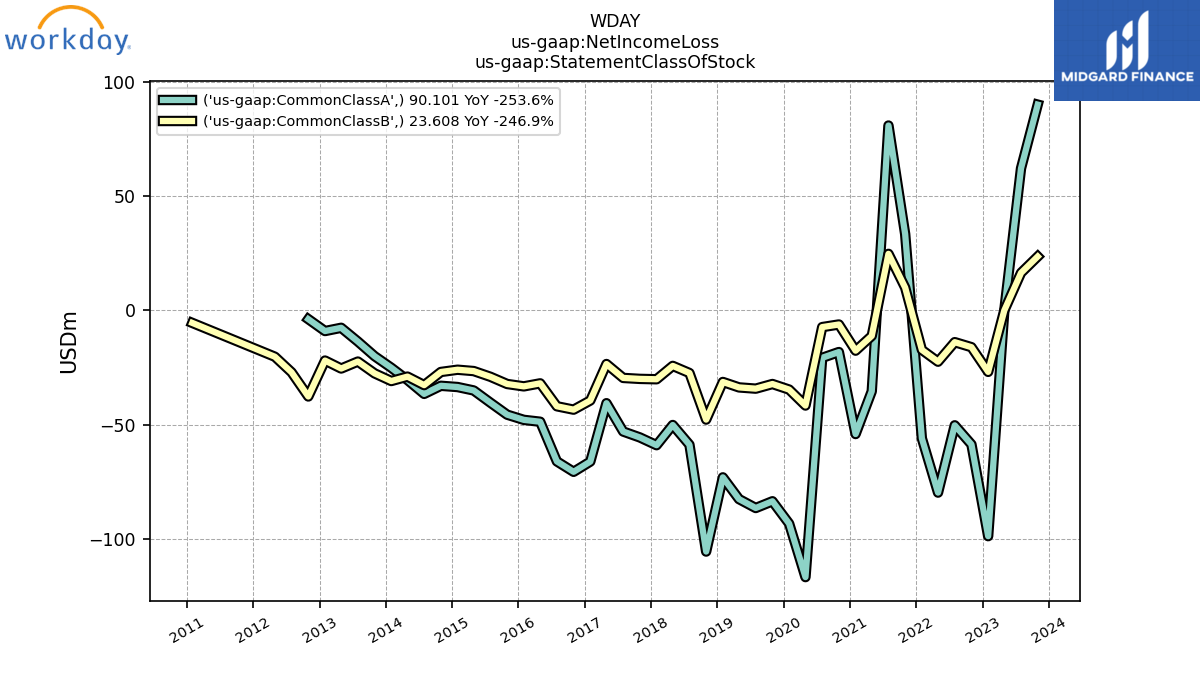
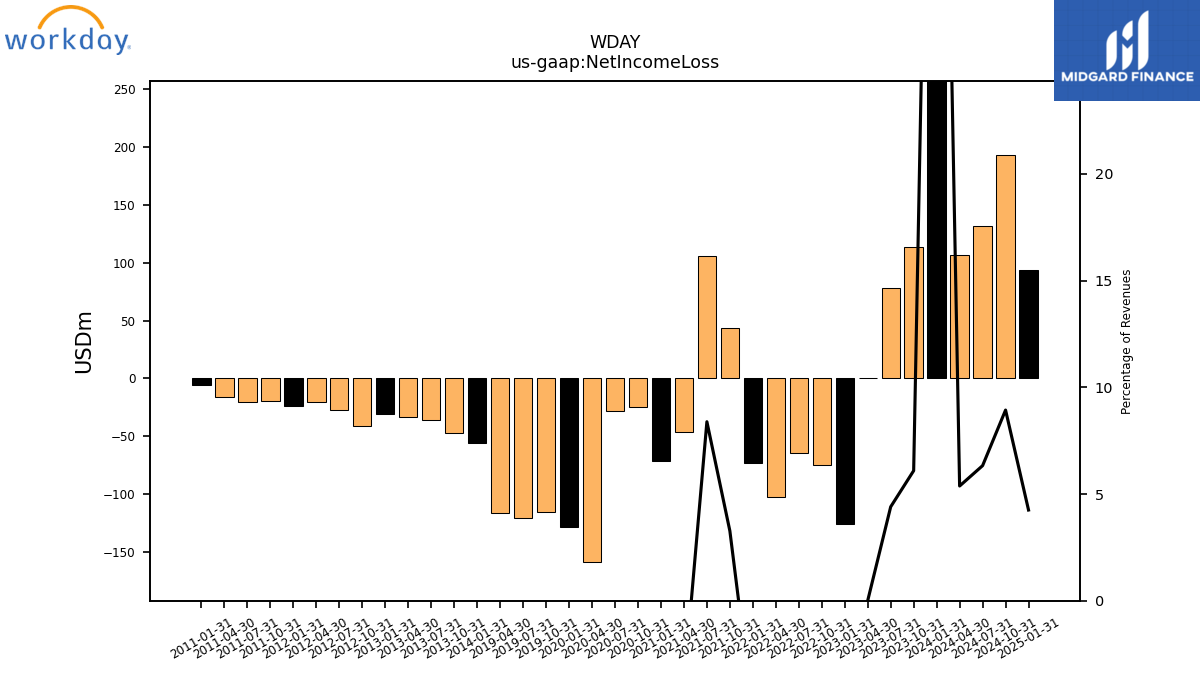
| Net Income Loss | 113.71 | 78.66 | 0.14 | -125.70 | -74.72 | -64.16 | -102.17 | -73.25 | 43.41 | 105.74 | -46.52 | -71.71 | -24.34 | -28.02 | -158.37 | -127.96 | -115.73 | -120.71 | -116.28 | NA | NA | NA | NA | NA | NA | NA | NA | NA | NA | NA | NA | NA | NA | NA | NA | NA | NA | NA | NA | -55.98 | -47.53 | -35.98 | -33.02 | -30.94 | -41.47 | -27.09 | -20.26 | -23.84 | -19.80 | -20.54 | -15.79 | -5.45 | |
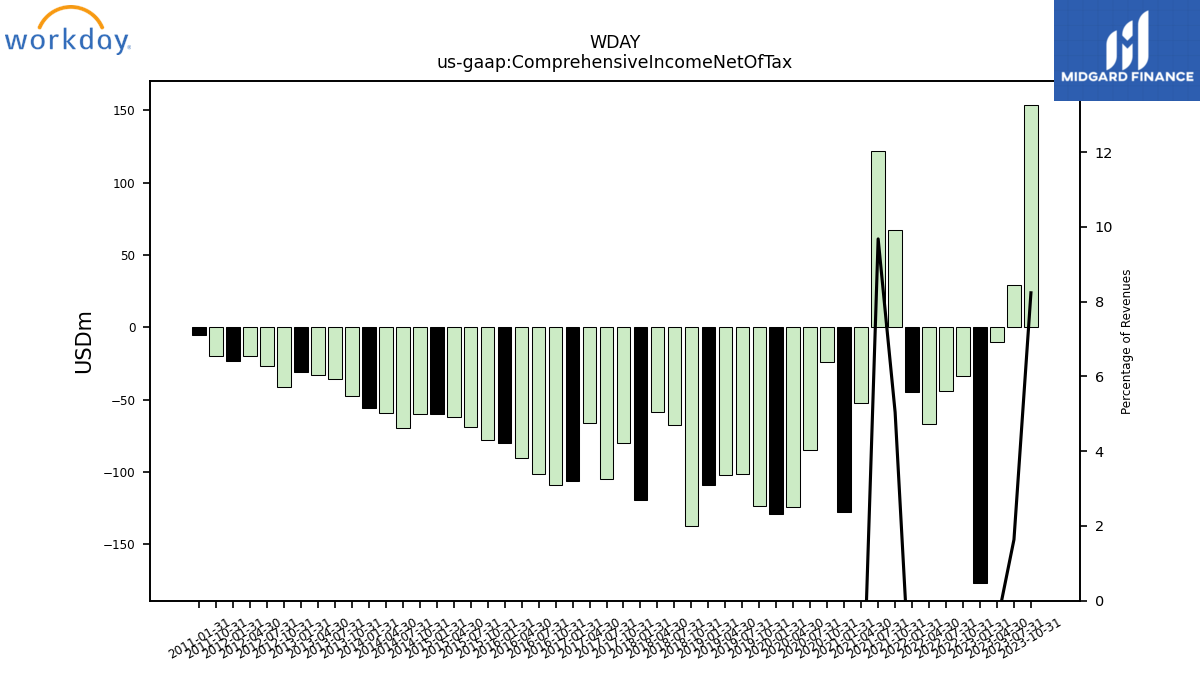
| Comprehensive Income Net Of Tax | 153.70 | 29.23 | -10.27 | -176.76 | -33.57 | -44.31 | -66.77 | -44.92 | 66.94 | 122.01 | -51.97 | -127.79 | -23.88 | -84.90 | -124.33 | -129.09 | -123.57 | -101.37 | -102.35 | -108.94 | -137.13 | -67.82 | -58.76 | -119.20 | -79.66 | -104.54 | -66.31 | -106.12 | -108.86 | -101.58 | -90.45 | -80.28 | -78.19 | -68.82 | -61.70 | -59.67 | -59.81 | -69.73 | -59.18 | -55.90 | -47.46 | -35.93 | -33.02 | -30.91 | -41.30 | -26.88 | -20.04 | -23.59 | -19.73 | NA | NA | -5.45 |
| 2023-10-31 | 2023-07-31 | 2023-04-30 | 2023-01-31 | 2022-10-31 | 2022-07-31 | 2022-04-30 | 2022-01-31 | 2021-10-31 | 2021-07-31 | 2021-04-30 | 2021-01-31 | 2020-10-31 | 2020-07-31 | 2020-04-30 | 2020-01-31 | 2019-10-31 | 2019-07-31 | 2019-04-30 | 2019-01-31 | 2018-10-31 | 2018-07-31 | 2018-04-30 | 2018-01-31 | 2017-10-31 | 2017-07-31 | 2017-04-30 | 2017-01-31 | 2016-10-31 | 2016-07-31 | 2016-04-30 | 2016-01-31 | 2015-10-31 | 2015-07-31 | 2015-04-30 | 2015-01-31 | 2014-10-31 | 2014-07-31 | 2014-04-30 | 2014-01-31 | 2013-10-31 | 2013-07-31 | 2013-04-30 | 2013-01-31 | 2012-10-31 | 2012-07-31 | 2012-04-30 | 2012-01-31 | 2011-10-31 | 2011-07-31 | 2011-04-30 | 2011-01-31 | ||
|---|---|---|---|---|---|---|---|---|---|---|---|---|---|---|---|---|---|---|---|---|---|---|---|---|---|---|---|---|---|---|---|---|---|---|---|---|---|---|---|---|---|---|---|---|---|---|---|---|---|---|---|---|---|
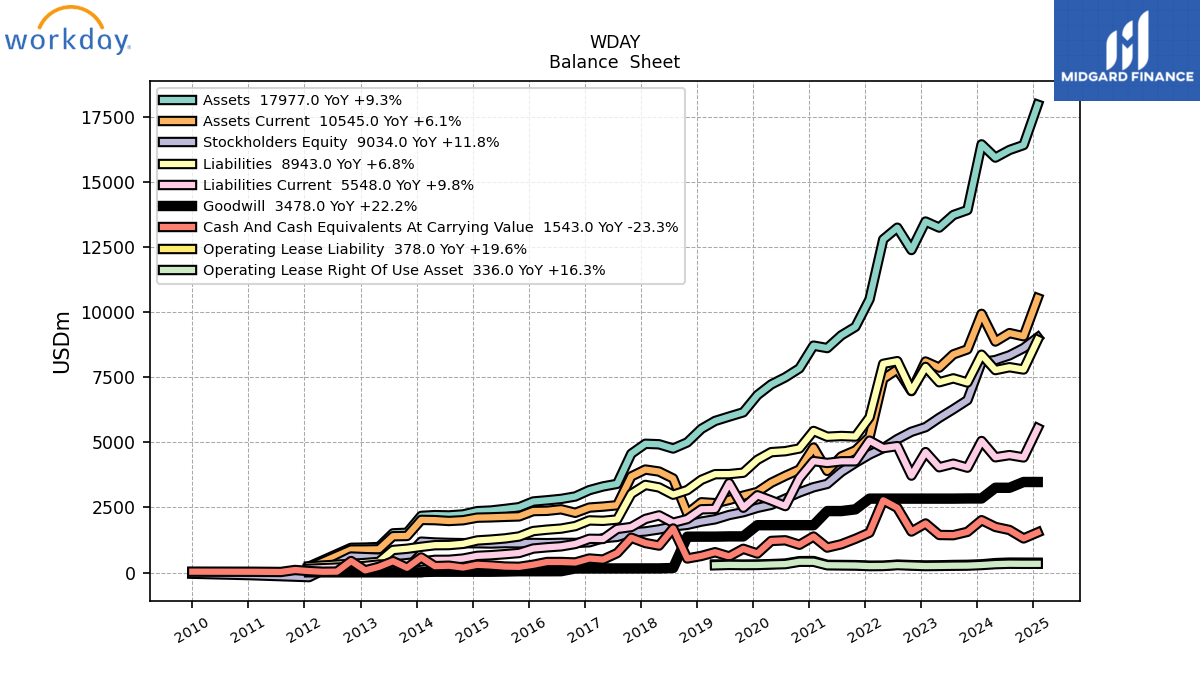
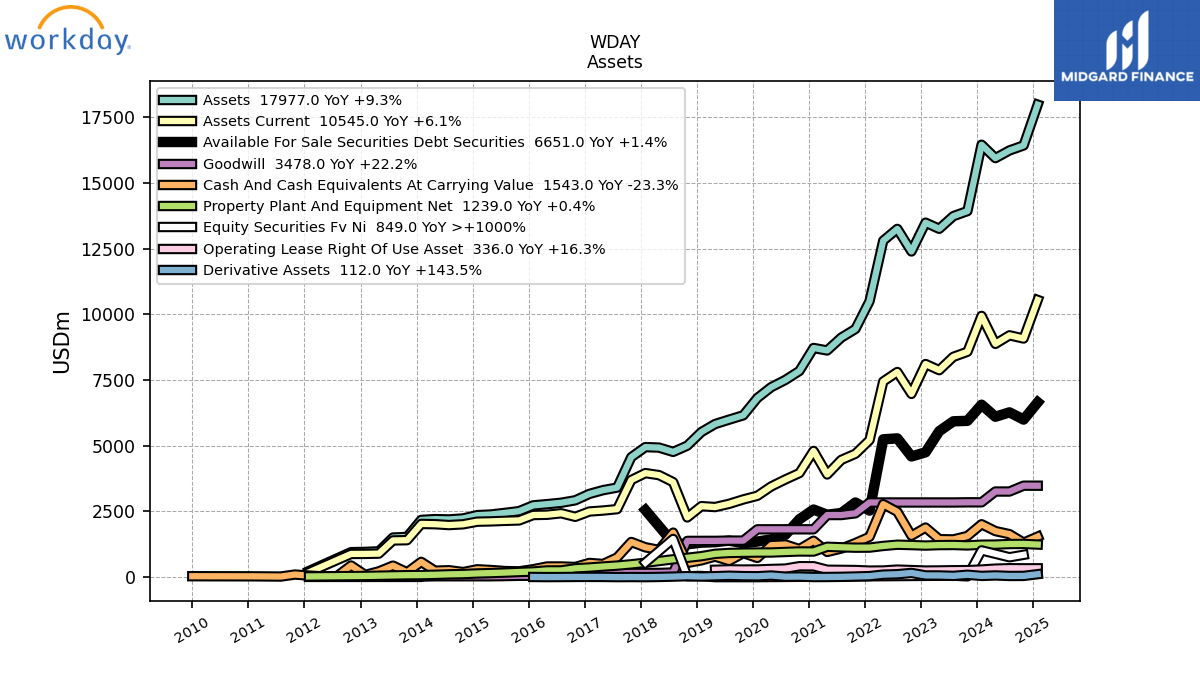
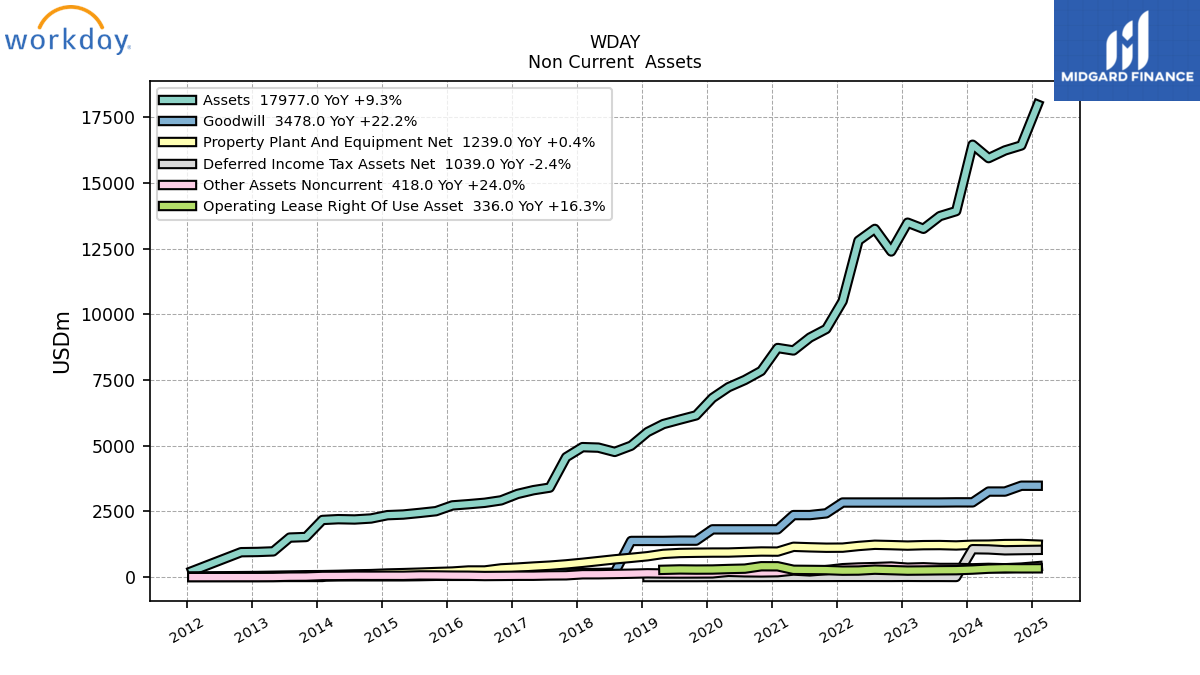
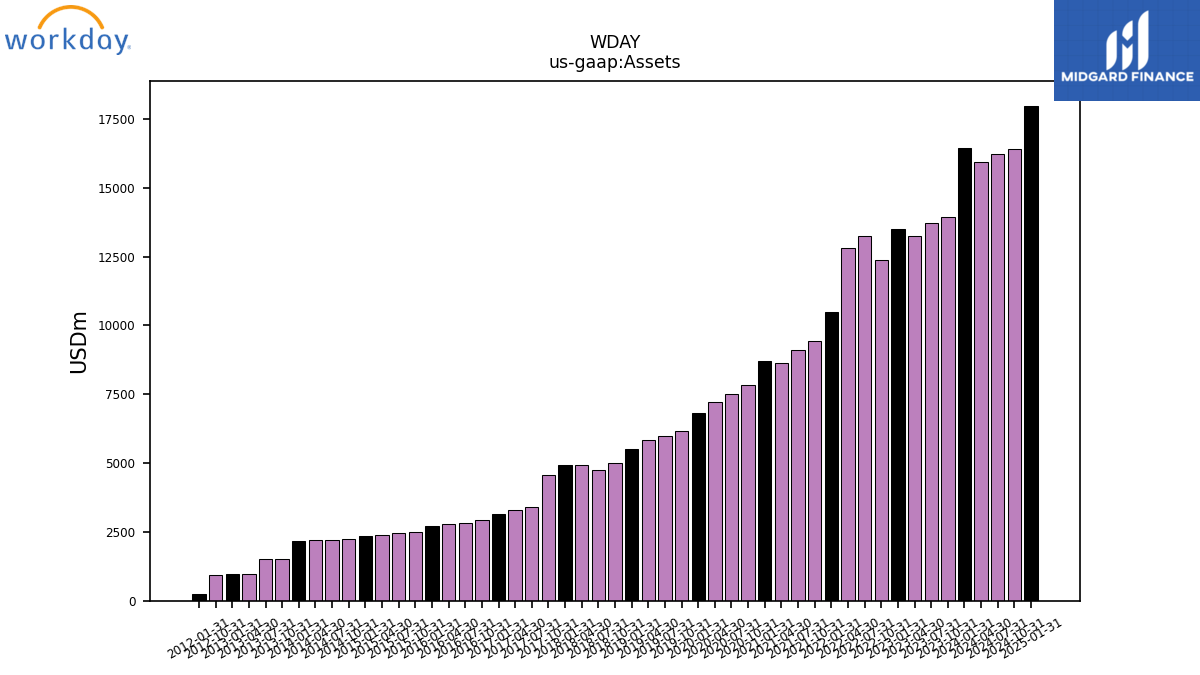
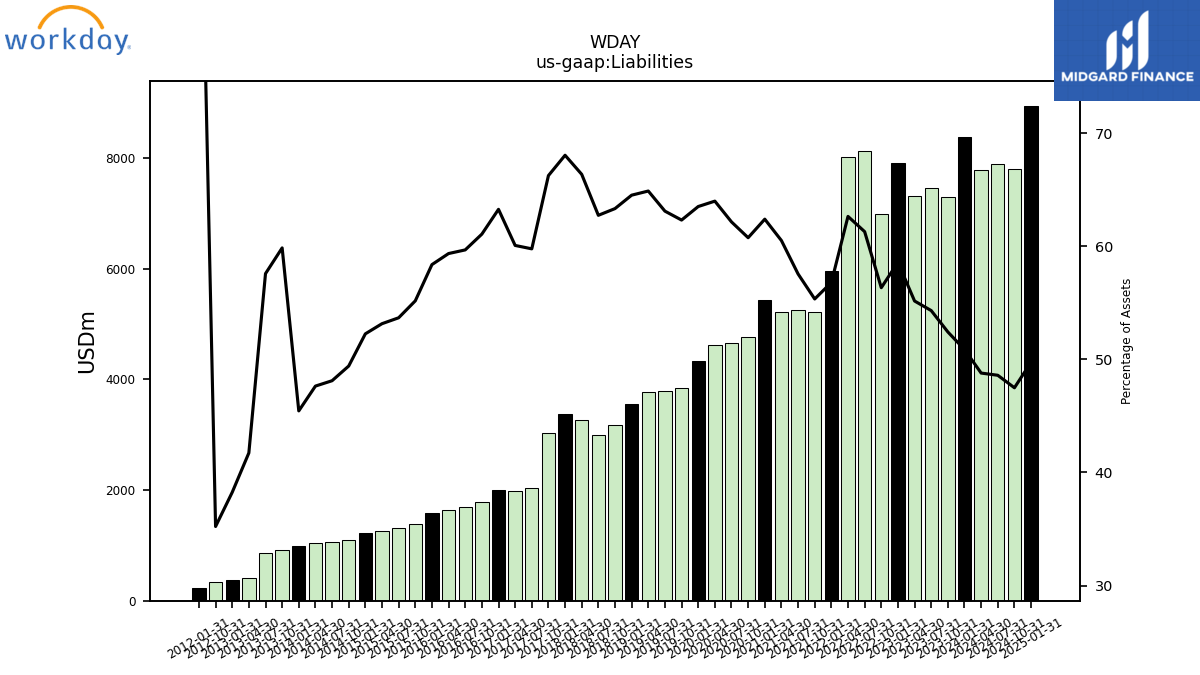
| Assets | 13925.93 | 13735.32 | 13252.80 | 13486.24 | 12389.79 | 13249.55 | 12799.11 | 10498.50 | 9440.88 | 9113.84 | 8624.01 | 8718.41 | 7845.03 | 7501.45 | 7227.50 | 6816.36 | 6155.65 | 5992.16 | 5824.17 | 5520.75 | 5000.30 | 4765.06 | 4927.83 | 4947.42 | 4564.72 | 3407.13 | 3308.74 | 3166.42 | 2922.57 | 2829.80 | 2776.15 | 2730.09 | 2511.15 | 2443.88 | 2382.56 | 2358.63 | 2232.32 | 2194.90 | 2206.69 | 2176.26 | 1528.18 | 1505.97 | 981.25 | 959.08 | 950.15 | NA | NA | 232.64 | NA | NA | NA | NA | |
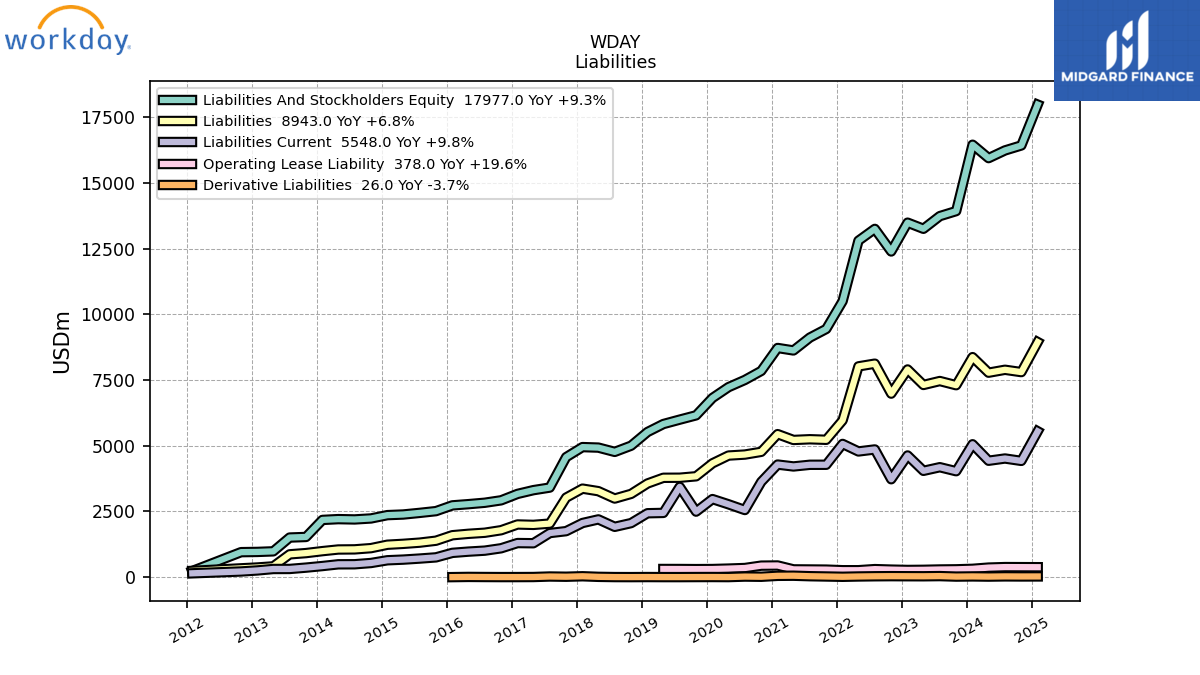
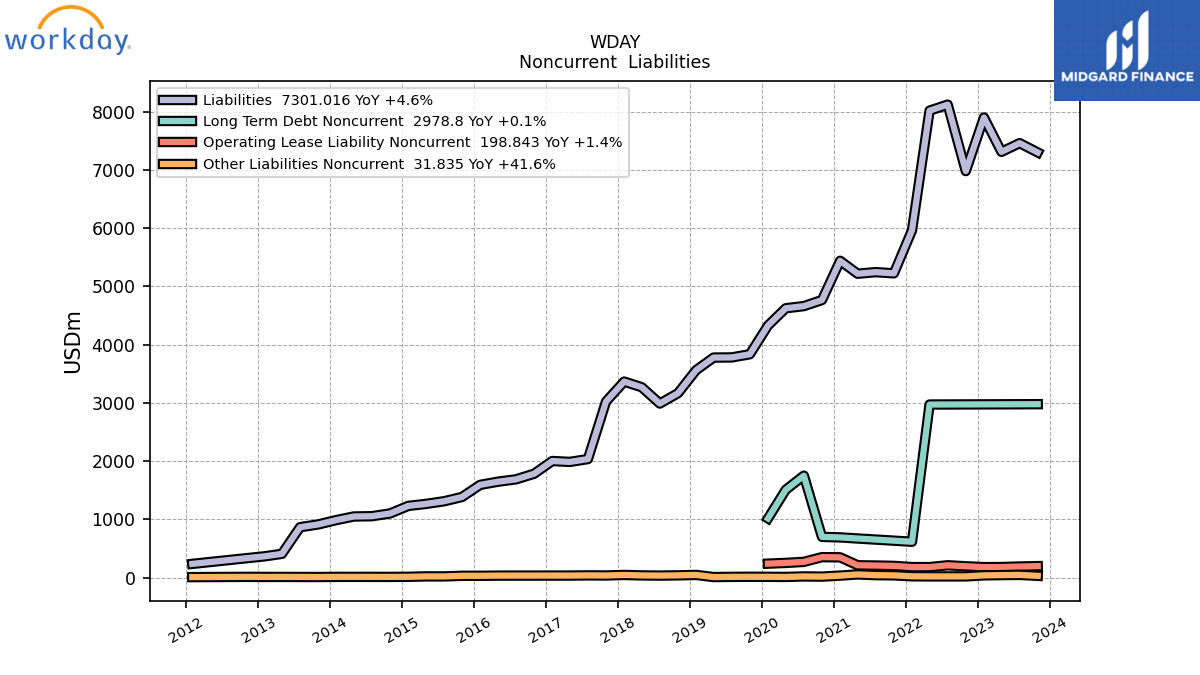
| Liabilities | 7301.02 | 7460.76 | 7310.93 | 7900.67 | 6980.68 | 8121.74 | 8018.30 | 5963.42 | 5225.07 | 5245.85 | 5218.57 | 5440.58 | 4766.97 | 4662.97 | 4625.50 | 4329.81 | 3836.47 | 3781.87 | 3779.43 | 3562.30 | 3167.15 | 2989.84 | 3270.53 | 3367.06 | 3024.44 | 2036.73 | 1987.88 | 2003.52 | 1785.11 | 1688.96 | 1648.00 | 1593.94 | 1385.63 | 1311.91 | 1266.53 | 1232.66 | 1103.10 | 1056.06 | 1051.25 | 989.05 | 914.78 | 867.23 | 409.47 | 366.80 | 334.65 | NA | NA | 237.29 | NA | NA | NA | NA | |
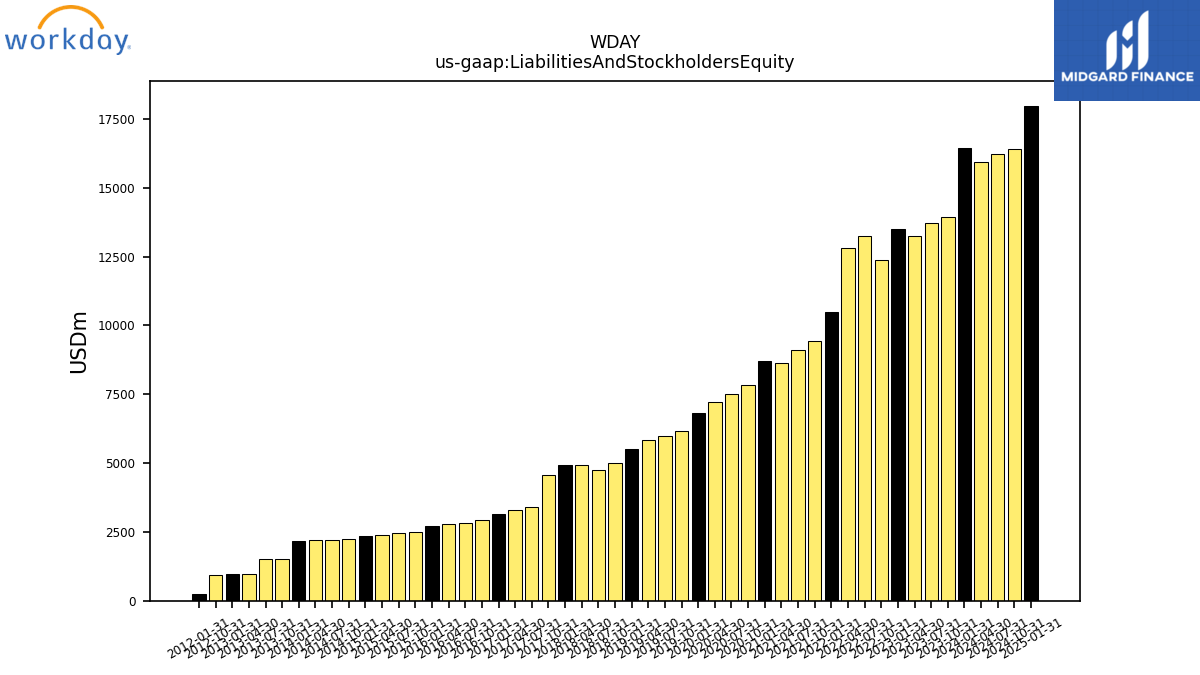
| Liabilities And Stockholders Equity | 13925.93 | 13735.32 | 13252.80 | 13486.24 | 12389.79 | 13249.55 | 12799.11 | 10498.50 | 9440.88 | 9113.84 | 8624.01 | 8718.41 | 7845.03 | 7501.45 | 7227.50 | 6816.36 | 6155.65 | 5992.16 | 5824.17 | 5520.75 | 5000.30 | 4765.06 | 4927.83 | 4947.42 | 4564.72 | 3407.13 | 3308.74 | 3166.42 | 2922.57 | 2829.80 | 2776.15 | 2730.09 | 2511.15 | 2443.88 | 2382.56 | 2358.63 | 2232.32 | 2194.90 | 2206.69 | 2176.26 | 1528.18 | 1505.97 | 981.25 | 959.08 | 950.15 | NA | NA | 232.64 | NA | NA | NA | NA | |
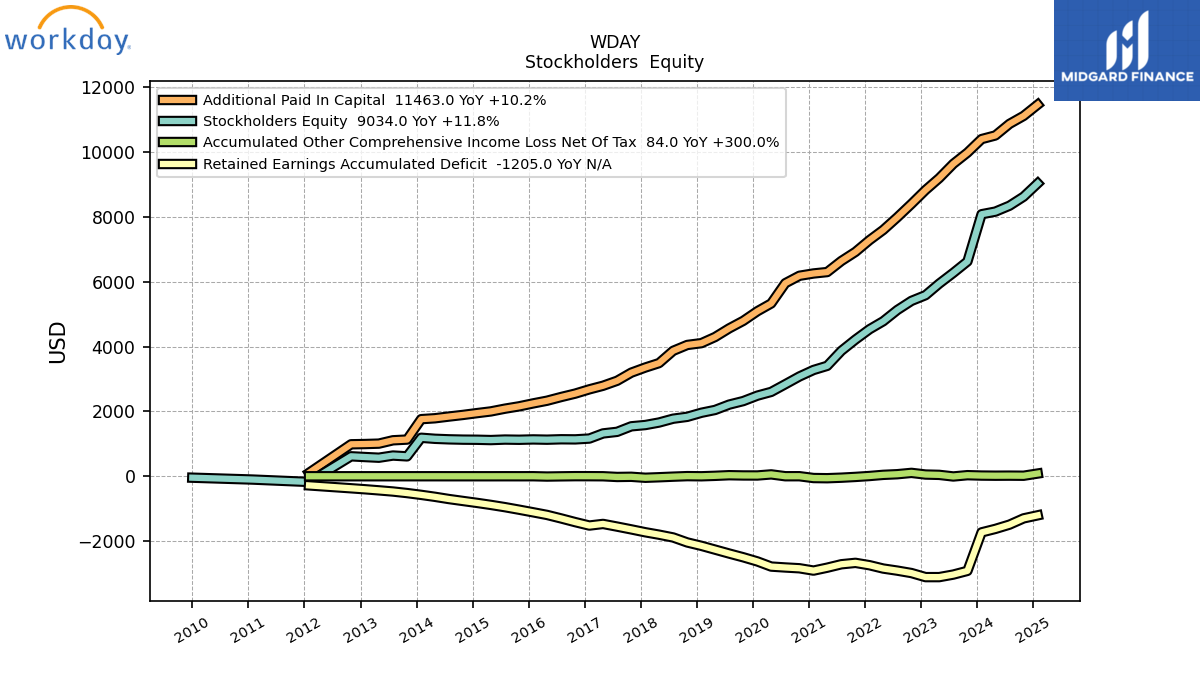
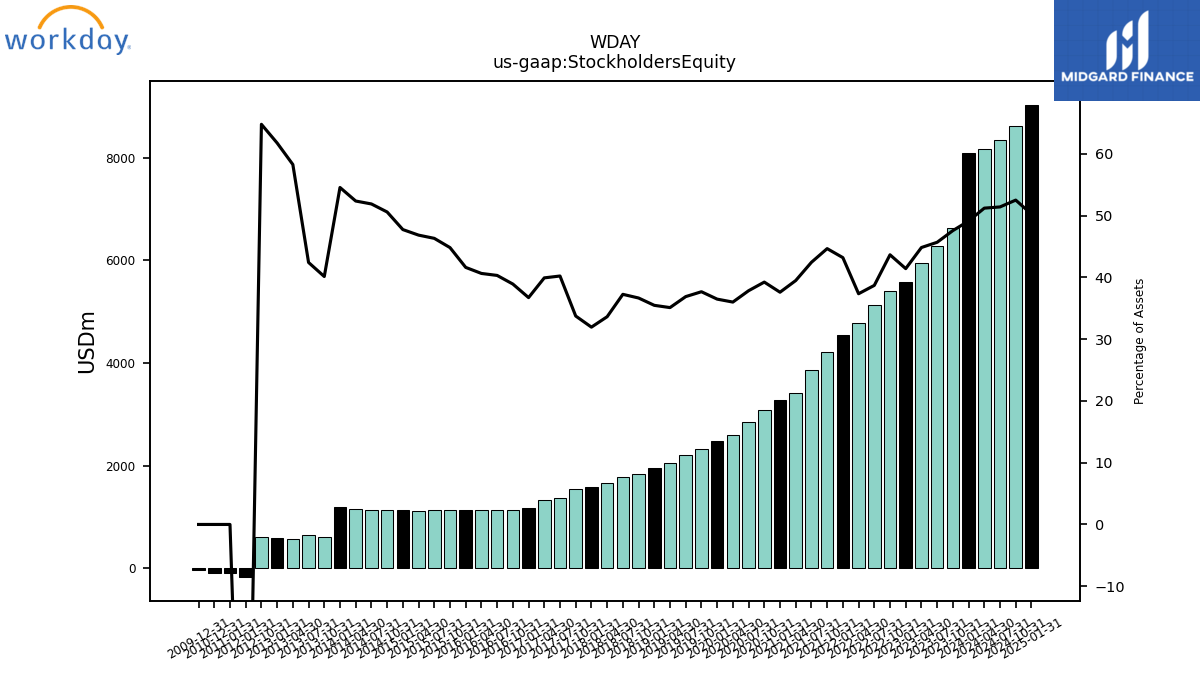
| Stockholders Equity | 6624.92 | 6274.55 | 5941.86 | 5585.57 | 5409.11 | 5127.81 | 4780.81 | 4535.08 | 4215.82 | 3867.99 | 3405.44 | 3277.83 | 3078.05 | 2838.48 | 2602.00 | 2486.55 | 2319.18 | 2210.28 | 2044.75 | 1958.44 | 1833.15 | 1775.22 | 1657.30 | 1580.37 | 1540.27 | 1370.40 | 1320.86 | 1162.91 | 1137.46 | 1140.85 | 1128.16 | 1136.16 | 1125.53 | 1131.97 | 1116.03 | 1125.97 | 1129.22 | 1138.84 | 1155.44 | 1187.22 | 613.40 | 638.74 | 571.78 | 592.28 | 615.50 | NA | NA | -175.56 | NA | NA | NA | -102.71 |
| 2023-10-31 | 2023-07-31 | 2023-04-30 | 2023-01-31 | 2022-10-31 | 2022-07-31 | 2022-04-30 | 2022-01-31 | 2021-10-31 | 2021-07-31 | 2021-04-30 | 2021-01-31 | 2020-10-31 | 2020-07-31 | 2020-04-30 | 2020-01-31 | 2019-10-31 | 2019-07-31 | 2019-04-30 | 2019-01-31 | 2018-10-31 | 2018-07-31 | 2018-04-30 | 2018-01-31 | 2017-10-31 | 2017-07-31 | 2017-04-30 | 2017-01-31 | 2016-10-31 | 2016-07-31 | 2016-04-30 | 2016-01-31 | 2015-10-31 | 2015-07-31 | 2015-04-30 | 2015-01-31 | 2014-10-31 | 2014-07-31 | 2014-04-30 | 2014-01-31 | 2013-10-31 | 2013-07-31 | 2013-04-30 | 2013-01-31 | 2012-10-31 | 2012-07-31 | 2012-04-30 | 2012-01-31 | 2011-10-31 | 2011-07-31 | 2011-04-30 | 2011-01-31 | ||
|---|---|---|---|---|---|---|---|---|---|---|---|---|---|---|---|---|---|---|---|---|---|---|---|---|---|---|---|---|---|---|---|---|---|---|---|---|---|---|---|---|---|---|---|---|---|---|---|---|---|---|---|---|---|
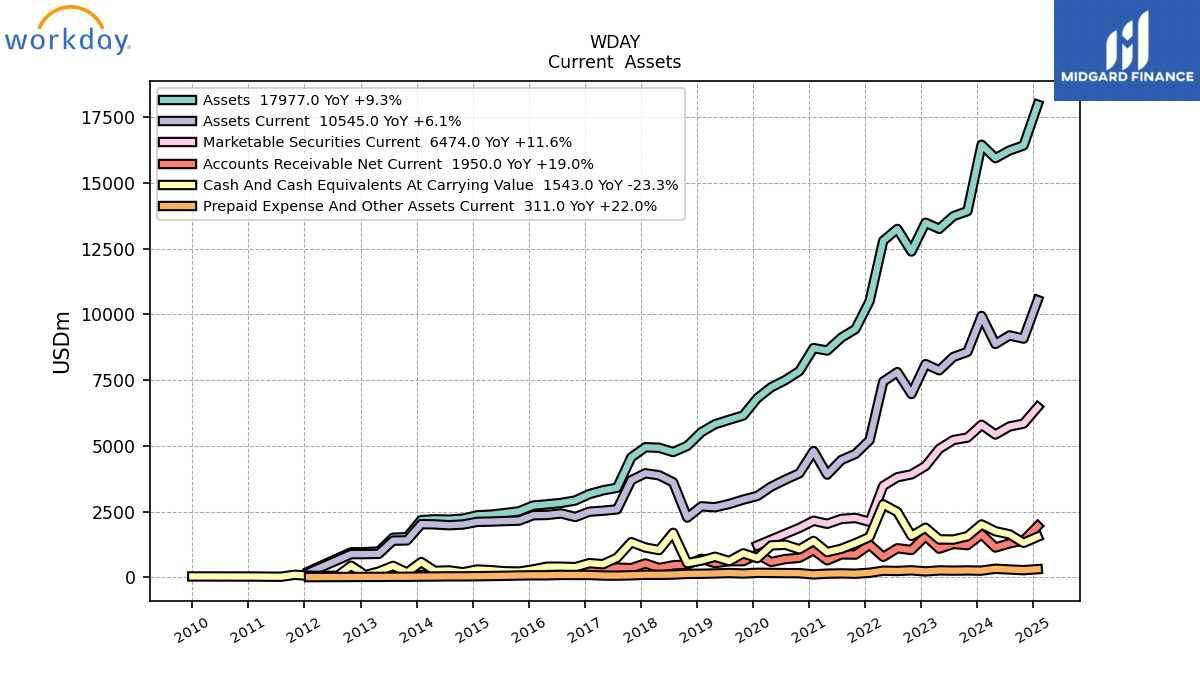
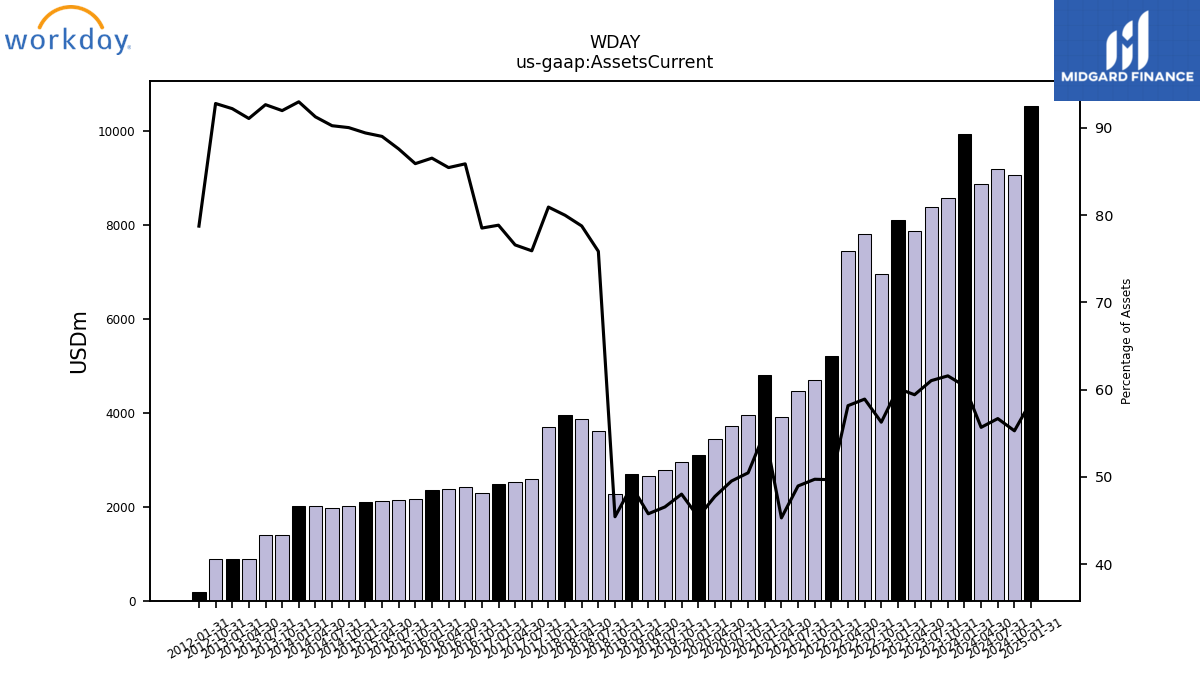
| Assets Current | 8574.16 | 8381.69 | 7873.09 | 8108.22 | 6970.27 | 7804.66 | 7443.23 | 5214.06 | 4693.71 | 4461.11 | 3905.80 | 4802.06 | 3958.24 | 3714.18 | 3450.37 | 3094.62 | 2955.42 | 2789.03 | 2665.13 | 2700.60 | 2271.28 | 3614.04 | 3880.81 | 3956.98 | 3693.77 | 2586.22 | 2533.82 | 2496.53 | 2294.59 | 2430.09 | 2372.13 | 2362.31 | 2157.07 | 2140.53 | 2120.99 | 2109.04 | 2009.75 | 1980.81 | 2013.89 | 2023.66 | 1405.60 | 1395.39 | 893.68 | 884.30 | 881.65 | NA | NA | 183.17 | NA | NA | NA | NA | |
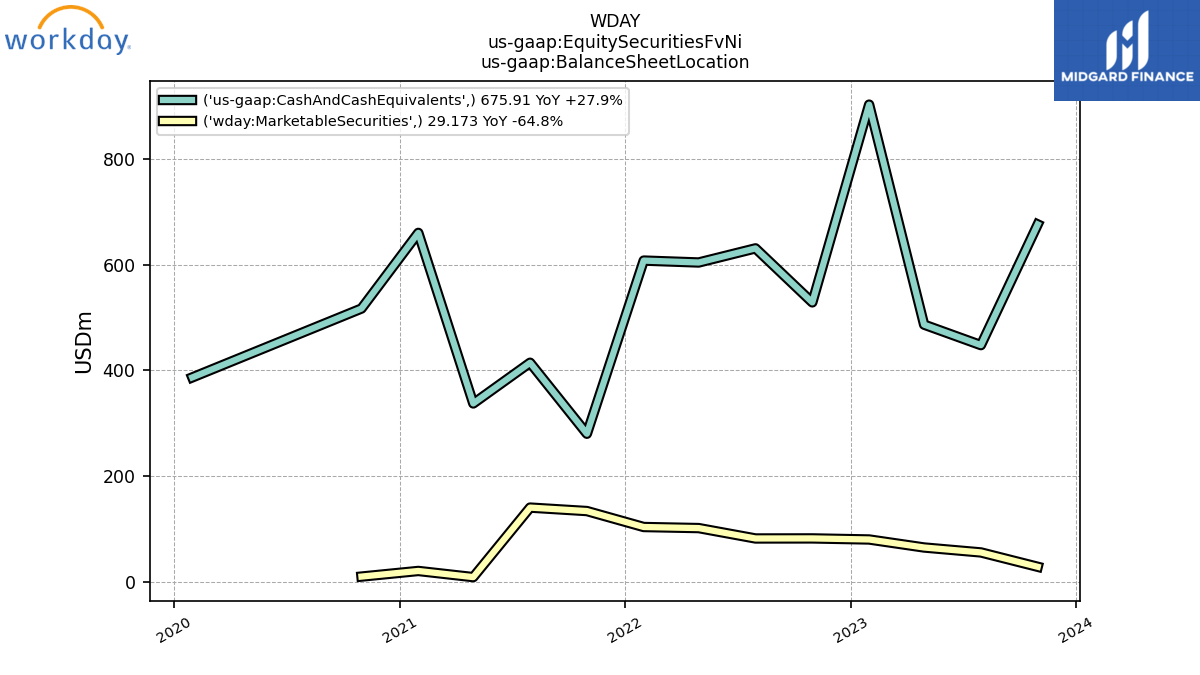
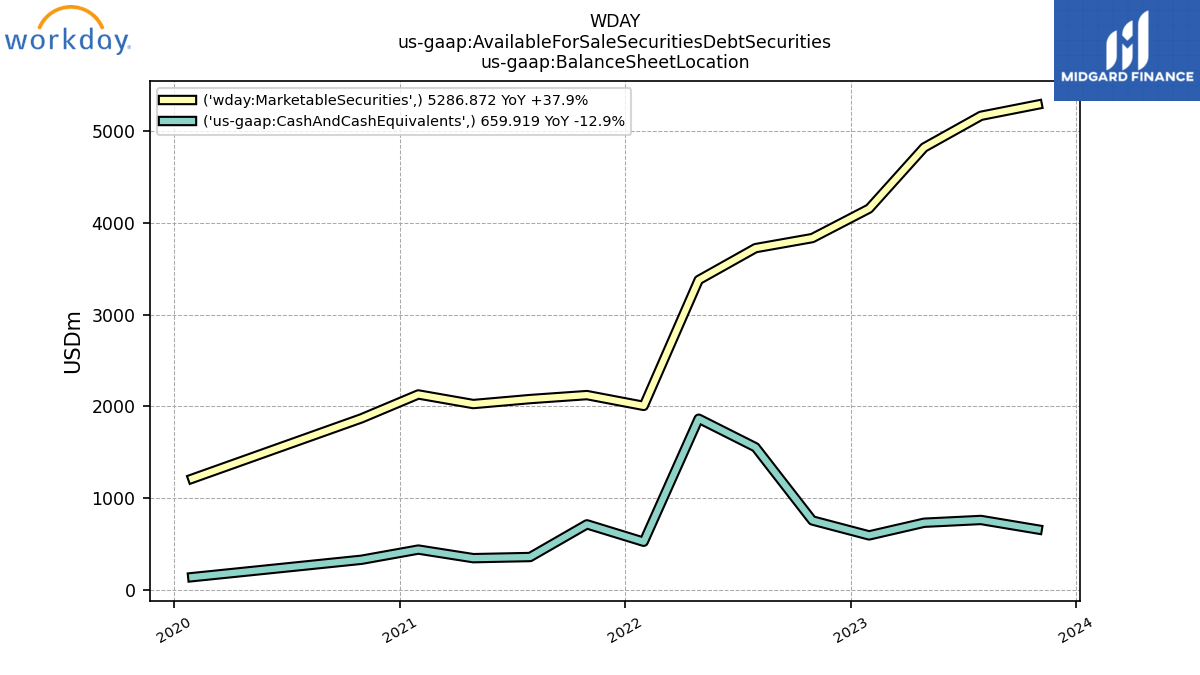
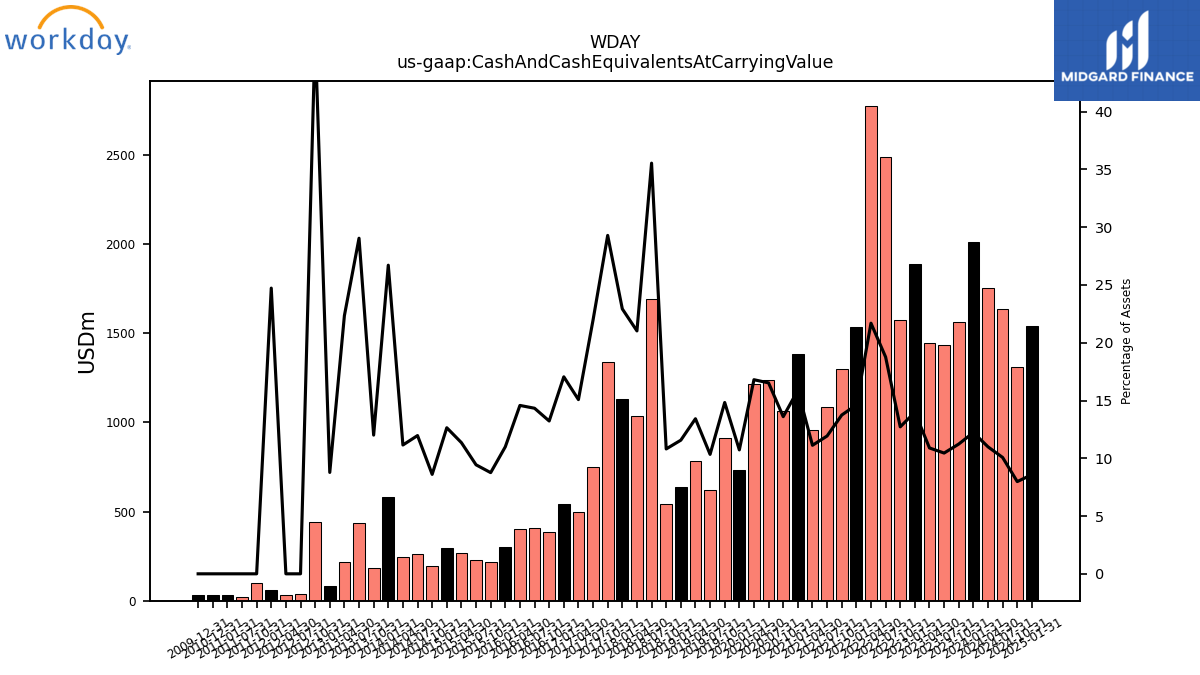
| Cash And Cash Equivalents At Carrying Value | 1563.94 | 1435.69 | 1443.65 | 1886.31 | 1575.95 | 2486.54 | 2776.34 | 1534.27 | 1297.26 | 1087.07 | 959.36 | 1384.18 | 1067.04 | 1239.70 | 1214.21 | 731.14 | 912.75 | 619.51 | 781.77 | 638.55 | 540.43 | 1693.74 | 1036.05 | 1134.36 | 1336.98 | 748.60 | 498.93 | 539.92 | 386.56 | 405.53 | 404.60 | 300.09 | 219.89 | 230.58 | 270.48 | 298.19 | 192.14 | 262.63 | 246.00 | 581.33 | 183.46 | 437.43 | 219.26 | 84.16 | 442.98 | 36.74 | 29.54 | 57.53 | 98.05 | 22.41 | NA | 30.51 | |
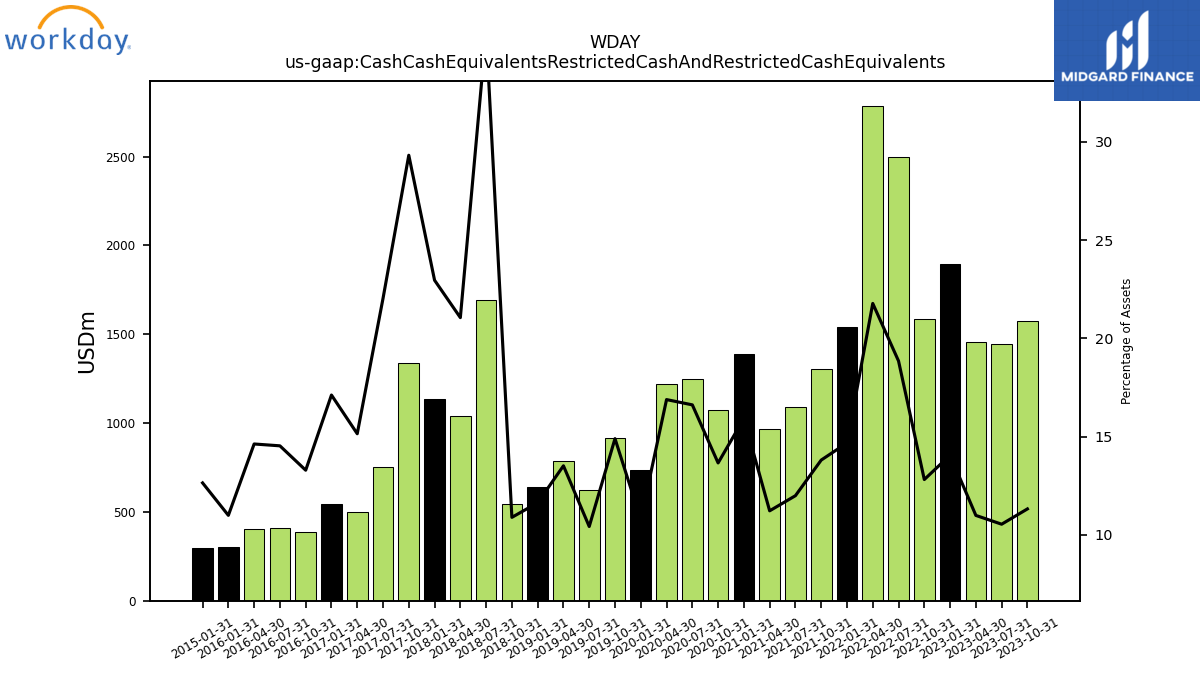
| Cash Cash Equivalents Restricted Cash And Restricted Cash Equivalents | 1576.26 | 1447.83 | 1456.29 | 1895.24 | 1587.65 | 2497.04 | 2786.74 | 1540.74 | 1303.25 | 1092.93 | 967.81 | 1387.92 | 1071.52 | 1246.25 | 1220.12 | 734.72 | 916.86 | 624.65 | 787.05 | 642.20 | 544.53 | 1695.82 | 1037.43 | 1135.65 | 1338.10 | 750.53 | 501.10 | 541.89 | 388.37 | 411.14 | 405.95 | 300.09 | NA | NA | NA | 298.19 | NA | NA | NA | NA | NA | NA | NA | NA | NA | NA | NA | NA | NA | NA | NA | NA | |
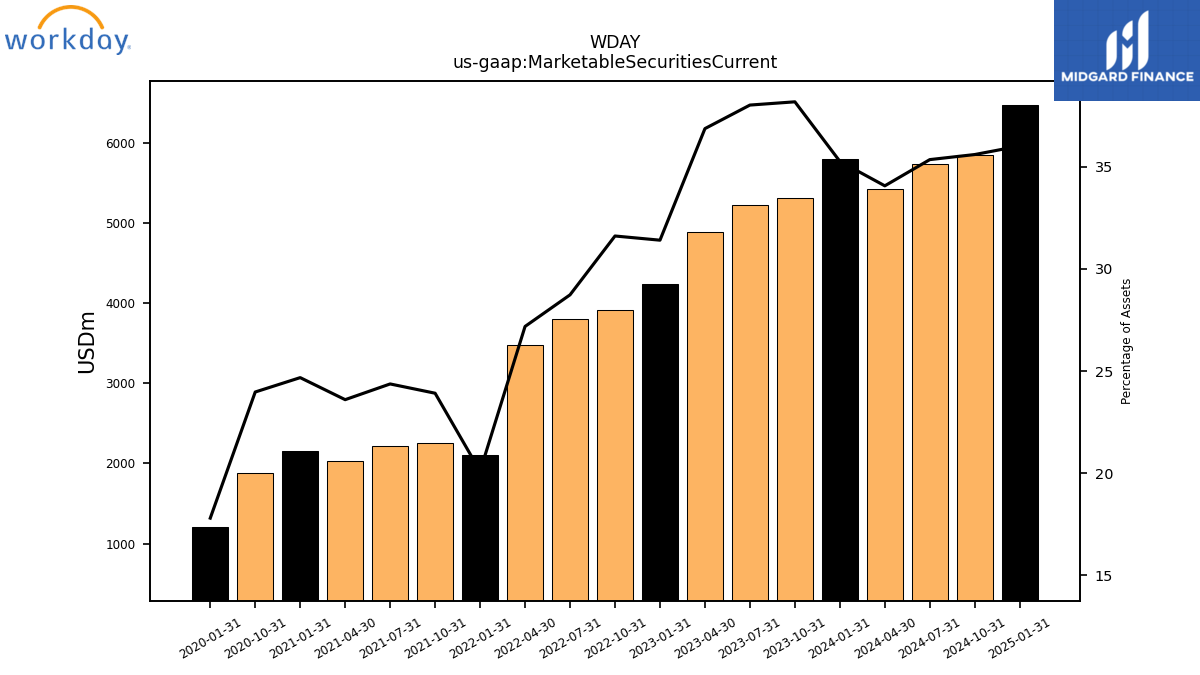
| Marketable Securities Current | 5316.05 | 5221.40 | 4885.31 | 4235.08 | 3916.13 | 3806.43 | 3479.02 | 2109.89 | 2257.72 | 2220.89 | 2035.17 | 2151.47 | 1880.77 | NA | NA | 1213.43 | NA | NA | NA | NA | NA | NA | NA | NA | NA | NA | NA | NA | NA | NA | NA | NA | NA | NA | NA | NA | NA | NA | NA | NA | NA | NA | NA | NA | NA | NA | NA | NA | NA | NA | NA | NA | |
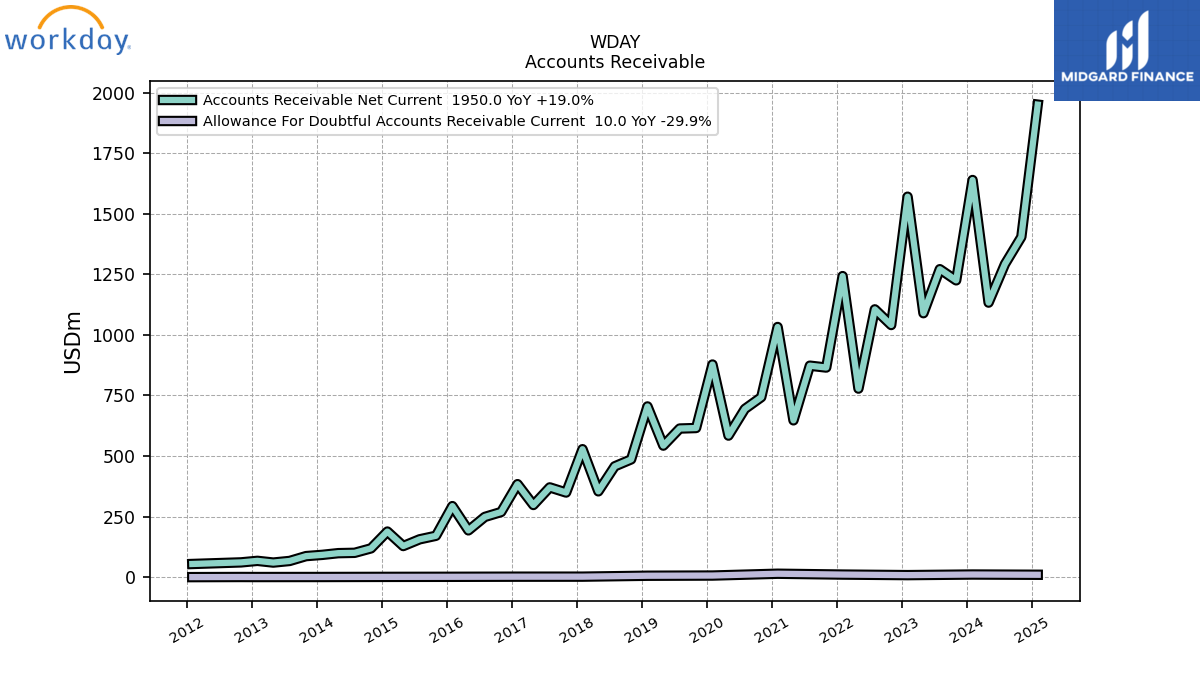
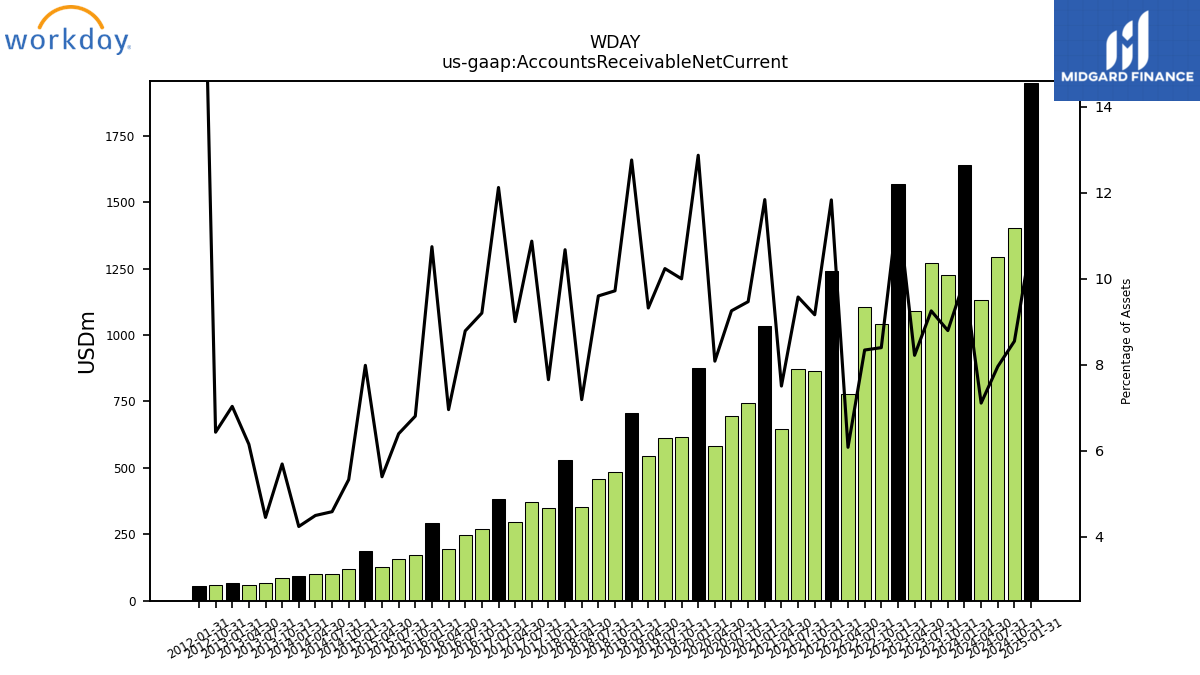
| Accounts Receivable Net Current | 1224.82 | 1270.94 | 1089.29 | 1570.09 | 1040.47 | 1105.29 | 778.08 | 1242.55 | 865.04 | 872.76 | 647.16 | 1032.48 | 742.74 | 694.29 | 584.22 | 877.58 | 615.51 | 613.42 | 542.84 | 704.68 | 486.04 | 457.50 | 354.21 | 528.21 | 349.31 | 370.56 | 297.89 | 383.91 | 268.94 | 248.66 | 193.10 | 293.41 | 170.85 | 156.28 | 128.49 | 188.36 | 118.94 | 100.53 | 99.14 | 92.18 | 86.96 | 66.97 | 60.34 | 67.44 | 61.10 | NA | NA | 54.47 | NA | NA | NA | NA | |
| Prepaid Expense And Other Assets Current | 261.80 | 254.99 | 262.88 | 225.69 | 266.62 | 241.39 | 252.99 | 174.40 | 137.86 | 150.29 | 140.28 | 111.16 | 157.66 | 161.00 | 166.64 | 172.01 | 145.46 | 163.53 | 148.06 | 136.69 | 132.49 | 105.17 | 97.36 | 97.86 | 77.04 | 63.86 | 68.41 | 88.34 | 88.79 | 90.86 | 77.41 | 77.62 | 70.38 | 58.41 | 50.60 | 42.50 | 37.12 | 37.83 | 32.10 | 28.45 | 21.59 | 22.44 | 17.52 | 16.71 | 14.54 | NA | NA | 8.09 | NA | NA | NA | NA | |
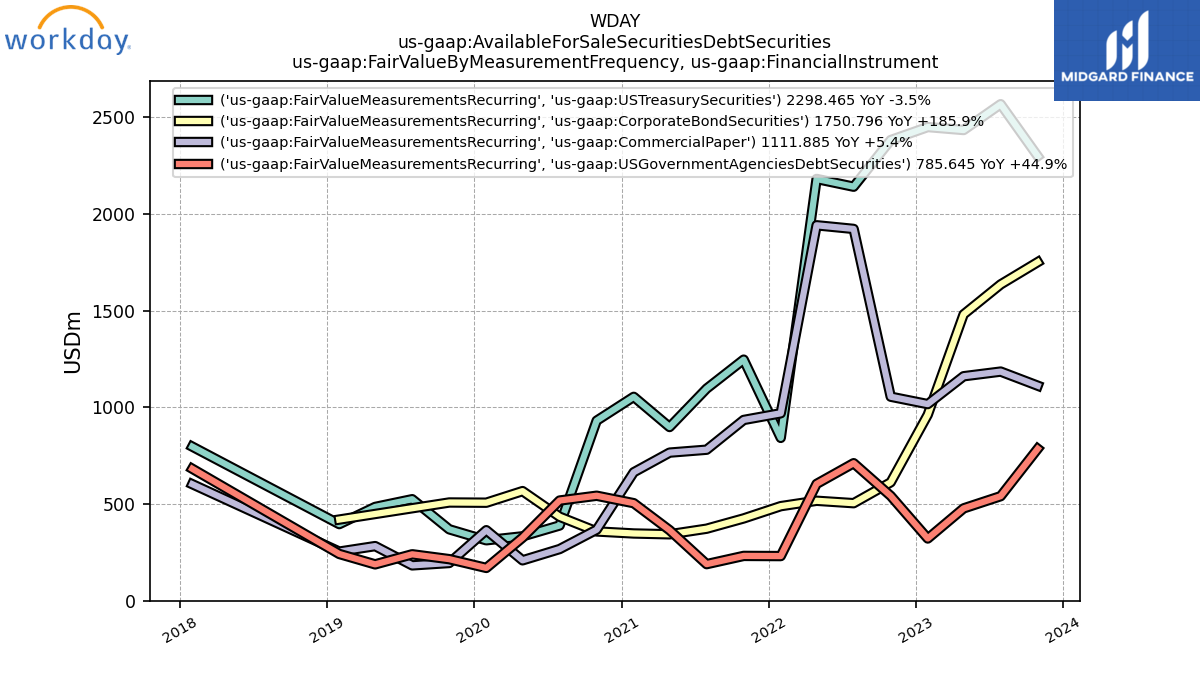
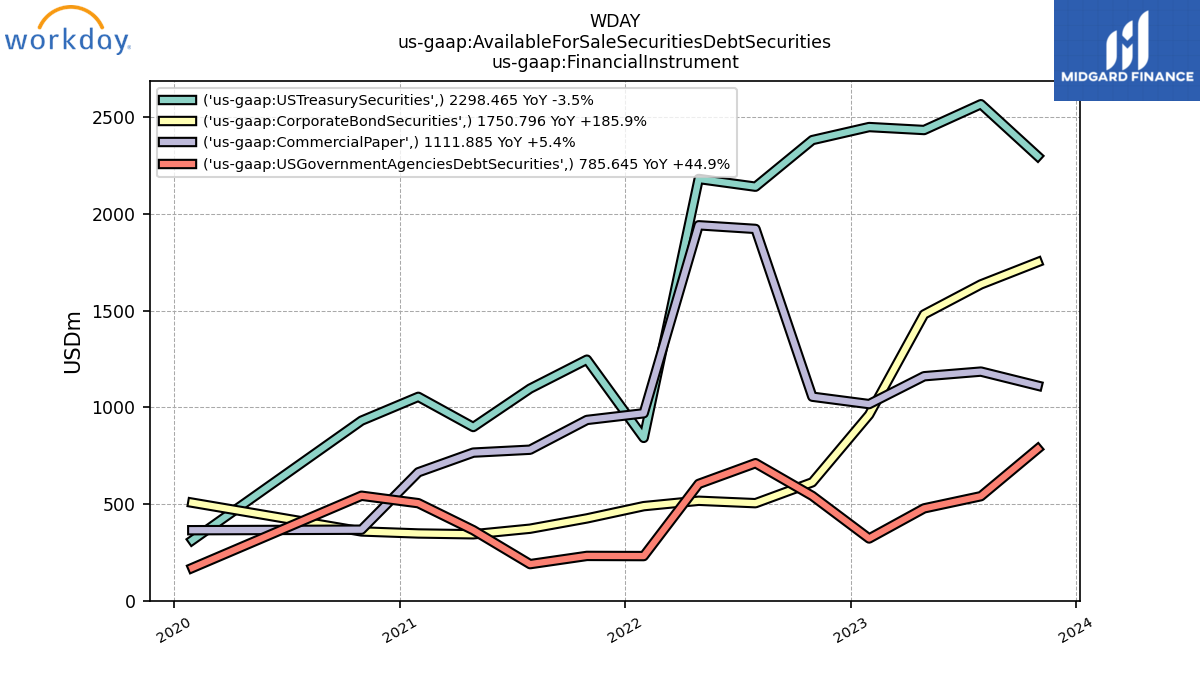
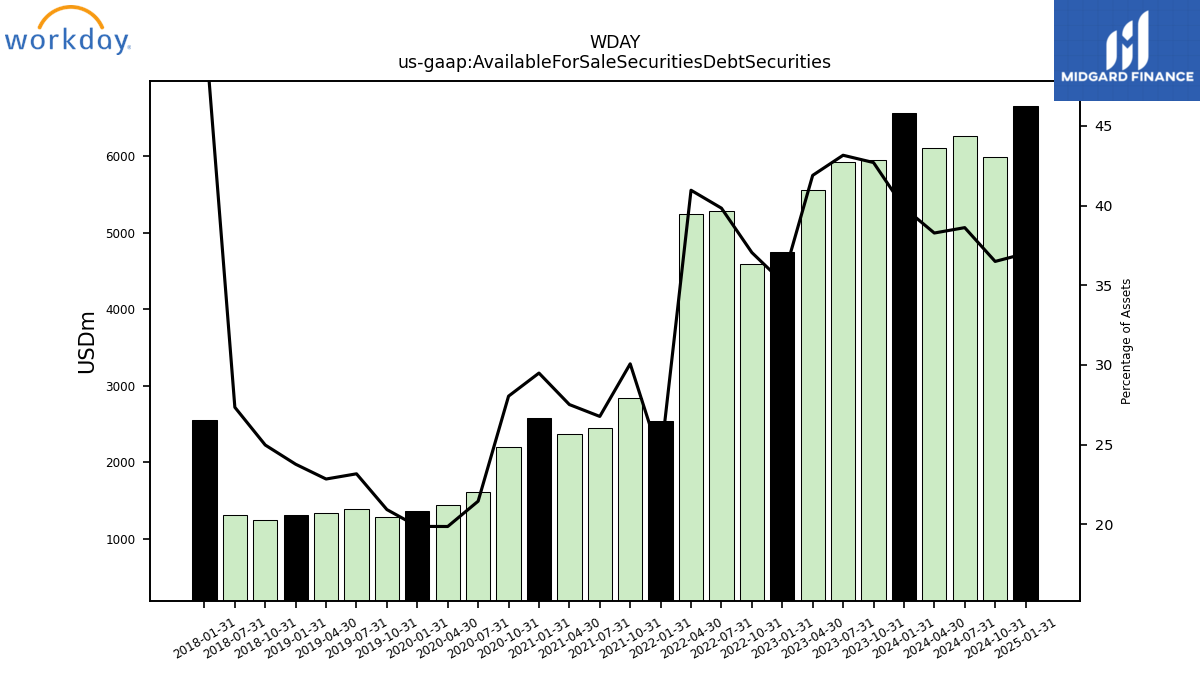
| Available For Sale Securities Debt Securities | 5946.79 | 5928.19 | 5552.57 | 4749.18 | 4590.98 | 5278.58 | 5242.97 | 2531.09 | 2838.74 | 2439.43 | 2372.53 | 2570.85 | 2199.66 | 1608.78 | 1435.14 | 1353.95 | 1287.66 | 1388.01 | 1330.09 | 1312.01 | 1248.59 | 1302.78 | NA | 2551.11 | NA | NA | NA | NA | NA | NA | NA | NA | NA | NA | NA | NA | NA | NA | NA | NA | NA | NA | NA | NA | NA | NA | NA | NA | NA | NA | NA | NA |
| 2023-10-31 | 2023-07-31 | 2023-04-30 | 2023-01-31 | 2022-10-31 | 2022-07-31 | 2022-04-30 | 2022-01-31 | 2021-10-31 | 2021-07-31 | 2021-04-30 | 2021-01-31 | 2020-10-31 | 2020-07-31 | 2020-04-30 | 2020-01-31 | 2019-10-31 | 2019-07-31 | 2019-04-30 | 2019-01-31 | 2018-10-31 | 2018-07-31 | 2018-04-30 | 2018-01-31 | 2017-10-31 | 2017-07-31 | 2017-04-30 | 2017-01-31 | 2016-10-31 | 2016-07-31 | 2016-04-30 | 2016-01-31 | 2015-10-31 | 2015-07-31 | 2015-04-30 | 2015-01-31 | 2014-10-31 | 2014-07-31 | 2014-04-30 | 2014-01-31 | 2013-10-31 | 2013-07-31 | 2013-04-30 | 2013-01-31 | 2012-10-31 | 2012-07-31 | 2012-04-30 | 2012-01-31 | 2011-10-31 | 2011-07-31 | 2011-04-30 | 2011-01-31 | ||
|---|---|---|---|---|---|---|---|---|---|---|---|---|---|---|---|---|---|---|---|---|---|---|---|---|---|---|---|---|---|---|---|---|---|---|---|---|---|---|---|---|---|---|---|---|---|---|---|---|---|---|---|---|---|
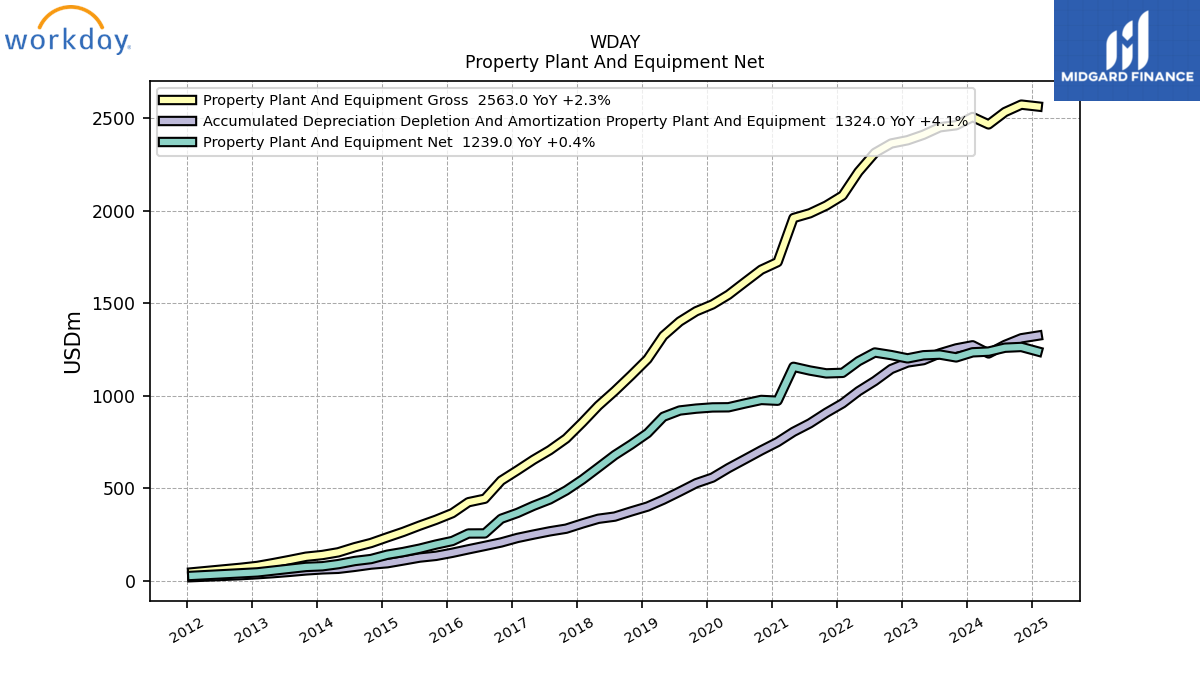
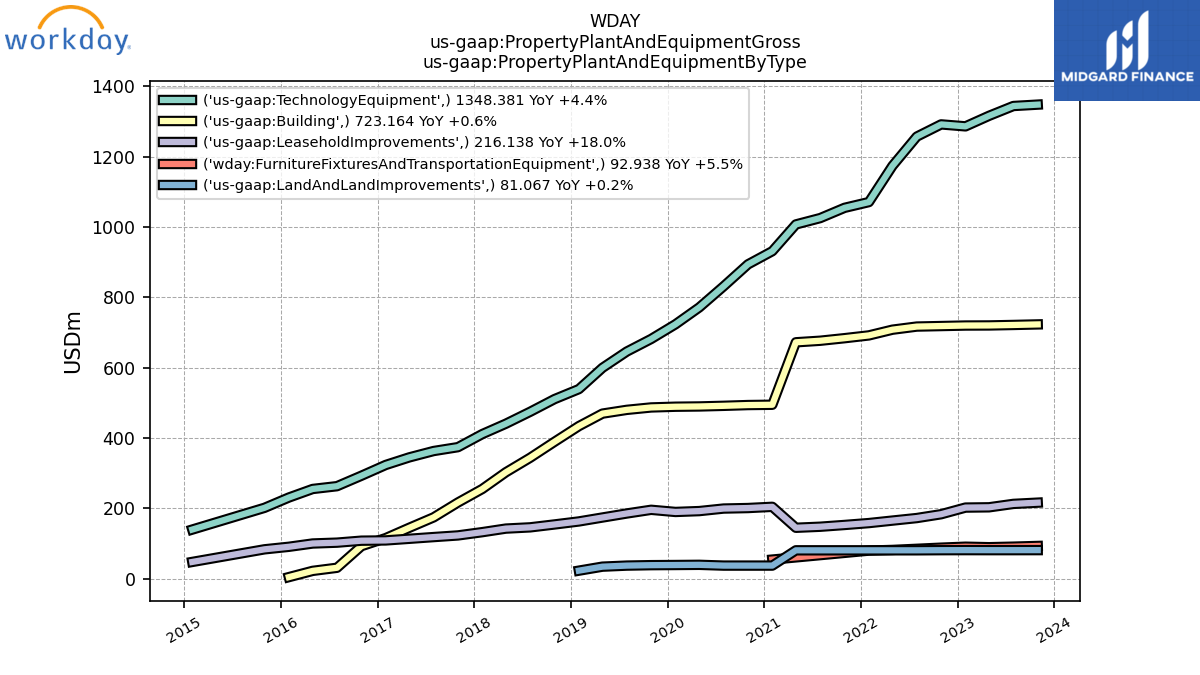
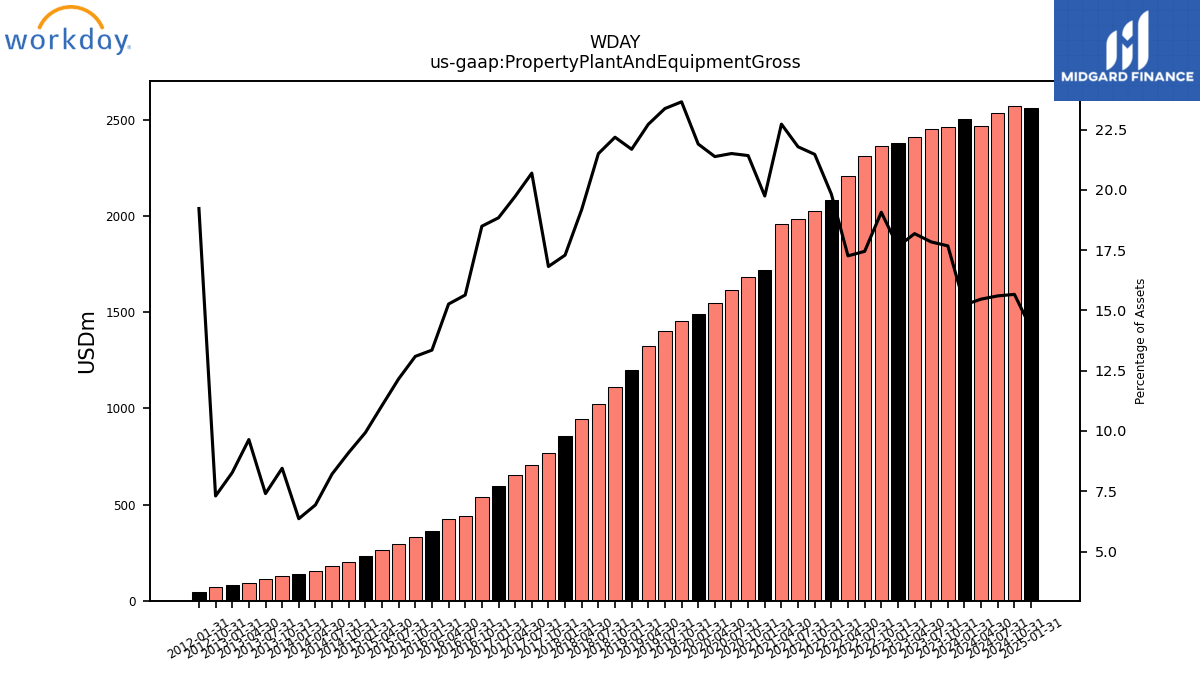
| Property Plant And Equipment Gross | 2461.69 | 2450.53 | 2410.04 | 2380.51 | 2362.85 | 2312.19 | 2209.53 | 2081.35 | 2027.26 | 1985.59 | 1959.95 | 1721.59 | 1680.61 | 1613.39 | 1545.33 | 1492.83 | 1455.90 | 1400.59 | 1323.21 | 1197.14 | 1109.26 | 1024.58 | 945.56 | 855.59 | 767.88 | 705.05 | 652.83 | 596.64 | 540.47 | 442.57 | 423.79 | 364.56 | 328.82 | 297.24 | 263.39 | 234.26 | 203.29 | 180.31 | 152.99 | 138.45 | 129.20 | 111.49 | 94.62 | 79.34 | 69.42 | NA | NA | 44.73 | NA | NA | NA | NA | |
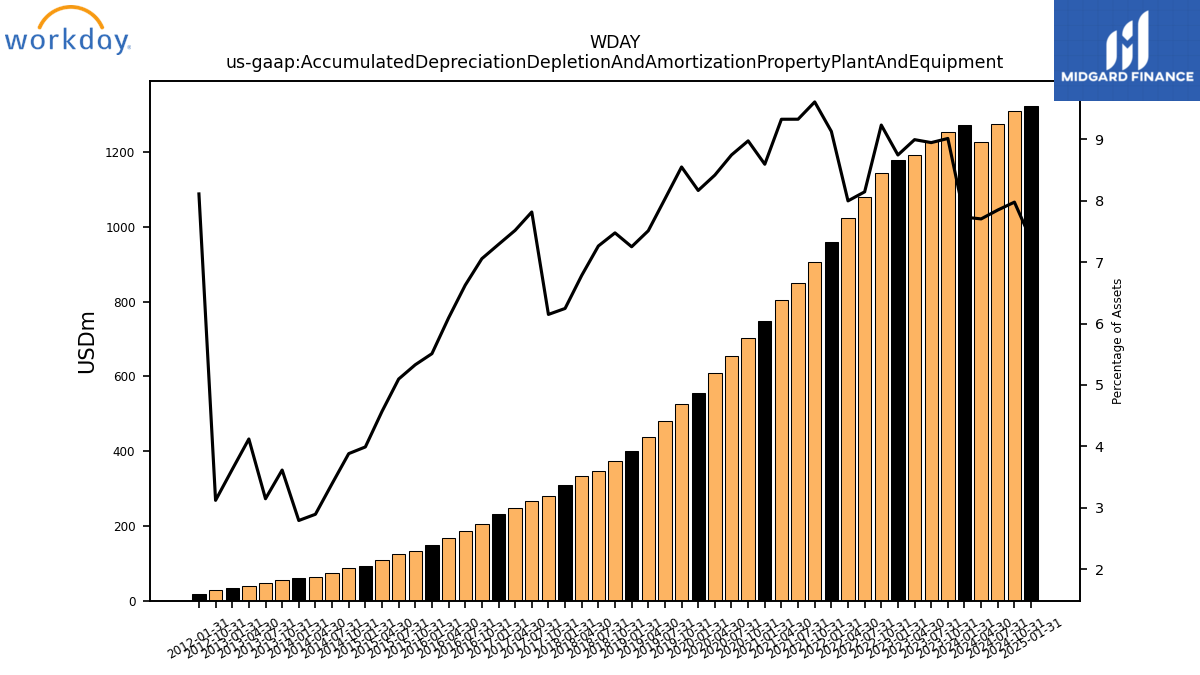
| Accumulated Depreciation Depletion And Amortization Property Plant And Equipment | 1255.12 | 1228.70 | 1191.93 | 1179.25 | 1143.72 | 1079.04 | 1023.52 | 958.27 | 907.07 | 849.99 | 804.26 | 749.18 | 704.00 | 655.96 | 608.32 | 556.65 | 526.23 | 481.07 | 437.43 | 400.24 | 373.81 | 346.05 | 334.26 | 308.98 | 280.64 | 266.30 | 248.72 | 230.76 | 206.21 | 187.45 | 169.09 | 150.40 | 133.82 | 124.54 | 108.85 | 94.12 | 86.65 | 74.46 | 63.87 | 60.78 | 55.24 | 47.40 | 40.43 | 34.76 | 29.66 | NA | NA | 18.87 | NA | NA | NA | NA | |
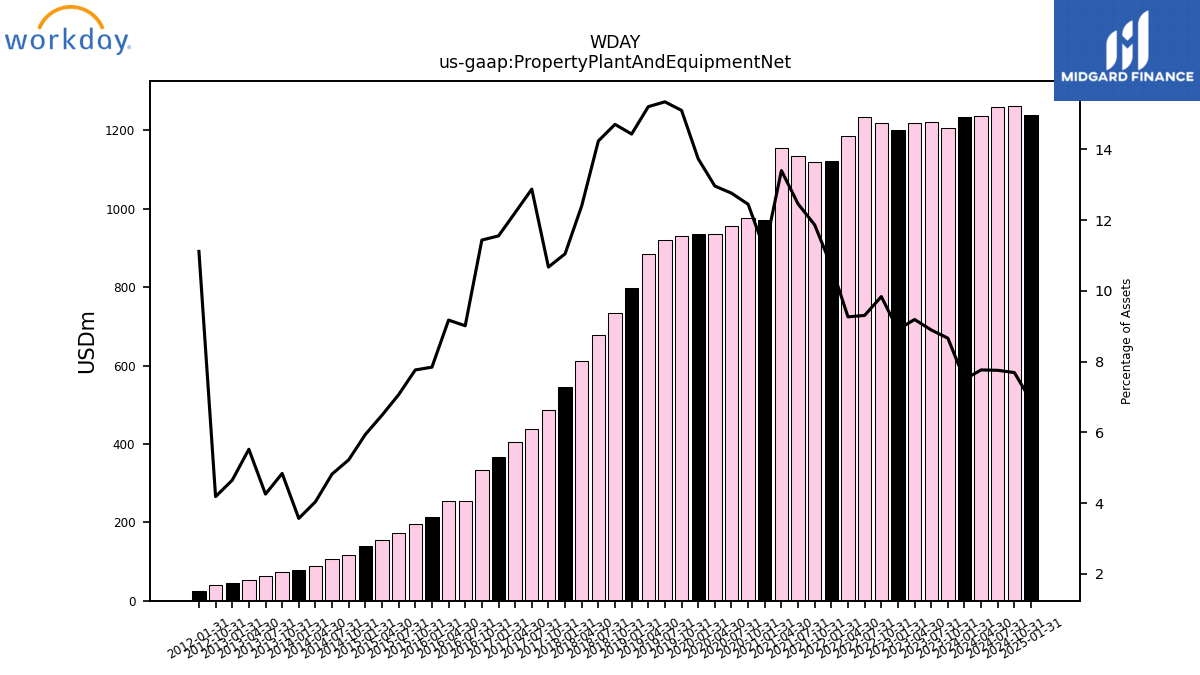
| Property Plant And Equipment Net | 1206.56 | 1221.83 | 1218.12 | 1201.25 | 1219.13 | 1233.15 | 1186.00 | 1123.08 | 1120.20 | 1135.59 | 1155.70 | 972.40 | 976.61 | 957.43 | 937.01 | 936.18 | 929.67 | 919.52 | 885.79 | 796.91 | 735.44 | 678.52 | 611.29 | 546.61 | 487.23 | 438.75 | 404.10 | 365.88 | 334.26 | 255.12 | 254.70 | 214.16 | 195.00 | 172.70 | 154.54 | 140.14 | 116.64 | 105.86 | 89.12 | 77.66 | 73.96 | 64.10 | 54.20 | 44.59 | 39.76 | NA | NA | 25.86 | NA | NA | NA | NA | |
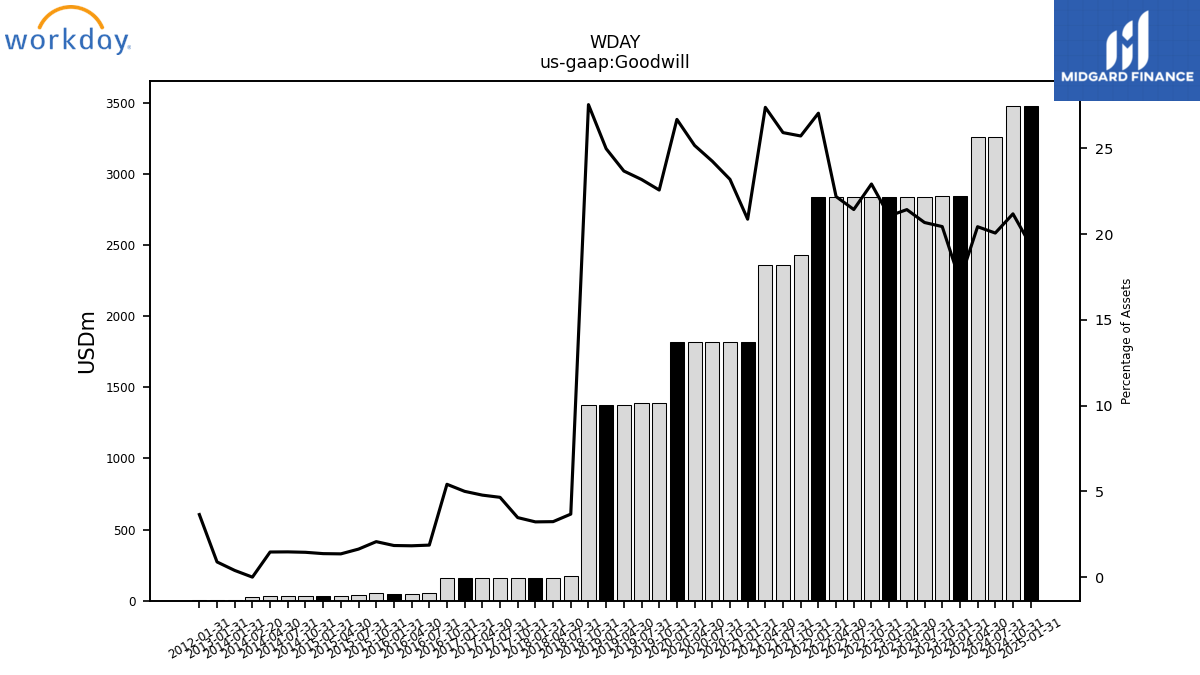
| Goodwill | 2846.46 | 2840.04 | 2840.04 | 2840.04 | 2840.04 | 2840.04 | 2840.04 | 2840.04 | 2428.48 | 2362.17 | 2362.17 | 1819.62 | 1819.62 | 1819.26 | 1819.26 | 1819.26 | 1389.35 | 1389.35 | 1379.12 | 1379.12 | 1377.62 | 175.07 | 159.40 | 159.38 | 158.42 | 158.54 | 158.19 | 158.35 | 158.19 | 52.82 | 50.73 | 50.33 | 51.95 | 39.93 | 32.31 | 32.31 | 32.31 | 32.31 | 32.31 | 8.49 | NA | NA | NA | 8.49 | NA | NA | NA | 8.49 | NA | NA | NA | NA | |
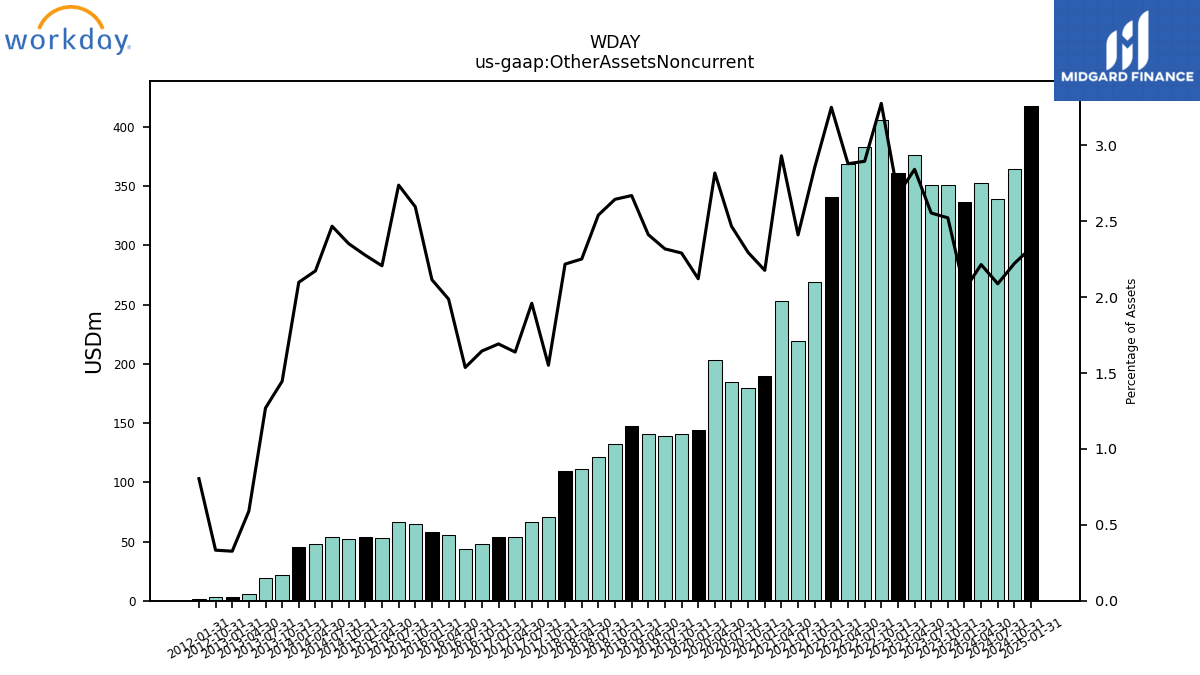
| Other Assets Noncurrent | 351.26 | 350.86 | 376.64 | 360.99 | 405.94 | 383.55 | 368.50 | 341.25 | 269.51 | 219.64 | 252.80 | 189.76 | 179.99 | 185.08 | 203.66 | 144.60 | 141.01 | 138.90 | 140.47 | 147.36 | 132.23 | 121.07 | 110.94 | 109.72 | 70.81 | 66.76 | 54.21 | 53.57 | 48.07 | 43.48 | 55.17 | 57.74 | 65.17 | 66.92 | 52.57 | 53.68 | 52.51 | 54.15 | 47.95 | 45.66 | 22.10 | 19.12 | 5.79 | 3.13 | 3.17 | NA | NA | 1.87 | NA | NA | NA | NA | |
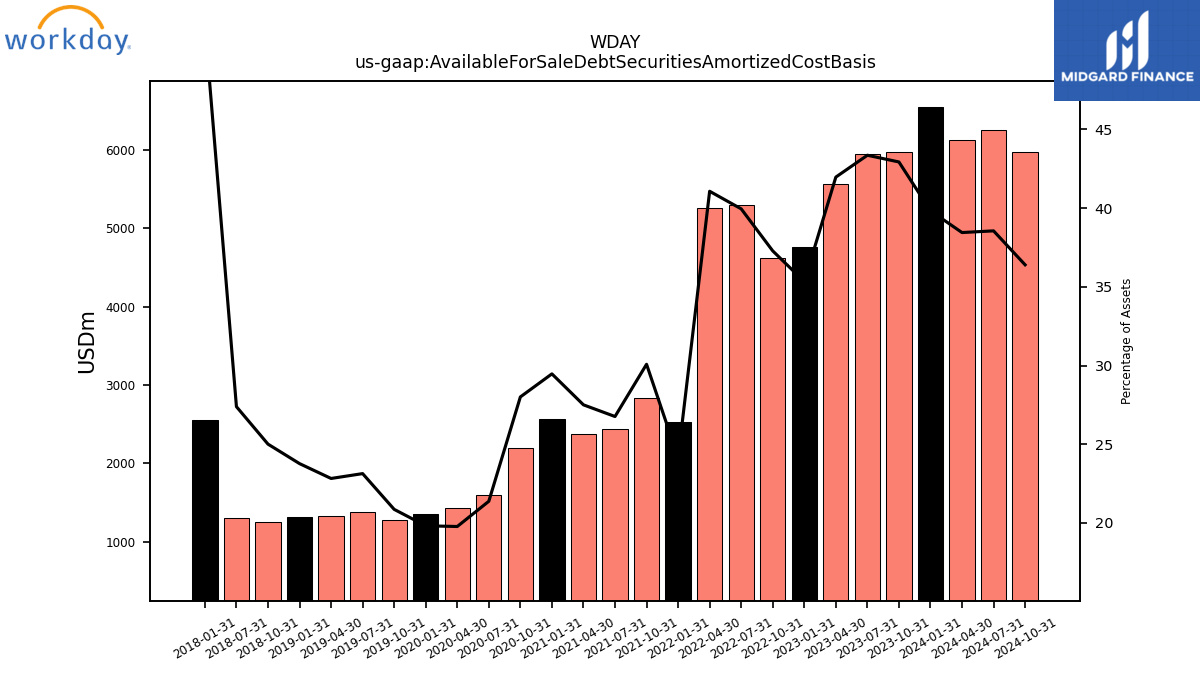
| Available For Sale Debt Securities Amortized Cost Basis | 5978.66 | 5955.42 | 5562.17 | 4764.85 | 4619.20 | 5293.56 | 5256.59 | 2535.79 | 2839.78 | 2438.96 | 2371.84 | 2569.27 | 2196.98 | 1603.52 | 1429.15 | 1350.93 | 1284.21 | 1386.20 | 1329.38 | 1312.22 | 1250.42 | 1304.99 | NA | 2554.51 | NA | NA | NA | NA | NA | NA | NA | NA | NA | NA | NA | NA | NA | NA | NA | NA | NA | NA | NA | NA | NA | NA | NA | NA | NA | NA | NA | NA |
| 2023-10-31 | 2023-07-31 | 2023-04-30 | 2023-01-31 | 2022-10-31 | 2022-07-31 | 2022-04-30 | 2022-01-31 | 2021-10-31 | 2021-07-31 | 2021-04-30 | 2021-01-31 | 2020-10-31 | 2020-07-31 | 2020-04-30 | 2020-01-31 | 2019-10-31 | 2019-07-31 | 2019-04-30 | 2019-01-31 | 2018-10-31 | 2018-07-31 | 2018-04-30 | 2018-01-31 | 2017-10-31 | 2017-07-31 | 2017-04-30 | 2017-01-31 | 2016-10-31 | 2016-07-31 | 2016-04-30 | 2016-01-31 | 2015-10-31 | 2015-07-31 | 2015-04-30 | 2015-01-31 | 2014-10-31 | 2014-07-31 | 2014-04-30 | 2014-01-31 | 2013-10-31 | 2013-07-31 | 2013-04-30 | 2013-01-31 | 2012-10-31 | 2012-07-31 | 2012-04-30 | 2012-01-31 | 2011-10-31 | 2011-07-31 | 2011-04-30 | 2011-01-31 | ||
|---|---|---|---|---|---|---|---|---|---|---|---|---|---|---|---|---|---|---|---|---|---|---|---|---|---|---|---|---|---|---|---|---|---|---|---|---|---|---|---|---|---|---|---|---|---|---|---|---|---|---|---|---|---|
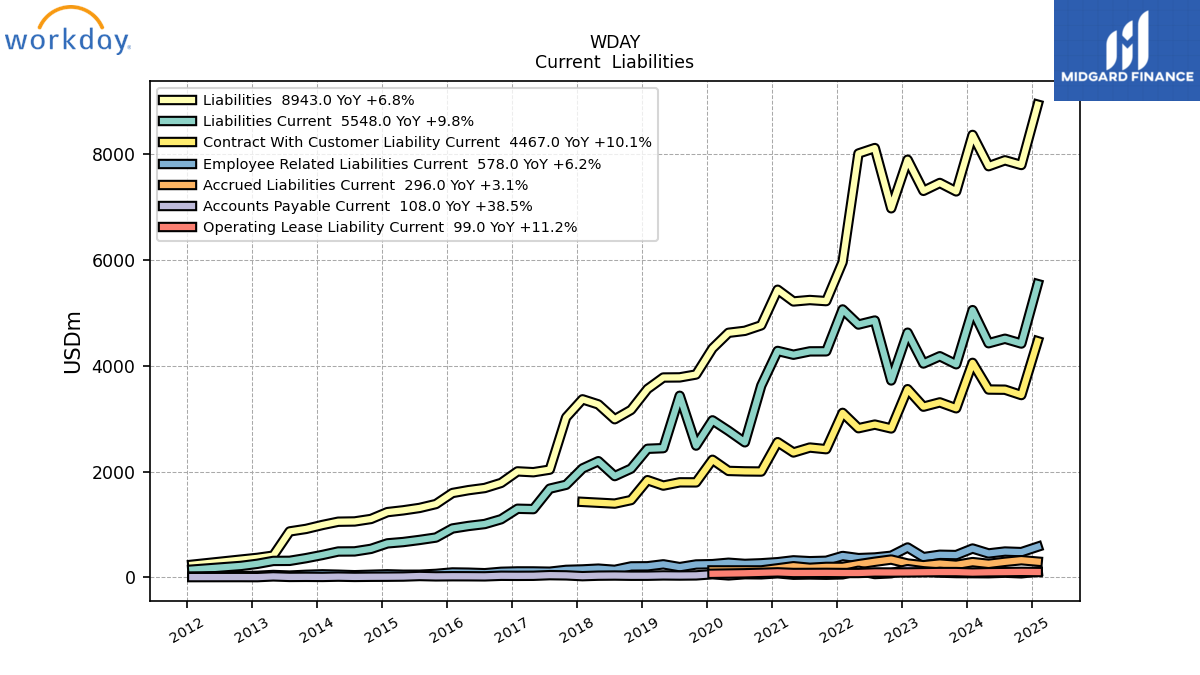
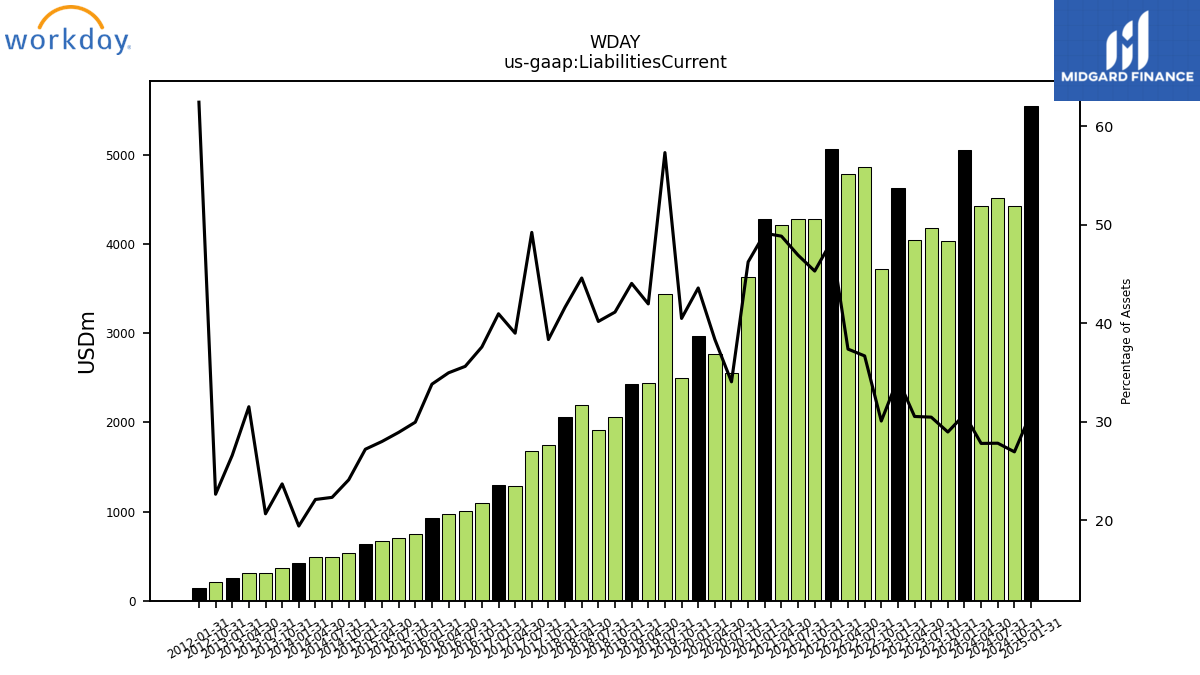
| Liabilities Current | 4029.39 | 4181.96 | 4044.09 | 4628.17 | 3723.40 | 4857.86 | 4781.39 | 5067.85 | 4275.05 | 4274.10 | 4210.76 | 4282.65 | 3625.20 | 2553.11 | 2770.96 | 2969.40 | 2491.39 | 3434.26 | 2443.08 | 2430.69 | 2055.89 | 1913.95 | 2196.65 | 2058.87 | 1749.55 | 1676.57 | 1289.44 | 1296.45 | 1098.10 | 1007.55 | 970.25 | 922.68 | 751.68 | 706.27 | 666.55 | 641.26 | 537.63 | 489.46 | 487.32 | 421.89 | 361.70 | 310.72 | 309.13 | 254.77 | 214.89 | NA | NA | 145.24 | NA | NA | NA | NA | |
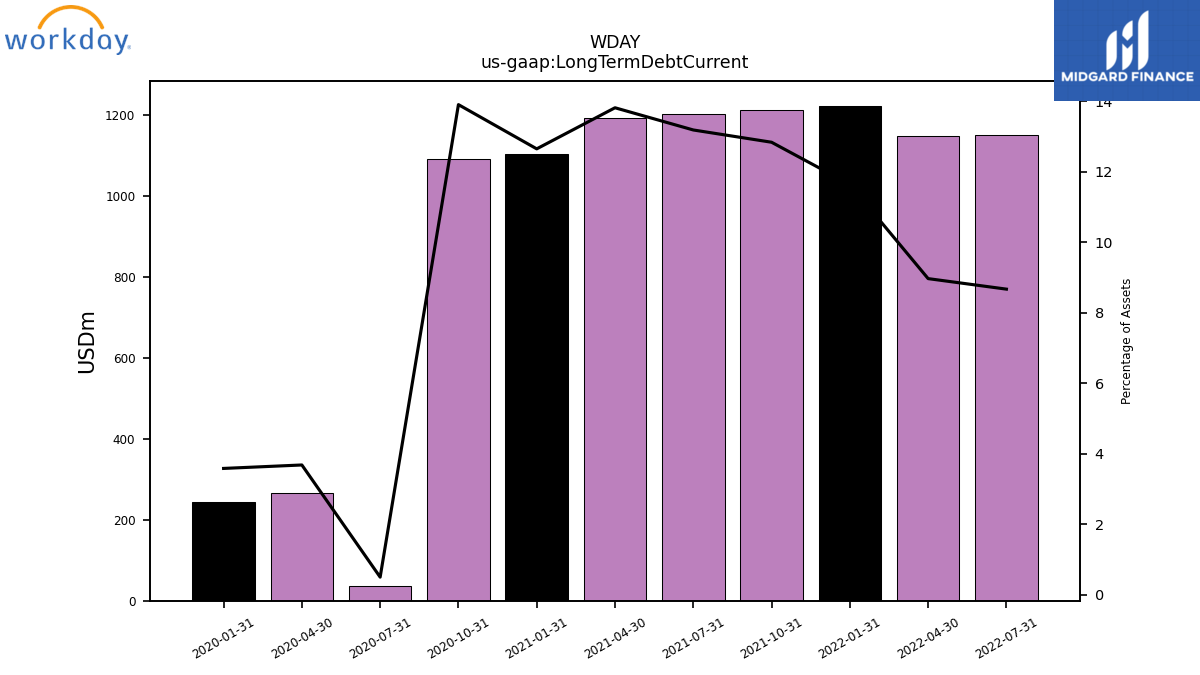
| Long Term Debt Current | NA | NA | NA | NA | NA | 1148.98 | 1148.13 | 1222.44 | 1212.21 | 1201.96 | 1191.72 | 1103.10 | 1091.05 | 37.50 | 266.14 | 244.32 | NA | NA | NA | NA | NA | NA | NA | NA | NA | NA | NA | NA | NA | NA | NA | NA | NA | NA | NA | NA | NA | NA | NA | NA | NA | NA | NA | NA | NA | NA | NA | NA | NA | NA | NA | NA | |
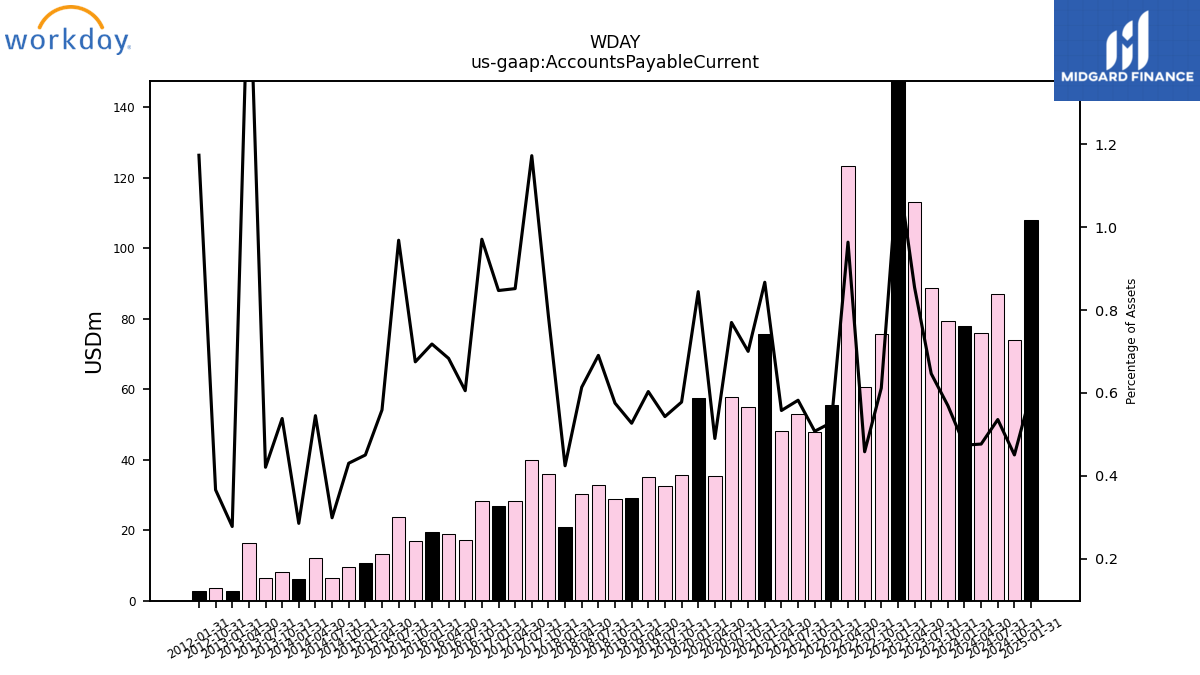
| Accounts Payable Current | 79.33 | 88.81 | 113.26 | 153.75 | 75.80 | 60.71 | 123.36 | 55.49 | 47.93 | 53.08 | 48.10 | 75.60 | 54.95 | 57.76 | 35.43 | 57.56 | 35.58 | 32.54 | 35.15 | 29.09 | 28.78 | 32.91 | 30.25 | 21.00 | 35.84 | 39.95 | 28.18 | 26.82 | 28.37 | 17.14 | 18.98 | 19.61 | 16.95 | 23.67 | 13.32 | 10.62 | 9.61 | 6.56 | 12.03 | 6.21 | 8.23 | 6.34 | 16.41 | 2.67 | 3.48 | NA | NA | 2.73 | NA | NA | NA | NA | |
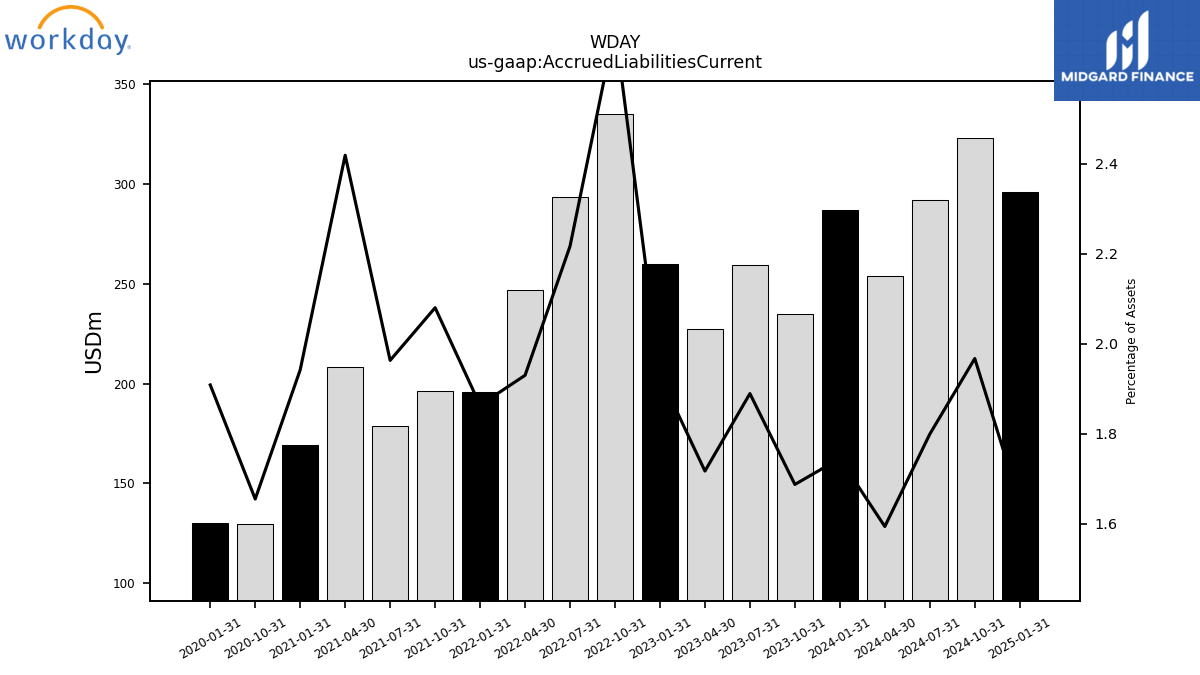
| Accrued Liabilities Current | 234.91 | 259.43 | 227.50 | 260.13 | 334.96 | 293.65 | 246.94 | 195.59 | 196.33 | 178.86 | 208.56 | 169.27 | 129.79 | NA | NA | 130.05 | NA | NA | NA | NA | NA | NA | NA | NA | NA | NA | NA | NA | NA | NA | NA | NA | NA | NA | NA | NA | NA | NA | NA | NA | NA | NA | NA | NA | NA | NA | NA | NA | NA | NA | NA | NA | |
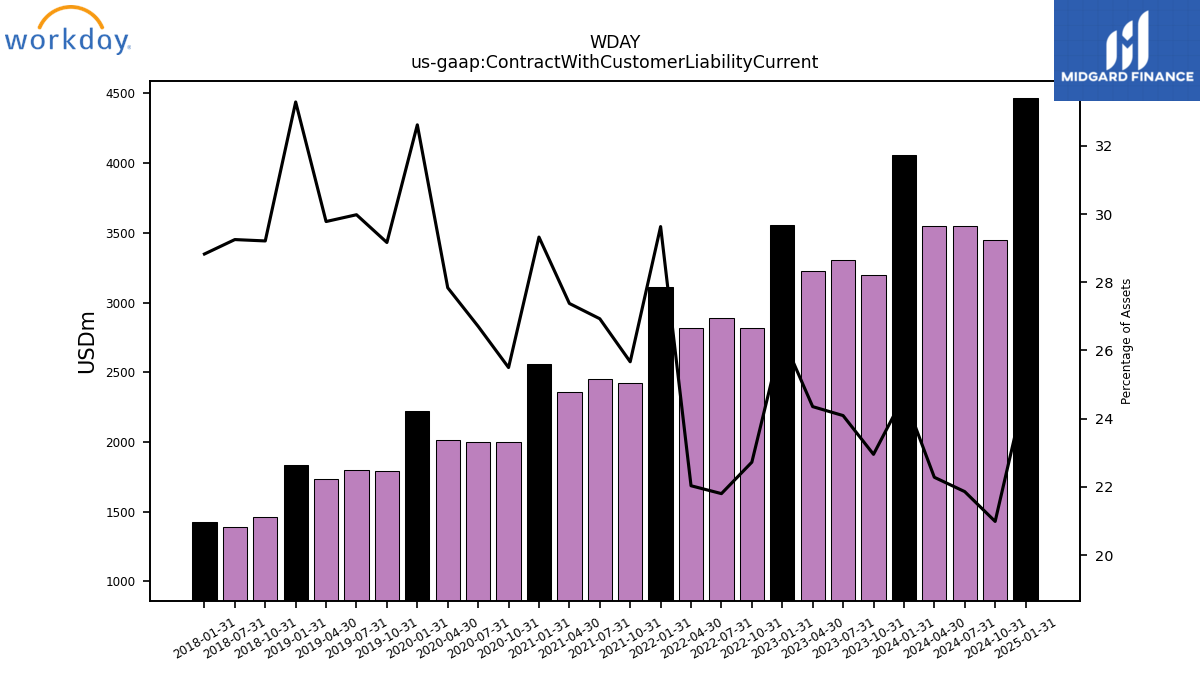
| Contract With Customer Liability Current | 3196.65 | 3309.00 | 3227.55 | 3559.39 | 2815.60 | 2888.79 | 2820.12 | 3110.95 | 2423.30 | 2454.38 | 2361.09 | 2556.62 | 2000.42 | 2003.45 | 2012.08 | 2223.18 | 1795.32 | 1796.42 | 1734.44 | 1837.62 | 1460.65 | 1393.85 | NA | 1426.24 | NA | NA | NA | NA | NA | NA | NA | NA | NA | NA | NA | NA | NA | NA | NA | NA | NA | NA | NA | NA | NA | NA | NA | NA | NA | NA | NA | NA |
| 2023-10-31 | 2023-07-31 | 2023-04-30 | 2023-01-31 | 2022-10-31 | 2022-07-31 | 2022-04-30 | 2022-01-31 | 2021-10-31 | 2021-07-31 | 2021-04-30 | 2021-01-31 | 2020-10-31 | 2020-07-31 | 2020-04-30 | 2020-01-31 | 2019-10-31 | 2019-07-31 | 2019-04-30 | 2019-01-31 | 2018-10-31 | 2018-07-31 | 2018-04-30 | 2018-01-31 | 2017-10-31 | 2017-07-31 | 2017-04-30 | 2017-01-31 | 2016-10-31 | 2016-07-31 | 2016-04-30 | 2016-01-31 | 2015-10-31 | 2015-07-31 | 2015-04-30 | 2015-01-31 | 2014-10-31 | 2014-07-31 | 2014-04-30 | 2014-01-31 | 2013-10-31 | 2013-07-31 | 2013-04-30 | 2013-01-31 | 2012-10-31 | 2012-07-31 | 2012-04-30 | 2012-01-31 | 2011-10-31 | 2011-07-31 | 2011-04-30 | 2011-01-31 | ||
|---|---|---|---|---|---|---|---|---|---|---|---|---|---|---|---|---|---|---|---|---|---|---|---|---|---|---|---|---|---|---|---|---|---|---|---|---|---|---|---|---|---|---|---|---|---|---|---|---|---|---|---|---|---|
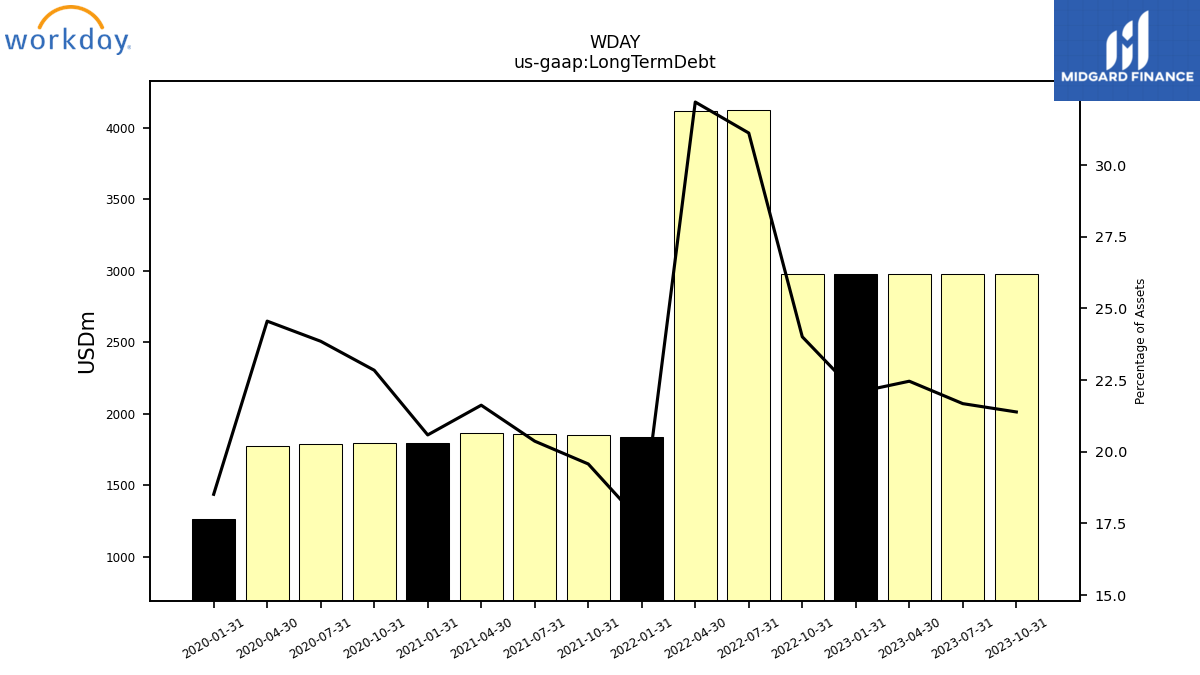
| Long Term Debt | 2978.80 | 2977.84 | 2976.89 | 2975.93 | 2974.98 | 4123.01 | 4121.19 | 1839.80 | 1848.21 | 1856.60 | 1864.99 | 1795.01 | 1792.23 | 1789.50 | 1774.92 | 1262.29 | NA | NA | NA | NA | NA | NA | NA | NA | NA | NA | NA | NA | NA | NA | NA | NA | NA | NA | NA | NA | NA | NA | NA | NA | NA | NA | NA | NA | NA | NA | NA | NA | NA | NA | NA | NA | |
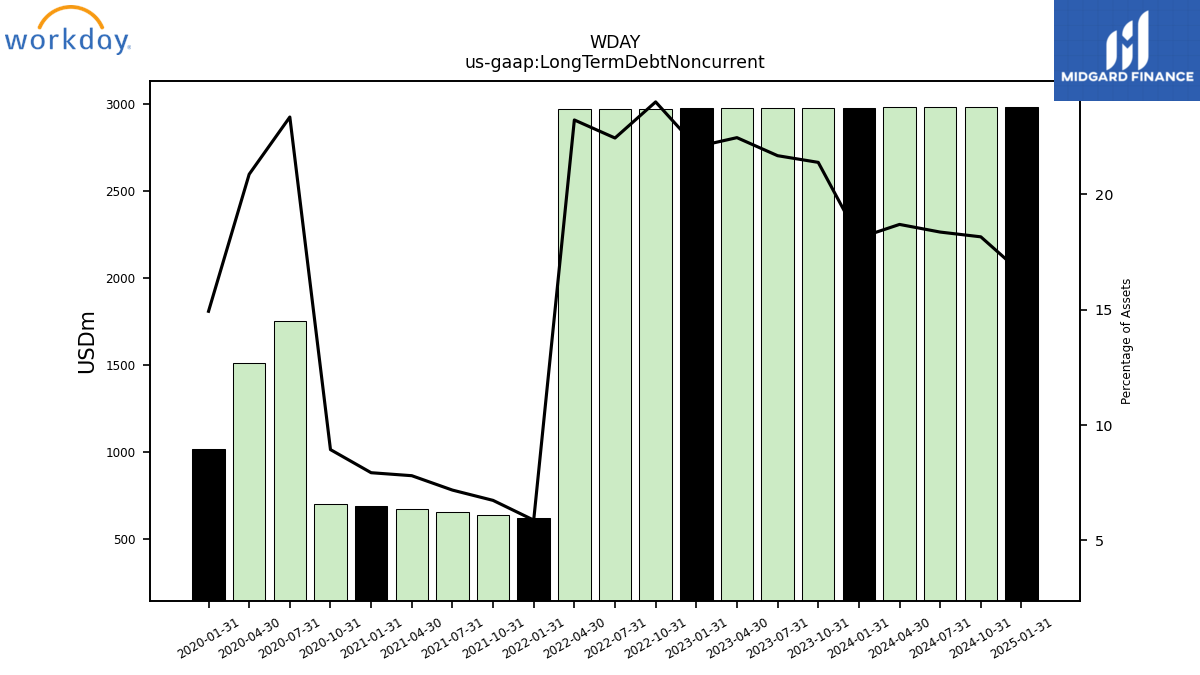
| Long Term Debt Noncurrent | 2978.80 | 2977.84 | 2976.89 | 2975.93 | 2974.98 | 2974.02 | 2973.07 | 617.35 | 635.99 | 654.63 | 673.27 | 691.91 | 701.18 | 1752.00 | 1508.78 | 1017.97 | NA | NA | NA | NA | NA | NA | NA | NA | NA | NA | NA | NA | NA | NA | NA | NA | NA | NA | NA | NA | NA | NA | NA | NA | NA | NA | NA | NA | NA | NA | NA | NA | NA | NA | NA | NA | |
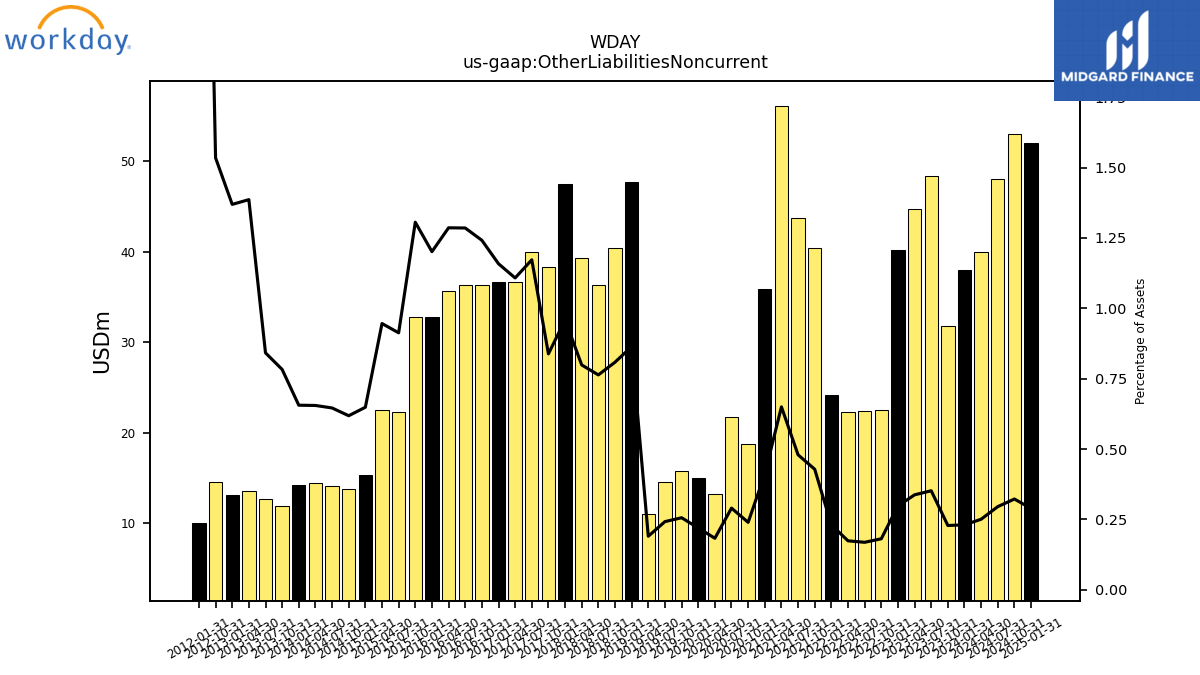
| Other Liabilities Noncurrent | 31.84 | 48.36 | 44.74 | 40.23 | 22.49 | 22.39 | 22.30 | 24.23 | 40.45 | 43.72 | 56.06 | 35.85 | 18.82 | 21.78 | 13.25 | 14.99 | 15.77 | 14.53 | 11.10 | 47.70 | 40.43 | 36.38 | 39.37 | 47.43 | 38.27 | 39.94 | 36.66 | 36.68 | 36.29 | 36.37 | 35.70 | 32.79 | 32.79 | 22.31 | 22.54 | 15.30 | 13.81 | 14.18 | 14.45 | 14.27 | 11.96 | 12.68 | 13.60 | 13.13 | 14.58 | NA | NA | 10.05 | NA | NA | NA | NA | |
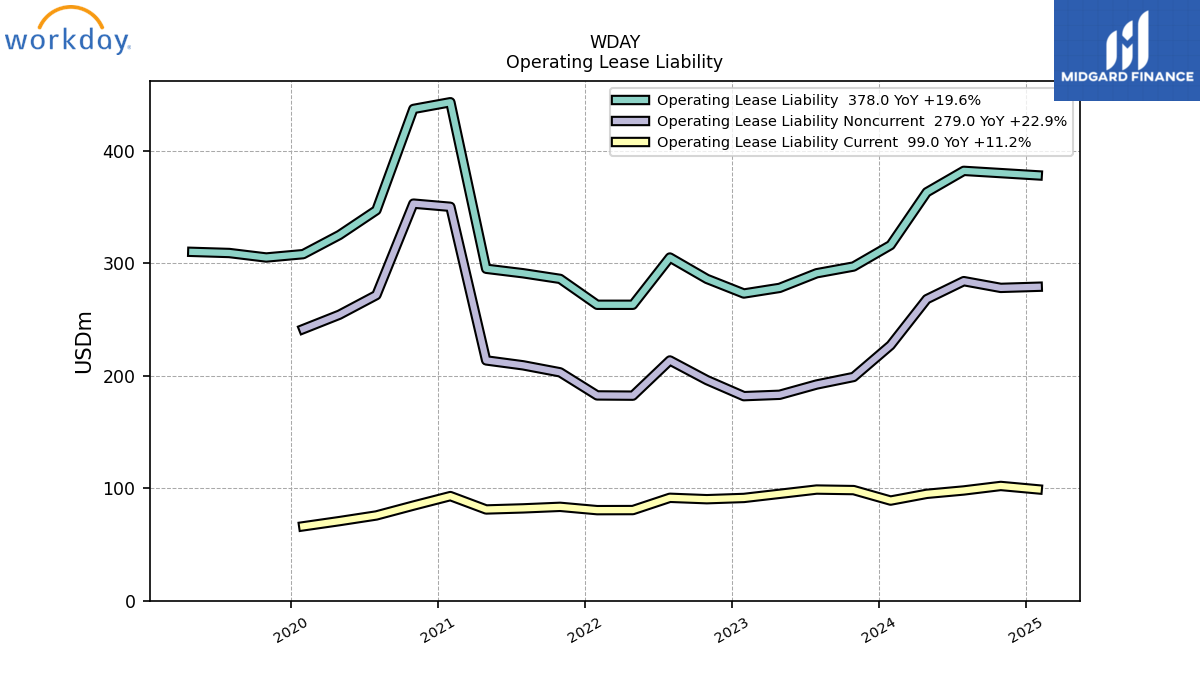
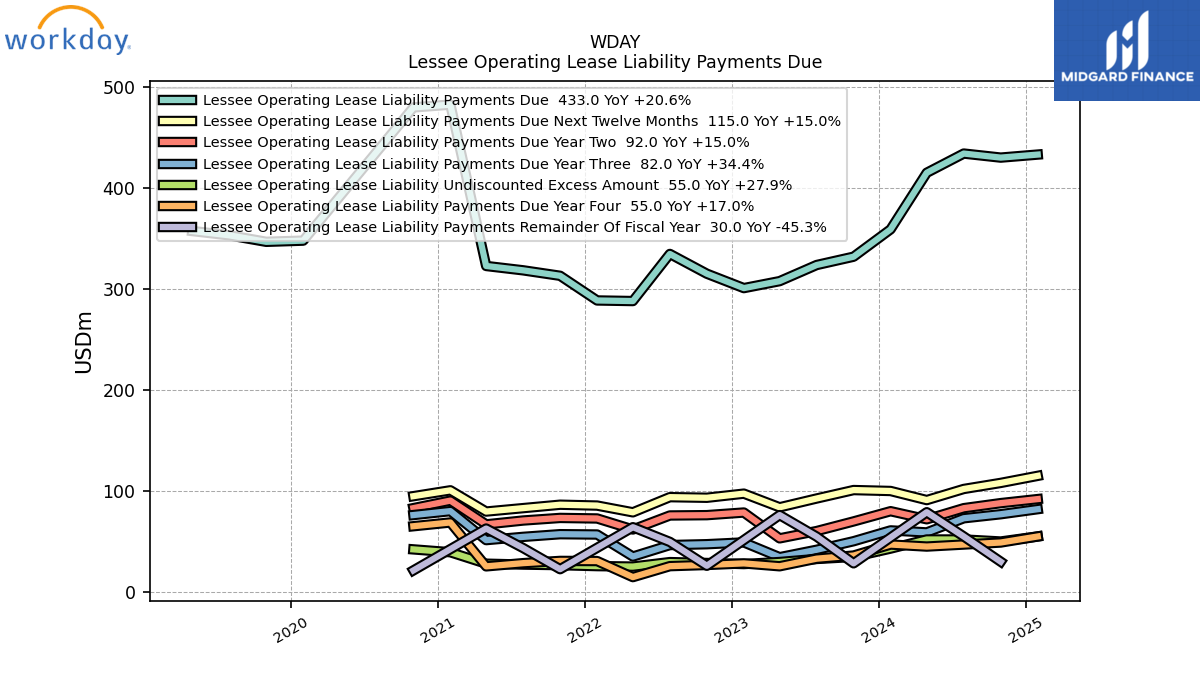
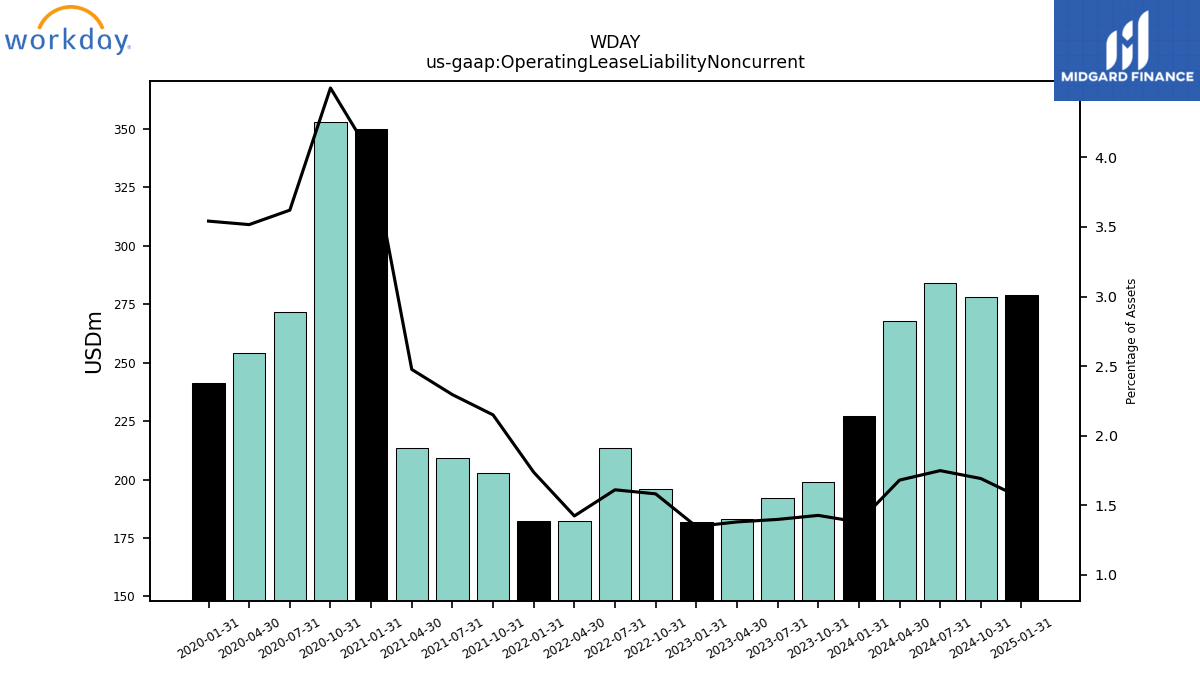
| Operating Lease Liability Noncurrent | 198.84 | 192.14 | 183.01 | 181.80 | 196.08 | 213.54 | 182.24 | 182.46 | 202.97 | 209.19 | 213.57 | 350.05 | 352.90 | 271.61 | 254.18 | 241.43 | NA | NA | NA | NA | NA | NA | NA | NA | NA | NA | NA | NA | NA | NA | NA | NA | NA | NA | NA | NA | NA | NA | NA | NA | NA | NA | NA | NA | NA | NA | NA | NA | NA | NA | NA | NA |
| 2023-10-31 | 2023-07-31 | 2023-04-30 | 2023-01-31 | 2022-10-31 | 2022-07-31 | 2022-04-30 | 2022-01-31 | 2021-10-31 | 2021-07-31 | 2021-04-30 | 2021-01-31 | 2020-10-31 | 2020-07-31 | 2020-04-30 | 2020-01-31 | 2019-10-31 | 2019-07-31 | 2019-04-30 | 2019-01-31 | 2018-10-31 | 2018-07-31 | 2018-04-30 | 2018-01-31 | 2017-10-31 | 2017-07-31 | 2017-04-30 | 2017-01-31 | 2016-10-31 | 2016-07-31 | 2016-04-30 | 2016-01-31 | 2015-10-31 | 2015-07-31 | 2015-04-30 | 2015-01-31 | 2014-10-31 | 2014-07-31 | 2014-04-30 | 2014-01-31 | 2013-10-31 | 2013-07-31 | 2013-04-30 | 2013-01-31 | 2012-10-31 | 2012-07-31 | 2012-04-30 | 2012-01-31 | 2011-10-31 | 2011-07-31 | 2011-04-30 | 2011-01-31 | ||
|---|---|---|---|---|---|---|---|---|---|---|---|---|---|---|---|---|---|---|---|---|---|---|---|---|---|---|---|---|---|---|---|---|---|---|---|---|---|---|---|---|---|---|---|---|---|---|---|---|---|---|---|---|---|
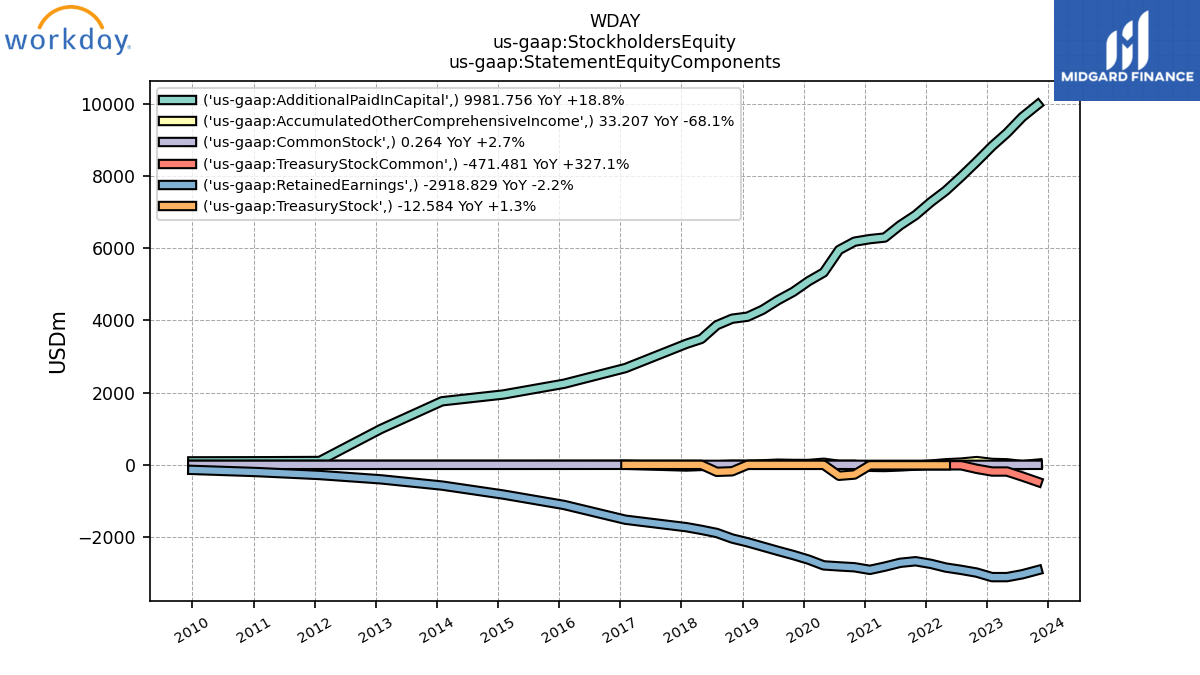
| Stockholders Equity | 6624.92 | 6274.55 | 5941.86 | 5585.57 | 5409.11 | 5127.81 | 4780.81 | 4535.08 | 4215.82 | 3867.99 | 3405.44 | 3277.83 | 3078.05 | 2838.48 | 2602.00 | 2486.55 | 2319.18 | 2210.28 | 2044.75 | 1958.44 | 1833.15 | 1775.22 | 1657.30 | 1580.37 | 1540.27 | 1370.40 | 1320.86 | 1162.91 | 1137.46 | 1140.85 | 1128.16 | 1136.16 | 1125.53 | 1131.97 | 1116.03 | 1125.97 | 1129.22 | 1138.84 | 1155.44 | 1187.22 | 613.40 | 638.74 | 571.78 | 592.28 | 615.50 | NA | NA | -175.56 | NA | NA | NA | -102.71 | |
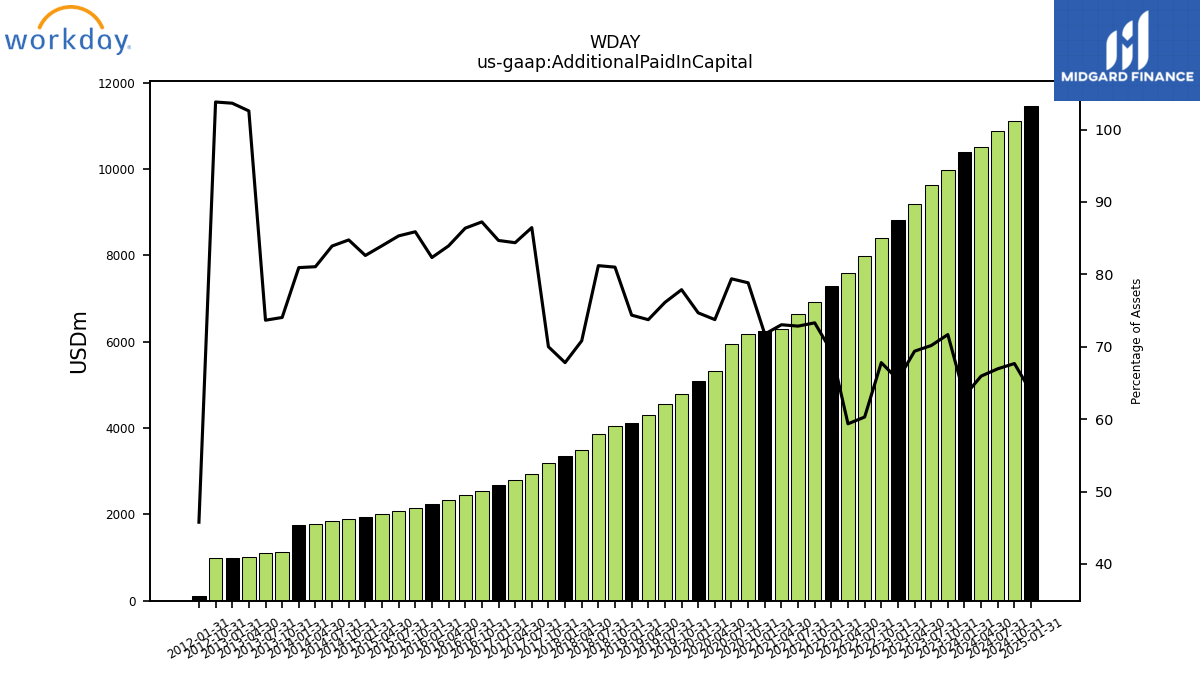
| Additional Paid In Capital | 9981.76 | 9637.30 | 9195.20 | 8828.64 | 8400.76 | 7988.10 | 7596.79 | 7284.17 | 6919.96 | 6639.07 | 6298.52 | 6254.94 | 6184.07 | 5954.74 | 5330.17 | 5090.19 | 4793.73 | 4561.27 | 4294.37 | 4105.33 | 4049.78 | 3869.11 | 3489.69 | 3354.42 | 3195.13 | 2945.60 | 2791.52 | 2681.20 | 2549.64 | 2444.17 | 2329.90 | 2247.45 | 2156.55 | 2084.82 | 2000.05 | 1948.30 | 1891.87 | 1841.69 | 1788.55 | 1761.16 | 1131.45 | 1109.33 | 1006.45 | 993.93 | 986.25 | NA | NA | 106.46 | NA | NA | NA | NA | |
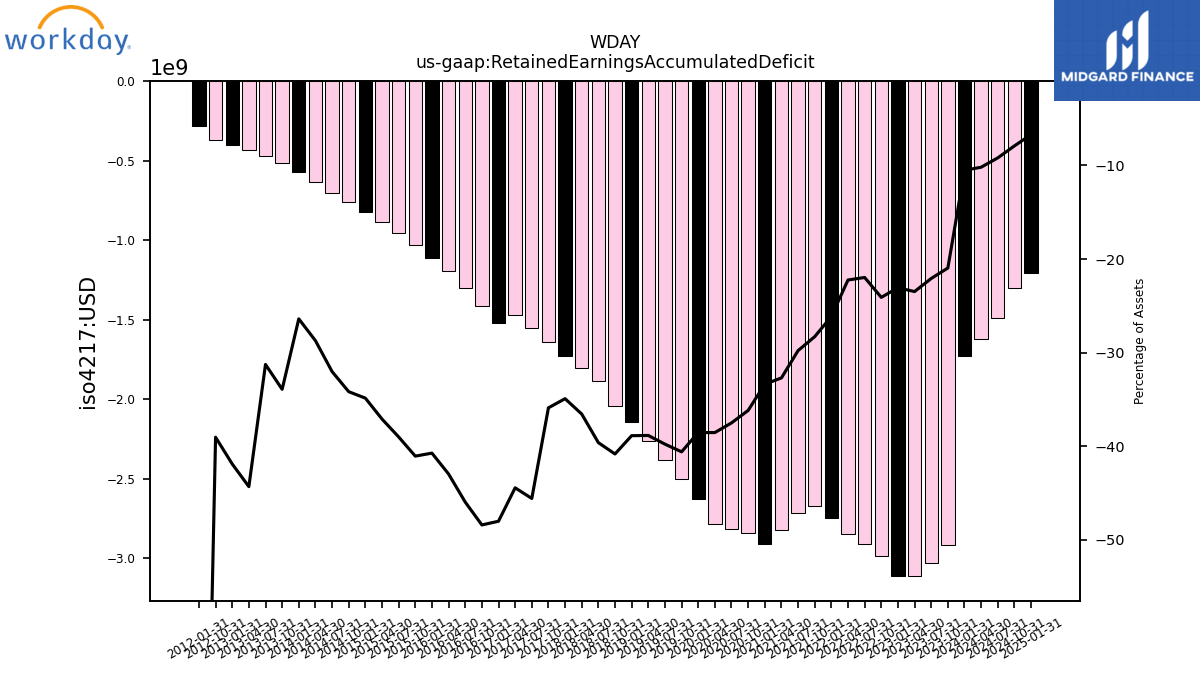
| Retained Earnings Accumulated Deficit | -2918.83 | -3032.54 | -3111.20 | -3111.33 | -2985.64 | -2910.92 | -2846.76 | -2744.59 | -2671.33 | -2714.74 | -2820.48 | -2909.99 | -2838.28 | -2813.94 | -2785.93 | -2627.36 | -2499.40 | -2383.67 | -2262.96 | -2146.30 | -2041.82 | -1887.99 | -1801.84 | -1727.86 | -1638.76 | -1553.21 | -1470.68 | -1520.57 | -1415.00 | -1300.94 | -1192.91 | -1112.29 | -1031.16 | -953.35 | -883.93 | -822.37 | -762.90 | -702.99 | -633.78 | -574.39 | -518.41 | -470.87 | -434.89 | -401.88 | -370.94 | NA | NA | -282.12 | NA | NA | NA | NA | |
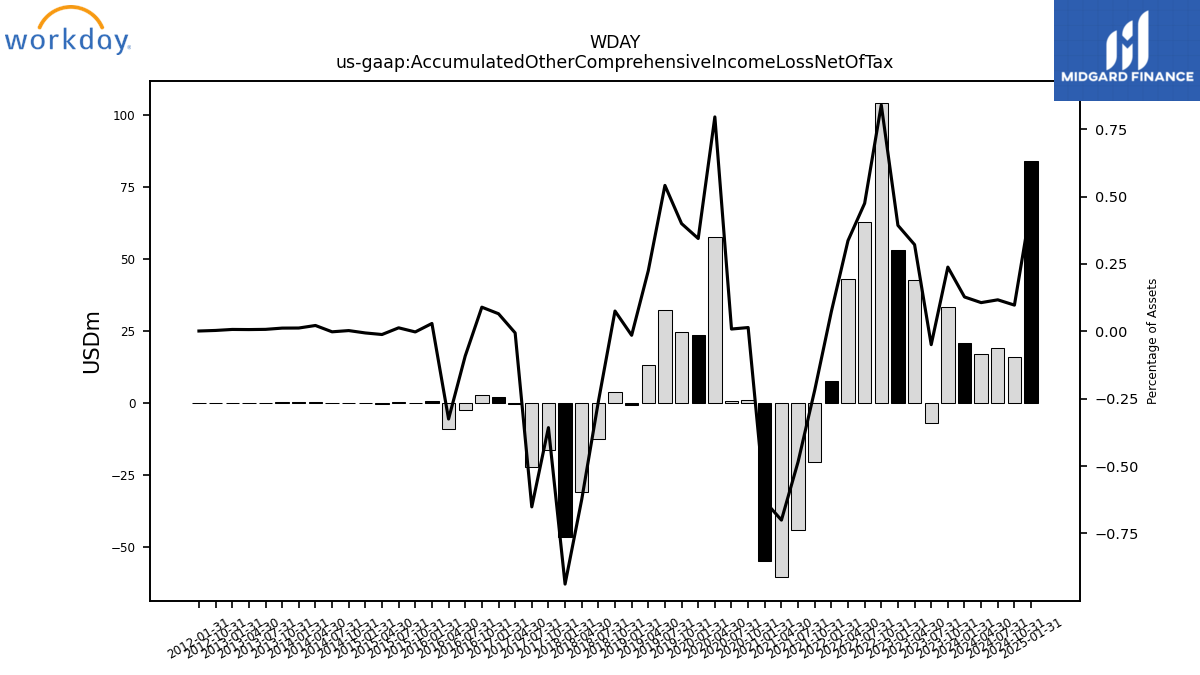
| Accumulated Other Comprehensive Income Loss Net Of Tax | 33.21 | -6.78 | 42.65 | 53.05 | 104.11 | 62.96 | 43.11 | 7.71 | -20.63 | -44.15 | -60.42 | -54.97 | 1.11 | 0.65 | 57.53 | 23.49 | 24.62 | 32.46 | 13.11 | -0.81 | 3.77 | -12.43 | -30.77 | -46.41 | -16.31 | -22.20 | -0.19 | 2.07 | 2.62 | -2.59 | -9.03 | 0.80 | -0.05 | 0.32 | -0.28 | -0.14 | 0.06 | -0.04 | 0.48 | 0.27 | 0.18 | 0.11 | 0.07 | 0.07 | 0.03 | NA | NA | 0.00 | NA | NA | NA | NA | |
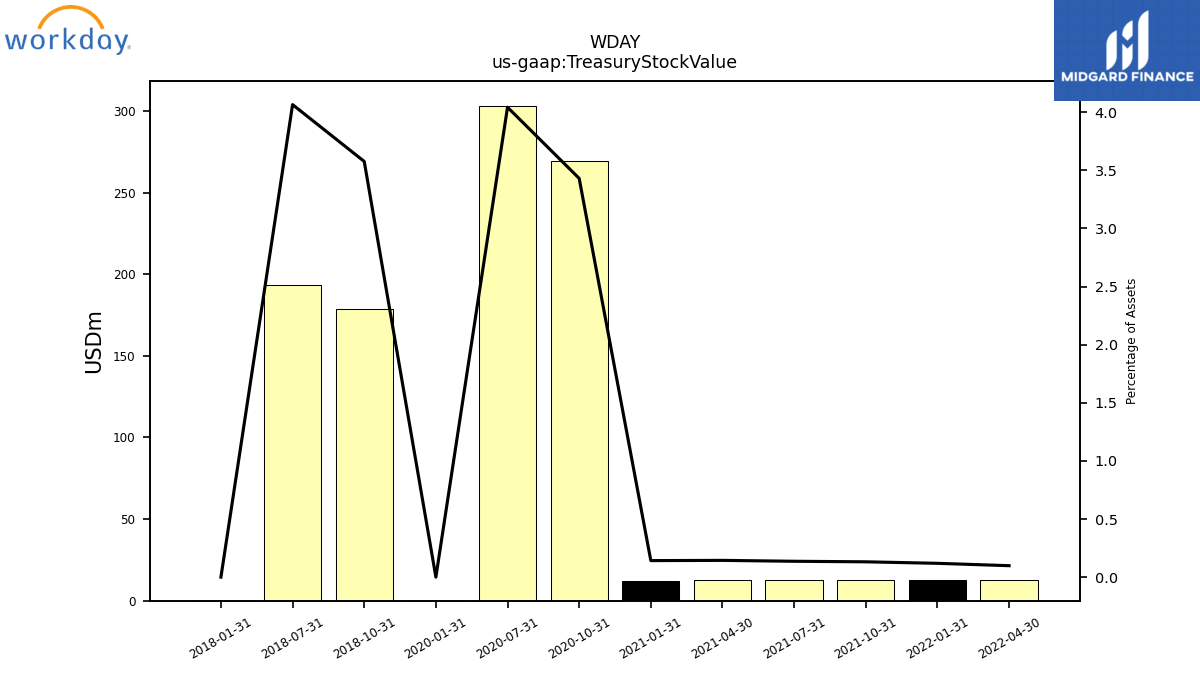
| Treasury Stock Value | NA | NA | NA | NA | NA | NA | 12.58 | 12.47 | 12.44 | 12.43 | 12.42 | 12.38 | 269.08 | 303.20 | NA | 0.00 | NA | NA | NA | NA | 178.80 | 193.68 | NA | 0.00 | NA | NA | NA | NA | NA | NA | NA | NA | NA | NA | NA | NA | NA | NA | NA | NA | NA | NA | NA | NA | NA | NA | NA | NA | NA | NA | NA | NA |
| 2023-10-31 | 2023-07-31 | 2023-04-30 | 2023-01-31 | 2022-10-31 | 2022-07-31 | 2022-04-30 | 2022-01-31 | 2021-10-31 | 2021-07-31 | 2021-04-30 | 2021-01-31 | 2020-10-31 | 2020-07-31 | 2020-04-30 | 2020-01-31 | 2019-10-31 | 2019-07-31 | 2019-04-30 | 2019-01-31 | 2018-10-31 | 2018-07-31 | 2018-04-30 | 2018-01-31 | 2017-10-31 | 2017-07-31 | 2017-04-30 | 2017-01-31 | 2016-10-31 | 2016-07-31 | 2016-04-30 | 2016-01-31 | 2015-10-31 | 2015-07-31 | 2015-04-30 | 2015-01-31 | 2014-10-31 | 2014-07-31 | 2014-04-30 | 2014-01-31 | 2013-10-31 | 2013-07-31 | 2013-04-30 | 2013-01-31 | 2012-10-31 | 2012-07-31 | 2012-04-30 | 2012-01-31 | 2011-10-31 | 2011-07-31 | 2011-04-30 | 2011-01-31 | ||
|---|---|---|---|---|---|---|---|---|---|---|---|---|---|---|---|---|---|---|---|---|---|---|---|---|---|---|---|---|---|---|---|---|---|---|---|---|---|---|---|---|---|---|---|---|---|---|---|---|---|---|---|---|---|
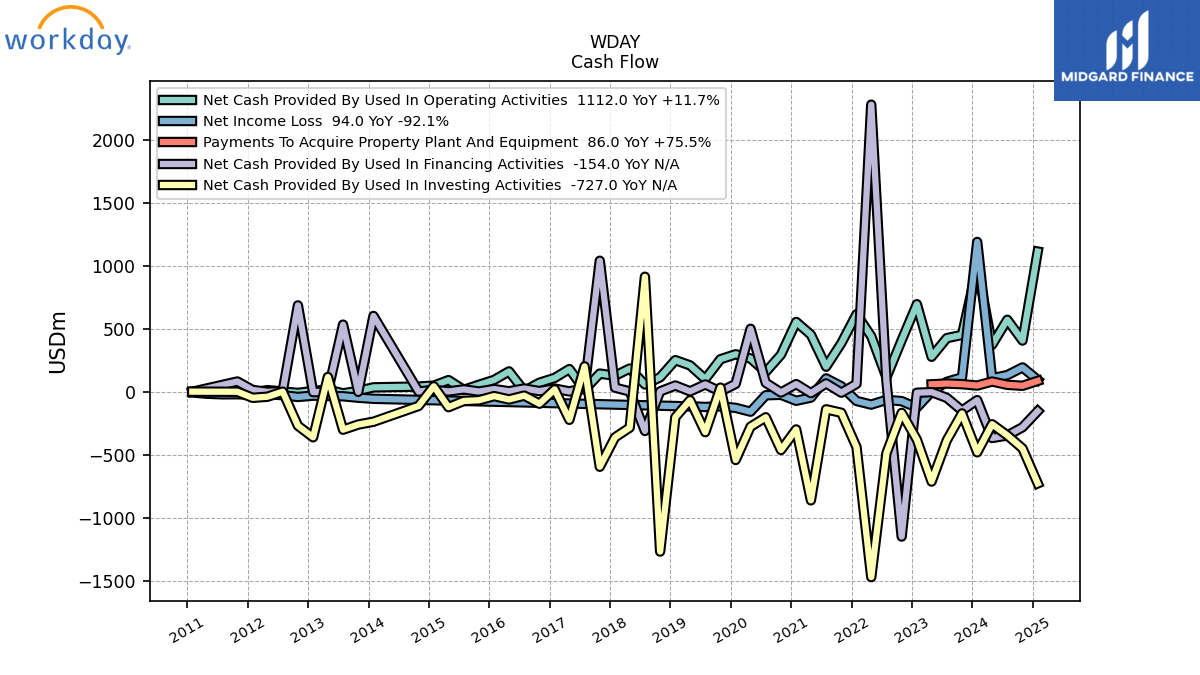
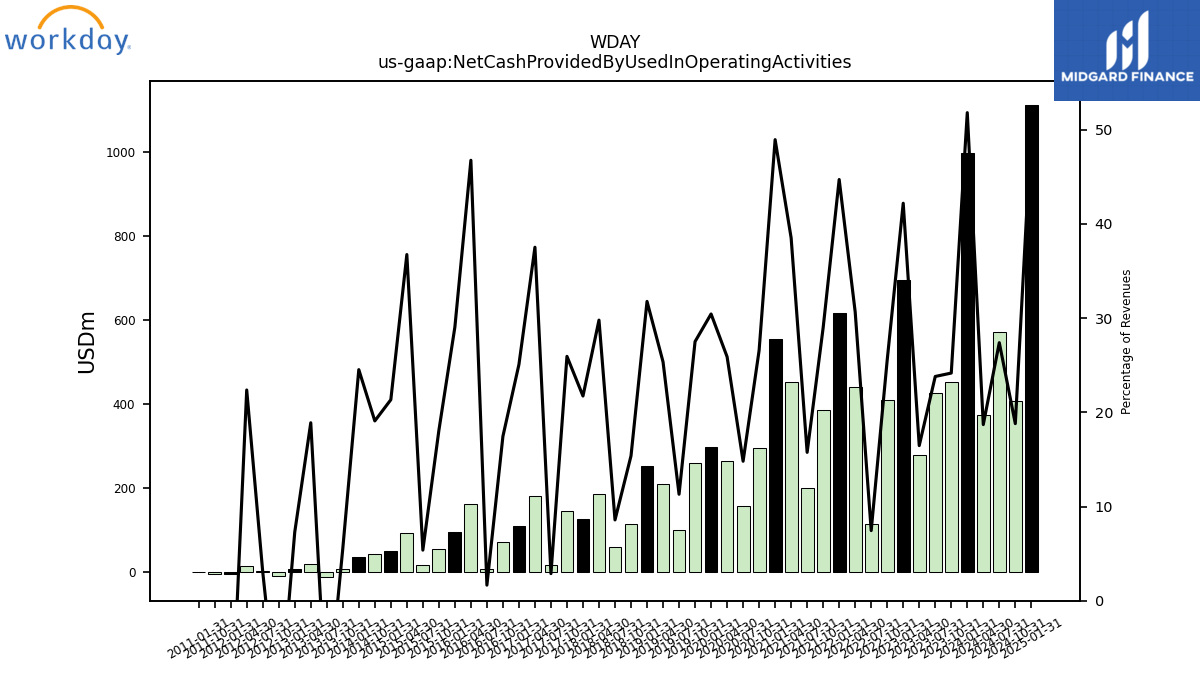
| Net Cash Provided By Used In Operating Activities | 450.77 | 425.26 | 277.32 | 694.45 | 408.67 | 114.36 | 439.72 | 615.15 | 384.65 | 198.47 | 452.43 | 553.75 | 293.80 | 157.21 | 263.68 | 297.11 | 258.00 | 100.32 | 209.16 | 250.51 | 114.30 | 57.62 | 184.23 | 126.55 | 144.03 | 15.13 | 180.02 | 109.47 | 71.46 | 6.26 | 161.47 | 93.92 | 55.15 | 15.19 | 92.20 | 48.27 | 41.04 | NA | NA | 34.79 | 7.08 | -12.92 | 17.31 | 5.94 | -9.36 | 1.92 | 12.71 | -6.64 | -5.51 | NA | NA | -1.07 | |
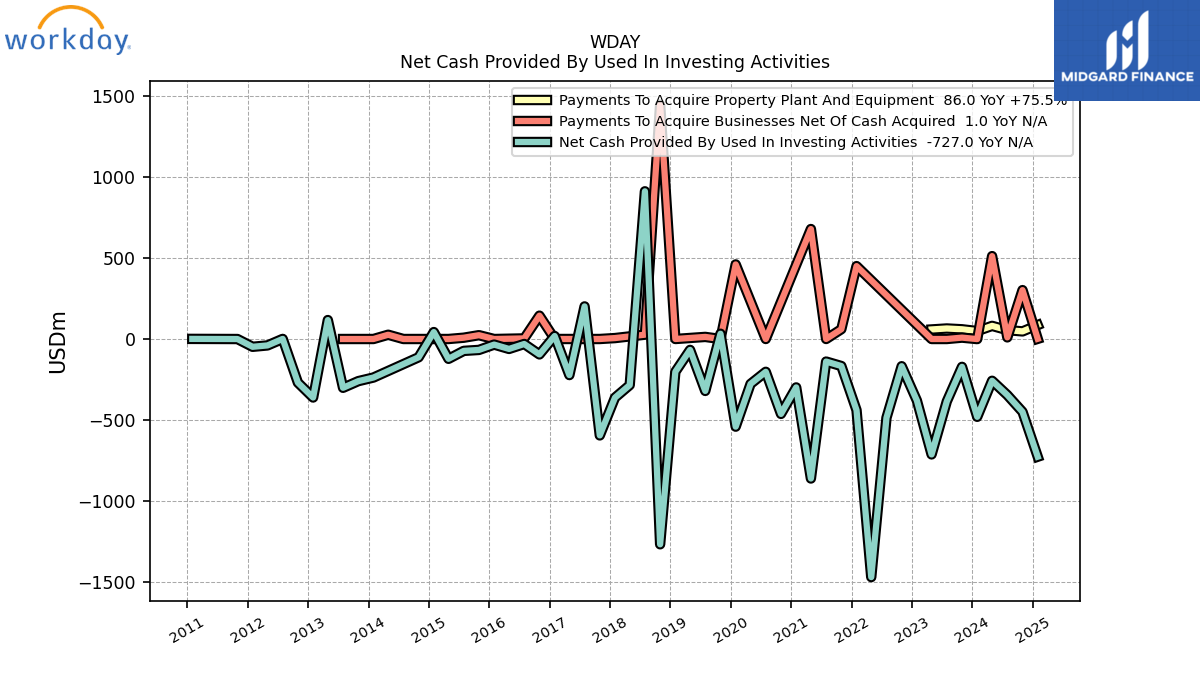
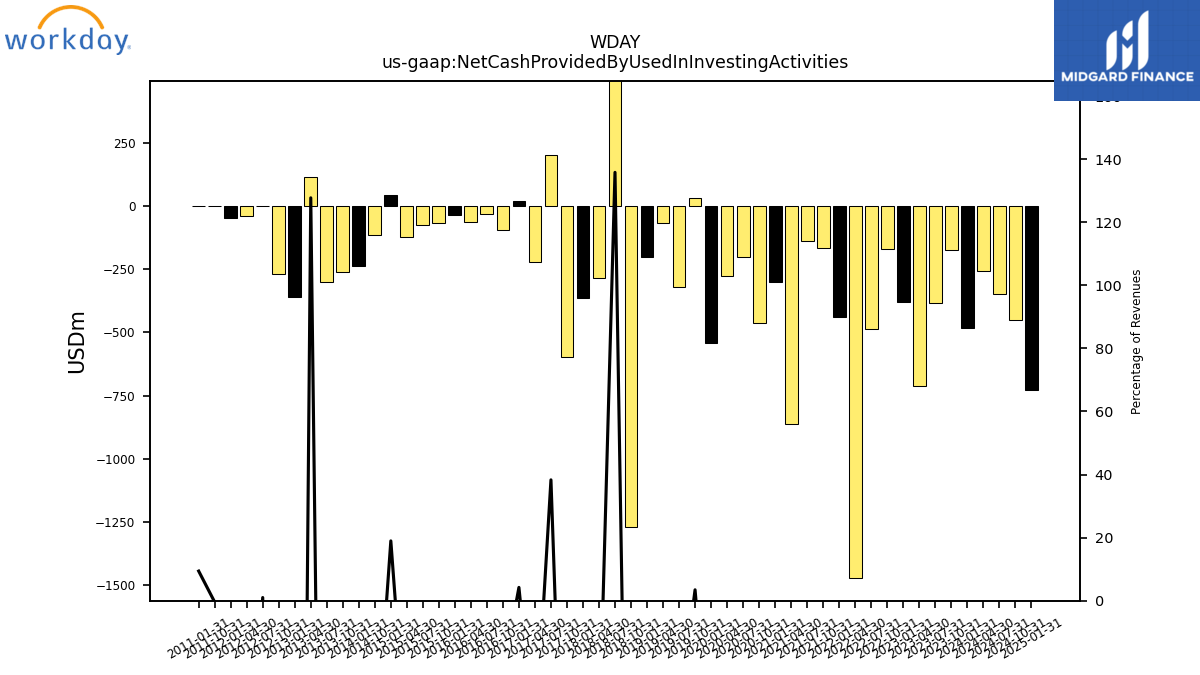
| Net Cash Provided By Used In Investing Activities | -172.01 | -385.34 | -712.98 | -380.13 | -168.06 | -487.00 | -1470.74 | -439.52 | -166.86 | -139.33 | -861.72 | -298.97 | -462.67 | -202.64 | -277.35 | -541.38 | 32.56 | -320.75 | -67.36 | -202.43 | -1268.08 | 912.31 | -284.59 | -361.98 | -595.46 | 201.34 | -222.89 | 18.46 | -95.22 | -30.78 | -61.34 | -34.60 | -67.48 | -73.40 | -122.49 | 42.94 | -112.93 | NA | NA | -237.96 | -260.30 | -301.43 | 117.06 | -361.50 | -269.62 | 0.64 | -39.64 | -48.13 | -0.15 | NA | NA | 0.69 | |
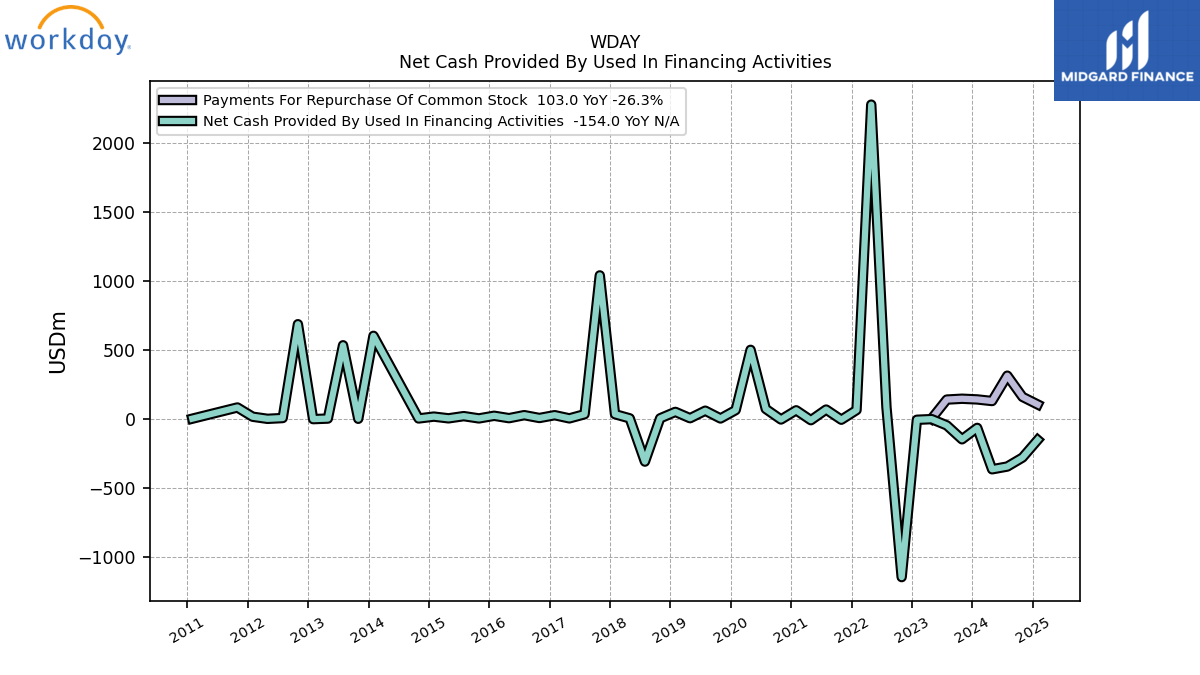
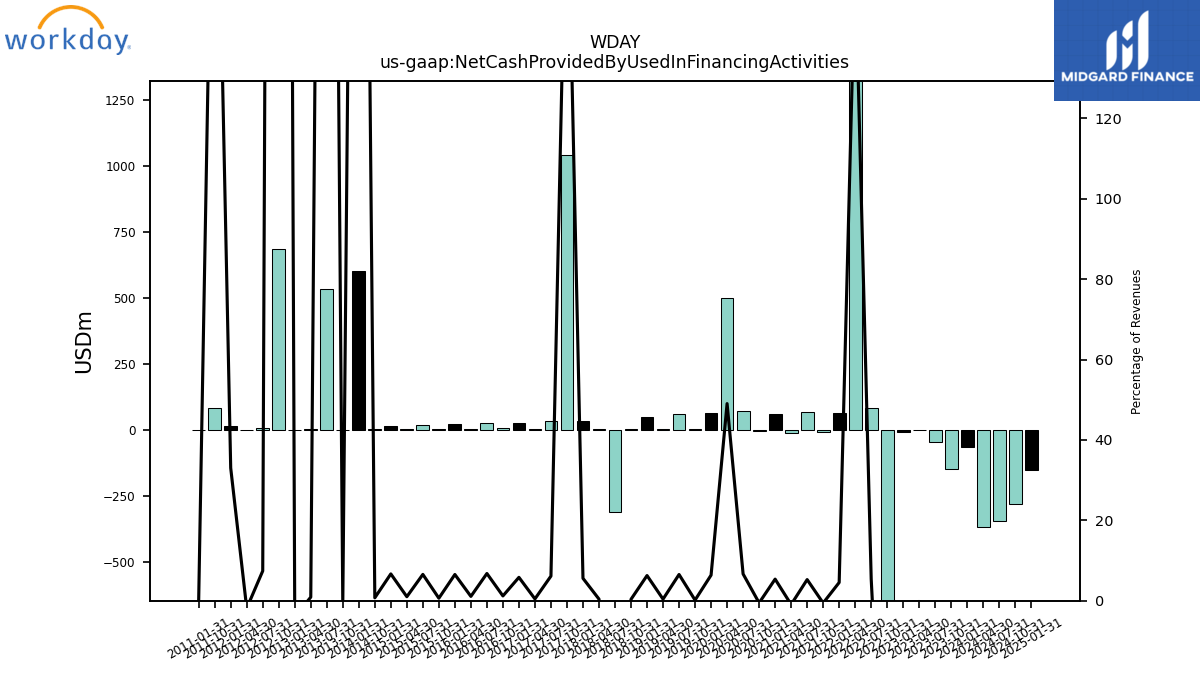
| Net Cash Provided By Used In Financing Activities | -149.56 | -48.60 | -3.16 | -7.89 | -1149.07 | 83.09 | 2277.70 | 62.48 | -7.52 | 66.30 | -11.01 | 60.84 | -5.91 | 70.78 | 499.33 | 62.21 | 1.60 | 57.95 | 3.36 | 49.41 | 2.70 | -311.38 | 2.55 | 32.50 | 1039.31 | 32.24 | 2.21 | 25.41 | 4.93 | 25.59 | 3.76 | 21.11 | 1.94 | 18.52 | 2.53 | 15.10 | 1.58 | NA | NA | 601.05 | -0.78 | 532.52 | 0.82 | -3.26 | 685.21 | 4.65 | -1.06 | 14.26 | 81.30 | NA | NA | 0.01 |
| 2023-10-31 | 2023-07-31 | 2023-04-30 | 2023-01-31 | 2022-10-31 | 2022-07-31 | 2022-04-30 | 2022-01-31 | 2021-10-31 | 2021-07-31 | 2021-04-30 | 2021-01-31 | 2020-10-31 | 2020-07-31 | 2020-04-30 | 2020-01-31 | 2019-10-31 | 2019-07-31 | 2019-04-30 | 2019-01-31 | 2018-10-31 | 2018-07-31 | 2018-04-30 | 2018-01-31 | 2017-10-31 | 2017-07-31 | 2017-04-30 | 2017-01-31 | 2016-10-31 | 2016-07-31 | 2016-04-30 | 2016-01-31 | 2015-10-31 | 2015-07-31 | 2015-04-30 | 2015-01-31 | 2014-10-31 | 2014-07-31 | 2014-04-30 | 2014-01-31 | 2013-10-31 | 2013-07-31 | 2013-04-30 | 2013-01-31 | 2012-10-31 | 2012-07-31 | 2012-04-30 | 2012-01-31 | 2011-10-31 | 2011-07-31 | 2011-04-30 | 2011-01-31 | ||
|---|---|---|---|---|---|---|---|---|---|---|---|---|---|---|---|---|---|---|---|---|---|---|---|---|---|---|---|---|---|---|---|---|---|---|---|---|---|---|---|---|---|---|---|---|---|---|---|---|---|---|---|---|---|
| Net Cash Provided By Used In Operating Activities | 450.77 | 425.26 | 277.32 | 694.45 | 408.67 | 114.36 | 439.72 | 615.15 | 384.65 | 198.47 | 452.43 | 553.75 | 293.80 | 157.21 | 263.68 | 297.11 | 258.00 | 100.32 | 209.16 | 250.51 | 114.30 | 57.62 | 184.23 | 126.55 | 144.03 | 15.13 | 180.02 | 109.47 | 71.46 | 6.26 | 161.47 | 93.92 | 55.15 | 15.19 | 92.20 | 48.27 | 41.04 | NA | NA | 34.79 | 7.08 | -12.92 | 17.31 | 5.94 | -9.36 | 1.92 | 12.71 | -6.64 | -5.51 | NA | NA | -1.07 | |
| Net Income Loss | 113.71 | 78.66 | 0.14 | -125.70 | -74.72 | -64.16 | -102.17 | -73.25 | 43.41 | 105.74 | -46.52 | -71.71 | -24.34 | -28.02 | -158.37 | -127.96 | -115.73 | -120.71 | -116.28 | NA | NA | NA | NA | NA | NA | NA | NA | NA | NA | NA | NA | NA | NA | NA | NA | NA | NA | NA | NA | -55.98 | -47.53 | -35.98 | -33.02 | -30.94 | -41.47 | -27.09 | -20.26 | -23.84 | -19.80 | -20.54 | -15.79 | -5.45 | |
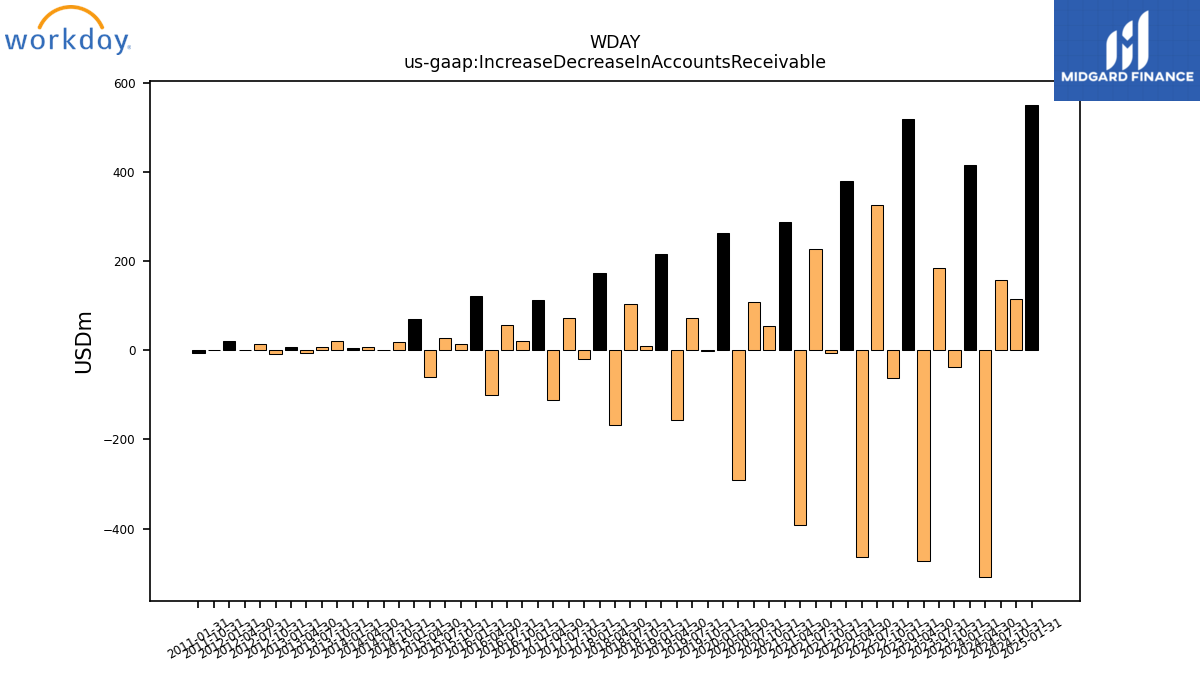
| Increase Decrease In Accounts Receivable | -37.72 | 183.39 | -473.31 | 518.61 | -61.88 | 324.84 | -462.96 | 379.19 | -6.65 | 227.51 | -392.12 | 286.90 | 53.92 | 109.32 | -290.90 | 262.28 | -2.20 | 73.44 | -157.38 | 215.09 | 9.38 | 104.76 | -168.70 | 174.08 | -19.07 | 71.42 | -111.81 | 113.33 | 20.36 | 55.99 | -101.05 | 122.68 | 14.73 | 27.57 | -59.72 | 69.82 | 18.60 | 1.44 | 7.01 | 5.36 | 20.00 | 6.81 | -7.13 | 6.34 | -7.38 | 13.54 | 0.47 | 21.77 | -0.48 | NA | NA | -5.92 | |
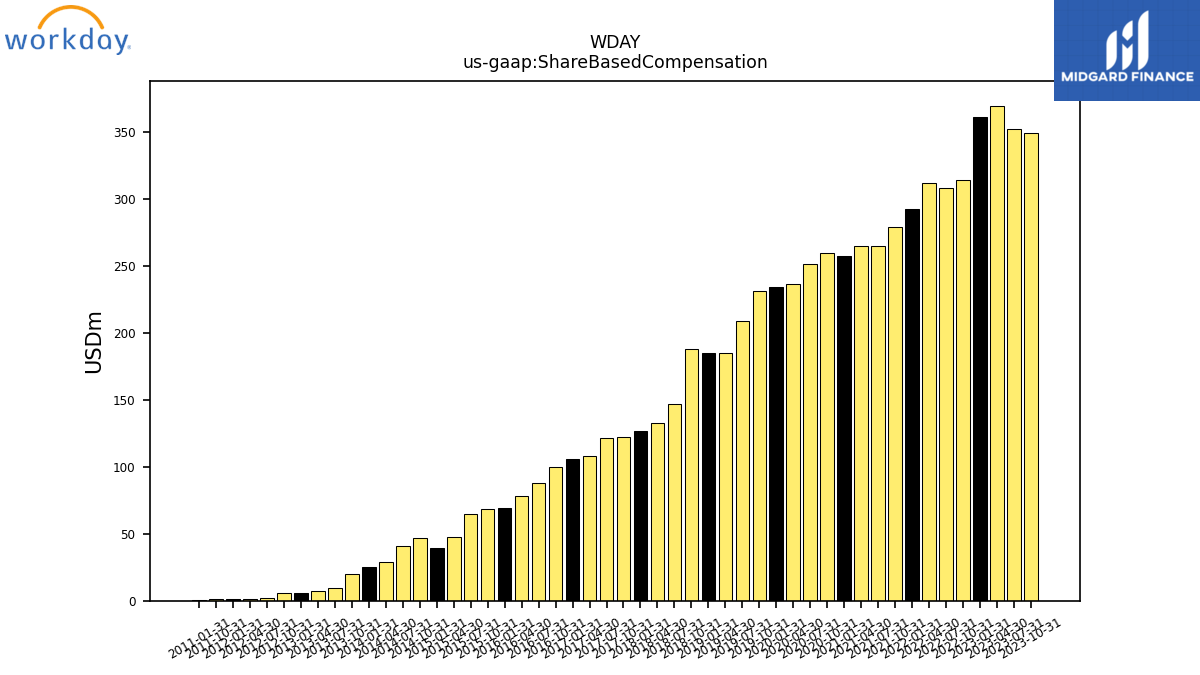
| Share Based Compensation | 349.26 | 351.91 | 369.46 | 360.91 | 314.20 | 308.01 | 311.51 | 292.24 | 279.00 | 264.72 | 264.63 | 257.11 | 259.83 | 251.24 | 236.67 | 234.42 | 231.00 | 208.91 | 185.24 | 184.77 | 187.97 | 147.06 | 132.66 | 126.64 | 122.48 | 121.52 | 107.79 | 105.72 | 100.10 | 88.22 | 78.23 | 69.27 | 68.66 | 64.76 | 47.27 | 39.38 | 47.01 | 40.78 | 28.87 | 24.97 | 19.68 | 9.78 | 7.42 | 5.45 | 6.15 | 2.28 | 1.45 | 1.43 | 1.11 | NA | NA | 0.19 |
| 2023-10-31 | 2023-07-31 | 2023-04-30 | 2023-01-31 | 2022-10-31 | 2022-07-31 | 2022-04-30 | 2022-01-31 | 2021-10-31 | 2021-07-31 | 2021-04-30 | 2021-01-31 | 2020-10-31 | 2020-07-31 | 2020-04-30 | 2020-01-31 | 2019-10-31 | 2019-07-31 | 2019-04-30 | 2019-01-31 | 2018-10-31 | 2018-07-31 | 2018-04-30 | 2018-01-31 | 2017-10-31 | 2017-07-31 | 2017-04-30 | 2017-01-31 | 2016-10-31 | 2016-07-31 | 2016-04-30 | 2016-01-31 | 2015-10-31 | 2015-07-31 | 2015-04-30 | 2015-01-31 | 2014-10-31 | 2014-07-31 | 2014-04-30 | 2014-01-31 | 2013-10-31 | 2013-07-31 | 2013-04-30 | 2013-01-31 | 2012-10-31 | 2012-07-31 | 2012-04-30 | 2012-01-31 | 2011-10-31 | 2011-07-31 | 2011-04-30 | 2011-01-31 | ||
|---|---|---|---|---|---|---|---|---|---|---|---|---|---|---|---|---|---|---|---|---|---|---|---|---|---|---|---|---|---|---|---|---|---|---|---|---|---|---|---|---|---|---|---|---|---|---|---|---|---|---|---|---|---|
| Net Cash Provided By Used In Investing Activities | -172.01 | -385.34 | -712.98 | -380.13 | -168.06 | -487.00 | -1470.74 | -439.52 | -166.86 | -139.33 | -861.72 | -298.97 | -462.67 | -202.64 | -277.35 | -541.38 | 32.56 | -320.75 | -67.36 | -202.43 | -1268.08 | 912.31 | -284.59 | -361.98 | -595.46 | 201.34 | -222.89 | 18.46 | -95.22 | -30.78 | -61.34 | -34.60 | -67.48 | -73.40 | -122.49 | 42.94 | -112.93 | NA | NA | -237.96 | -260.30 | -301.43 | 117.06 | -361.50 | -269.62 | 0.64 | -39.64 | -48.13 | -0.15 | NA | NA | 0.69 |
| 2023-10-31 | 2023-07-31 | 2023-04-30 | 2023-01-31 | 2022-10-31 | 2022-07-31 | 2022-04-30 | 2022-01-31 | 2021-10-31 | 2021-07-31 | 2021-04-30 | 2021-01-31 | 2020-10-31 | 2020-07-31 | 2020-04-30 | 2020-01-31 | 2019-10-31 | 2019-07-31 | 2019-04-30 | 2019-01-31 | 2018-10-31 | 2018-07-31 | 2018-04-30 | 2018-01-31 | 2017-10-31 | 2017-07-31 | 2017-04-30 | 2017-01-31 | 2016-10-31 | 2016-07-31 | 2016-04-30 | 2016-01-31 | 2015-10-31 | 2015-07-31 | 2015-04-30 | 2015-01-31 | 2014-10-31 | 2014-07-31 | 2014-04-30 | 2014-01-31 | 2013-10-31 | 2013-07-31 | 2013-04-30 | 2013-01-31 | 2012-10-31 | 2012-07-31 | 2012-04-30 | 2012-01-31 | 2011-10-31 | 2011-07-31 | 2011-04-30 | 2011-01-31 | ||
|---|---|---|---|---|---|---|---|---|---|---|---|---|---|---|---|---|---|---|---|---|---|---|---|---|---|---|---|---|---|---|---|---|---|---|---|---|---|---|---|---|---|---|---|---|---|---|---|---|---|---|---|---|---|
| Net Cash Provided By Used In Financing Activities | -149.56 | -48.60 | -3.16 | -7.89 | -1149.07 | 83.09 | 2277.70 | 62.48 | -7.52 | 66.30 | -11.01 | 60.84 | -5.91 | 70.78 | 499.33 | 62.21 | 1.60 | 57.95 | 3.36 | 49.41 | 2.70 | -311.38 | 2.55 | 32.50 | 1039.31 | 32.24 | 2.21 | 25.41 | 4.93 | 25.59 | 3.76 | 21.11 | 1.94 | 18.52 | 2.53 | 15.10 | 1.58 | NA | NA | 601.05 | -0.78 | 532.52 | 0.82 | -3.26 | 685.21 | 4.65 | -1.06 | 14.26 | 81.30 | NA | NA | 0.01 | |
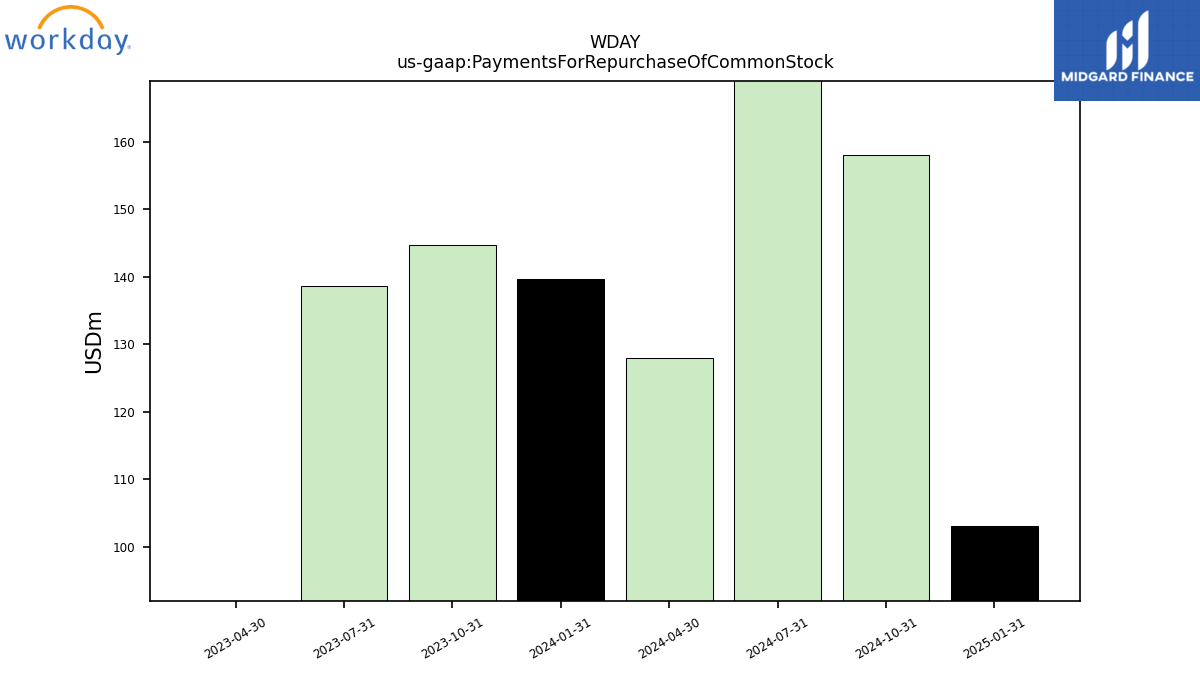
| Payments For Repurchase Of Common Stock | 144.69 | 138.65 | NA | NA | NA | NA | NA | NA | NA | NA | NA | NA | NA | NA | NA | NA | NA | NA | NA | NA | NA | NA | NA | NA | NA | NA | NA | NA | NA | NA | NA | NA | NA | NA | NA | NA | NA | NA | NA | NA | NA | NA | NA | NA | NA | NA | NA | NA | NA | NA | NA | NA |
| 2023-10-31 | 2023-07-31 | 2023-04-30 | 2023-01-31 | 2022-10-31 | 2022-07-31 | 2022-04-30 | 2022-01-31 | 2021-10-31 | 2021-07-31 | 2021-04-30 | 2021-01-31 | 2020-10-31 | 2020-07-31 | 2020-04-30 | 2020-01-31 | 2019-10-31 | 2019-07-31 | 2019-04-30 | 2019-01-31 | 2018-10-31 | 2018-07-31 | 2018-04-30 | 2018-01-31 | 2017-10-31 | 2017-07-31 | 2017-04-30 | 2017-01-31 | 2016-10-31 | 2016-07-31 | 2016-04-30 | 2016-01-31 | 2015-10-31 | 2015-07-31 | 2015-04-30 | 2015-01-31 | 2014-10-31 | 2014-07-31 | 2014-04-30 | 2014-01-31 | 2013-10-31 | 2013-07-31 | 2013-04-30 | 2013-01-31 | 2012-10-31 | 2012-07-31 | 2012-04-30 | 2012-01-31 | 2011-10-31 | 2011-07-31 | 2011-04-30 | 2011-01-31 | ||
|---|---|---|---|---|---|---|---|---|---|---|---|---|---|---|---|---|---|---|---|---|---|---|---|---|---|---|---|---|---|---|---|---|---|---|---|---|---|---|---|---|---|---|---|---|---|---|---|---|---|---|---|---|---|
| Revenues | 1865.67 | 1786.77 | 1684.31 | 1646.26 | 1599.10 | 1535.80 | 1434.66 | 1376.14 | 1327.26 | 1260.36 | 1175.03 | 1131.68 | 1105.96 | 1061.97 | 1018.38 | 976.30 | 938.10 | 887.75 | 825.05 | 788.63 | 743.19 | 671.72 | 618.64 | 582.48 | 555.39 | 525.32 | 479.86 | 436.67 | 409.58 | 377.72 | 345.43 | 323.43 | 305.27 | 282.70 | 250.96 | 226.27 | 215.07 | 186.78 | 159.74 | 141.87 | 127.87 | 107.56 | 91.64 | 81.52 | 72.62 | 62.70 | 56.82 | 43.16 | 36.45 | 30.13 | 24.69 | 7.28 | |
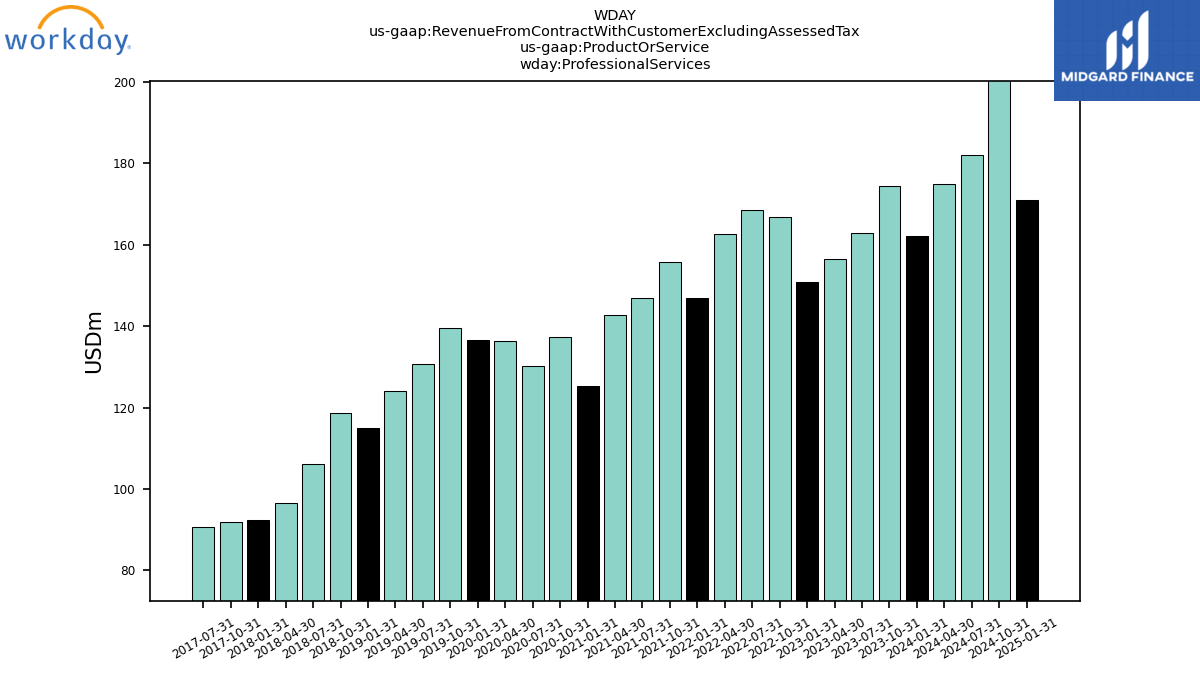
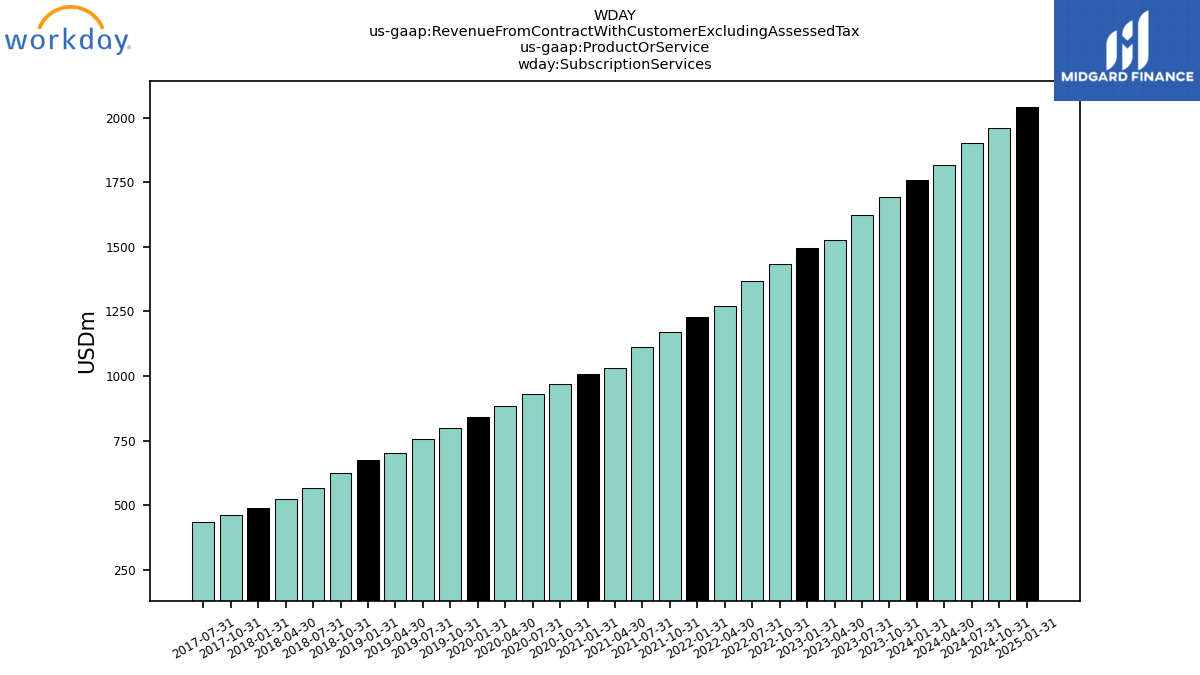
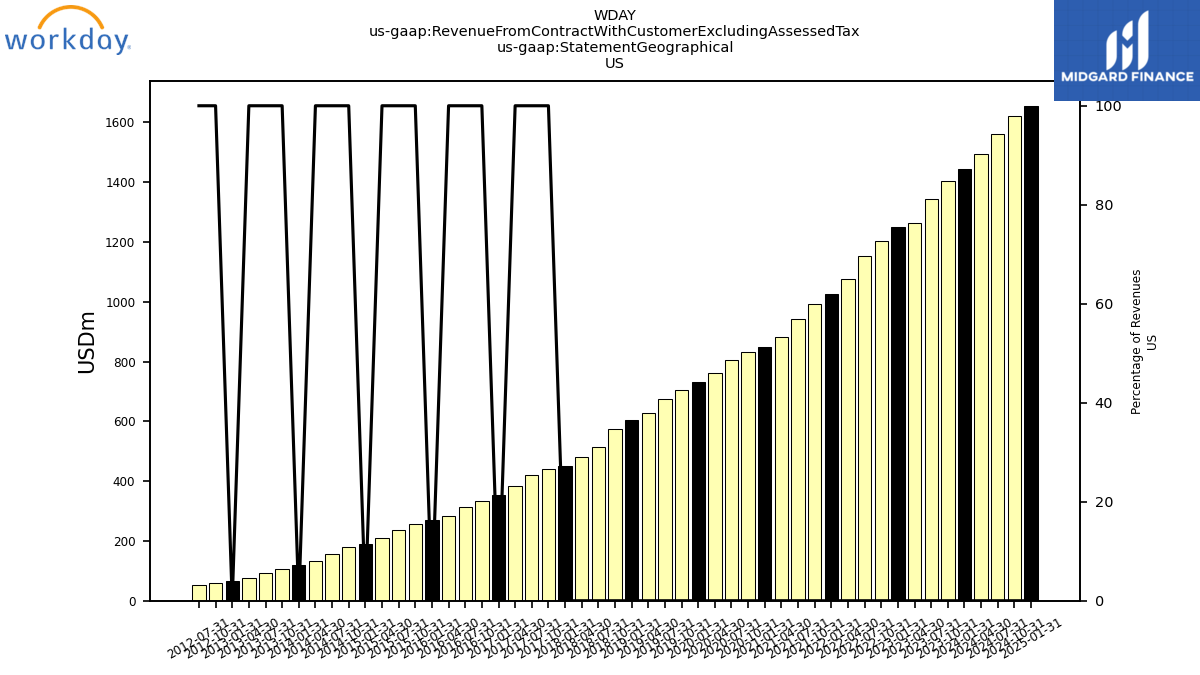
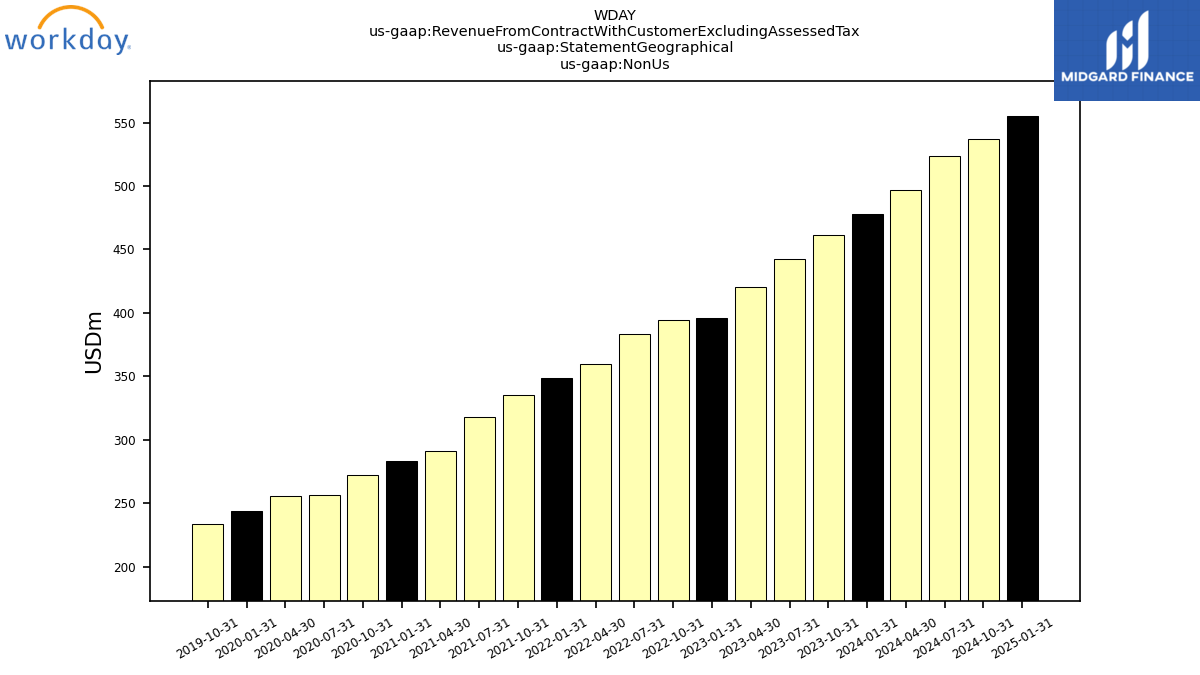
| Revenue From Contract With Customer Excluding Assessed Tax | 1865.67 | 1786.77 | 1684.31 | 1646.26 | 1599.10 | 1535.80 | 1434.66 | 1376.14 | 1327.26 | 1260.36 | 1175.03 | 1131.68 | 1105.96 | 1061.97 | 1018.38 | 976.30 | 938.10 | 887.75 | 825.05 | 788.63 | 743.19 | 671.72 | 618.64 | 582.48 | 555.39 | 525.32 | 479.86 | 436.67 | 409.58 | 377.72 | 345.43 | 323.43 | 305.27 | 282.70 | 250.96 | 226.27 | 215.07 | 186.78 | 159.74 | 141.87 | 127.87 | 107.56 | 91.64 | 81.52 | 72.62 | 62.70 | 56.82 | 43.16 | 36.45 | 30.13 | 24.69 | 7.28 | |
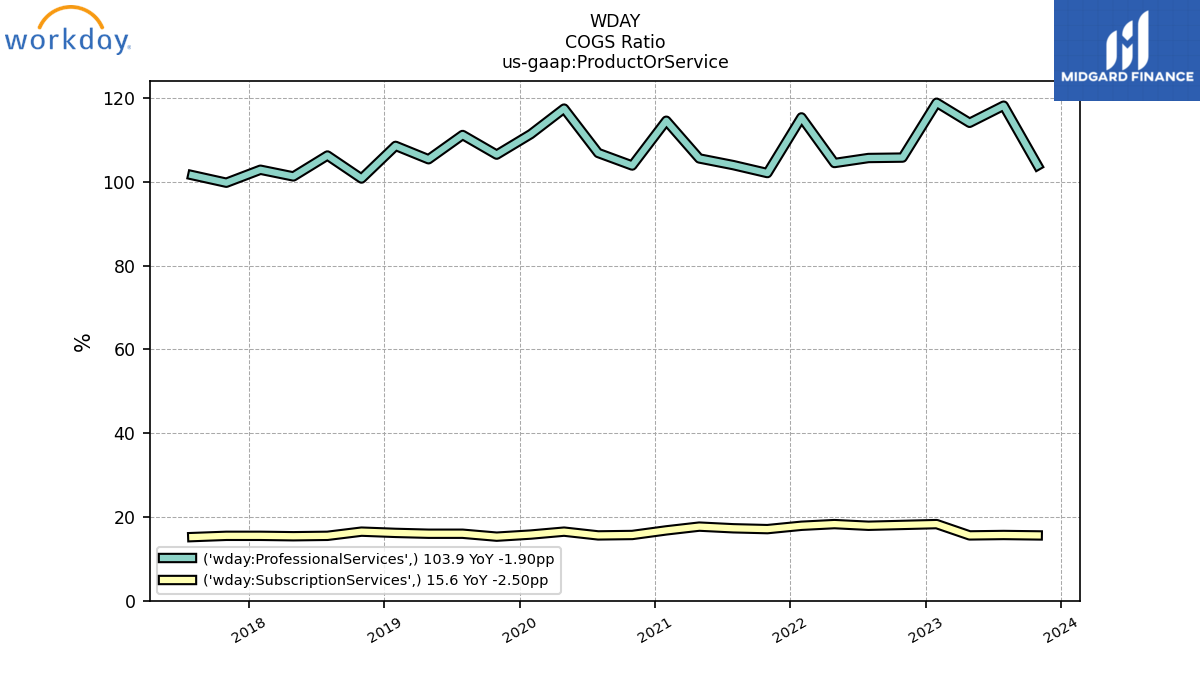
| Professional Services | 174.56 | 162.83 | 156.40 | 150.86 | 166.71 | 168.46 | 162.58 | 146.97 | 155.75 | 146.91 | 142.86 | 125.43 | 137.41 | 130.27 | 136.43 | 136.60 | 139.58 | 130.60 | 124.03 | 115.08 | 118.77 | 106.06 | 96.49 | 92.48 | 91.82 | 90.79 | NA | NA | NA | NA | NA | NA | NA | NA | NA | NA | NA | NA | NA | NA | NA | NA | NA | NA | NA | NA | NA | NA | NA | NA | NA | NA | |
| Subscription Services | 1691.12 | 1623.94 | 1527.91 | 1495.40 | 1432.39 | 1367.34 | 1272.08 | 1229.17 | 1171.52 | 1113.45 | 1032.17 | 1006.25 | 968.55 | 931.70 | 881.96 | 839.69 | 798.52 | 757.15 | 701.02 | 673.54 | 624.42 | 565.66 | 522.15 | 490.00 | 463.57 | 434.53 | NA | NA | NA | NA | NA | NA | NA | NA | NA | NA | NA | NA | NA | NA | NA | NA | NA | NA | NA | NA | NA | NA | NA | NA | NA | NA | |
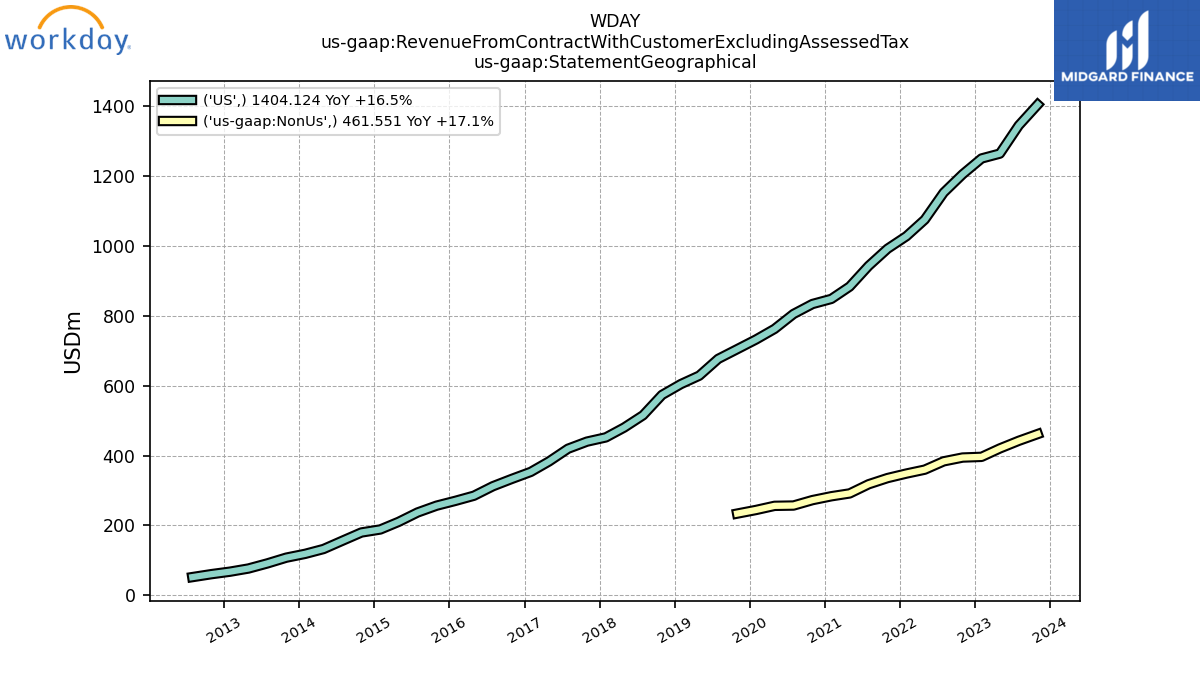
| US | 1404.12 | 1344.57 | 1263.96 | 1250.04 | 1204.84 | 1152.36 | 1075.05 | 1027.66 | 991.75 | 942.56 | 883.44 | 848.19 | 833.54 | 805.06 | 762.34 | 732.07 | 704.26 | 676.57 | 628.53 | 604.53 | 573.47 | 515.26 | 480.08 | 451.92 | 439.79 | 419.47 | 383.17 | 353.18 | 333.13 | 312.15 | 285.02 | 270.37 | 256.51 | 237.06 | 210.28 | 188.44 | 179.82 | 156.29 | 132.53 | 118.73 | 107.80 | 91.33 | 76.70 | 67.73 | 60.50 | 52.08 | NA | NA | NA | NA | NA | NA | |
| Non Us | 461.55 | 442.19 | 420.35 | 396.22 | 394.26 | 383.44 | 359.61 | 348.48 | 335.52 | 317.80 | 291.59 | 283.50 | 272.42 | 256.91 | 256.05 | 244.23 | 233.84 | NA | NA | NA | NA | NA | NA | NA | NA | NA | NA | NA | NA | NA | NA | NA | NA | NA | NA | NA | NA | NA | NA | NA | NA | NA | NA | NA | NA | NA | NA | NA | NA | NA | NA | NA |


