
| 2024-03-31 | 2023-12-31 | 2023-09-30 | 2023-06-30 | 2023-03-31 | 2022-12-31 | 2022-09-30 | 2022-06-30 | 2022-03-31 | 2021-12-31 | 2021-09-30 | 2021-06-30 | 2021-03-31 | 2020-12-31 | 2020-09-30 | 2020-06-30 | 2020-03-31 | 2019-12-31 | 2019-09-30 | 2019-06-30 | 2019-03-31 | 2018-12-31 | 2018-09-30 | 2018-06-30 | 2018-03-31 | 2017-12-31 | 2017-09-30 | 2017-06-30 | 2017-03-31 | ||
|---|---|---|---|---|---|---|---|---|---|---|---|---|---|---|---|---|---|---|---|---|---|---|---|---|---|---|---|---|---|---|
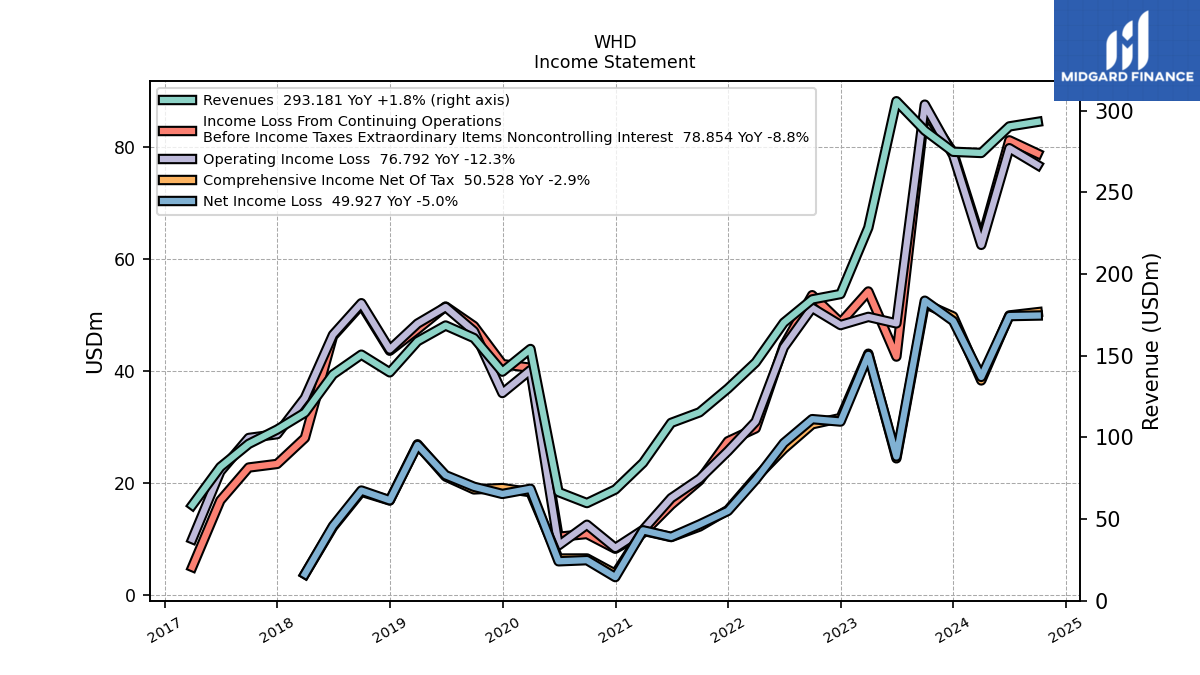
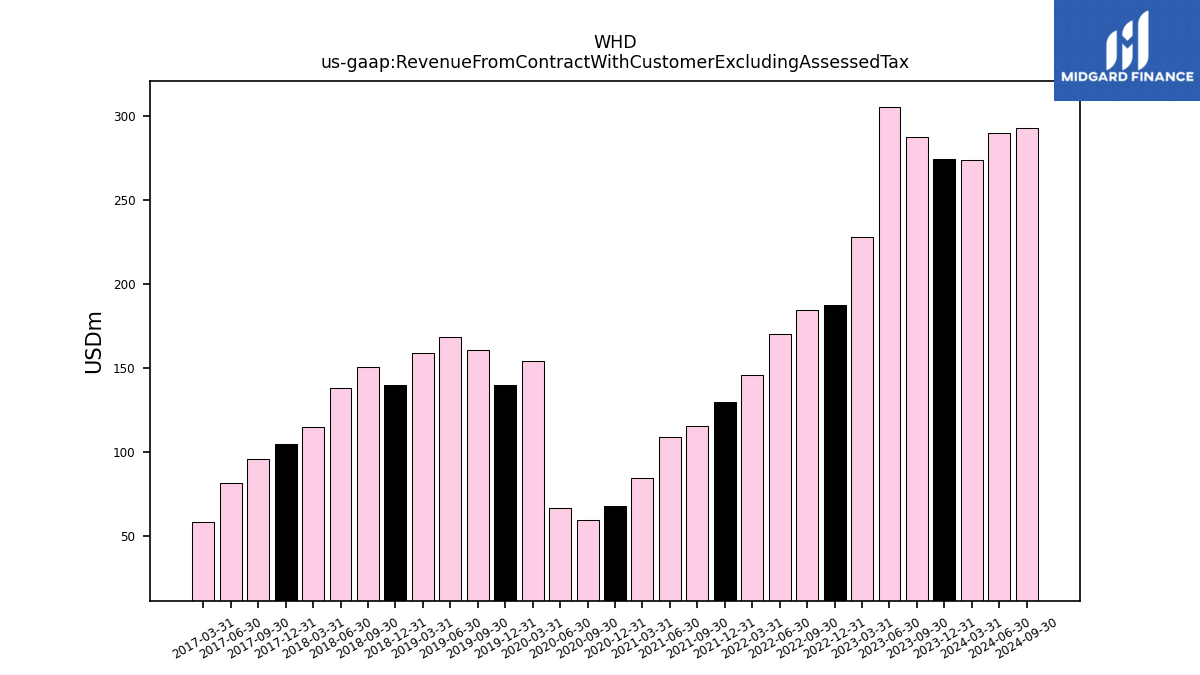
| Revenue From Contract With Customer Excluding Assessed Tax | 274.12 | 274.87 | 287.87 | 305.82 | 228.41 | 187.77 | 184.48 | 170.22 | 145.90 | 129.92 | 115.36 | 108.89 | 84.42 | 68.09 | 59.79 | 66.55 | 154.14 | 140.24 | 160.81 | 168.49 | 158.88 | 139.82 | 150.66 | 138.54 | 115.11 | 104.78 | 96.03 | 81.88 | 58.50 | |
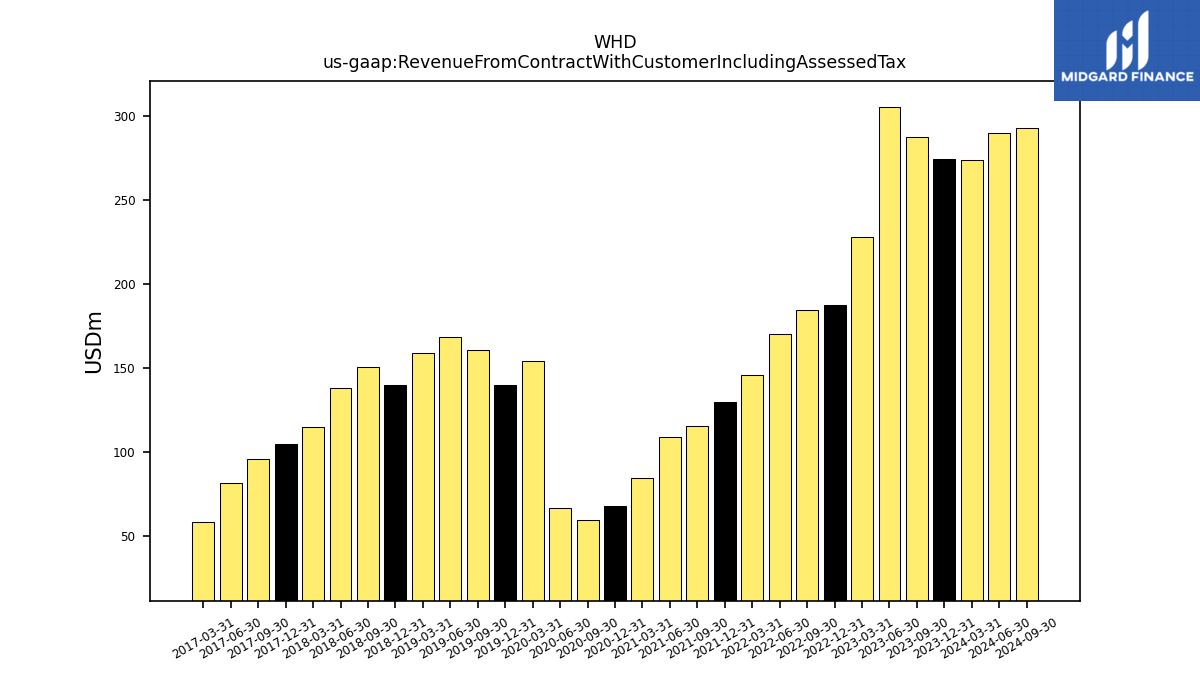
| Revenue From Contract With Customer Including Assessed Tax | 274.12 | 274.87 | 287.87 | 305.82 | 228.41 | 187.77 | 184.48 | 170.22 | 145.90 | 129.92 | 115.36 | 108.89 | 84.42 | 68.09 | 59.79 | 66.55 | 154.14 | 140.24 | 160.81 | 168.49 | 158.88 | 139.82 | 150.66 | 138.54 | 115.11 | 104.78 | 96.03 | 81.88 | 58.50 | |
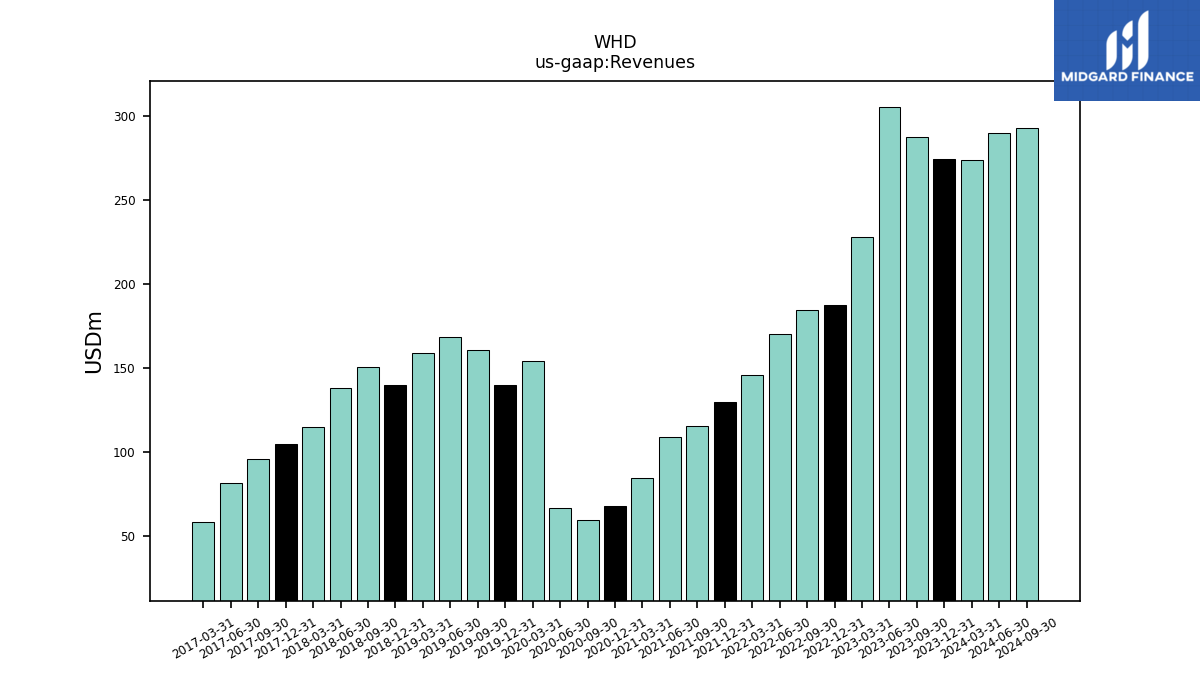
| Revenues | 274.12 | 274.87 | 287.87 | 305.82 | 228.41 | 187.77 | 184.48 | 170.22 | 145.90 | 129.92 | 115.36 | 108.89 | 84.42 | 68.09 | 59.79 | 66.55 | 154.14 | 140.24 | 160.81 | 168.49 | 158.88 | 139.82 | 150.66 | 138.54 | 115.11 | 104.78 | 96.03 | 81.88 | 58.50 | |
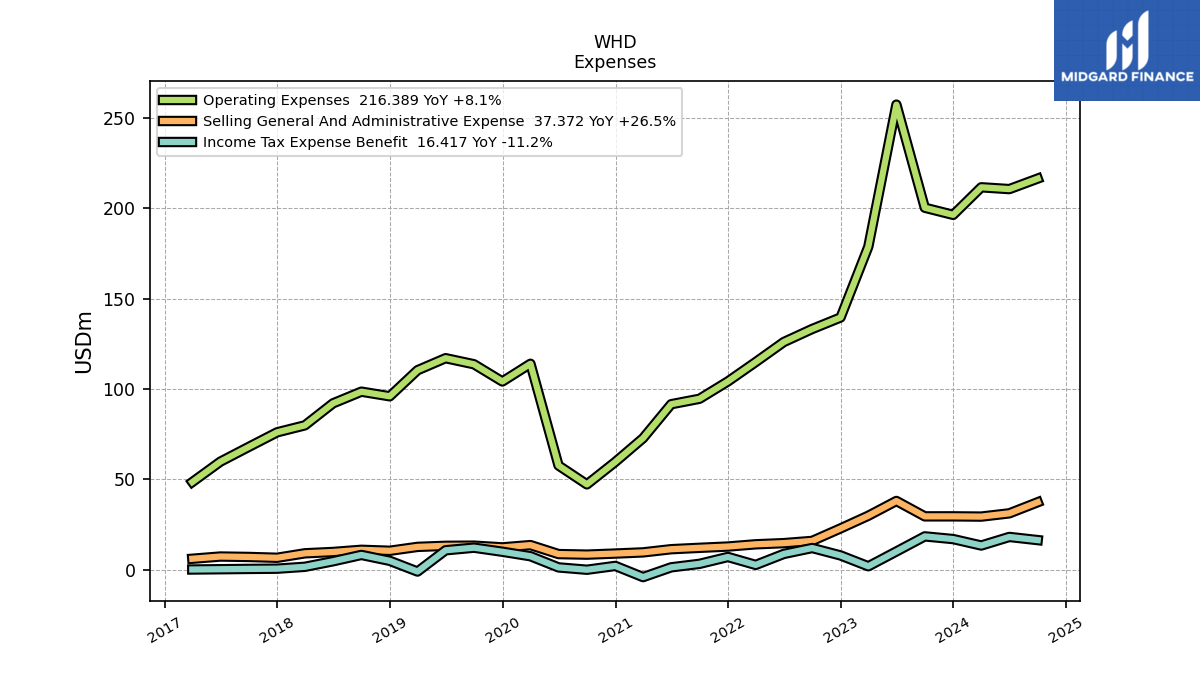
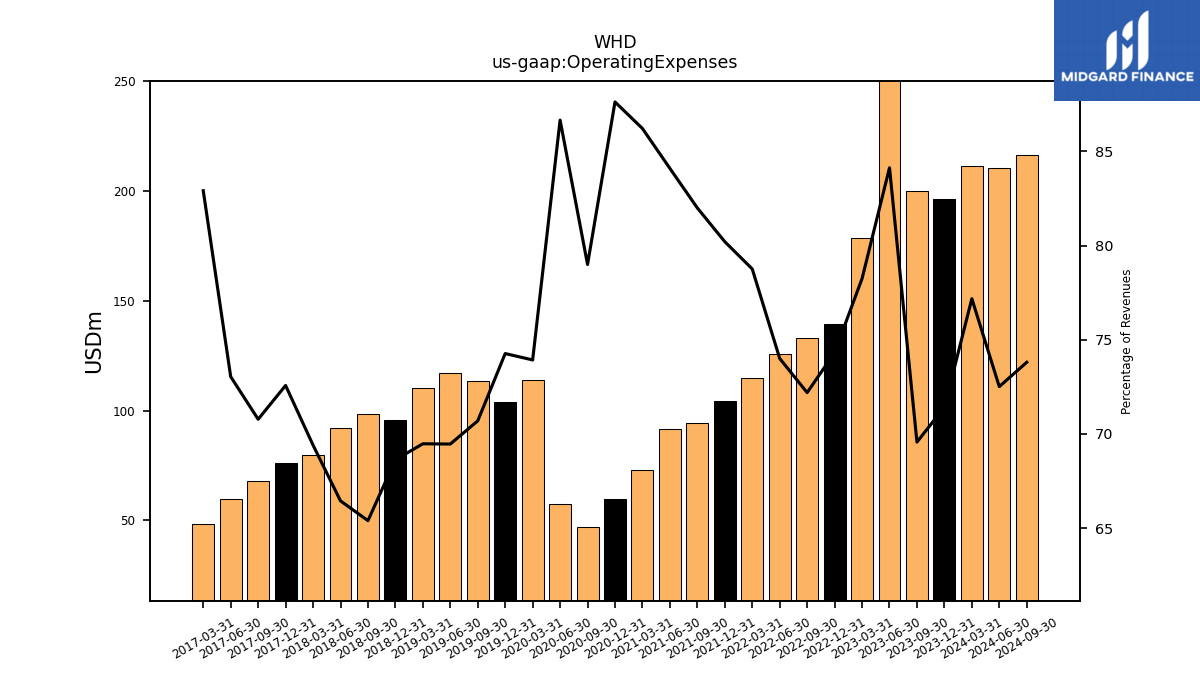
| Operating Expenses | 211.57 | 196.31 | 200.27 | 257.30 | 178.72 | 139.55 | 133.19 | 125.97 | 114.91 | 104.20 | 94.60 | 91.58 | 72.78 | 59.67 | 47.23 | 57.67 | 113.95 | 104.15 | 113.69 | 117.04 | 110.38 | 95.96 | 98.53 | 92.06 | 79.89 | 76.05 | 67.97 | 59.80 | 48.51 | |
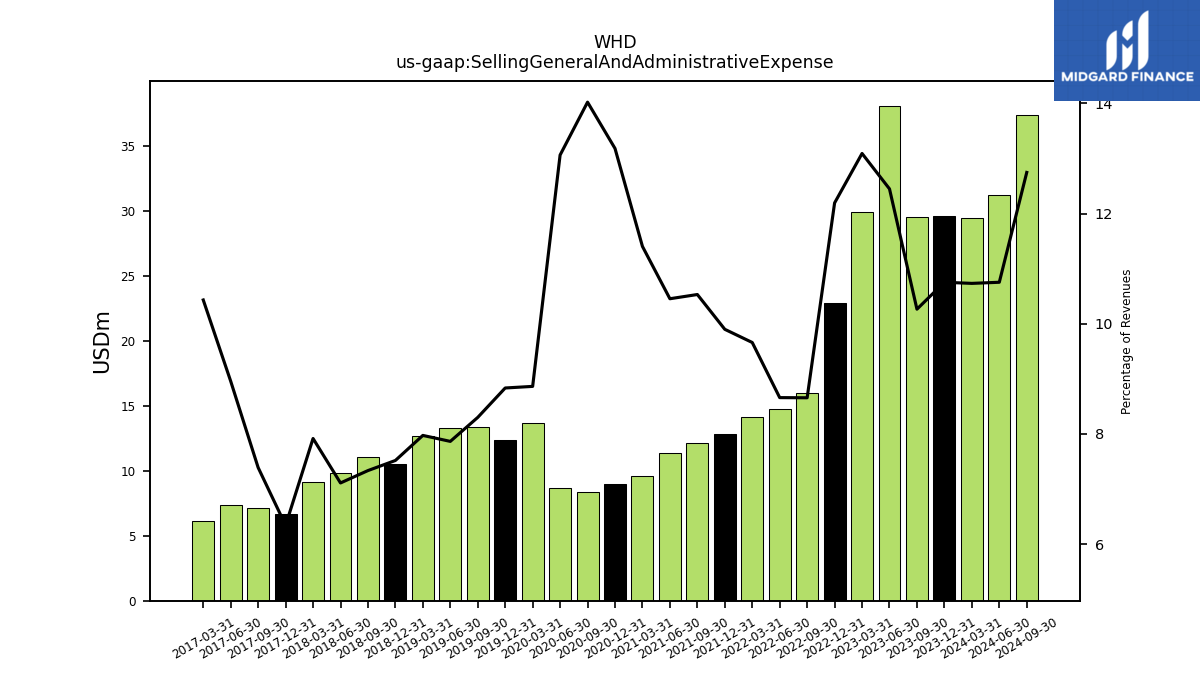
| Selling General And Administrative Expense | 29.42 | 29.56 | 29.55 | 38.07 | 29.90 | 22.90 | 15.97 | 14.74 | 14.09 | 12.86 | 12.15 | 11.38 | 9.63 | 8.98 | 8.38 | 8.69 | 13.66 | 12.39 | 13.35 | 13.25 | 12.67 | 10.51 | 11.05 | 9.85 | 9.11 | 6.64 | 7.10 | 7.33 | 6.10 | |
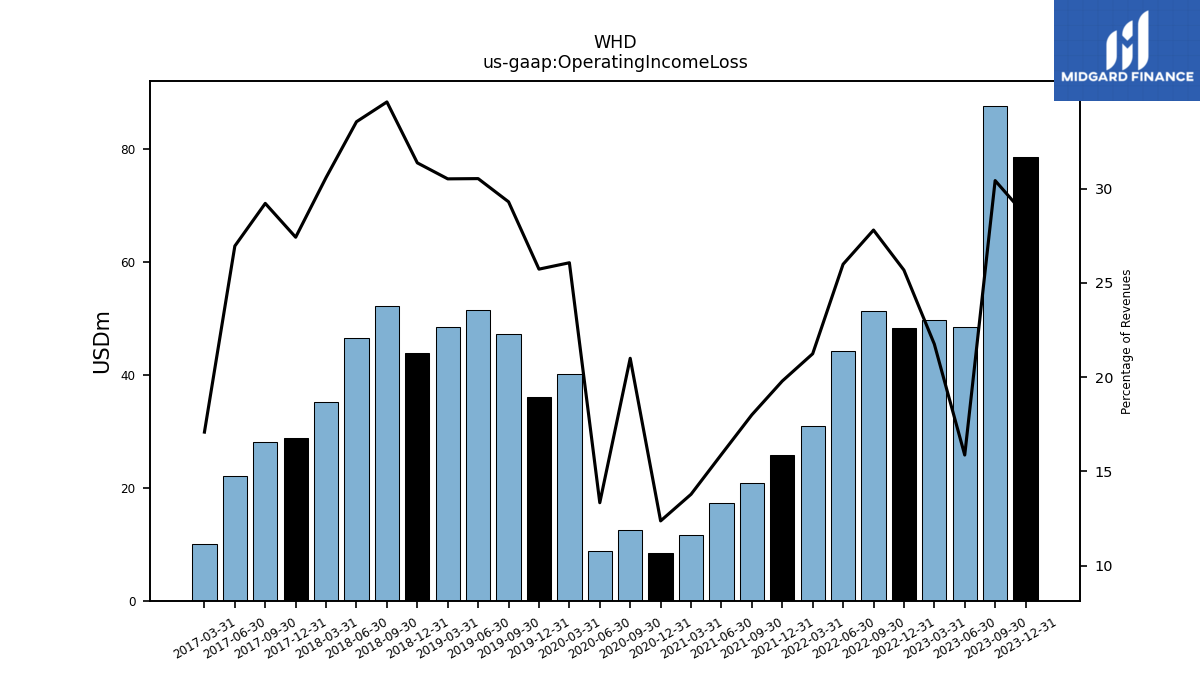
| Operating Income Loss | 62.55 | 78.55 | 87.60 | 48.52 | 49.69 | 48.22 | 51.30 | 44.24 | 30.99 | 25.71 | 20.77 | 17.31 | 11.63 | 8.42 | 12.56 | 8.88 | 40.19 | 36.09 | 47.12 | 51.45 | 48.49 | 43.86 | 52.13 | 46.49 | 35.22 | 28.74 | 28.06 | 22.07 | 9.99 | |
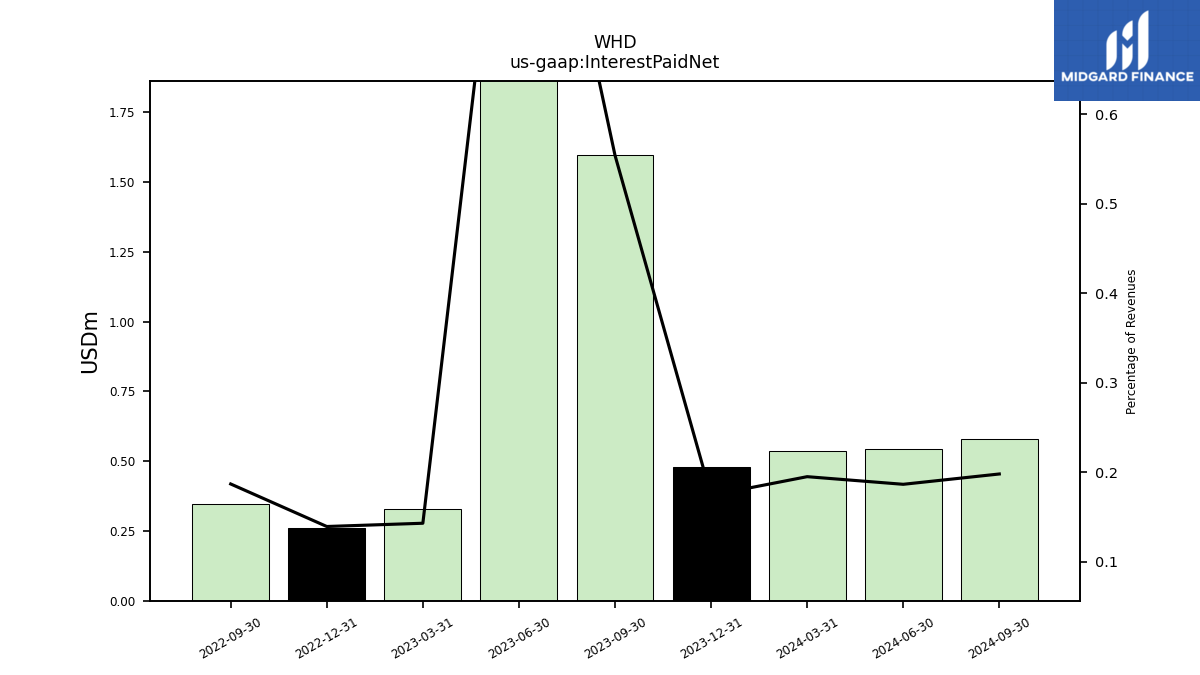
| Interest Paid Net | 0.54 | 0.48 | 1.59 | 3.23 | 0.33 | 0.26 | 0.34 | NA | NA | NA | NA | NA | NA | NA | NA | NA | NA | NA | NA | NA | NA | NA | NA | NA | NA | NA | NA | NA | NA | |
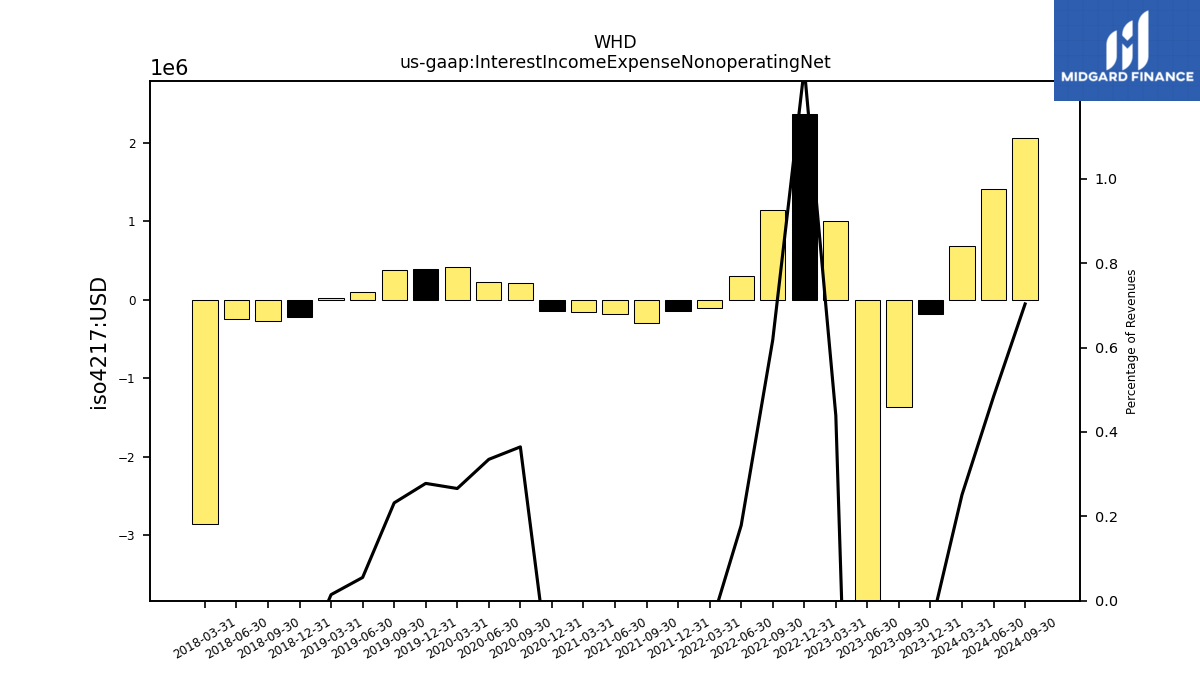
| Interest Income Expense Nonoperating Net | 0.69 | -0.18 | -1.37 | -5.93 | 1.00 | 2.37 | 1.14 | 0.30 | -0.10 | -0.14 | -0.30 | -0.18 | -0.15 | -0.15 | 0.22 | 0.22 | 0.41 | 0.39 | 0.37 | 0.09 | 0.02 | -0.23 | -0.27 | -0.25 | -2.85 | NA | NA | NA | NA | |
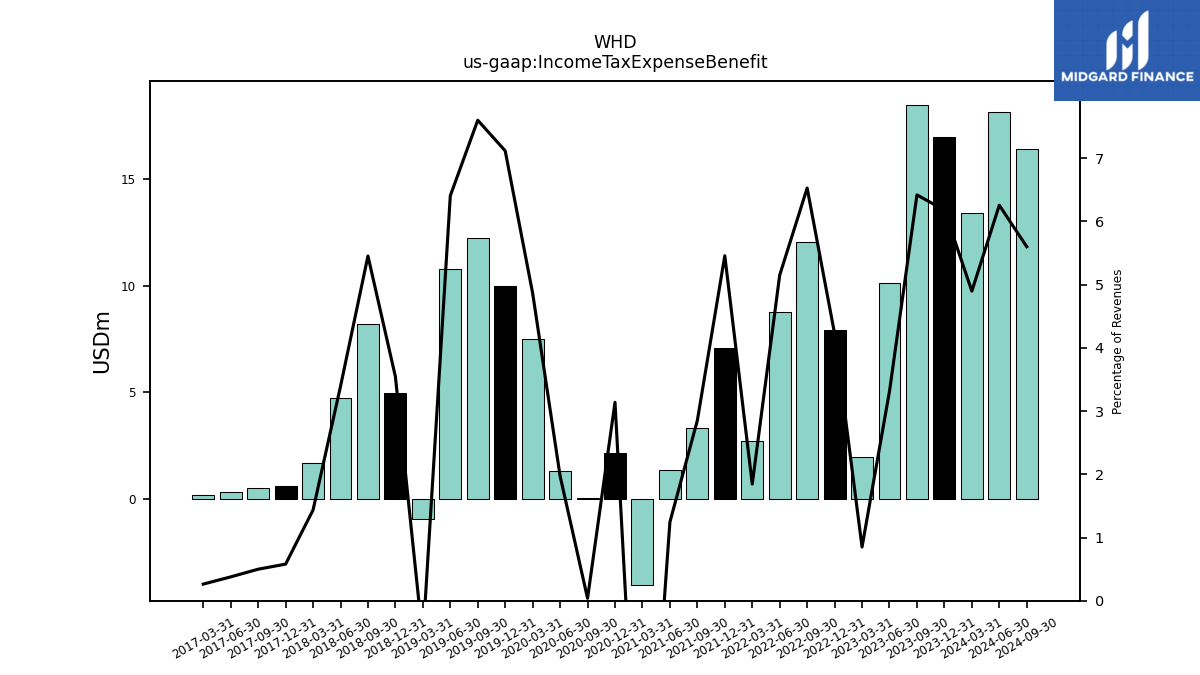
| Income Tax Expense Benefit | 13.42 | 16.98 | 18.48 | 10.13 | 1.94 | 7.93 | 12.04 | 8.77 | 2.69 | 7.09 | 3.29 | 1.35 | -4.06 | 2.14 | 0.02 | 1.31 | 7.50 | 9.98 | 12.22 | 10.79 | -0.97 | 4.96 | 8.21 | 4.70 | 1.65 | 0.61 | 0.48 | 0.31 | 0.15 | |
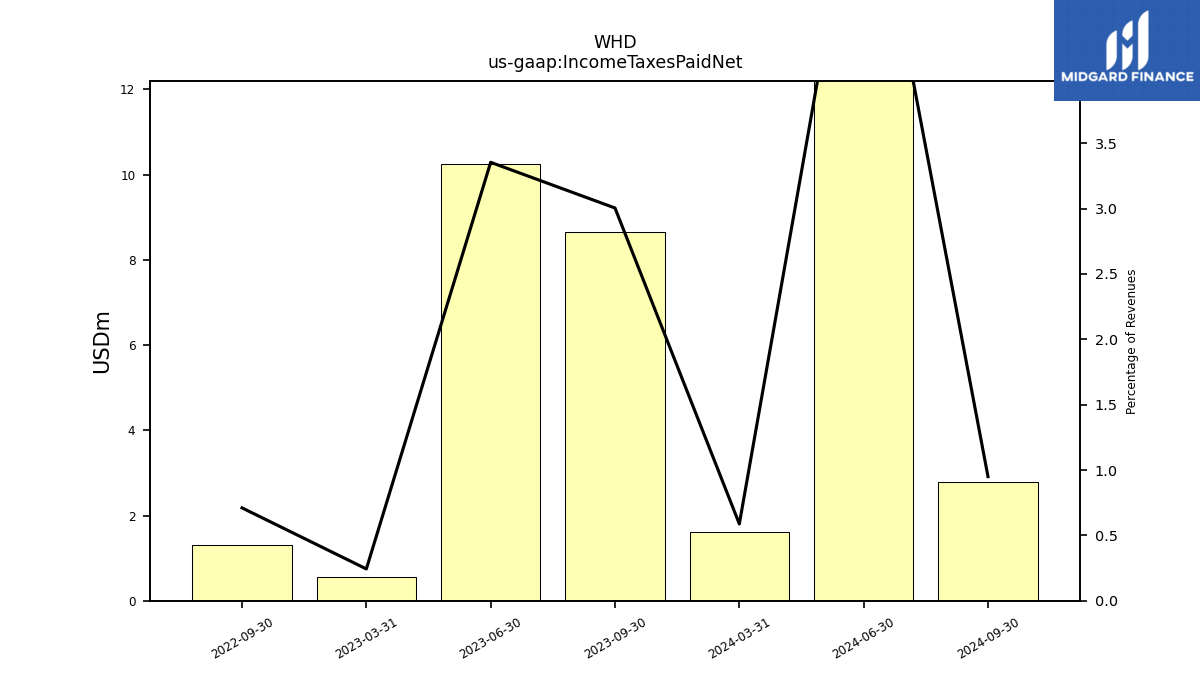
| Income Taxes Paid Net | 1.61 | NA | 8.65 | 10.26 | 0.56 | NA | 1.31 | NA | NA | NA | NA | NA | NA | NA | NA | NA | NA | NA | NA | NA | NA | NA | NA | NA | NA | NA | NA | NA | NA | |
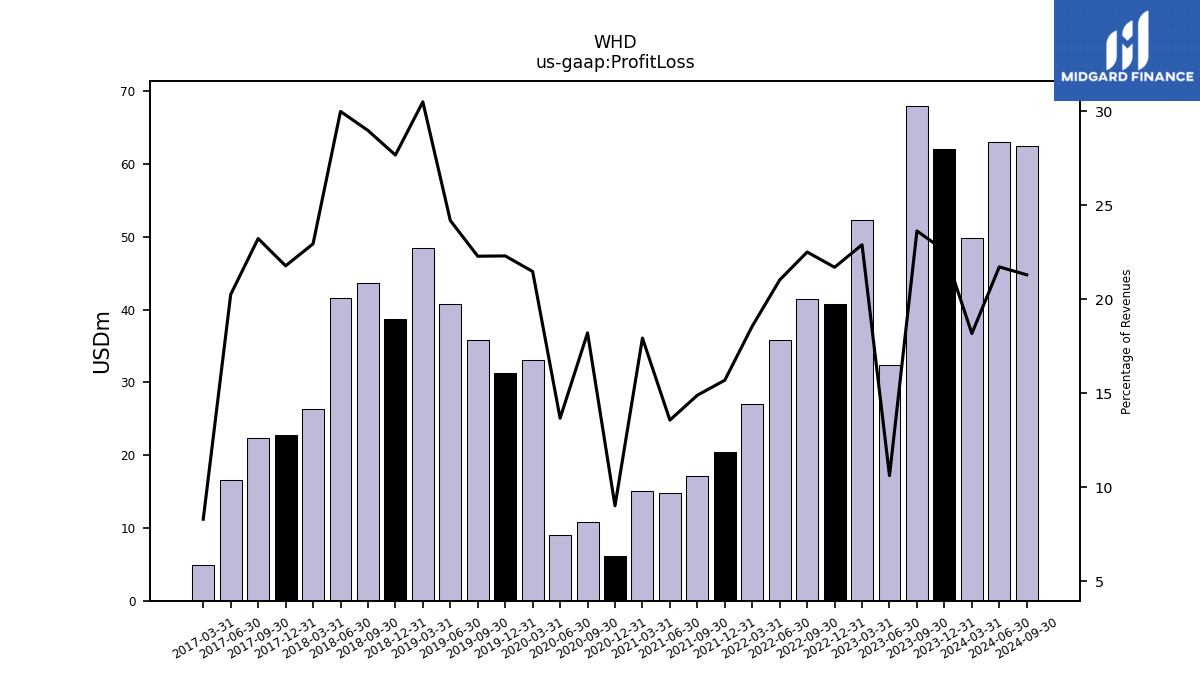
| Profit Loss | 49.81 | 62.07 | 68.02 | 32.46 | 52.29 | 40.74 | 41.52 | 35.78 | 27.08 | 20.38 | 17.18 | 14.77 | 15.14 | 6.14 | 10.89 | 9.10 | 33.10 | 31.27 | 35.83 | 40.75 | 48.45 | 38.68 | 43.65 | 41.54 | 26.41 | 22.81 | 22.30 | 16.58 | 4.85 | |
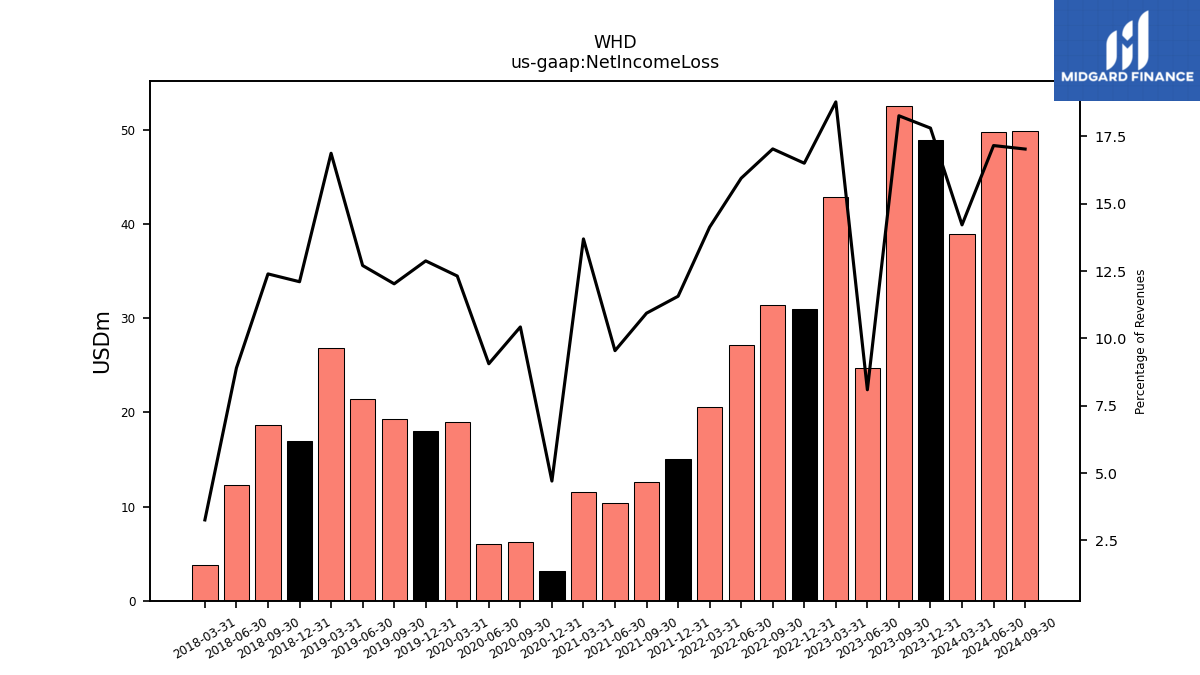
| Net Income Loss | 38.97 | 48.95 | 52.58 | 24.75 | 42.89 | 30.99 | 31.43 | 27.14 | 20.62 | 15.02 | 12.62 | 10.39 | 11.56 | 3.20 | 6.23 | 6.03 | 18.98 | 18.06 | 19.34 | 21.41 | 26.81 | 16.92 | 18.67 | 12.33 | 3.75 | NA | NA | NA | NA | |
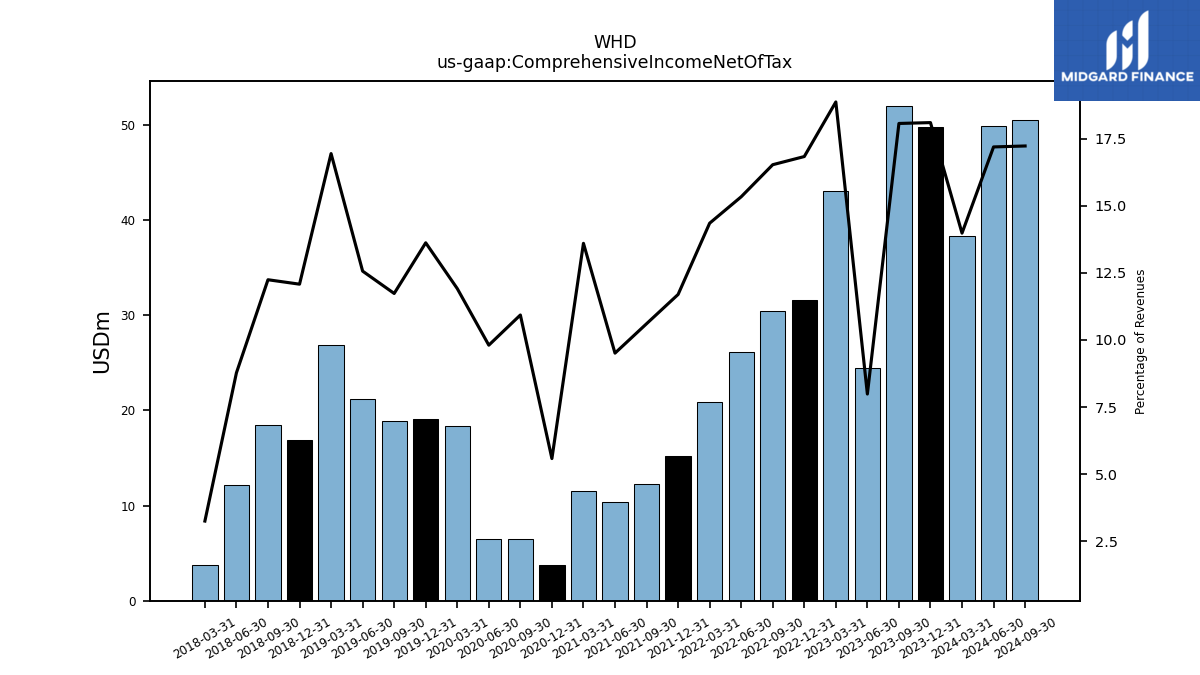
| Comprehensive Income Net Of Tax | 38.34 | 49.77 | 52.03 | 24.42 | 43.11 | 31.62 | 30.51 | 26.11 | 20.94 | 15.20 | 12.23 | 10.36 | 11.48 | 3.80 | 6.54 | 6.53 | 18.37 | 19.11 | 18.87 | 21.18 | 26.93 | 16.89 | 18.45 | 12.16 | 3.74 | NA | NA | NA | NA |
| 2024-03-31 | 2023-12-31 | 2023-09-30 | 2023-06-30 | 2023-03-31 | 2022-12-31 | 2022-09-30 | 2022-06-30 | 2022-03-31 | 2021-12-31 | 2021-09-30 | 2021-06-30 | 2021-03-31 | 2020-12-31 | 2020-09-30 | 2020-06-30 | 2020-03-31 | 2019-12-31 | 2019-09-30 | 2019-06-30 | 2019-03-31 | 2018-12-31 | 2018-09-30 | 2018-06-30 | 2018-03-31 | 2017-12-31 | 2017-09-30 | 2017-06-30 | 2017-03-31 | ||
|---|---|---|---|---|---|---|---|---|---|---|---|---|---|---|---|---|---|---|---|---|---|---|---|---|---|---|---|---|---|---|
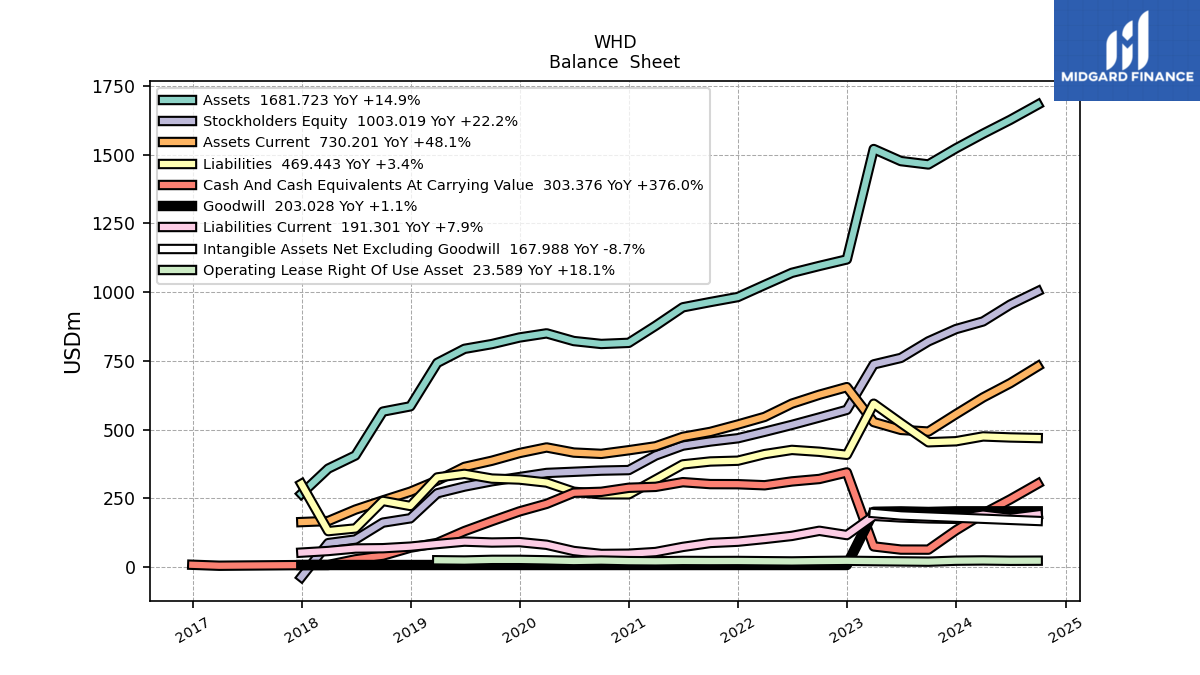
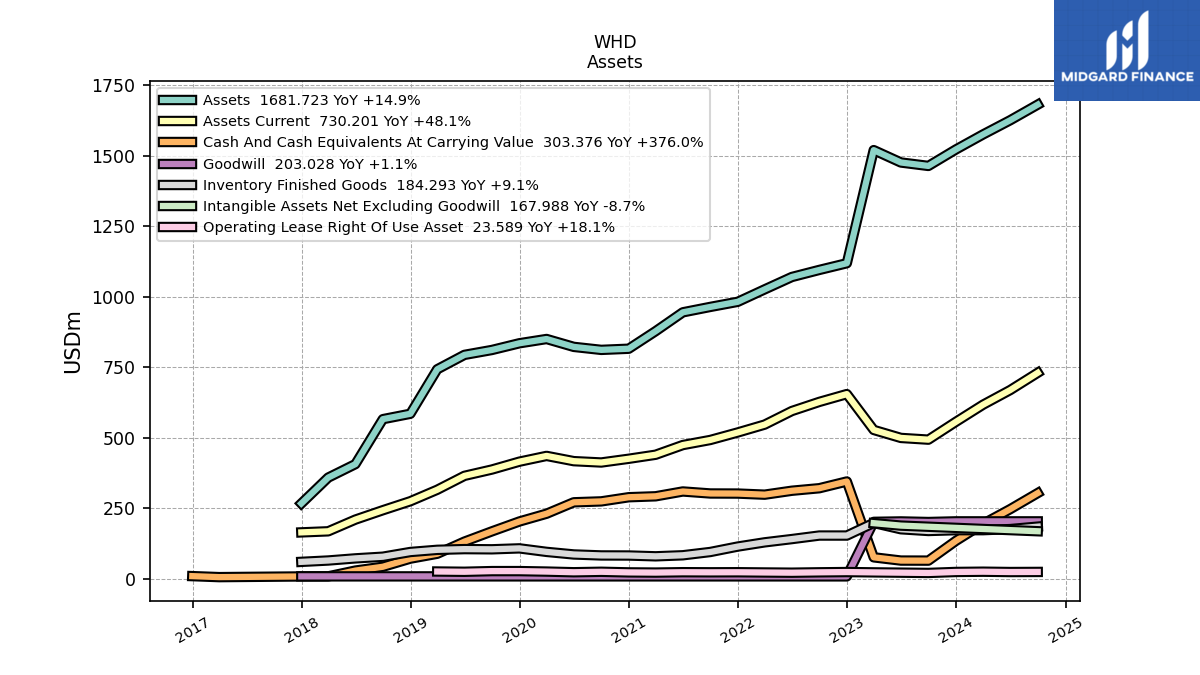
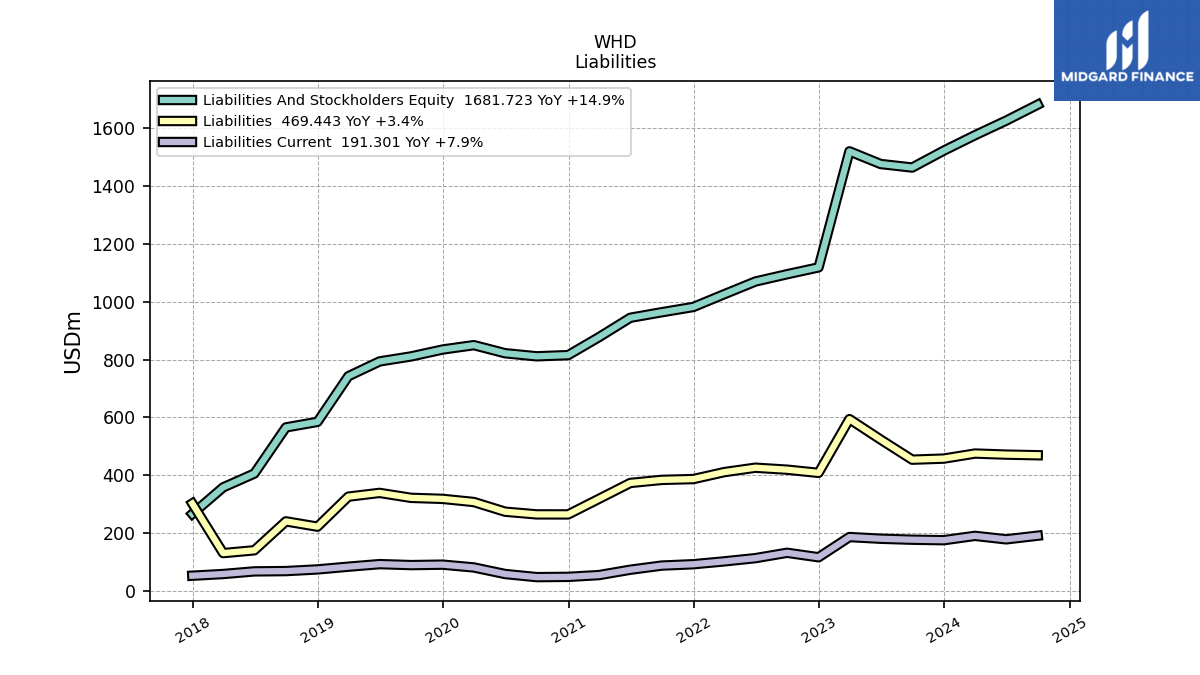
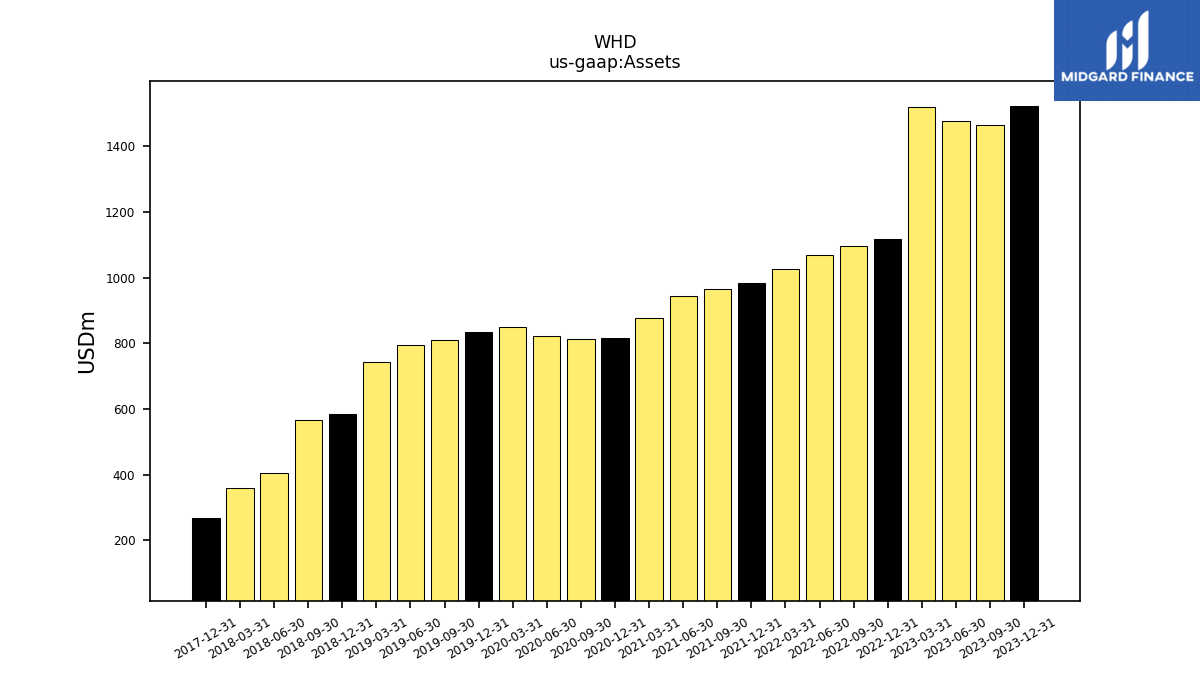
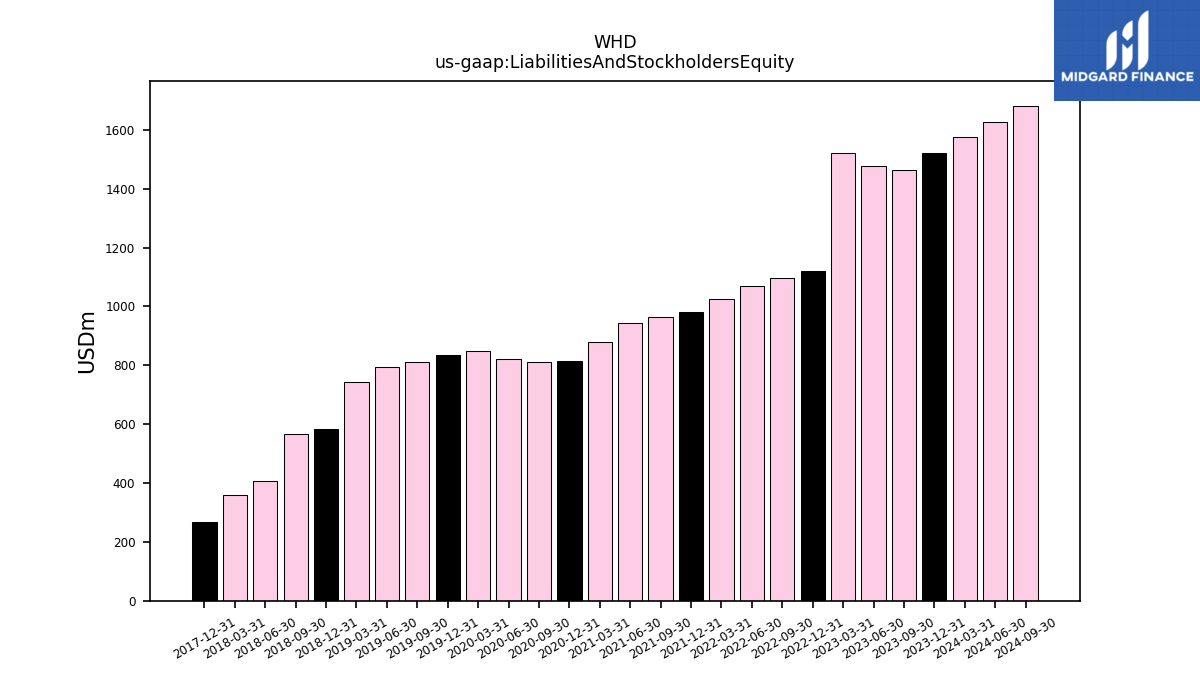
| Assets | 1575.89 | 1522.56 | 1464.15 | 1476.40 | 1520.27 | 1118.90 | 1095.20 | 1070.12 | 1026.19 | 982.08 | 963.93 | 944.75 | 877.87 | 815.59 | 811.49 | 822.15 | 850.10 | 834.96 | 811.14 | 793.76 | 742.63 | 584.74 | 565.67 | 406.07 | 358.33 | 266.46 | NA | NA | NA | |
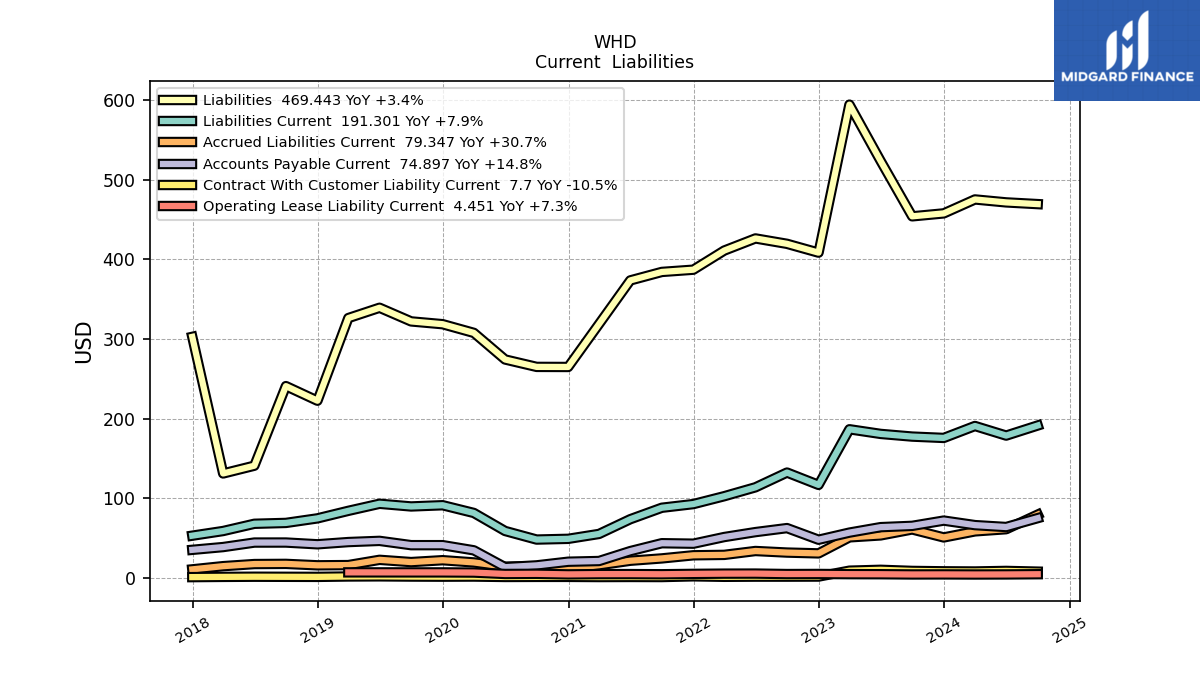
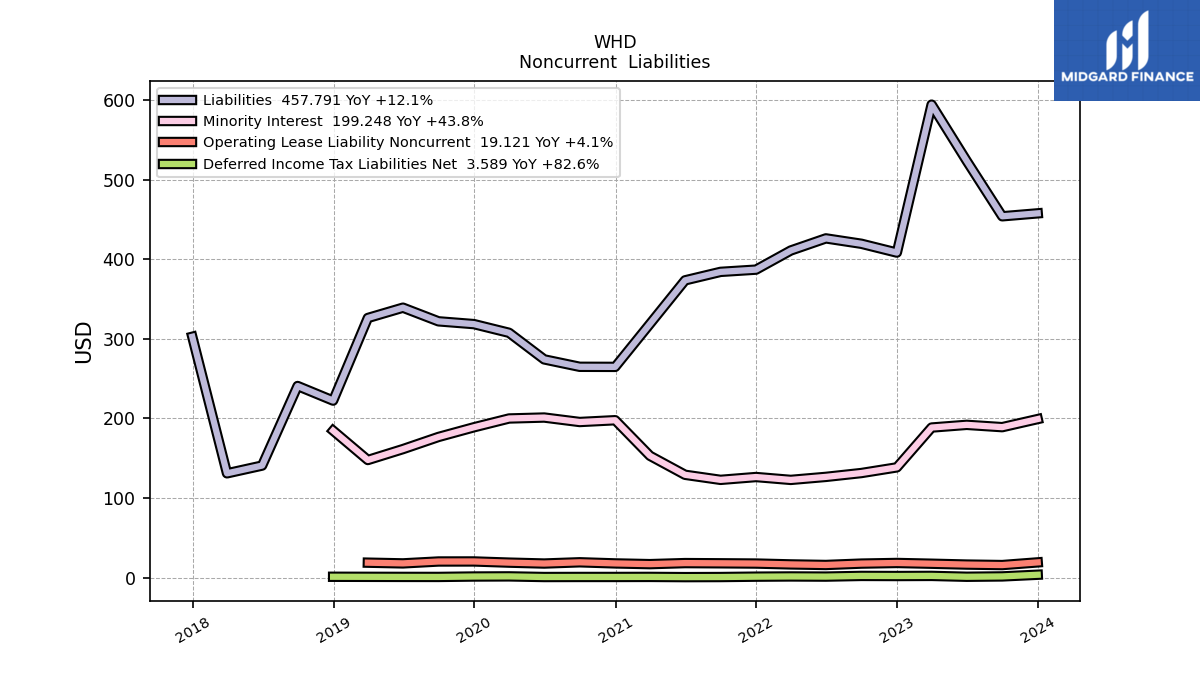
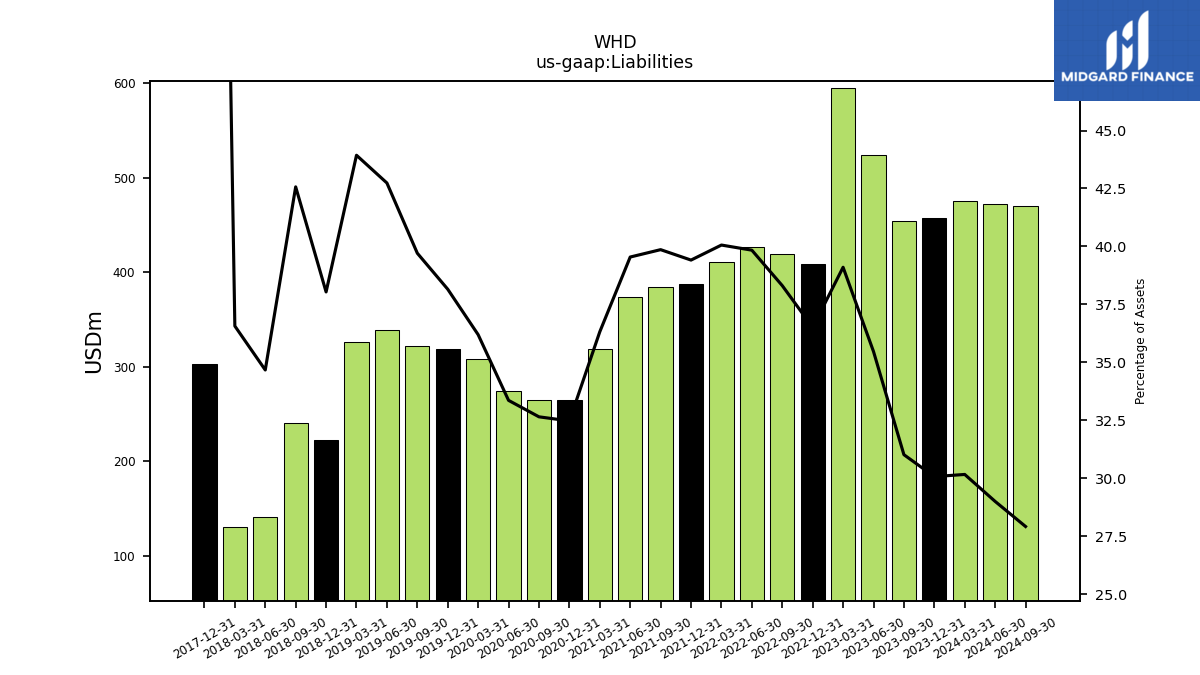
| Liabilities | 475.30 | 457.79 | 454.08 | 523.62 | 594.43 | 408.45 | 419.55 | 426.32 | 411.09 | 387.05 | 384.23 | 373.57 | 318.81 | 264.82 | 264.93 | 274.25 | 307.67 | 318.57 | 322.08 | 339.24 | 326.27 | 222.42 | 240.81 | 140.78 | 131.02 | 302.67 | NA | NA | NA | |
| Liabilities And Stockholders Equity | 1575.89 | 1522.56 | 1464.15 | 1476.40 | 1520.27 | 1118.90 | 1095.20 | 1070.12 | 1026.19 | 982.08 | 963.93 | 944.75 | 877.87 | 815.59 | 811.49 | 822.15 | 850.10 | 834.96 | 811.14 | 793.76 | 742.63 | 584.74 | 565.67 | 406.07 | 358.33 | 266.46 | NA | NA | NA | |
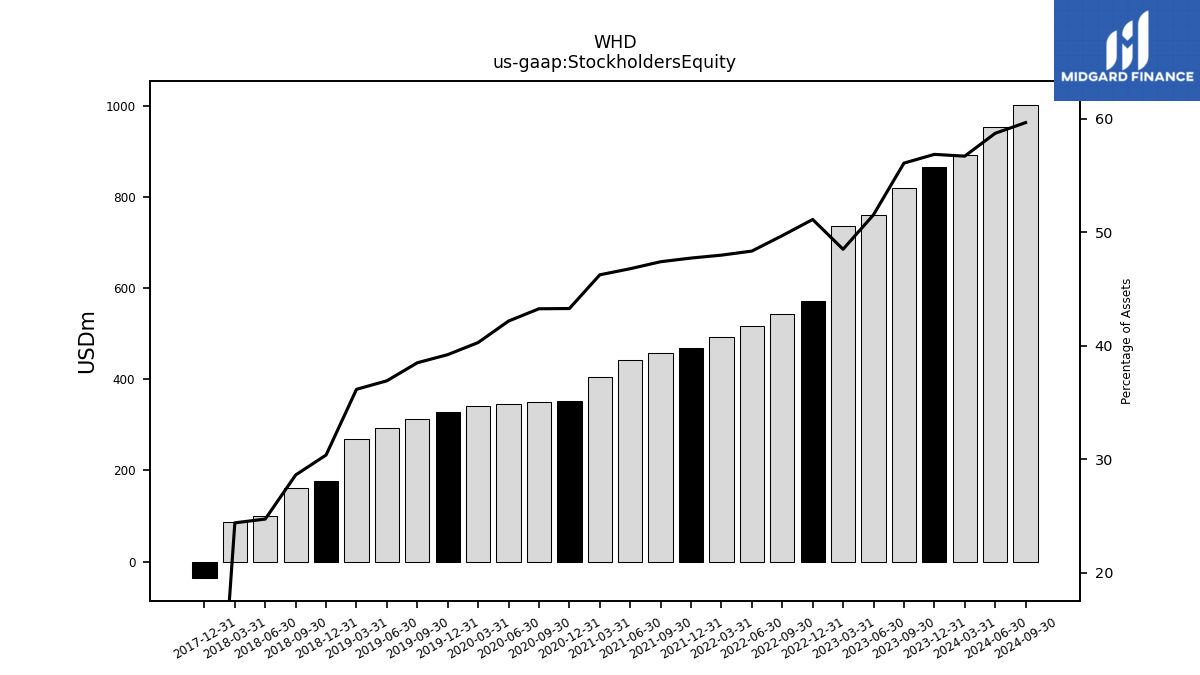
| Stockholders Equity | 893.37 | 865.52 | 821.01 | 760.81 | 737.25 | 571.92 | 544.24 | 517.24 | 492.32 | 468.64 | 456.87 | 441.97 | 405.96 | 352.97 | 351.02 | 346.75 | 342.46 | 327.47 | 312.32 | 293.03 | 268.60 | 177.66 | 161.95 | 100.49 | 87.48 | -36.22 | NA | NA | NA |
| 2024-03-31 | 2023-12-31 | 2023-09-30 | 2023-06-30 | 2023-03-31 | 2022-12-31 | 2022-09-30 | 2022-06-30 | 2022-03-31 | 2021-12-31 | 2021-09-30 | 2021-06-30 | 2021-03-31 | 2020-12-31 | 2020-09-30 | 2020-06-30 | 2020-03-31 | 2019-12-31 | 2019-09-30 | 2019-06-30 | 2019-03-31 | 2018-12-31 | 2018-09-30 | 2018-06-30 | 2018-03-31 | 2017-12-31 | 2017-09-30 | 2017-06-30 | 2017-03-31 | ||
|---|---|---|---|---|---|---|---|---|---|---|---|---|---|---|---|---|---|---|---|---|---|---|---|---|---|---|---|---|---|---|
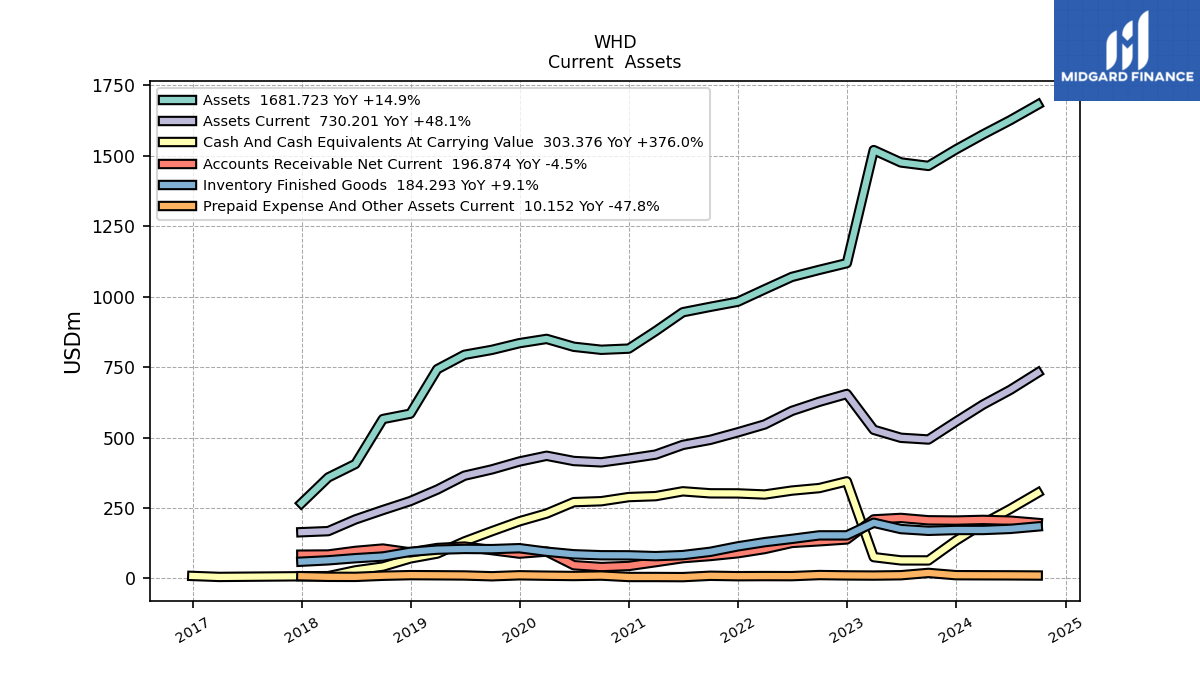
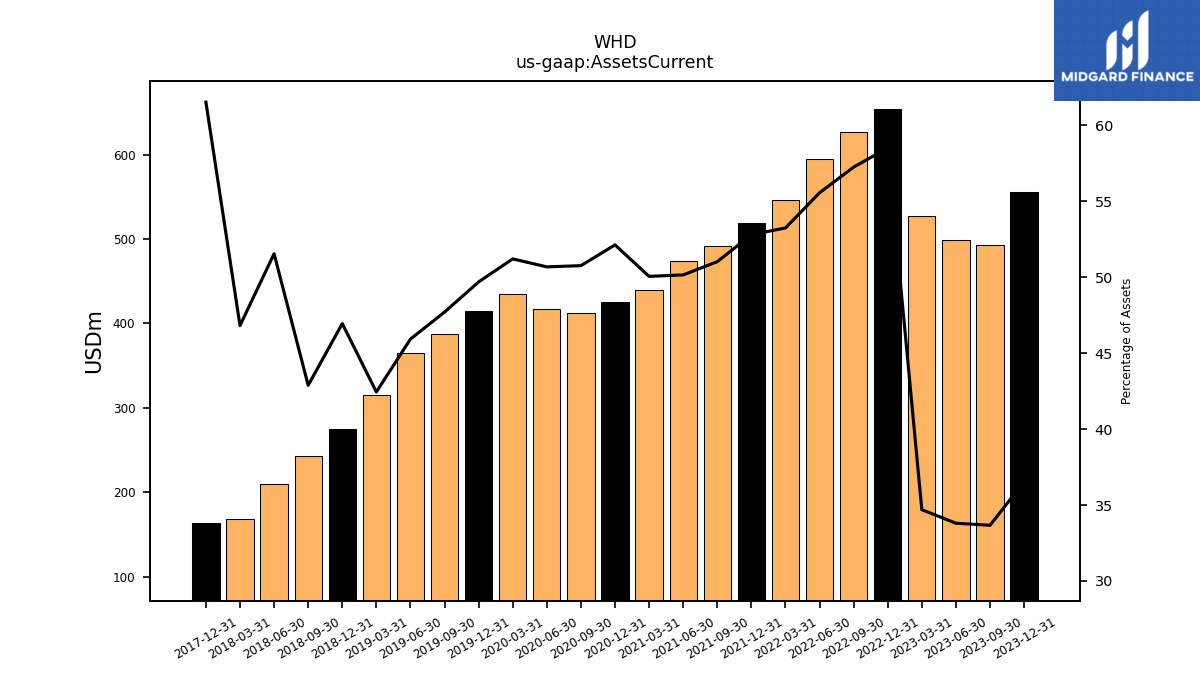
| Assets Current | 616.96 | 556.18 | 492.95 | 499.07 | 527.46 | 654.64 | 626.95 | 594.53 | 546.37 | 518.49 | 491.80 | 473.78 | 439.41 | 425.14 | 411.89 | 416.67 | 435.27 | 414.88 | 386.95 | 364.54 | 315.20 | 274.50 | 242.58 | 209.30 | 167.76 | 163.93 | NA | NA | NA | |
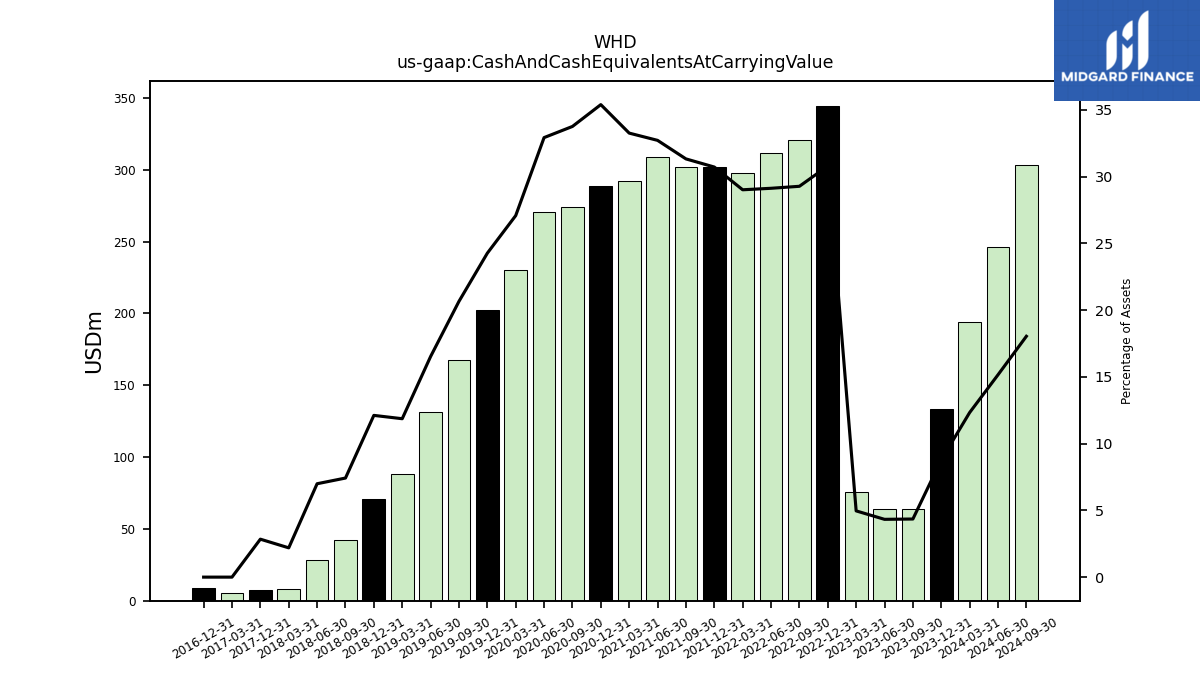
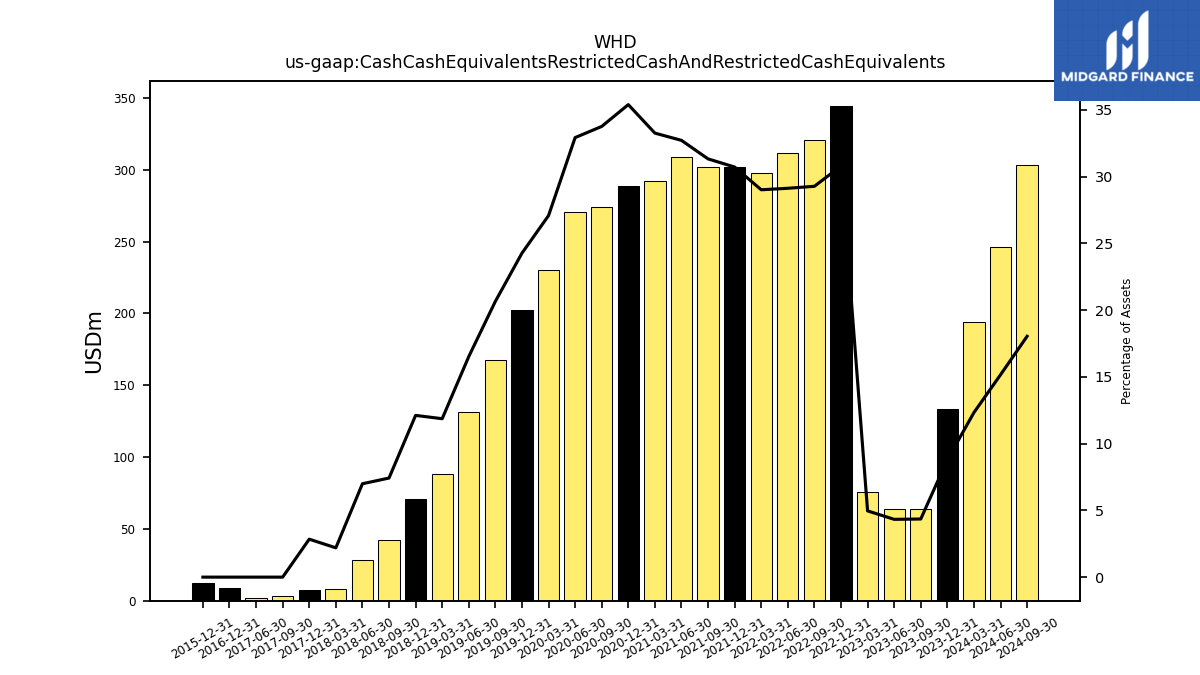
| Cash And Cash Equivalents At Carrying Value | 194.26 | 133.79 | 63.74 | 63.91 | 75.42 | 344.53 | 320.62 | 311.68 | 297.74 | 301.67 | 301.97 | 309.08 | 291.97 | 288.66 | 273.94 | 270.67 | 230.20 | 202.60 | 167.54 | 131.15 | 88.12 | 70.84 | 41.98 | 28.40 | 7.86 | 7.57 | NA | NA | 5.17 | |
| Cash Cash Equivalents Restricted Cash And Restricted Cash Equivalents | 194.26 | 133.79 | 63.74 | 63.91 | 75.42 | 344.53 | 320.62 | 311.68 | 297.74 | 301.67 | 301.97 | 309.08 | 291.97 | 288.66 | 273.94 | 270.67 | 230.20 | 202.60 | 167.54 | 131.15 | 88.12 | 70.84 | 41.98 | 28.40 | 7.86 | 7.57 | 3.22 | 2.13 | NA | |
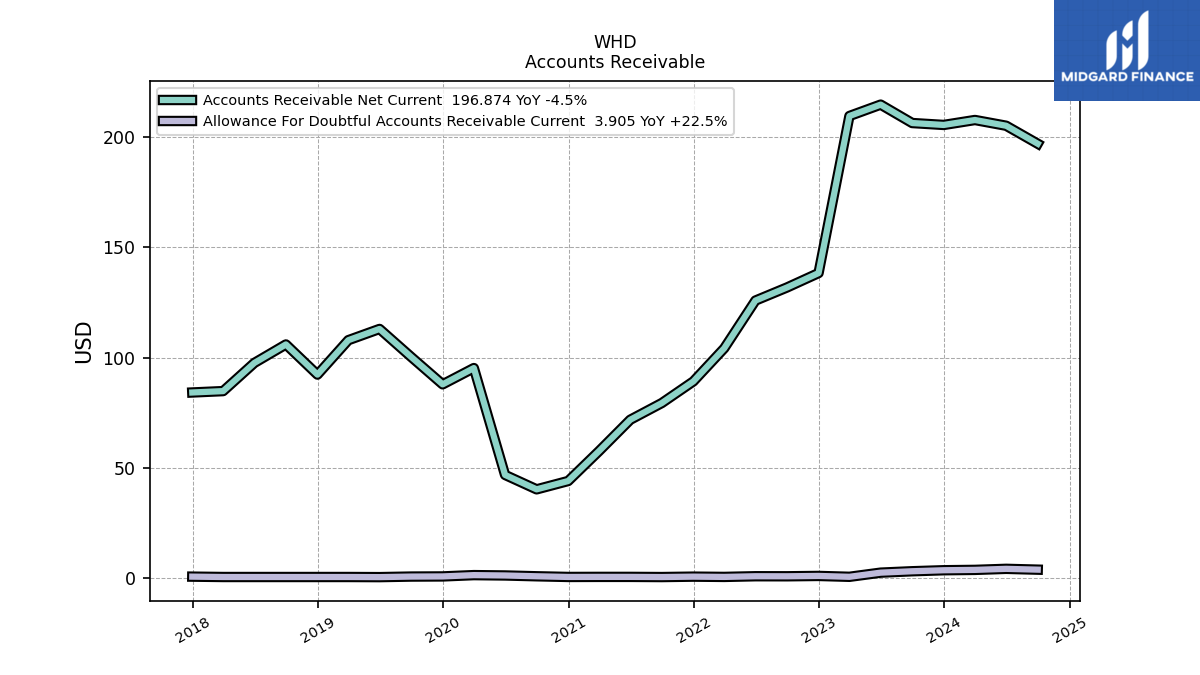
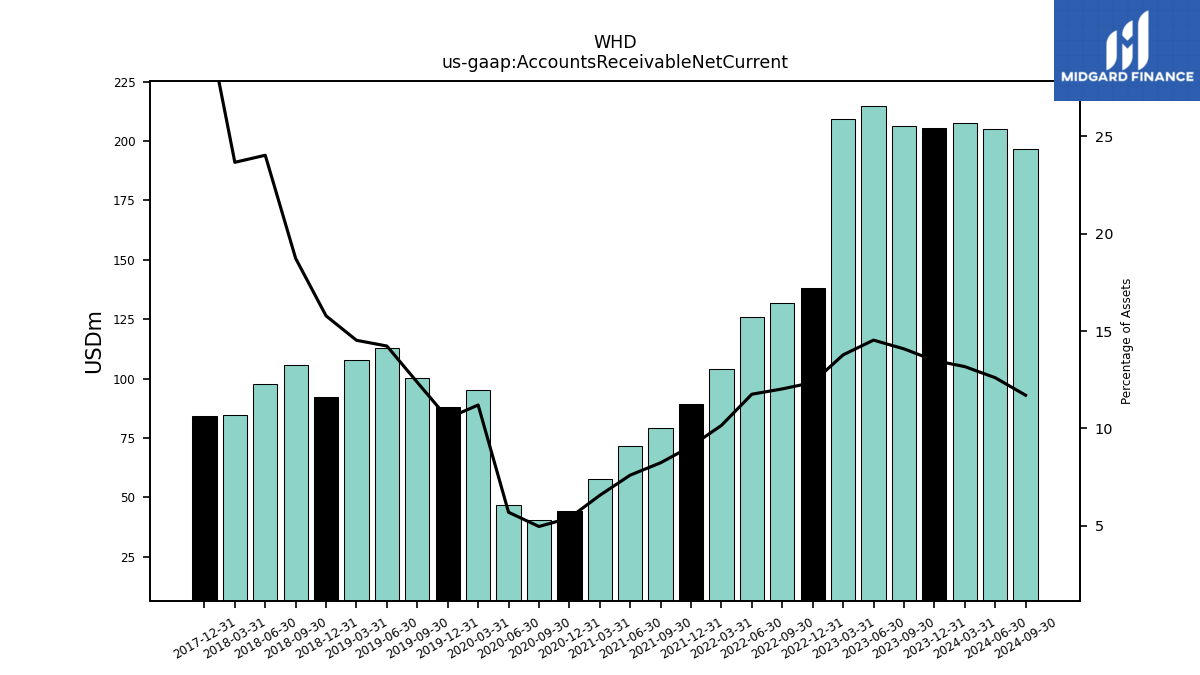
| Accounts Receivable Net Current | 207.62 | 205.38 | 206.25 | 214.59 | 209.44 | 138.27 | 131.75 | 125.82 | 104.21 | 89.20 | 79.40 | 71.83 | 57.63 | 44.07 | 40.29 | 46.82 | 95.24 | 87.86 | 100.31 | 112.96 | 107.87 | 92.27 | 105.94 | 97.57 | 84.80 | 84.17 | NA | NA | NA | |
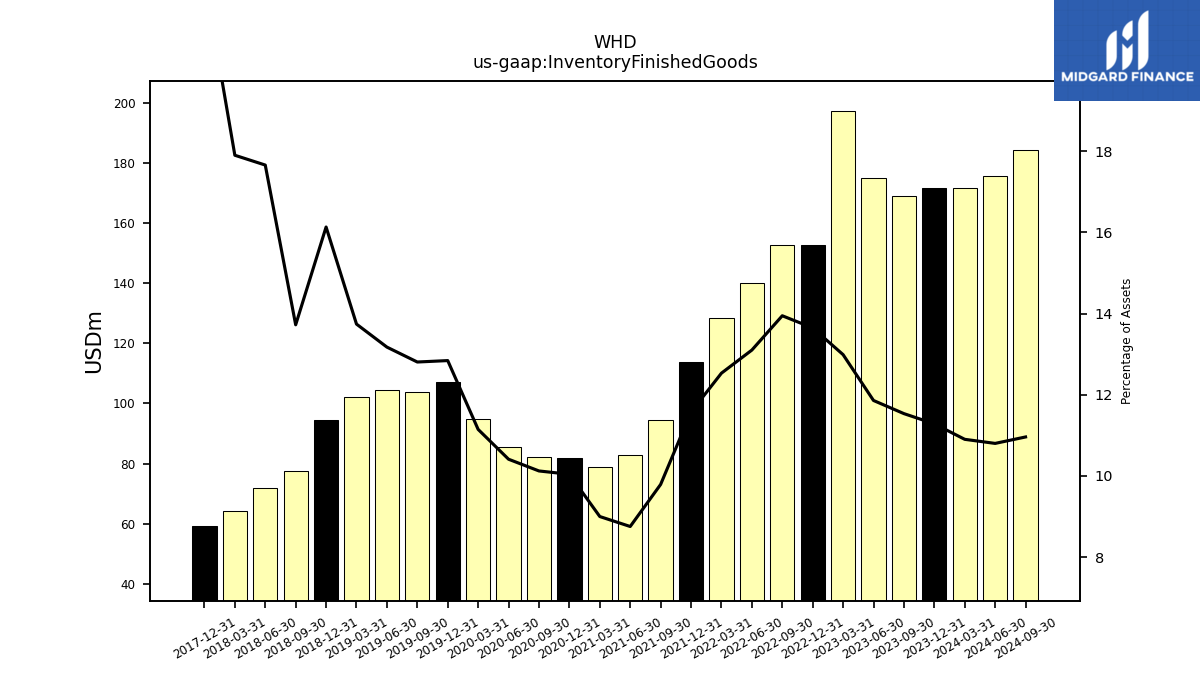
| Inventory Finished Goods | 171.78 | 171.78 | 168.87 | 175.07 | 197.44 | 152.69 | 152.73 | 140.18 | 128.59 | 113.66 | 94.35 | 82.69 | 78.99 | 81.88 | 82.13 | 85.59 | 94.74 | 107.21 | 103.87 | 104.56 | 102.04 | 94.33 | 77.62 | 71.71 | 64.14 | 59.33 | NA | NA | NA | |
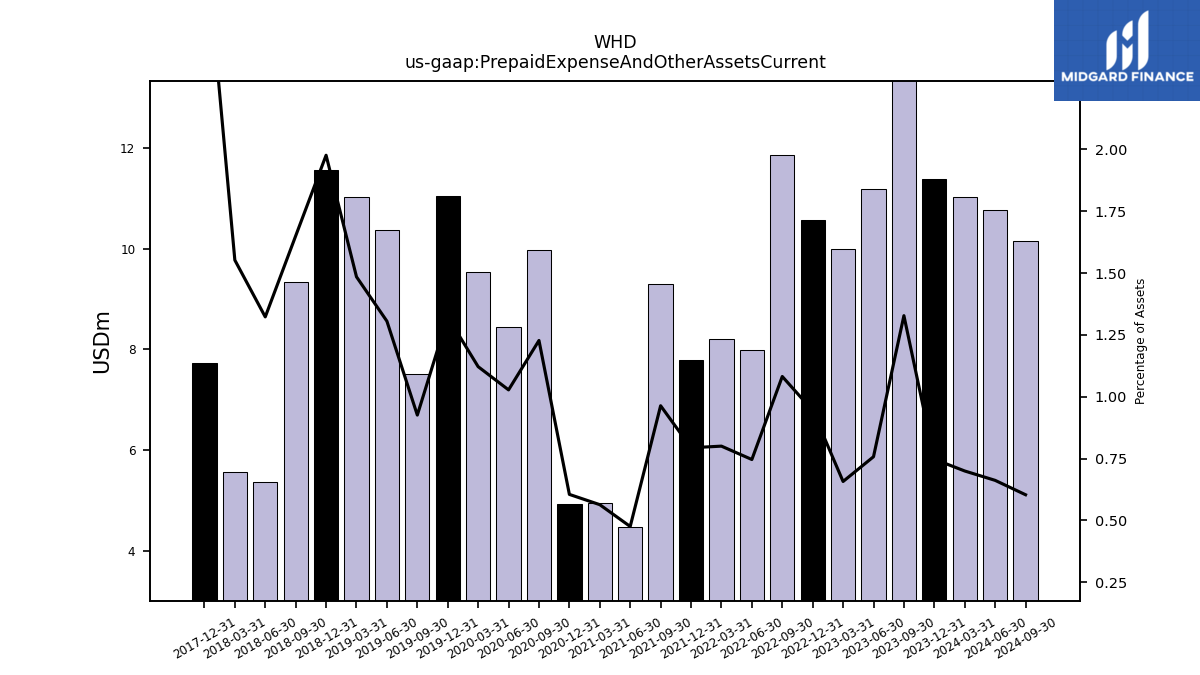
| Prepaid Expense And Other Assets Current | 11.03 | 11.38 | 19.44 | 11.18 | 9.99 | 10.56 | 11.85 | 7.99 | 8.21 | 7.79 | 9.29 | 4.49 | 4.95 | 4.93 | 9.96 | 8.45 | 9.54 | 11.04 | 7.51 | 10.36 | 11.03 | 11.56 | 9.34 | 5.37 | 5.56 | 7.73 | NA | NA | NA |
| 2024-03-31 | 2023-12-31 | 2023-09-30 | 2023-06-30 | 2023-03-31 | 2022-12-31 | 2022-09-30 | 2022-06-30 | 2022-03-31 | 2021-12-31 | 2021-09-30 | 2021-06-30 | 2021-03-31 | 2020-12-31 | 2020-09-30 | 2020-06-30 | 2020-03-31 | 2019-12-31 | 2019-09-30 | 2019-06-30 | 2019-03-31 | 2018-12-31 | 2018-09-30 | 2018-06-30 | 2018-03-31 | 2017-12-31 | 2017-09-30 | 2017-06-30 | 2017-03-31 | ||
|---|---|---|---|---|---|---|---|---|---|---|---|---|---|---|---|---|---|---|---|---|---|---|---|---|---|---|---|---|---|---|
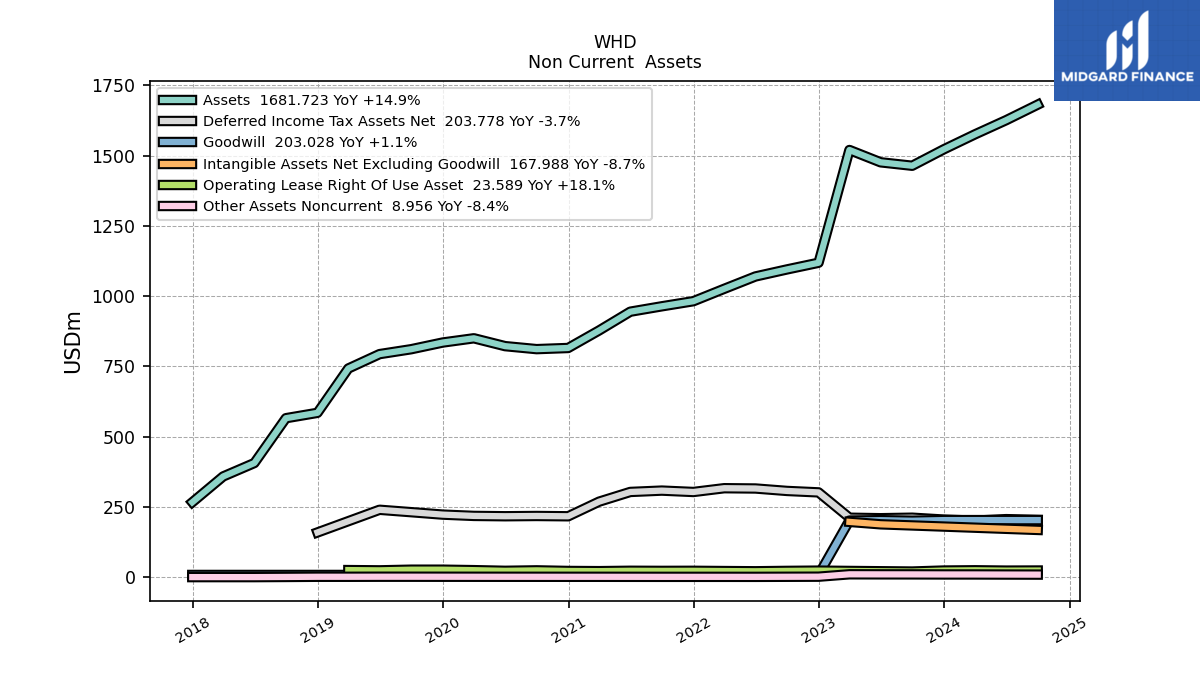
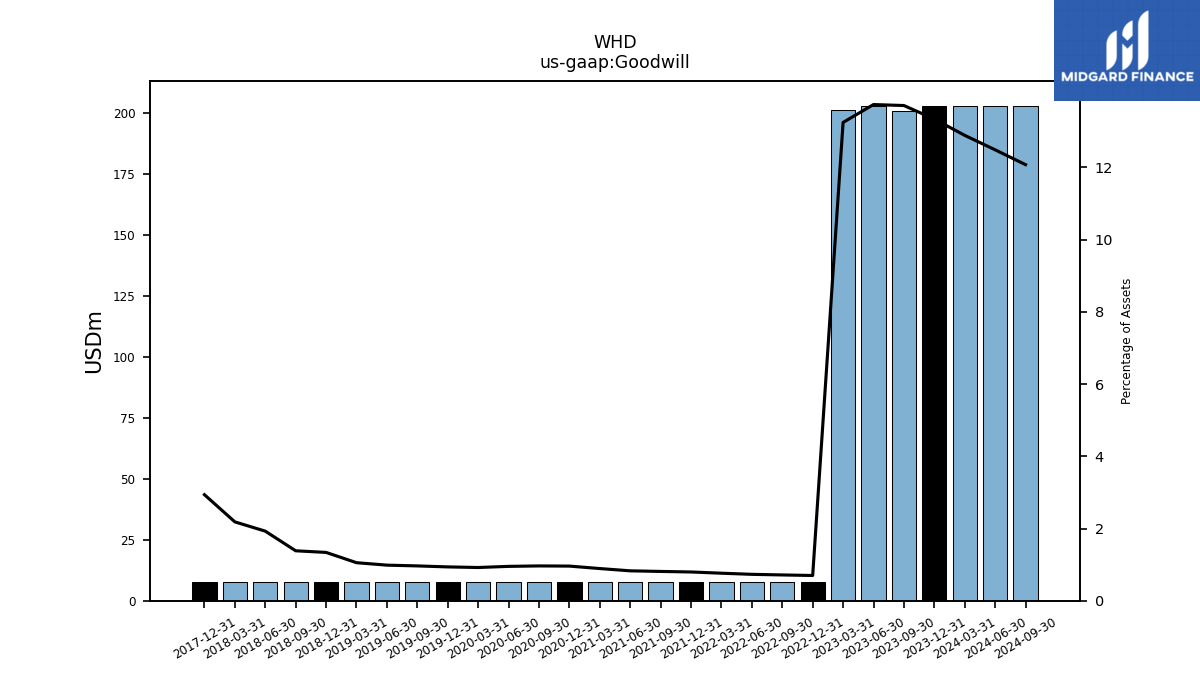
| Goodwill | 203.03 | 203.03 | 200.72 | 202.81 | 201.30 | 7.82 | 7.82 | 7.82 | 7.82 | 7.82 | 7.82 | 7.82 | 7.82 | 7.82 | 7.82 | 7.82 | 7.82 | 7.82 | 7.82 | 7.82 | 7.82 | 7.82 | 7.82 | 7.82 | 7.82 | 7.82 | NA | NA | NA | |
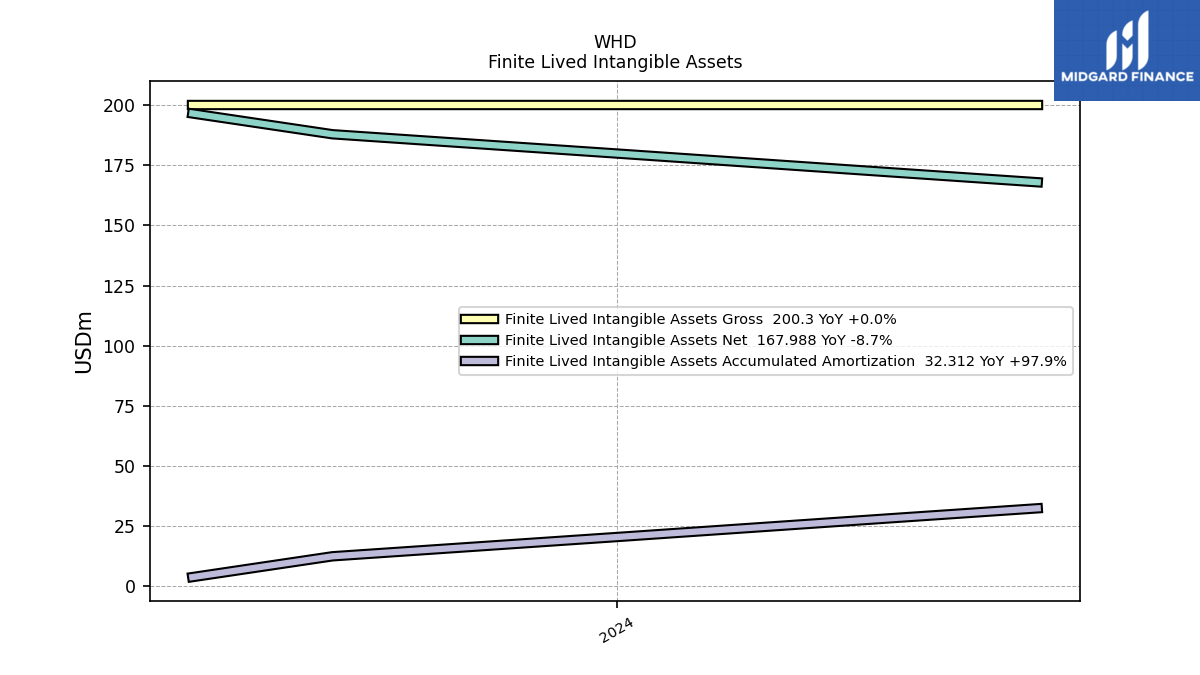
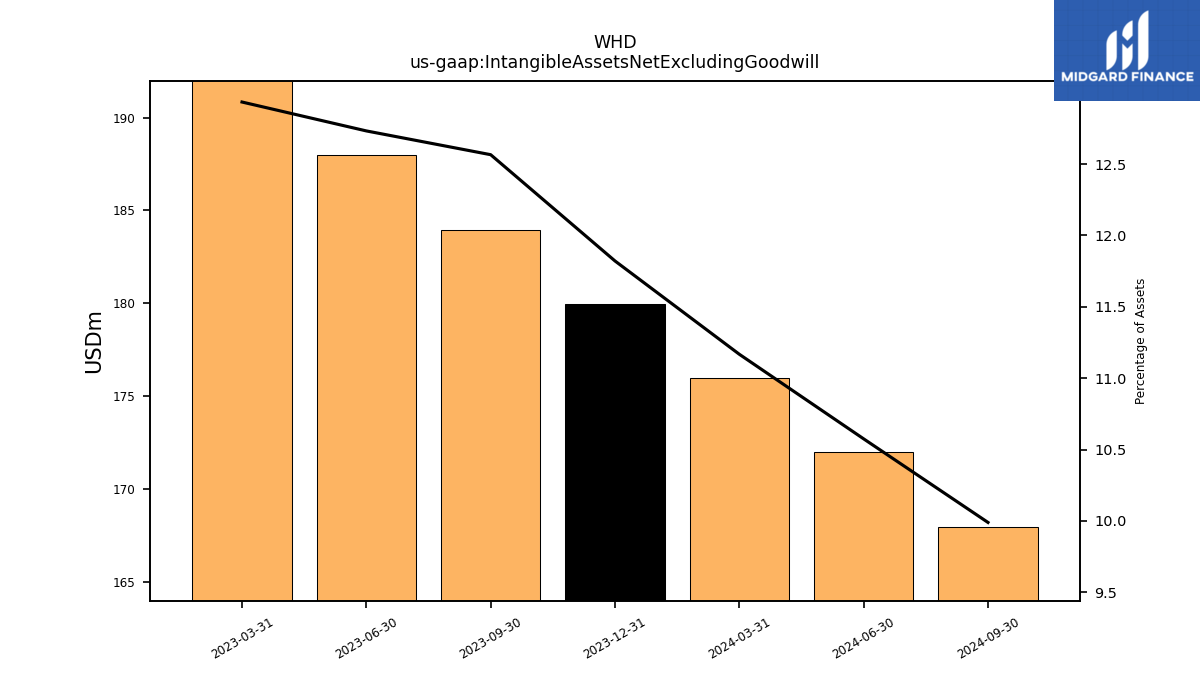
| Intangible Assets Net Excluding Goodwill | 175.98 | 179.98 | 183.97 | 187.97 | 196.63 | NA | NA | NA | NA | NA | NA | NA | NA | NA | NA | NA | NA | NA | NA | NA | NA | NA | NA | NA | NA | NA | NA | NA | NA | |
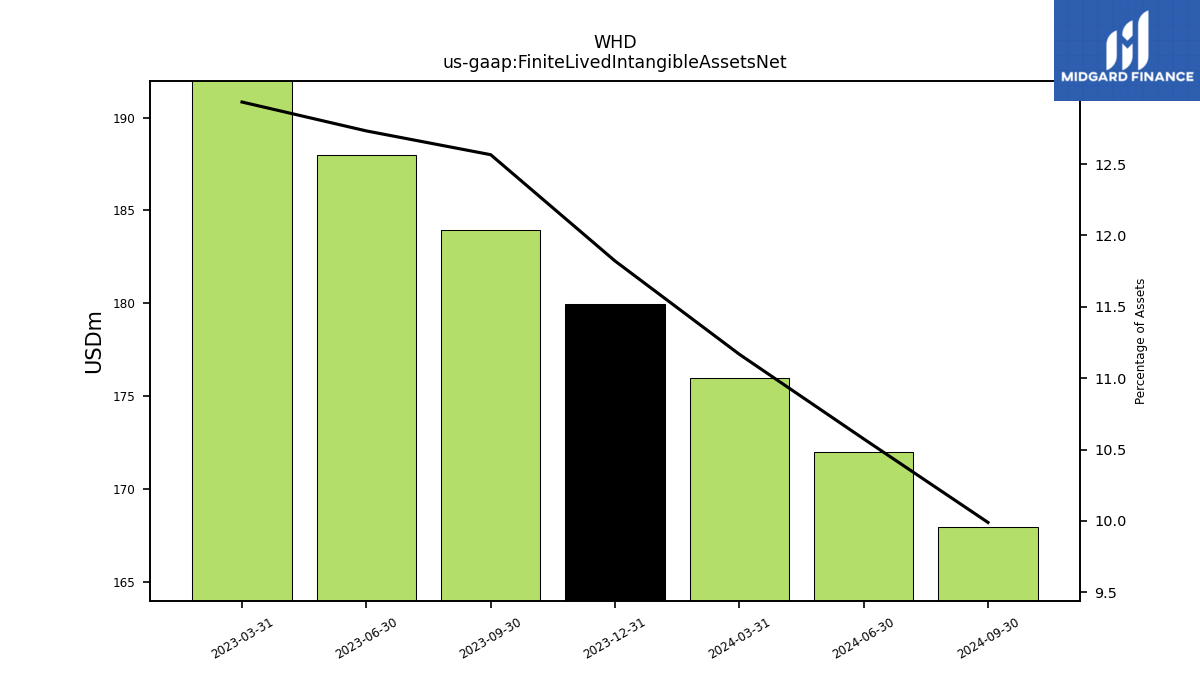
| Finite Lived Intangible Assets Net | 175.98 | 179.98 | 183.97 | 187.97 | 196.63 | NA | NA | NA | NA | NA | NA | NA | NA | NA | NA | NA | NA | NA | NA | NA | NA | NA | NA | NA | NA | NA | NA | NA | NA | |
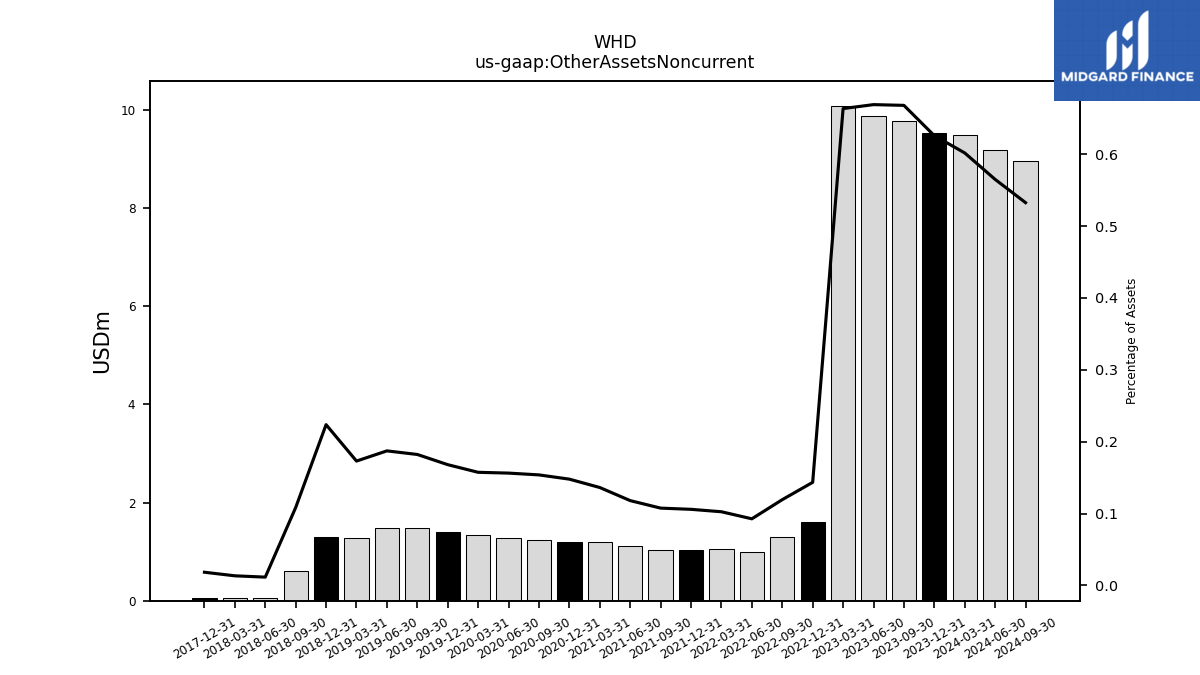
| Other Assets Noncurrent | 9.48 | 9.53 | 9.78 | 9.88 | 10.09 | 1.60 | 1.31 | 0.99 | 1.05 | 1.04 | 1.04 | 1.11 | 1.20 | 1.21 | 1.25 | 1.28 | 1.34 | 1.40 | 1.48 | 1.49 | 1.28 | 1.31 | 0.61 | 0.05 | 0.05 | 0.05 | NA | NA | NA |
| 2024-03-31 | 2023-12-31 | 2023-09-30 | 2023-06-30 | 2023-03-31 | 2022-12-31 | 2022-09-30 | 2022-06-30 | 2022-03-31 | 2021-12-31 | 2021-09-30 | 2021-06-30 | 2021-03-31 | 2020-12-31 | 2020-09-30 | 2020-06-30 | 2020-03-31 | 2019-12-31 | 2019-09-30 | 2019-06-30 | 2019-03-31 | 2018-12-31 | 2018-09-30 | 2018-06-30 | 2018-03-31 | 2017-12-31 | 2017-09-30 | 2017-06-30 | 2017-03-31 | ||
|---|---|---|---|---|---|---|---|---|---|---|---|---|---|---|---|---|---|---|---|---|---|---|---|---|---|---|---|---|---|---|
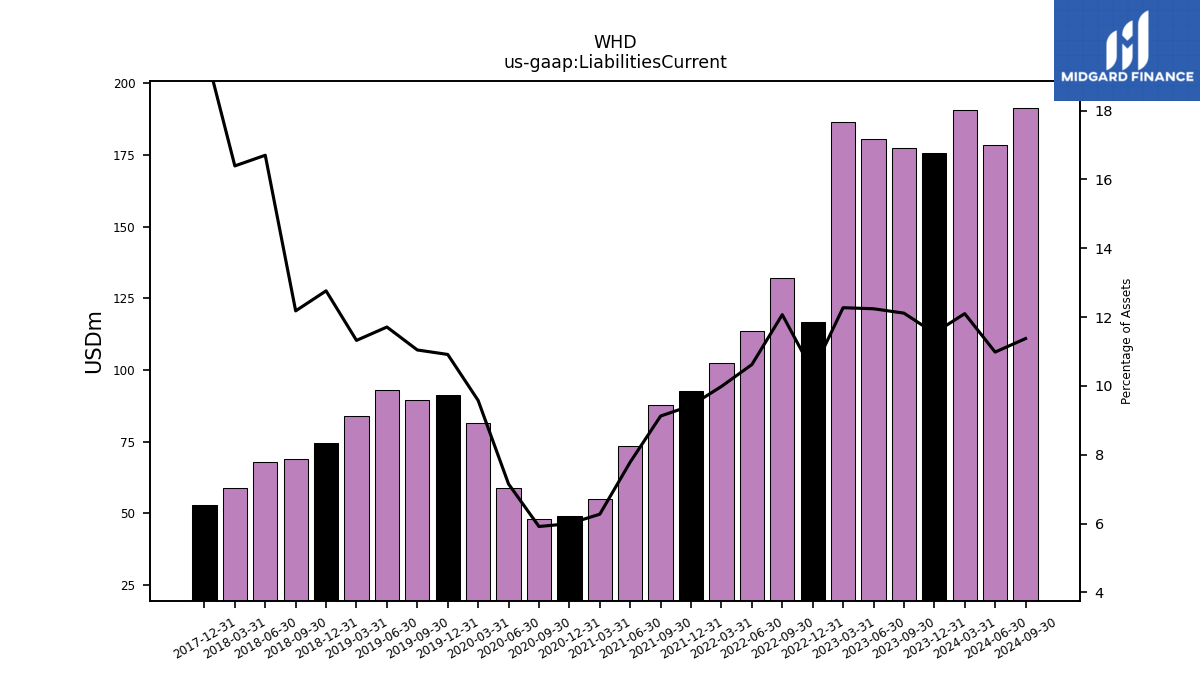
| Liabilities Current | 190.67 | 175.66 | 177.37 | 180.73 | 186.57 | 116.65 | 132.19 | 113.64 | 102.46 | 92.57 | 87.95 | 73.56 | 55.06 | 48.91 | 48.00 | 58.78 | 81.41 | 91.13 | 89.58 | 92.95 | 84.08 | 74.62 | 68.90 | 67.82 | 58.74 | 52.87 | NA | NA | NA | |
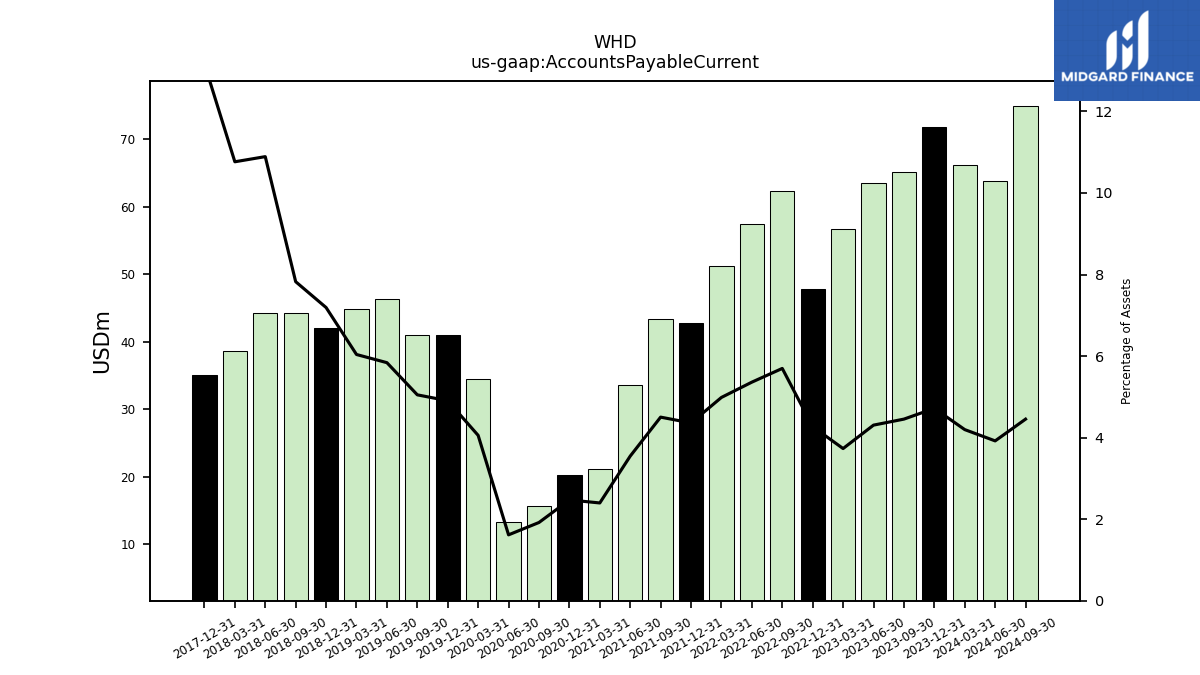
| Accounts Payable Current | 66.14 | 71.84 | 65.22 | 63.59 | 56.74 | 47.78 | 62.40 | 57.37 | 51.17 | 42.82 | 43.41 | 33.51 | 21.05 | 20.16 | 15.57 | 13.29 | 34.48 | 40.96 | 40.96 | 46.35 | 44.85 | 42.05 | 44.26 | 44.23 | 38.58 | 35.08 | NA | NA | NA | |
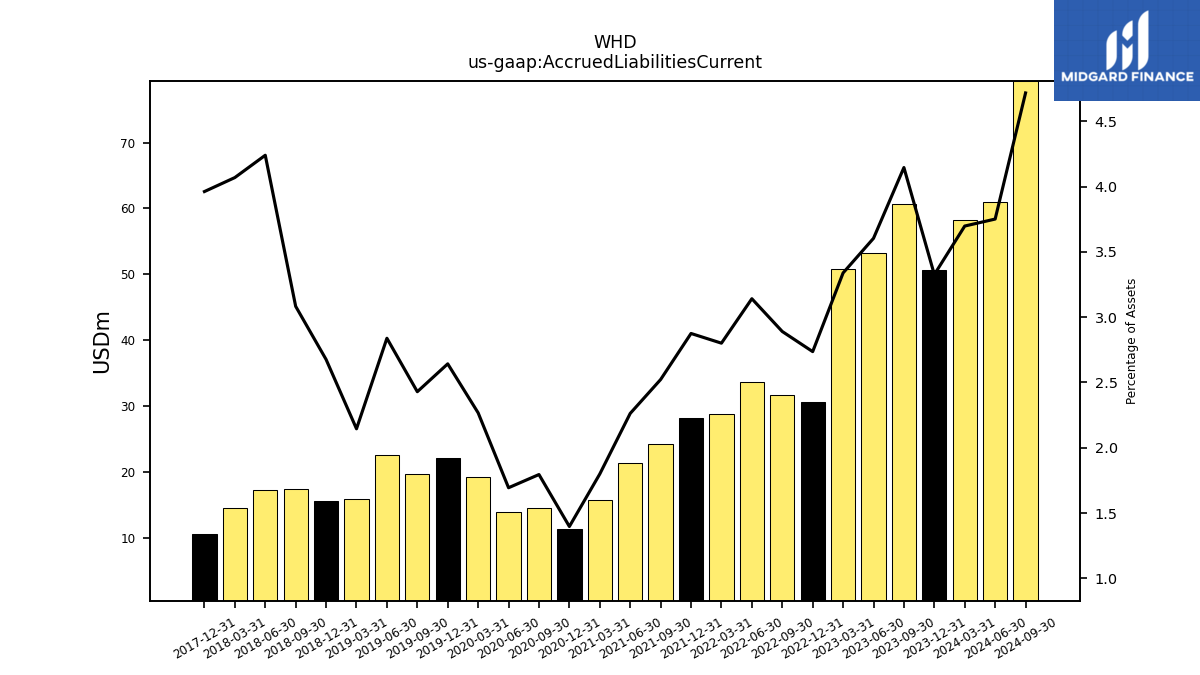
| Accrued Liabilities Current | 58.28 | 50.65 | 60.71 | 53.22 | 50.77 | 30.62 | 31.66 | 33.62 | 28.75 | 28.24 | 24.32 | 21.38 | 15.79 | 11.39 | 14.56 | 13.93 | 19.27 | 22.07 | 19.71 | 22.53 | 15.93 | 15.65 | 17.44 | 17.22 | 14.58 | 10.56 | NA | NA | NA | |
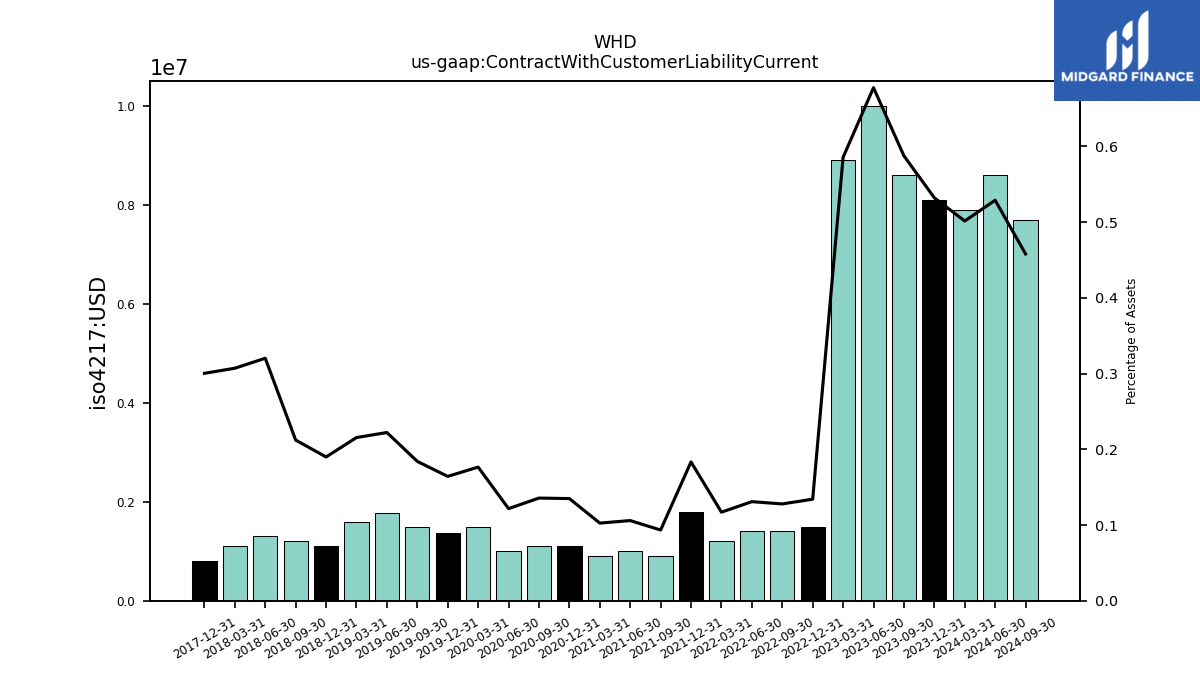
| Contract With Customer Liability Current | 7.90 | 8.10 | 8.60 | 10.00 | 8.90 | 1.50 | 1.40 | 1.40 | 1.20 | 1.80 | 0.90 | 1.00 | 0.90 | 1.10 | 1.10 | 1.00 | 1.50 | 1.37 | 1.49 | 1.76 | 1.60 | 1.11 | 1.20 | 1.30 | 1.10 | 0.80 | NA | NA | NA |
| 2024-03-31 | 2023-12-31 | 2023-09-30 | 2023-06-30 | 2023-03-31 | 2022-12-31 | 2022-09-30 | 2022-06-30 | 2022-03-31 | 2021-12-31 | 2021-09-30 | 2021-06-30 | 2021-03-31 | 2020-12-31 | 2020-09-30 | 2020-06-30 | 2020-03-31 | 2019-12-31 | 2019-09-30 | 2019-06-30 | 2019-03-31 | 2018-12-31 | 2018-09-30 | 2018-06-30 | 2018-03-31 | 2017-12-31 | 2017-09-30 | 2017-06-30 | 2017-03-31 | ||
|---|---|---|---|---|---|---|---|---|---|---|---|---|---|---|---|---|---|---|---|---|---|---|---|---|---|---|---|---|---|---|
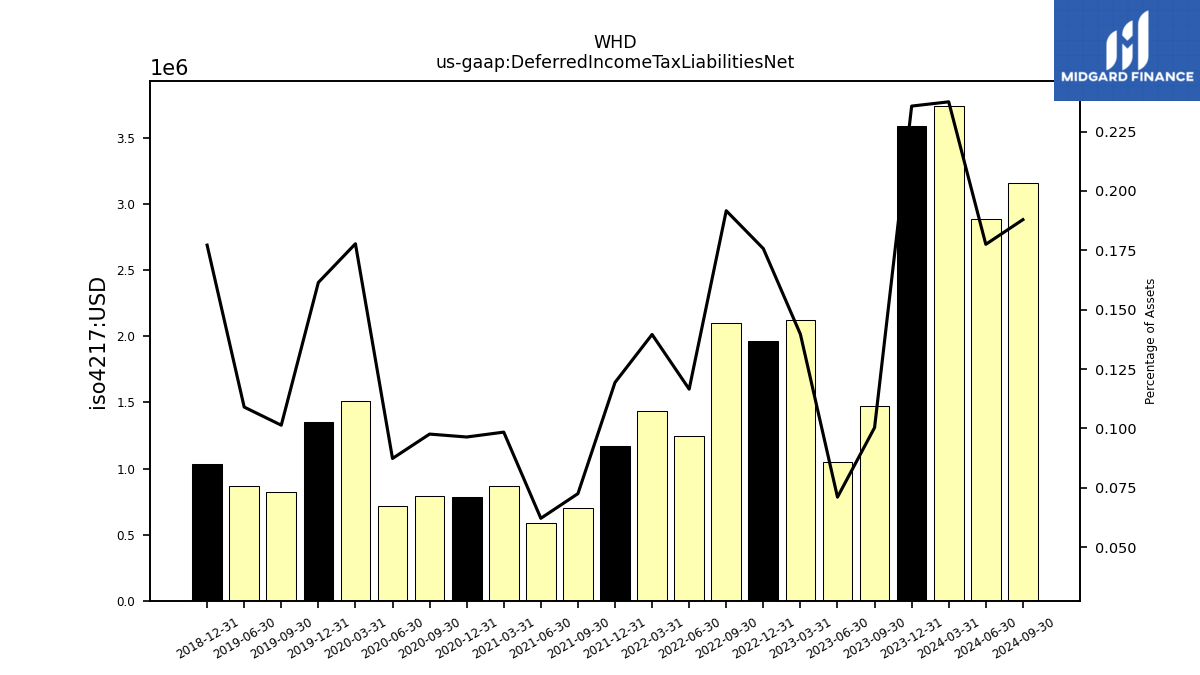
| Deferred Income Tax Liabilities Net | 3.74 | 3.59 | 1.47 | 1.05 | 2.12 | 1.97 | 2.10 | 1.25 | 1.43 | 1.17 | 0.70 | 0.59 | 0.86 | 0.79 | 0.79 | 0.72 | 1.51 | 1.35 | 0.82 | 0.86 | NA | 1.04 | NA | NA | NA | NA | NA | NA | NA | |
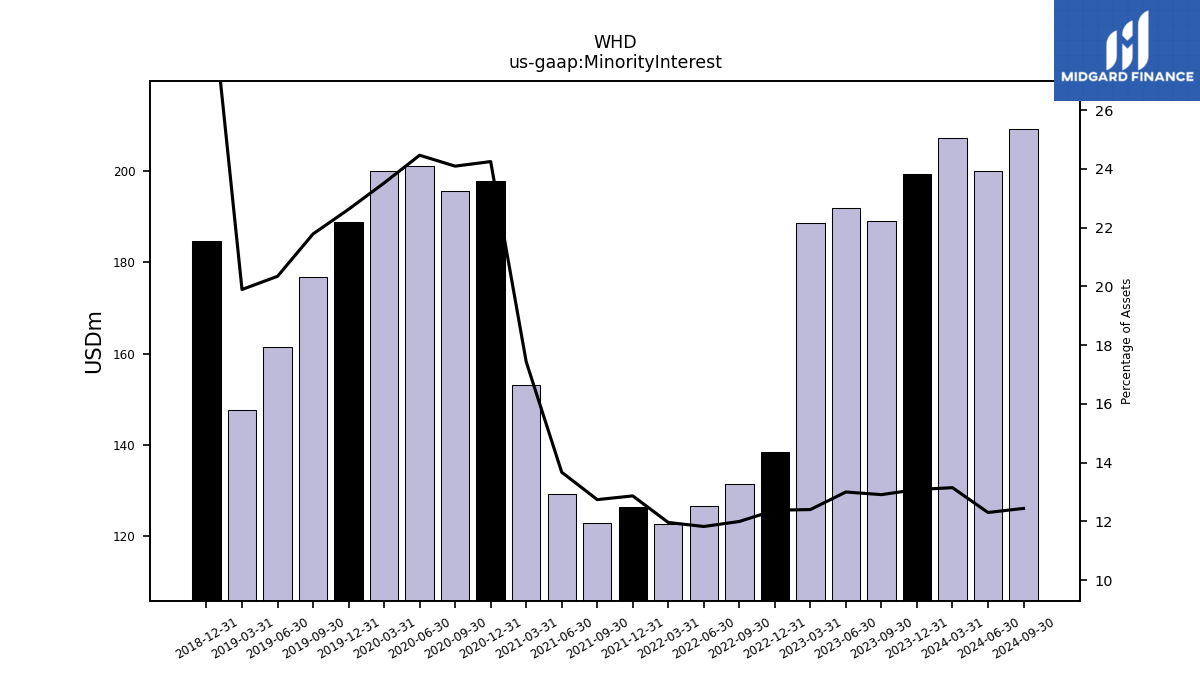
| Minority Interest | 207.22 | 199.25 | 189.06 | 191.97 | 188.58 | 138.53 | 131.41 | 126.57 | 122.78 | 126.39 | 122.83 | 129.21 | 153.09 | 197.80 | 195.54 | 201.16 | 199.97 | 188.93 | 176.73 | 161.50 | 147.76 | 184.67 | NA | NA | NA | NA | NA | NA | NA | |
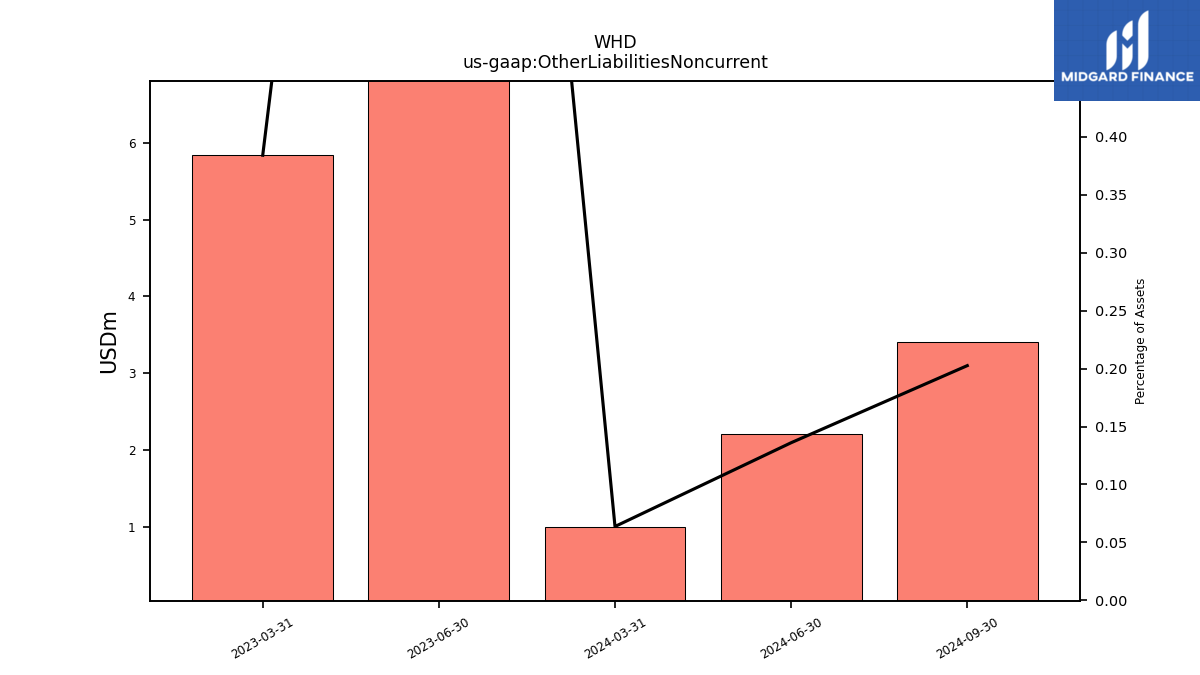
| Other Liabilities Noncurrent | 1.00 | NA | NA | 23.98 | 5.84 | NA | NA | NA | NA | NA | NA | NA | NA | NA | NA | NA | NA | NA | NA | NA | NA | NA | NA | NA | NA | NA | NA | NA | NA | |
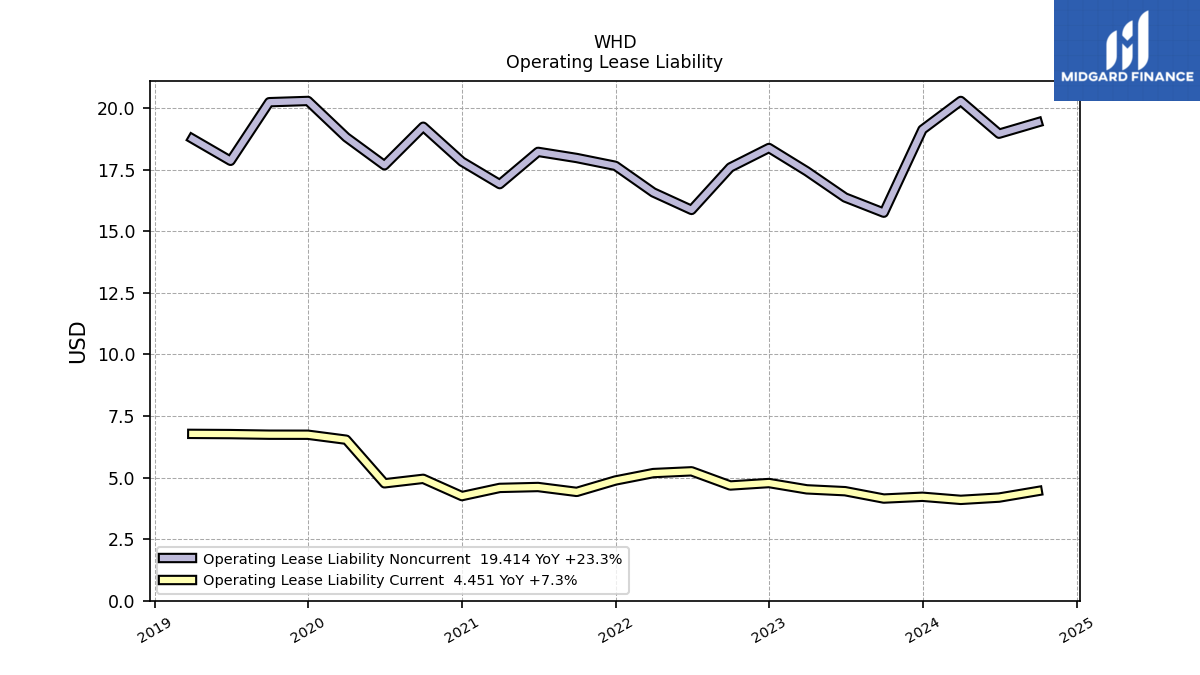
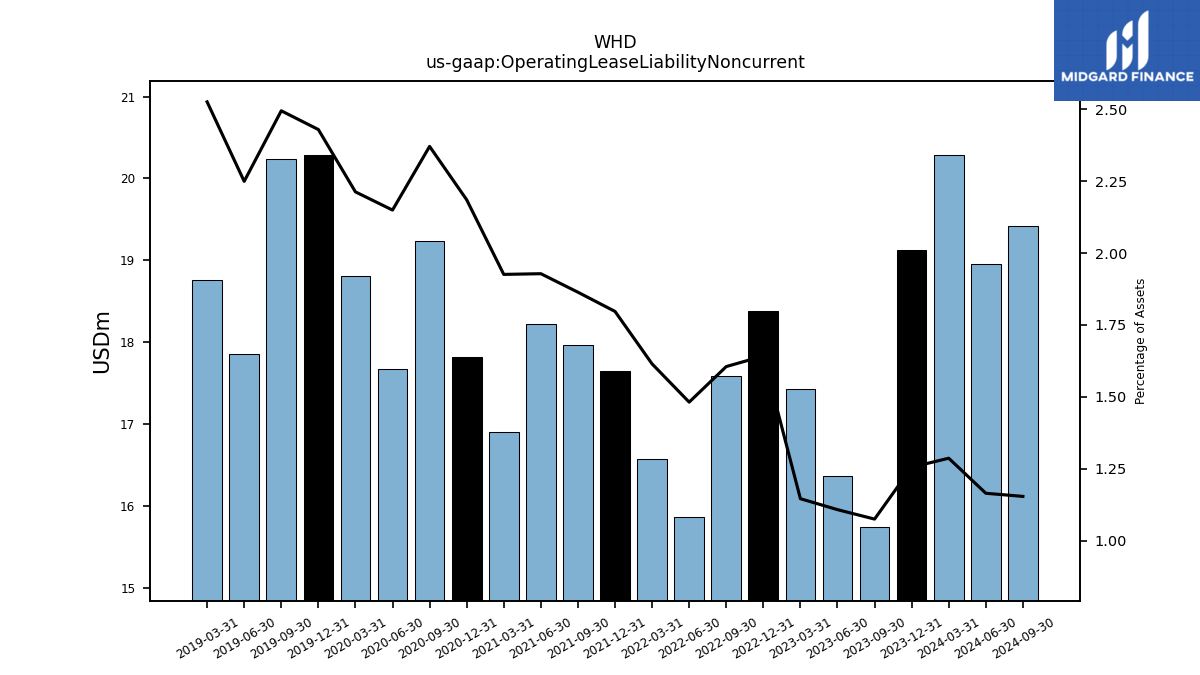
| Operating Lease Liability Noncurrent | 20.28 | 19.12 | 15.75 | 16.36 | 17.43 | 18.38 | 17.58 | 15.86 | 16.57 | 17.65 | 17.97 | 18.22 | 16.91 | 17.82 | 19.24 | 17.67 | 18.81 | 20.28 | 20.23 | 17.85 | 18.75 | NA | NA | NA | NA | NA | NA | NA | NA |
| 2024-03-31 | 2023-12-31 | 2023-09-30 | 2023-06-30 | 2023-03-31 | 2022-12-31 | 2022-09-30 | 2022-06-30 | 2022-03-31 | 2021-12-31 | 2021-09-30 | 2021-06-30 | 2021-03-31 | 2020-12-31 | 2020-09-30 | 2020-06-30 | 2020-03-31 | 2019-12-31 | 2019-09-30 | 2019-06-30 | 2019-03-31 | 2018-12-31 | 2018-09-30 | 2018-06-30 | 2018-03-31 | 2017-12-31 | 2017-09-30 | 2017-06-30 | 2017-03-31 | ||
|---|---|---|---|---|---|---|---|---|---|---|---|---|---|---|---|---|---|---|---|---|---|---|---|---|---|---|---|---|---|---|
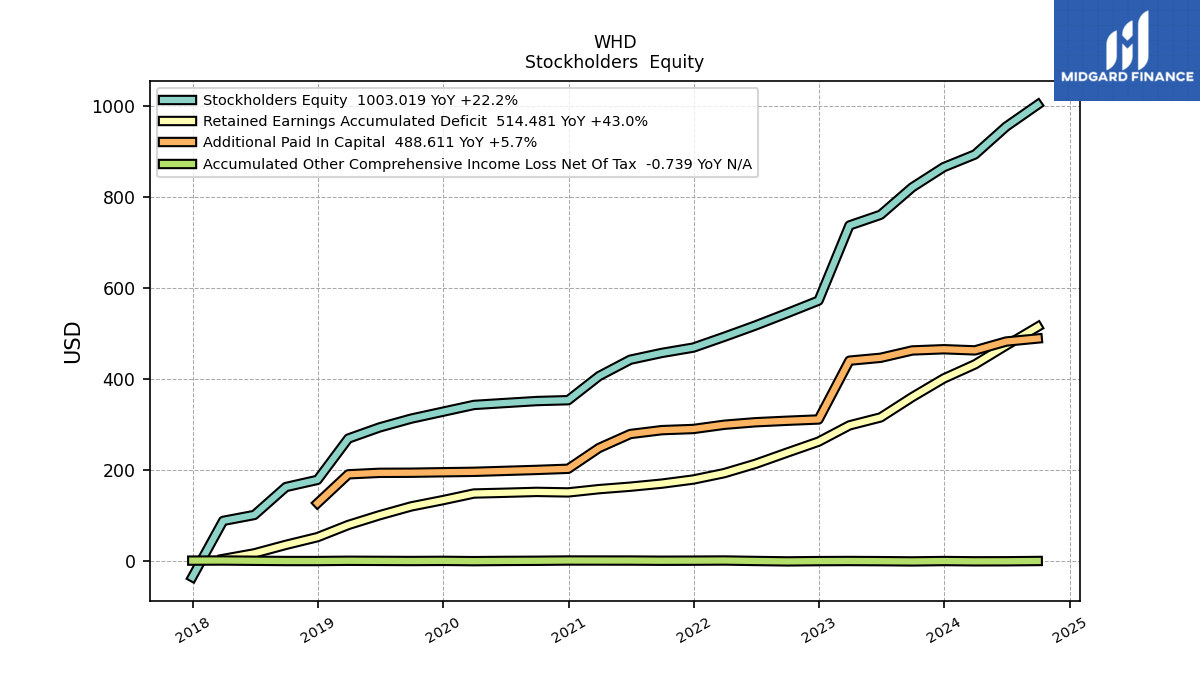
| Stockholders Equity | 893.37 | 865.52 | 821.01 | 760.81 | 737.25 | 571.92 | 544.24 | 517.24 | 492.32 | 468.64 | 456.87 | 441.97 | 405.96 | 352.97 | 351.02 | 346.75 | 342.46 | 327.47 | 312.32 | 293.03 | 268.60 | 177.66 | 161.95 | 100.49 | 87.48 | -36.22 | NA | NA | NA | |
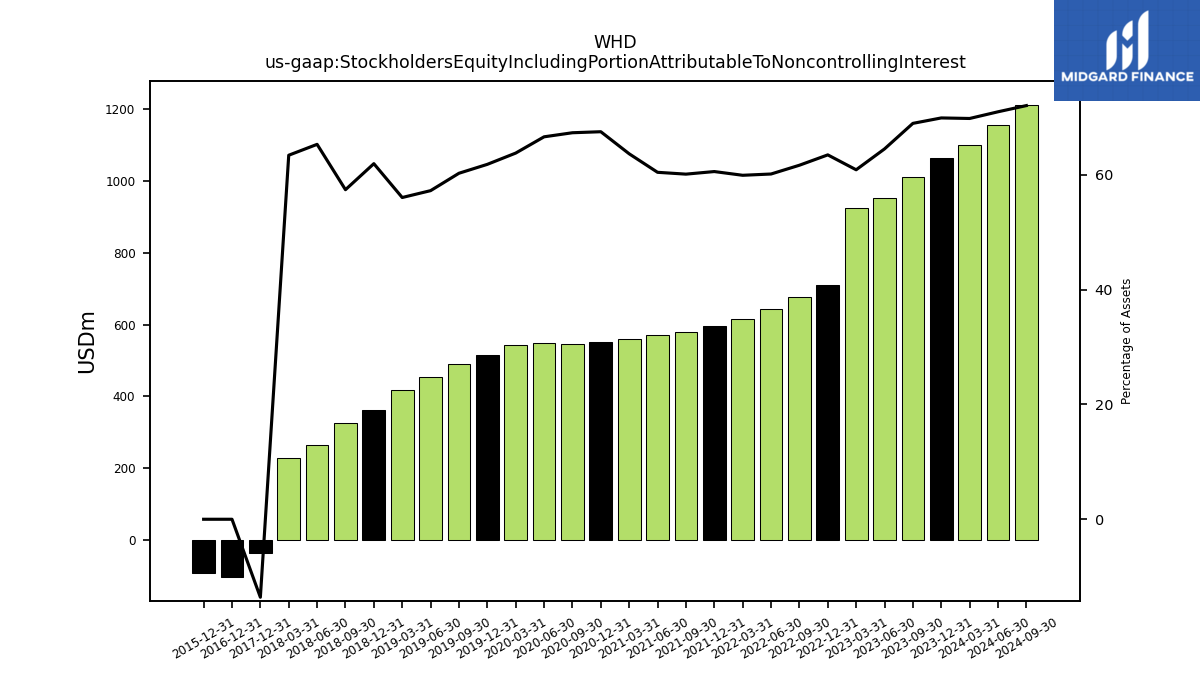
| Stockholders Equity Including Portion Attributable To Noncontrolling Interest | 1100.59 | 1064.77 | 1010.07 | 952.77 | 925.84 | 710.45 | 675.65 | 643.81 | 615.10 | 595.03 | 579.70 | 571.17 | 559.05 | 550.77 | 546.56 | 547.91 | 542.43 | 516.39 | 489.06 | 454.53 | 416.36 | 362.33 | 324.86 | 265.29 | 227.31 | -36.22 | NA | NA | NA | |
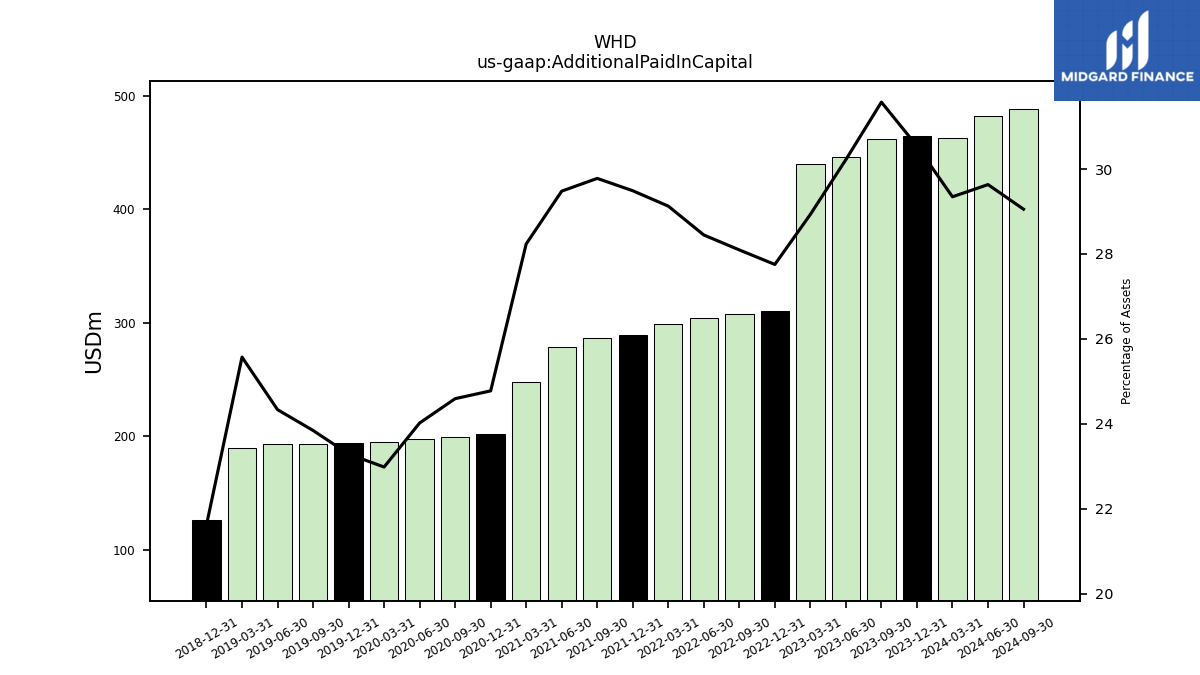
| Additional Paid In Capital | 462.46 | 465.01 | 462.30 | 446.21 | 439.84 | 310.53 | 307.70 | 304.42 | 298.89 | 289.60 | 287.05 | 278.50 | 247.88 | 202.08 | 199.57 | 197.48 | 195.38 | 194.46 | 193.41 | 193.16 | 189.90 | 126.42 | NA | NA | NA | NA | NA | NA | NA | |
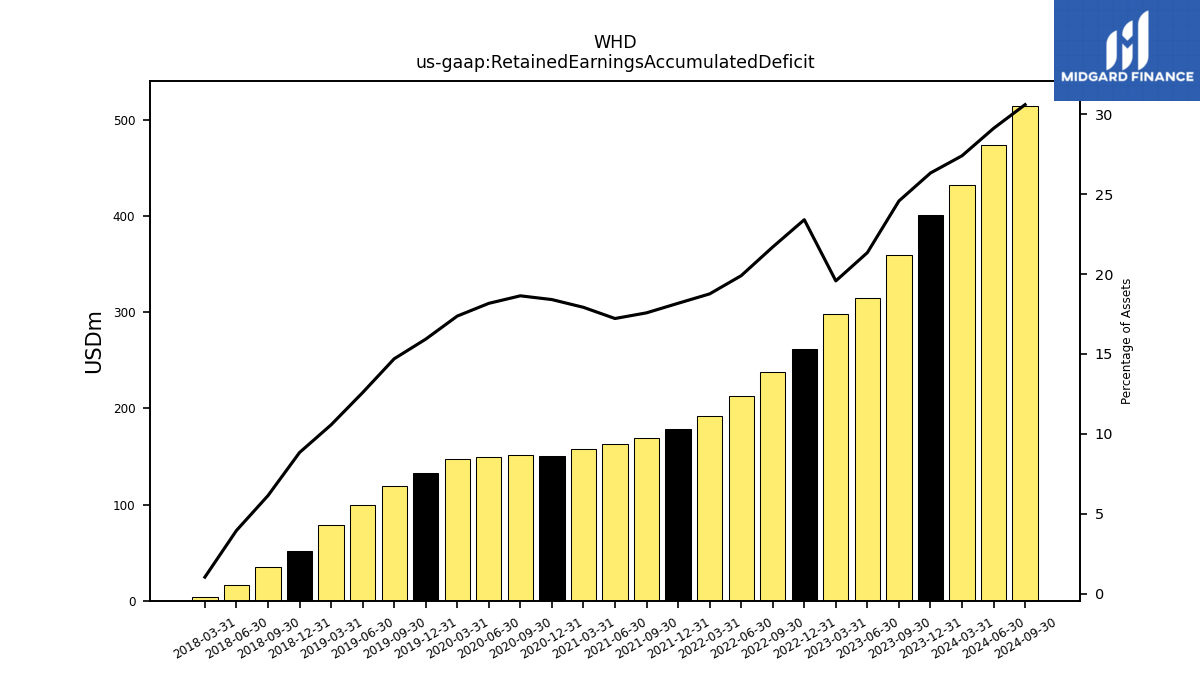
| Retained Earnings Accumulated Deficit | 431.70 | 400.68 | 359.70 | 315.05 | 297.53 | 261.76 | 237.55 | 212.91 | 192.49 | 178.45 | 169.39 | 162.67 | 157.29 | 150.09 | 151.24 | 149.36 | 147.67 | 132.99 | 119.24 | 99.90 | 78.49 | 51.68 | 34.76 | 16.09 | 3.75 | NA | NA | NA | NA | |
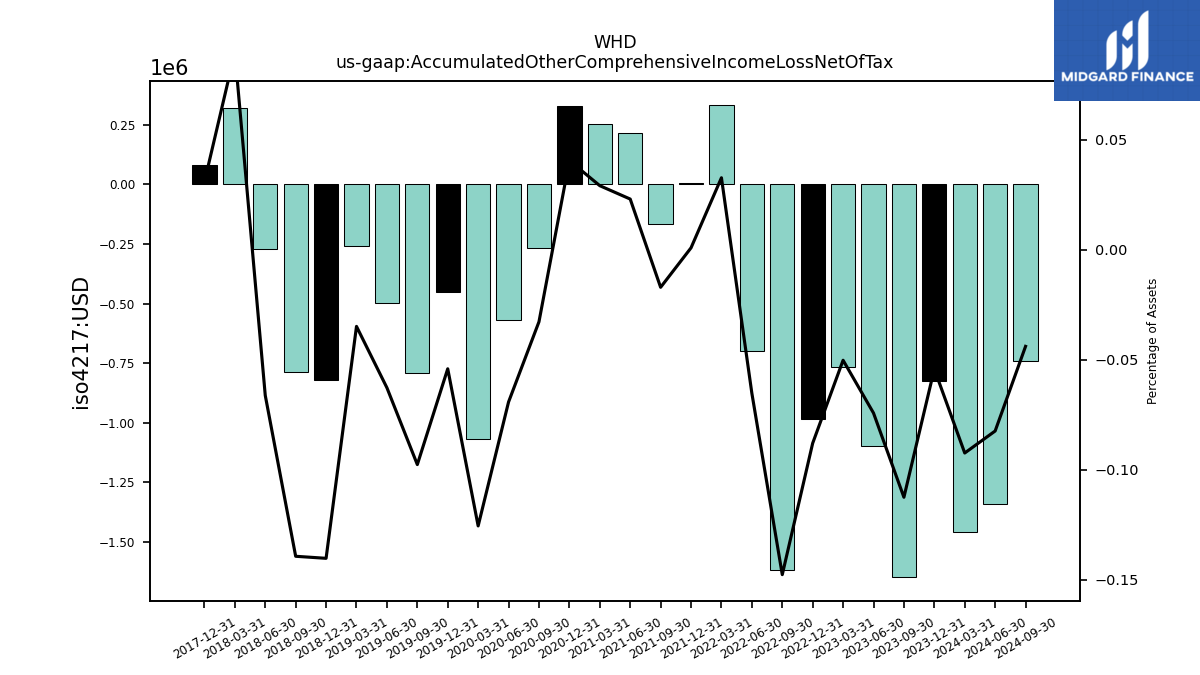
| Accumulated Other Comprehensive Income Loss Net Of Tax | -1.46 | -0.83 | -1.65 | -1.10 | -0.76 | -0.98 | -1.62 | -0.70 | 0.34 | 0.01 | -0.17 | 0.22 | 0.26 | 0.33 | -0.27 | -0.57 | -1.07 | -0.45 | -0.79 | -0.50 | -0.26 | -0.82 | -0.79 | -0.27 | 0.32 | 0.08 | NA | NA | NA | |
| Minority Interest | 207.22 | 199.25 | 189.06 | 191.97 | 188.58 | 138.53 | 131.41 | 126.57 | 122.78 | 126.39 | 122.83 | 129.21 | 153.09 | 197.80 | 195.54 | 201.16 | 199.97 | 188.93 | 176.73 | 161.50 | 147.76 | 184.67 | NA | NA | NA | NA | NA | NA | NA | |
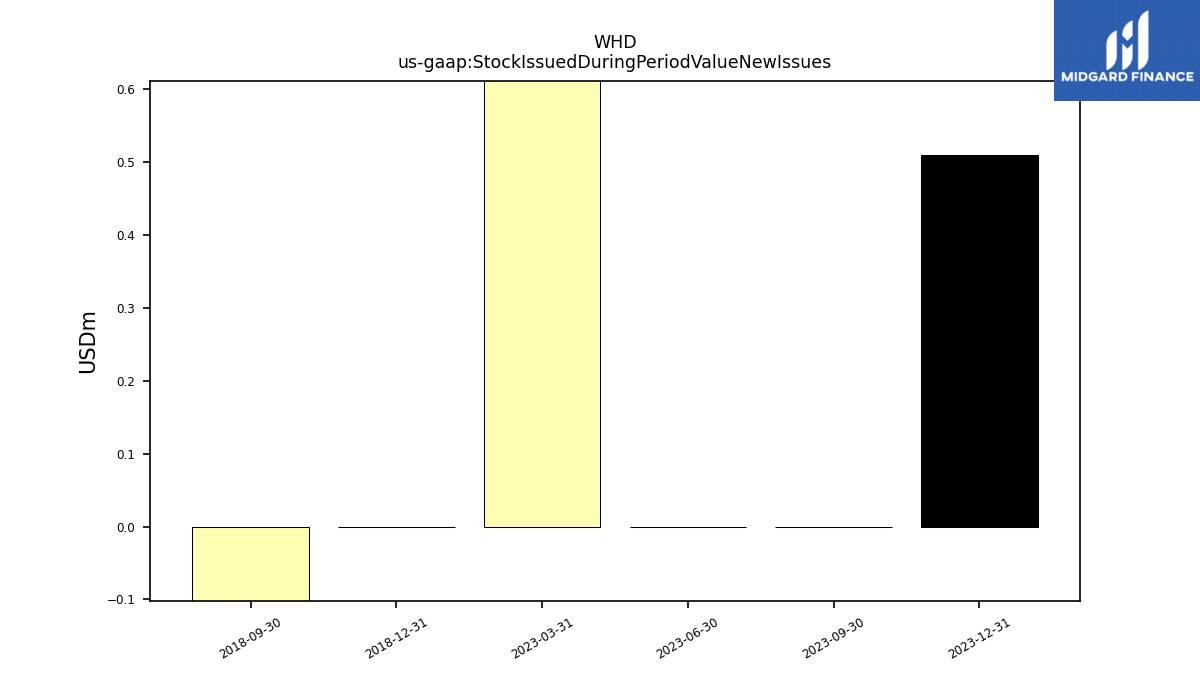
| Stock Issued During Period Value New Issues | NA | 0.51 | 0.00 | 0.00 | 169.37 | NA | NA | NA | NA | NA | NA | NA | NA | NA | NA | NA | NA | NA | NA | NA | NA | 0.00 | -0.71 | NA | NA | NA | NA | NA | NA | |
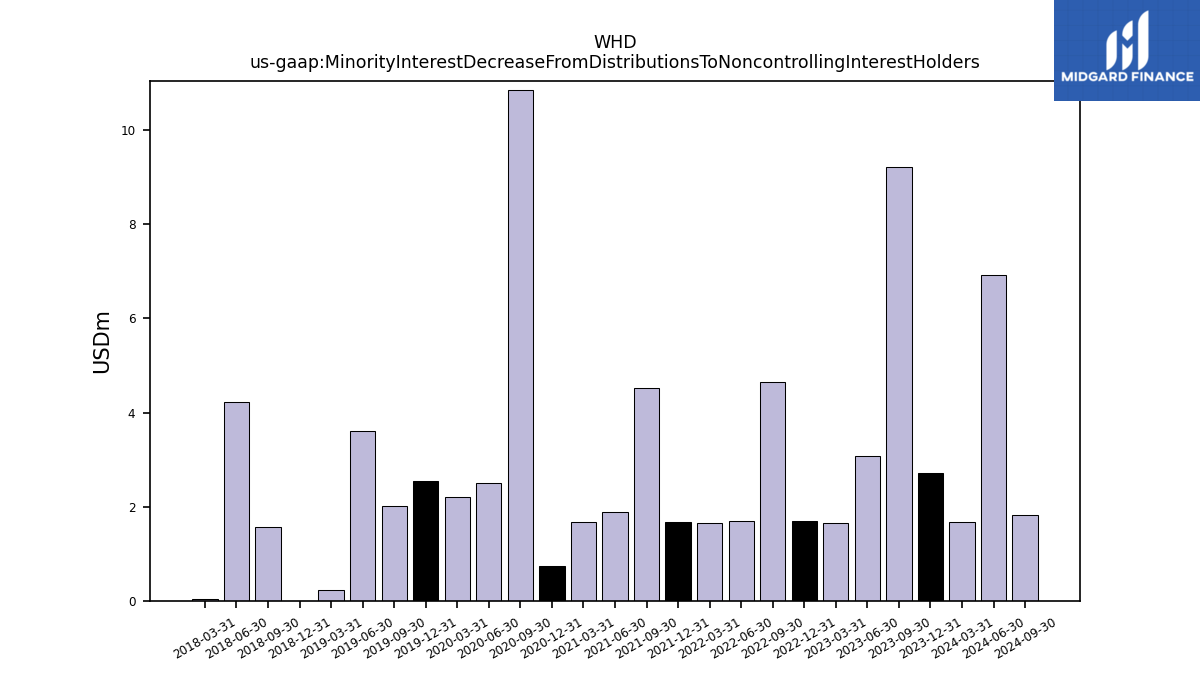
| Minority Interest Decrease From Distributions To Noncontrolling Interest Holders | 1.68 | 2.72 | 9.21 | 3.07 | 1.64 | 1.69 | 4.66 | 1.69 | 1.65 | 1.67 | 4.51 | 1.89 | 1.67 | 0.74 | 10.85 | 2.51 | 2.20 | 2.54 | 2.00 | 3.61 | 0.23 | 0.00 | 1.57 | 4.23 | 0.04 | NA | NA | NA | NA |
| 2024-03-31 | 2023-12-31 | 2023-09-30 | 2023-06-30 | 2023-03-31 | 2022-12-31 | 2022-09-30 | 2022-06-30 | 2022-03-31 | 2021-12-31 | 2021-09-30 | 2021-06-30 | 2021-03-31 | 2020-12-31 | 2020-09-30 | 2020-06-30 | 2020-03-31 | 2019-12-31 | 2019-09-30 | 2019-06-30 | 2019-03-31 | 2018-12-31 | 2018-09-30 | 2018-06-30 | 2018-03-31 | 2017-12-31 | 2017-09-30 | 2017-06-30 | 2017-03-31 | ||
|---|---|---|---|---|---|---|---|---|---|---|---|---|---|---|---|---|---|---|---|---|---|---|---|---|---|---|---|---|---|---|
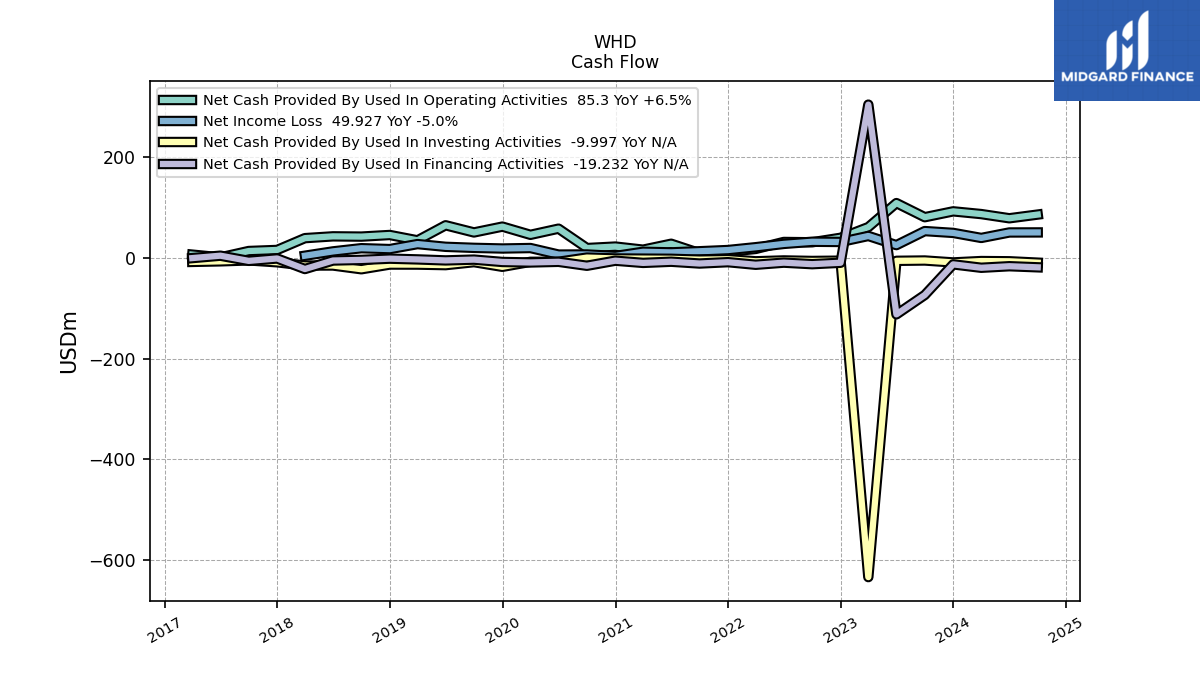
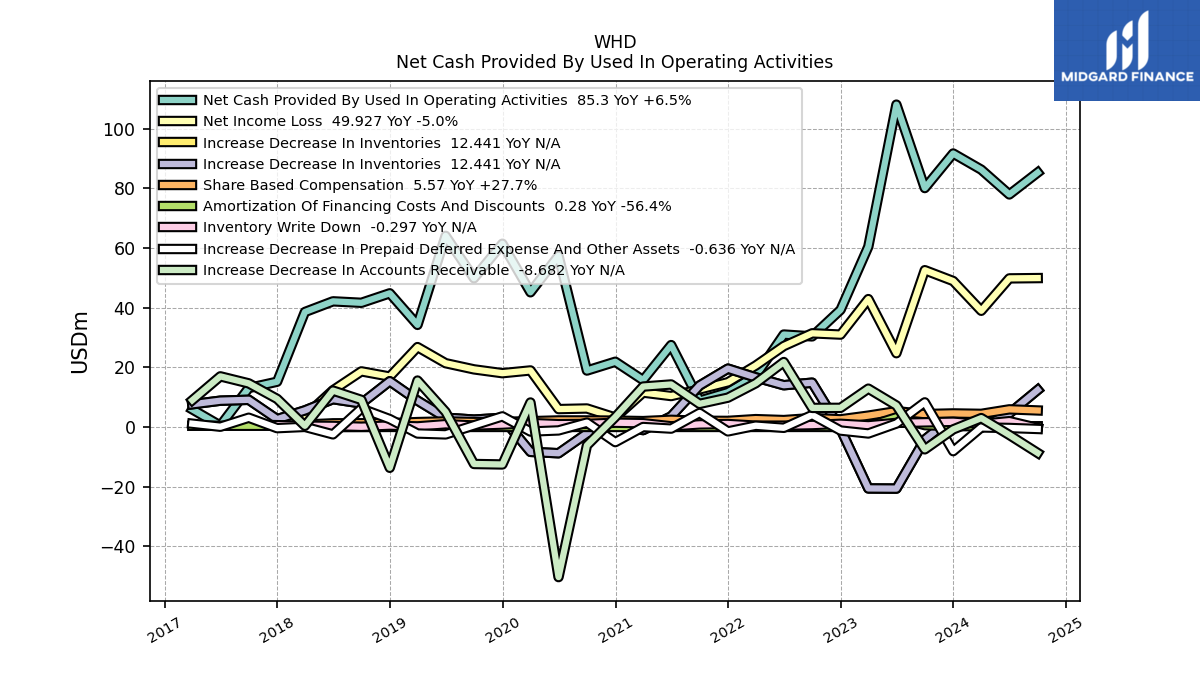
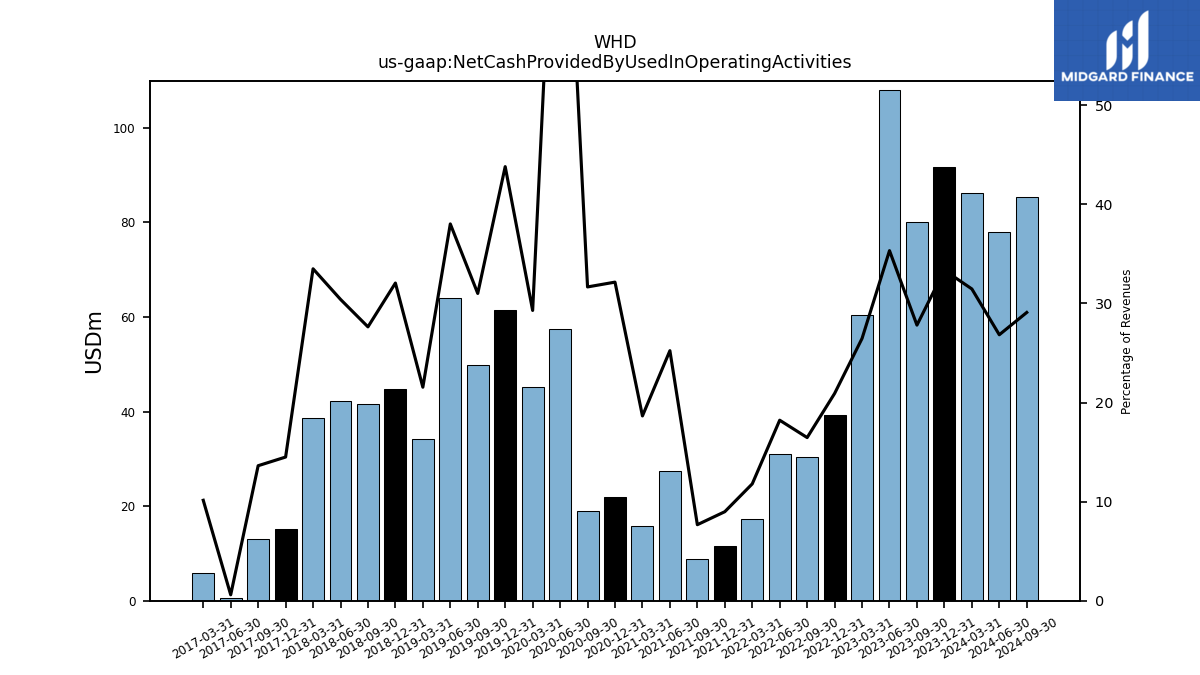
| Net Cash Provided By Used In Operating Activities | 86.26 | 91.68 | 80.08 | 108.06 | 60.46 | 39.28 | 30.38 | 31.01 | 17.21 | 11.68 | 8.86 | 27.48 | 15.75 | 21.89 | 18.94 | 57.39 | 45.16 | 61.44 | 49.87 | 64.08 | 34.24 | 44.83 | 41.65 | 42.14 | 38.56 | 15.20 | 13.09 | 0.49 | 5.93 | |
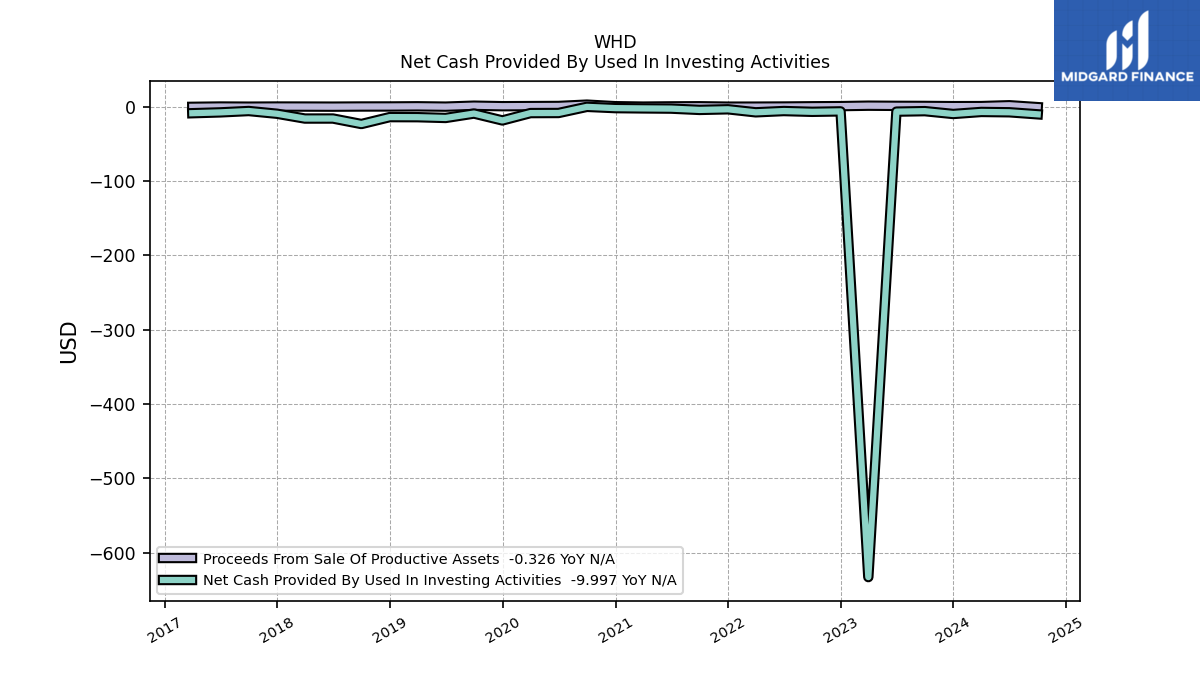
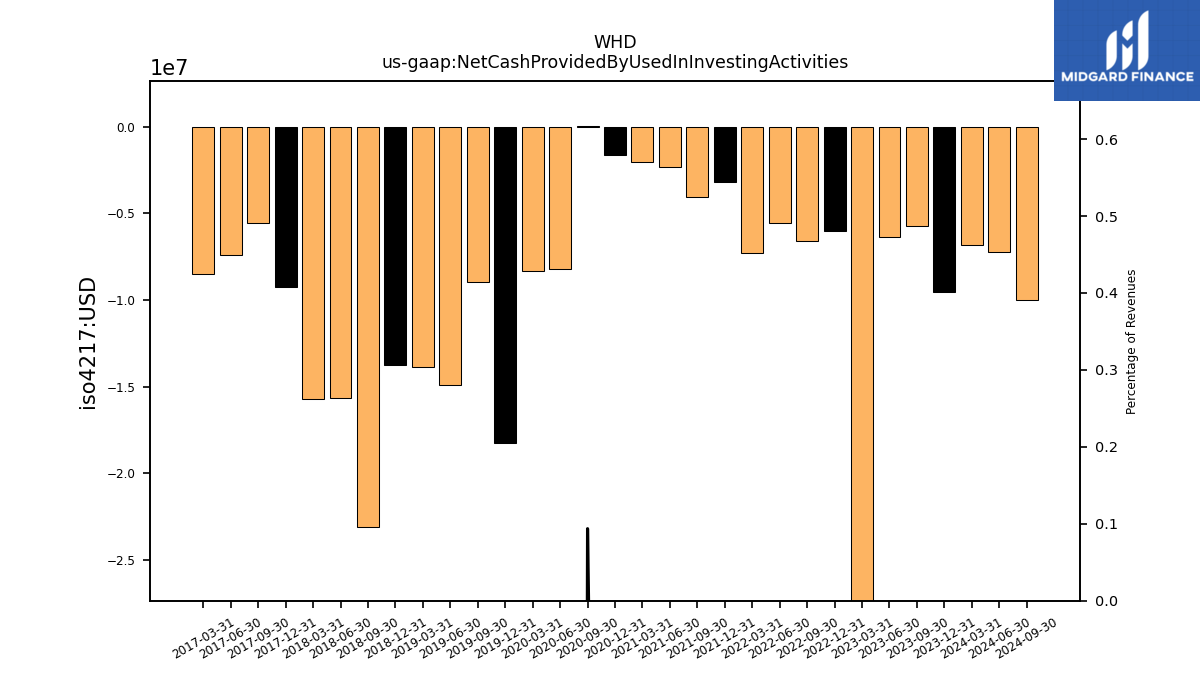
| Net Cash Provided By Used In Investing Activities | -6.81 | -9.55 | -5.72 | -6.37 | -633.15 | -6.04 | -6.62 | -5.58 | -7.29 | -3.22 | -4.06 | -2.33 | -2.03 | -1.65 | 0.06 | -8.21 | -8.34 | -18.23 | -8.97 | -14.90 | -13.85 | -13.75 | -23.06 | -15.66 | -15.69 | -9.25 | -5.54 | -7.38 | -8.50 | |
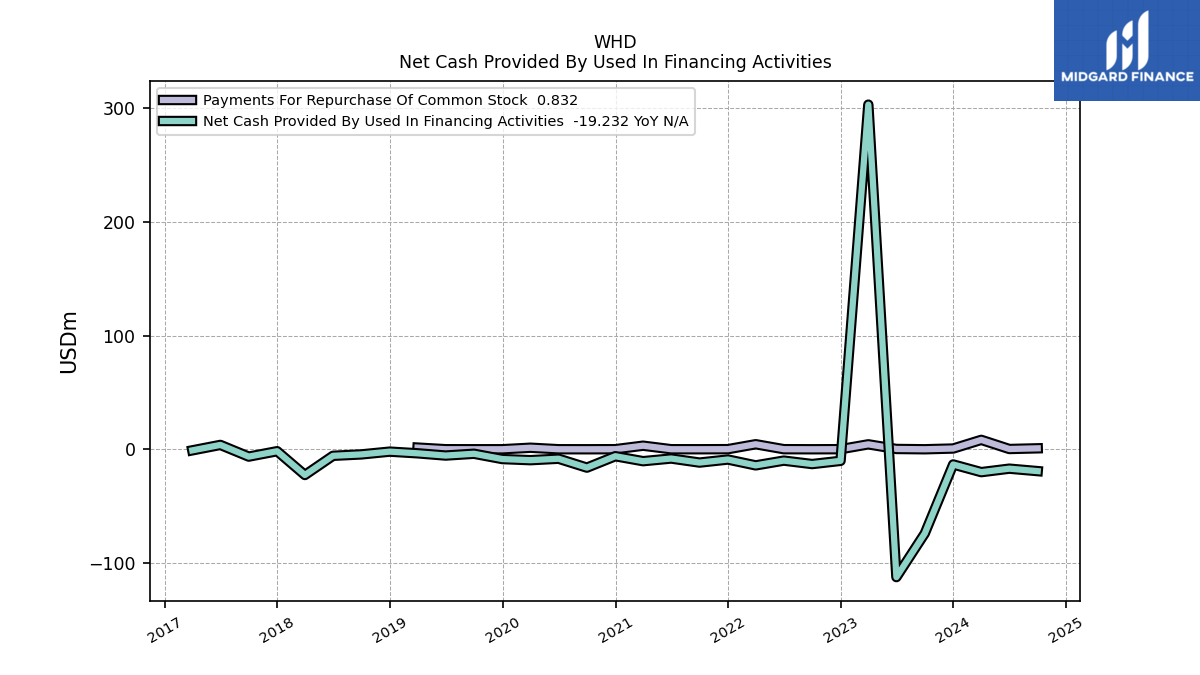
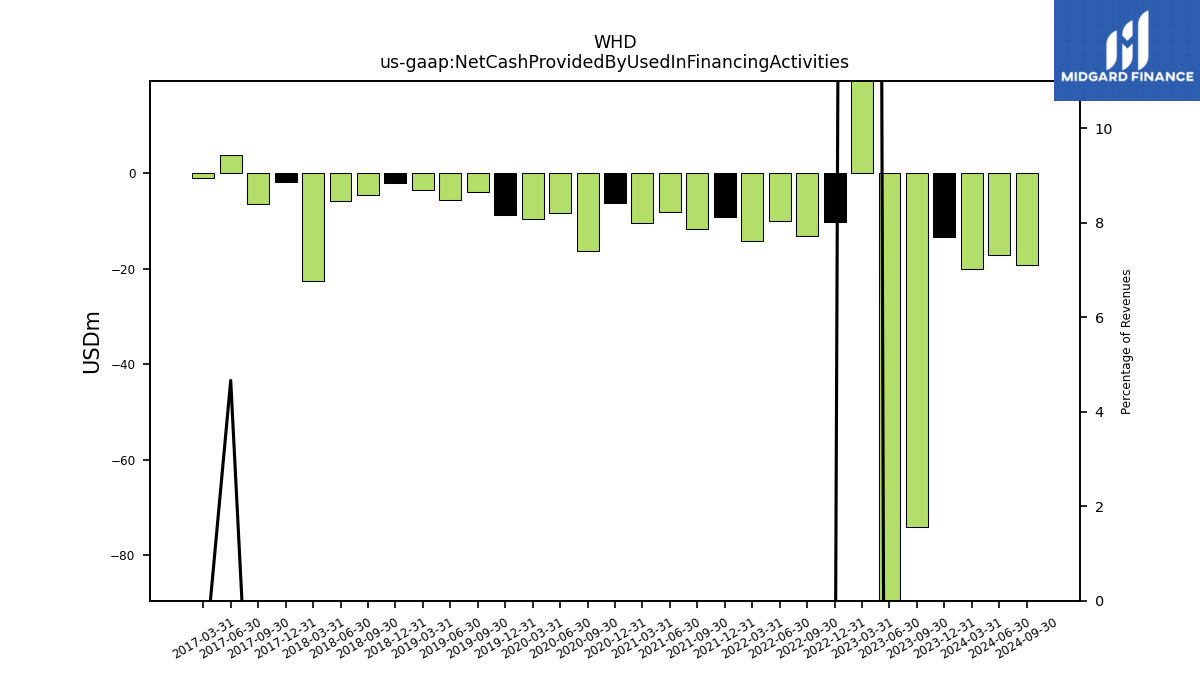
| Net Cash Provided By Used In Financing Activities | -20.13 | -13.38 | -74.04 | -112.48 | 303.16 | -10.20 | -13.02 | -9.98 | -14.18 | -9.03 | -11.71 | -8.16 | -10.48 | -6.12 | -16.16 | -8.33 | -9.60 | -8.63 | -3.96 | -5.53 | -3.56 | -2.08 | -4.53 | -5.76 | -22.64 | -1.70 | -6.46 | 3.82 | -0.96 |
| 2024-03-31 | 2023-12-31 | 2023-09-30 | 2023-06-30 | 2023-03-31 | 2022-12-31 | 2022-09-30 | 2022-06-30 | 2022-03-31 | 2021-12-31 | 2021-09-30 | 2021-06-30 | 2021-03-31 | 2020-12-31 | 2020-09-30 | 2020-06-30 | 2020-03-31 | 2019-12-31 | 2019-09-30 | 2019-06-30 | 2019-03-31 | 2018-12-31 | 2018-09-30 | 2018-06-30 | 2018-03-31 | 2017-12-31 | 2017-09-30 | 2017-06-30 | 2017-03-31 | ||
|---|---|---|---|---|---|---|---|---|---|---|---|---|---|---|---|---|---|---|---|---|---|---|---|---|---|---|---|---|---|---|
| Net Cash Provided By Used In Operating Activities | 86.26 | 91.68 | 80.08 | 108.06 | 60.46 | 39.28 | 30.38 | 31.01 | 17.21 | 11.68 | 8.86 | 27.48 | 15.75 | 21.89 | 18.94 | 57.39 | 45.16 | 61.44 | 49.87 | 64.08 | 34.24 | 44.83 | 41.65 | 42.14 | 38.56 | 15.20 | 13.09 | 0.49 | 5.93 | |
| Net Income Loss | 38.97 | 48.95 | 52.58 | 24.75 | 42.89 | 30.99 | 31.43 | 27.14 | 20.62 | 15.02 | 12.62 | 10.39 | 11.56 | 3.20 | 6.23 | 6.03 | 18.98 | 18.06 | 19.34 | 21.41 | 26.81 | 16.92 | 18.67 | 12.33 | 3.75 | NA | NA | NA | NA | |
| Profit Loss | 49.81 | 62.07 | 68.02 | 32.46 | 52.29 | 40.74 | 41.52 | 35.78 | 27.08 | 20.38 | 17.18 | 14.77 | 15.14 | 6.14 | 10.89 | 9.10 | 33.10 | 31.27 | 35.83 | 40.75 | 48.45 | 38.68 | 43.65 | 41.54 | 26.41 | 22.81 | 22.30 | 16.58 | 4.85 | |
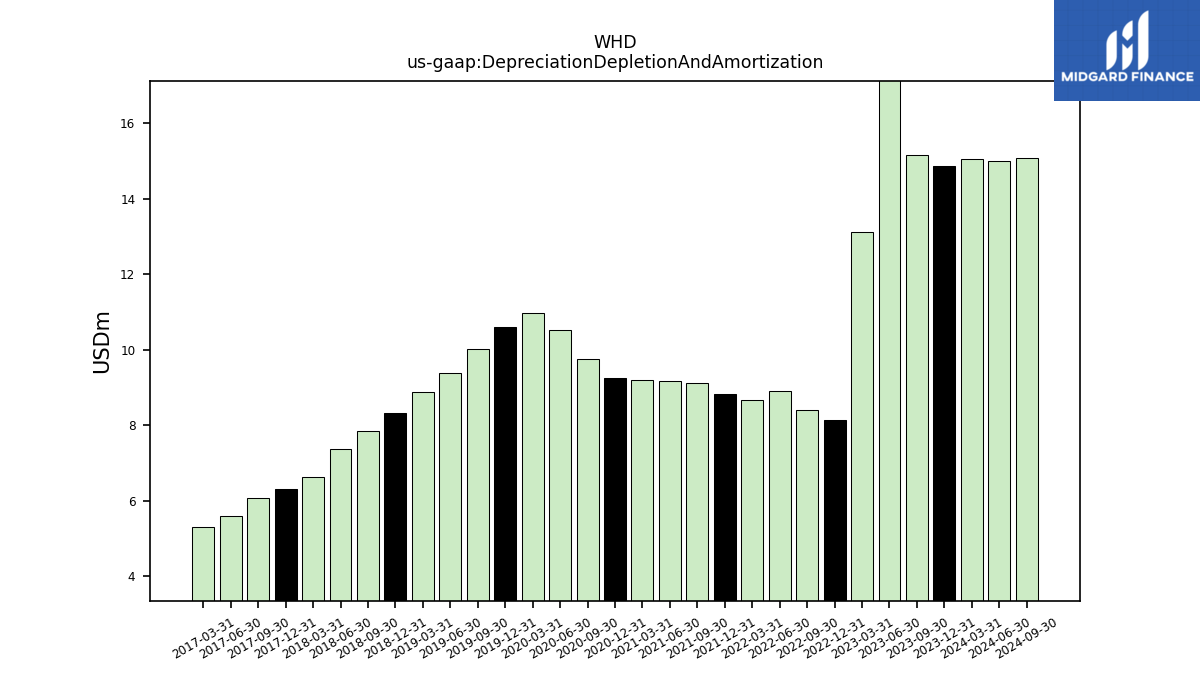
| Depreciation Depletion And Amortization | 15.05 | 14.87 | 15.16 | 21.91 | 13.11 | 8.13 | 8.40 | 8.91 | 8.68 | 8.83 | 9.13 | 9.16 | 9.19 | 9.26 | 9.76 | 10.52 | 10.98 | 10.59 | 10.01 | 9.38 | 8.88 | 8.32 | 7.84 | 7.37 | 6.62 | 6.29 | 6.07 | 5.59 | 5.31 | |
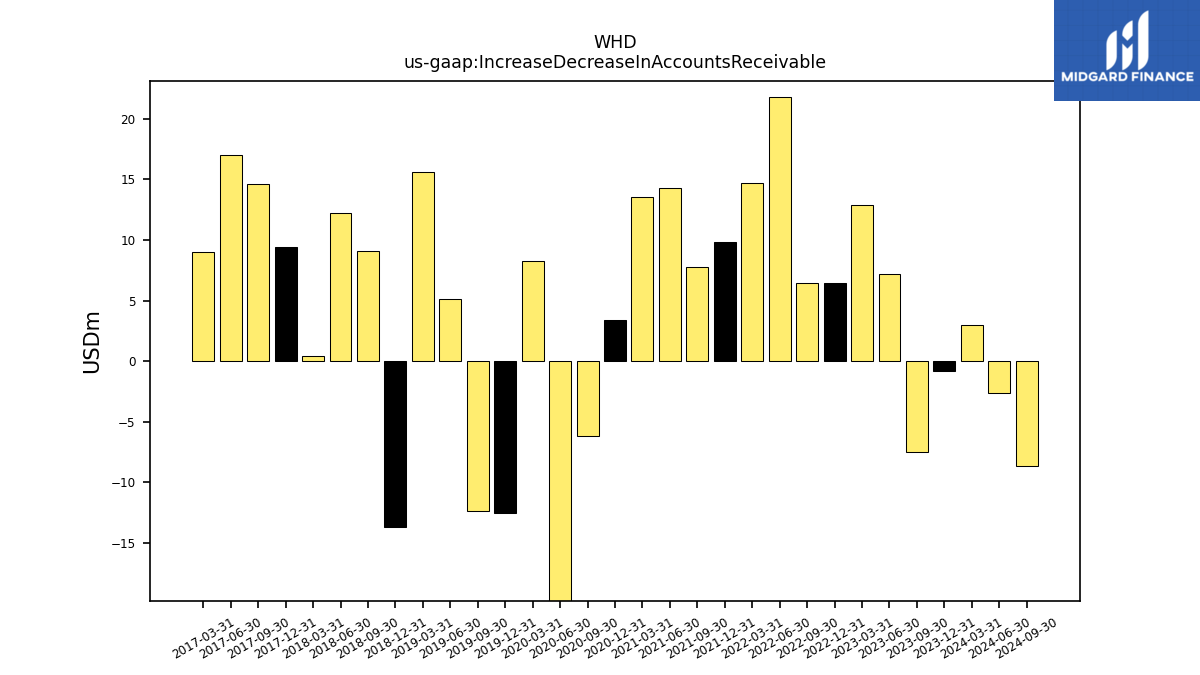
| Increase Decrease In Accounts Receivable | 3.01 | -0.78 | -7.47 | 7.22 | 12.88 | 6.44 | 6.42 | 21.80 | 14.68 | 9.86 | 7.78 | 14.28 | 13.57 | 3.36 | -6.15 | -50.28 | 8.24 | -12.53 | -12.37 | 5.10 | 15.60 | -13.66 | 9.11 | 12.23 | 0.42 | 9.45 | 14.65 | 17.00 | 9.00 | |
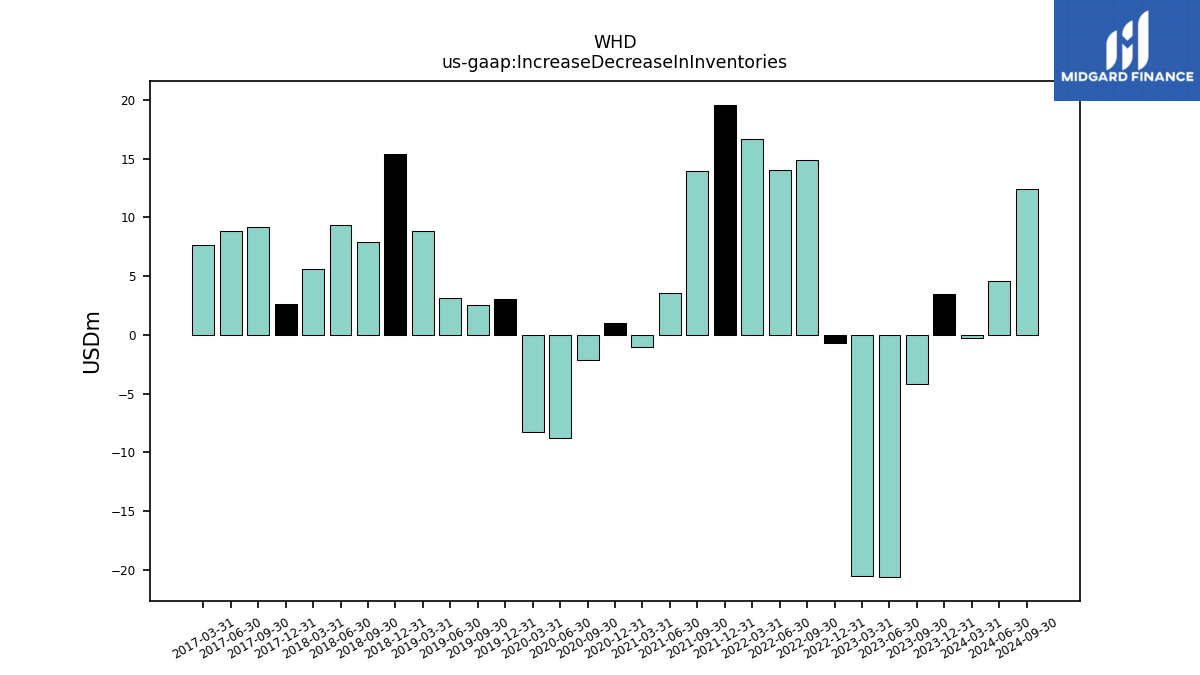
| Increase Decrease In Inventories | -0.23 | 3.46 | -4.19 | -20.62 | -20.57 | -0.65 | 14.88 | 14.02 | 16.65 | 19.59 | 13.92 | 3.58 | -1.01 | 0.99 | -2.11 | -8.77 | -8.31 | 3.08 | 2.50 | 3.13 | 8.88 | 15.36 | 7.92 | 9.35 | 5.59 | 2.65 | 9.14 | 8.85 | 7.65 | |
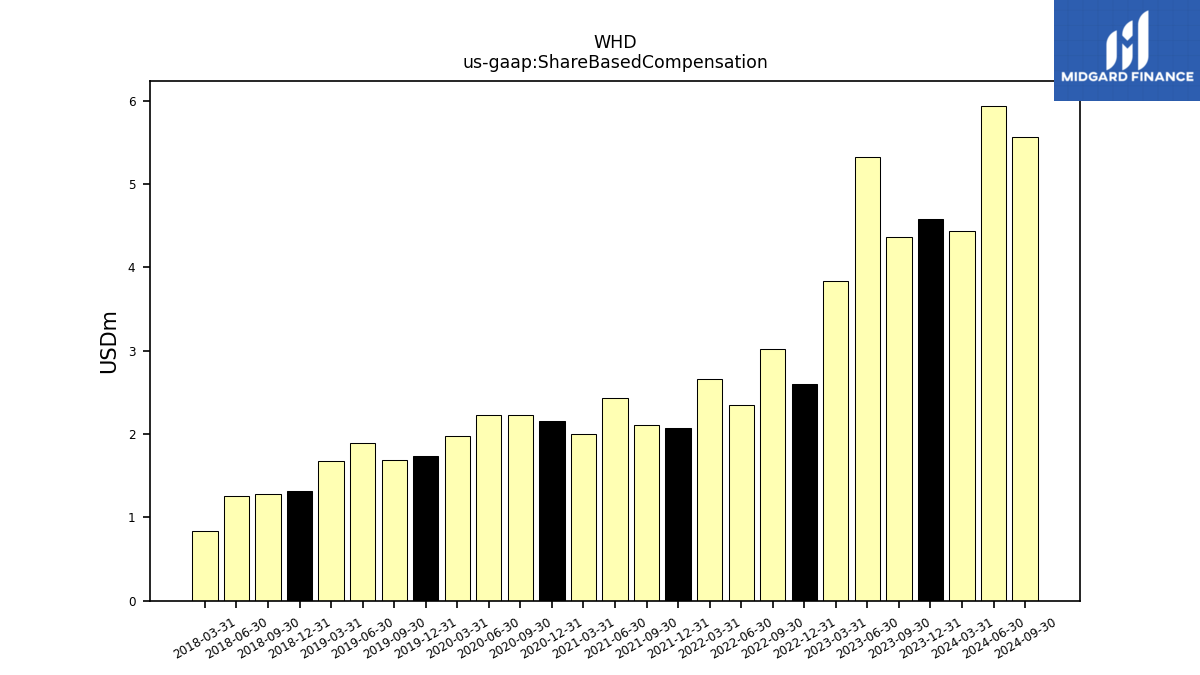
| Share Based Compensation | 4.43 | 4.58 | 4.36 | 5.32 | 3.84 | 2.60 | 3.02 | 2.35 | 2.67 | 2.07 | 2.11 | 2.44 | 2.00 | 2.16 | 2.23 | 2.23 | 1.97 | 1.74 | 1.69 | 1.89 | 1.68 | 1.32 | 1.29 | 1.26 | 0.83 | NA | NA | NA | NA |
| 2024-03-31 | 2023-12-31 | 2023-09-30 | 2023-06-30 | 2023-03-31 | 2022-12-31 | 2022-09-30 | 2022-06-30 | 2022-03-31 | 2021-12-31 | 2021-09-30 | 2021-06-30 | 2021-03-31 | 2020-12-31 | 2020-09-30 | 2020-06-30 | 2020-03-31 | 2019-12-31 | 2019-09-30 | 2019-06-30 | 2019-03-31 | 2018-12-31 | 2018-09-30 | 2018-06-30 | 2018-03-31 | 2017-12-31 | 2017-09-30 | 2017-06-30 | 2017-03-31 | ||
|---|---|---|---|---|---|---|---|---|---|---|---|---|---|---|---|---|---|---|---|---|---|---|---|---|---|---|---|---|---|---|
| Net Cash Provided By Used In Investing Activities | -6.81 | -9.55 | -5.72 | -6.37 | -633.15 | -6.04 | -6.62 | -5.58 | -7.29 | -3.22 | -4.06 | -2.33 | -2.03 | -1.65 | 0.06 | -8.21 | -8.34 | -18.23 | -8.97 | -14.90 | -13.85 | -13.75 | -23.06 | -15.66 | -15.69 | -9.25 | -5.54 | -7.38 | -8.50 |
| 2024-03-31 | 2023-12-31 | 2023-09-30 | 2023-06-30 | 2023-03-31 | 2022-12-31 | 2022-09-30 | 2022-06-30 | 2022-03-31 | 2021-12-31 | 2021-09-30 | 2021-06-30 | 2021-03-31 | 2020-12-31 | 2020-09-30 | 2020-06-30 | 2020-03-31 | 2019-12-31 | 2019-09-30 | 2019-06-30 | 2019-03-31 | 2018-12-31 | 2018-09-30 | 2018-06-30 | 2018-03-31 | 2017-12-31 | 2017-09-30 | 2017-06-30 | 2017-03-31 | ||
|---|---|---|---|---|---|---|---|---|---|---|---|---|---|---|---|---|---|---|---|---|---|---|---|---|---|---|---|---|---|---|
| Net Cash Provided By Used In Financing Activities | -20.13 | -13.38 | -74.04 | -112.48 | 303.16 | -10.20 | -13.02 | -9.98 | -14.18 | -9.03 | -11.71 | -8.16 | -10.48 | -6.12 | -16.16 | -8.33 | -9.60 | -8.63 | -3.96 | -5.53 | -3.56 | -2.08 | -4.53 | -5.76 | -22.64 | -1.70 | -6.46 | 3.82 | -0.96 | |
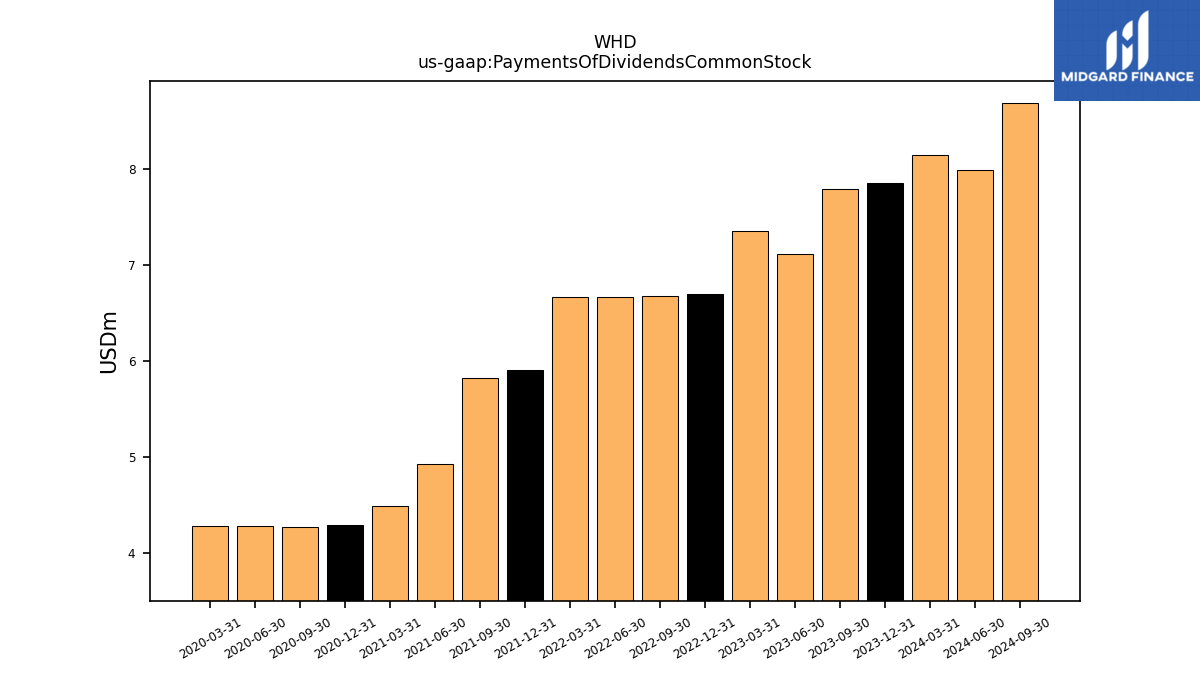
| Payments Of Dividends Common Stock | 8.14 | 7.86 | 7.80 | 7.12 | 7.35 | 6.70 | 6.68 | 6.67 | 6.66 | 5.91 | 5.82 | 4.93 | 4.50 | 4.29 | 4.28 | 4.29 | 4.28 | NA | NA | NA | NA | NA | NA | NA | NA | NA | NA | NA | NA | |
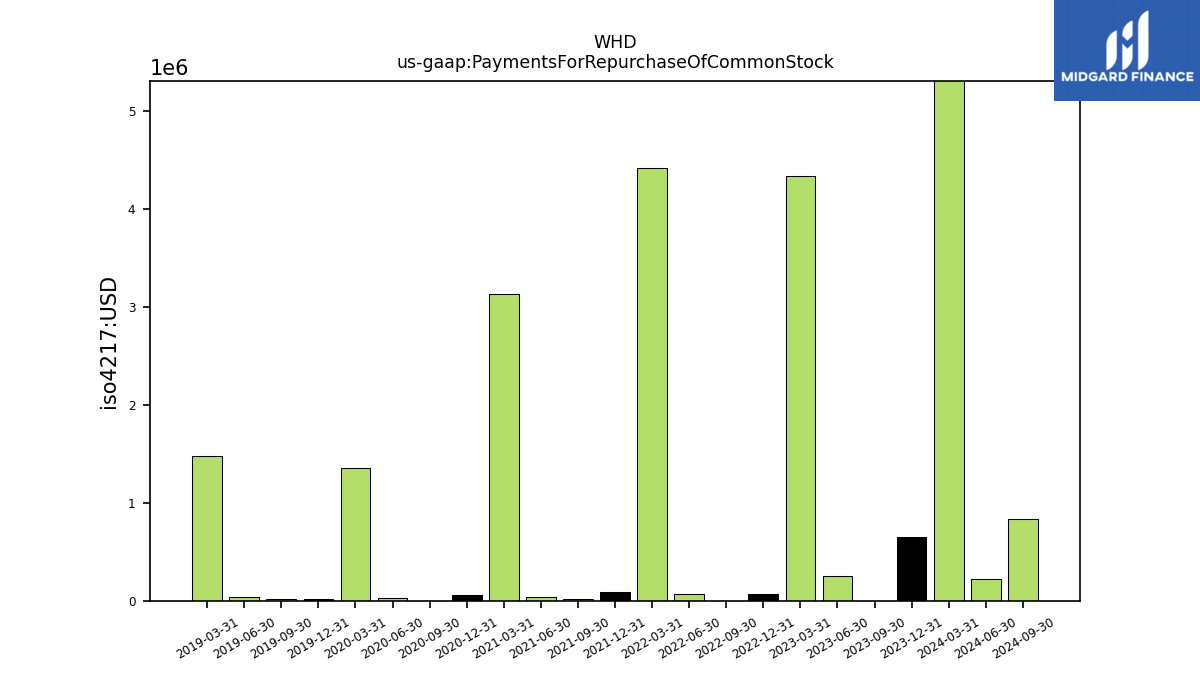
| Payments For Repurchase Of Common Stock | 8.27 | 0.65 | 0.00 | 0.26 | 4.34 | 0.07 | 0.00 | 0.07 | 4.42 | 0.09 | 0.02 | 0.04 | 3.14 | 0.06 | 0.00 | 0.03 | 1.36 | 0.02 | 0.01 | 0.04 | 1.47 | NA | NA | NA | NA | NA | NA | NA | NA |
| 2024-03-31 | 2023-12-31 | 2023-09-30 | 2023-06-30 | 2023-03-31 | 2022-12-31 | 2022-09-30 | 2022-06-30 | 2022-03-31 | 2021-12-31 | 2021-09-30 | 2021-06-30 | 2021-03-31 | 2020-12-31 | 2020-09-30 | 2020-06-30 | 2020-03-31 | 2019-12-31 | 2019-09-30 | 2019-06-30 | 2019-03-31 | 2018-12-31 | 2018-09-30 | 2018-06-30 | 2018-03-31 | 2017-12-31 | 2017-09-30 | 2017-06-30 | 2017-03-31 | ||
|---|---|---|---|---|---|---|---|---|---|---|---|---|---|---|---|---|---|---|---|---|---|---|---|---|---|---|---|---|---|---|
| Revenues | 274.12 | 274.87 | 287.87 | 305.82 | 228.41 | 187.77 | 184.48 | 170.22 | 145.90 | 129.92 | 115.36 | 108.89 | 84.42 | 68.09 | 59.79 | 66.55 | 154.14 | 140.24 | 160.81 | 168.49 | 158.88 | 139.82 | 150.66 | 138.54 | 115.11 | 104.78 | 96.03 | 81.88 | 58.50 | |
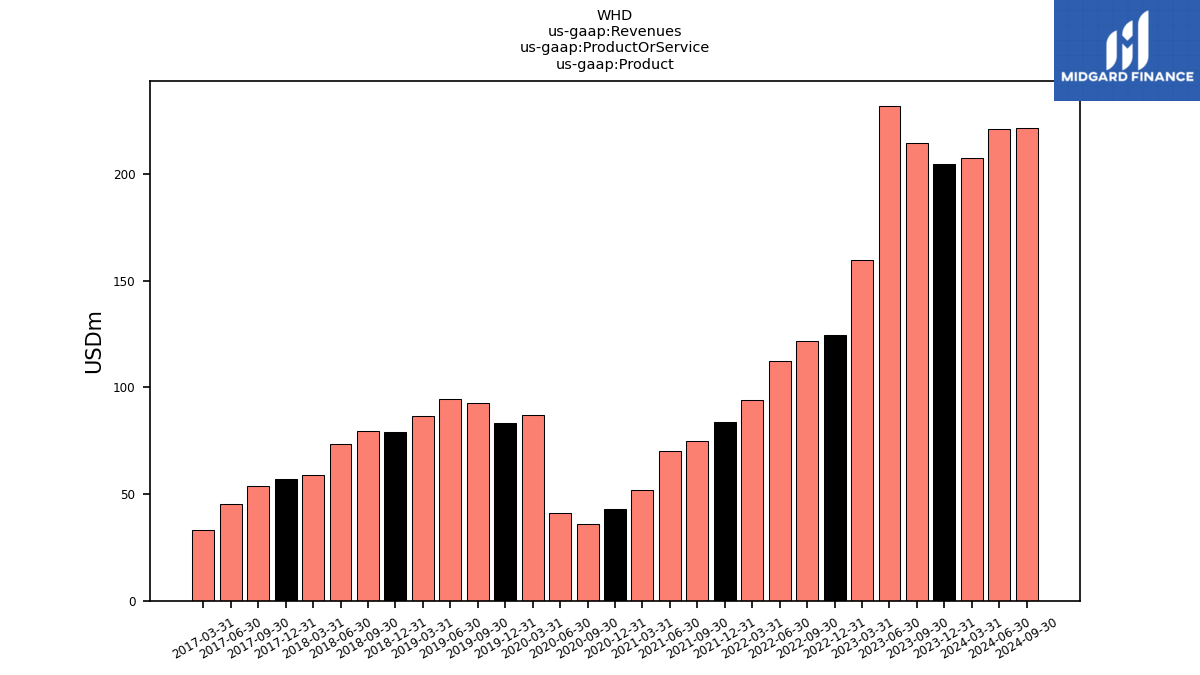
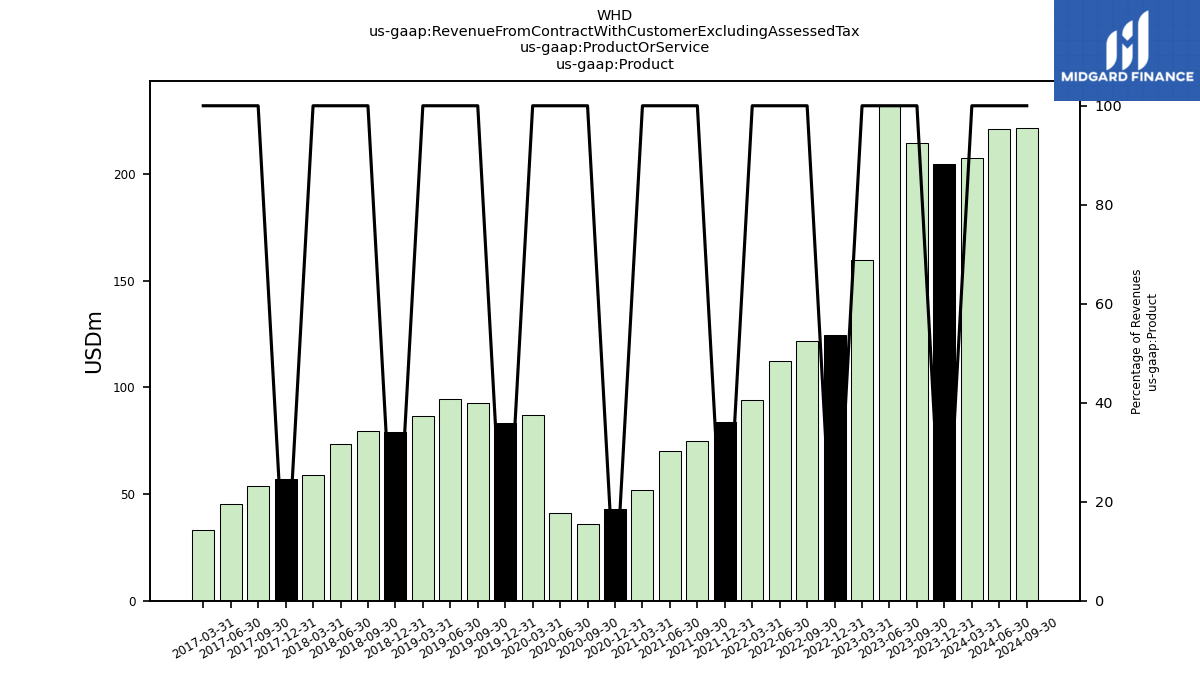
| Product | 207.51 | 204.68 | 214.29 | 231.89 | 159.51 | 124.56 | 121.78 | 112.23 | 94.04 | 83.77 | 74.83 | 70.34 | 51.96 | 43.02 | 35.86 | 40.89 | 87.03 | 83.37 | 92.58 | 94.49 | 86.64 | 78.90 | 79.39 | 73.28 | 58.93 | 57.13 | 53.68 | 45.24 | 33.04 | |
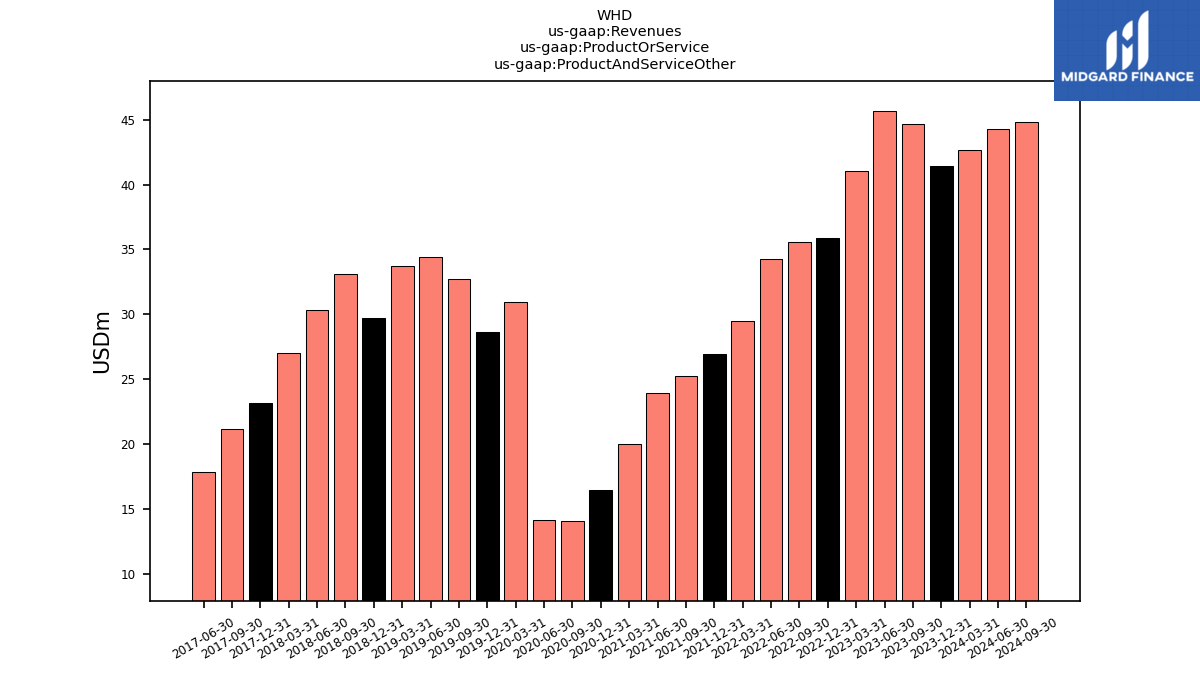
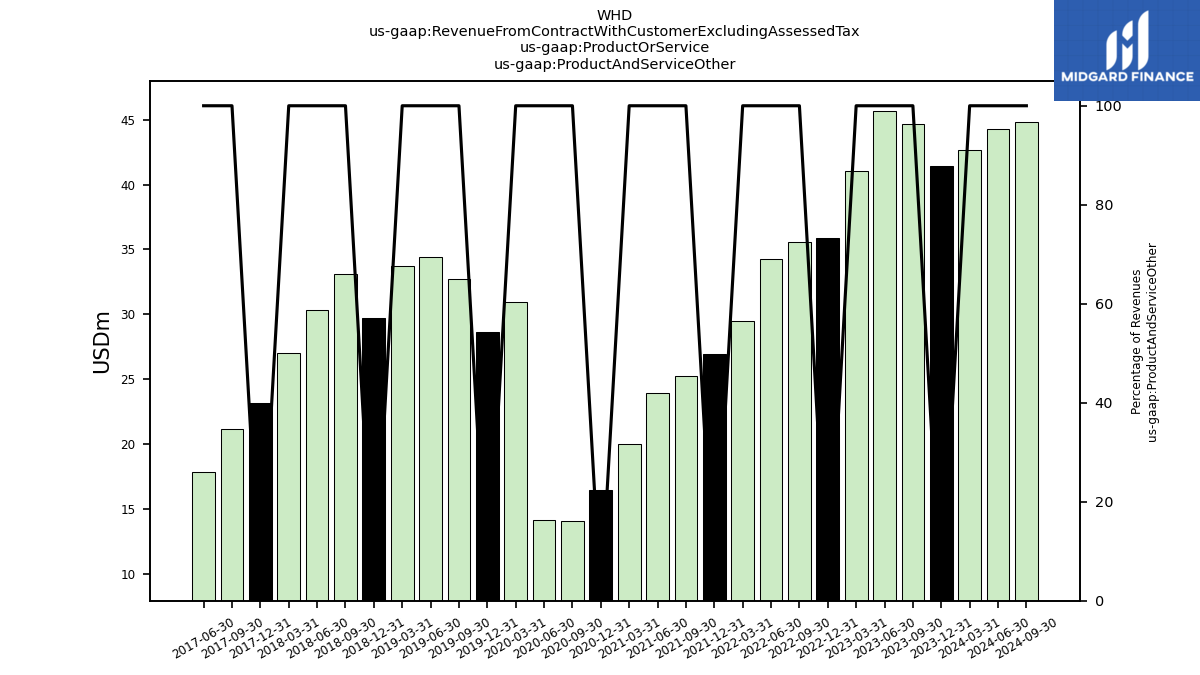
| Product And Service Other | 42.67 | 41.47 | 44.70 | 45.71 | 41.08 | 35.90 | 35.59 | 34.29 | 29.52 | 26.92 | 25.26 | 23.90 | 19.97 | 16.48 | 14.05 | 14.12 | 30.95 | 28.65 | 32.70 | 34.42 | 33.74 | 29.73 | 33.13 | 30.32 | 27.04 | 23.17 | 21.15 | 17.83 | NA | |
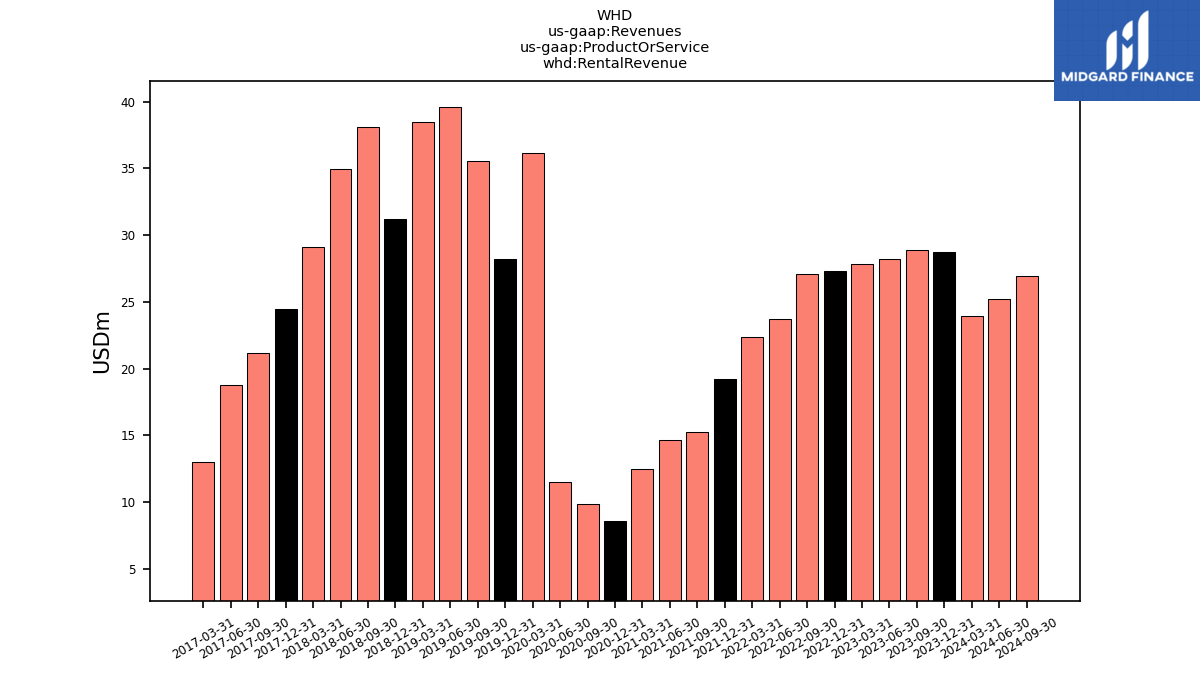
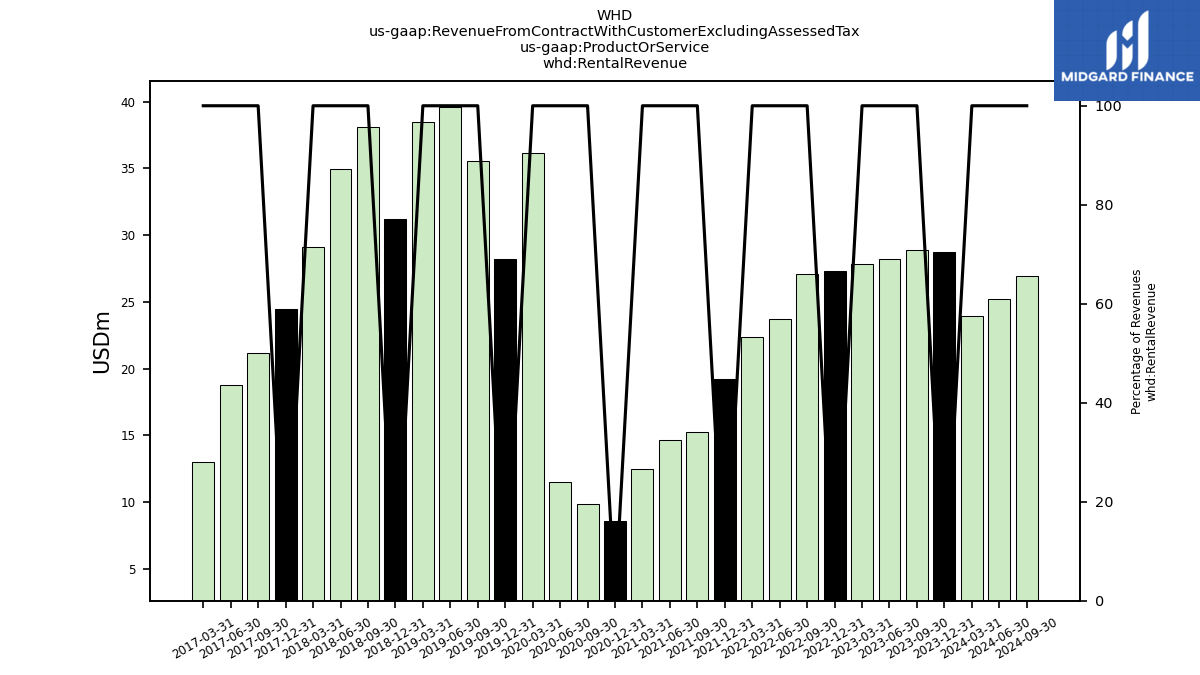
| Rental Revenue | 23.94 | 28.71 | 28.88 | 28.22 | 27.82 | 27.31 | 27.11 | 23.70 | 22.34 | 19.23 | 15.27 | 14.64 | 12.49 | 8.59 | 9.88 | 11.54 | 36.16 | 28.21 | 35.53 | 39.58 | 38.50 | 31.19 | 38.13 | 34.94 | 29.14 | 24.49 | 21.20 | 18.80 | 12.97 | |
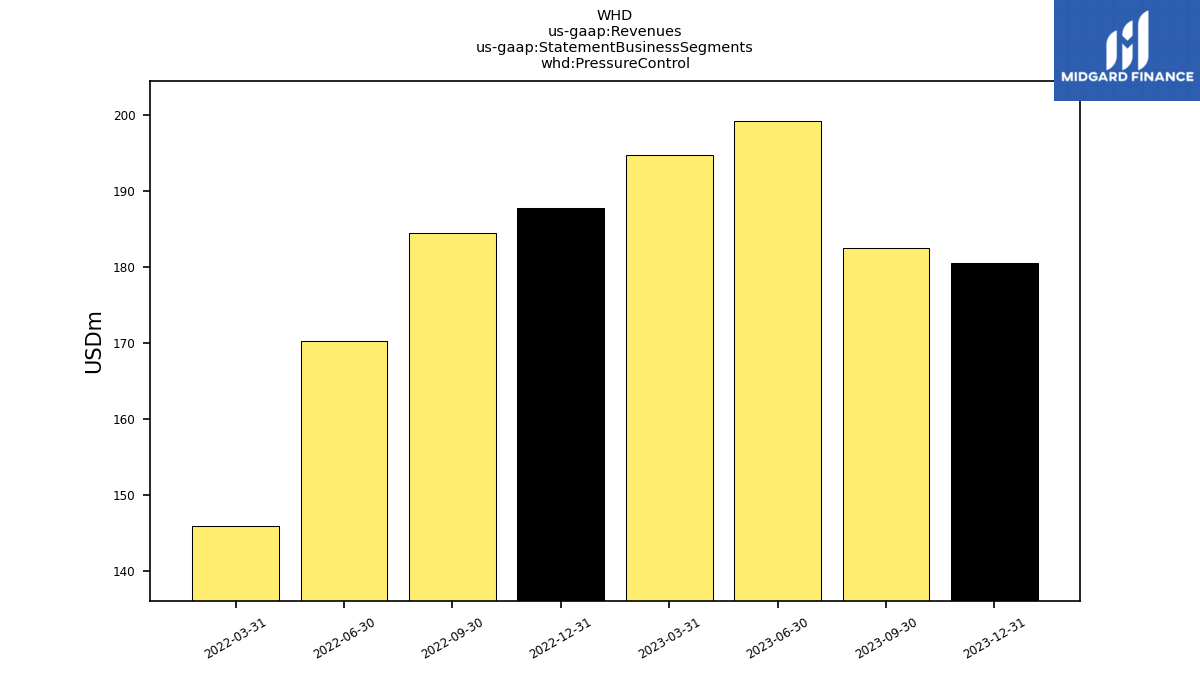
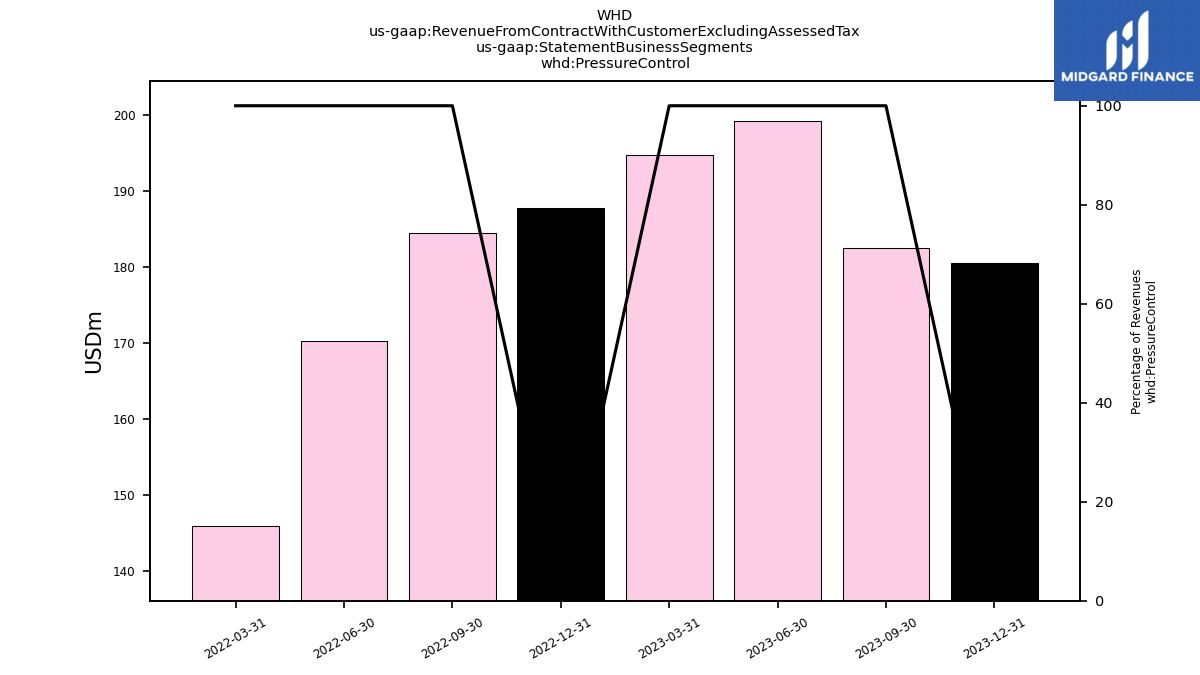
| Pressure Control | 175.03 | 180.45 | 182.48 | 199.13 | 194.66 | 187.77 | 184.48 | 170.22 | 145.90 | NA | NA | NA | NA | NA | NA | NA | NA | NA | NA | NA | NA | NA | NA | NA | NA | NA | NA | NA | NA | |
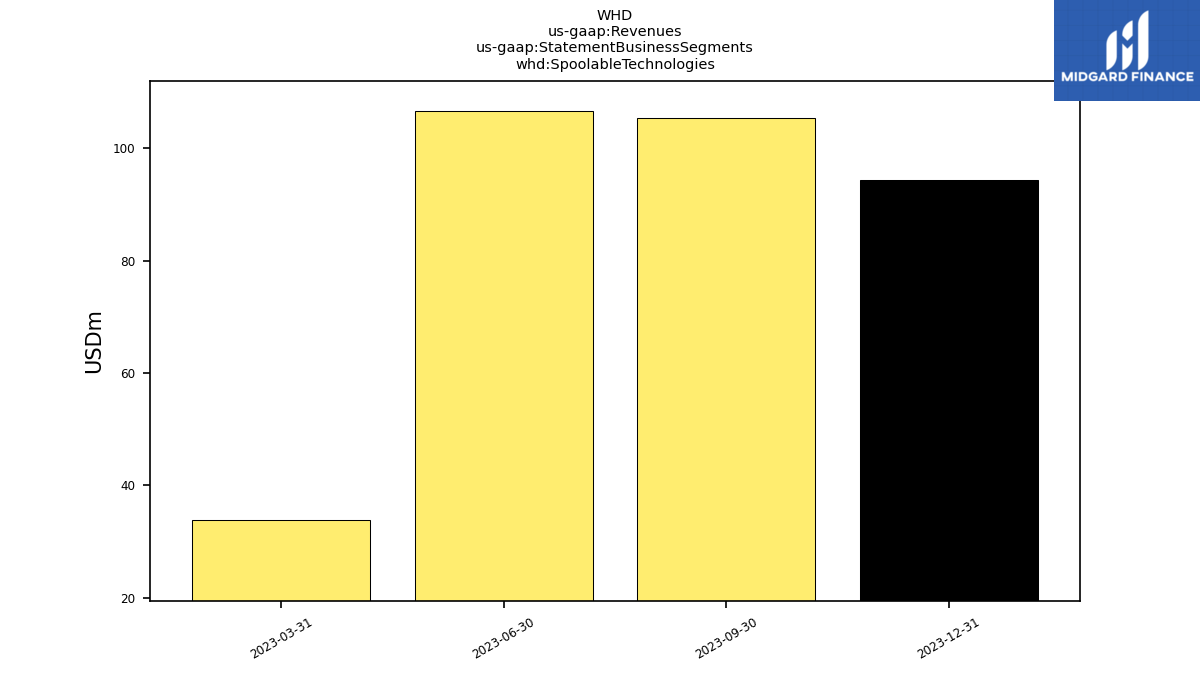
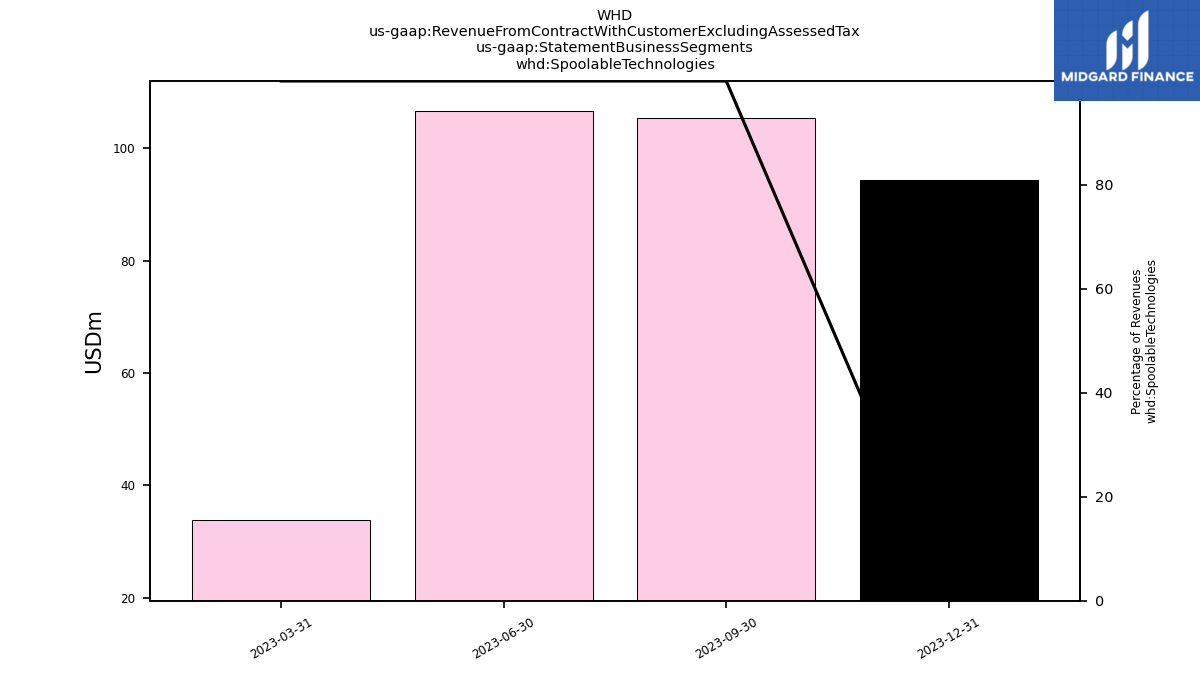
| Spoolable Technologies | 99.09 | 94.41 | 105.39 | 106.69 | 33.75 | NA | NA | NA | NA | NA | NA | NA | NA | NA | NA | NA | NA | NA | NA | NA | NA | NA | NA | NA | NA | NA | NA | NA | NA | |
| Revenue From Contract With Customer Excluding Assessed Tax | 274.12 | 274.87 | 287.87 | 305.82 | 228.41 | 187.77 | 184.48 | 170.22 | 145.90 | 129.92 | 115.36 | 108.89 | 84.42 | 68.09 | 59.79 | 66.55 | 154.14 | 140.24 | 160.81 | 168.49 | 158.88 | 139.82 | 150.66 | 138.54 | 115.11 | 104.78 | 96.03 | 81.88 | 58.50 | |
| Product | 207.51 | 204.68 | 214.29 | 231.89 | 159.51 | 124.56 | 121.78 | 112.23 | 94.04 | 83.77 | 74.83 | 70.34 | 51.96 | 43.02 | 35.86 | 40.89 | 87.03 | 83.37 | 92.58 | 94.49 | 86.64 | 78.90 | 79.39 | 73.28 | 58.93 | 57.13 | 53.68 | 45.24 | 33.04 | |
| Product And Service Other | 42.67 | 41.47 | 44.70 | 45.71 | 41.08 | 35.90 | 35.59 | 34.29 | 29.52 | 26.92 | 25.26 | 23.90 | 19.97 | 16.48 | 14.05 | 14.12 | 30.95 | 28.65 | 32.70 | 34.42 | 33.74 | 29.73 | 33.13 | 30.32 | 27.04 | 23.17 | 21.15 | 17.83 | NA | |
| Rental Revenue | 23.94 | 28.71 | 28.88 | 28.22 | 27.82 | 27.31 | 27.11 | 23.70 | 22.34 | 19.23 | 15.27 | 14.64 | 12.49 | 8.59 | 9.88 | 11.54 | 36.16 | 28.21 | 35.53 | 39.58 | 38.50 | 31.19 | 38.13 | 34.94 | 29.14 | 24.49 | 21.20 | 18.80 | 12.97 | |
| Pressure Control | 175.03 | 180.45 | 182.48 | 199.13 | 194.66 | 187.77 | 184.48 | 170.22 | 145.90 | NA | NA | NA | NA | NA | NA | NA | NA | NA | NA | NA | NA | NA | NA | NA | NA | NA | NA | NA | NA | |
| Spoolable Technologies | 99.09 | 94.41 | 105.39 | 106.69 | 33.75 | NA | NA | NA | NA | NA | NA | NA | NA | NA | NA | NA | NA | NA | NA | NA | NA | NA | NA | NA | NA | NA | NA | NA | NA | |
| Revenue From Contract With Customer Including Assessed Tax | 274.12 | 274.87 | 287.87 | 305.82 | 228.41 | 187.77 | 184.48 | 170.22 | 145.90 | 129.92 | 115.36 | 108.89 | 84.42 | 68.09 | 59.79 | 66.55 | 154.14 | 140.24 | 160.81 | 168.49 | 158.88 | 139.82 | 150.66 | 138.54 | 115.11 | 104.78 | 96.03 | 81.88 | 58.50 |
