
| 2024-03-31 | 2023-12-31 | 2023-09-30 | 2023-06-30 | 2023-03-31 | 2022-12-31 | 2022-09-30 | 2022-06-30 | 2022-03-31 | 2021-12-31 | 2021-09-30 | 2021-06-30 | 2021-03-31 | 2020-12-31 | 2020-09-30 | 2020-06-30 | 2020-03-31 | 2019-12-31 | 2019-09-30 | 2019-06-30 | 2019-03-31 | 2018-12-31 | 2018-09-30 | 2018-06-30 | 2018-03-31 | 2017-12-31 | 2017-09-30 | 2017-06-30 | 2017-03-31 | 2016-12-31 | 2016-09-30 | 2016-06-30 | 2016-03-31 | 2015-12-31 | 2015-09-30 | 2015-06-30 | 2015-03-31 | 2014-12-31 | 2014-09-30 | 2014-06-30 | 2014-03-31 | 2013-12-31 | 2013-09-30 | 2013-06-30 | 2013-03-31 | 2012-12-31 | 2012-09-30 | 2012-06-30 | 2012-03-31 | 2011-12-31 | 2011-09-30 | 2011-06-30 | 2011-03-31 | 2010-12-31 | 2010-09-30 | 2010-06-30 | 2010-03-31 | ||
|---|---|---|---|---|---|---|---|---|---|---|---|---|---|---|---|---|---|---|---|---|---|---|---|---|---|---|---|---|---|---|---|---|---|---|---|---|---|---|---|---|---|---|---|---|---|---|---|---|---|---|---|---|---|---|---|---|---|---|
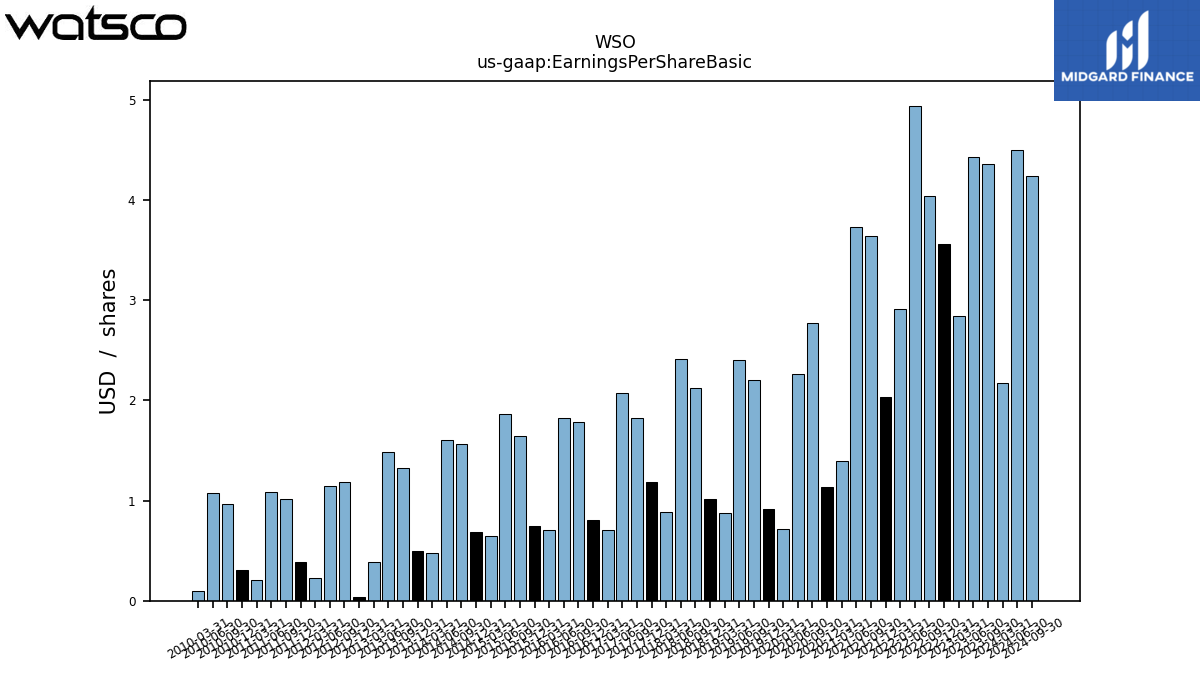
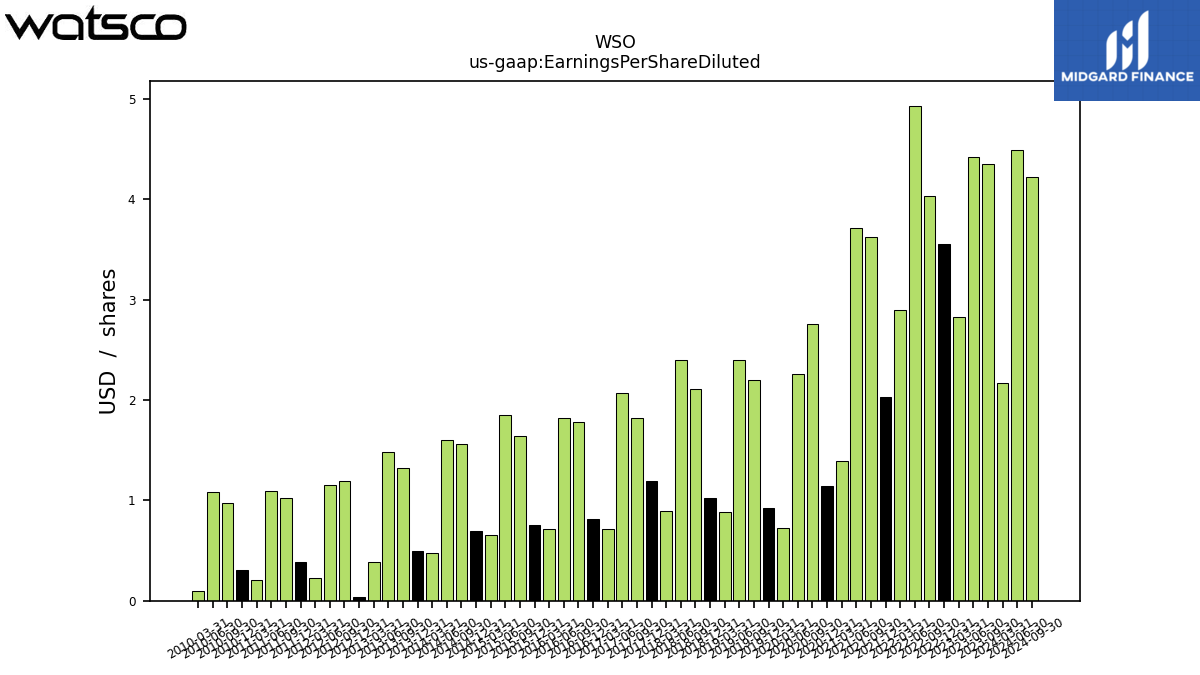
| Earnings Per Share Basic | 2.17 | 2.08 | 4.36 | 4.43 | 2.84 | 3.56 | 4.04 | 4.94 | 2.91 | 2.03 | 3.64 | 3.73 | 1.39 | 1.14 | 2.77 | 2.26 | 0.72 | 0.92 | 2.20 | 2.40 | 0.88 | 1.02 | 2.12 | 2.41 | 0.89 | 1.19 | 1.82 | 2.07 | 0.71 | 0.81 | 1.78 | 1.82 | 0.71 | 0.75 | 1.64 | 1.86 | 0.65 | 0.69 | 1.56 | 1.60 | 0.48 | 0.50 | 1.32 | 1.48 | 0.39 | 0.04 | 1.19 | 1.15 | 0.23 | 0.39 | 1.02 | 1.09 | 0.21 | 0.31 | 0.97 | 1.08 | 0.10 | |
| Earnings Per Share Diluted | 2.17 | 2.07 | 4.35 | 4.42 | 2.83 | 3.55 | 4.03 | 4.93 | 2.90 | 2.03 | 3.62 | 3.71 | 1.39 | 1.14 | 2.76 | 2.26 | 0.72 | 0.92 | 2.20 | 2.40 | 0.88 | 1.02 | 2.11 | 2.40 | 0.89 | 1.19 | 1.82 | 2.07 | 0.71 | 0.81 | 1.78 | 1.82 | 0.71 | 0.75 | 1.64 | 1.85 | 0.65 | 0.69 | 1.56 | 1.60 | 0.48 | 0.50 | 1.32 | 1.48 | 0.39 | 0.04 | 1.19 | 1.15 | 0.23 | 0.39 | 1.02 | 1.09 | 0.21 | 0.31 | 0.97 | 1.08 | 0.10 |
| 2024-03-31 | 2023-12-31 | 2023-09-30 | 2023-06-30 | 2023-03-31 | 2022-12-31 | 2022-09-30 | 2022-06-30 | 2022-03-31 | 2021-12-31 | 2021-09-30 | 2021-06-30 | 2021-03-31 | 2020-12-31 | 2020-09-30 | 2020-06-30 | 2020-03-31 | 2019-12-31 | 2019-09-30 | 2019-06-30 | 2019-03-31 | 2018-12-31 | 2018-09-30 | 2018-06-30 | 2018-03-31 | 2017-12-31 | 2017-09-30 | 2017-06-30 | 2017-03-31 | 2016-12-31 | 2016-09-30 | 2016-06-30 | 2016-03-31 | 2015-12-31 | 2015-09-30 | 2015-06-30 | 2015-03-31 | 2014-12-31 | 2014-09-30 | 2014-06-30 | 2014-03-31 | 2013-12-31 | 2013-09-30 | 2013-06-30 | 2013-03-31 | 2012-12-31 | 2012-09-30 | 2012-06-30 | 2012-03-31 | 2011-12-31 | 2011-09-30 | 2011-06-30 | 2011-03-31 | 2010-12-31 | 2010-09-30 | 2010-06-30 | 2010-03-31 | ||
|---|---|---|---|---|---|---|---|---|---|---|---|---|---|---|---|---|---|---|---|---|---|---|---|---|---|---|---|---|---|---|---|---|---|---|---|---|---|---|---|---|---|---|---|---|---|---|---|---|---|---|---|---|---|---|---|---|---|---|
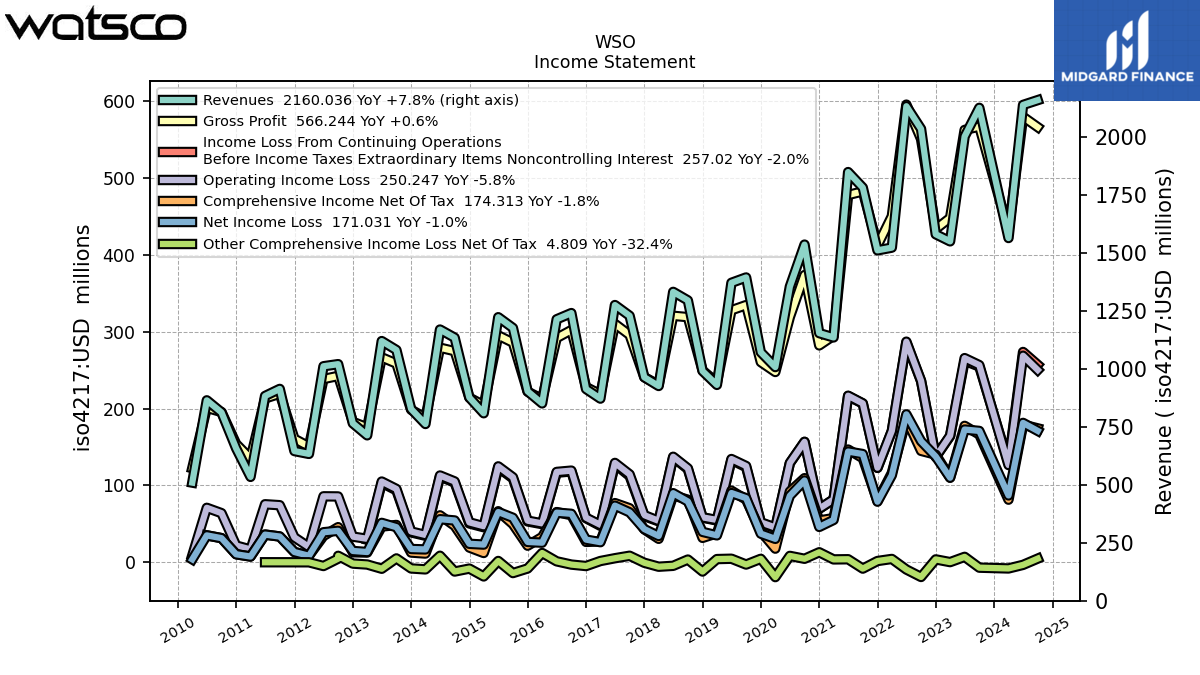
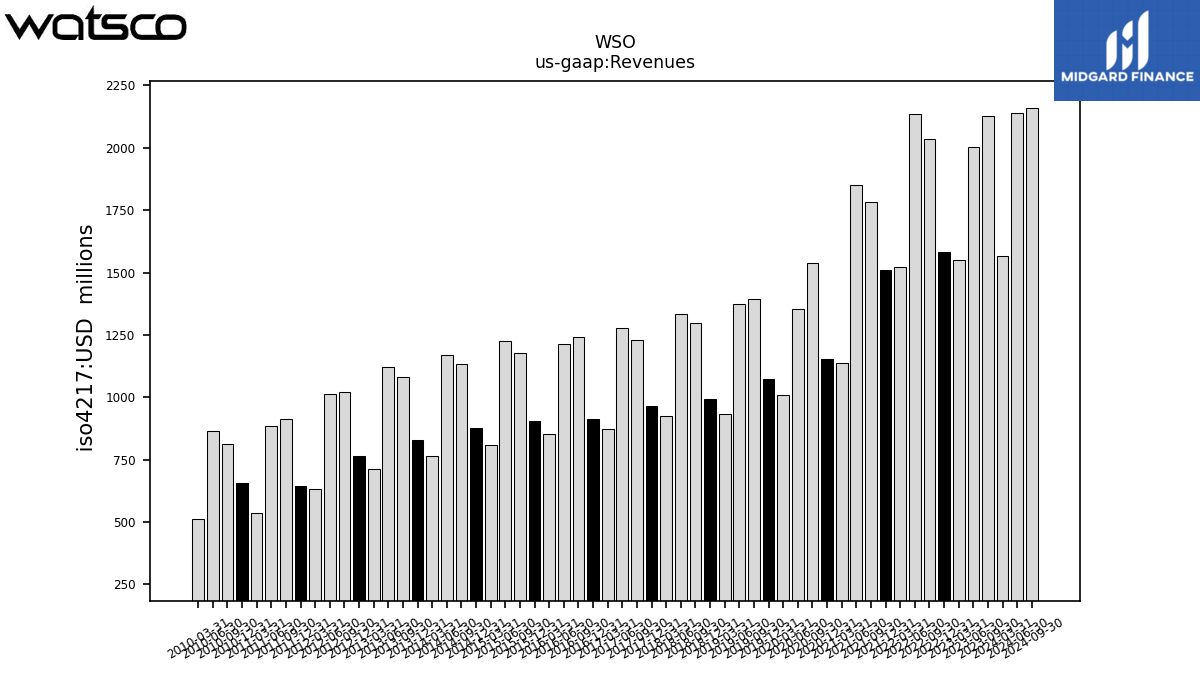
| Revenues | 1564.99 | 1603.20 | 2126.84 | 2003.08 | 1550.64 | 1581.22 | 2035.80 | 2133.76 | 1523.57 | 1511.87 | 1782.57 | 1849.64 | 1136.12 | 1154.72 | 1536.67 | 1355.38 | 1008.16 | 1072.32 | 1394.91 | 1371.85 | 931.28 | 991.33 | 1296.01 | 1332.74 | 926.58 | 964.35 | 1229.59 | 1275.92 | 872.10 | 913.61 | 1241.23 | 1214.43 | 851.42 | 903.82 | 1177.01 | 1223.44 | 808.97 | 876.79 | 1135.00 | 1170.19 | 762.57 | 827.35 | 1081.89 | 1120.45 | 713.63 | 765.54 | 1020.86 | 1011.80 | 633.51 | 645.83 | 914.04 | 883.55 | 534.34 | 657.25 | 812.79 | 864.80 | 509.75 | |
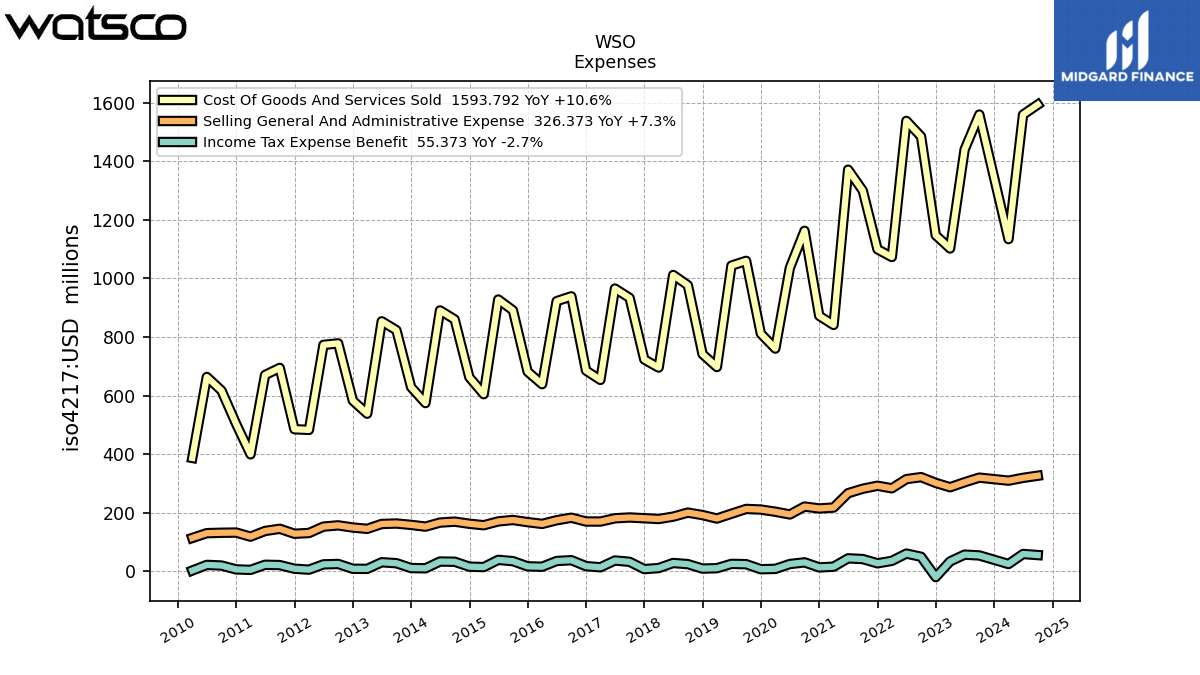
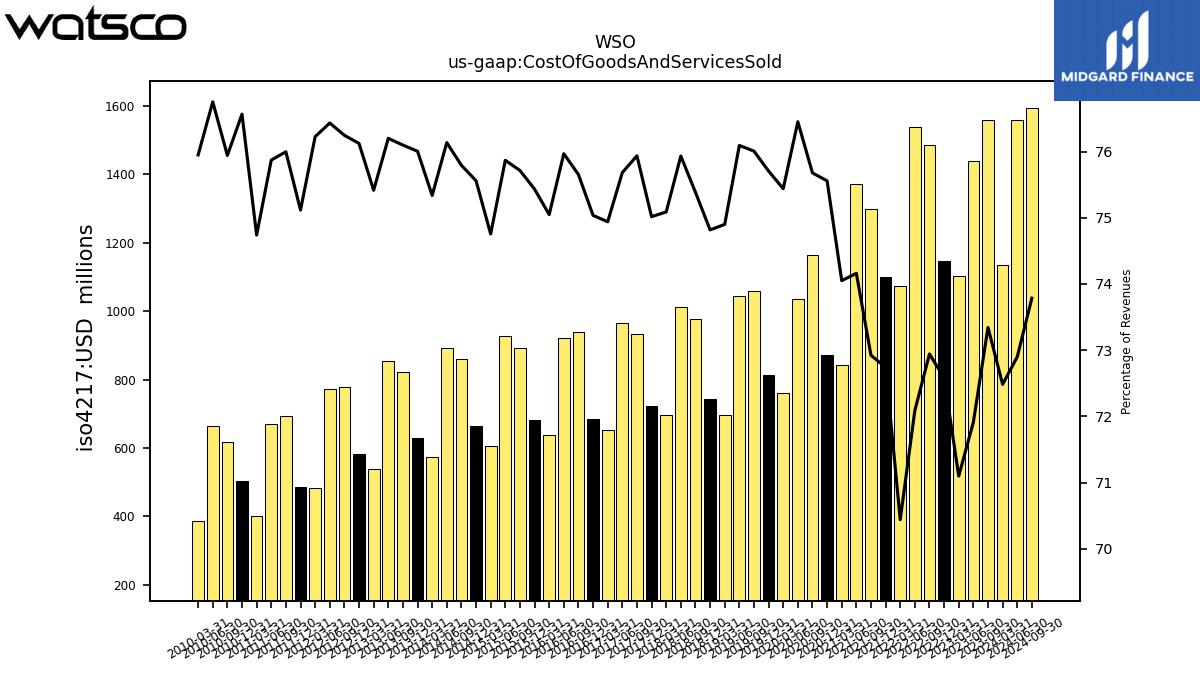
| Cost Of Goods And Services Sold | 1134.37 | 1188.78 | 1559.90 | 1440.46 | 1102.48 | 1147.67 | 1484.95 | 1538.22 | 1073.21 | 1099.75 | 1299.90 | 1371.70 | 841.30 | 872.47 | 1162.91 | 1036.19 | 760.54 | 811.79 | 1060.22 | 1043.87 | 697.52 | 741.68 | 977.00 | 1011.98 | 695.74 | 723.41 | 933.70 | 965.65 | 653.54 | 685.54 | 939.03 | 922.57 | 638.98 | 681.77 | 891.17 | 928.19 | 604.75 | 662.49 | 860.23 | 890.91 | 574.50 | 628.82 | 823.30 | 853.77 | 538.19 | 582.75 | 778.35 | 773.33 | 482.89 | 485.12 | 694.63 | 670.36 | 399.35 | 503.22 | 617.25 | 663.74 | 387.15 | |
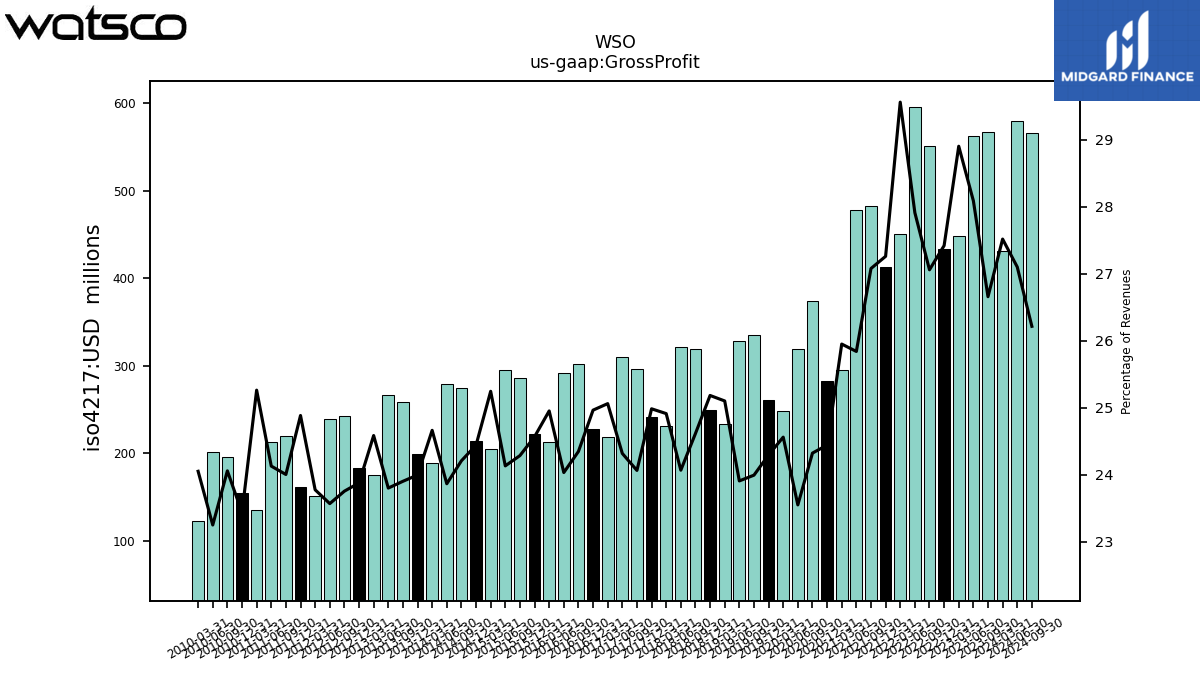
| Gross Profit | 430.62 | 414.42 | 566.95 | 562.62 | 448.16 | 433.55 | 550.85 | 595.53 | 450.36 | 412.12 | 482.66 | 477.94 | 294.82 | 282.24 | 373.76 | 319.20 | 247.62 | 260.52 | 334.69 | 327.98 | 233.76 | 249.64 | 319.01 | 320.77 | 230.83 | 240.93 | 295.89 | 310.28 | 218.56 | 228.07 | 302.20 | 291.86 | 212.45 | 222.04 | 285.85 | 295.25 | 204.22 | 214.29 | 274.76 | 279.27 | 188.07 | 198.53 | 258.60 | 266.68 | 175.45 | 182.79 | 242.50 | 238.47 | 150.62 | 160.71 | 219.41 | 213.19 | 134.99 | 154.03 | 195.54 | 201.07 | 122.60 | |
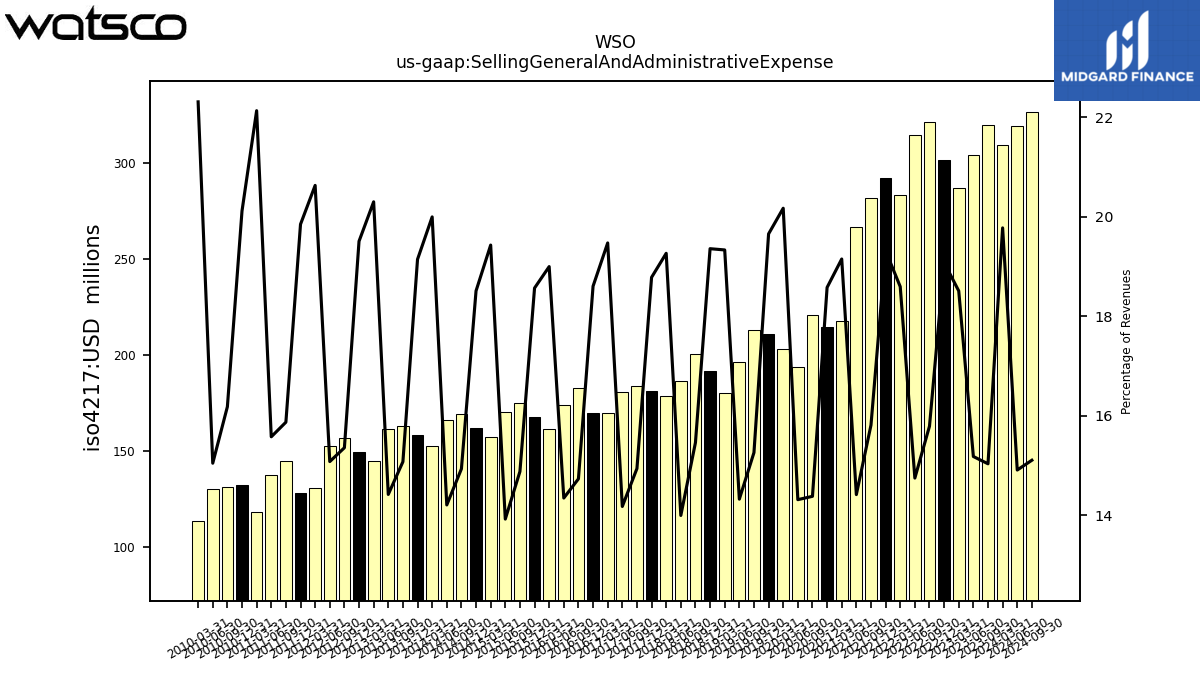
| Selling General And Administrative Expense | 309.55 | 312.46 | 319.83 | 304.15 | 287.06 | 301.75 | 321.52 | 314.75 | 283.35 | 292.08 | 281.92 | 266.70 | 217.61 | 214.57 | 221.04 | 194.05 | 203.39 | 210.81 | 212.90 | 196.55 | 180.07 | 191.93 | 200.41 | 186.58 | 178.53 | 181.16 | 183.73 | 180.93 | 169.86 | 170.00 | 182.90 | 174.27 | 161.78 | 167.84 | 175.17 | 170.39 | 157.22 | 162.32 | 169.53 | 166.29 | 152.52 | 158.41 | 163.14 | 161.59 | 144.89 | 149.36 | 156.81 | 152.60 | 130.71 | 128.21 | 145.10 | 137.66 | 118.28 | 132.23 | 131.55 | 130.15 | 113.74 | |
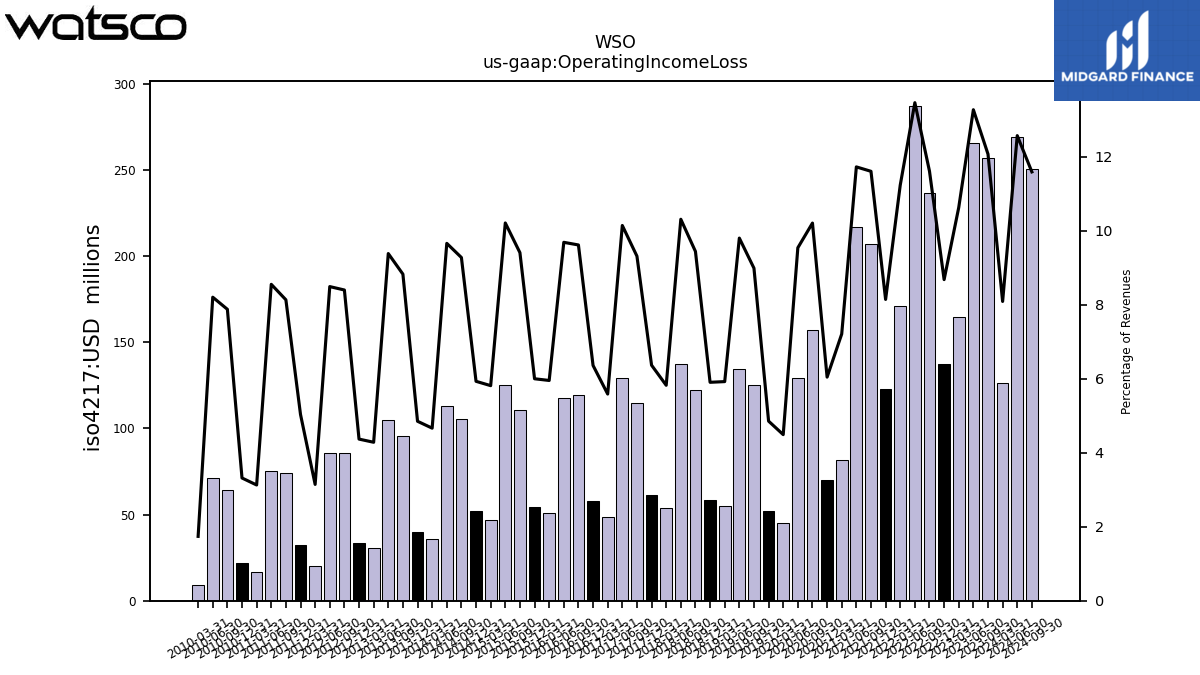
| Operating Income Loss | 126.54 | 107.75 | 256.62 | 265.70 | 164.74 | 137.18 | 236.25 | 287.10 | 171.05 | 123.07 | 206.80 | 216.78 | 81.88 | 69.76 | 156.78 | 129.25 | 45.24 | 52.03 | 125.32 | 134.40 | 55.13 | 58.50 | 122.30 | 137.35 | 53.94 | 61.37 | 114.46 | 129.35 | 48.70 | 58.07 | 119.30 | 117.59 | 50.67 | 54.20 | 110.68 | 124.86 | 47.01 | 51.98 | 105.24 | 112.98 | 35.55 | 40.12 | 95.45 | 105.08 | 30.55 | 33.43 | 85.70 | 85.87 | 19.91 | 32.50 | 74.31 | 75.53 | 16.71 | 21.80 | 63.99 | 70.92 | 8.87 | |
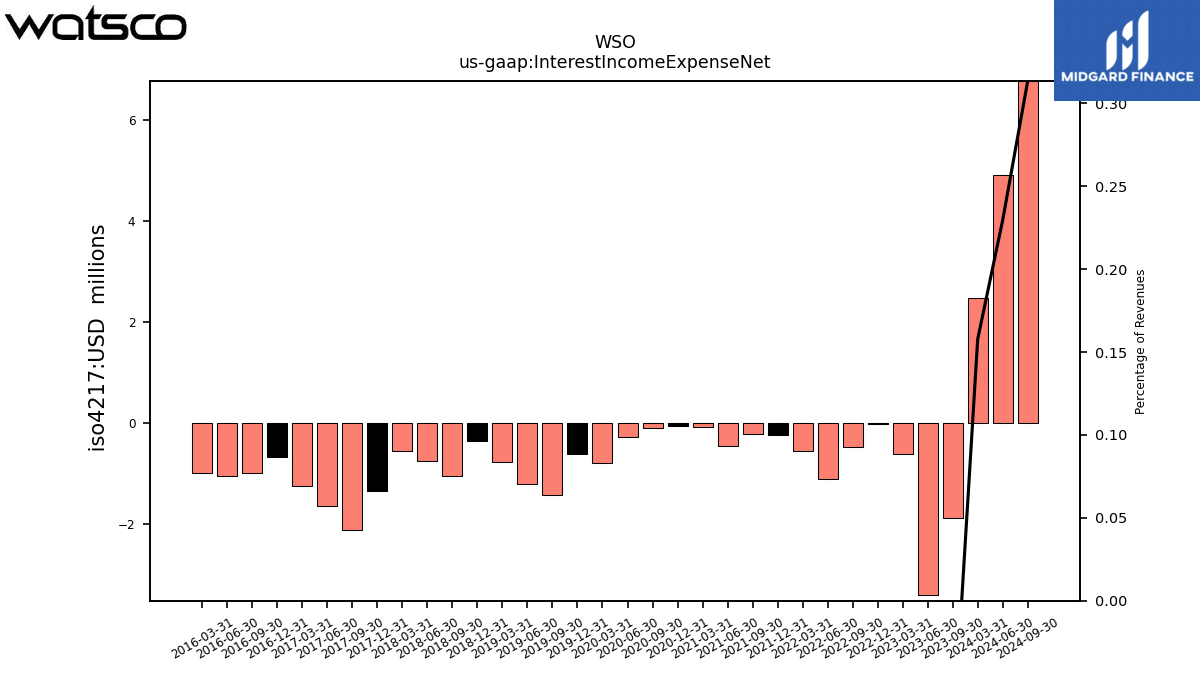
| Interest Income Expense Net | 2.47 | 1.00 | -1.89 | -3.42 | -0.61 | -0.01 | -0.48 | -1.11 | -0.56 | -0.24 | -0.22 | -0.45 | -0.09 | -0.06 | -0.11 | -0.28 | -0.79 | -0.61 | -1.43 | -1.21 | -0.78 | -0.36 | -1.05 | -0.76 | -0.56 | -1.34 | -2.12 | -1.65 | -1.25 | -0.68 | -1.00 | -1.05 | -0.99 | NA | NA | NA | NA | NA | NA | NA | NA | NA | NA | NA | NA | NA | NA | NA | NA | NA | NA | NA | NA | NA | NA | NA | NA | |
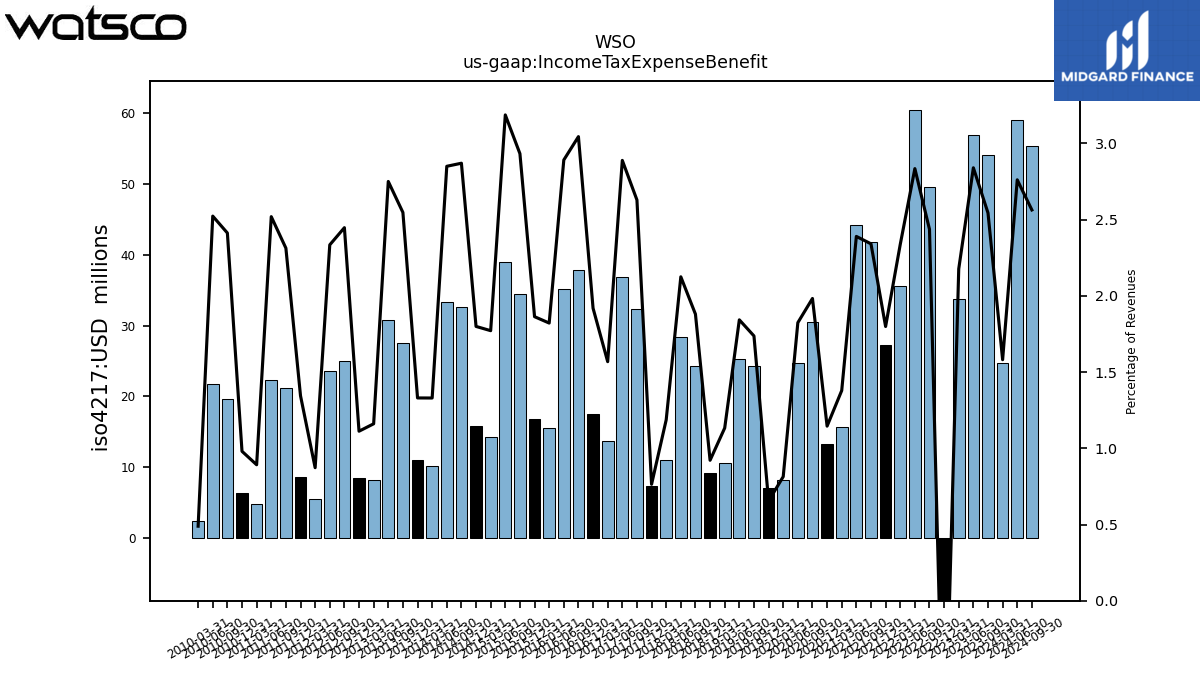
| Income Tax Expense Benefit | 24.75 | 11.01 | 54.10 | 56.89 | 33.75 | -19.96 | 49.60 | 60.48 | 35.60 | 27.20 | 41.73 | 44.20 | 15.66 | 13.23 | 30.47 | 24.72 | 8.21 | 7.02 | 24.23 | 25.28 | 10.55 | 9.13 | 24.36 | 28.32 | 10.99 | 7.37 | 32.33 | 36.85 | 13.68 | 17.53 | 37.79 | 35.11 | 15.51 | 16.84 | 34.52 | 38.99 | 14.33 | 15.78 | 32.57 | 33.35 | 10.14 | 11.01 | 27.56 | 30.82 | 8.28 | 8.51 | 24.98 | 23.62 | 5.53 | 8.68 | 21.14 | 22.26 | 4.77 | 6.44 | 19.61 | 21.82 | 2.49 | |
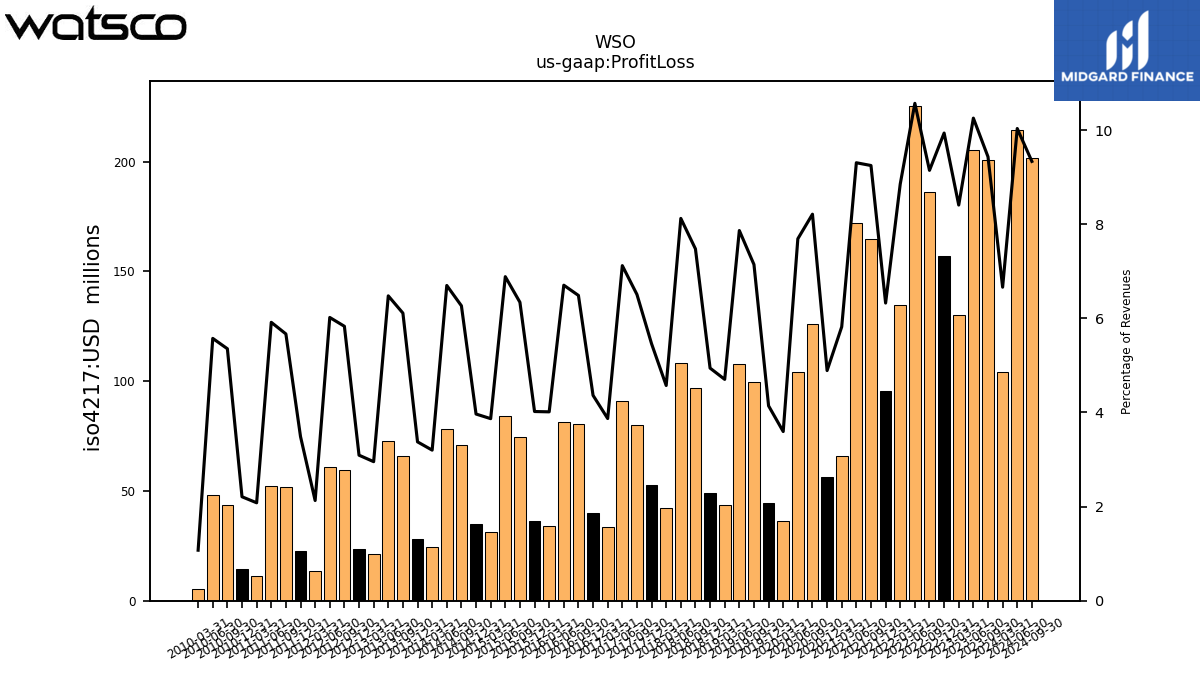
| Profit Loss | 104.26 | 97.74 | 200.62 | 205.40 | 130.37 | 157.13 | 186.17 | 225.51 | 134.89 | 95.63 | 164.84 | 172.13 | 66.13 | 56.48 | 126.21 | 104.24 | 36.25 | 44.41 | 99.66 | 107.91 | 43.80 | 49.00 | 96.89 | 108.26 | 42.38 | 52.66 | 80.02 | 90.85 | 33.77 | 39.87 | 80.52 | 81.42 | 34.17 | 36.34 | 74.64 | 84.24 | 31.30 | 34.78 | 71.13 | 78.39 | 24.40 | 27.93 | 66.12 | 72.58 | 21.09 | 23.68 | 59.53 | 60.90 | 13.49 | 22.53 | 51.82 | 52.27 | 11.12 | 14.52 | 43.52 | 48.21 | 5.47 | |
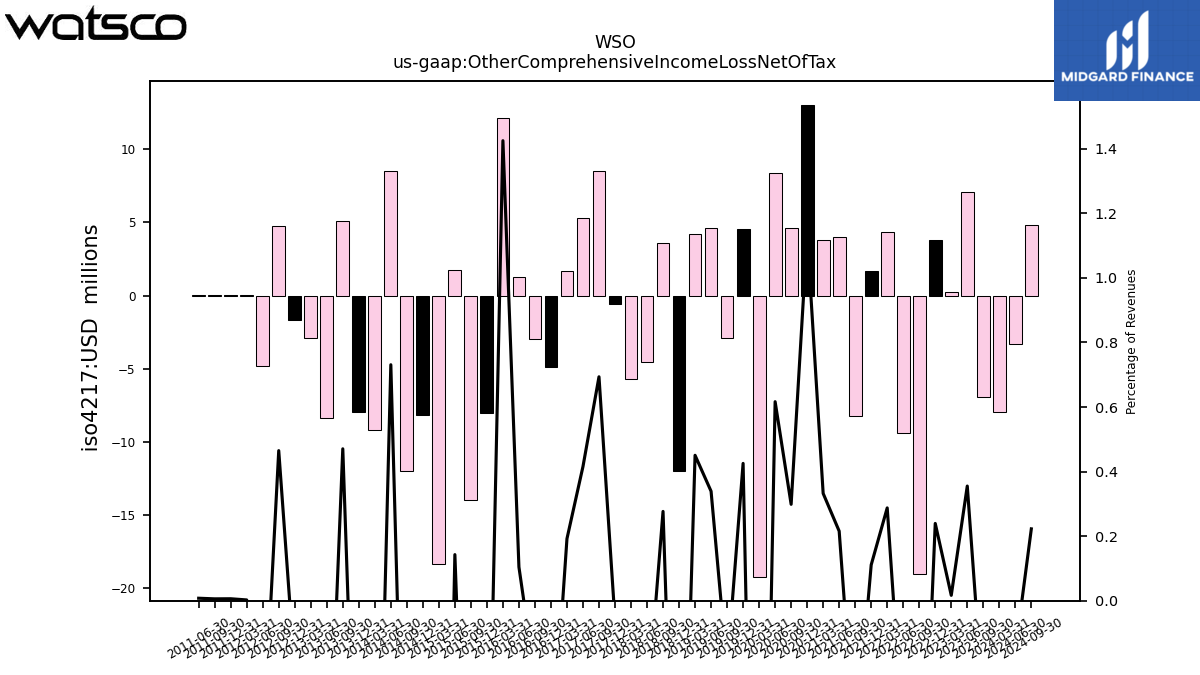
| Other Comprehensive Income Loss Net Of Tax | -8.00 | 7.50 | -6.97 | 7.12 | 0.26 | 3.79 | -19.09 | -9.38 | 4.38 | 1.68 | -8.22 | 3.99 | 3.78 | 13.07 | 4.59 | 8.36 | -19.28 | 4.56 | -2.92 | 4.65 | 4.20 | -12.02 | 3.58 | -4.56 | -5.74 | -0.59 | 8.53 | 5.30 | 1.68 | -4.86 | -2.96 | 1.27 | 12.13 | -8.02 | -14.01 | 1.75 | -18.38 | -8.18 | -12.00 | 8.55 | -9.21 | -7.99 | 5.09 | -8.39 | -2.88 | -1.67 | 4.75 | -4.84 | 0.02 | 0.04 | 0.05 | 0.07 | NA | NA | NA | NA | NA | |
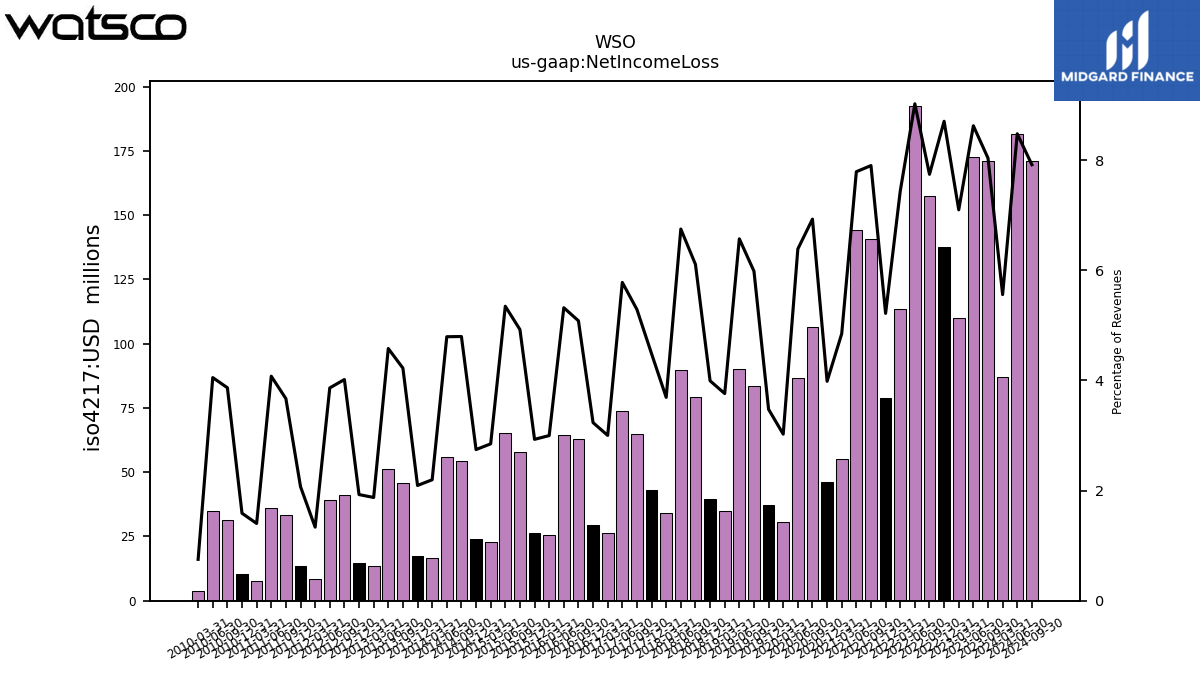
| Net Income Loss | 87.00 | 82.55 | 170.95 | 172.76 | 110.07 | 137.67 | 157.64 | 192.56 | 113.30 | 78.89 | 140.87 | 144.10 | 55.09 | 46.01 | 106.49 | 86.58 | 30.50 | 37.28 | 83.48 | 90.16 | 35.04 | 39.59 | 79.16 | 89.96 | 34.22 | 43.26 | 65.03 | 73.76 | 26.18 | 29.55 | 63.10 | 64.62 | 25.54 | 26.49 | 57.97 | 65.42 | 23.05 | 24.07 | 54.46 | 56.10 | 16.75 | 17.32 | 45.70 | 51.32 | 13.38 | 14.76 | 41.01 | 39.10 | 8.47 | 13.38 | 33.55 | 36.02 | 7.50 | 10.45 | 31.44 | 35.05 | 3.83 | |
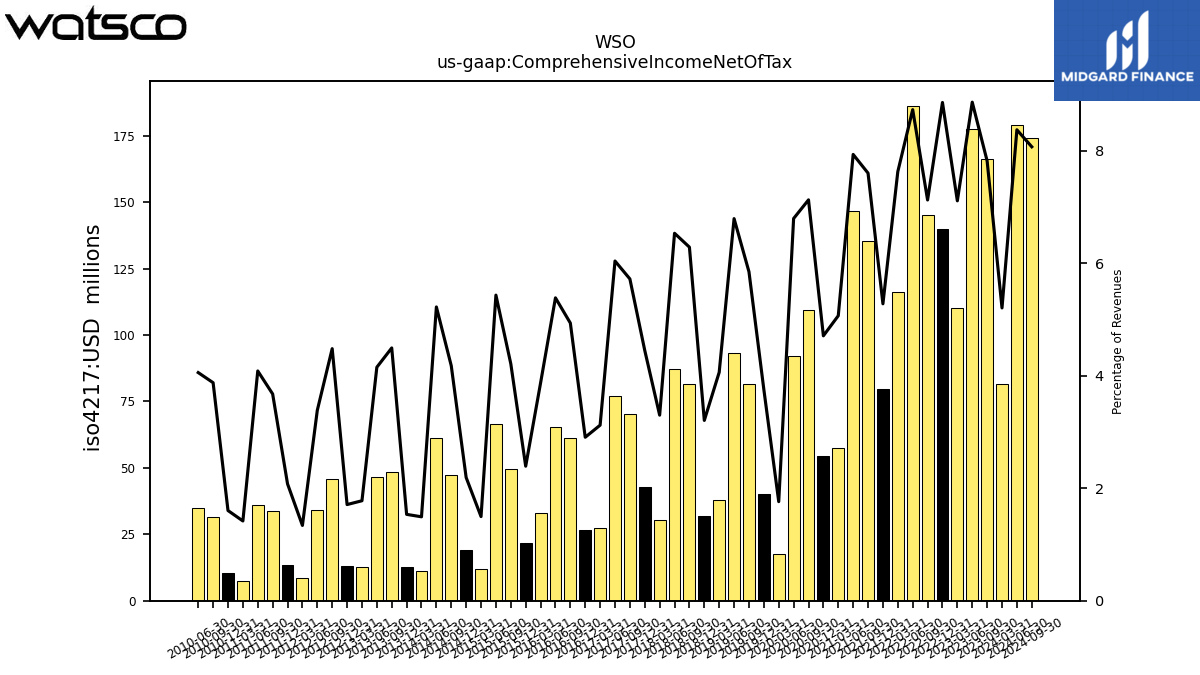
| Comprehensive Income Net Of Tax | 81.47 | 87.62 | 166.31 | 177.54 | 110.24 | 140.07 | 145.04 | 186.29 | 116.23 | 79.81 | 135.51 | 146.75 | 57.57 | 54.39 | 109.51 | 92.10 | 17.76 | 40.27 | 81.59 | 93.19 | 37.82 | 31.78 | 81.47 | 87.07 | 30.57 | 42.91 | 70.35 | 77.06 | 27.22 | 26.55 | 61.27 | 65.39 | 32.97 | 21.62 | 49.58 | 66.47 | 12.11 | 19.21 | 47.41 | 61.12 | 11.38 | 12.71 | 48.62 | 46.52 | 12.69 | 13.09 | 45.75 | 34.26 | 8.48 | 13.42 | 33.60 | 36.09 | 7.58 | 10.54 | 31.51 | 35.08 | NA |
| 2024-03-31 | 2023-12-31 | 2023-09-30 | 2023-06-30 | 2023-03-31 | 2022-12-31 | 2022-09-30 | 2022-06-30 | 2022-03-31 | 2021-12-31 | 2021-09-30 | 2021-06-30 | 2021-03-31 | 2020-12-31 | 2020-09-30 | 2020-06-30 | 2020-03-31 | 2019-12-31 | 2019-09-30 | 2019-06-30 | 2019-03-31 | 2018-12-31 | 2018-09-30 | 2018-06-30 | 2018-03-31 | 2017-12-31 | 2017-09-30 | 2017-06-30 | 2017-03-31 | 2016-12-31 | 2016-09-30 | 2016-06-30 | 2016-03-31 | 2015-12-31 | 2015-09-30 | 2015-06-30 | 2015-03-31 | 2014-12-31 | 2014-09-30 | 2014-06-30 | 2014-03-31 | 2013-12-31 | 2013-09-30 | 2013-06-30 | 2013-03-31 | 2012-12-31 | 2012-09-30 | 2012-06-30 | 2012-03-31 | 2011-12-31 | 2011-09-30 | 2011-06-30 | 2011-03-31 | 2010-12-31 | 2010-09-30 | 2010-06-30 | 2010-03-31 | ||
|---|---|---|---|---|---|---|---|---|---|---|---|---|---|---|---|---|---|---|---|---|---|---|---|---|---|---|---|---|---|---|---|---|---|---|---|---|---|---|---|---|---|---|---|---|---|---|---|---|---|---|---|---|---|---|---|---|---|---|
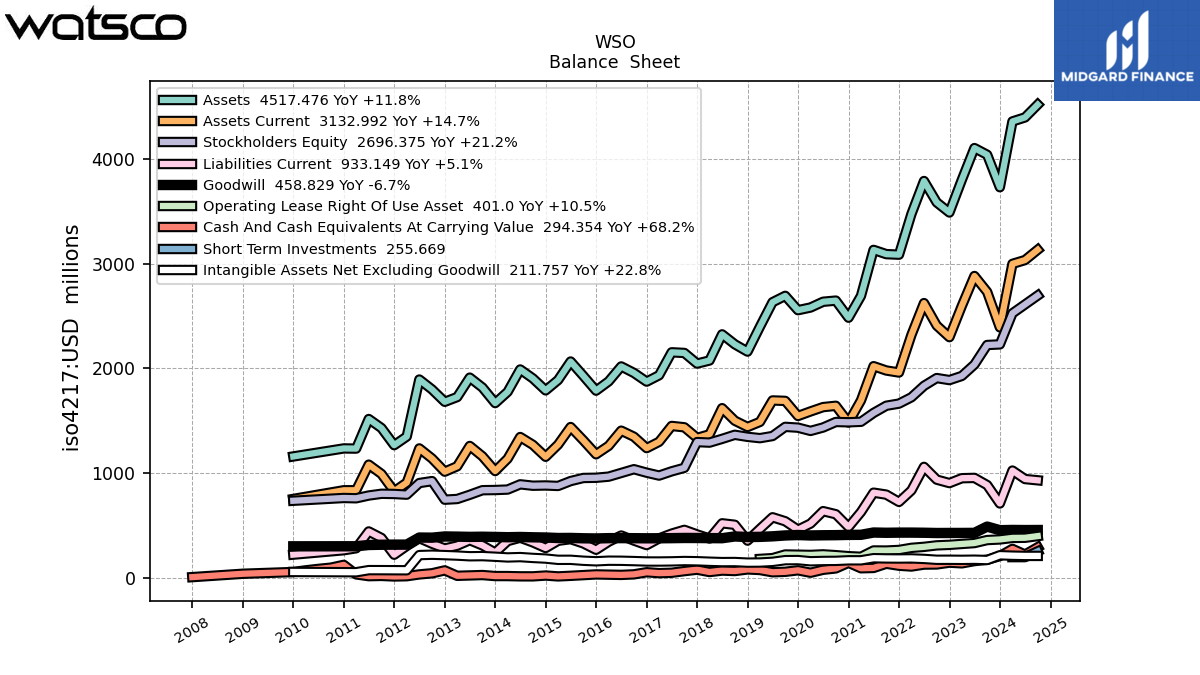
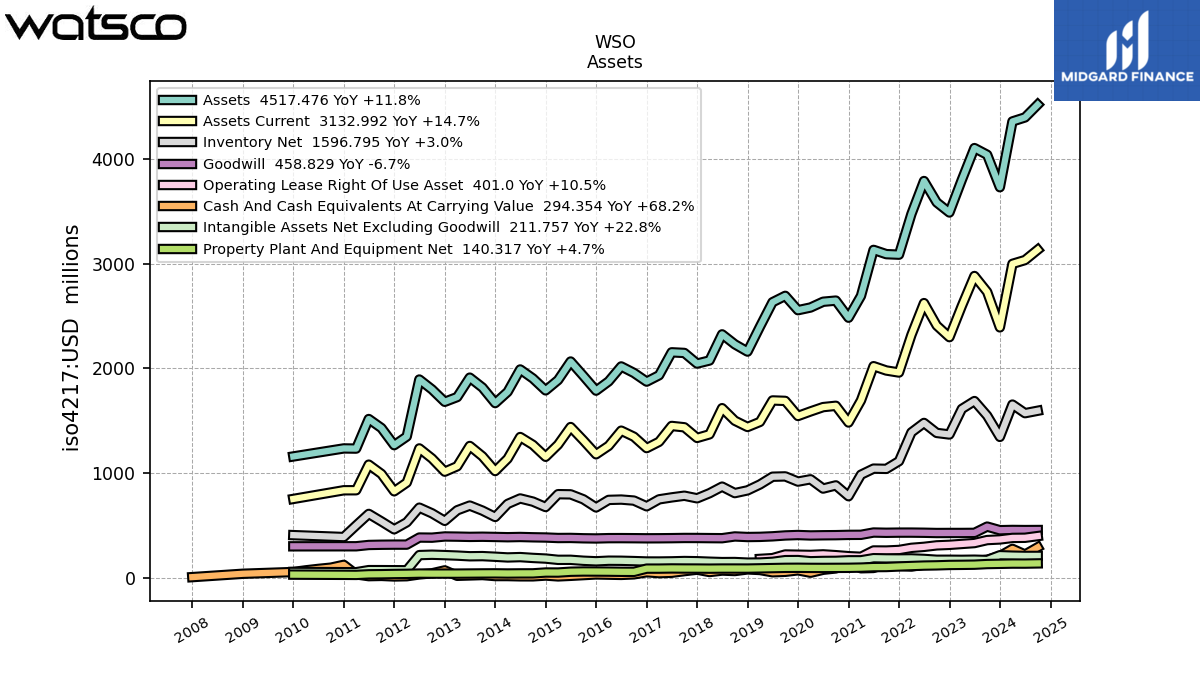
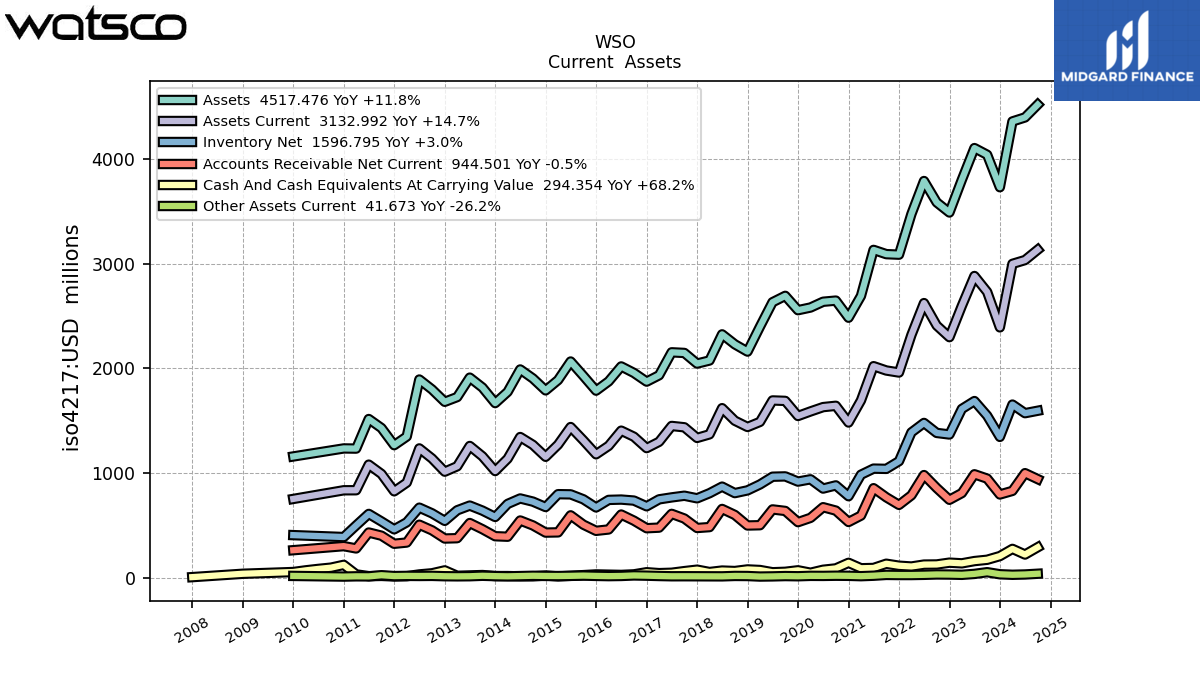
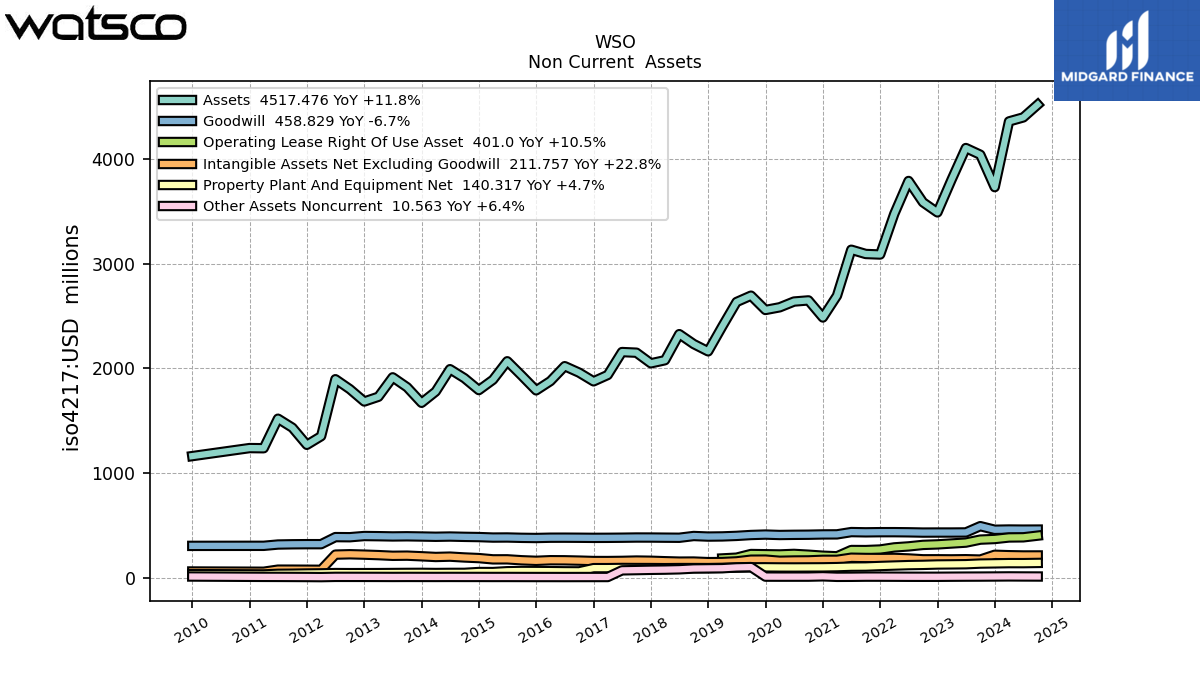
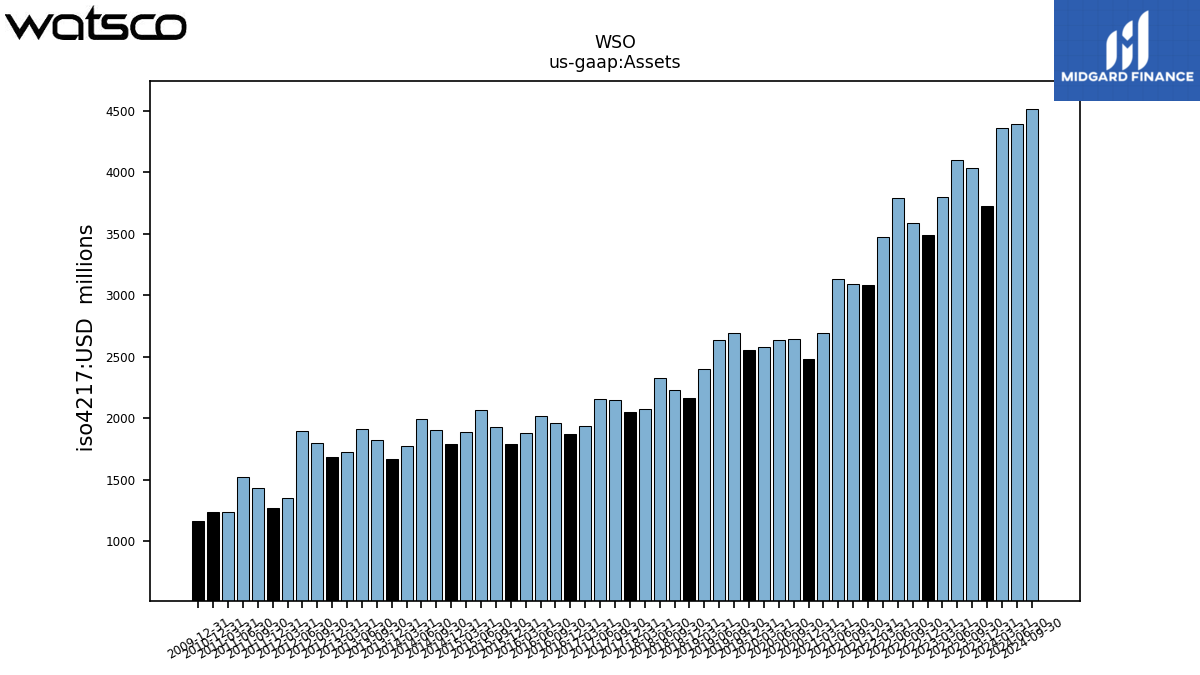
| Assets | 4357.12 | 3729.18 | 4039.07 | 4103.01 | 3800.61 | 3488.21 | 3584.59 | 3788.59 | 3473.89 | 3085.86 | 3090.92 | 3131.68 | 2692.26 | 2484.35 | 2647.68 | 2636.73 | 2581.83 | 2556.16 | 2693.06 | 2632.43 | 2398.94 | 2161.03 | 2230.75 | 2325.62 | 2076.28 | 2046.88 | 2148.22 | 2154.42 | 1935.28 | 1874.65 | 1957.60 | 2019.59 | 1876.89 | 1788.44 | 1929.46 | 2066.55 | 1889.51 | 1791.07 | 1904.99 | 1990.84 | 1776.86 | 1669.53 | 1818.03 | 1913.01 | 1727.28 | 1682.06 | 1799.82 | 1894.88 | 1350.61 | 1268.15 | 1431.75 | 1517.89 | 1235.67 | 1237.23 | NA | NA | NA | |
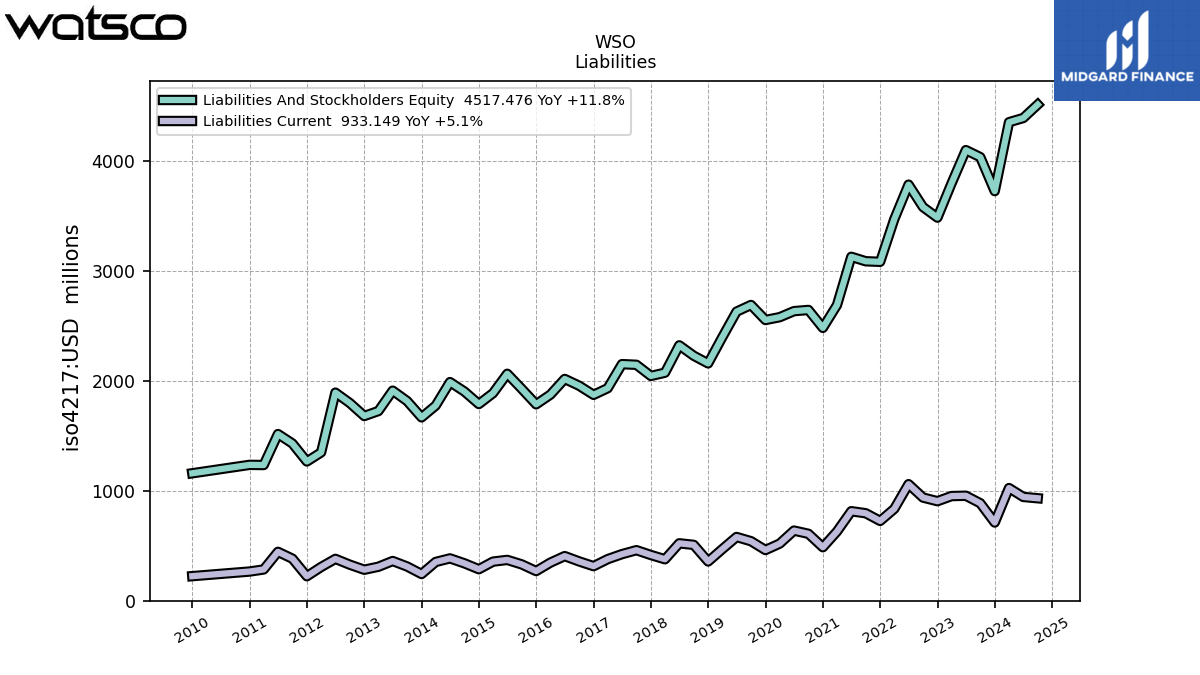
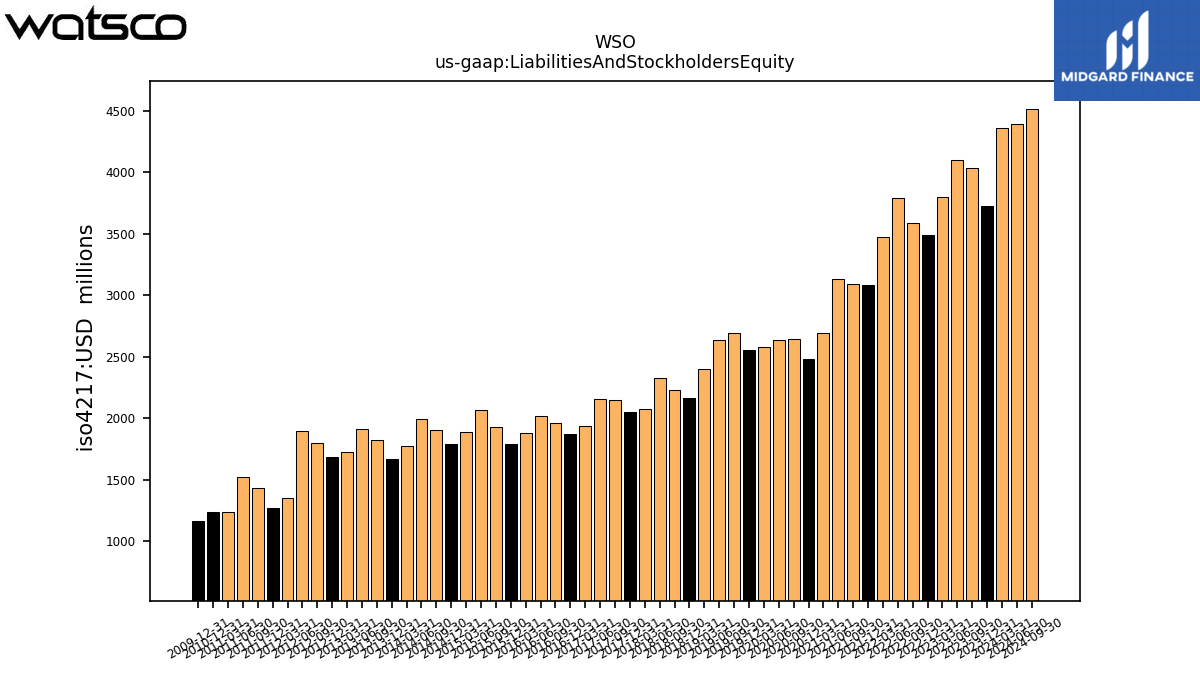
| Liabilities And Stockholders Equity | 4357.12 | 3729.18 | 4039.07 | 4103.01 | 3800.61 | 3488.21 | 3584.59 | 3788.59 | 3473.89 | 3085.86 | 3090.92 | 3131.68 | 2692.26 | 2484.35 | 2647.68 | 2636.73 | 2581.83 | 2556.16 | 2693.06 | 2632.43 | 2398.94 | 2161.03 | 2230.75 | 2325.62 | 2076.28 | 2046.88 | 2148.22 | 2154.42 | 1935.28 | 1874.65 | 1957.60 | 2019.59 | 1876.89 | 1788.44 | 1929.46 | 2066.55 | 1889.51 | 1791.07 | 1904.99 | 1990.84 | 1776.86 | 1669.53 | 1818.03 | 1913.01 | 1727.28 | 1682.06 | 1799.82 | 1894.88 | 1350.61 | 1268.15 | 1431.75 | 1517.89 | 1235.67 | 1237.23 | NA | NA | NA | |
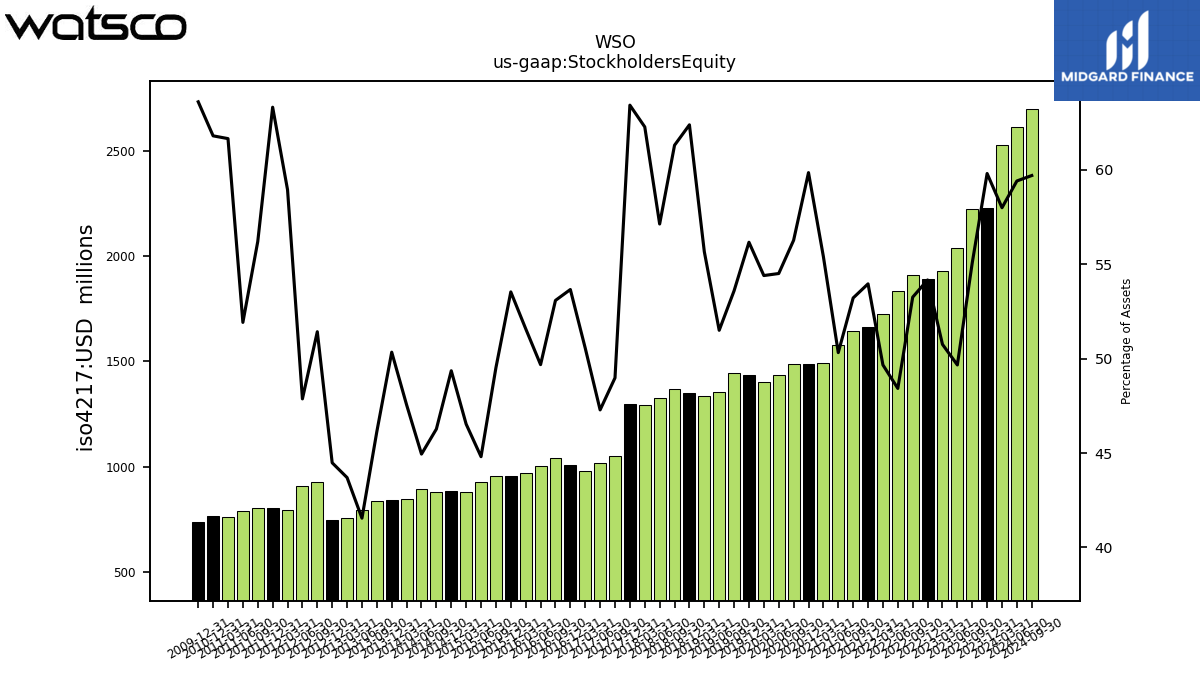
| Stockholders Equity | 2526.43 | 2229.84 | 2224.01 | 2037.65 | 1928.87 | 1889.24 | 1908.78 | 1834.44 | 1725.21 | 1664.95 | 1644.58 | 1575.70 | 1491.41 | 1486.68 | 1489.61 | 1437.04 | 1404.34 | 1435.43 | 1443.11 | 1355.60 | 1335.21 | 1347.85 | 1367.24 | 1328.45 | 1292.71 | 1297.95 | 1052.14 | 1018.66 | 978.34 | 1005.83 | 1039.02 | 1003.30 | 968.07 | 957.31 | 955.36 | 925.94 | 879.17 | 883.96 | 881.44 | 894.73 | 844.86 | 840.40 | 838.75 | 794.89 | 754.81 | 748.21 | 925.47 | 906.99 | 796.01 | 802.79 | 804.58 | 788.00 | 761.69 | 764.46 | NA | NA | NA |
| 2024-03-31 | 2023-12-31 | 2023-09-30 | 2023-06-30 | 2023-03-31 | 2022-12-31 | 2022-09-30 | 2022-06-30 | 2022-03-31 | 2021-12-31 | 2021-09-30 | 2021-06-30 | 2021-03-31 | 2020-12-31 | 2020-09-30 | 2020-06-30 | 2020-03-31 | 2019-12-31 | 2019-09-30 | 2019-06-30 | 2019-03-31 | 2018-12-31 | 2018-09-30 | 2018-06-30 | 2018-03-31 | 2017-12-31 | 2017-09-30 | 2017-06-30 | 2017-03-31 | 2016-12-31 | 2016-09-30 | 2016-06-30 | 2016-03-31 | 2015-12-31 | 2015-09-30 | 2015-06-30 | 2015-03-31 | 2014-12-31 | 2014-09-30 | 2014-06-30 | 2014-03-31 | 2013-12-31 | 2013-09-30 | 2013-06-30 | 2013-03-31 | 2012-12-31 | 2012-09-30 | 2012-06-30 | 2012-03-31 | 2011-12-31 | 2011-09-30 | 2011-06-30 | 2011-03-31 | 2010-12-31 | 2010-09-30 | 2010-06-30 | 2010-03-31 | ||
|---|---|---|---|---|---|---|---|---|---|---|---|---|---|---|---|---|---|---|---|---|---|---|---|---|---|---|---|---|---|---|---|---|---|---|---|---|---|---|---|---|---|---|---|---|---|---|---|---|---|---|---|---|---|---|---|---|---|---|
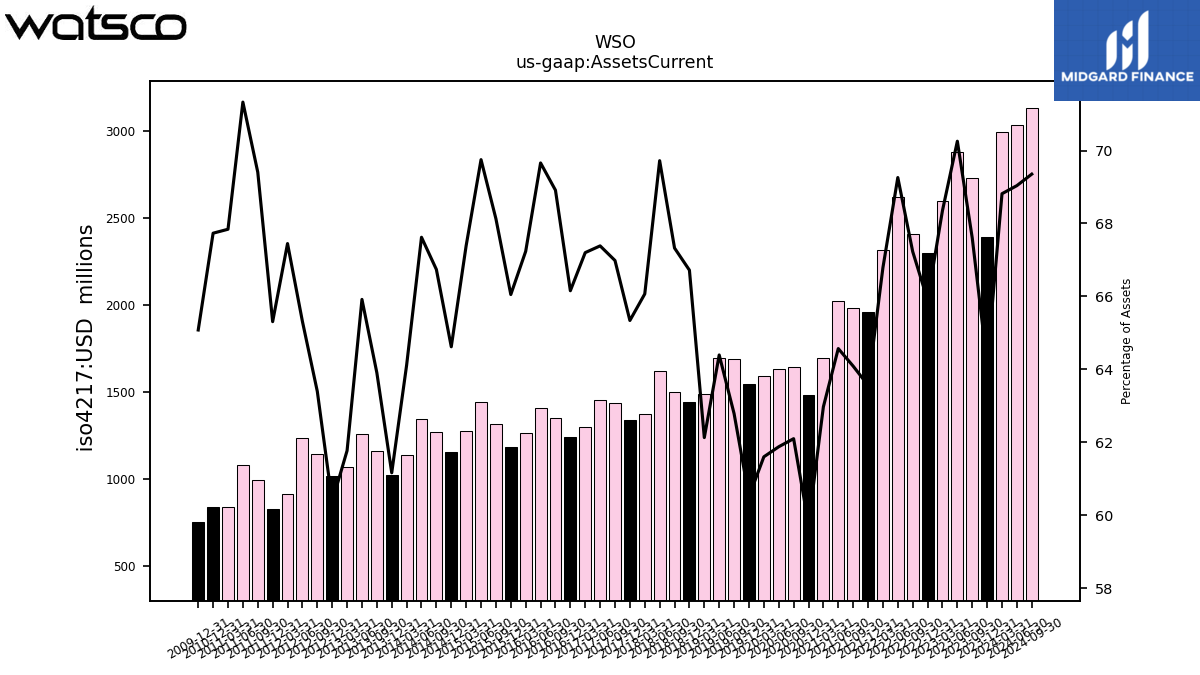
| Assets Current | 2998.37 | 2391.93 | 2730.57 | 2882.57 | 2597.82 | 2298.74 | 2409.88 | 2623.93 | 2320.13 | 1961.40 | 1980.86 | 2022.06 | 1695.36 | 1484.44 | 1644.12 | 1631.47 | 1590.38 | 1546.73 | 1690.83 | 1695.09 | 1490.38 | 1441.81 | 1501.85 | 1621.45 | 1371.72 | 1337.40 | 1438.94 | 1451.74 | 1300.50 | 1240.16 | 1349.01 | 1406.83 | 1261.92 | 1181.27 | 1314.49 | 1441.41 | 1273.34 | 1157.34 | 1271.34 | 1346.22 | 1139.17 | 1021.10 | 1161.82 | 1260.98 | 1066.90 | 1015.45 | 1140.97 | 1237.60 | 910.96 | 828.18 | 993.72 | 1082.68 | 838.29 | 838.00 | NA | NA | NA | |
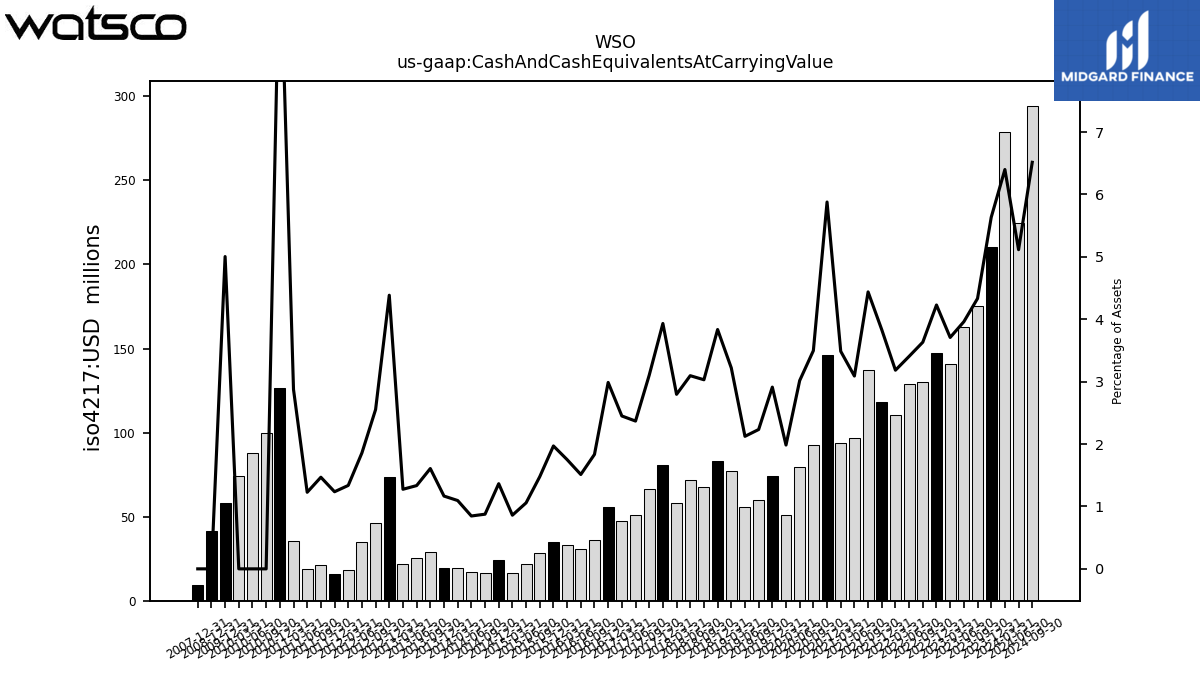
| Cash And Cash Equivalents At Carrying Value | 278.86 | 210.11 | 175.02 | 162.53 | 140.96 | 147.50 | 130.23 | 129.05 | 110.61 | 118.27 | 137.20 | 96.79 | 93.88 | 146.07 | 92.60 | 79.57 | 51.24 | 74.45 | 60.15 | 55.91 | 77.27 | 82.89 | 67.61 | 72.00 | 58.07 | 80.50 | 66.67 | 51.03 | 47.42 | 56.01 | 35.91 | 30.54 | 32.86 | 35.23 | 28.50 | 21.85 | 16.25 | 24.45 | 16.69 | 16.86 | 19.46 | 19.48 | 29.23 | 25.53 | 22.03 | 73.77 | 45.96 | 35.21 | 18.06 | 15.67 | 21.02 | 18.63 | 35.53 | 126.50 | 99.87 | 87.76 | 74.10 | |
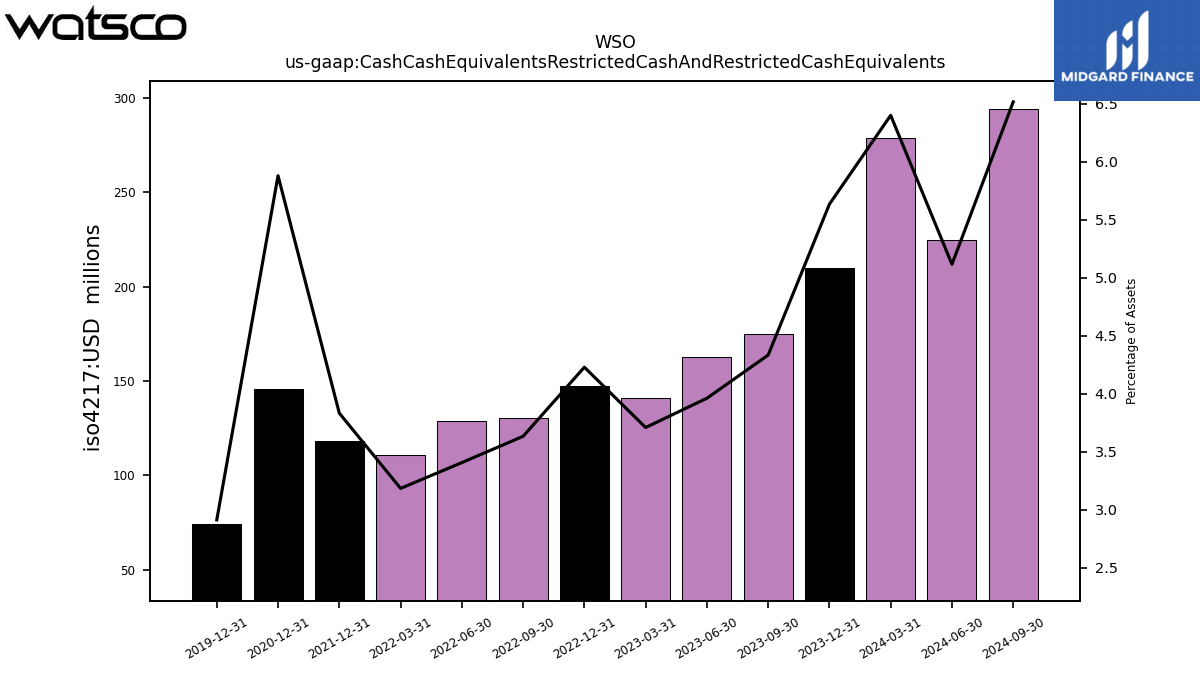
| Cash Cash Equivalents Restricted Cash And Restricted Cash Equivalents | 278.86 | 210.11 | 175.02 | 162.53 | 140.96 | 147.50 | 130.23 | 129.05 | 110.61 | 118.27 | NA | NA | NA | 146.07 | NA | NA | NA | 74.45 | NA | NA | NA | NA | NA | NA | NA | NA | NA | NA | NA | NA | NA | NA | NA | NA | NA | NA | NA | NA | NA | NA | NA | NA | NA | NA | NA | NA | NA | NA | NA | NA | NA | NA | NA | NA | NA | NA | NA | |
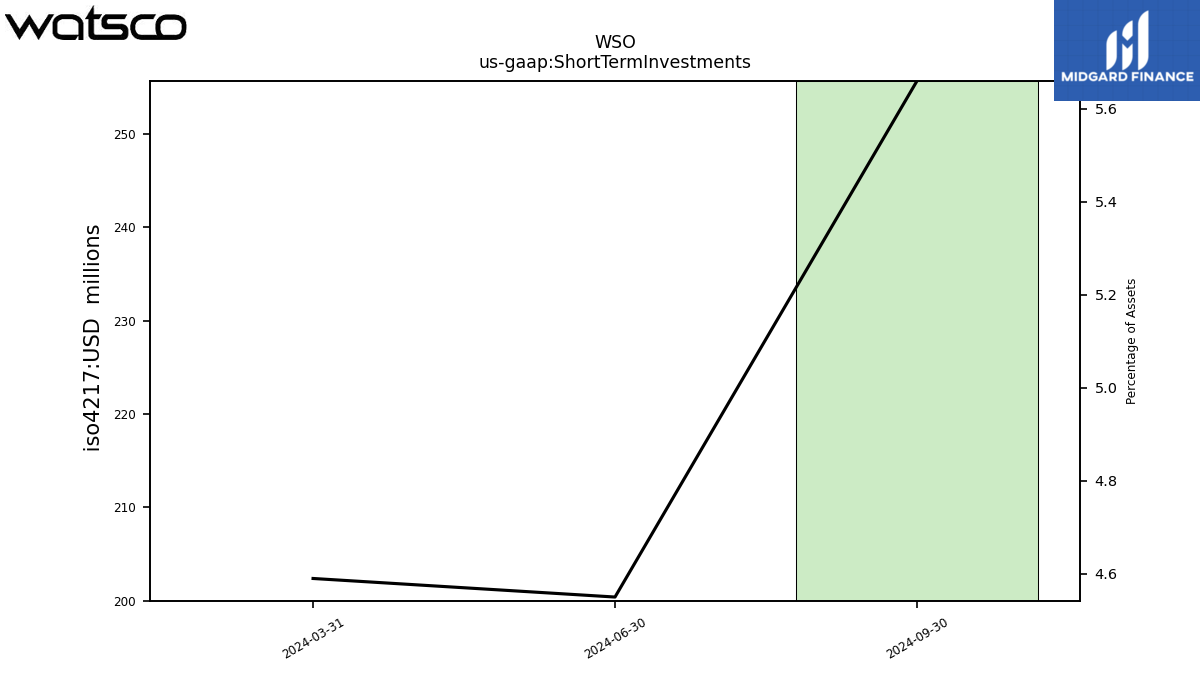
| Short Term Investments | 200.00 | NA | NA | NA | NA | NA | NA | NA | NA | NA | NA | NA | NA | NA | NA | NA | NA | NA | NA | NA | NA | NA | NA | NA | NA | NA | NA | NA | NA | NA | NA | NA | NA | NA | NA | NA | NA | NA | NA | NA | NA | NA | NA | NA | NA | NA | NA | NA | NA | NA | NA | NA | NA | NA | NA | NA | NA | |
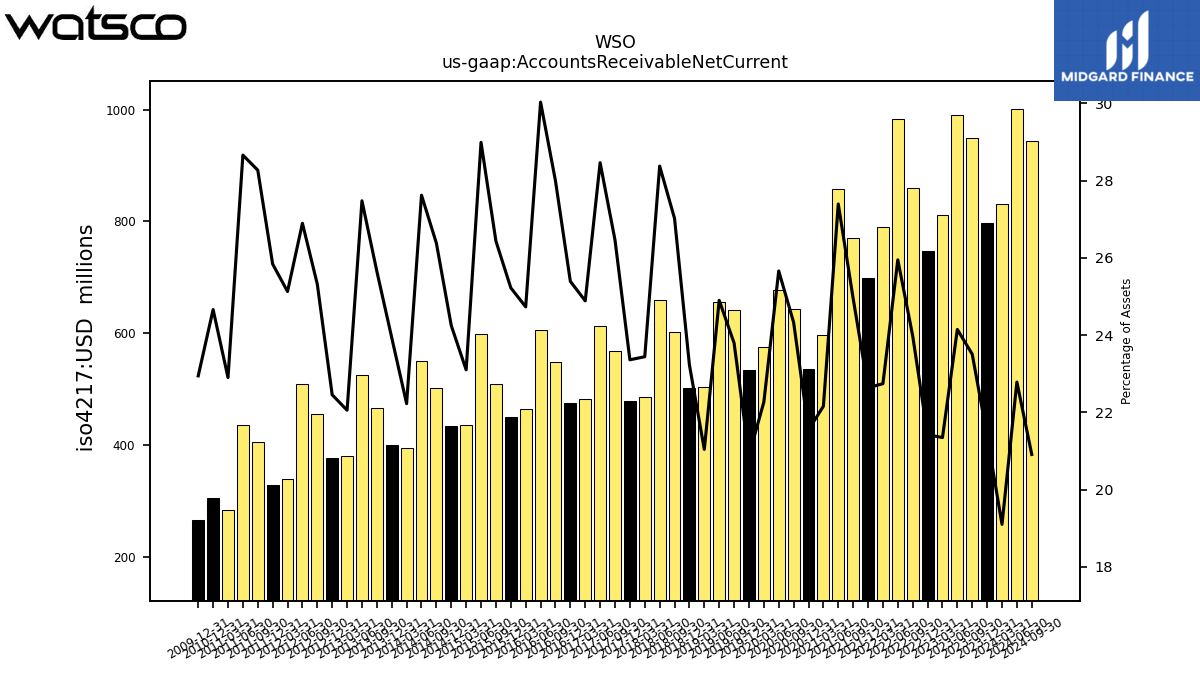
| Accounts Receivable Net Current | 832.12 | 797.83 | 949.32 | 990.66 | 811.26 | 747.11 | 859.58 | 983.03 | 790.01 | 698.46 | 771.04 | 857.86 | 596.51 | 535.29 | 644.12 | 676.57 | 574.83 | 533.81 | 640.80 | 655.42 | 504.72 | 501.91 | 602.75 | 659.89 | 486.65 | 478.13 | 568.46 | 613.19 | 481.60 | 475.97 | 548.00 | 606.51 | 464.15 | 451.08 | 510.00 | 599.07 | 436.46 | 434.23 | 502.52 | 549.90 | 394.87 | 399.56 | 466.34 | 525.61 | 380.92 | 377.65 | 455.67 | 509.61 | 339.38 | 327.66 | 404.75 | 435.02 | 282.96 | 305.09 | NA | NA | NA | |
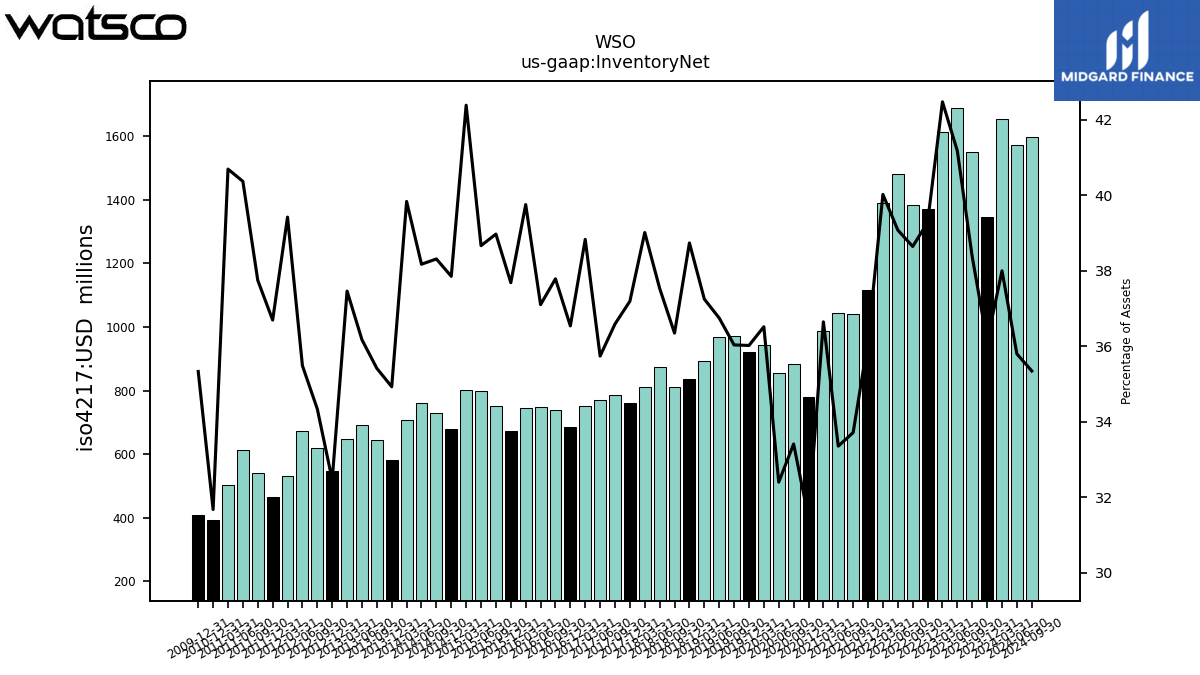
| Inventory Net | 1655.63 | 1347.29 | 1549.74 | 1689.31 | 1614.29 | 1370.17 | 1385.19 | 1480.52 | 1390.30 | 1115.47 | 1042.14 | 1044.61 | 986.65 | 781.30 | 884.65 | 854.37 | 942.82 | 920.79 | 970.48 | 967.39 | 893.64 | 837.13 | 810.87 | 872.90 | 810.02 | 761.31 | 786.06 | 770.01 | 751.50 | 685.01 | 739.72 | 749.33 | 746.12 | 673.97 | 751.94 | 799.04 | 800.86 | 677.99 | 729.87 | 759.97 | 707.84 | 583.15 | 643.87 | 692.01 | 647.08 | 546.08 | 618.08 | 672.43 | 532.43 | 465.35 | 540.46 | 612.74 | 502.83 | 391.93 | NA | NA | NA | |
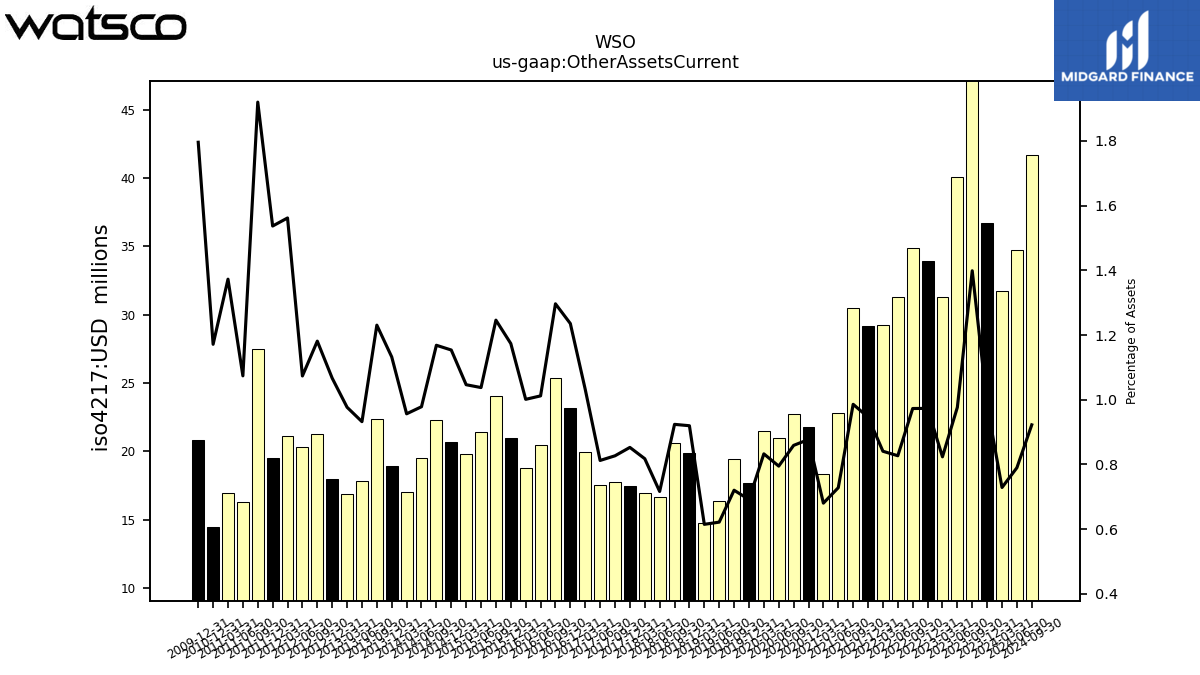
| Other Assets Current | 31.75 | 36.70 | 56.49 | 40.07 | 31.30 | 33.95 | 34.88 | 31.33 | 29.21 | 29.21 | 30.47 | 22.80 | 18.32 | 21.79 | 22.74 | 20.96 | 21.50 | 17.68 | 19.40 | 16.37 | 14.75 | 19.88 | 20.61 | 16.66 | 16.98 | 17.45 | 17.76 | 17.50 | 19.98 | 23.16 | 25.38 | 20.44 | 18.79 | 20.99 | 24.04 | 21.44 | 19.77 | 20.66 | 22.26 | 19.48 | 17.00 | 18.91 | 22.37 | 17.83 | 16.87 | 17.94 | 21.26 | 20.34 | 21.09 | 19.49 | 27.49 | 16.30 | 16.96 | 14.49 | NA | NA | NA |
| 2024-03-31 | 2023-12-31 | 2023-09-30 | 2023-06-30 | 2023-03-31 | 2022-12-31 | 2022-09-30 | 2022-06-30 | 2022-03-31 | 2021-12-31 | 2021-09-30 | 2021-06-30 | 2021-03-31 | 2020-12-31 | 2020-09-30 | 2020-06-30 | 2020-03-31 | 2019-12-31 | 2019-09-30 | 2019-06-30 | 2019-03-31 | 2018-12-31 | 2018-09-30 | 2018-06-30 | 2018-03-31 | 2017-12-31 | 2017-09-30 | 2017-06-30 | 2017-03-31 | 2016-12-31 | 2016-09-30 | 2016-06-30 | 2016-03-31 | 2015-12-31 | 2015-09-30 | 2015-06-30 | 2015-03-31 | 2014-12-31 | 2014-09-30 | 2014-06-30 | 2014-03-31 | 2013-12-31 | 2013-09-30 | 2013-06-30 | 2013-03-31 | 2012-12-31 | 2012-09-30 | 2012-06-30 | 2012-03-31 | 2011-12-31 | 2011-09-30 | 2011-06-30 | 2011-03-31 | 2010-12-31 | 2010-09-30 | 2010-06-30 | 2010-03-31 | ||
|---|---|---|---|---|---|---|---|---|---|---|---|---|---|---|---|---|---|---|---|---|---|---|---|---|---|---|---|---|---|---|---|---|---|---|---|---|---|---|---|---|---|---|---|---|---|---|---|---|---|---|---|---|---|---|---|---|---|---|
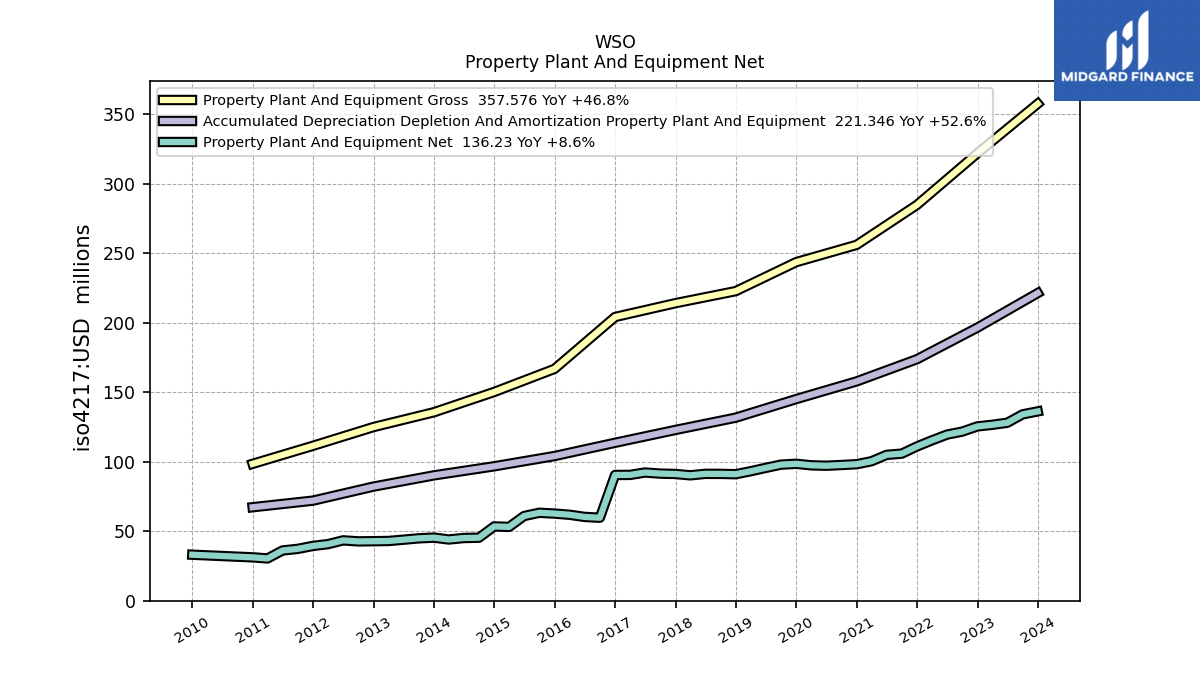
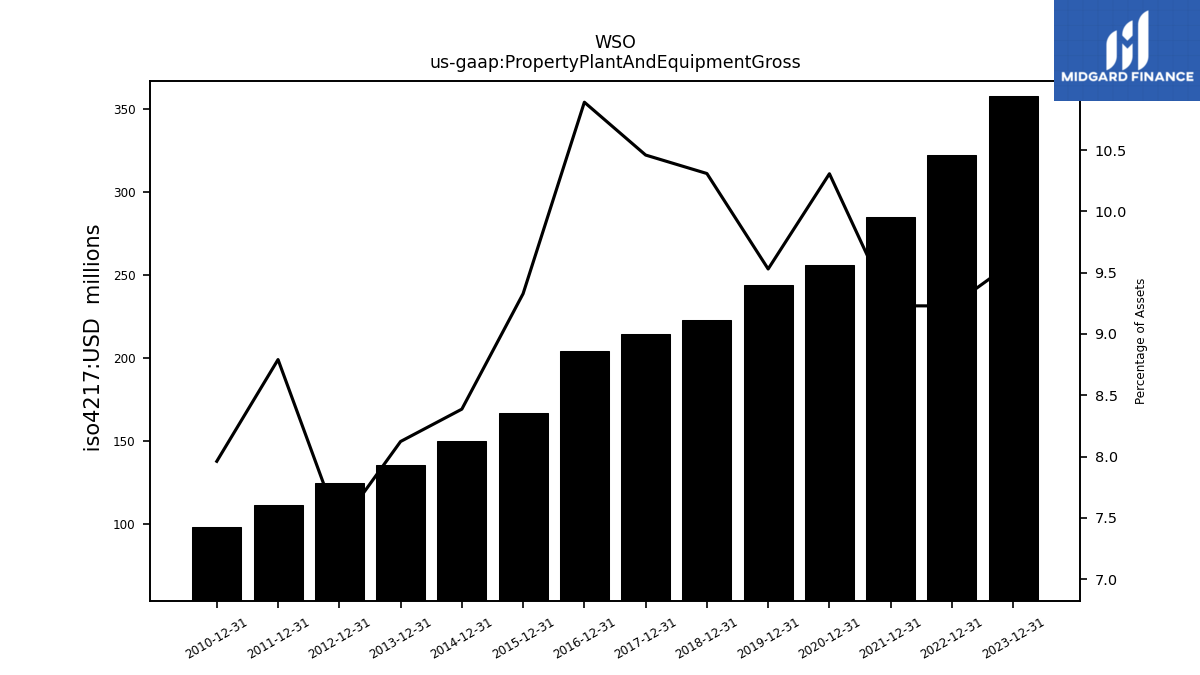
| Property Plant And Equipment Gross | NA | 357.58 | NA | NA | NA | 321.90 | NA | NA | NA | 284.81 | NA | NA | NA | 256.05 | NA | NA | NA | 243.59 | NA | NA | NA | 222.76 | NA | NA | NA | 214.08 | NA | NA | NA | 204.15 | NA | NA | NA | 166.83 | NA | NA | NA | 150.21 | NA | NA | NA | 135.61 | NA | NA | NA | 124.97 | NA | NA | NA | 111.48 | NA | NA | NA | 98.50 | NA | NA | NA | |
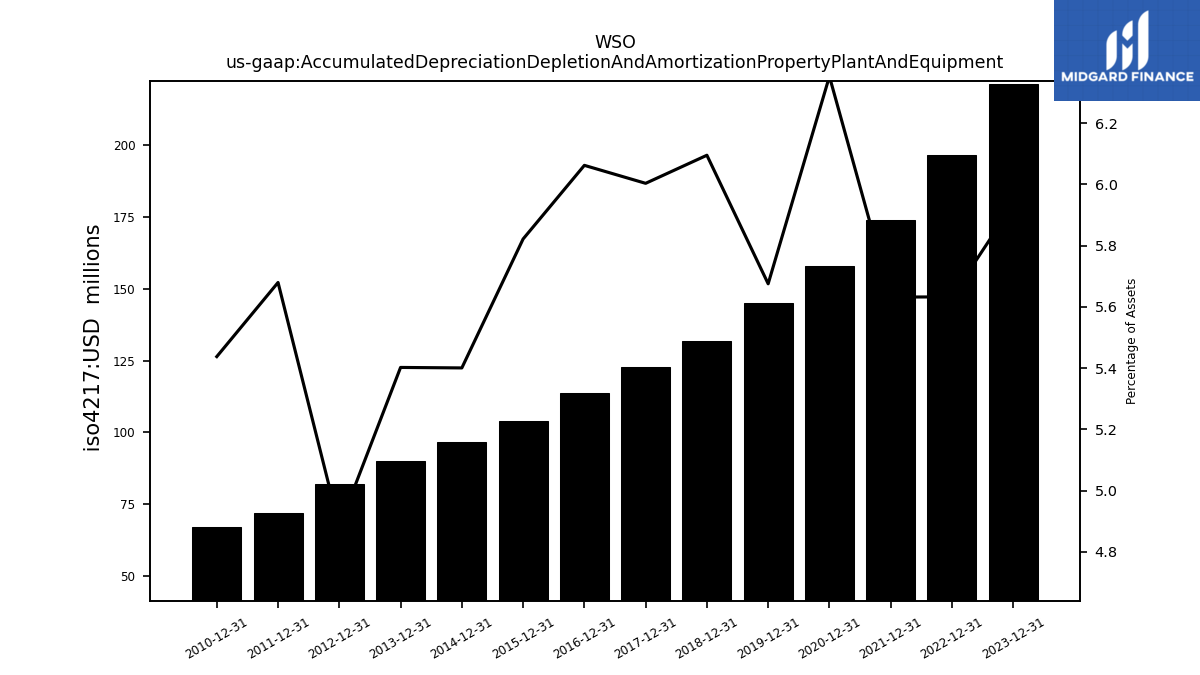
| Accumulated Depreciation Depletion And Amortization Property Plant And Equipment | NA | 221.35 | NA | NA | NA | 196.48 | NA | NA | NA | 173.79 | NA | NA | NA | 157.82 | NA | NA | NA | 145.07 | NA | NA | NA | 131.72 | NA | NA | NA | 122.88 | NA | NA | NA | 113.64 | NA | NA | NA | 104.12 | NA | NA | NA | 96.73 | NA | NA | NA | 90.19 | NA | NA | NA | 82.13 | NA | NA | NA | 72.03 | NA | NA | NA | 67.27 | NA | NA | NA | |
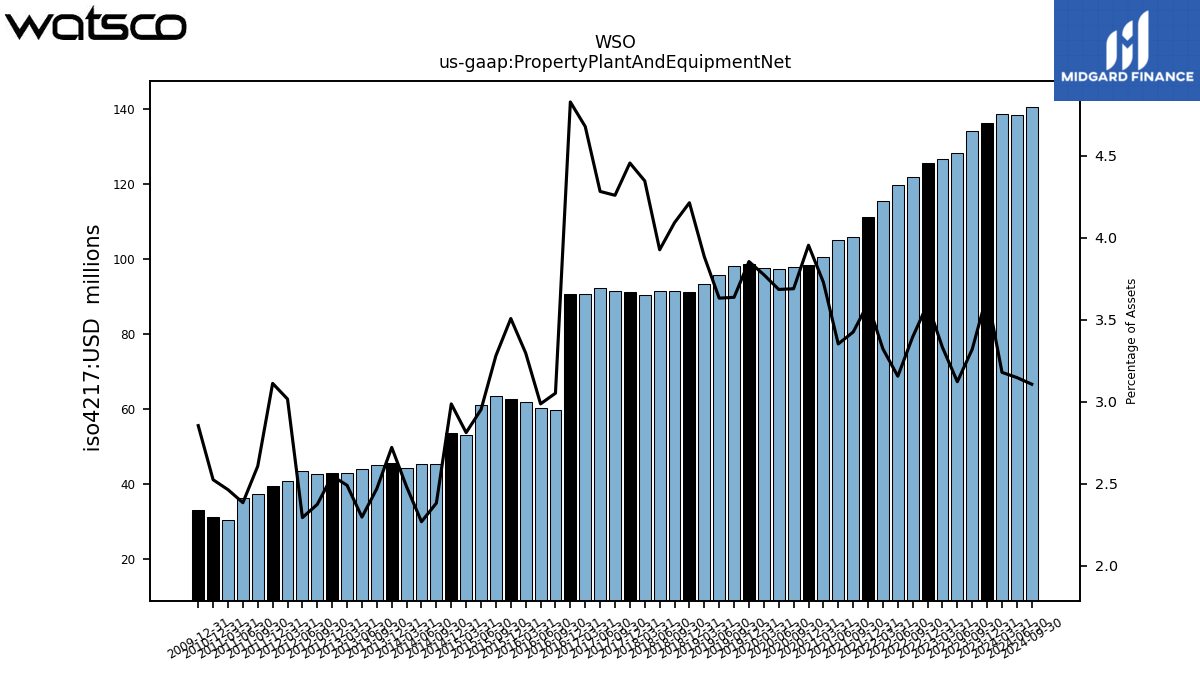
| Property Plant And Equipment Net | 138.49 | 136.23 | 134.08 | 128.06 | 126.58 | 125.42 | 121.68 | 119.53 | 115.39 | 111.02 | 105.84 | 104.97 | 100.38 | 98.22 | 97.66 | 97.14 | 97.44 | 98.52 | 97.93 | 95.59 | 93.18 | 91.05 | 91.28 | 91.31 | 90.24 | 91.20 | 91.48 | 92.25 | 90.53 | 90.50 | 59.73 | 60.31 | 61.87 | 62.72 | 63.30 | 60.99 | 53.12 | 53.48 | 45.35 | 45.14 | 44.07 | 45.42 | 44.89 | 43.91 | 43.00 | 42.84 | 42.72 | 43.44 | 40.73 | 39.45 | 37.32 | 36.18 | 30.43 | 31.22 | NA | NA | NA | |
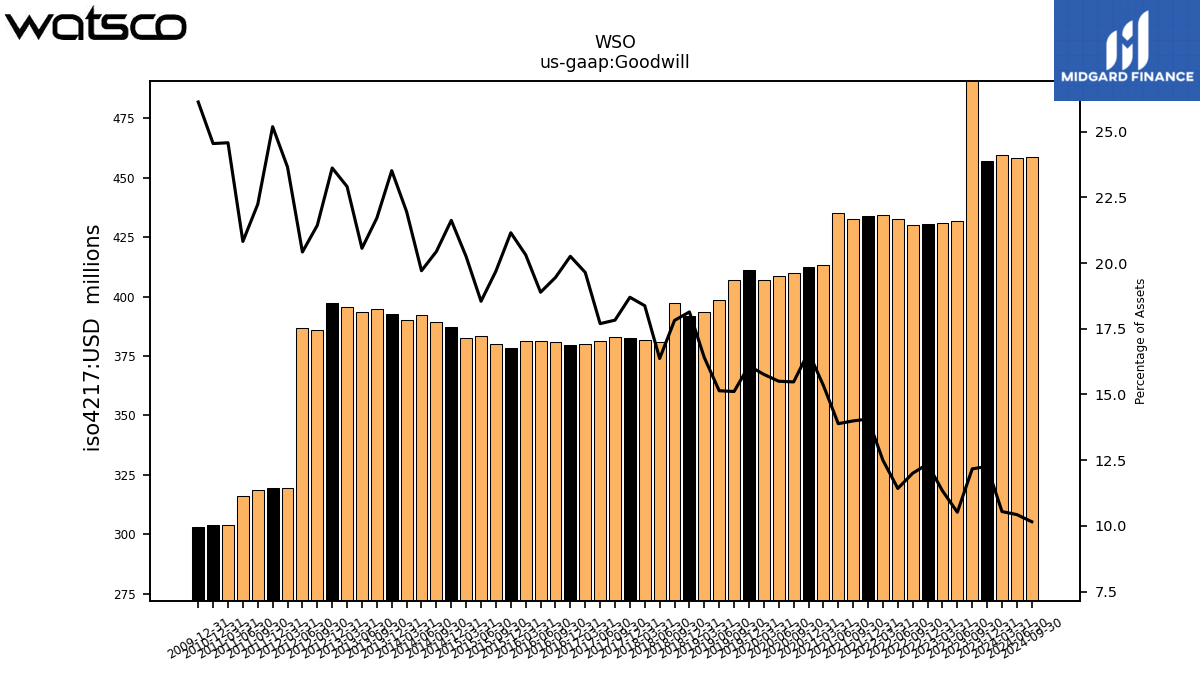
| Goodwill | 459.44 | 457.15 | 491.52 | 431.59 | 430.74 | 430.71 | 430.23 | 432.78 | 434.14 | 434.02 | 432.51 | 434.95 | 413.08 | 412.49 | 409.78 | 408.77 | 407.00 | 411.22 | 407.01 | 398.57 | 393.50 | 392.00 | 397.45 | 380.69 | 381.55 | 382.73 | 382.97 | 381.22 | 380.17 | 379.74 | 380.79 | 381.50 | 381.24 | 378.31 | 379.99 | 383.27 | 382.53 | 387.31 | 389.36 | 392.35 | 390.12 | 392.61 | 394.75 | 393.33 | 395.74 | 397.26 | 385.83 | 386.95 | 319.44 | 319.44 | 318.41 | 316.06 | 303.70 | 303.70 | NA | NA | NA | |
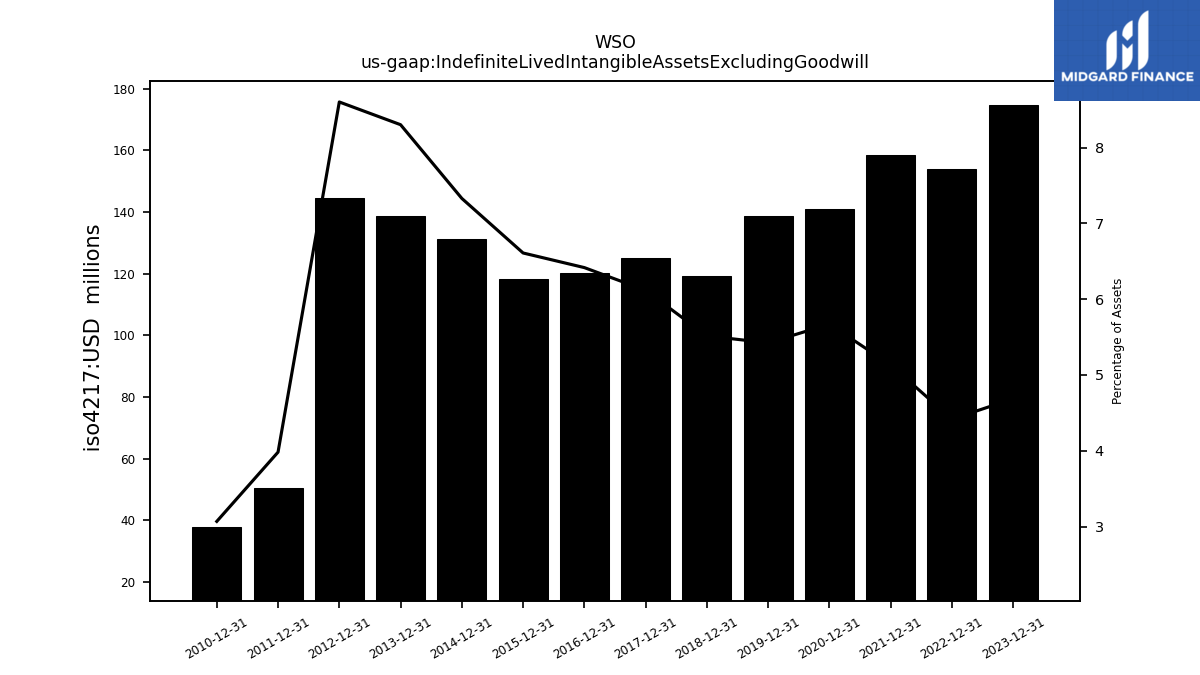
| Indefinite Lived Intangible Assets Excluding Goodwill | NA | 174.78 | NA | NA | NA | 154.09 | NA | NA | NA | 158.39 | NA | NA | NA | 140.87 | NA | NA | NA | 138.65 | NA | NA | NA | 119.19 | NA | NA | NA | 125.19 | NA | NA | NA | 120.29 | NA | NA | NA | 118.20 | NA | NA | NA | 131.27 | NA | NA | NA | 138.60 | NA | NA | NA | 144.68 | NA | NA | NA | 50.50 | NA | NA | NA | 37.96 | NA | NA | NA | |
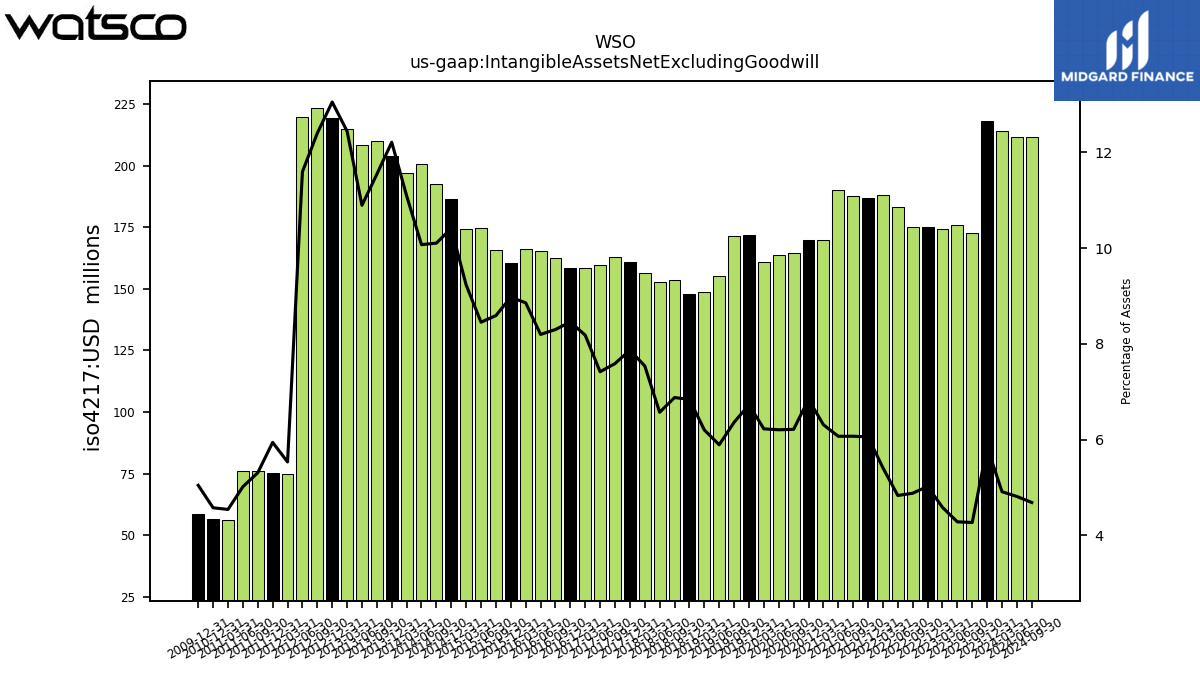
| Intangible Assets Net Excluding Goodwill | 214.06 | 218.15 | 172.47 | 175.77 | 174.29 | 175.19 | 174.98 | 183.13 | 188.00 | 186.90 | 187.66 | 190.09 | 169.93 | 169.93 | 164.55 | 163.64 | 160.74 | 172.00 | 171.31 | 155.12 | 148.80 | 147.85 | 153.45 | 152.82 | 156.53 | 161.06 | 163.01 | 159.80 | 158.32 | 158.56 | 162.47 | 165.54 | 166.24 | 160.48 | 165.75 | 174.67 | 174.38 | 186.48 | 192.47 | 200.50 | 197.11 | 203.84 | 209.83 | 208.39 | 214.88 | 219.50 | 223.16 | 219.68 | 74.75 | 75.37 | 76.01 | 76.16 | 56.13 | 56.63 | NA | NA | NA | |
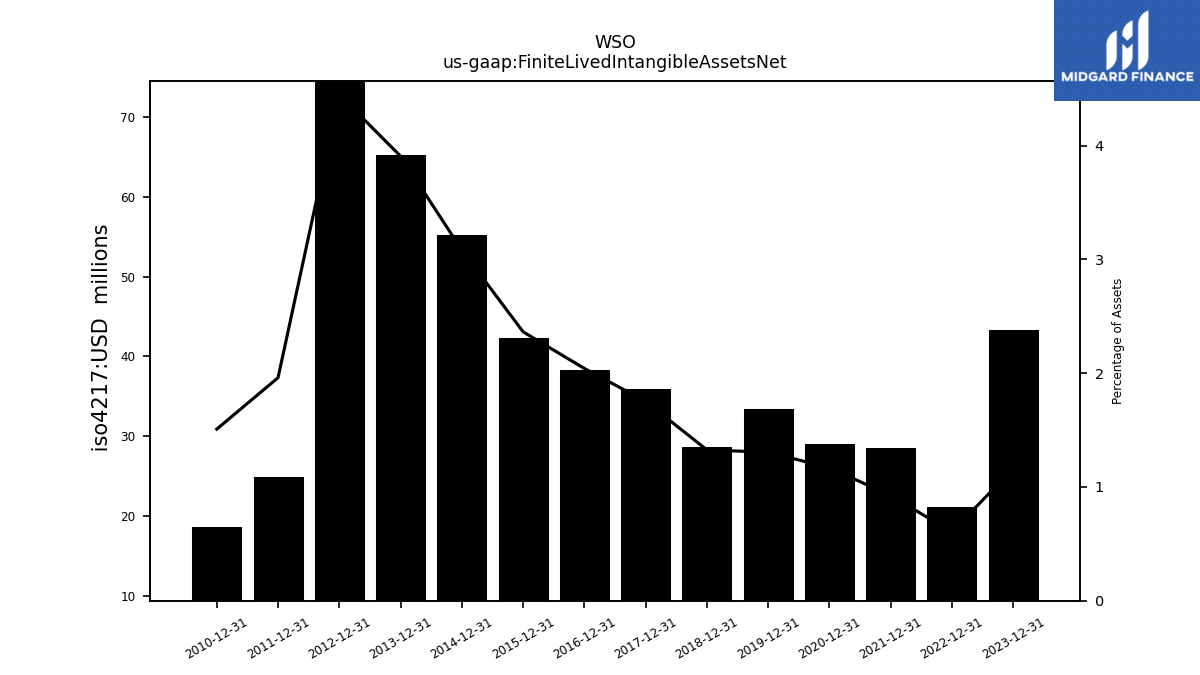
| Finite Lived Intangible Assets Net | NA | 43.37 | NA | NA | NA | 21.11 | NA | NA | NA | 28.51 | NA | NA | NA | 29.06 | NA | NA | NA | 33.36 | NA | NA | NA | 28.66 | NA | NA | NA | 35.87 | NA | NA | NA | 38.28 | NA | NA | NA | 42.28 | NA | NA | NA | 55.20 | NA | NA | NA | 65.24 | NA | NA | NA | 74.82 | NA | NA | NA | 24.86 | NA | NA | NA | 18.66 | NA | NA | NA | |
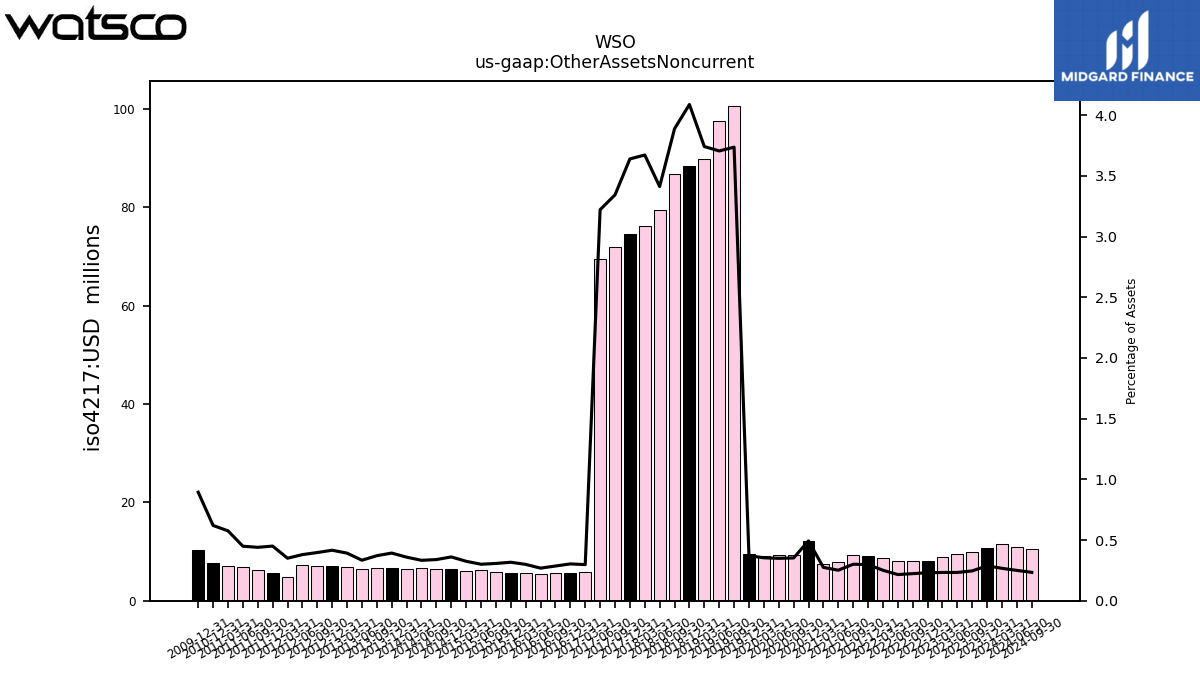
| Other Assets Noncurrent | 11.63 | 10.74 | 9.93 | 9.56 | 8.86 | 8.03 | 8.01 | 8.17 | 8.73 | 9.19 | 9.30 | 7.88 | 7.40 | 12.25 | 9.33 | 9.21 | 9.14 | 9.48 | 100.62 | 97.53 | 89.76 | 88.33 | 86.73 | 79.35 | 76.23 | 74.49 | 71.81 | 69.40 | 5.76 | 5.69 | 5.60 | 5.42 | 5.62 | 5.67 | 5.93 | 6.21 | 6.14 | 6.46 | 6.46 | 6.63 | 6.38 | 6.56 | 6.75 | 6.39 | 6.77 | 7.00 | 7.15 | 7.20 | 4.73 | 5.71 | 6.30 | 6.82 | 7.12 | 7.67 | NA | NA | NA |
| 2024-03-31 | 2023-12-31 | 2023-09-30 | 2023-06-30 | 2023-03-31 | 2022-12-31 | 2022-09-30 | 2022-06-30 | 2022-03-31 | 2021-12-31 | 2021-09-30 | 2021-06-30 | 2021-03-31 | 2020-12-31 | 2020-09-30 | 2020-06-30 | 2020-03-31 | 2019-12-31 | 2019-09-30 | 2019-06-30 | 2019-03-31 | 2018-12-31 | 2018-09-30 | 2018-06-30 | 2018-03-31 | 2017-12-31 | 2017-09-30 | 2017-06-30 | 2017-03-31 | 2016-12-31 | 2016-09-30 | 2016-06-30 | 2016-03-31 | 2015-12-31 | 2015-09-30 | 2015-06-30 | 2015-03-31 | 2014-12-31 | 2014-09-30 | 2014-06-30 | 2014-03-31 | 2013-12-31 | 2013-09-30 | 2013-06-30 | 2013-03-31 | 2012-12-31 | 2012-09-30 | 2012-06-30 | 2012-03-31 | 2011-12-31 | 2011-09-30 | 2011-06-30 | 2011-03-31 | 2010-12-31 | 2010-09-30 | 2010-06-30 | 2010-03-31 | ||
|---|---|---|---|---|---|---|---|---|---|---|---|---|---|---|---|---|---|---|---|---|---|---|---|---|---|---|---|---|---|---|---|---|---|---|---|---|---|---|---|---|---|---|---|---|---|---|---|---|---|---|---|---|---|---|---|---|---|---|
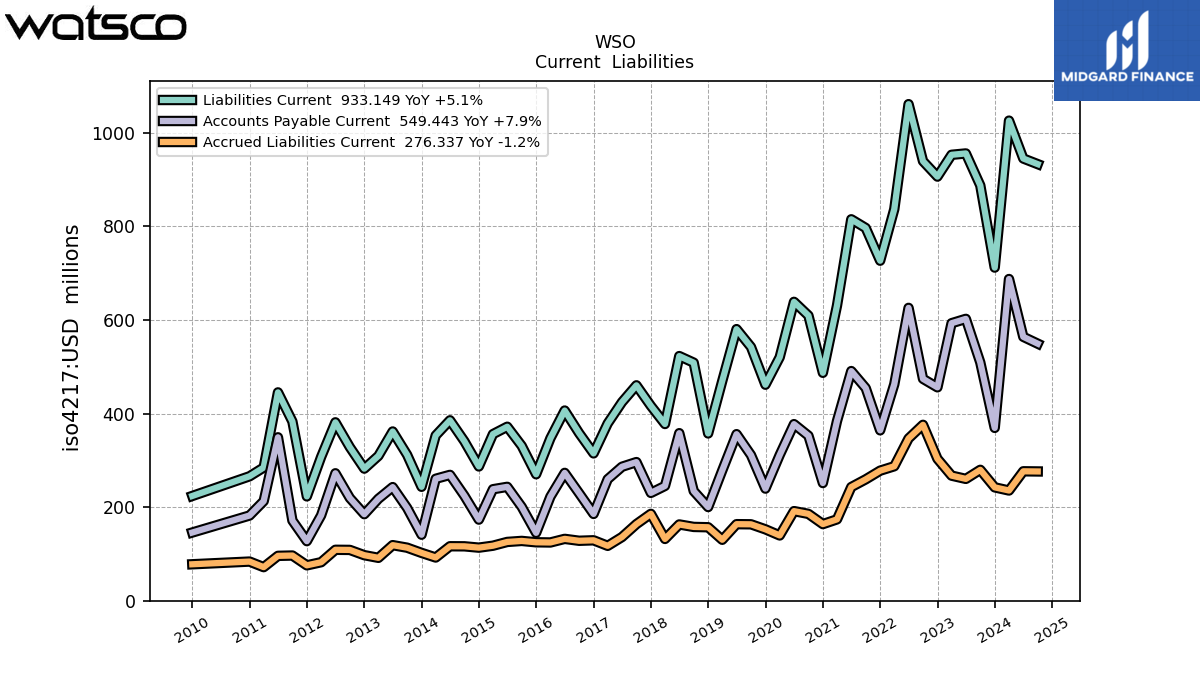
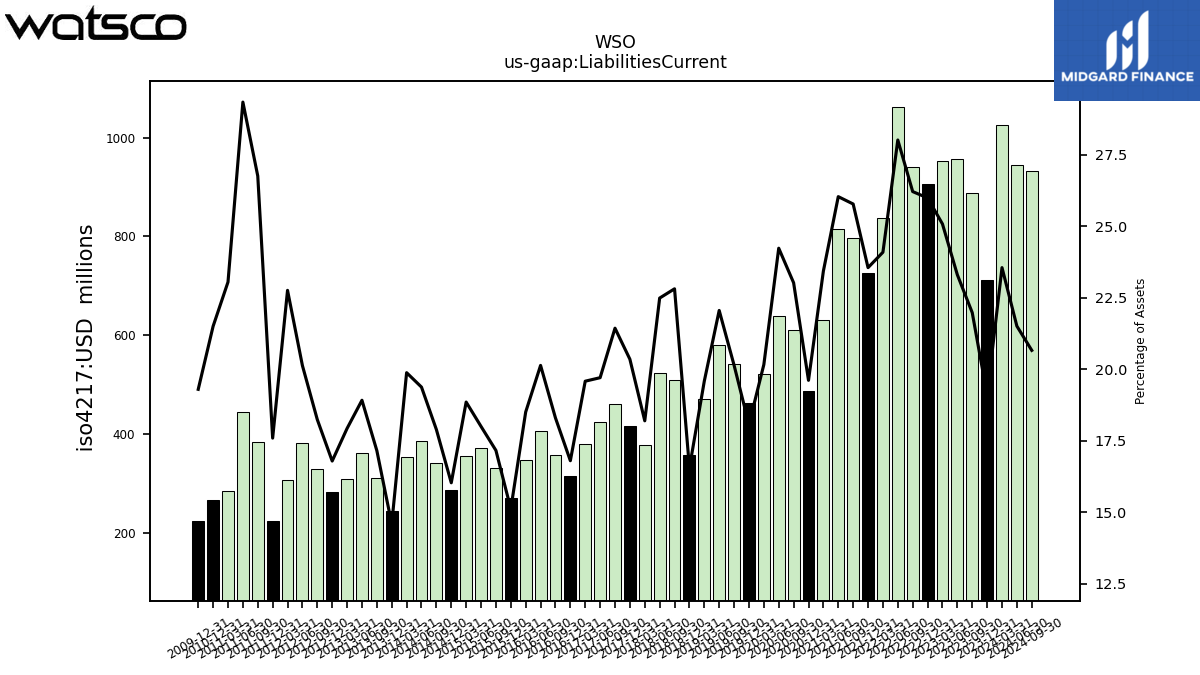
| Liabilities Current | 1026.13 | 712.01 | 887.63 | 956.00 | 953.08 | 906.52 | 939.52 | 1061.34 | 836.84 | 726.72 | 796.69 | 815.26 | 630.82 | 487.14 | 609.50 | 638.86 | 520.47 | 461.72 | 542.29 | 580.52 | 469.77 | 357.57 | 508.82 | 522.92 | 377.73 | 416.48 | 460.40 | 424.44 | 378.90 | 314.89 | 358.13 | 406.55 | 347.25 | 270.30 | 331.04 | 371.90 | 356.14 | 287.02 | 340.75 | 385.65 | 353.18 | 243.51 | 311.79 | 361.78 | 309.64 | 282.36 | 328.20 | 381.34 | 307.34 | 223.04 | 383.07 | 445.35 | 284.77 | 266.00 | NA | NA | NA | |
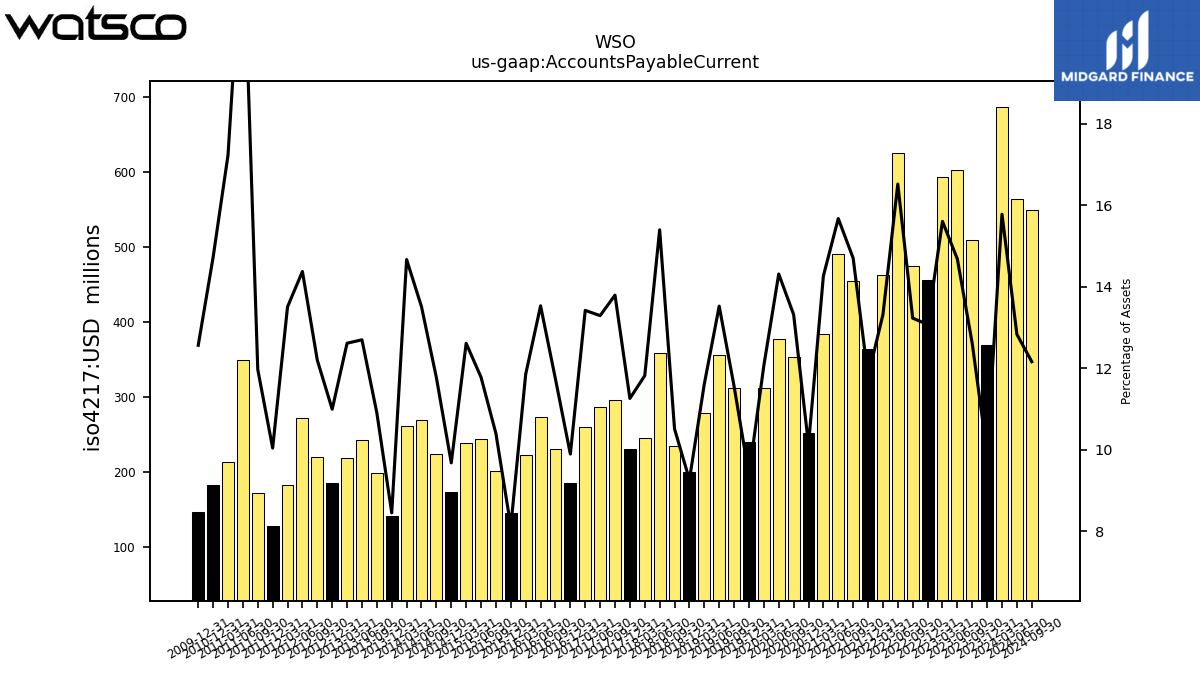
| Accounts Payable Current | 687.64 | 369.40 | 509.31 | 602.46 | 593.15 | 456.13 | 474.27 | 625.96 | 462.57 | 364.19 | 454.50 | 490.92 | 384.11 | 251.55 | 352.69 | 377.44 | 311.59 | 239.67 | 311.32 | 356.06 | 278.63 | 200.23 | 234.48 | 358.15 | 245.41 | 230.48 | 296.35 | 286.39 | 259.74 | 185.48 | 229.74 | 273.31 | 222.51 | 145.16 | 200.64 | 243.46 | 238.33 | 173.36 | 224.27 | 269.02 | 260.66 | 141.10 | 198.28 | 242.93 | 217.92 | 184.96 | 219.56 | 272.42 | 182.46 | 127.36 | 171.40 | 349.35 | 212.91 | 182.19 | NA | NA | NA | |
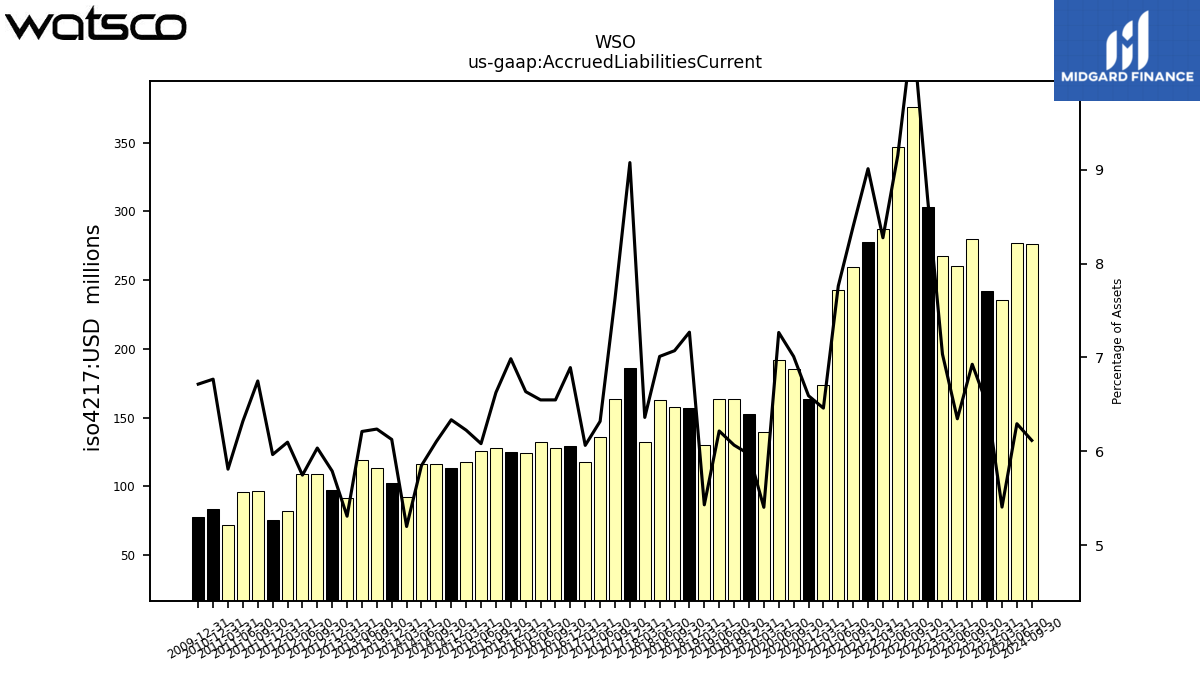
| Accrued Liabilities Current | 235.59 | 242.35 | 279.81 | 260.44 | 267.40 | 303.40 | 376.02 | 346.78 | 287.46 | 278.04 | 259.48 | 243.04 | 173.94 | 163.79 | 185.63 | 191.59 | 139.54 | 152.63 | 163.38 | 163.67 | 130.29 | 157.09 | 157.76 | 163.06 | 132.09 | 185.76 | 163.81 | 136.17 | 117.36 | 129.21 | 128.19 | 132.25 | 124.56 | 124.95 | 127.86 | 125.70 | 117.64 | 113.49 | 116.32 | 116.46 | 92.40 | 102.30 | 113.41 | 118.84 | 91.72 | 97.40 | 108.63 | 108.91 | 82.36 | 75.66 | 96.64 | 95.95 | 71.81 | 83.75 | NA | NA | NA |
| 2024-03-31 | 2023-12-31 | 2023-09-30 | 2023-06-30 | 2023-03-31 | 2022-12-31 | 2022-09-30 | 2022-06-30 | 2022-03-31 | 2021-12-31 | 2021-09-30 | 2021-06-30 | 2021-03-31 | 2020-12-31 | 2020-09-30 | 2020-06-30 | 2020-03-31 | 2019-12-31 | 2019-09-30 | 2019-06-30 | 2019-03-31 | 2018-12-31 | 2018-09-30 | 2018-06-30 | 2018-03-31 | 2017-12-31 | 2017-09-30 | 2017-06-30 | 2017-03-31 | 2016-12-31 | 2016-09-30 | 2016-06-30 | 2016-03-31 | 2015-12-31 | 2015-09-30 | 2015-06-30 | 2015-03-31 | 2014-12-31 | 2014-09-30 | 2014-06-30 | 2014-03-31 | 2013-12-31 | 2013-09-30 | 2013-06-30 | 2013-03-31 | 2012-12-31 | 2012-09-30 | 2012-06-30 | 2012-03-31 | 2011-12-31 | 2011-09-30 | 2011-06-30 | 2011-03-31 | 2010-12-31 | 2010-09-30 | 2010-06-30 | 2010-03-31 | ||
|---|---|---|---|---|---|---|---|---|---|---|---|---|---|---|---|---|---|---|---|---|---|---|---|---|---|---|---|---|---|---|---|---|---|---|---|---|---|---|---|---|---|---|---|---|---|---|---|---|---|---|---|---|---|---|---|---|---|---|
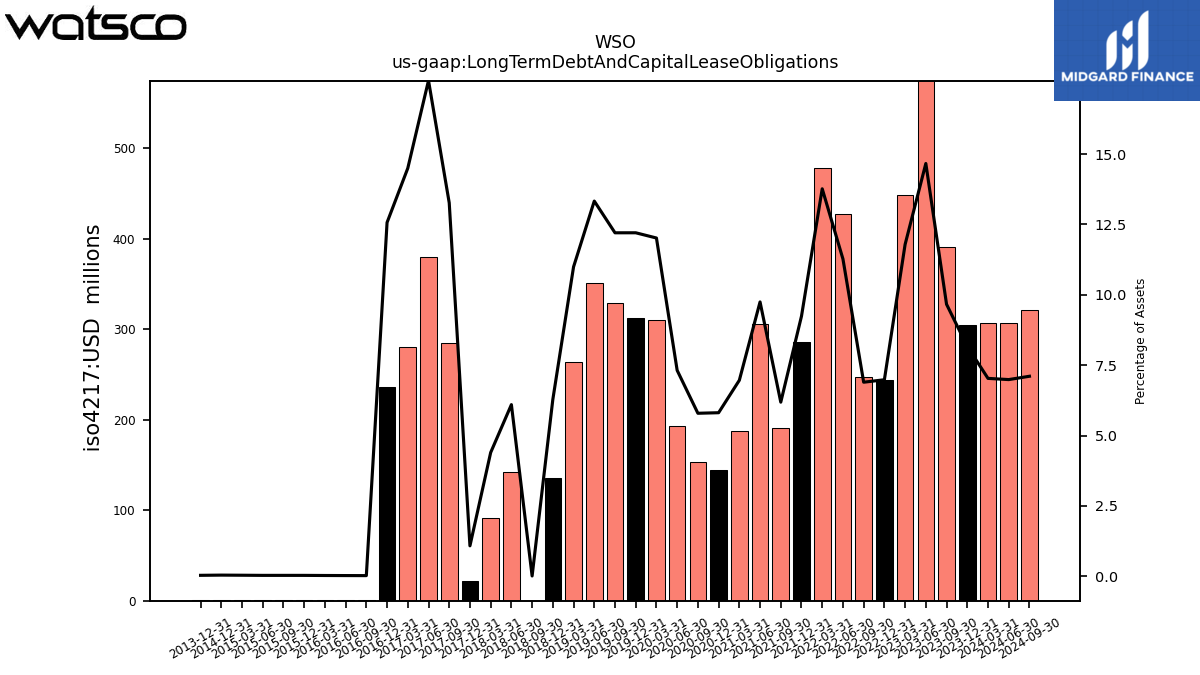
| Long Term Debt And Capital Lease Obligations | 306.31 | 304.53 | 390.34 | 601.80 | 448.14 | 243.53 | 247.13 | 427.15 | 478.30 | 285.21 | 191.17 | 305.26 | 187.47 | 144.34 | 153.31 | 192.89 | 310.31 | 311.98 | 328.67 | 350.95 | 263.73 | 135.75 | 0.17 | 141.80 | 91.23 | 22.09 | 285.05 | 379.54 | 280.60 | 235.64 | 0.39 | 0.44 | 0.47 | 0.51 | 0.56 | 0.60 | 0.64 | 0.69 | NA | NA | NA | 0.51 | NA | NA | NA | NA | NA | NA | NA | NA | NA | NA | NA | NA | NA | NA | NA | |
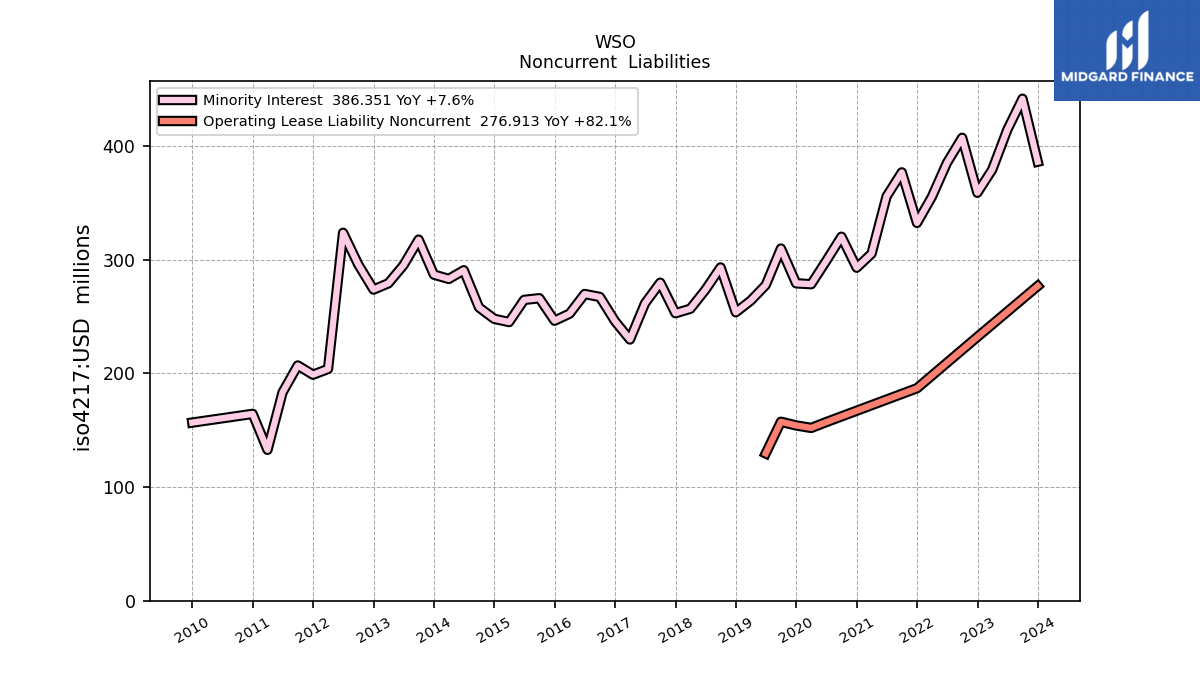
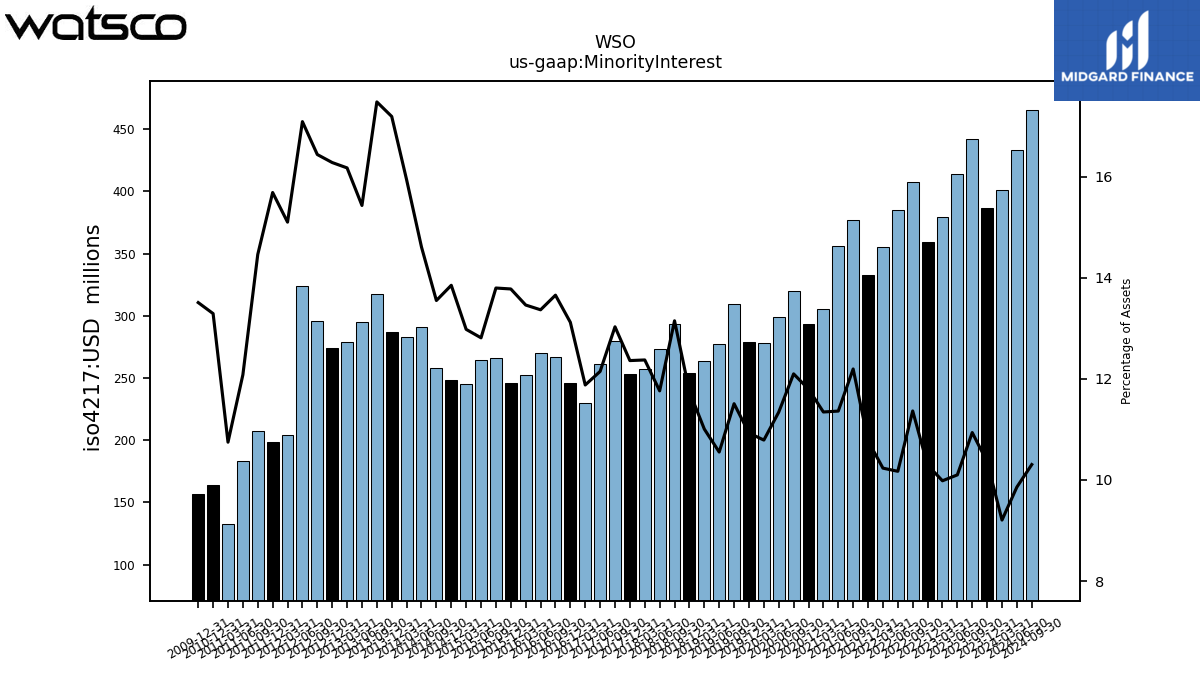
| Minority Interest | 401.15 | 386.35 | 441.75 | 414.40 | 379.43 | 359.04 | 407.38 | 385.34 | 355.50 | 332.47 | 376.94 | 355.83 | 305.42 | 293.08 | 320.33 | 299.04 | 278.54 | 279.34 | 309.91 | 277.77 | 264.04 | 253.86 | 293.31 | 273.55 | 256.91 | 253.02 | 279.90 | 261.69 | 229.88 | 245.92 | 267.31 | 269.94 | 252.64 | 246.41 | 266.20 | 264.76 | 245.24 | 248.08 | 258.12 | 290.81 | 283.19 | 287.00 | 317.77 | 295.18 | 279.35 | 273.83 | 295.85 | 323.80 | 203.95 | 198.92 | 207.04 | 183.37 | 132.80 | 164.44 | NA | NA | NA | |
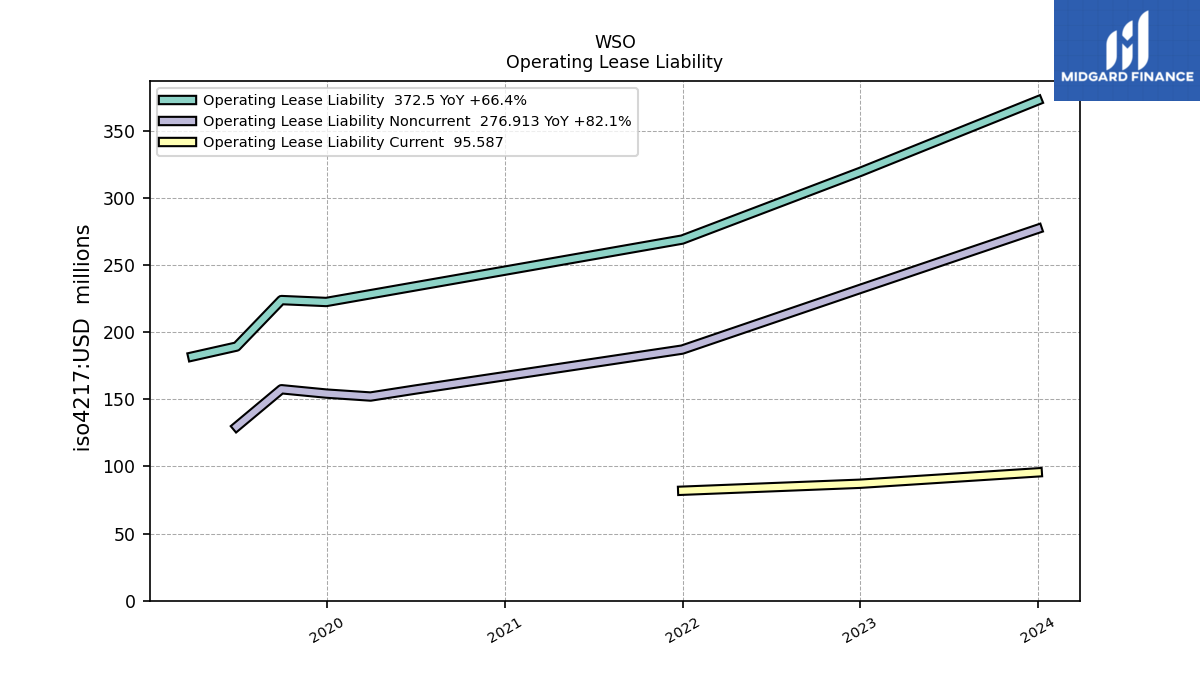
| Operating Lease Liability Noncurrent | NA | 276.91 | NA | NA | NA | 232.14 | NA | NA | NA | 187.02 | NA | NA | NA | NA | NA | 157.21 | 152.06 | 154.27 | 157.50 | 129.64 | NA | NA | NA | NA | NA | NA | NA | NA | NA | NA | NA | NA | NA | NA | NA | NA | NA | NA | NA | NA | NA | NA | NA | NA | NA | NA | NA | NA | NA | NA | NA | NA | NA | NA | NA | NA | NA |
| 2024-03-31 | 2023-12-31 | 2023-09-30 | 2023-06-30 | 2023-03-31 | 2022-12-31 | 2022-09-30 | 2022-06-30 | 2022-03-31 | 2021-12-31 | 2021-09-30 | 2021-06-30 | 2021-03-31 | 2020-12-31 | 2020-09-30 | 2020-06-30 | 2020-03-31 | 2019-12-31 | 2019-09-30 | 2019-06-30 | 2019-03-31 | 2018-12-31 | 2018-09-30 | 2018-06-30 | 2018-03-31 | 2017-12-31 | 2017-09-30 | 2017-06-30 | 2017-03-31 | 2016-12-31 | 2016-09-30 | 2016-06-30 | 2016-03-31 | 2015-12-31 | 2015-09-30 | 2015-06-30 | 2015-03-31 | 2014-12-31 | 2014-09-30 | 2014-06-30 | 2014-03-31 | 2013-12-31 | 2013-09-30 | 2013-06-30 | 2013-03-31 | 2012-12-31 | 2012-09-30 | 2012-06-30 | 2012-03-31 | 2011-12-31 | 2011-09-30 | 2011-06-30 | 2011-03-31 | 2010-12-31 | 2010-09-30 | 2010-06-30 | 2010-03-31 | ||
|---|---|---|---|---|---|---|---|---|---|---|---|---|---|---|---|---|---|---|---|---|---|---|---|---|---|---|---|---|---|---|---|---|---|---|---|---|---|---|---|---|---|---|---|---|---|---|---|---|---|---|---|---|---|---|---|---|---|---|
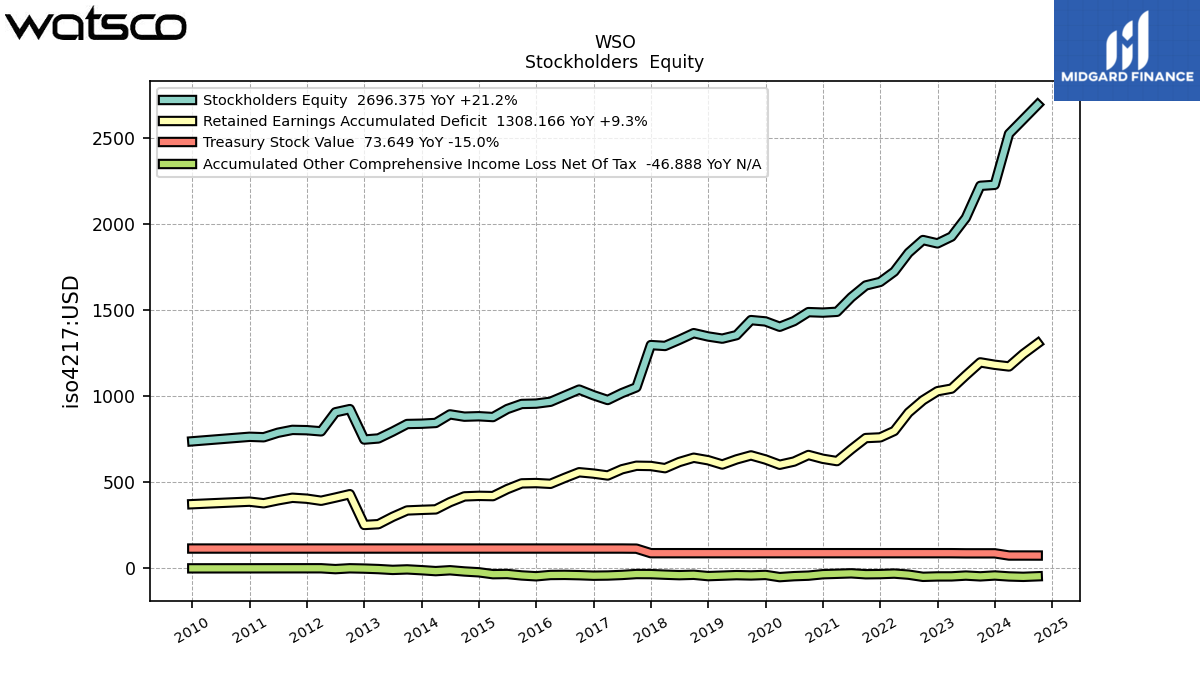
| Stockholders Equity | 2526.43 | 2229.84 | 2224.01 | 2037.65 | 1928.87 | 1889.24 | 1908.78 | 1834.44 | 1725.21 | 1664.95 | 1644.58 | 1575.70 | 1491.41 | 1486.68 | 1489.61 | 1437.04 | 1404.34 | 1435.43 | 1443.11 | 1355.60 | 1335.21 | 1347.85 | 1367.24 | 1328.45 | 1292.71 | 1297.95 | 1052.14 | 1018.66 | 978.34 | 1005.83 | 1039.02 | 1003.30 | 968.07 | 957.31 | 955.36 | 925.94 | 879.17 | 883.96 | 881.44 | 894.73 | 844.86 | 840.40 | 838.75 | 794.89 | 754.81 | 748.21 | 925.47 | 906.99 | 796.01 | 802.79 | 804.58 | 788.00 | 761.69 | 764.46 | NA | NA | NA | |
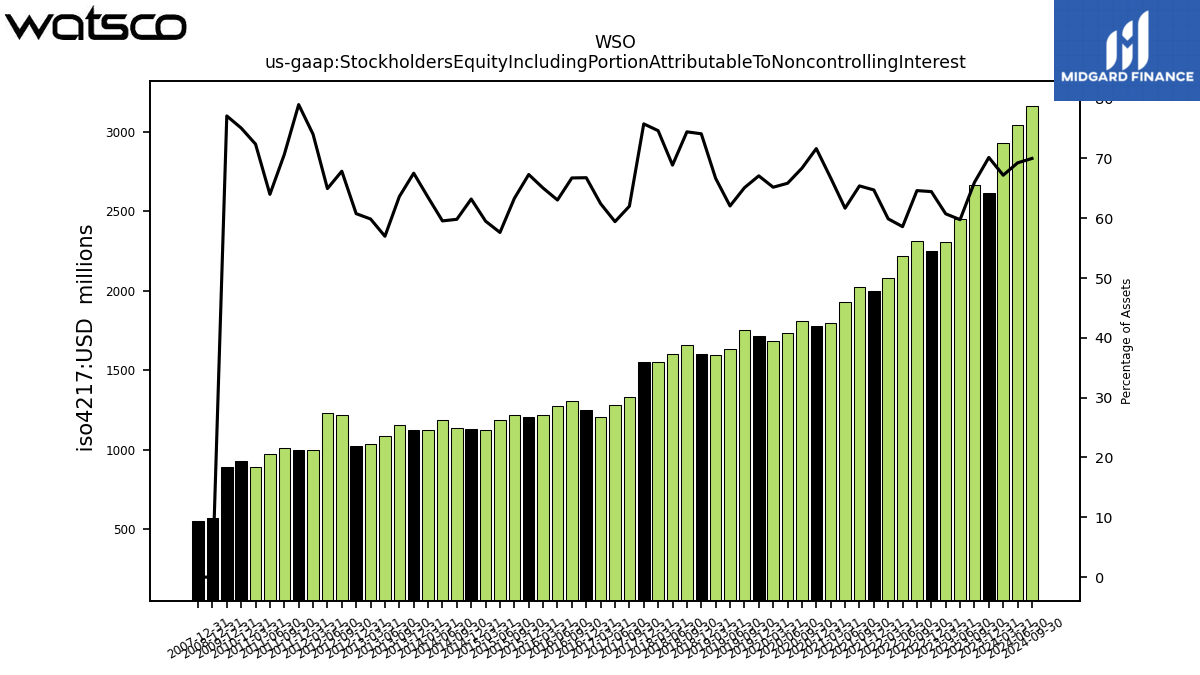
| Stockholders Equity Including Portion Attributable To Noncontrolling Interest | 2927.57 | 2616.19 | 2665.76 | 2452.05 | 2308.30 | 2248.28 | 2316.15 | 2219.78 | 2080.72 | 1997.41 | 2021.53 | 1931.53 | 1796.83 | 1779.76 | 1809.94 | 1736.08 | 1682.89 | 1714.77 | 1753.02 | 1633.36 | 1599.26 | 1601.71 | 1660.55 | 1601.99 | 1549.63 | 1550.98 | 1332.04 | 1280.36 | 1208.22 | 1251.75 | 1306.33 | 1273.24 | 1220.70 | 1203.72 | 1221.57 | 1190.70 | 1124.41 | 1132.04 | 1139.56 | 1185.53 | 1128.05 | 1127.39 | 1156.52 | 1090.07 | 1034.16 | 1022.04 | 1221.32 | 1230.79 | 999.96 | 1001.71 | 1011.63 | 971.37 | 894.49 | 928.90 | NA | NA | NA | |
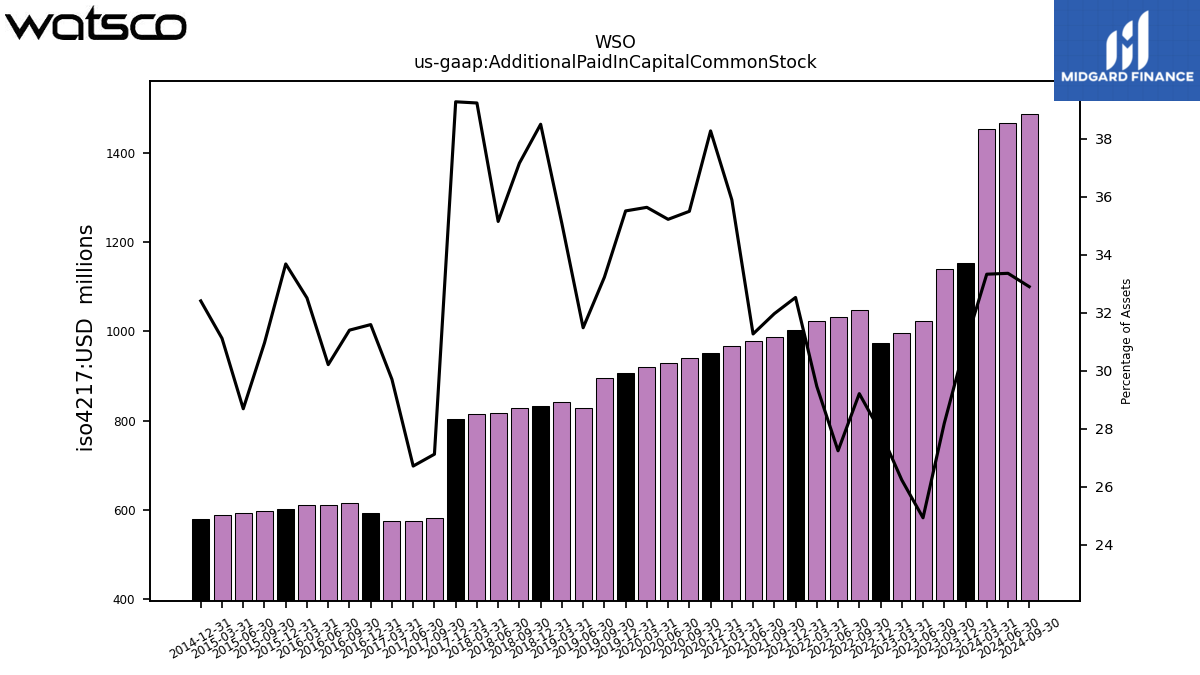
| Additional Paid In Capital Common Stock | 1452.45 | 1153.46 | 1138.75 | 1023.15 | 997.32 | 973.06 | 1047.32 | 1032.29 | 1023.68 | 1003.93 | 988.31 | 979.43 | 966.54 | 950.91 | 940.01 | 928.85 | 920.19 | 907.88 | 894.92 | 828.93 | 841.58 | 832.12 | 829.05 | 817.56 | 814.71 | 804.01 | 582.79 | 575.66 | 574.95 | 592.35 | 614.81 | 610.25 | 610.28 | 602.52 | 597.52 | 593.01 | 588.09 | 580.56 | NA | NA | NA | NA | NA | NA | NA | NA | NA | NA | NA | NA | NA | NA | NA | NA | NA | NA | NA | |
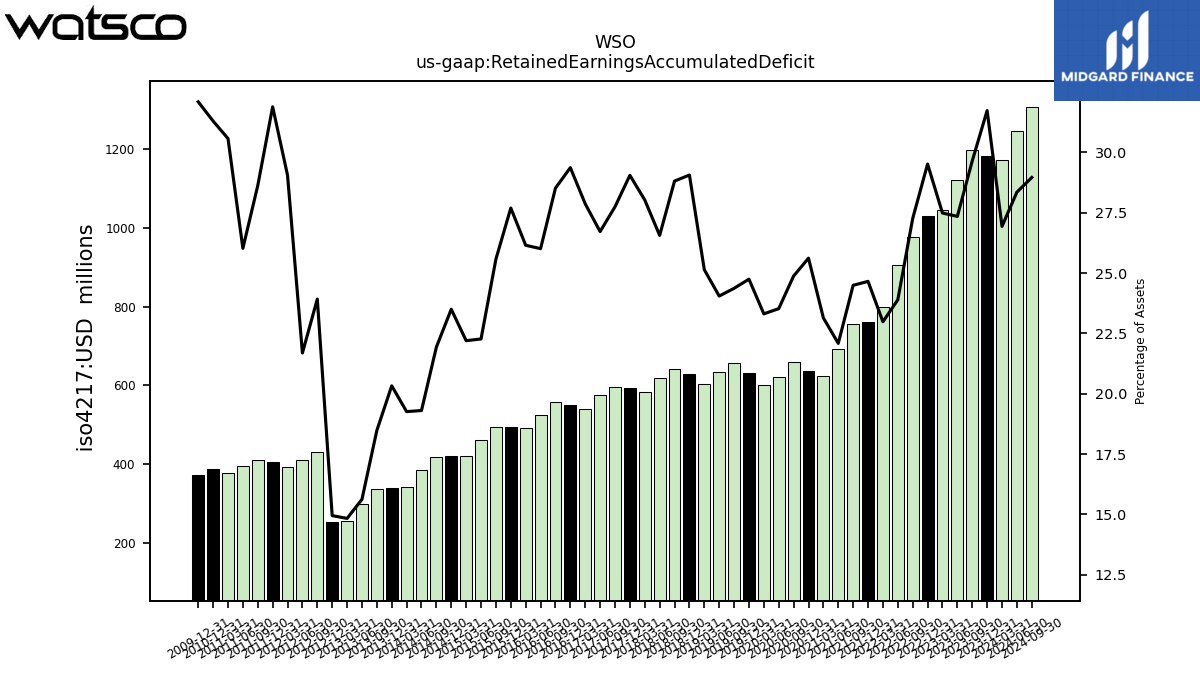
| Retained Earnings Accumulated Deficit | 1173.45 | 1183.21 | 1197.18 | 1121.94 | 1044.62 | 1029.52 | 977.05 | 905.17 | 798.30 | 760.80 | 756.99 | 691.66 | 622.94 | 636.37 | 658.62 | 620.27 | 601.77 | 632.51 | 656.19 | 632.98 | 603.04 | 627.97 | 642.64 | 617.67 | 581.89 | 594.56 | 595.98 | 575.58 | 539.28 | 550.48 | 558.24 | 525.27 | 490.78 | 495.28 | 493.48 | 460.19 | 419.40 | 420.88 | 417.79 | 384.31 | 342.19 | 339.36 | 335.92 | 298.88 | 256.22 | 251.47 | 430.56 | 410.93 | 392.36 | 404.36 | 409.77 | 395.00 | 377.75 | 387.19 | NA | NA | NA | |
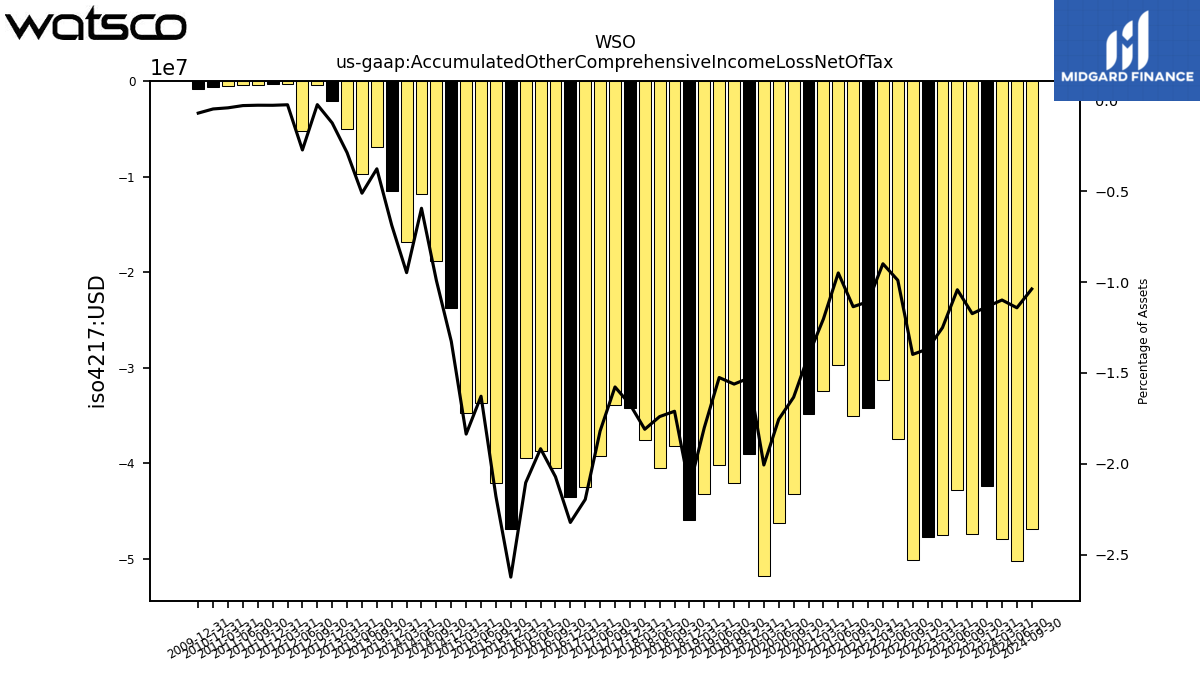
| Accumulated Other Comprehensive Income Loss Net Of Tax | -47.87 | -42.33 | -47.41 | -42.76 | -47.54 | -47.71 | -50.11 | -37.51 | -31.24 | -34.18 | -35.10 | -29.74 | -32.39 | -34.87 | -43.24 | -46.27 | -51.79 | -39.05 | -42.04 | -40.15 | -43.19 | -45.97 | -38.16 | -40.46 | -37.57 | -34.22 | -33.87 | -39.19 | -42.49 | -43.53 | -40.53 | -38.70 | -39.48 | -46.90 | -42.03 | -33.64 | -34.69 | -23.75 | -18.88 | -11.83 | -16.85 | -11.47 | -6.86 | -9.78 | -4.98 | -2.10 | -0.43 | -5.18 | -0.34 | -0.35 | -0.39 | -0.45 | -0.52 | -0.59 | NA | NA | NA | |
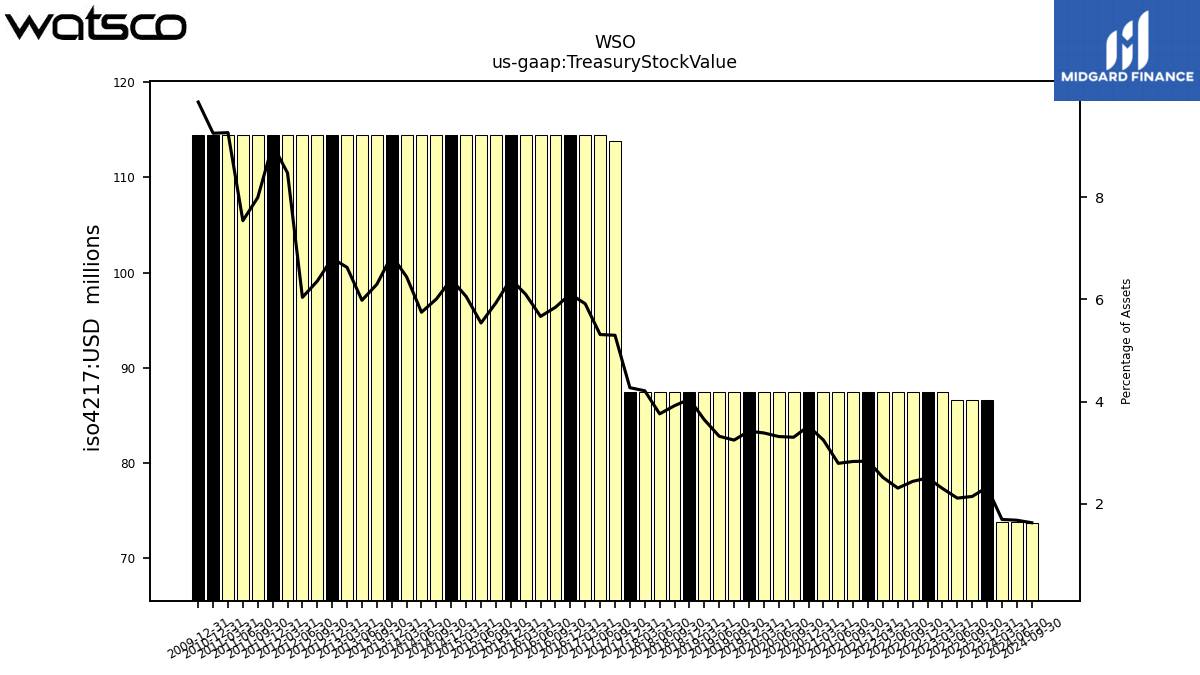
| Treasury Stock Value | 73.81 | 86.63 | 86.63 | 86.63 | 87.44 | 87.44 | 87.44 | 87.44 | 87.44 | 87.44 | 87.44 | 87.44 | 87.44 | 87.44 | 87.44 | 87.44 | 87.44 | 87.44 | 87.44 | 87.44 | 87.44 | 87.44 | 87.44 | 87.44 | 87.44 | 87.44 | 113.80 | 114.42 | 114.42 | 114.42 | 114.42 | 114.42 | 114.42 | 114.42 | 114.42 | 114.42 | 114.42 | 114.42 | 114.42 | 114.42 | 114.42 | 114.42 | 114.42 | 114.42 | 114.42 | 114.42 | 114.42 | 114.42 | 114.42 | 114.42 | 114.42 | 114.42 | 114.42 | 114.42 | NA | NA | NA | |
| Minority Interest | 401.15 | 386.35 | 441.75 | 414.40 | 379.43 | 359.04 | 407.38 | 385.34 | 355.50 | 332.47 | 376.94 | 355.83 | 305.42 | 293.08 | 320.33 | 299.04 | 278.54 | 279.34 | 309.91 | 277.77 | 264.04 | 253.86 | 293.31 | 273.55 | 256.91 | 253.02 | 279.90 | 261.69 | 229.88 | 245.92 | 267.31 | 269.94 | 252.64 | 246.41 | 266.20 | 264.76 | 245.24 | 248.08 | 258.12 | 290.81 | 283.19 | 287.00 | 317.77 | 295.18 | 279.35 | 273.83 | 295.85 | 323.80 | 203.95 | 198.92 | 207.04 | 183.37 | 132.80 | 164.44 | NA | NA | NA | |
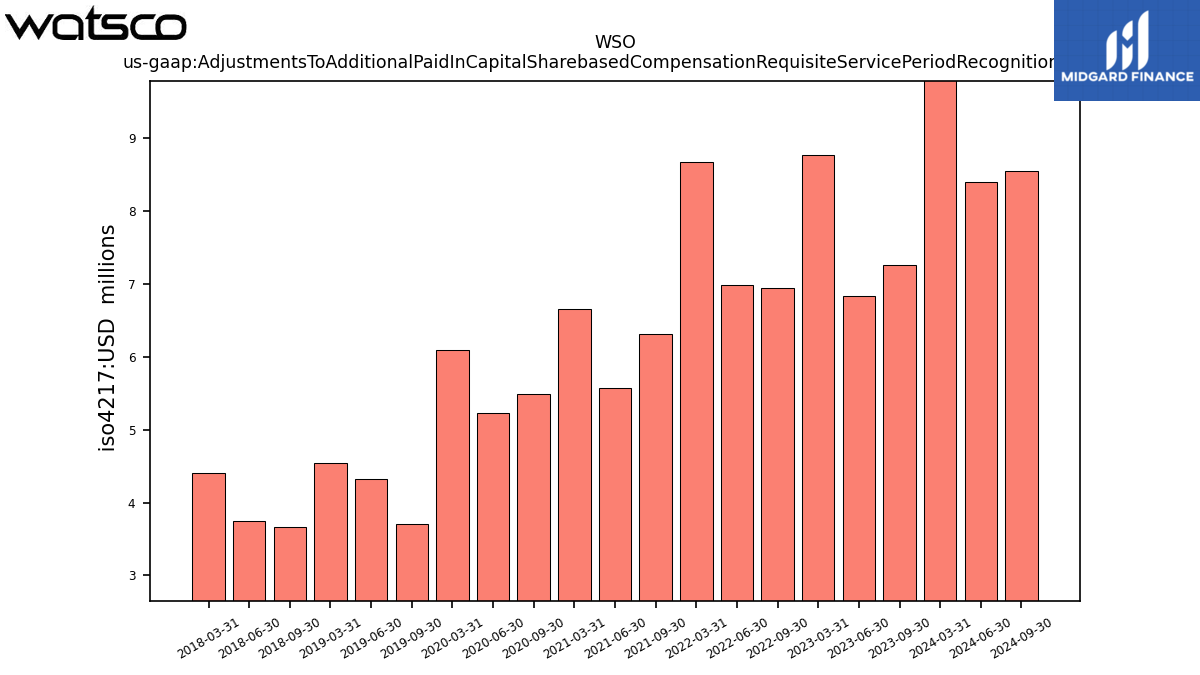
| Adjustments To Additional Paid In Capital Sharebased Compensation Requisite Service Period Recognition Value | 10.47 | NA | 7.26 | 6.83 | 8.76 | NA | 6.94 | 6.99 | 8.67 | NA | 6.31 | 5.57 | 6.66 | NA | 5.49 | 5.23 | 6.10 | NA | 3.71 | 4.32 | 4.54 | NA | 3.67 | 3.75 | 4.40 | NA | NA | NA | NA | NA | NA | NA | NA | NA | NA | NA | NA | NA | NA | NA | NA | NA | NA | NA | NA | NA | NA | NA | NA | NA | NA | NA | NA | NA | NA | NA | NA |
| 2024-03-31 | 2023-12-31 | 2023-09-30 | 2023-06-30 | 2023-03-31 | 2022-12-31 | 2022-09-30 | 2022-06-30 | 2022-03-31 | 2021-12-31 | 2021-09-30 | 2021-06-30 | 2021-03-31 | 2020-12-31 | 2020-09-30 | 2020-06-30 | 2020-03-31 | 2019-12-31 | 2019-09-30 | 2019-06-30 | 2019-03-31 | 2018-12-31 | 2018-09-30 | 2018-06-30 | 2018-03-31 | 2017-12-31 | 2017-09-30 | 2017-06-30 | 2017-03-31 | 2016-12-31 | 2016-09-30 | 2016-06-30 | 2016-03-31 | 2015-12-31 | 2015-09-30 | 2015-06-30 | 2015-03-31 | 2014-12-31 | 2014-09-30 | 2014-06-30 | 2014-03-31 | 2013-12-31 | 2013-09-30 | 2013-06-30 | 2013-03-31 | 2012-12-31 | 2012-09-30 | 2012-06-30 | 2012-03-31 | 2011-12-31 | 2011-09-30 | 2011-06-30 | 2011-03-31 | 2010-12-31 | 2010-09-30 | 2010-06-30 | 2010-03-31 | ||
|---|---|---|---|---|---|---|---|---|---|---|---|---|---|---|---|---|---|---|---|---|---|---|---|---|---|---|---|---|---|---|---|---|---|---|---|---|---|---|---|---|---|---|---|---|---|---|---|---|---|---|---|---|---|---|---|---|---|---|
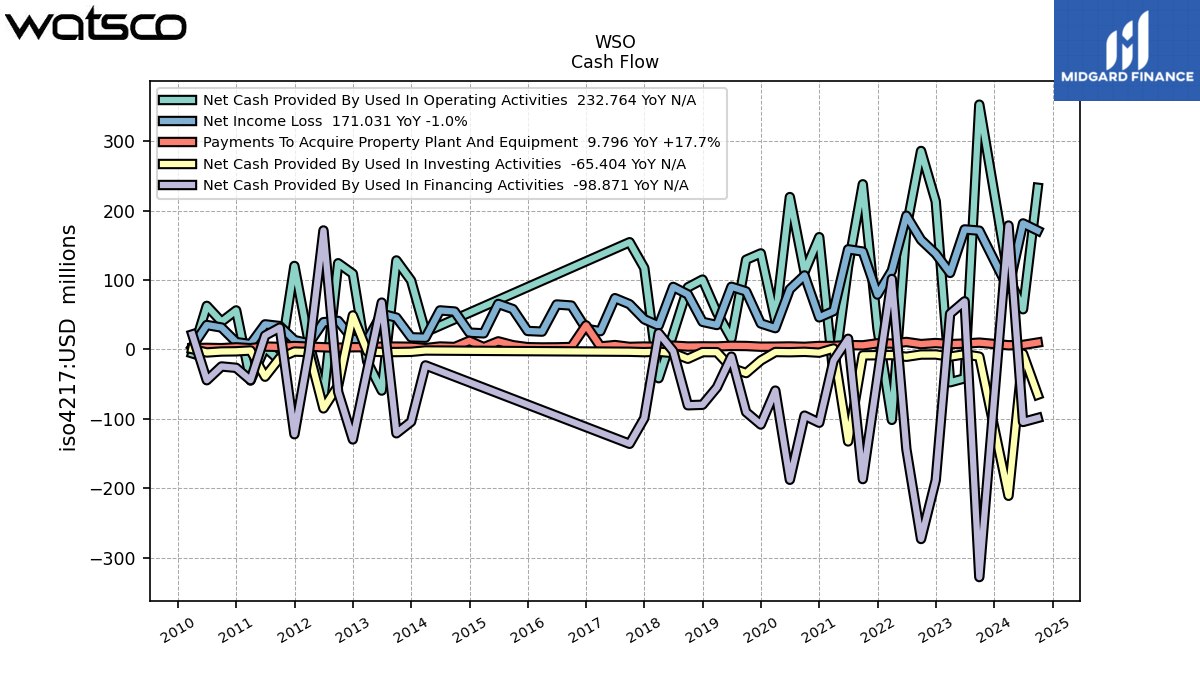
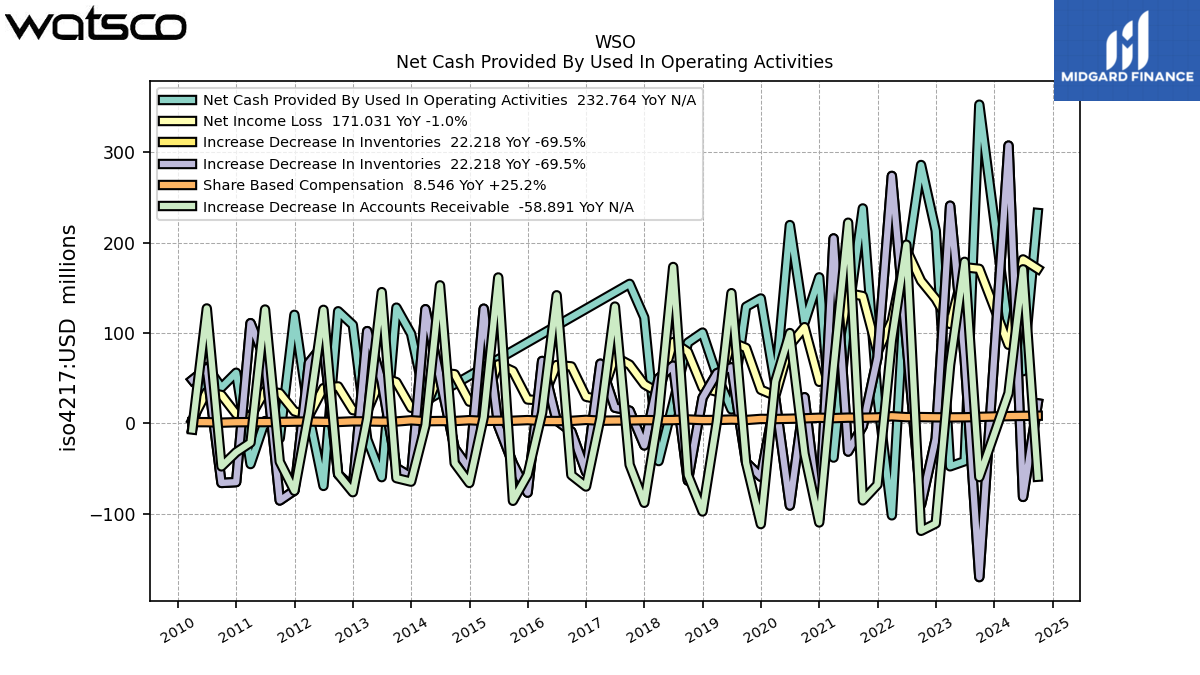
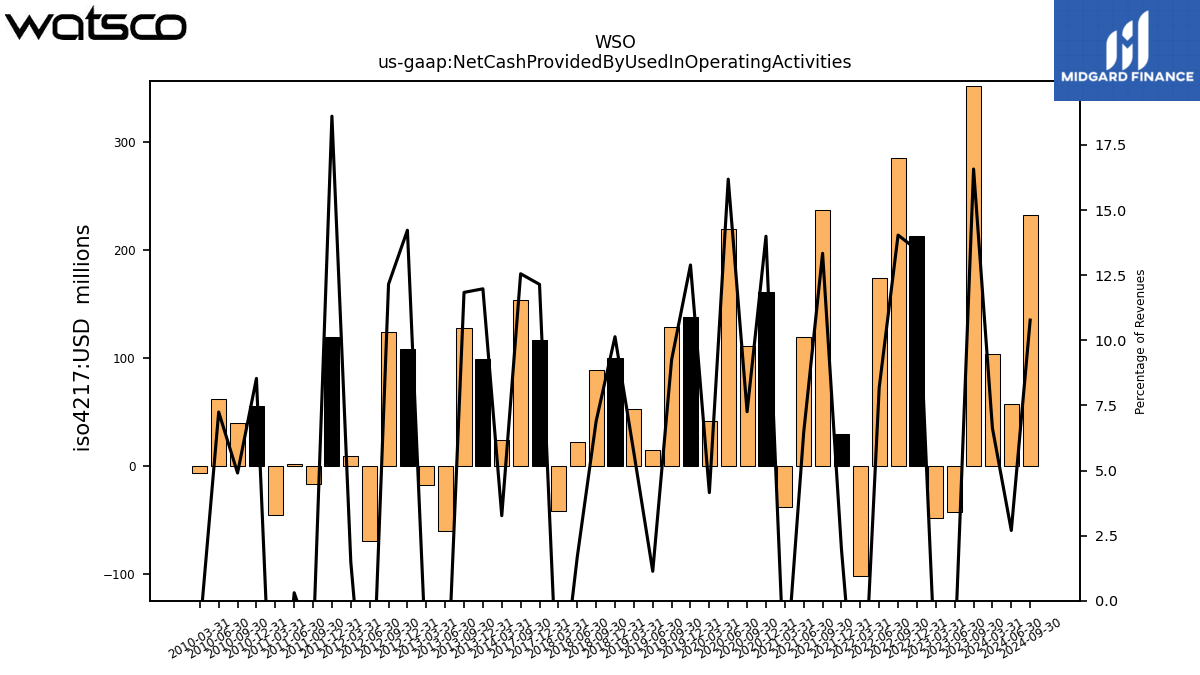
| Net Cash Provided By Used In Operating Activities | 103.71 | 298.61 | 352.52 | -41.76 | -47.42 | 213.08 | 285.81 | 174.69 | -101.62 | 29.89 | 237.79 | 119.63 | -37.74 | 161.60 | 111.52 | 219.40 | 41.86 | 138.24 | 129.08 | 15.51 | 52.94 | 100.49 | 89.32 | 22.36 | -41.61 | 117.14 | 154.37 | NA | NA | NA | NA | NA | NA | NA | NA | NA | NA | NA | NA | NA | 24.90 | 99.09 | 128.09 | -59.41 | -17.50 | 108.90 | 124.08 | -69.09 | 9.45 | 120.16 | -16.50 | 2.72 | -44.93 | 56.10 | 39.87 | 62.66 | -5.83 | |
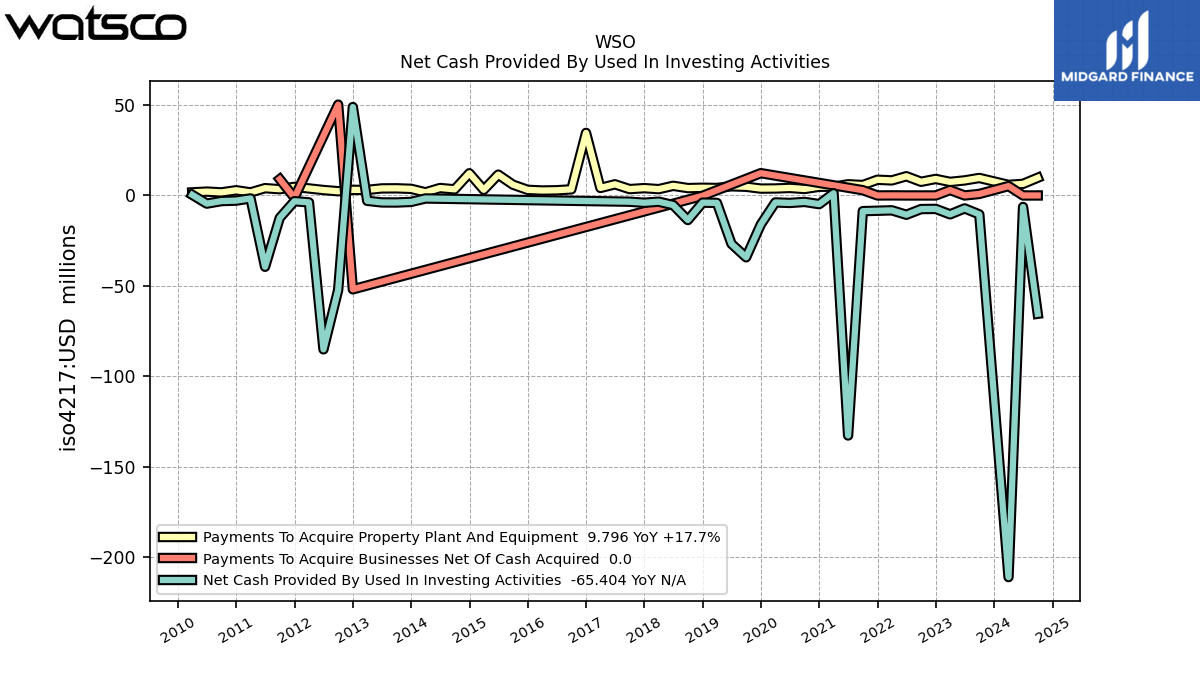
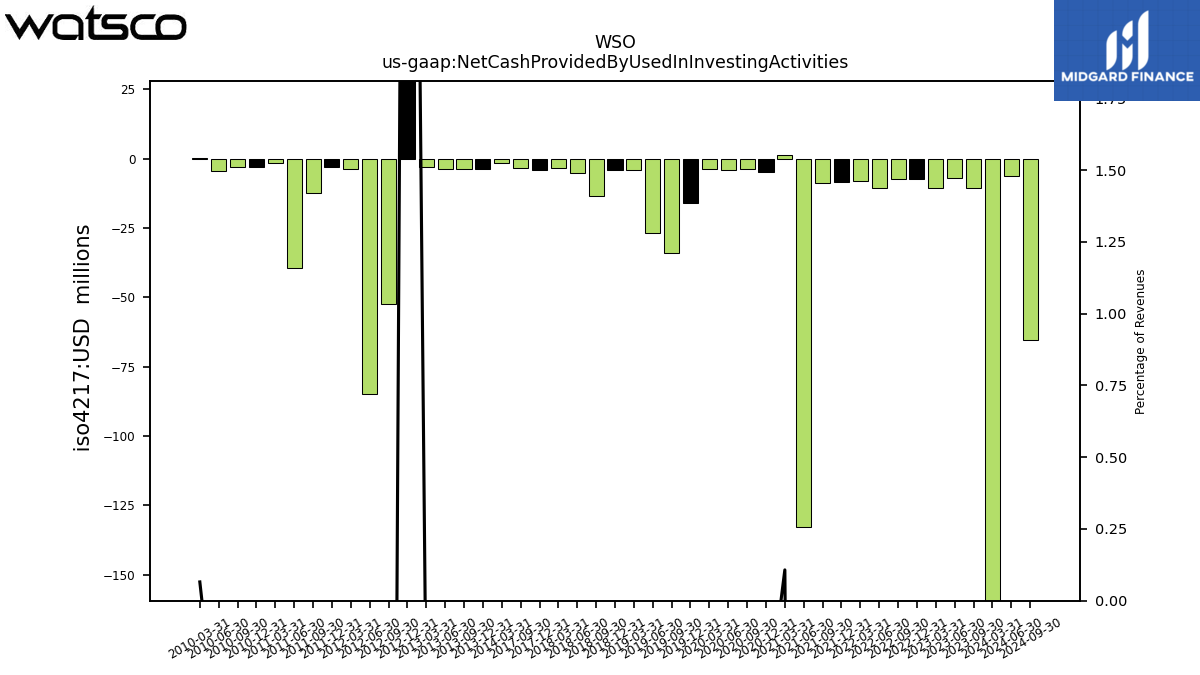
| Net Cash Provided By Used In Investing Activities | -210.97 | -13.29 | -10.46 | -7.15 | -10.44 | -7.43 | -7.52 | -10.67 | -8.22 | -8.45 | -8.67 | -132.69 | 1.22 | -4.79 | -3.56 | -4.13 | -3.85 | -16.04 | -34.19 | -26.70 | -4.10 | -3.97 | -13.60 | -5.31 | -3.43 | -4.02 | -3.45 | NA | NA | NA | NA | NA | NA | NA | NA | NA | NA | NA | NA | NA | -1.67 | -3.56 | -3.89 | -3.84 | -2.96 | 48.89 | -52.30 | -85.07 | -3.81 | -3.19 | -12.40 | -39.42 | -1.64 | -2.85 | -3.11 | -4.51 | 0.33 | |
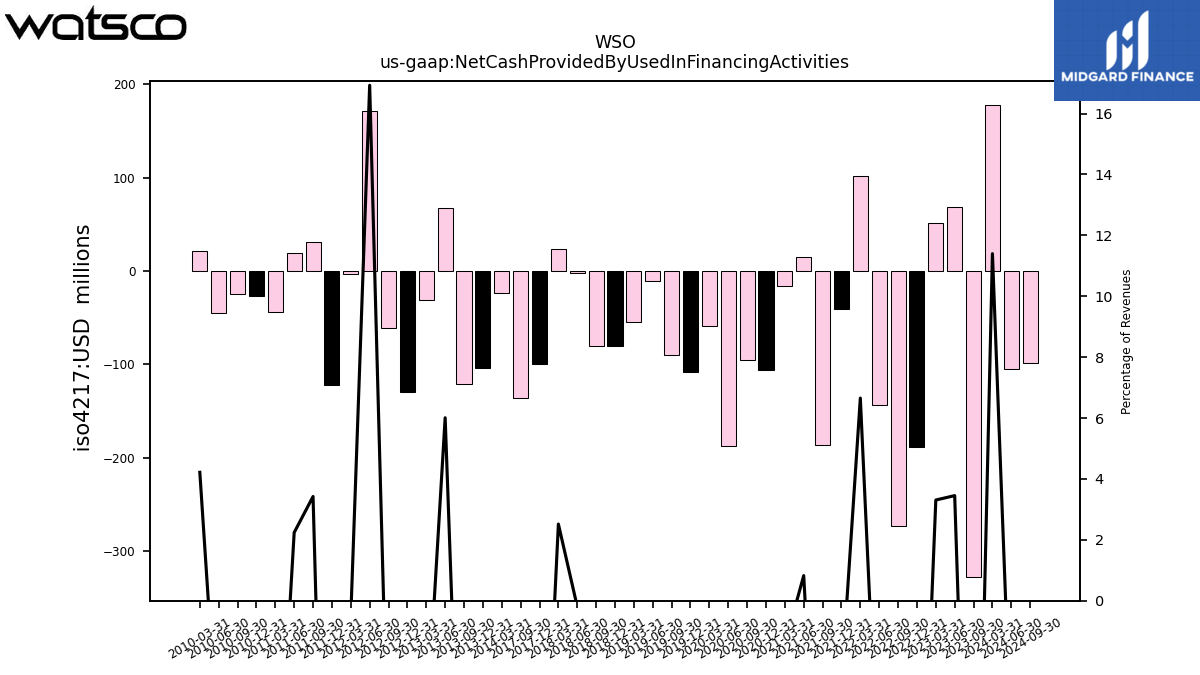
| Net Cash Provided By Used In Financing Activities | 178.40 | -252.44 | -328.11 | 69.17 | 51.30 | -188.47 | -273.21 | -143.68 | 101.41 | -40.70 | -186.92 | 15.27 | -16.25 | -105.72 | -95.47 | -187.91 | -59.39 | -108.29 | -90.41 | -10.47 | -54.86 | -79.84 | -80.54 | -2.56 | 23.34 | -99.19 | -136.08 | NA | NA | NA | NA | NA | NA | NA | NA | NA | NA | NA | NA | NA | -23.11 | -104.35 | -120.95 | 67.34 | -31.08 | -129.79 | -61.33 | 171.29 | -3.26 | -122.31 | 31.29 | 19.79 | -44.40 | -26.63 | -24.64 | -44.50 | 21.50 |
| 2024-03-31 | 2023-12-31 | 2023-09-30 | 2023-06-30 | 2023-03-31 | 2022-12-31 | 2022-09-30 | 2022-06-30 | 2022-03-31 | 2021-12-31 | 2021-09-30 | 2021-06-30 | 2021-03-31 | 2020-12-31 | 2020-09-30 | 2020-06-30 | 2020-03-31 | 2019-12-31 | 2019-09-30 | 2019-06-30 | 2019-03-31 | 2018-12-31 | 2018-09-30 | 2018-06-30 | 2018-03-31 | 2017-12-31 | 2017-09-30 | 2017-06-30 | 2017-03-31 | 2016-12-31 | 2016-09-30 | 2016-06-30 | 2016-03-31 | 2015-12-31 | 2015-09-30 | 2015-06-30 | 2015-03-31 | 2014-12-31 | 2014-09-30 | 2014-06-30 | 2014-03-31 | 2013-12-31 | 2013-09-30 | 2013-06-30 | 2013-03-31 | 2012-12-31 | 2012-09-30 | 2012-06-30 | 2012-03-31 | 2011-12-31 | 2011-09-30 | 2011-06-30 | 2011-03-31 | 2010-12-31 | 2010-09-30 | 2010-06-30 | 2010-03-31 | ||
|---|---|---|---|---|---|---|---|---|---|---|---|---|---|---|---|---|---|---|---|---|---|---|---|---|---|---|---|---|---|---|---|---|---|---|---|---|---|---|---|---|---|---|---|---|---|---|---|---|---|---|---|---|---|---|---|---|---|---|
| Net Cash Provided By Used In Operating Activities | 103.71 | 298.61 | 352.52 | -41.76 | -47.42 | 213.08 | 285.81 | 174.69 | -101.62 | 29.89 | 237.79 | 119.63 | -37.74 | 161.60 | 111.52 | 219.40 | 41.86 | 138.24 | 129.08 | 15.51 | 52.94 | 100.49 | 89.32 | 22.36 | -41.61 | 117.14 | 154.37 | NA | NA | NA | NA | NA | NA | NA | NA | NA | NA | NA | NA | NA | 24.90 | 99.09 | 128.09 | -59.41 | -17.50 | 108.90 | 124.08 | -69.09 | 9.45 | 120.16 | -16.50 | 2.72 | -44.93 | 56.10 | 39.87 | 62.66 | -5.83 | |
| Net Income Loss | 87.00 | 82.55 | 170.95 | 172.76 | 110.07 | 137.67 | 157.64 | 192.56 | 113.30 | 78.89 | 140.87 | 144.10 | 55.09 | 46.01 | 106.49 | 86.58 | 30.50 | 37.28 | 83.48 | 90.16 | 35.04 | 39.59 | 79.16 | 89.96 | 34.22 | 43.26 | 65.03 | 73.76 | 26.18 | 29.55 | 63.10 | 64.62 | 25.54 | 26.49 | 57.97 | 65.42 | 23.05 | 24.07 | 54.46 | 56.10 | 16.75 | 17.32 | 45.70 | 51.32 | 13.38 | 14.76 | 41.01 | 39.10 | 8.47 | 13.38 | 33.55 | 36.02 | 7.50 | 10.45 | 31.44 | 35.05 | 3.83 | |
| Profit Loss | 104.26 | 97.74 | 200.62 | 205.40 | 130.37 | 157.13 | 186.17 | 225.51 | 134.89 | 95.63 | 164.84 | 172.13 | 66.13 | 56.48 | 126.21 | 104.24 | 36.25 | 44.41 | 99.66 | 107.91 | 43.80 | 49.00 | 96.89 | 108.26 | 42.38 | 52.66 | 80.02 | 90.85 | 33.77 | 39.87 | 80.52 | 81.42 | 34.17 | 36.34 | 74.64 | 84.24 | 31.30 | 34.78 | 71.13 | 78.39 | 24.40 | 27.93 | 66.12 | 72.58 | 21.09 | 23.68 | 59.53 | 60.90 | 13.49 | 22.53 | 51.82 | 52.27 | 11.12 | 14.52 | 43.52 | 48.21 | 5.47 | |
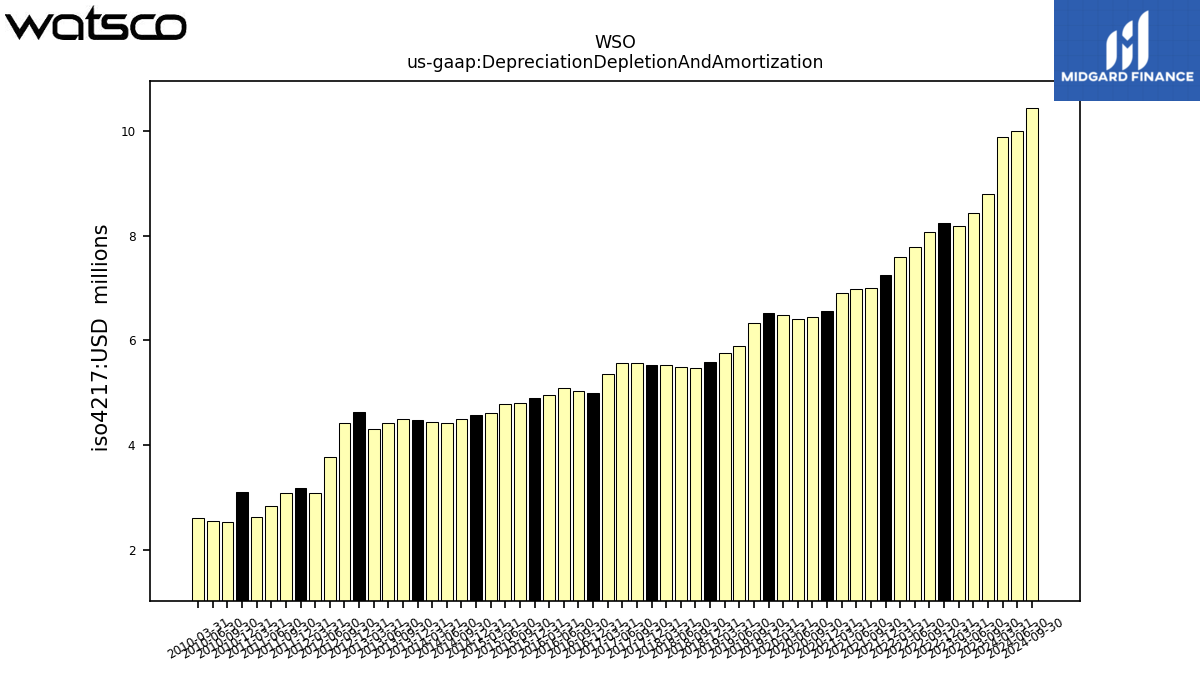
| Depreciation Depletion And Amortization | 9.88 | 9.68 | 8.79 | 8.43 | 8.18 | 8.24 | 8.06 | 7.78 | 7.59 | 7.25 | 7.00 | 6.98 | 6.90 | 6.56 | 6.45 | 6.42 | 6.48 | 6.53 | 6.33 | 5.89 | 5.77 | 5.59 | 5.47 | 5.49 | 5.54 | 5.52 | 5.58 | 5.57 | 5.37 | 4.99 | 5.04 | 5.09 | 4.96 | 4.90 | 4.81 | 4.79 | 4.62 | 4.58 | 4.50 | 4.41 | 4.43 | 4.48 | 4.50 | 4.42 | 4.30 | 4.63 | 4.42 | 3.78 | 3.08 | 3.18 | 3.09 | 2.84 | 2.62 | 3.10 | 2.52 | 2.55 | 2.60 | |
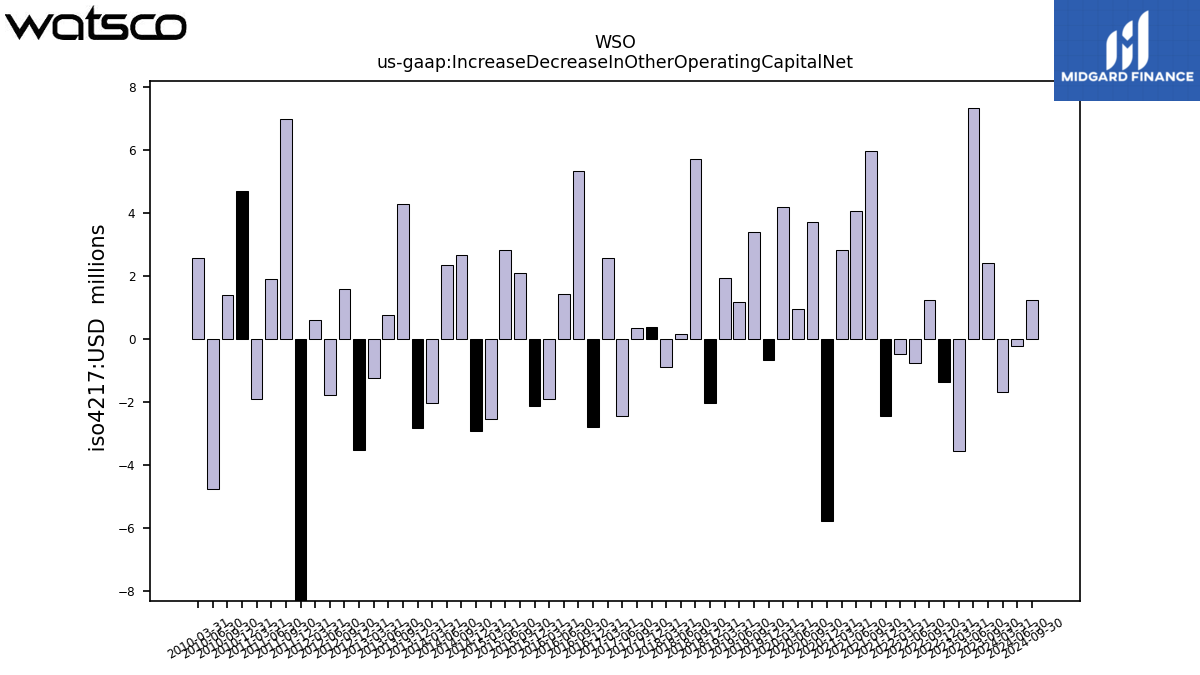
| Increase Decrease In Other Operating Capital Net | -1.69 | -19.88 | 2.41 | 7.35 | -3.54 | -1.34 | 1.24 | -0.76 | -0.47 | -2.43 | 5.97 | 4.07 | 2.83 | -5.76 | 3.73 | 0.97 | 4.22 | -0.67 | 3.40 | 1.18 | 1.96 | -2.01 | 5.74 | 0.16 | -0.89 | 0.38 | 0.36 | -2.43 | 2.58 | -2.80 | 5.33 | 1.43 | -1.90 | -2.12 | 2.10 | 2.85 | -2.55 | -2.90 | 2.69 | 2.35 | -2.04 | -2.81 | 4.28 | 0.77 | -1.23 | -3.52 | 1.60 | -1.76 | 0.60 | -9.73 | 6.98 | 1.93 | -1.90 | 4.72 | 1.39 | -4.77 | 2.57 | |
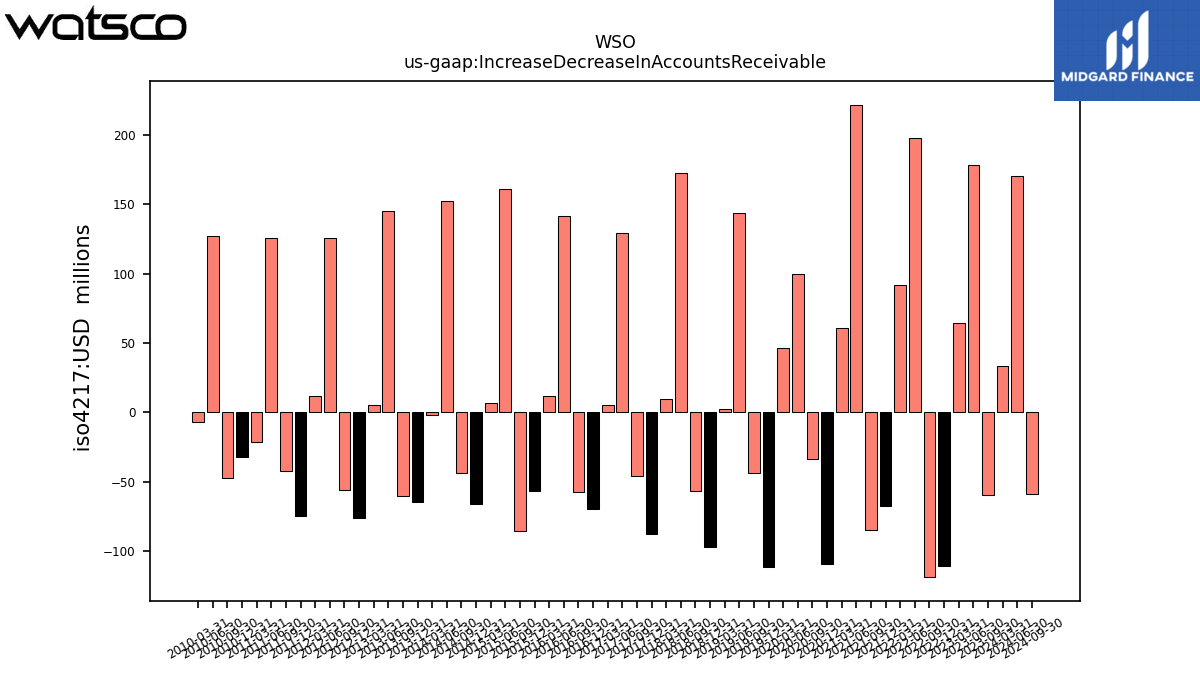
| Increase Decrease In Accounts Receivable | 33.50 | -148.07 | -59.33 | 178.75 | 64.69 | -110.59 | -118.73 | 197.70 | 91.78 | -67.60 | -85.07 | 222.00 | 61.07 | -109.46 | -33.49 | 99.98 | 46.53 | -111.27 | -43.63 | 144.11 | 2.33 | -97.35 | -56.92 | 173.05 | 10.06 | -87.72 | -45.56 | 129.27 | 5.68 | -69.75 | -57.01 | 141.77 | 11.93 | -56.67 | -85.55 | 161.46 | 6.88 | -65.82 | -43.87 | 152.75 | -1.99 | -64.36 | -60.43 | 145.26 | 5.38 | -76.04 | -56.09 | 125.65 | 12.23 | -74.53 | -42.26 | 126.01 | -21.21 | -31.78 | -47.46 | 127.22 | -6.72 | |
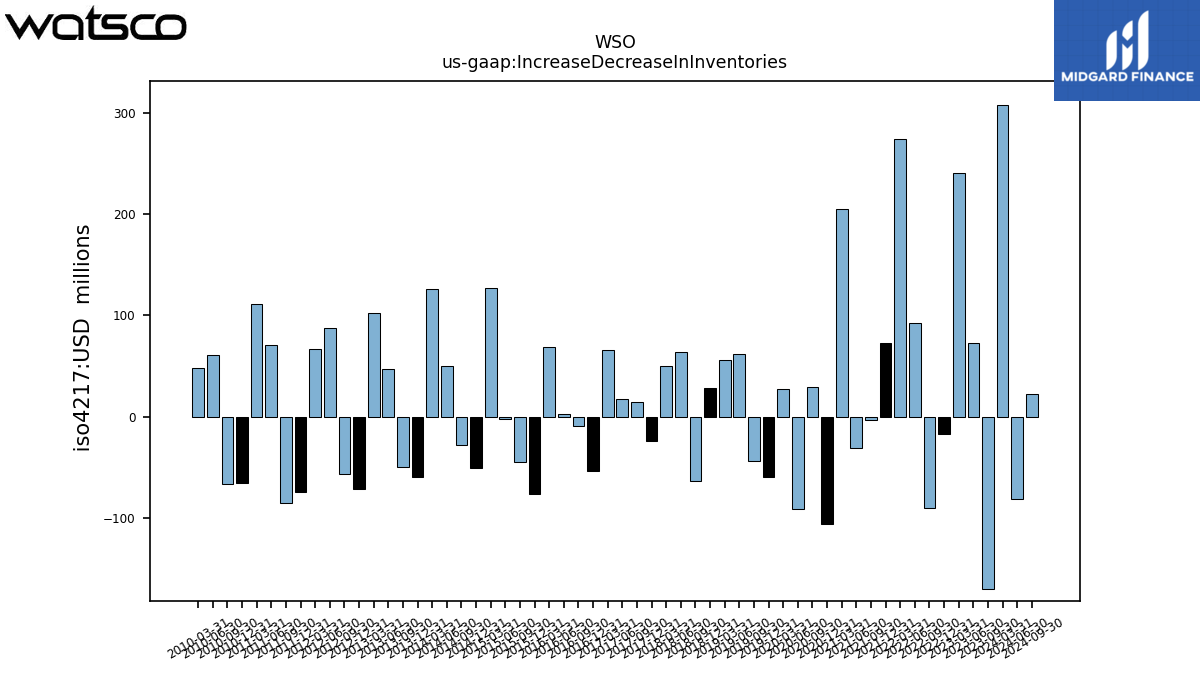
| Increase Decrease In Inventories | 307.22 | -208.37 | -169.89 | 72.88 | 240.76 | -16.79 | -89.71 | 92.66 | 273.70 | 73.00 | -2.88 | -31.05 | 204.59 | -105.48 | 28.98 | -90.71 | 27.28 | -58.92 | -43.14 | 62.03 | 55.56 | 28.39 | -63.27 | 63.89 | 49.94 | -24.28 | 14.16 | 17.42 | 66.10 | -53.75 | -8.89 | 3.25 | 69.12 | -76.51 | -44.31 | -2.42 | 126.90 | -50.34 | -27.50 | 50.27 | 126.32 | -59.08 | -49.20 | 46.74 | 102.12 | -71.35 | -56.24 | 87.16 | 67.08 | -74.13 | -85.19 | 70.90 | 110.91 | -64.84 | -65.78 | 61.02 | 48.16 | |
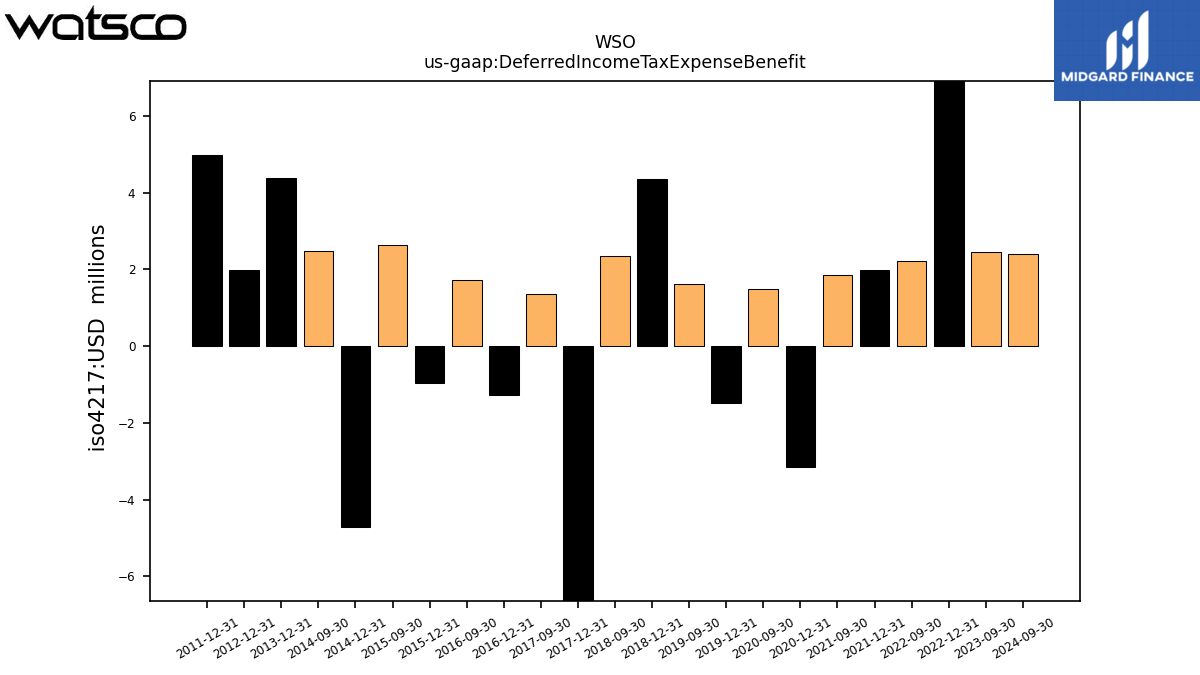
| Deferred Income Tax Expense Benefit | NA | -13.07 | 2.45 | NA | NA | 7.16 | 2.21 | NA | NA | 1.97 | 1.85 | NA | NA | -3.14 | 1.50 | NA | NA | -1.49 | 1.61 | NA | NA | 4.37 | 2.36 | NA | NA | -14.84 | 1.36 | NA | NA | -1.26 | 1.72 | NA | NA | -0.95 | 2.62 | NA | NA | -4.70 | 2.49 | NA | NA | 4.38 | NA | NA | NA | 1.98 | NA | NA | NA | 4.98 | NA | NA | NA | NA | NA | NA | NA | |
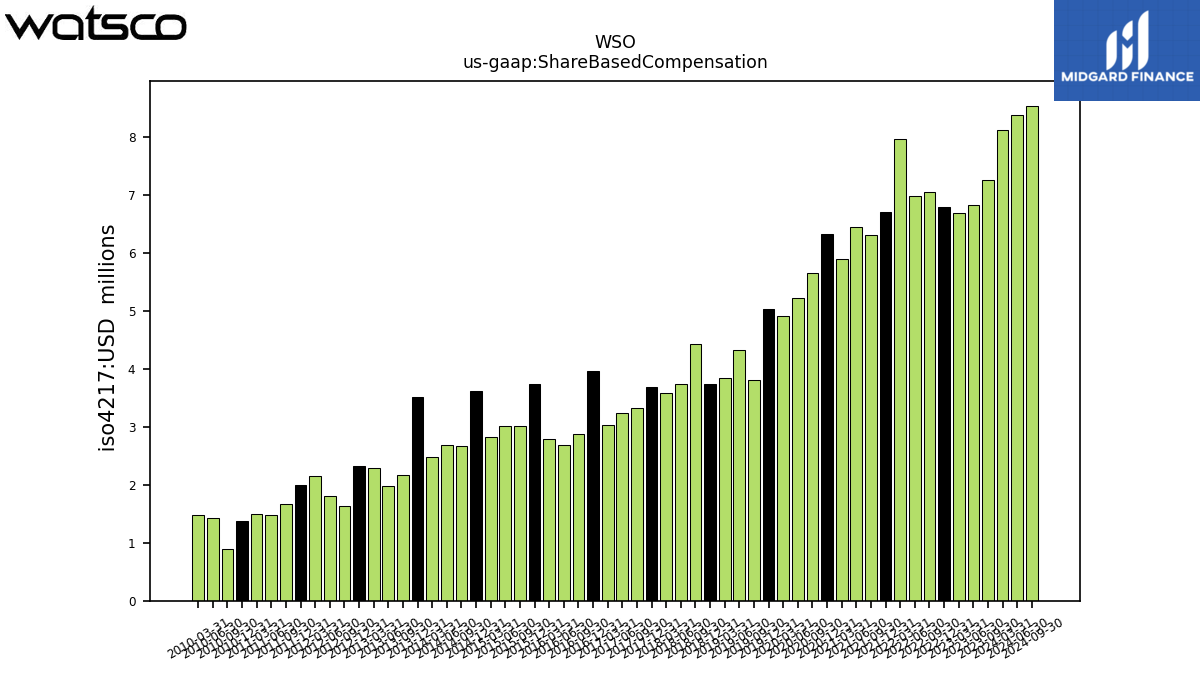
| Share Based Compensation | 8.13 | 9.21 | 7.26 | 6.83 | 6.70 | 6.80 | 7.06 | 6.99 | 7.97 | 6.71 | 6.31 | 6.46 | 5.89 | 6.33 | 5.66 | 5.23 | 4.91 | 5.04 | 3.82 | 4.33 | 3.85 | 3.74 | 4.43 | 3.75 | 3.59 | 3.69 | 3.33 | 3.24 | 3.03 | 3.96 | 2.88 | 2.69 | 2.79 | 3.73 | 3.02 | 3.01 | 2.83 | 3.62 | 2.67 | 2.69 | 2.49 | 3.51 | 2.18 | 1.98 | 2.30 | 2.33 | 1.64 | 1.80 | 2.16 | 2.00 | 1.67 | 1.49 | 1.50 | 1.38 | 0.89 | 1.43 | 1.48 |
| 2024-03-31 | 2023-12-31 | 2023-09-30 | 2023-06-30 | 2023-03-31 | 2022-12-31 | 2022-09-30 | 2022-06-30 | 2022-03-31 | 2021-12-31 | 2021-09-30 | 2021-06-30 | 2021-03-31 | 2020-12-31 | 2020-09-30 | 2020-06-30 | 2020-03-31 | 2019-12-31 | 2019-09-30 | 2019-06-30 | 2019-03-31 | 2018-12-31 | 2018-09-30 | 2018-06-30 | 2018-03-31 | 2017-12-31 | 2017-09-30 | 2017-06-30 | 2017-03-31 | 2016-12-31 | 2016-09-30 | 2016-06-30 | 2016-03-31 | 2015-12-31 | 2015-09-30 | 2015-06-30 | 2015-03-31 | 2014-12-31 | 2014-09-30 | 2014-06-30 | 2014-03-31 | 2013-12-31 | 2013-09-30 | 2013-06-30 | 2013-03-31 | 2012-12-31 | 2012-09-30 | 2012-06-30 | 2012-03-31 | 2011-12-31 | 2011-09-30 | 2011-06-30 | 2011-03-31 | 2010-12-31 | 2010-09-30 | 2010-06-30 | 2010-03-31 | ||
|---|---|---|---|---|---|---|---|---|---|---|---|---|---|---|---|---|---|---|---|---|---|---|---|---|---|---|---|---|---|---|---|---|---|---|---|---|---|---|---|---|---|---|---|---|---|---|---|---|---|---|---|---|---|---|---|---|---|---|
| Net Cash Provided By Used In Investing Activities | -210.97 | -13.29 | -10.46 | -7.15 | -10.44 | -7.43 | -7.52 | -10.67 | -8.22 | -8.45 | -8.67 | -132.69 | 1.22 | -4.79 | -3.56 | -4.13 | -3.85 | -16.04 | -34.19 | -26.70 | -4.10 | -3.97 | -13.60 | -5.31 | -3.43 | -4.02 | -3.45 | NA | NA | NA | NA | NA | NA | NA | NA | NA | NA | NA | NA | NA | -1.67 | -3.56 | -3.89 | -3.84 | -2.96 | 48.89 | -52.30 | -85.07 | -3.81 | -3.19 | -12.40 | -39.42 | -1.64 | -2.85 | -3.11 | -4.51 | 0.33 | |
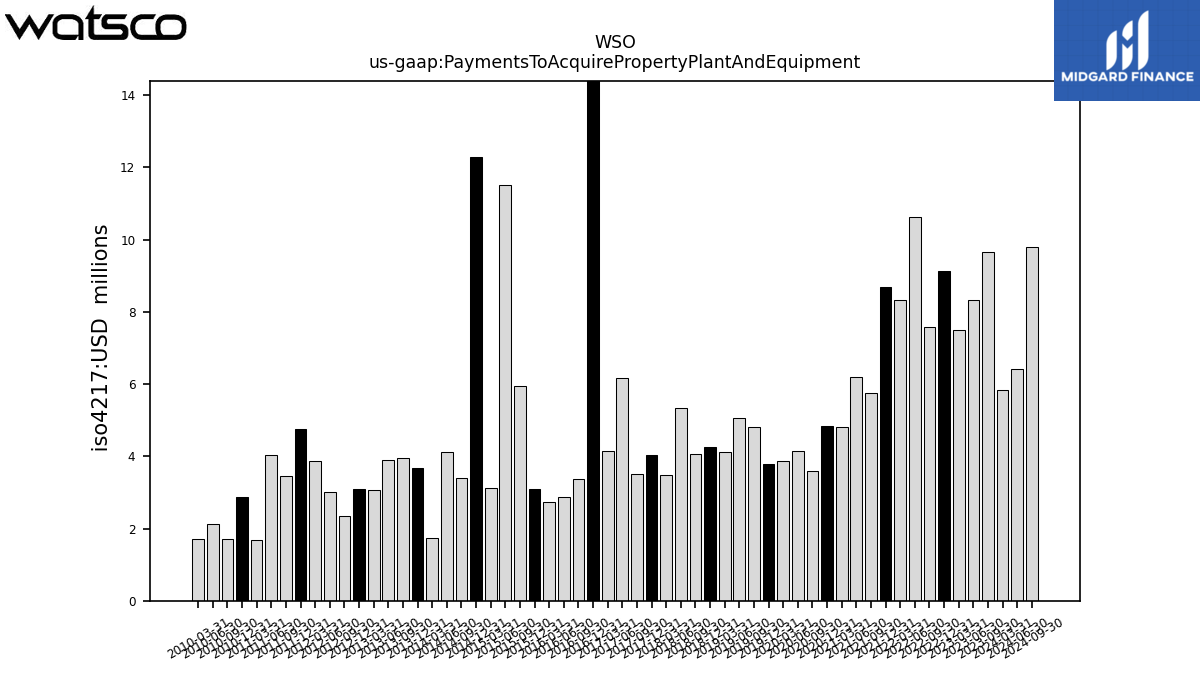
| Payments To Acquire Property Plant And Equipment | 5.84 | 9.98 | 9.67 | 8.33 | 7.50 | 9.13 | 7.57 | 10.63 | 8.32 | 8.69 | 5.76 | 6.19 | 4.82 | 4.83 | 3.59 | 4.16 | 3.86 | 3.80 | 4.81 | 5.07 | 4.13 | 4.26 | 4.07 | 5.33 | 3.49 | 4.05 | 3.52 | 6.17 | 4.15 | 34.59 | 3.37 | 2.88 | 2.74 | 3.10 | 5.96 | 11.52 | 3.11 | 12.28 | 3.39 | 4.11 | 1.74 | 3.67 | 3.95 | 3.90 | 3.07 | 3.09 | 2.34 | 3.01 | 3.88 | 4.75 | 3.45 | 4.04 | 1.69 | 2.88 | 1.70 | 2.13 | 1.71 |
| 2024-03-31 | 2023-12-31 | 2023-09-30 | 2023-06-30 | 2023-03-31 | 2022-12-31 | 2022-09-30 | 2022-06-30 | 2022-03-31 | 2021-12-31 | 2021-09-30 | 2021-06-30 | 2021-03-31 | 2020-12-31 | 2020-09-30 | 2020-06-30 | 2020-03-31 | 2019-12-31 | 2019-09-30 | 2019-06-30 | 2019-03-31 | 2018-12-31 | 2018-09-30 | 2018-06-30 | 2018-03-31 | 2017-12-31 | 2017-09-30 | 2017-06-30 | 2017-03-31 | 2016-12-31 | 2016-09-30 | 2016-06-30 | 2016-03-31 | 2015-12-31 | 2015-09-30 | 2015-06-30 | 2015-03-31 | 2014-12-31 | 2014-09-30 | 2014-06-30 | 2014-03-31 | 2013-12-31 | 2013-09-30 | 2013-06-30 | 2013-03-31 | 2012-12-31 | 2012-09-30 | 2012-06-30 | 2012-03-31 | 2011-12-31 | 2011-09-30 | 2011-06-30 | 2011-03-31 | 2010-12-31 | 2010-09-30 | 2010-06-30 | 2010-03-31 | ||
|---|---|---|---|---|---|---|---|---|---|---|---|---|---|---|---|---|---|---|---|---|---|---|---|---|---|---|---|---|---|---|---|---|---|---|---|---|---|---|---|---|---|---|---|---|---|---|---|---|---|---|---|---|---|---|---|---|---|---|
| Net Cash Provided By Used In Financing Activities | 178.40 | -252.44 | -328.11 | 69.17 | 51.30 | -188.47 | -273.21 | -143.68 | 101.41 | -40.70 | -186.92 | 15.27 | -16.25 | -105.72 | -95.47 | -187.91 | -59.39 | -108.29 | -90.41 | -10.47 | -54.86 | -79.84 | -80.54 | -2.56 | 23.34 | -99.19 | -136.08 | NA | NA | NA | NA | NA | NA | NA | NA | NA | NA | NA | NA | NA | -23.11 | -104.35 | -120.95 | 67.34 | -31.08 | -129.79 | -61.33 | 171.29 | -3.26 | -122.31 | 31.29 | 19.79 | -44.40 | -26.63 | -24.64 | -44.50 | 21.50 | |
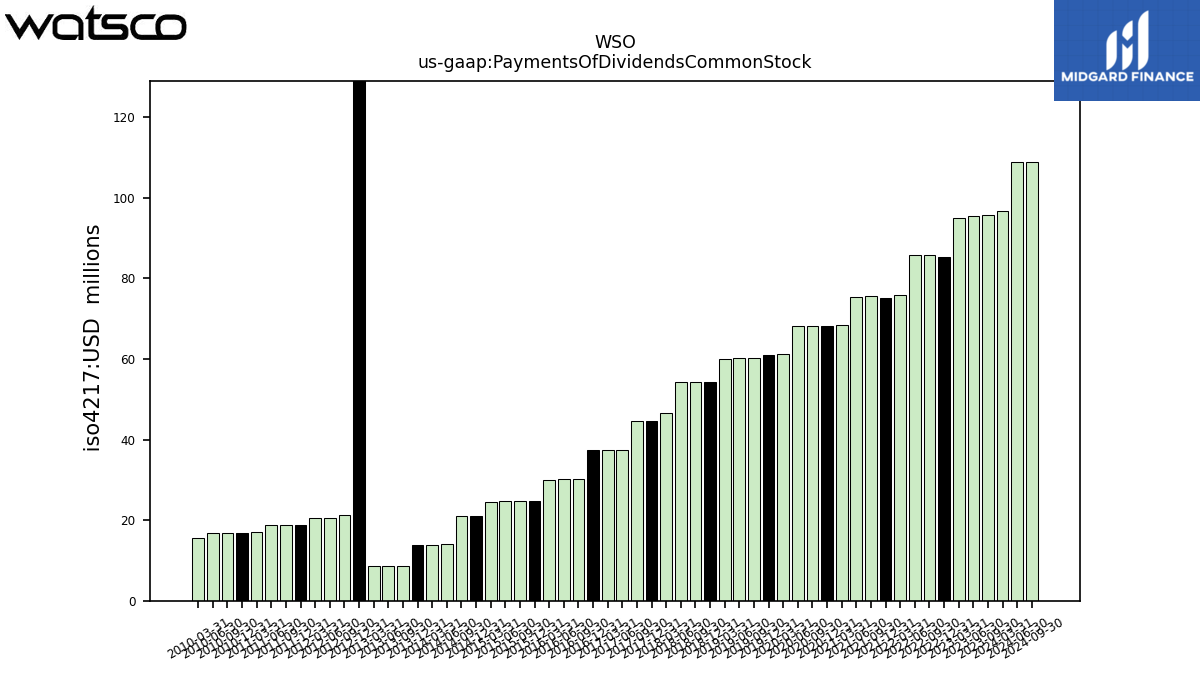
| Payments Of Dividends Common Stock | 96.77 | 96.52 | 95.71 | 95.44 | 94.97 | 85.20 | 85.76 | 85.69 | 75.80 | 75.08 | 75.53 | 75.39 | 68.52 | 68.26 | 68.14 | 68.08 | 61.24 | 60.96 | 60.28 | 60.21 | 59.97 | 54.27 | 54.19 | 54.18 | 46.58 | 44.68 | 44.63 | 37.45 | 37.38 | 37.31 | 30.13 | 30.13 | 30.03 | 24.69 | 24.68 | 24.64 | 24.52 | 20.99 | 20.98 | 13.99 | 13.92 | 13.88 | 8.66 | 8.66 | 8.64 | 193.84 | 21.38 | 20.53 | 20.47 | 18.79 | 18.78 | 18.77 | 16.94 | 16.84 | 16.85 | 16.85 | 15.49 |
| 2024-03-31 | 2023-12-31 | 2023-09-30 | 2023-06-30 | 2023-03-31 | 2022-12-31 | 2022-09-30 | 2022-06-30 | 2022-03-31 | 2021-12-31 | 2021-09-30 | 2021-06-30 | 2021-03-31 | 2020-12-31 | 2020-09-30 | 2020-06-30 | 2020-03-31 | 2019-12-31 | 2019-09-30 | 2019-06-30 | 2019-03-31 | 2018-12-31 | 2018-09-30 | 2018-06-30 | 2018-03-31 | 2017-12-31 | 2017-09-30 | 2017-06-30 | 2017-03-31 | 2016-12-31 | 2016-09-30 | 2016-06-30 | 2016-03-31 | 2015-12-31 | 2015-09-30 | 2015-06-30 | 2015-03-31 | 2014-12-31 | 2014-09-30 | 2014-06-30 | 2014-03-31 | 2013-12-31 | 2013-09-30 | 2013-06-30 | 2013-03-31 | 2012-12-31 | 2012-09-30 | 2012-06-30 | 2012-03-31 | 2011-12-31 | 2011-09-30 | 2011-06-30 | 2011-03-31 | 2010-12-31 | 2010-09-30 | 2010-06-30 | 2010-03-31 | ||
|---|---|---|---|---|---|---|---|---|---|---|---|---|---|---|---|---|---|---|---|---|---|---|---|---|---|---|---|---|---|---|---|---|---|---|---|---|---|---|---|---|---|---|---|---|---|---|---|---|---|---|---|---|---|---|---|---|---|---|
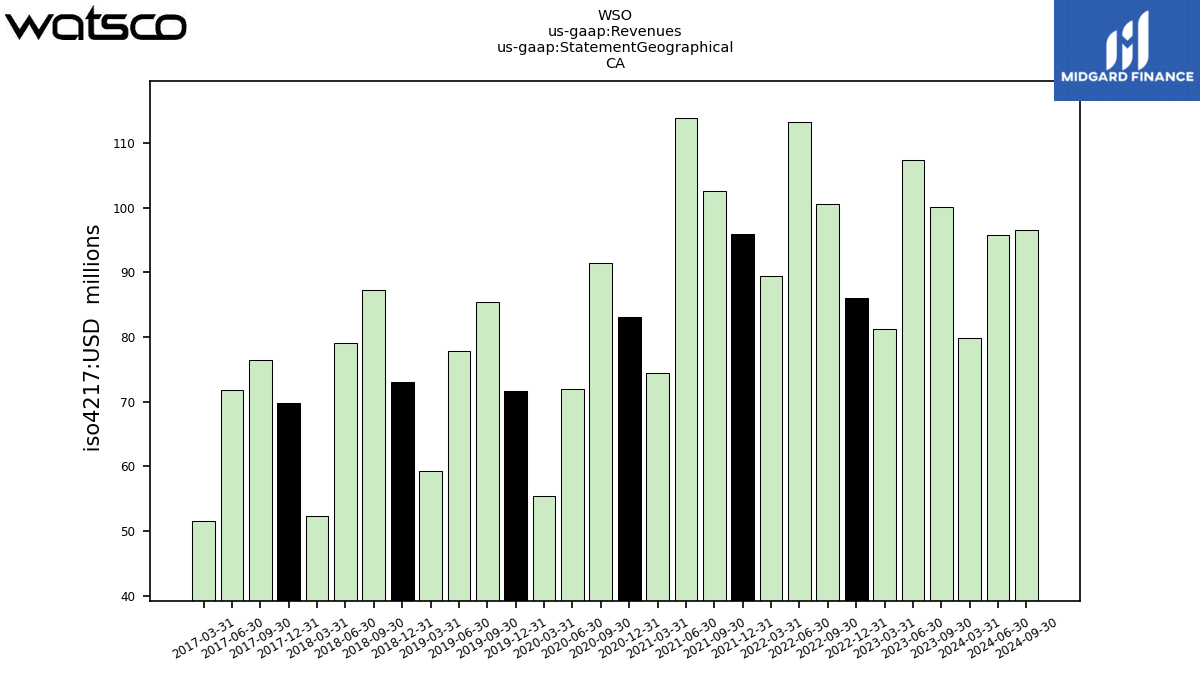
| Revenues | 1564.99 | 1603.20 | 2126.84 | 2003.08 | 1550.64 | 1581.22 | 2035.80 | 2133.76 | 1523.57 | 1511.87 | 1782.57 | 1849.64 | 1136.12 | 1154.72 | 1536.67 | 1355.38 | 1008.16 | 1072.32 | 1394.91 | 1371.85 | 931.28 | 991.33 | 1296.01 | 1332.74 | 926.58 | 964.35 | 1229.59 | 1275.92 | 872.10 | 913.61 | 1241.23 | 1214.43 | 851.42 | 903.82 | 1177.01 | 1223.44 | 808.97 | 876.79 | 1135.00 | 1170.19 | 762.57 | 827.35 | 1081.89 | 1120.45 | 713.63 | 765.54 | 1020.86 | 1011.80 | 633.51 | 645.83 | 914.04 | 883.55 | 534.34 | 657.25 | 812.79 | 864.80 | 509.75 | |
| Supplier Concentration Risk, Carrier And Its Affiliates, Related Party | 18.00 | 22.00 | 34.00 | 32.00 | 22.00 | 21.00 | 26.00 | 29.00 | NA | NA | NA | NA | NA | NA | NA | NA | NA | NA | NA | NA | NA | NA | NA | NA | NA | NA | NA | NA | NA | NA | NA | NA | NA | NA | NA | NA | NA | NA | NA | NA | NA | NA | NA | NA | NA | NA | NA | NA | NA | NA | NA | NA | NA | NA | NA | NA | NA | |
| 79.80 | 86.01 | 100.03 | 107.36 | 81.26 | 85.97 | 100.57 | 113.16 | 89.42 | 95.92 | 102.49 | 113.88 | 74.49 | 83.04 | 91.43 | 71.92 | 55.34 | 71.61 | 85.42 | 77.75 | 59.26 | 72.95 | 87.25 | 79.12 | 52.36 | 69.81 | 76.41 | 71.85 | 51.53 | NA | NA | NA | NA | NA | NA | NA | NA | NA | NA | NA | NA | NA | NA | NA | NA | NA | NA | NA | NA | NA | NA | NA | NA | NA | NA | NA | NA | ||
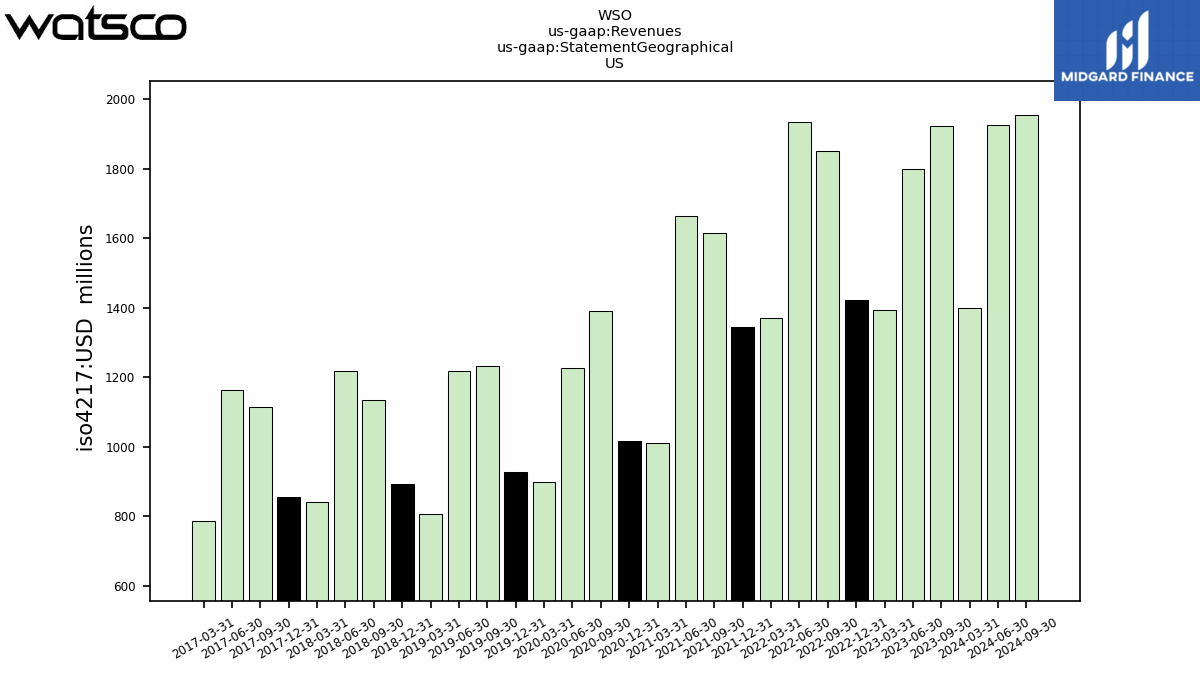
| US | 1398.69 | 1422.06 | 1924.56 | 1799.03 | 1395.00 | 1422.05 | 1851.07 | 1934.43 | 1371.34 | 1345.09 | 1615.32 | 1665.25 | 1011.27 | 1017.73 | 1391.34 | 1226.65 | 899.54 | 925.92 | 1232.56 | 1219.21 | 806.51 | 892.91 | 1134.85 | 1217.38 | 840.27 | 855.50 | 1114.16 | 1163.74 | 786.28 | NA | NA | NA | NA | NA | NA | NA | NA | NA | NA | NA | NA | NA | NA | NA | NA | NA | NA | NA | NA | NA | NA | NA | NA | NA | NA | NA | NA | |
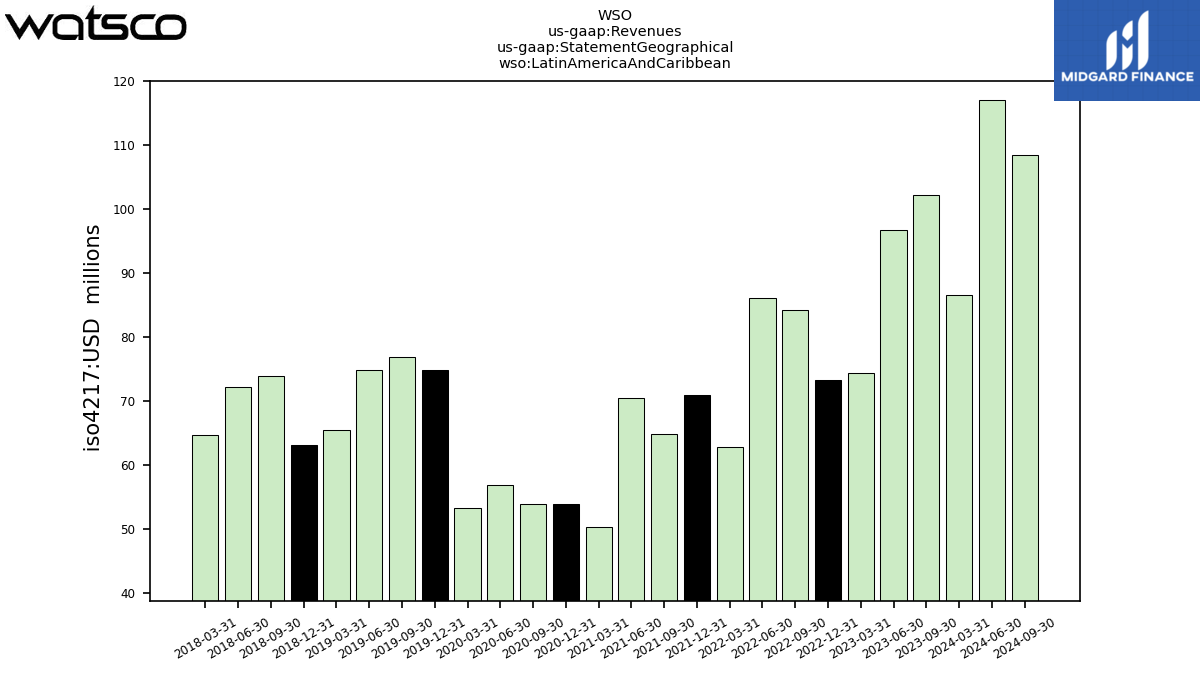
| Latin America And Caribbean | 86.51 | 95.14 | 102.26 | 96.69 | 74.37 | 73.20 | 84.16 | 86.16 | 62.81 | 70.86 | 64.76 | 70.51 | 50.36 | 53.95 | 53.90 | 56.82 | 53.27 | 74.78 | 76.93 | 74.89 | 65.51 | 63.13 | 73.90 | 72.16 | 64.72 | NA | NA | NA | NA | NA | NA | NA | NA | NA | NA | NA | NA | NA | NA | NA | NA | NA | NA | NA | NA | NA | NA | NA | NA | NA | NA | NA | NA | NA | NA | NA | NA |

