
| 2023-12-31 | 2023-09-30 | 2023-06-30 | 2023-03-31 | 2022-12-31 | 2022-09-30 | 2022-06-30 | 2022-03-31 | 2021-12-31 | 2021-09-30 | 2021-06-30 | 2021-03-31 | 2020-12-31 | 2020-09-30 | 2020-06-30 | 2020-03-31 | 2019-12-31 | 2019-09-30 | 2019-06-30 | 2019-03-31 | 2018-12-31 | 2018-09-30 | 2018-06-30 | 2018-03-31 | 2017-12-31 | 2017-09-30 | 2017-06-30 | 2017-03-31 | 2016-12-31 | 2016-09-30 | 2016-06-30 | 2016-03-31 | 2015-12-31 | 2015-09-30 | 2015-06-30 | 2015-03-31 | 2014-12-31 | 2014-09-30 | 2014-06-30 | 2014-03-31 | 2013-12-31 | 2013-09-30 | 2013-06-30 | 2013-03-31 | 2012-12-31 | 2012-09-30 | 2012-06-30 | 2012-03-31 | 2011-12-31 | 2011-09-30 | 2011-06-30 | 2011-03-31 | 2010-12-31 | 2010-09-30 | 2010-06-30 | 2010-03-31 | ||
|---|---|---|---|---|---|---|---|---|---|---|---|---|---|---|---|---|---|---|---|---|---|---|---|---|---|---|---|---|---|---|---|---|---|---|---|---|---|---|---|---|---|---|---|---|---|---|---|---|---|---|---|---|---|---|---|---|---|
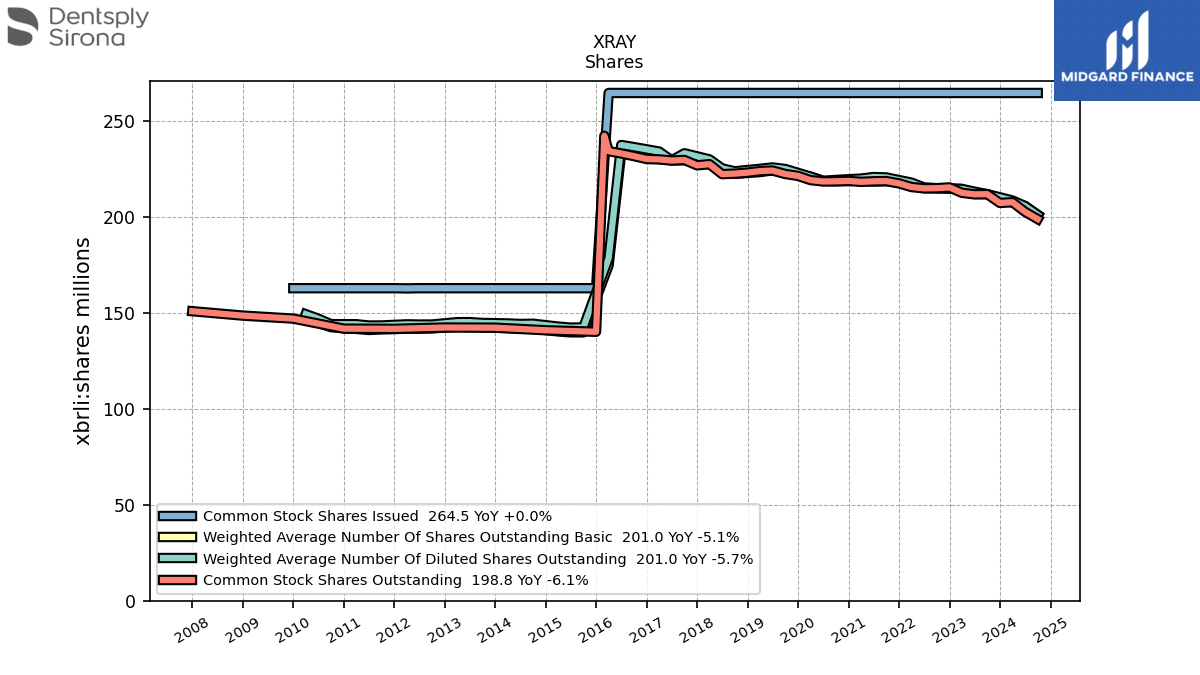
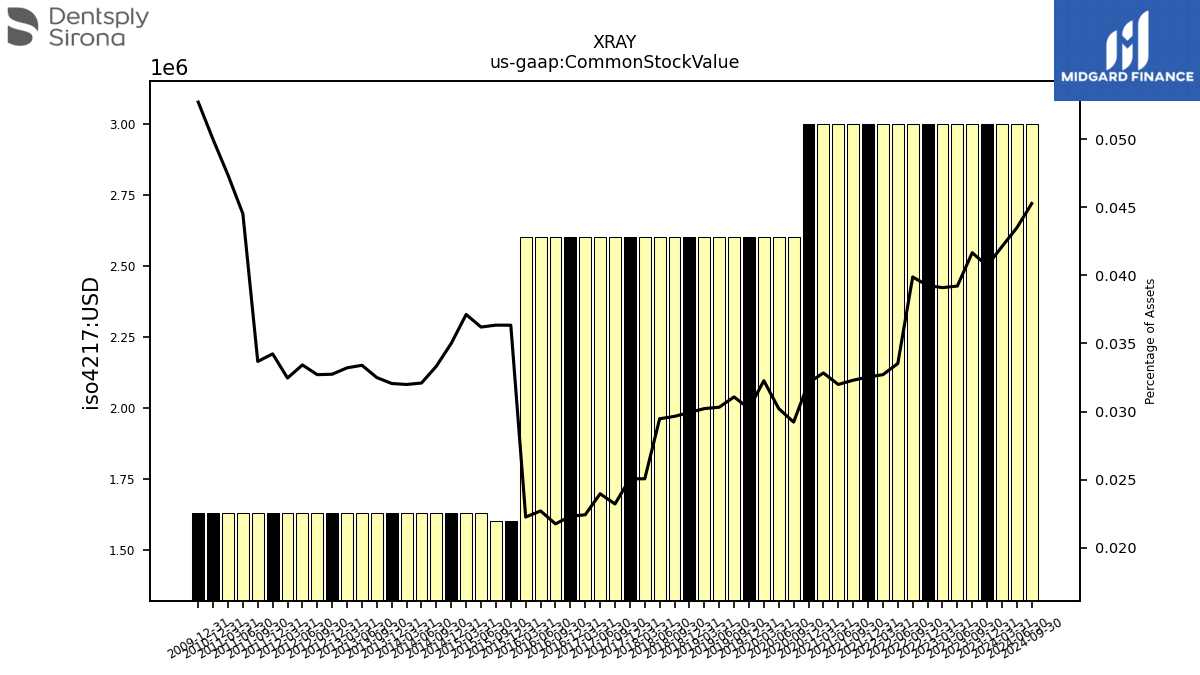
| Common Stock Value | 3.00 | 3.00 | 3.00 | 3.00 | 3.00 | 3.00 | 3.00 | 3.00 | 3.00 | 3.00 | 3.00 | 3.00 | 3.00 | 2.60 | 2.60 | 2.60 | 2.60 | 2.60 | 2.60 | 2.60 | 2.60 | 2.60 | 2.60 | 2.60 | 2.60 | 2.60 | 2.60 | 2.60 | 2.60 | 2.60 | 2.60 | 2.60 | 1.60 | 1.60 | 1.63 | 1.63 | 1.63 | 1.63 | 1.63 | 1.63 | 1.63 | 1.63 | 1.63 | 1.63 | 1.63 | 1.63 | 1.63 | 1.63 | 1.63 | 1.63 | 1.63 | 1.63 | 1.63 | NA | NA | NA | |
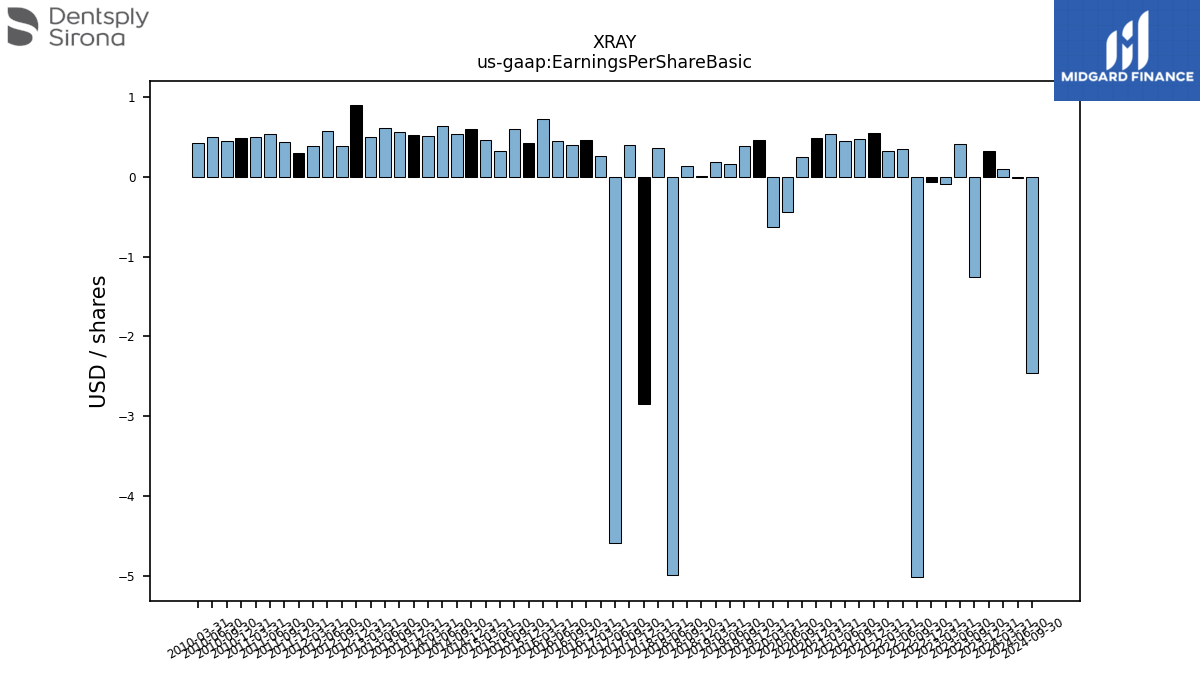
| Earnings Per Share Basic | 0.32 | -1.25 | 0.41 | -0.09 | -0.07 | -5.01 | 0.34 | 0.32 | 0.55 | 0.47 | 0.45 | 0.53 | 0.48 | 0.25 | -0.44 | -0.63 | 0.46 | 0.38 | 0.16 | 0.18 | 0.01 | 0.13 | -4.98 | 0.36 | -2.85 | 0.39 | -4.58 | 0.26 | 0.46 | 0.40 | 0.45 | 0.72 | 0.42 | 0.60 | 0.32 | 0.46 | 0.60 | 0.53 | 0.63 | 0.51 | 0.52 | 0.56 | 0.61 | 0.50 | 0.90 | 0.38 | 0.57 | 0.38 | 0.29 | 0.43 | 0.53 | 0.49 | 0.48 | 0.45 | 0.50 | 0.42 | |
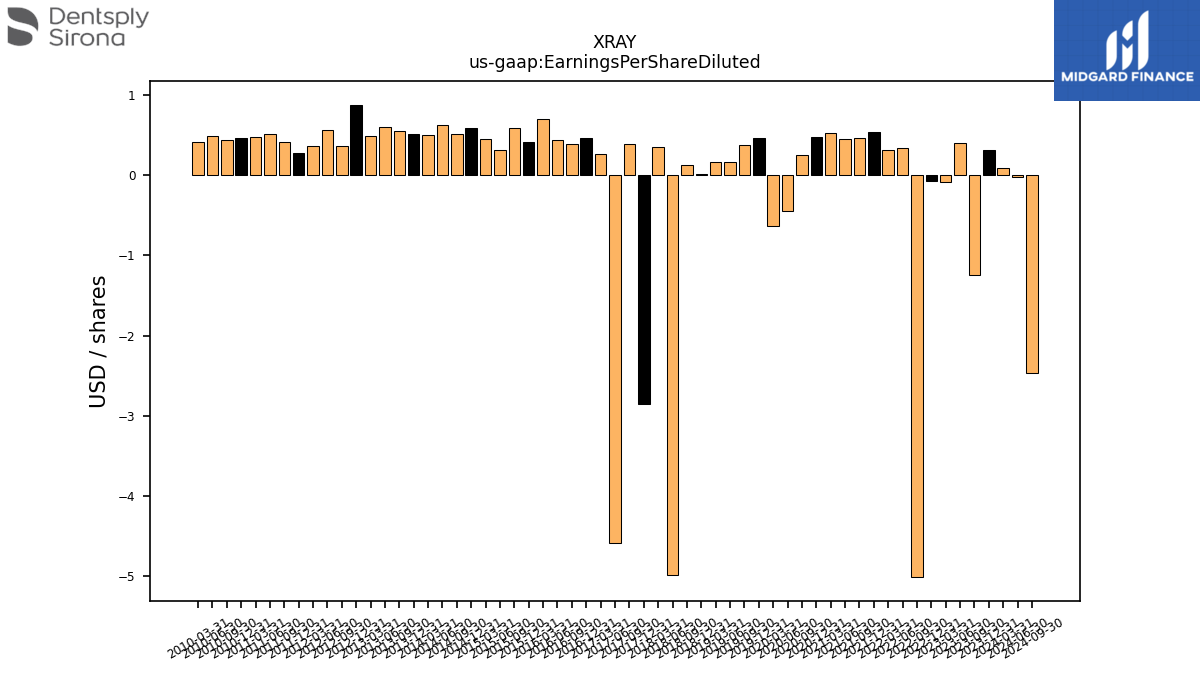
| Earnings Per Share Diluted | 0.32 | -1.25 | 0.40 | -0.09 | -0.07 | -5.01 | 0.34 | 0.32 | 0.54 | 0.47 | 0.45 | 0.53 | 0.48 | 0.25 | -0.44 | -0.63 | 0.46 | 0.38 | 0.16 | 0.17 | 0.01 | 0.13 | -4.98 | 0.35 | -2.85 | 0.39 | -4.58 | 0.26 | 0.46 | 0.39 | 0.44 | 0.70 | 0.41 | 0.59 | 0.31 | 0.45 | 0.59 | 0.52 | 0.62 | 0.50 | 0.51 | 0.55 | 0.60 | 0.49 | 0.88 | 0.37 | 0.56 | 0.37 | 0.28 | 0.42 | 0.52 | 0.48 | 0.47 | 0.44 | 0.49 | 0.41 |
| 2023-12-31 | 2023-09-30 | 2023-06-30 | 2023-03-31 | 2022-12-31 | 2022-09-30 | 2022-06-30 | 2022-03-31 | 2021-12-31 | 2021-09-30 | 2021-06-30 | 2021-03-31 | 2020-12-31 | 2020-09-30 | 2020-06-30 | 2020-03-31 | 2019-12-31 | 2019-09-30 | 2019-06-30 | 2019-03-31 | 2018-12-31 | 2018-09-30 | 2018-06-30 | 2018-03-31 | 2017-12-31 | 2017-09-30 | 2017-06-30 | 2017-03-31 | 2016-12-31 | 2016-09-30 | 2016-06-30 | 2016-03-31 | 2015-12-31 | 2015-09-30 | 2015-06-30 | 2015-03-31 | 2014-12-31 | 2014-09-30 | 2014-06-30 | 2014-03-31 | 2013-12-31 | 2013-09-30 | 2013-06-30 | 2013-03-31 | 2012-12-31 | 2012-09-30 | 2012-06-30 | 2012-03-31 | 2011-12-31 | 2011-09-30 | 2011-06-30 | 2011-03-31 | 2010-12-31 | 2010-09-30 | 2010-06-30 | 2010-03-31 | ||
|---|---|---|---|---|---|---|---|---|---|---|---|---|---|---|---|---|---|---|---|---|---|---|---|---|---|---|---|---|---|---|---|---|---|---|---|---|---|---|---|---|---|---|---|---|---|---|---|---|---|---|---|---|---|---|---|---|---|
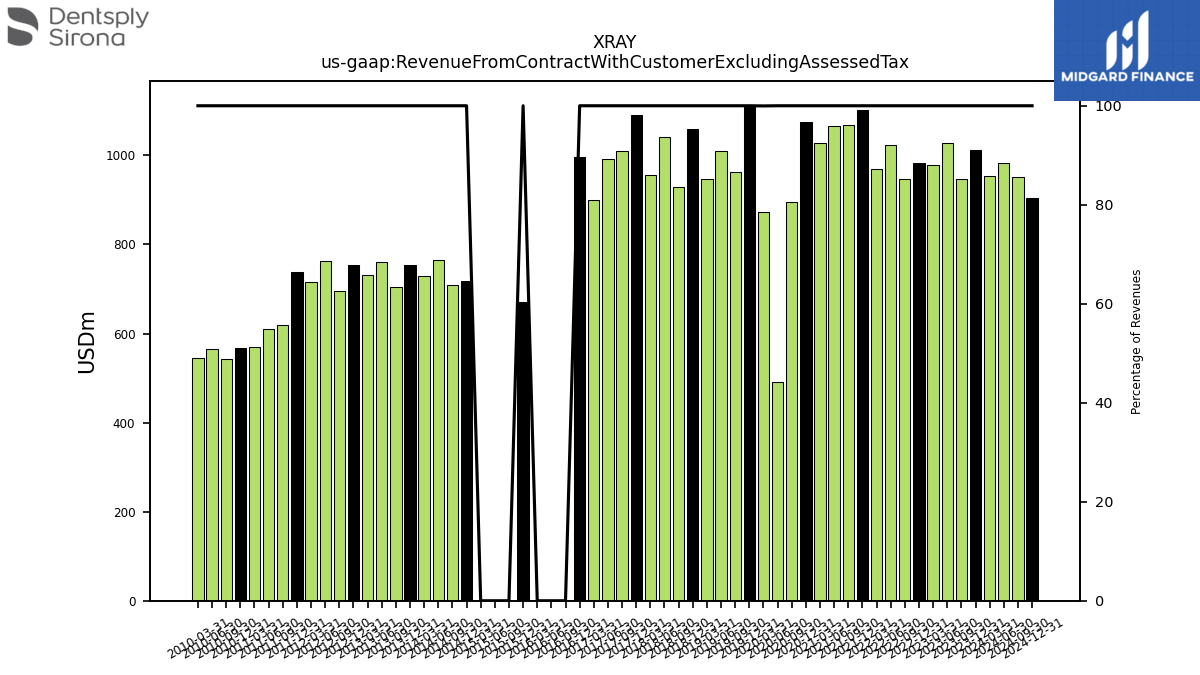
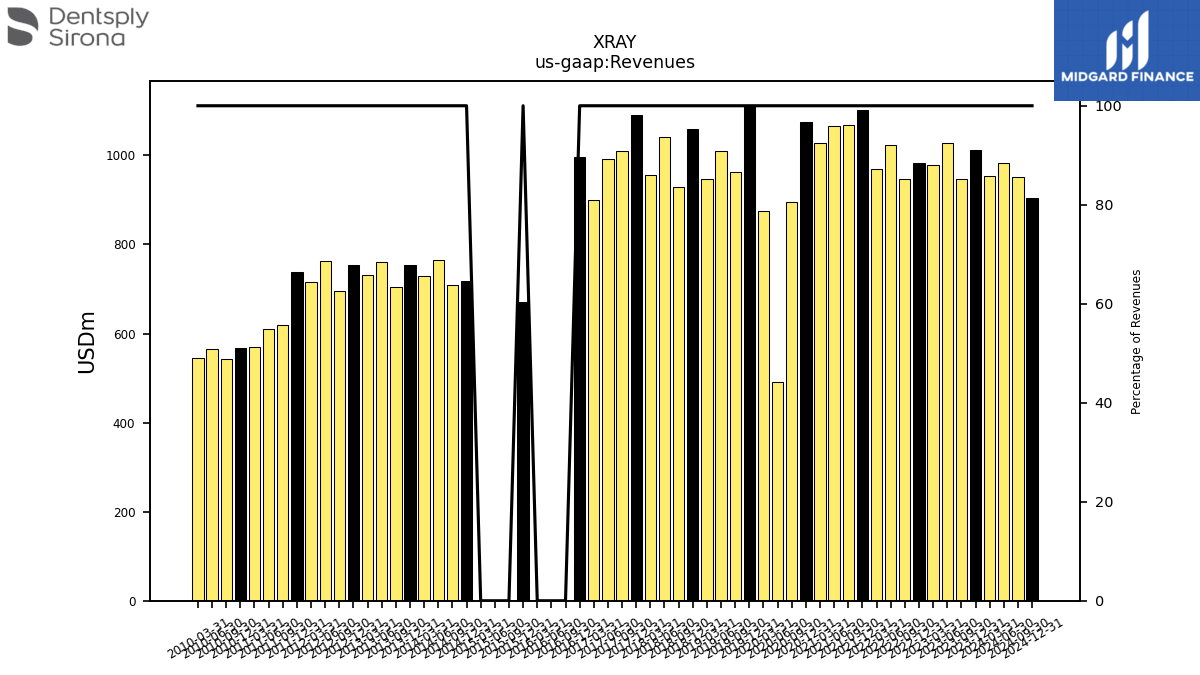
| Revenue From Contract With Customer Excluding Assessed Tax | 1012.00 | 947.00 | 1028.00 | 978.00 | 983.00 | 947.00 | 1023.00 | 969.00 | 1103.00 | 1069.00 | 1067.00 | 1027.00 | 1076.00 | 894.80 | 490.60 | 874.00 | 1111.50 | 962.10 | 1009.40 | 946.20 | 1059.70 | 928.40 | 1042.10 | 956.10 | 1091.00 | 1009.20 | 992.70 | 900.50 | 996.50 | 0.00 | 0.00 | 0.00 | 671.10 | 0.00 | 0.00 | 0.00 | 719.04 | 708.24 | 765.23 | 730.11 | 753.66 | 704.02 | 761.01 | 732.08 | 753.29 | 695.73 | 762.99 | 716.41 | 738.01 | 619.76 | 609.44 | 570.50 | 568.17 | 541.82 | 565.09 | 545.94 | |
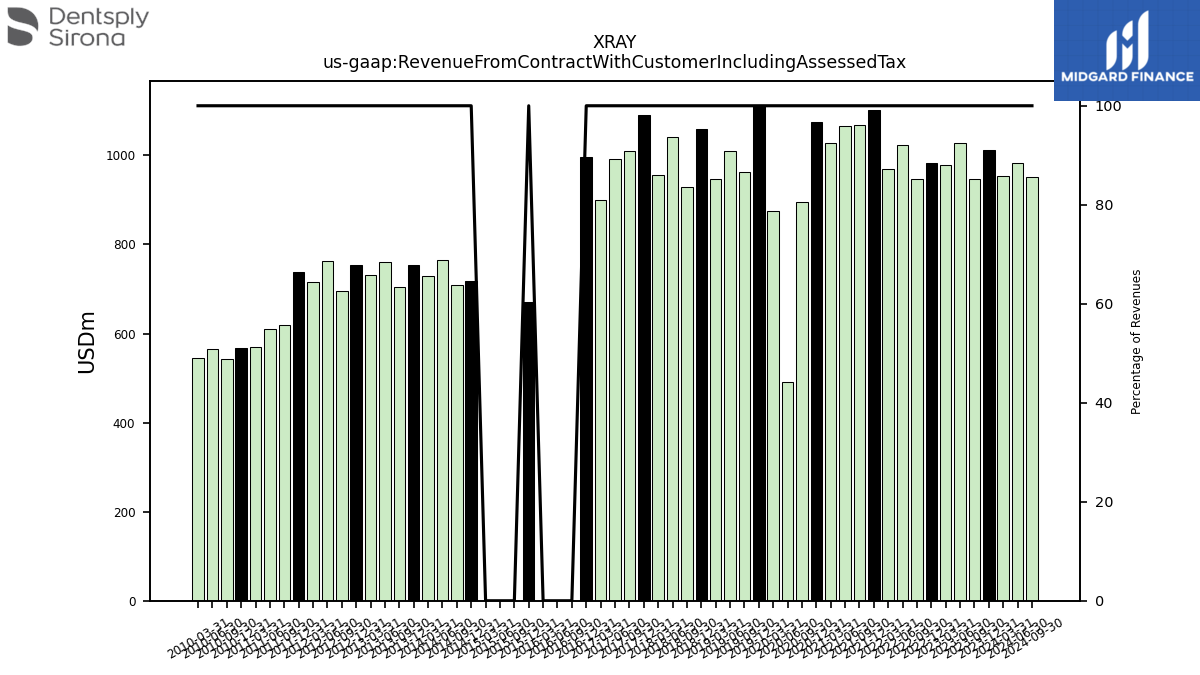
| Revenue From Contract With Customer Including Assessed Tax | 1012.00 | 947.00 | 1028.00 | 978.00 | 983.00 | 947.00 | 1023.00 | 969.00 | 1103.00 | 1069.00 | 1067.00 | 1027.00 | 1076.00 | 894.80 | 490.60 | 874.30 | 1111.50 | 962.10 | 1009.40 | 946.20 | 1059.70 | 928.40 | 1042.10 | 956.10 | 1091.00 | 1009.20 | 992.70 | 900.50 | 996.50 | 0.00 | 0.00 | 0.00 | 671.10 | 0.00 | 0.00 | 0.00 | 719.04 | 708.24 | 765.23 | 730.11 | 753.66 | 704.02 | 761.01 | 732.08 | 753.29 | 695.73 | 762.99 | 716.41 | 738.01 | 619.76 | 609.44 | 570.50 | 568.17 | 541.82 | 565.09 | 545.94 | |
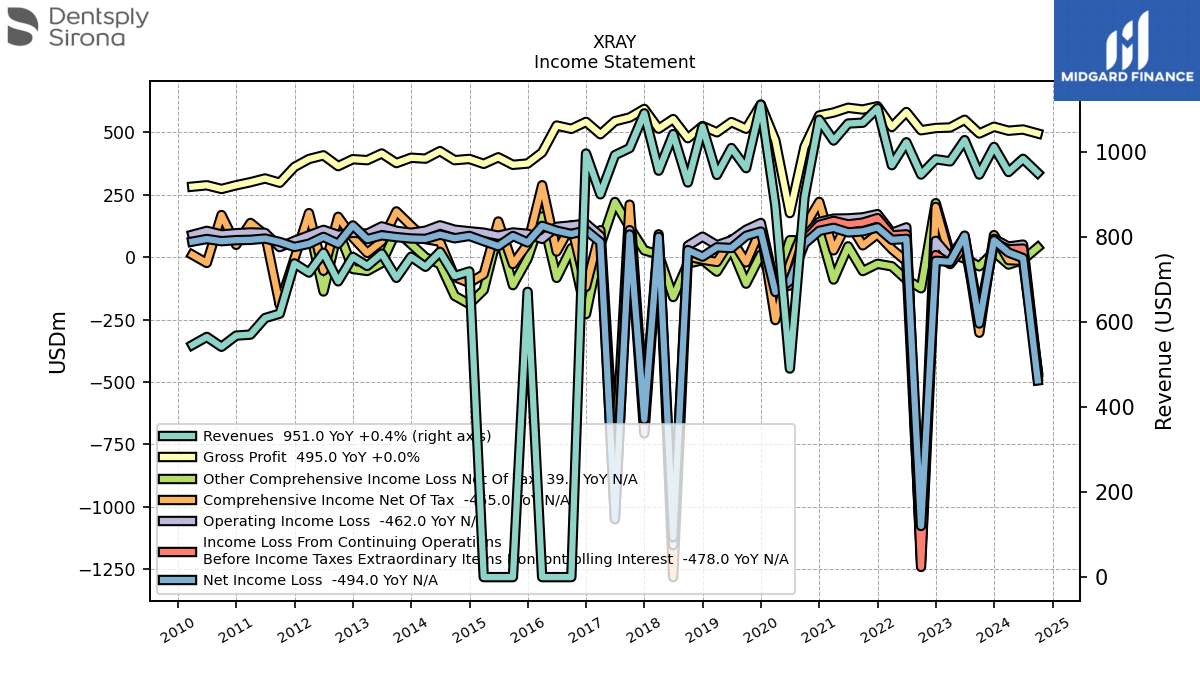
| Revenues | 1012.00 | 947.00 | 1028.00 | 978.00 | 983.00 | 947.00 | 1023.00 | 969.00 | 1103.00 | 1069.00 | 1067.00 | 1027.00 | 1076.00 | 894.80 | 490.60 | 874.30 | 1111.50 | 962.10 | 1009.40 | 946.20 | 1059.70 | 928.40 | 1042.10 | 956.10 | 1091.00 | 1009.20 | 992.70 | 900.50 | 996.50 | 0.00 | 0.00 | 0.00 | 671.10 | 0.00 | 0.00 | 0.00 | 719.04 | 708.24 | 765.23 | 730.11 | 753.66 | 704.02 | 761.01 | 732.08 | 753.29 | 695.73 | 762.99 | 716.41 | 738.01 | 619.76 | 609.44 | 570.50 | 568.17 | 541.82 | 565.09 | 545.94 | |
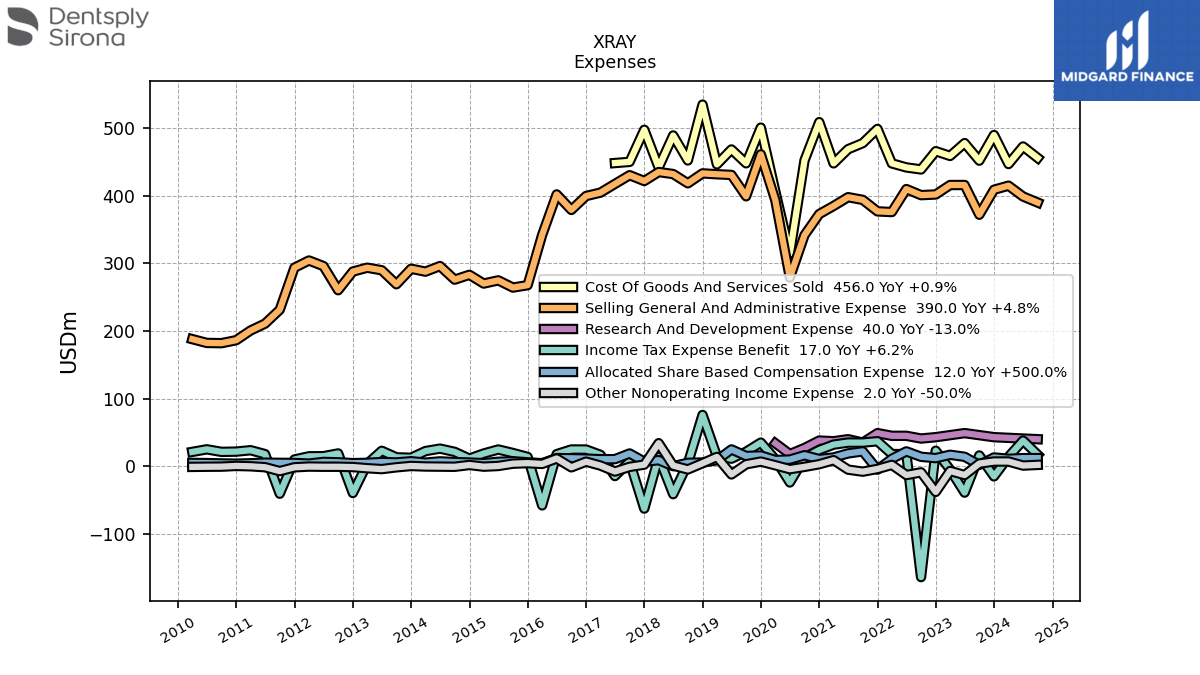
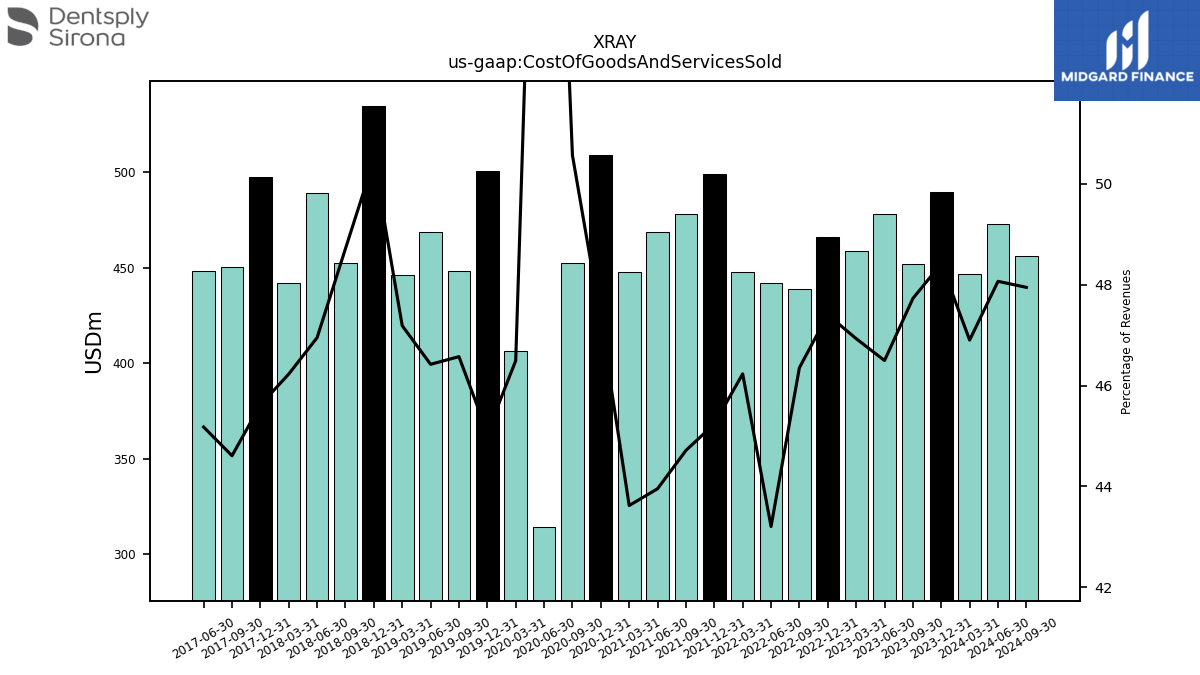
| Cost Of Goods And Services Sold | 490.00 | 452.00 | 478.00 | 459.00 | 466.00 | 439.00 | 442.00 | 448.00 | 499.00 | 478.00 | 469.00 | 448.00 | 509.00 | 452.50 | 314.50 | 406.50 | 500.90 | 448.10 | 468.60 | 446.50 | 534.90 | 452.30 | 489.30 | 442.00 | 497.70 | 450.20 | 448.50 | NA | NA | NA | NA | NA | NA | NA | NA | NA | NA | NA | NA | NA | NA | NA | NA | NA | NA | NA | NA | NA | NA | NA | NA | NA | NA | NA | NA | NA | |
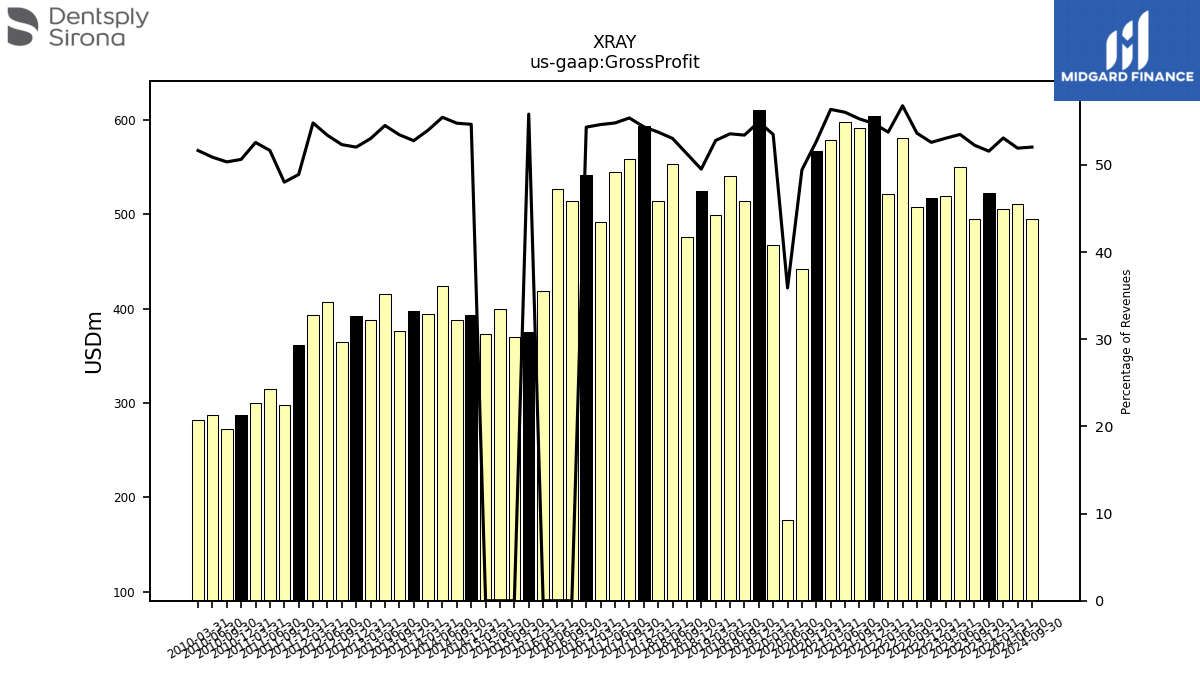
| Gross Profit | 522.00 | 495.00 | 550.00 | 519.00 | 517.00 | 508.00 | 581.00 | 521.00 | 604.00 | 591.00 | 598.00 | 579.00 | 567.00 | 442.30 | 176.10 | 467.80 | 610.60 | 514.00 | 540.80 | 499.70 | 524.80 | 476.10 | 552.80 | 514.10 | 593.30 | 559.00 | 544.20 | 492.00 | 541.50 | 513.60 | 526.90 | 418.90 | 374.70 | 369.50 | 399.66 | 373.37 | 393.05 | 388.06 | 424.47 | 394.20 | 397.84 | 376.42 | 414.96 | 388.20 | 392.05 | 364.12 | 407.47 | 392.75 | 360.96 | 297.65 | 314.85 | 299.98 | 287.71 | 272.81 | 287.60 | 282.04 | |
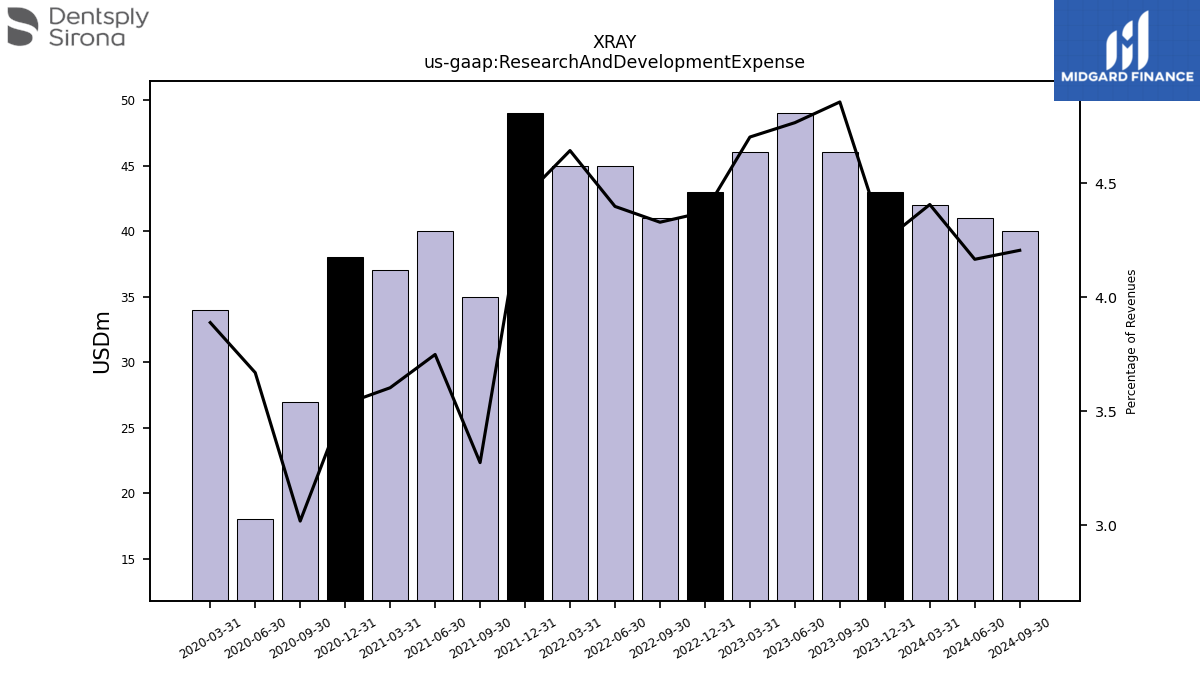
| Research And Development Expense | 43.00 | 46.00 | 49.00 | 46.00 | 43.00 | 41.00 | 45.00 | 45.00 | 49.00 | 35.00 | 40.00 | 37.00 | 38.00 | 27.00 | 18.00 | 34.00 | NA | NA | NA | NA | NA | NA | NA | NA | NA | NA | NA | NA | NA | NA | NA | NA | NA | NA | NA | NA | NA | NA | NA | NA | NA | NA | NA | NA | NA | NA | NA | NA | NA | NA | NA | NA | NA | NA | NA | NA | |
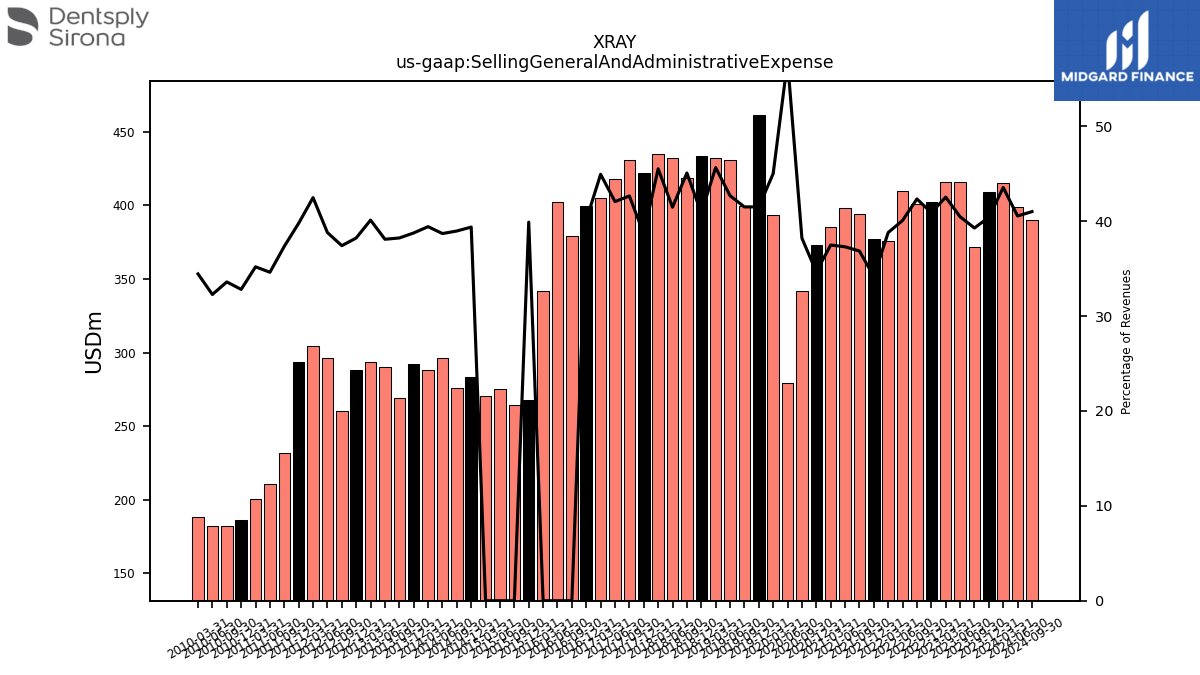
| Selling General And Administrative Expense | 409.00 | 372.00 | 416.00 | 416.00 | 402.00 | 401.00 | 410.00 | 376.00 | 377.00 | 394.00 | 398.00 | 385.00 | 373.00 | 341.90 | 279.10 | 393.50 | 461.40 | 399.30 | 430.90 | 431.90 | 433.20 | 418.50 | 432.20 | 435.20 | 421.90 | 430.50 | 417.60 | 404.70 | 399.70 | 379.10 | 402.10 | 342.10 | 267.80 | 264.30 | 274.98 | 270.23 | 283.16 | 275.98 | 296.12 | 287.84 | 292.13 | 269.17 | 289.92 | 293.68 | 287.99 | 260.35 | 296.03 | 304.35 | 293.60 | 231.49 | 210.98 | 200.77 | 186.43 | 182.06 | 182.38 | 188.03 | |
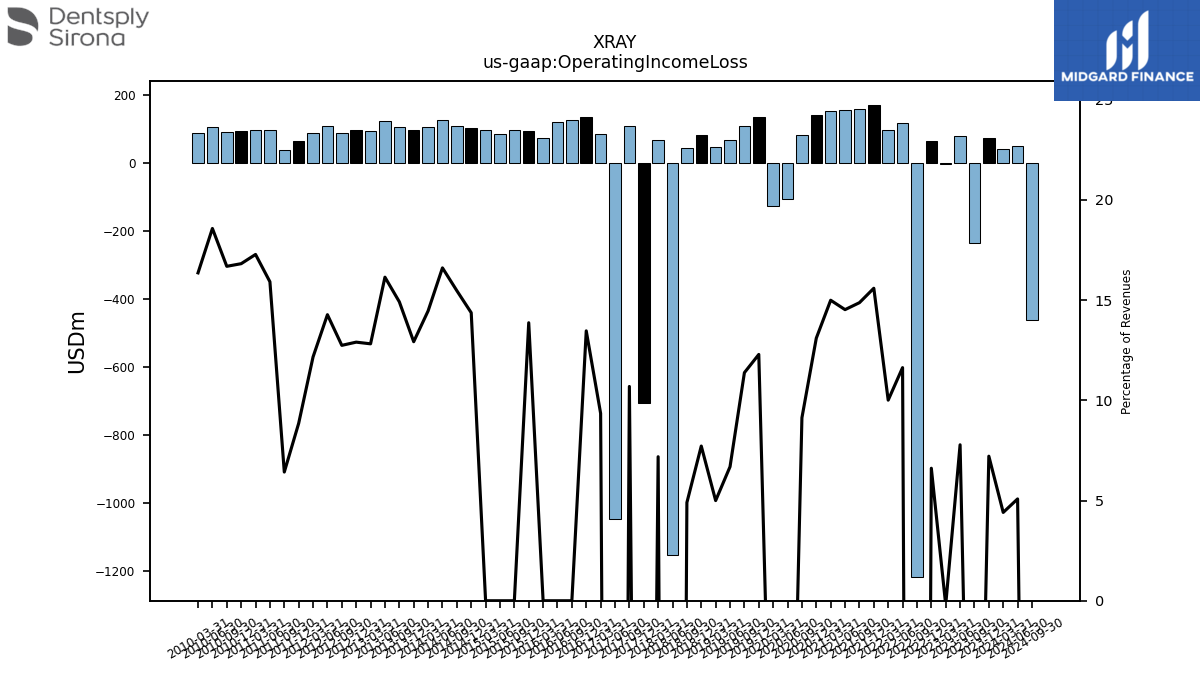
| Operating Income Loss | 73.00 | -236.00 | 80.00 | -2.00 | 65.00 | -1218.00 | 119.00 | 97.00 | 172.00 | 159.00 | 155.00 | 154.00 | 141.00 | 81.70 | -104.30 | -124.80 | 136.60 | 109.50 | 67.50 | 47.30 | 81.80 | 45.50 | -1154.10 | 68.70 | -706.40 | 107.90 | -1048.00 | 84.20 | 134.20 | 126.60 | 121.20 | 72.70 | 93.10 | 98.60 | 85.80 | 97.71 | 103.34 | 109.58 | 127.11 | 105.57 | 97.42 | 105.02 | 122.87 | 93.86 | 97.21 | 88.67 | 108.91 | 87.16 | 65.34 | 39.80 | 97.00 | 98.58 | 95.56 | 90.42 | 104.97 | 89.32 | |
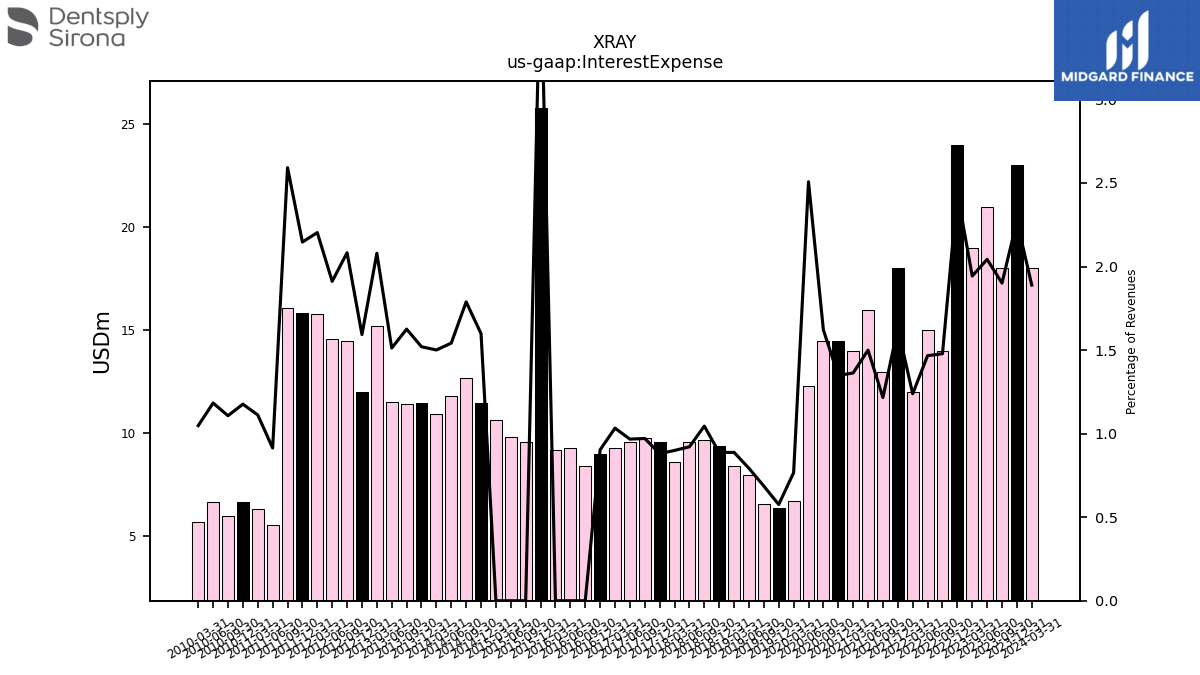
| Interest Expense | 23.00 | 18.00 | 21.00 | 19.00 | 24.00 | 14.00 | 15.00 | 12.00 | 18.00 | 13.00 | 16.00 | 14.00 | 14.50 | 14.50 | 12.30 | 6.70 | 6.40 | 6.60 | 8.00 | 8.40 | 9.40 | 9.70 | 9.60 | 8.60 | 9.60 | 9.80 | 9.60 | 9.30 | 9.00 | 8.40 | 9.30 | 9.20 | 25.80 | 9.60 | 9.82 | 10.67 | 11.49 | 12.66 | 11.80 | 10.96 | 11.46 | 11.44 | 11.51 | 15.22 | 12.00 | 14.49 | 14.58 | 15.78 | 15.84 | 16.06 | 5.57 | 6.34 | 6.68 | 6.00 | 6.69 | 5.72 | |
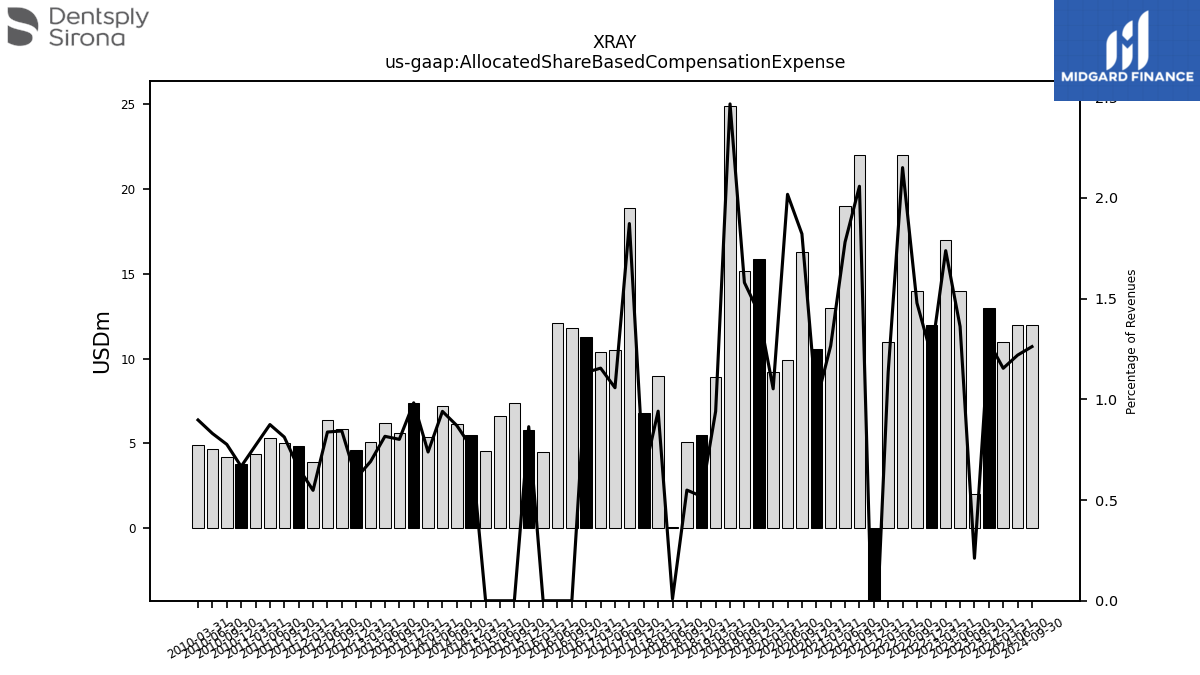
| Allocated Share Based Compensation Expense | 13.00 | 2.00 | 14.00 | 17.00 | 12.00 | 14.00 | 22.00 | 11.00 | -5.00 | 22.00 | 19.00 | 13.00 | 10.60 | 16.30 | 9.90 | 9.20 | 15.90 | 15.20 | 24.90 | 8.90 | 5.50 | 5.10 | 0.10 | 9.00 | 6.80 | 18.90 | 10.50 | 10.40 | 11.30 | 11.80 | 12.10 | 4.50 | 5.80 | 7.40 | 6.60 | 4.58 | 5.49 | 6.16 | 7.20 | 5.39 | 7.41 | 5.64 | 6.21 | 5.06 | 4.58 | 5.87 | 6.39 | 3.93 | 4.86 | 5.04 | 5.33 | 4.40 | 3.79 | 4.21 | 4.69 | 4.90 | |
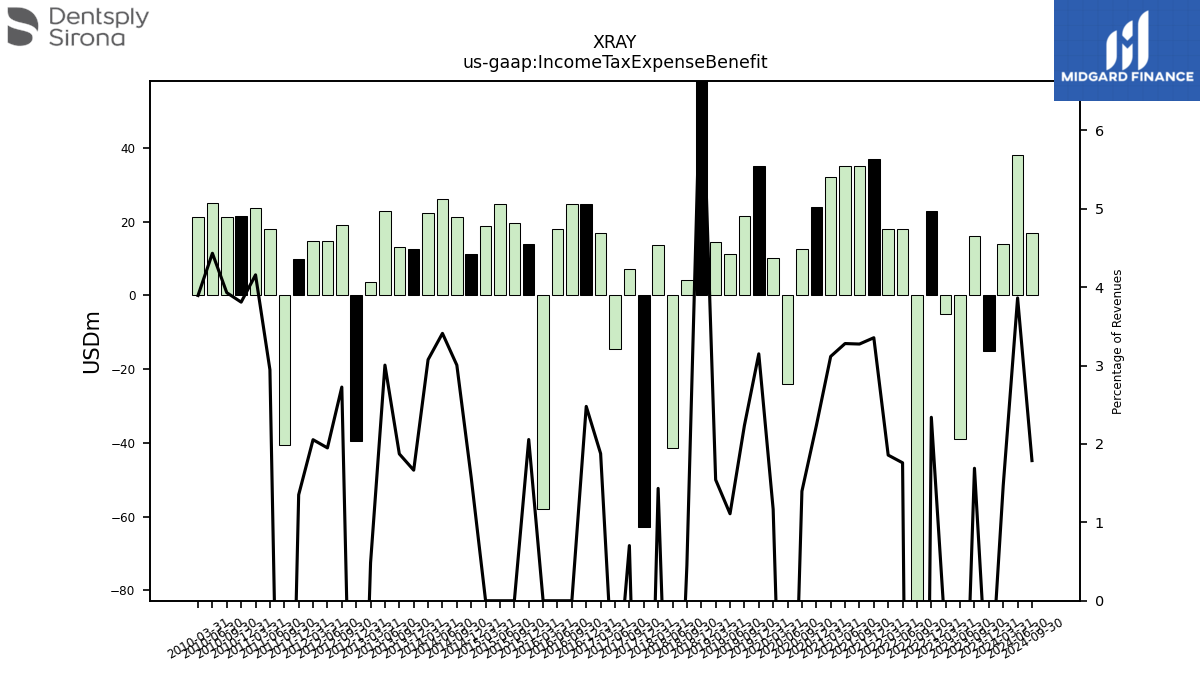
| Income Tax Expense Benefit | -15.00 | 16.00 | -39.00 | -5.00 | 23.00 | -164.00 | 18.00 | 18.00 | 37.00 | 35.00 | 35.00 | 32.00 | 24.00 | 12.50 | -24.00 | 10.20 | 35.00 | 21.50 | 11.20 | 14.60 | 75.90 | 4.20 | -41.30 | 13.70 | -62.70 | 7.10 | -14.50 | 16.90 | 24.70 | 24.80 | 17.90 | -57.90 | 13.80 | 19.60 | 24.77 | 18.85 | 11.29 | 21.28 | 26.10 | 22.45 | 12.55 | 13.19 | 22.87 | 3.54 | -39.63 | 18.96 | 14.88 | 14.71 | 9.97 | -40.63 | 17.96 | 23.71 | 21.64 | 21.29 | 25.04 | 21.25 | |
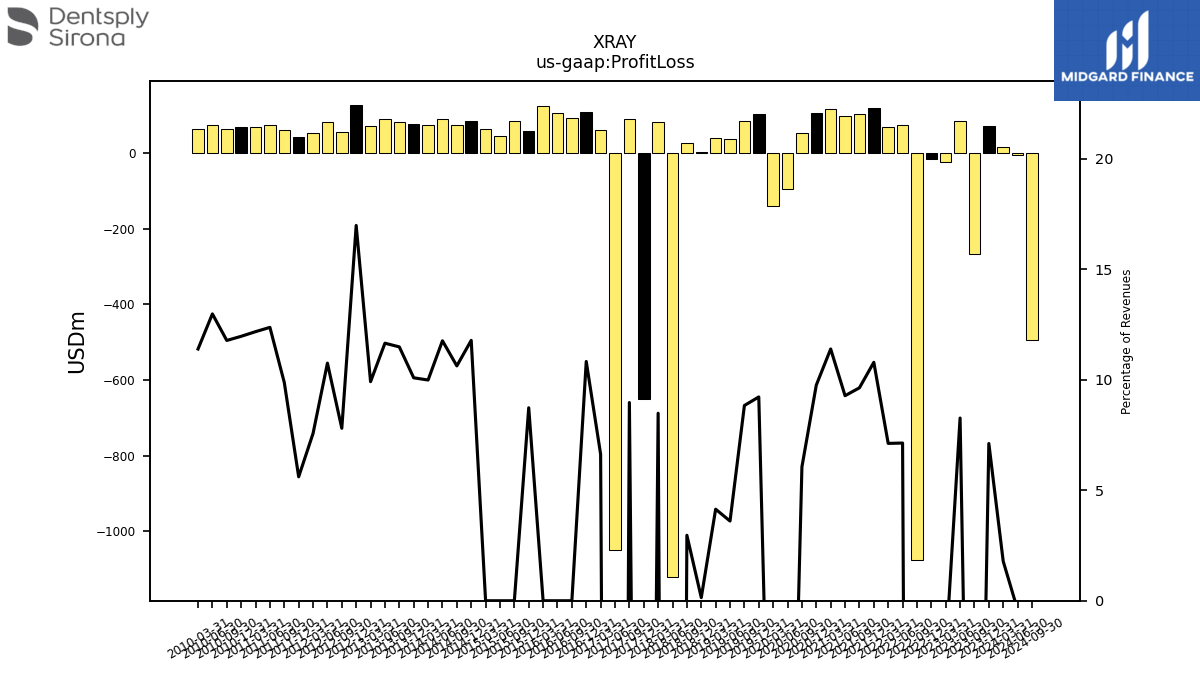
| Profit Loss | 72.00 | -266.00 | 85.00 | -23.00 | -15.00 | -1077.00 | 73.00 | 69.00 | 119.00 | 103.00 | 99.00 | 117.00 | 105.00 | 54.20 | -95.90 | -139.90 | 102.50 | 85.00 | 36.40 | 39.20 | 1.50 | 27.50 | -1121.00 | 81.10 | -650.20 | 90.50 | -1050.30 | 59.70 | 107.90 | 92.30 | 105.90 | 125.30 | 58.60 | 84.40 | 44.06 | 63.95 | 84.71 | 75.27 | 90.01 | 72.92 | 76.03 | 80.87 | 88.69 | 72.57 | 127.93 | 54.29 | 82.04 | 54.23 | 41.39 | 61.20 | 75.39 | 69.46 | 67.98 | 63.81 | 73.35 | 62.19 | |
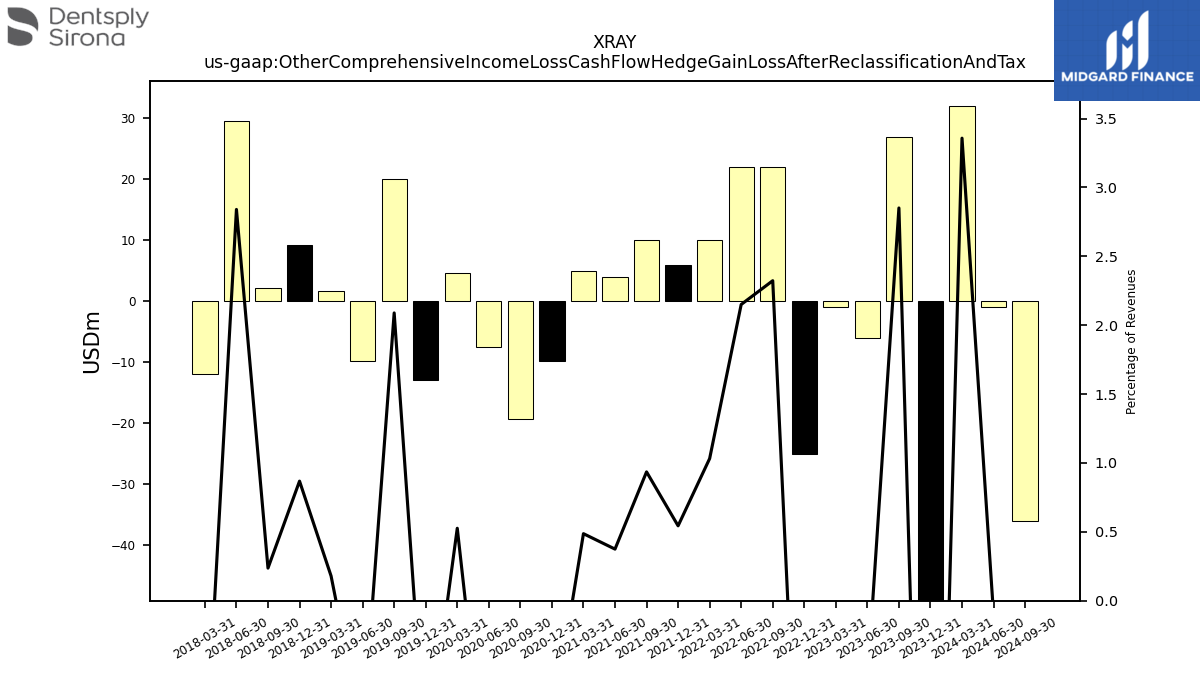
| Other Comprehensive Income Loss Cash Flow Hedge Gain Loss After Reclassification And Tax | -50.00 | 27.00 | -6.00 | -1.00 | -25.00 | 22.00 | 22.00 | 10.00 | 6.00 | 10.00 | 4.00 | 5.00 | -9.80 | -19.30 | -7.50 | 4.60 | -13.00 | 20.10 | -9.80 | 1.70 | 9.20 | 2.20 | 29.60 | -12.00 | NA | NA | NA | NA | NA | NA | NA | NA | NA | NA | NA | NA | NA | NA | NA | NA | NA | NA | NA | NA | NA | NA | NA | NA | NA | NA | NA | NA | NA | NA | NA | NA | |
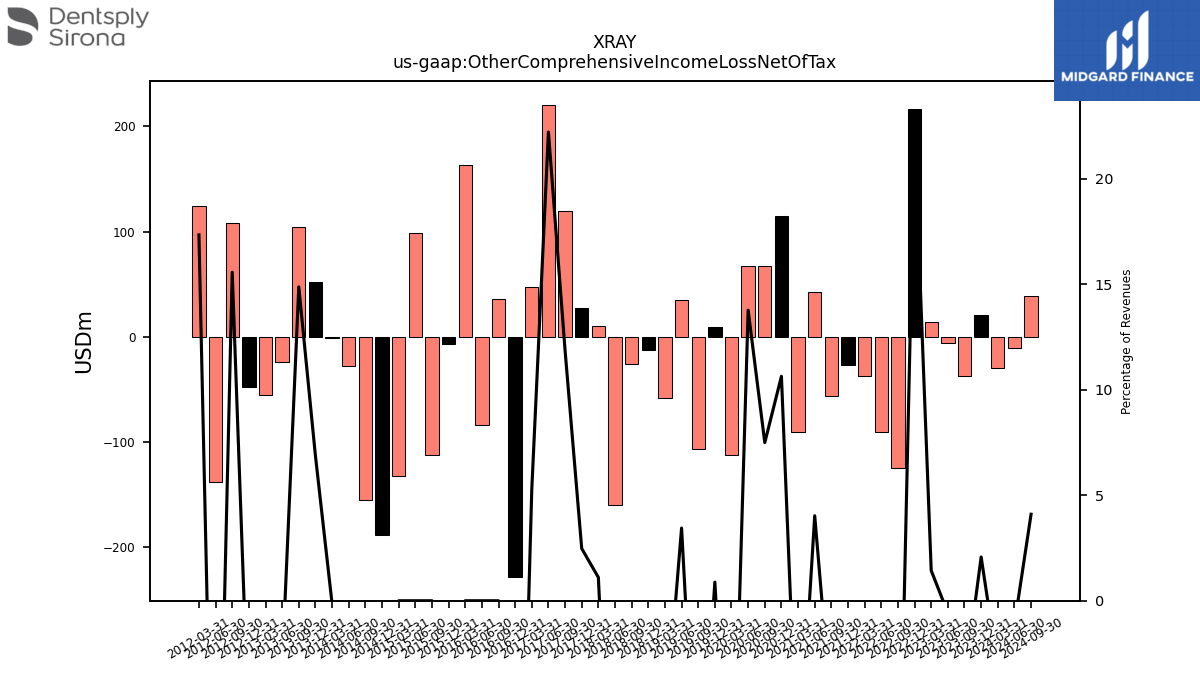
| Other Comprehensive Income Loss Net Of Tax | 21.00 | -37.00 | -6.00 | 14.00 | 216.00 | -125.00 | -90.00 | -37.00 | -27.00 | -56.00 | 43.00 | -90.00 | 114.50 | 67.10 | 67.60 | -112.20 | 9.80 | -106.50 | 34.80 | -58.40 | -12.30 | -25.80 | -160.00 | 10.60 | 27.00 | 119.80 | 220.60 | 47.60 | -228.30 | 35.90 | -83.40 | 162.90 | -6.50 | -112.50 | 98.56 | -131.88 | -188.29 | -155.30 | -28.14 | -1.00 | 51.78 | 104.77 | -23.57 | -55.61 | -47.60 | 108.37 | -137.88 | 124.28 | NA | NA | NA | NA | NA | NA | NA | NA | |
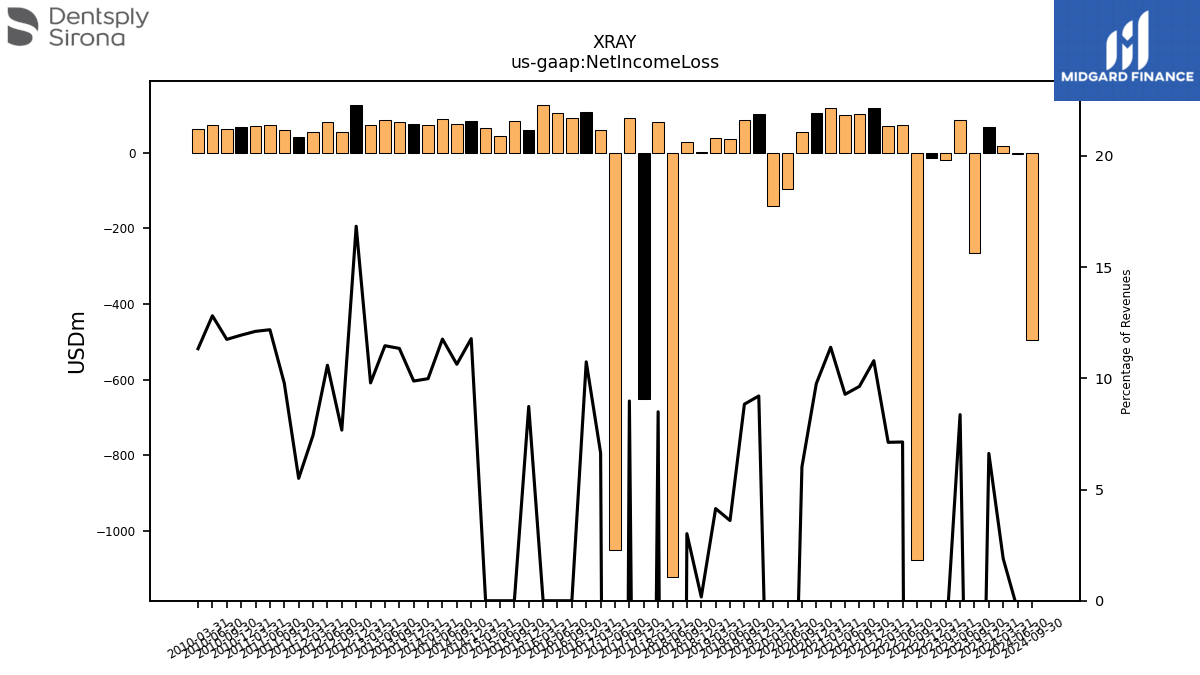
| Net Income Loss | 67.00 | -266.00 | 86.00 | -19.00 | -15.00 | -1077.00 | 73.00 | 69.00 | 119.00 | 103.00 | 99.00 | 117.00 | 105.00 | 53.80 | -95.40 | -139.90 | 102.30 | 85.00 | 36.40 | 39.20 | 1.80 | 28.00 | -1122.00 | 81.20 | -650.40 | 90.60 | -1050.00 | 59.80 | 107.00 | 92.50 | 105.40 | 125.00 | 58.60 | 84.50 | 44.10 | 63.96 | 84.71 | 75.27 | 89.99 | 72.88 | 74.43 | 79.85 | 87.23 | 71.69 | 126.80 | 53.36 | 80.76 | 53.28 | 40.60 | 60.60 | 74.24 | 69.08 | 67.83 | 63.65 | 72.39 | 61.84 | |
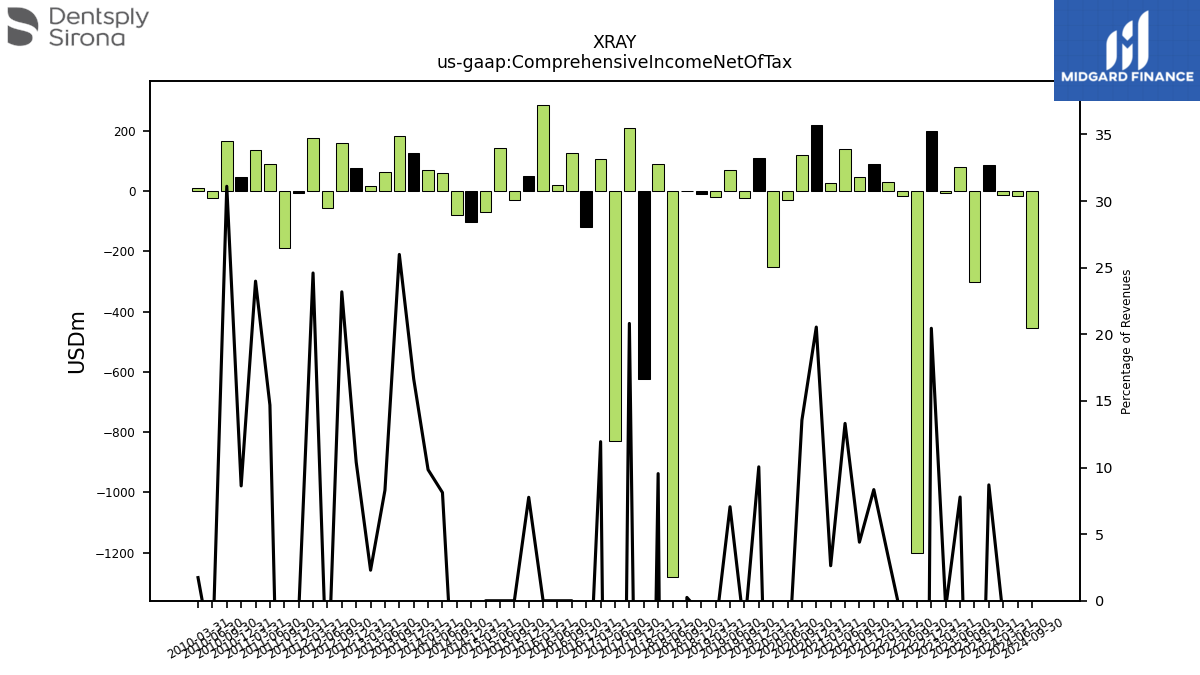
| Comprehensive Income Net Of Tax | 88.00 | -303.00 | 80.00 | -5.00 | 201.00 | -1202.00 | -17.00 | 32.00 | 92.00 | 47.00 | 142.00 | 27.00 | 221.00 | 121.30 | -28.40 | -252.40 | 111.70 | -21.50 | 71.20 | -19.50 | -10.40 | 2.30 | -1281.80 | 91.20 | -622.80 | 210.00 | -830.00 | 107.50 | -119.30 | 127.70 | 22.00 | 287.80 | 52.10 | -28.10 | 142.66 | -68.47 | -103.37 | -79.78 | 62.13 | 71.81 | 125.47 | 182.97 | 63.11 | 16.78 | 78.38 | 161.30 | -54.92 | 176.22 | -7.06 | -187.74 | 89.48 | 136.84 | 48.98 | 168.53 | -23.63 | 9.48 | |
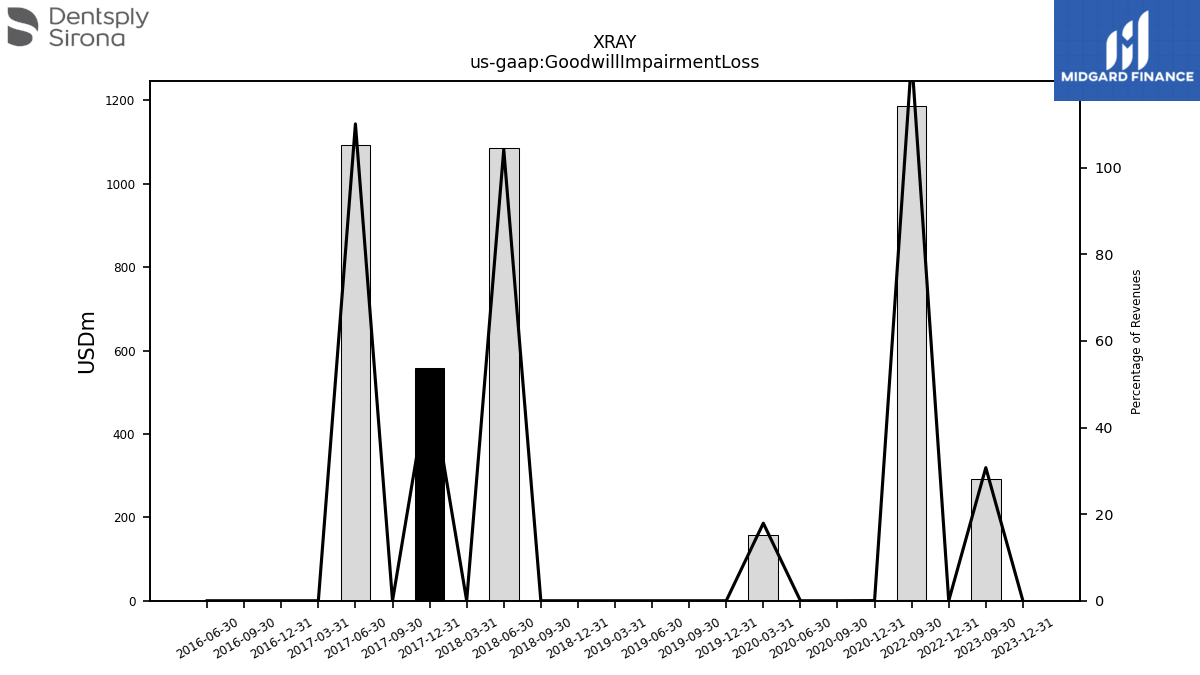
| Goodwill Impairment Loss | 0.00 | 291.00 | NA | NA | 0.00 | 1187.00 | NA | NA | NA | NA | NA | NA | 0.40 | 0.00 | 0.00 | 156.60 | 0.00 | 0.00 | 0.00 | 0.00 | 0.00 | 0.00 | 1085.80 | 0.00 | 558.00 | 0.00 | 1092.90 | 0.00 | 0.00 | 0.00 | 0.00 | NA | NA | NA | NA | NA | NA | NA | NA | NA | NA | NA | NA | NA | NA | NA | NA | NA | NA | NA | NA | NA | NA | NA | NA | NA |
| 2023-12-31 | 2023-09-30 | 2023-06-30 | 2023-03-31 | 2022-12-31 | 2022-09-30 | 2022-06-30 | 2022-03-31 | 2021-12-31 | 2021-09-30 | 2021-06-30 | 2021-03-31 | 2020-12-31 | 2020-09-30 | 2020-06-30 | 2020-03-31 | 2019-12-31 | 2019-09-30 | 2019-06-30 | 2019-03-31 | 2018-12-31 | 2018-09-30 | 2018-06-30 | 2018-03-31 | 2017-12-31 | 2017-09-30 | 2017-06-30 | 2017-03-31 | 2016-12-31 | 2016-09-30 | 2016-06-30 | 2016-03-31 | 2015-12-31 | 2015-09-30 | 2015-06-30 | 2015-03-31 | 2014-12-31 | 2014-09-30 | 2014-06-30 | 2014-03-31 | 2013-12-31 | 2013-09-30 | 2013-06-30 | 2013-03-31 | 2012-12-31 | 2012-09-30 | 2012-06-30 | 2012-03-31 | 2011-12-31 | 2011-09-30 | 2011-06-30 | 2011-03-31 | 2010-12-31 | 2010-09-30 | 2010-06-30 | 2010-03-31 | ||
|---|---|---|---|---|---|---|---|---|---|---|---|---|---|---|---|---|---|---|---|---|---|---|---|---|---|---|---|---|---|---|---|---|---|---|---|---|---|---|---|---|---|---|---|---|---|---|---|---|---|---|---|---|---|---|---|---|---|
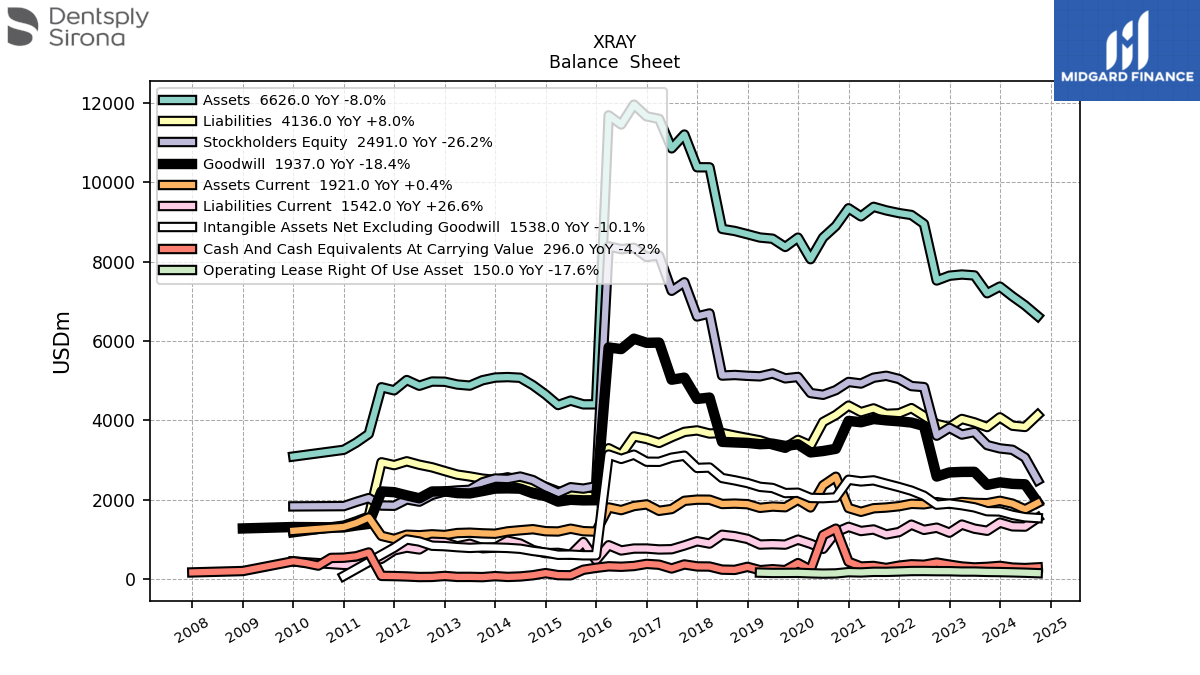
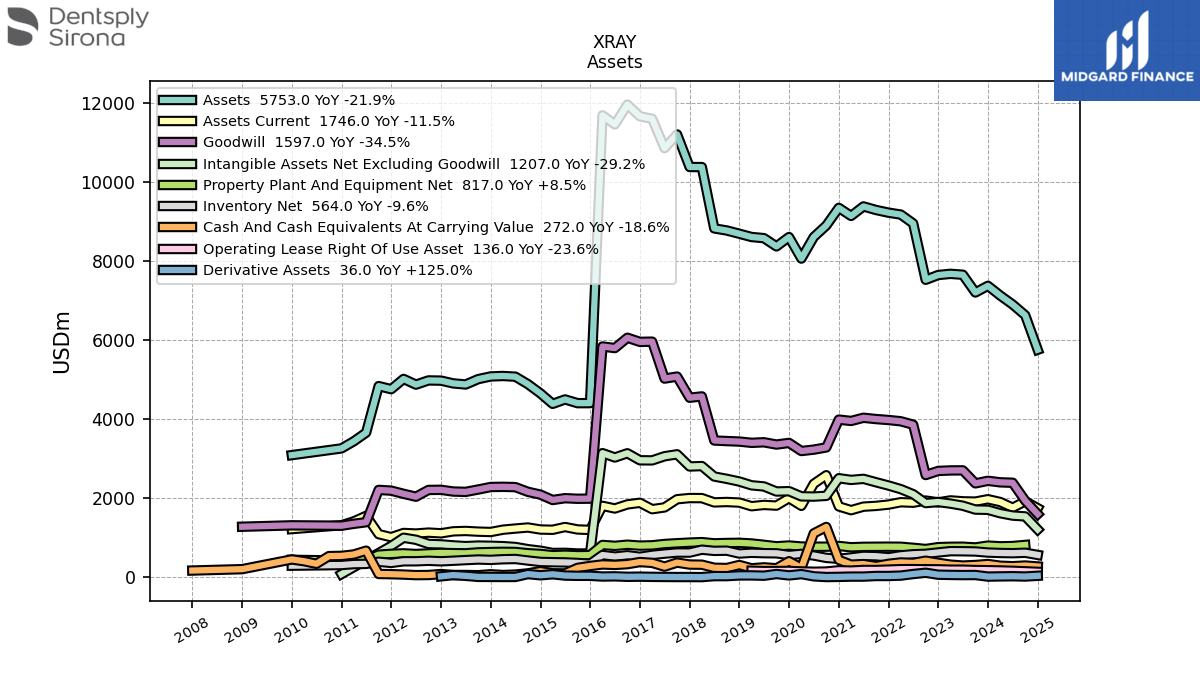
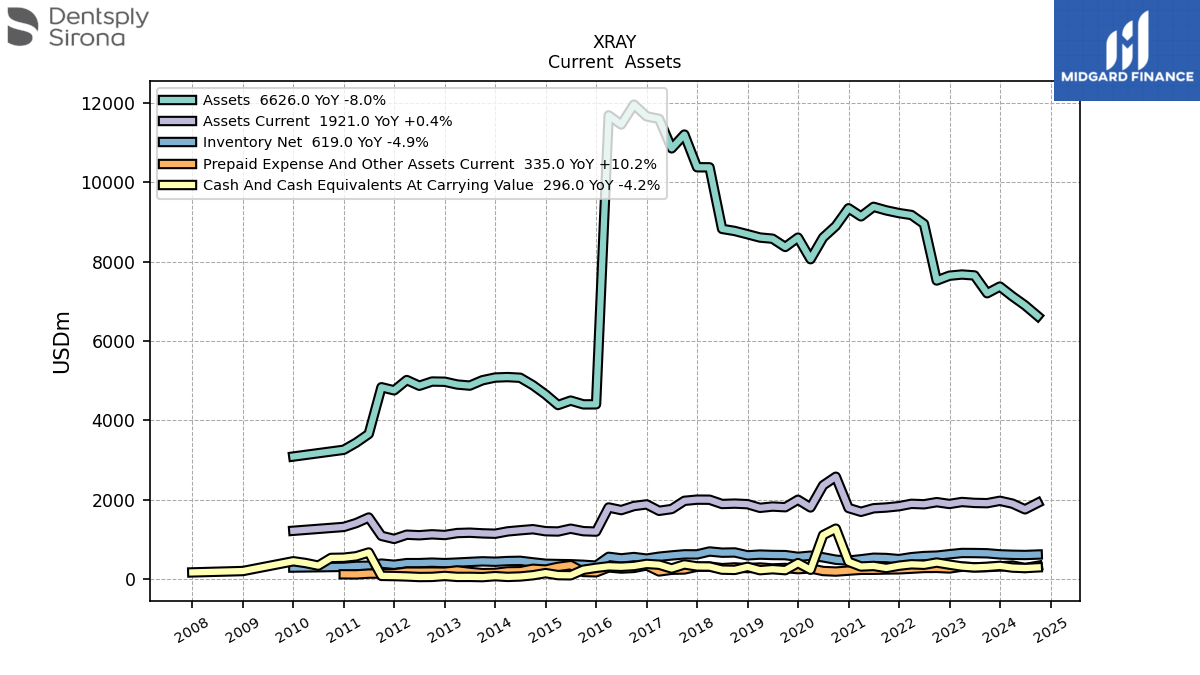
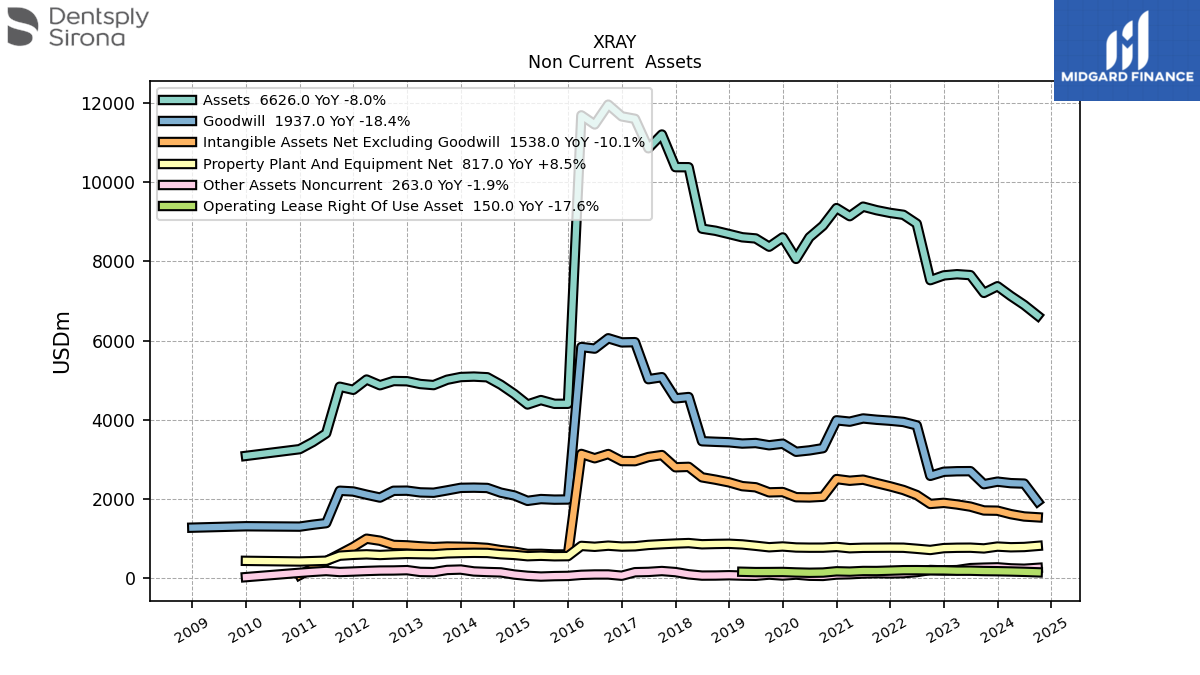
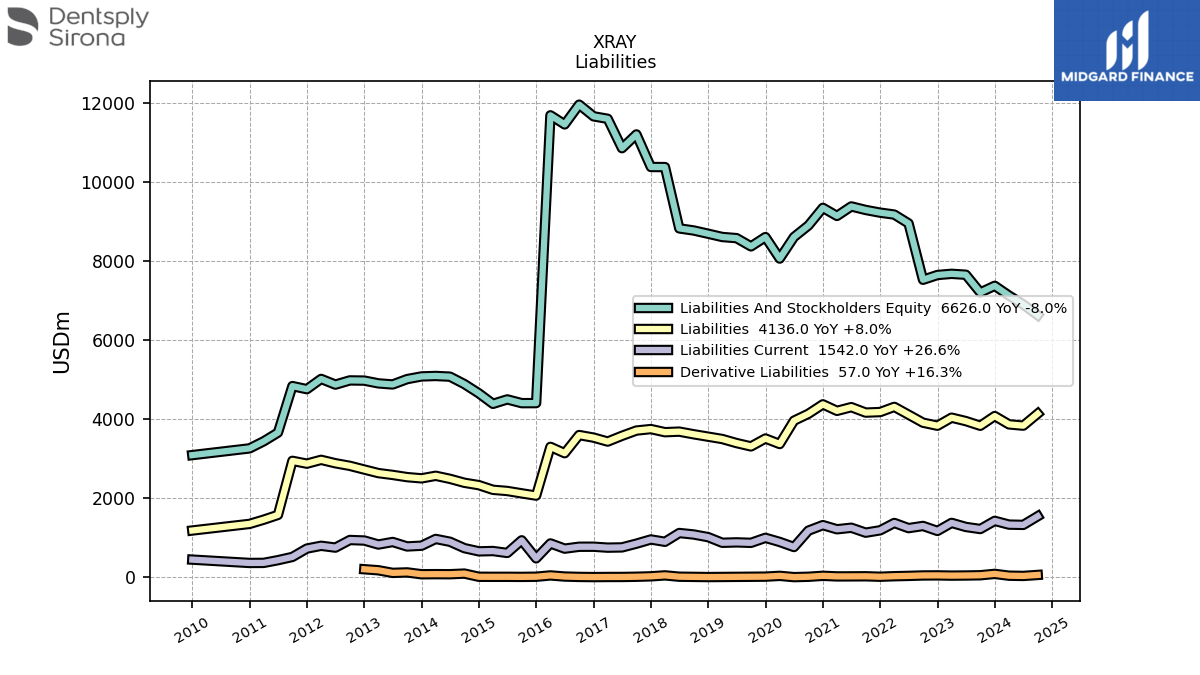
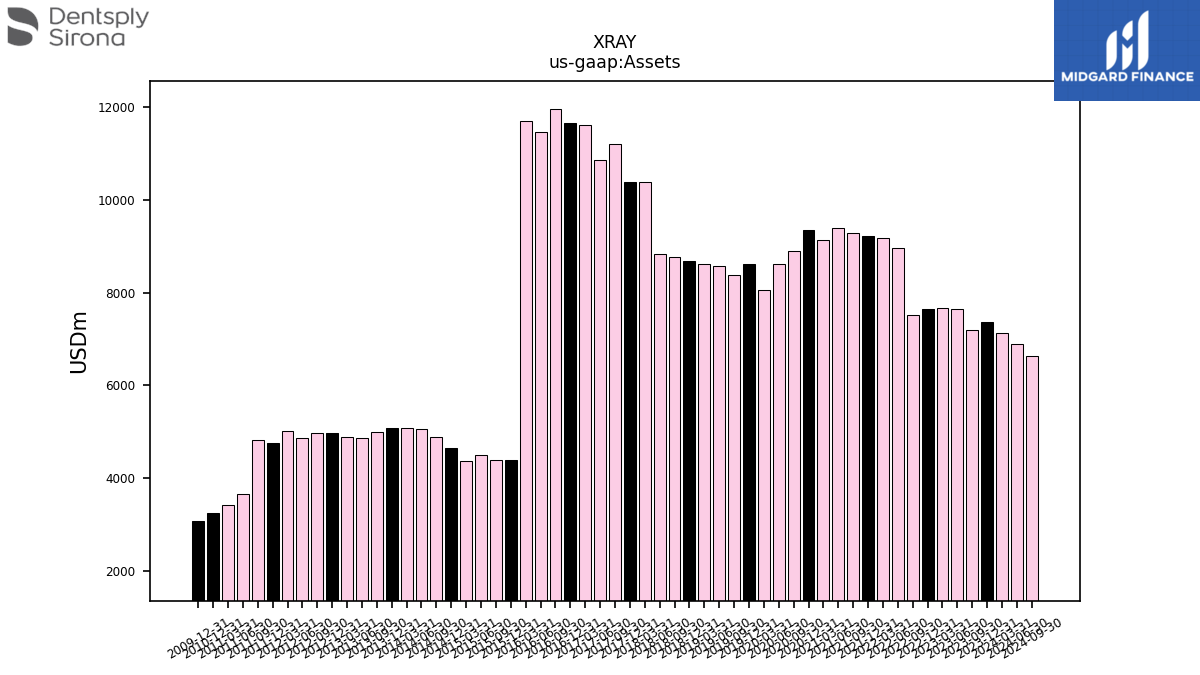
| Assets | 7370.00 | 7201.00 | 7650.00 | 7673.00 | 7643.00 | 7522.00 | 8948.00 | 9172.00 | 9220.00 | 9288.00 | 9378.00 | 9137.00 | 9342.00 | 8895.90 | 8604.20 | 8058.40 | 8602.90 | 8366.80 | 8575.30 | 8604.50 | 8687.00 | 8769.20 | 8822.00 | 10372.80 | 10374.50 | 11199.00 | 10850.00 | 11594.00 | 11656.10 | 11952.40 | 11451.40 | 11682.40 | 4402.90 | 4402.20 | 4496.76 | 4384.83 | 4650.27 | 4884.06 | 5072.37 | 5089.43 | 5078.05 | 5009.98 | 4874.68 | 4902.13 | 4972.30 | 4977.42 | 4870.76 | 5015.06 | 4755.40 | 4833.71 | 3656.64 | 3437.05 | 3257.95 | NA | NA | NA | |
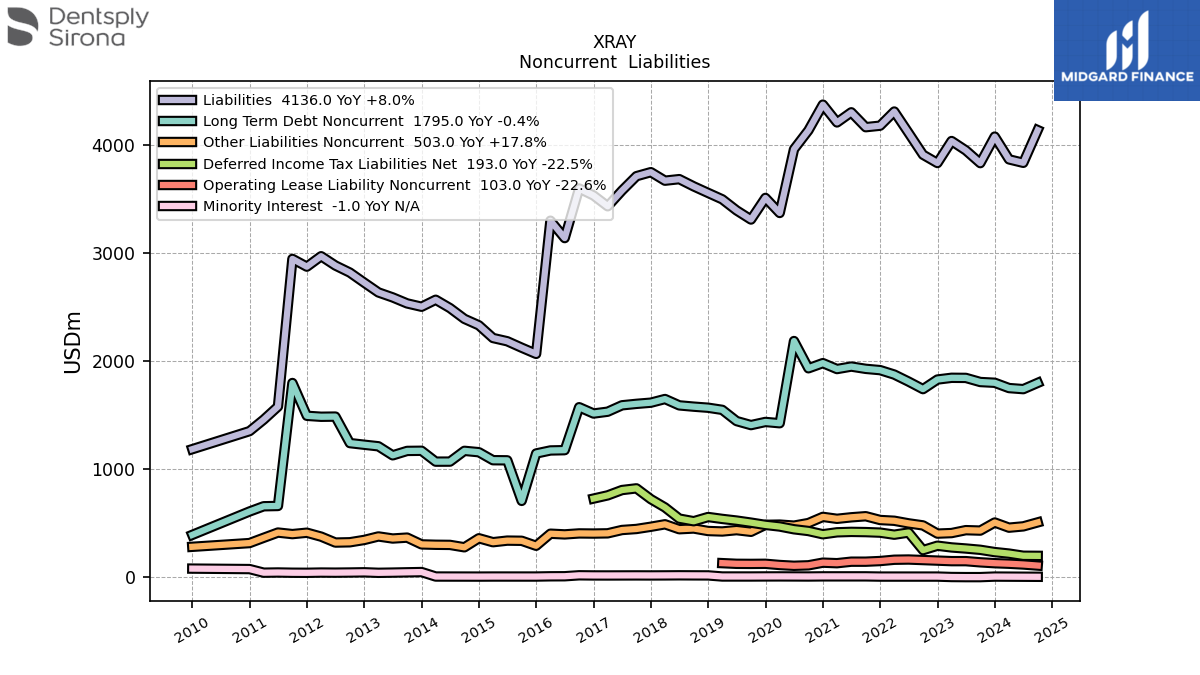
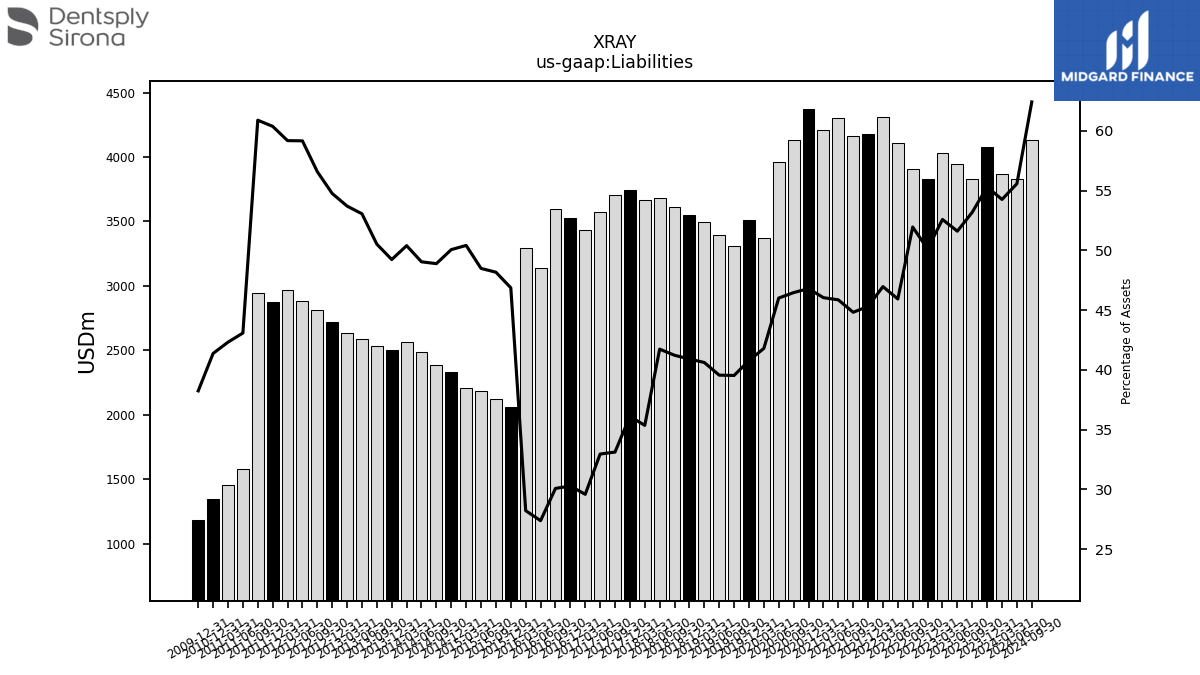
| Liabilities | 4076.00 | 3830.00 | 3948.00 | 4035.00 | 3831.00 | 3908.00 | 4110.00 | 4308.00 | 4177.00 | 4163.00 | 4301.00 | 4207.00 | 4372.00 | 4133.60 | 3958.80 | 3368.20 | 3508.00 | 3307.70 | 3392.40 | 3495.00 | 3554.00 | 3614.90 | 3681.90 | 3667.60 | 3746.60 | 3709.20 | 3575.80 | 3430.40 | 3530.20 | 3595.30 | 3135.80 | 3297.00 | 2063.50 | 2120.70 | 2180.47 | 2210.58 | 2328.07 | 2387.82 | 2487.60 | 2564.84 | 2500.07 | 2530.96 | 2586.59 | 2632.73 | 2722.85 | 2816.55 | 2881.76 | 2968.09 | 2871.25 | 2943.30 | 1575.41 | 1454.55 | 1348.04 | NA | NA | NA | |
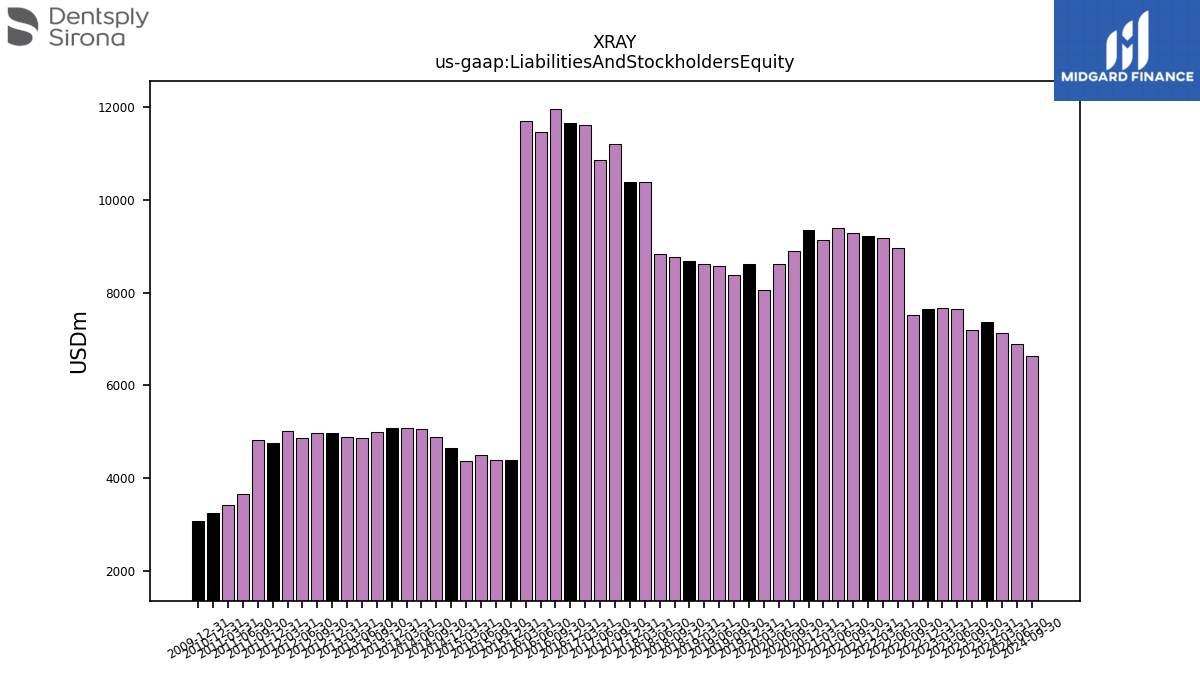
| Liabilities And Stockholders Equity | 7370.00 | 7201.00 | 7650.00 | 7673.00 | 7643.00 | 7522.00 | 8948.00 | 9172.00 | 9220.00 | 9288.00 | 9378.00 | 9137.00 | 9342.00 | 8895.90 | 8604.20 | 8058.40 | 8602.90 | 8366.80 | 8575.30 | 8604.50 | 8687.00 | 8769.20 | 8822.00 | 10372.80 | 10374.50 | 11199.00 | 10850.00 | 11594.00 | 11656.10 | 11952.40 | 11451.40 | 11682.40 | 4402.90 | 4402.20 | 4496.76 | 4384.83 | 4650.27 | 4884.06 | 5072.37 | 5089.43 | 5078.05 | 5009.98 | 4874.68 | 4902.13 | 4972.30 | 4977.42 | 4870.76 | 5015.06 | 4755.40 | 4833.71 | 3656.64 | 3437.05 | 3257.95 | NA | NA | NA | |
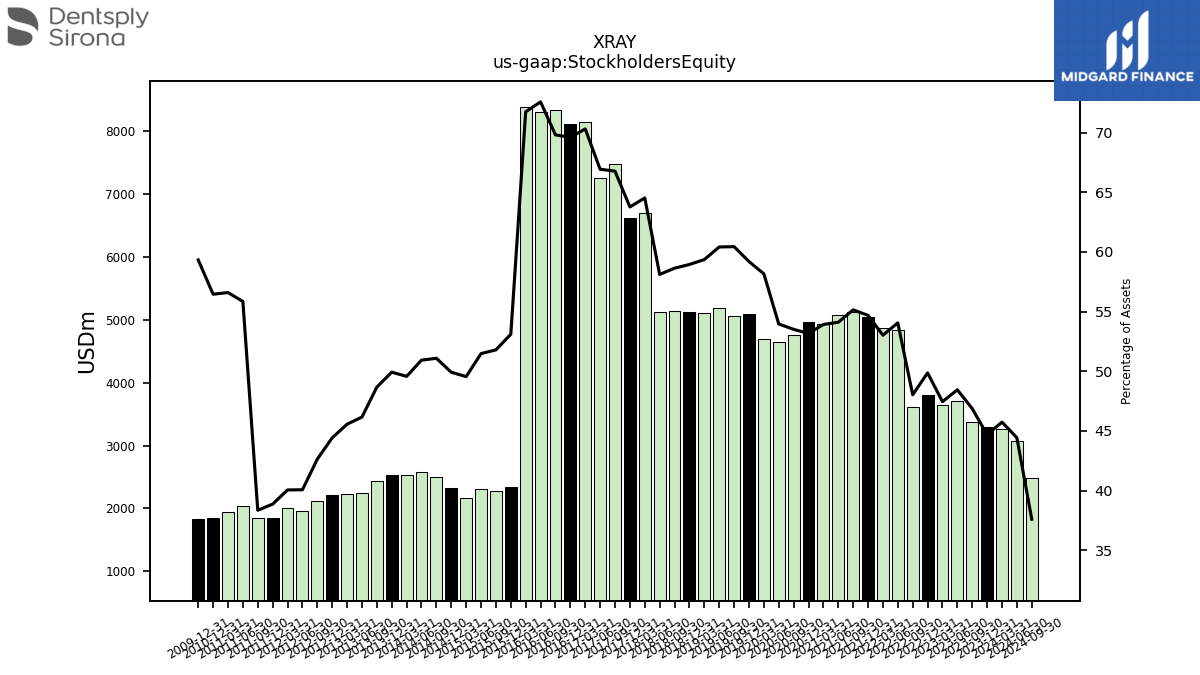
| Stockholders Equity | 3293.00 | 3375.00 | 3706.00 | 3641.00 | 3811.00 | 3613.00 | 4837.00 | 4863.00 | 5042.00 | 5122.00 | 5074.00 | 4927.00 | 4967.00 | 4760.50 | 4643.10 | 4687.50 | 5092.50 | 5057.30 | 5181.10 | 5107.70 | 5121.10 | 5142.00 | 5127.20 | 6693.10 | 6616.30 | 7477.80 | 7262.50 | 8152.20 | 8114.30 | 8344.10 | 8311.50 | 8381.80 | 2338.00 | 2280.10 | 2314.87 | 2172.79 | 2321.28 | 2495.11 | 2583.46 | 2523.03 | 2535.05 | 2438.44 | 2250.18 | 2233.50 | 2208.70 | 2122.07 | 1951.57 | 2008.62 | 1848.08 | 1853.69 | 2042.23 | 1945.34 | 1839.39 | NA | NA | NA |
| 2023-12-31 | 2023-09-30 | 2023-06-30 | 2023-03-31 | 2022-12-31 | 2022-09-30 | 2022-06-30 | 2022-03-31 | 2021-12-31 | 2021-09-30 | 2021-06-30 | 2021-03-31 | 2020-12-31 | 2020-09-30 | 2020-06-30 | 2020-03-31 | 2019-12-31 | 2019-09-30 | 2019-06-30 | 2019-03-31 | 2018-12-31 | 2018-09-30 | 2018-06-30 | 2018-03-31 | 2017-12-31 | 2017-09-30 | 2017-06-30 | 2017-03-31 | 2016-12-31 | 2016-09-30 | 2016-06-30 | 2016-03-31 | 2015-12-31 | 2015-09-30 | 2015-06-30 | 2015-03-31 | 2014-12-31 | 2014-09-30 | 2014-06-30 | 2014-03-31 | 2013-12-31 | 2013-09-30 | 2013-06-30 | 2013-03-31 | 2012-12-31 | 2012-09-30 | 2012-06-30 | 2012-03-31 | 2011-12-31 | 2011-09-30 | 2011-06-30 | 2011-03-31 | 2010-12-31 | 2010-09-30 | 2010-06-30 | 2010-03-31 | ||
|---|---|---|---|---|---|---|---|---|---|---|---|---|---|---|---|---|---|---|---|---|---|---|---|---|---|---|---|---|---|---|---|---|---|---|---|---|---|---|---|---|---|---|---|---|---|---|---|---|---|---|---|---|---|---|---|---|---|
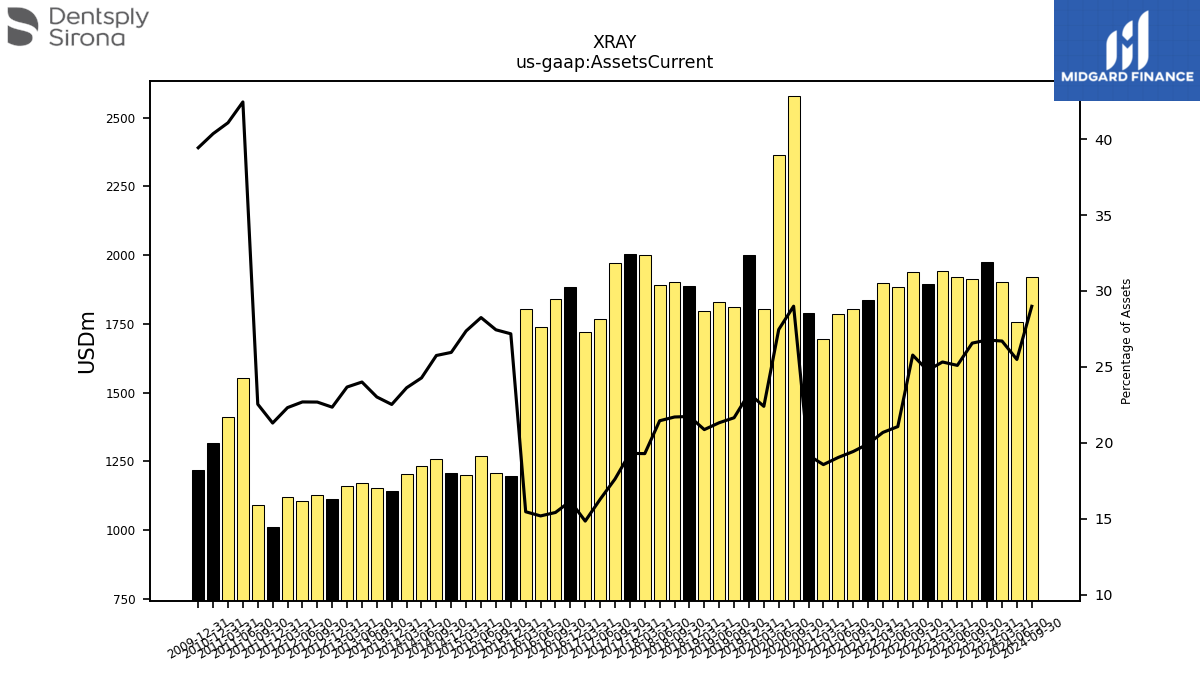
| Assets Current | 1973.00 | 1913.00 | 1920.00 | 1943.00 | 1893.00 | 1939.00 | 1885.00 | 1897.00 | 1837.00 | 1804.00 | 1785.00 | 1696.00 | 1791.00 | 2579.60 | 2362.90 | 1805.20 | 1999.90 | 1811.30 | 1828.30 | 1795.60 | 1888.00 | 1902.80 | 1892.40 | 2000.50 | 2002.50 | 1972.40 | 1765.70 | 1720.60 | 1882.60 | 1841.60 | 1738.40 | 1805.50 | 1196.70 | 1208.10 | 1270.33 | 1200.08 | 1206.97 | 1257.70 | 1231.27 | 1202.32 | 1143.80 | 1153.14 | 1170.03 | 1160.52 | 1111.10 | 1128.98 | 1105.18 | 1119.18 | 1012.90 | 1089.61 | 1552.41 | 1412.07 | 1315.05 | NA | NA | NA | |
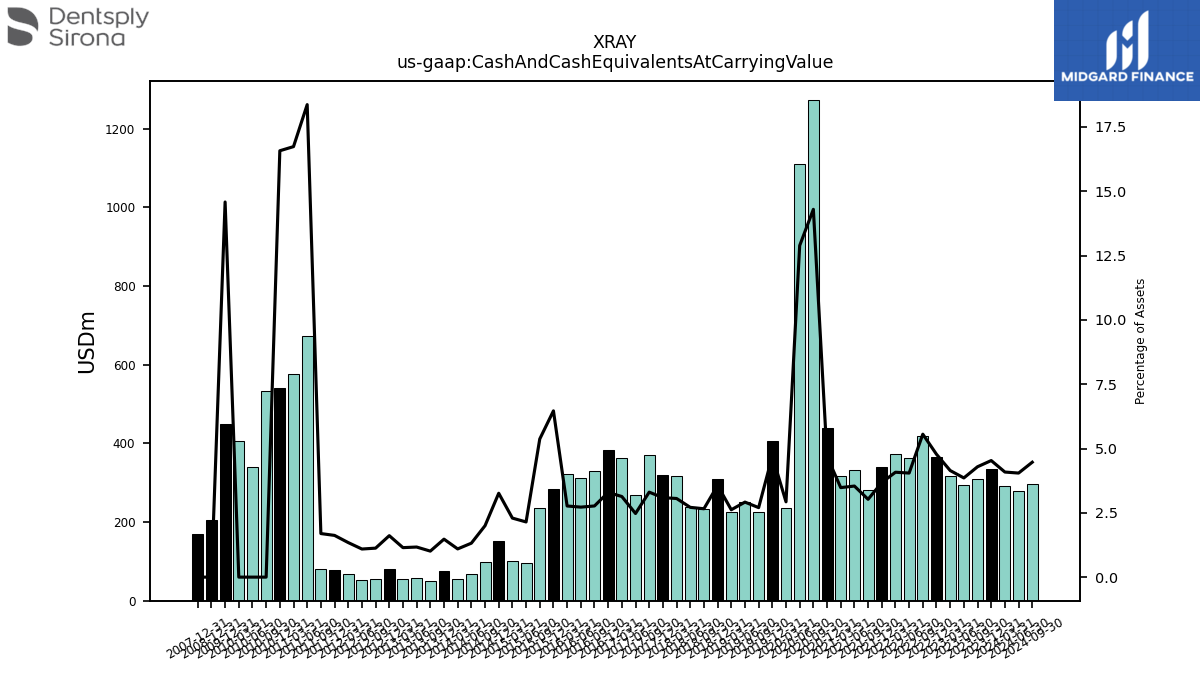
| Cash And Cash Equivalents At Carrying Value | 334.00 | 309.00 | 295.00 | 318.00 | 365.00 | 418.00 | 362.00 | 374.00 | 339.00 | 281.00 | 332.00 | 318.00 | 438.00 | 1272.00 | 1109.10 | 235.90 | 404.90 | 226.10 | 250.10 | 225.40 | 309.60 | 233.10 | 239.30 | 317.10 | 320.60 | 370.00 | 268.40 | 363.30 | 383.90 | 330.70 | 311.60 | 323.10 | 284.60 | 236.40 | 96.47 | 100.62 | 151.64 | 97.65 | 66.93 | 55.82 | 74.95 | 50.66 | 57.03 | 56.20 | 80.13 | 56.08 | 53.21 | 67.35 | 77.13 | 81.87 | 671.71 | 575.26 | 540.04 | 534.24 | 340.35 | 405.02 | |
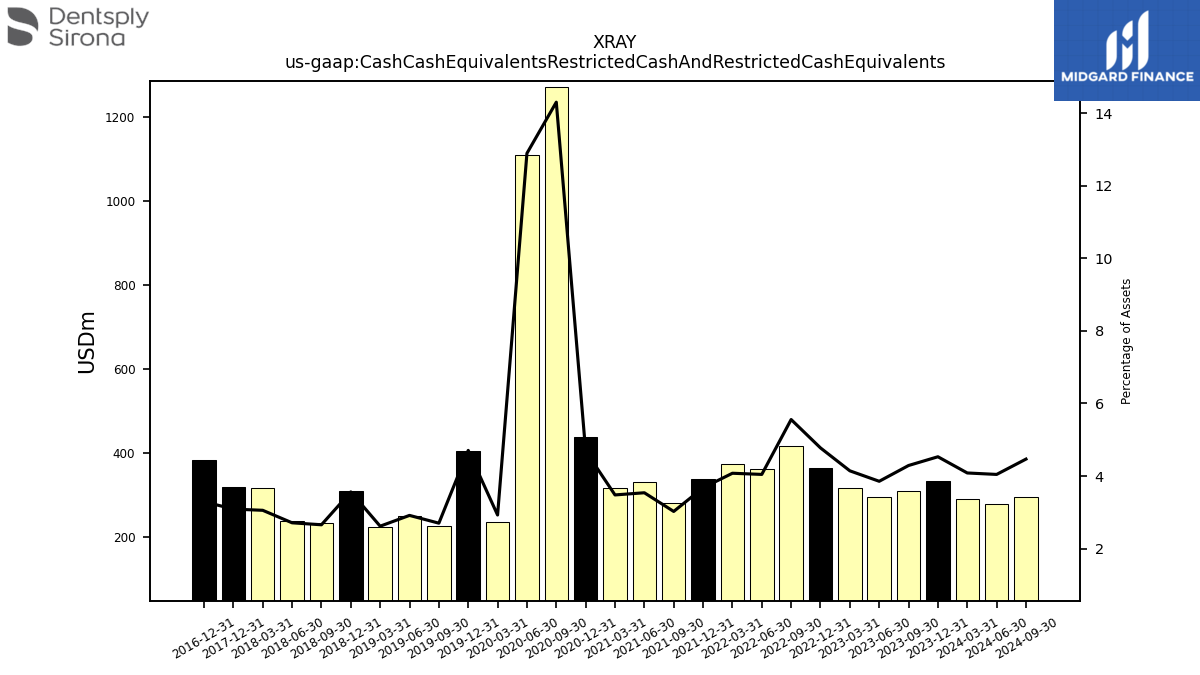
| Cash Cash Equivalents Restricted Cash And Restricted Cash Equivalents | 334.00 | 309.00 | 295.00 | 318.00 | 365.00 | 418.00 | 362.00 | 374.00 | 339.00 | 281.00 | 332.00 | 318.00 | 438.00 | 1272.00 | 1109.10 | 235.90 | 404.90 | 226.10 | 250.10 | 225.40 | 309.60 | 233.10 | 239.30 | 317.10 | 320.60 | NA | NA | NA | 383.90 | NA | NA | NA | NA | NA | NA | NA | NA | NA | NA | NA | NA | NA | NA | NA | NA | NA | NA | NA | NA | NA | NA | NA | NA | NA | NA | NA | |
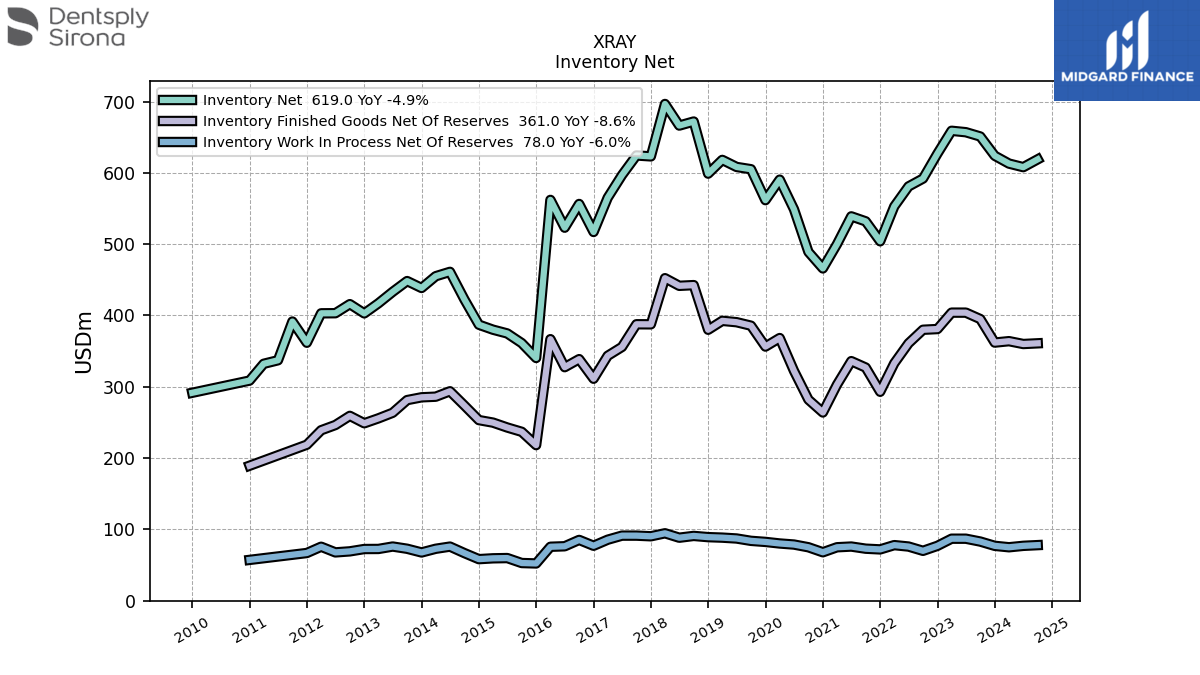
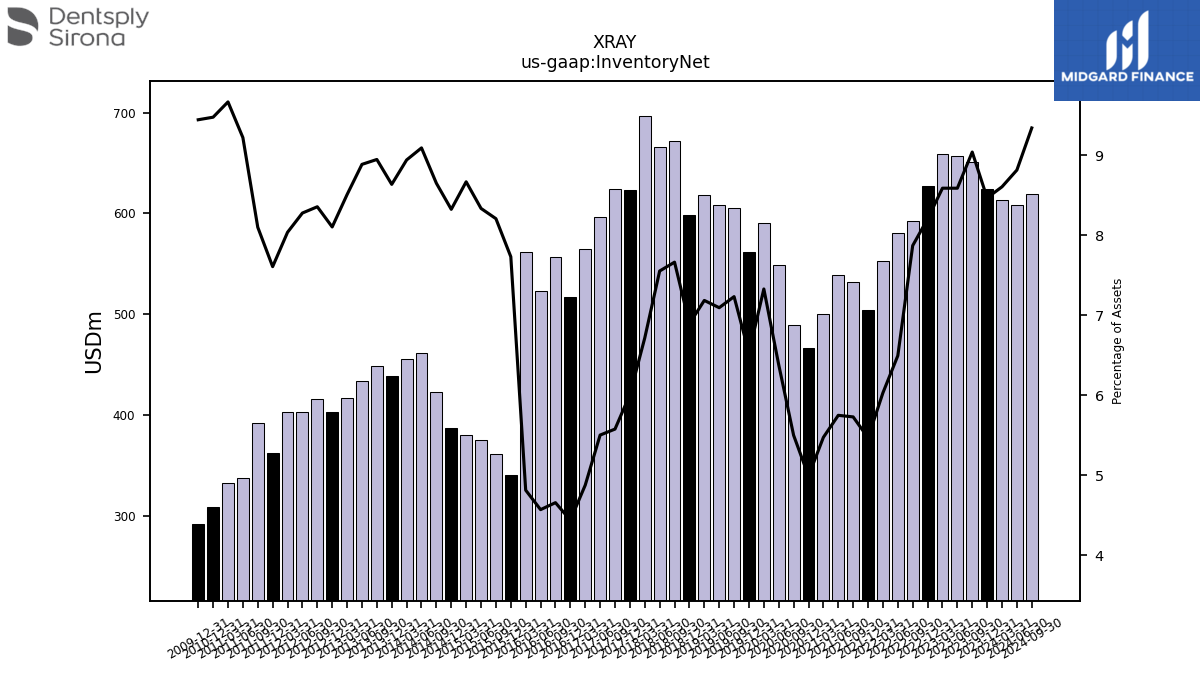
| Inventory Net | 624.00 | 651.00 | 657.00 | 659.00 | 627.00 | 592.00 | 581.00 | 553.00 | 504.00 | 532.00 | 539.00 | 500.00 | 466.00 | 489.10 | 548.90 | 590.50 | 561.70 | 605.10 | 608.30 | 618.20 | 598.90 | 672.00 | 666.30 | 696.60 | 623.10 | 624.40 | 596.80 | 565.10 | 517.10 | 556.40 | 523.10 | 562.10 | 340.40 | 361.30 | 374.82 | 380.10 | 387.10 | 422.49 | 461.20 | 455.07 | 438.56 | 448.28 | 433.19 | 417.09 | 402.94 | 415.92 | 403.19 | 403.05 | 361.76 | 391.53 | 337.20 | 332.28 | 308.74 | NA | NA | NA | |
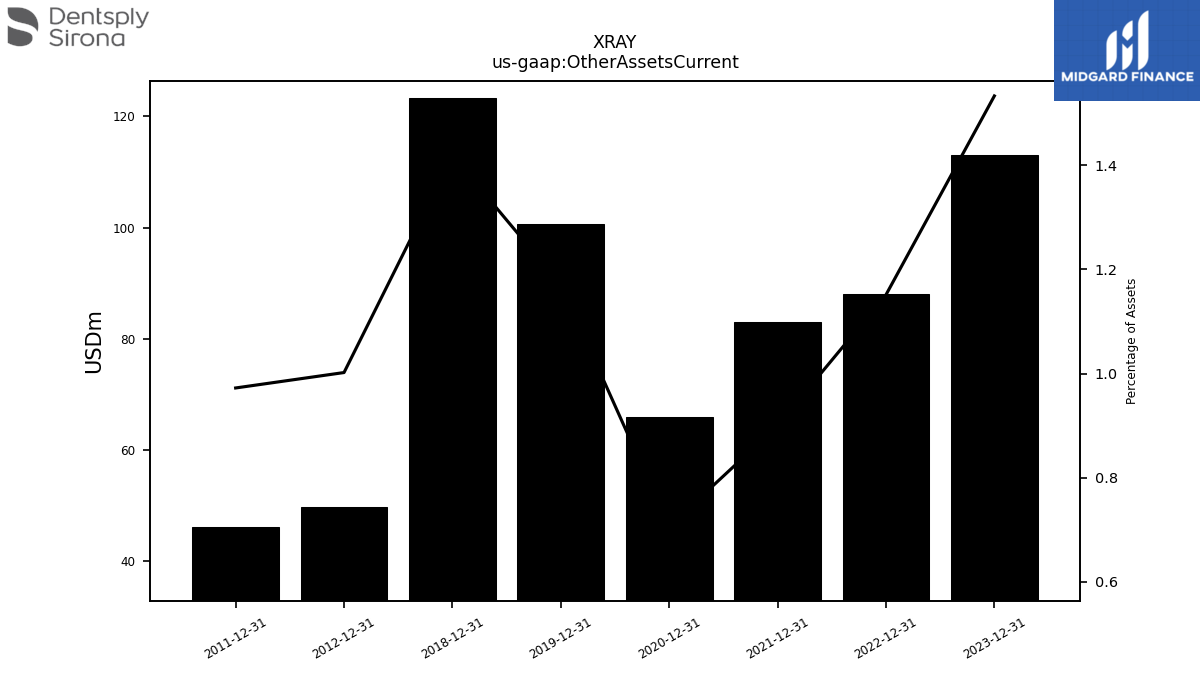
| Other Assets Current | 113.00 | NA | NA | NA | 88.00 | NA | NA | NA | 83.00 | NA | NA | NA | 66.00 | NA | NA | NA | 100.70 | NA | NA | NA | 123.30 | NA | NA | NA | NA | NA | NA | NA | NA | NA | NA | NA | NA | NA | NA | NA | NA | NA | NA | NA | NA | NA | NA | NA | 49.83 | NA | NA | NA | 46.25 | NA | NA | NA | NA | NA | NA | NA | |
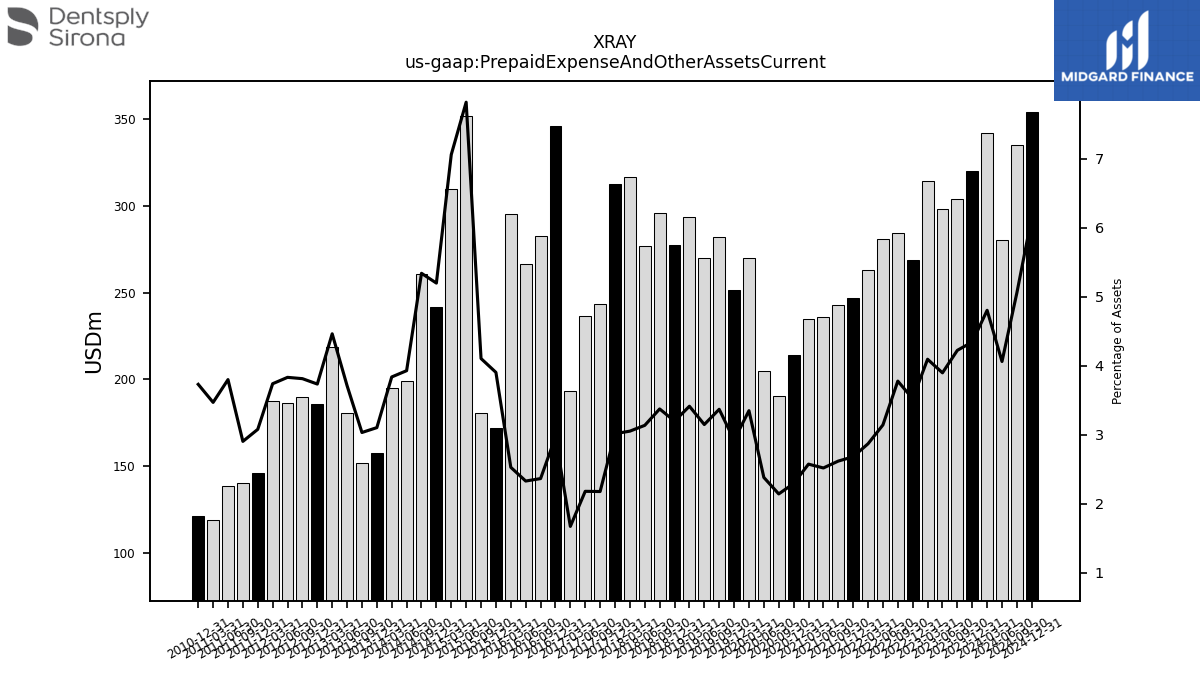
| Prepaid Expense And Other Assets Current | 320.00 | 304.00 | 298.00 | 314.00 | 269.00 | 284.00 | 281.00 | 263.00 | 247.00 | 243.00 | 236.00 | 235.00 | 214.00 | 190.40 | 204.70 | 269.70 | 251.30 | 281.70 | 269.80 | 293.50 | 277.60 | 295.70 | 276.50 | 316.40 | 312.60 | 243.60 | 236.30 | 193.60 | 345.60 | 282.40 | 266.50 | 295.10 | 171.80 | 180.60 | 351.54 | 309.50 | 241.63 | 260.71 | 199.17 | 195.21 | 157.49 | 151.84 | 180.81 | 218.69 | 185.61 | 189.69 | 186.54 | 187.44 | 146.30 | 140.26 | 138.84 | 119.17 | 121.47 | NA | NA | NA |
| 2023-12-31 | 2023-09-30 | 2023-06-30 | 2023-03-31 | 2022-12-31 | 2022-09-30 | 2022-06-30 | 2022-03-31 | 2021-12-31 | 2021-09-30 | 2021-06-30 | 2021-03-31 | 2020-12-31 | 2020-09-30 | 2020-06-30 | 2020-03-31 | 2019-12-31 | 2019-09-30 | 2019-06-30 | 2019-03-31 | 2018-12-31 | 2018-09-30 | 2018-06-30 | 2018-03-31 | 2017-12-31 | 2017-09-30 | 2017-06-30 | 2017-03-31 | 2016-12-31 | 2016-09-30 | 2016-06-30 | 2016-03-31 | 2015-12-31 | 2015-09-30 | 2015-06-30 | 2015-03-31 | 2014-12-31 | 2014-09-30 | 2014-06-30 | 2014-03-31 | 2013-12-31 | 2013-09-30 | 2013-06-30 | 2013-03-31 | 2012-12-31 | 2012-09-30 | 2012-06-30 | 2012-03-31 | 2011-12-31 | 2011-09-30 | 2011-06-30 | 2011-03-31 | 2010-12-31 | 2010-09-30 | 2010-06-30 | 2010-03-31 | ||
|---|---|---|---|---|---|---|---|---|---|---|---|---|---|---|---|---|---|---|---|---|---|---|---|---|---|---|---|---|---|---|---|---|---|---|---|---|---|---|---|---|---|---|---|---|---|---|---|---|---|---|---|---|---|---|---|---|---|
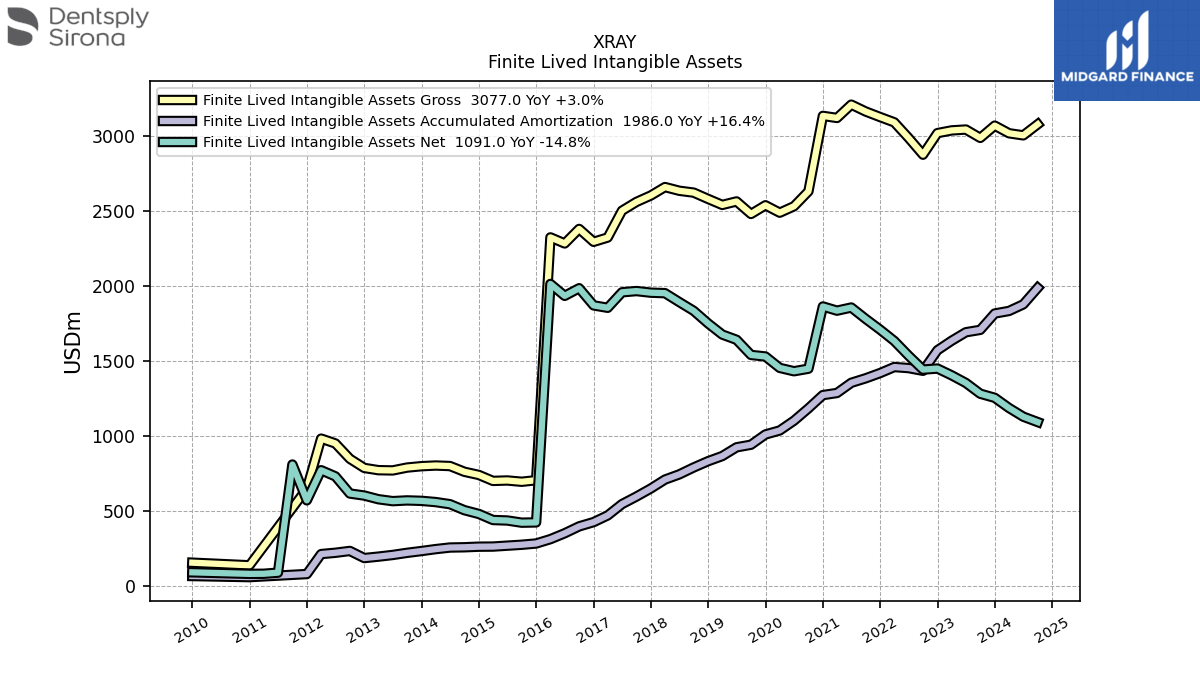
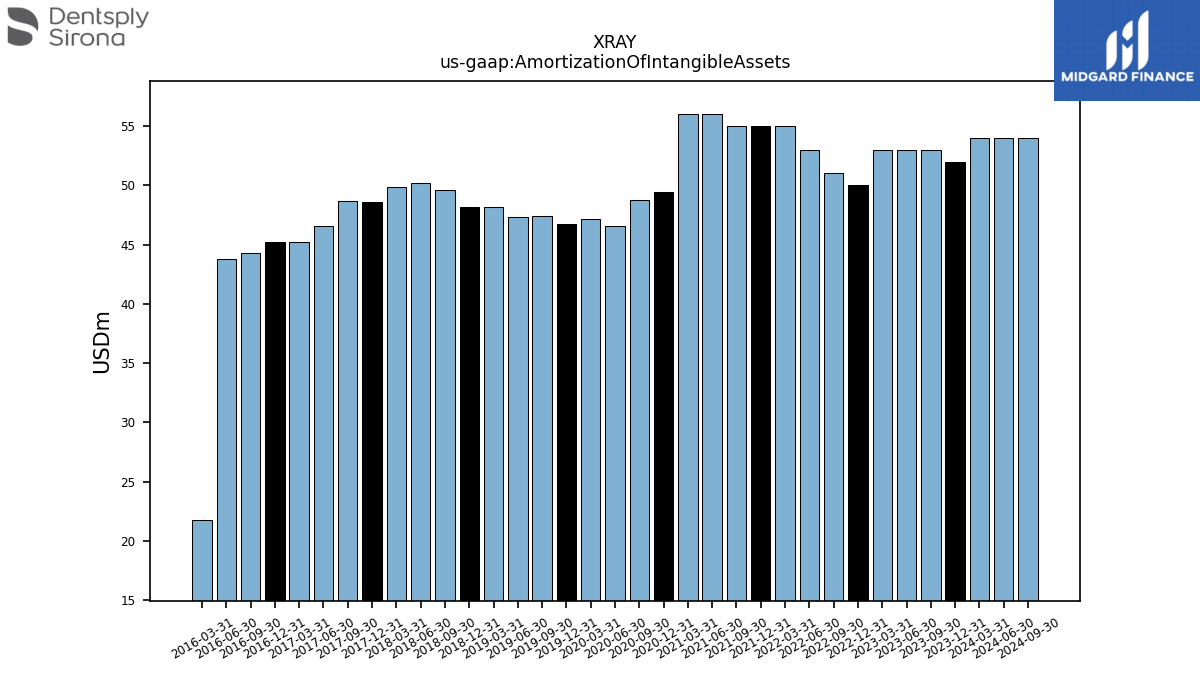
| Amortization Of Intangible Assets | 52.00 | 53.00 | 53.00 | 53.00 | 50.00 | 51.00 | 53.00 | 55.00 | 55.00 | 55.00 | 56.00 | 56.00 | 49.40 | 48.80 | 46.60 | 47.20 | 46.70 | 47.40 | 47.30 | 48.20 | 48.20 | 49.60 | 50.20 | 49.90 | 48.60 | 48.70 | 46.60 | 45.20 | 45.20 | 44.30 | 43.80 | 21.80 | NA | NA | NA | NA | NA | NA | NA | NA | NA | NA | NA | NA | NA | NA | NA | NA | NA | NA | NA | NA | NA | NA | NA | NA | |
| Goodwill | 2438.00 | 2374.00 | 2703.00 | 2701.00 | 2688.00 | 2584.00 | 3858.00 | 3944.00 | 3976.00 | 4000.00 | 4033.00 | 3952.00 | 3986.00 | 3282.70 | 3227.20 | 3191.80 | 3396.50 | 3355.70 | 3412.70 | 3399.20 | 3431.30 | 3443.60 | 3457.80 | 4573.20 | 4539.20 | 5074.90 | 5023.60 | 5958.20 | 5952.00 | 6056.70 | 5794.70 | 5836.00 | 1987.60 | 1984.30 | 1998.61 | 1953.27 | 2089.34 | 2160.70 | 2278.80 | 2286.72 | 2281.60 | 2218.14 | 2158.53 | 2167.24 | 2210.95 | 2207.41 | 2036.08 | 2109.45 | 2190.06 | 2208.91 | 1391.29 | 1350.78 | 1303.06 | NA | NA | NA | |
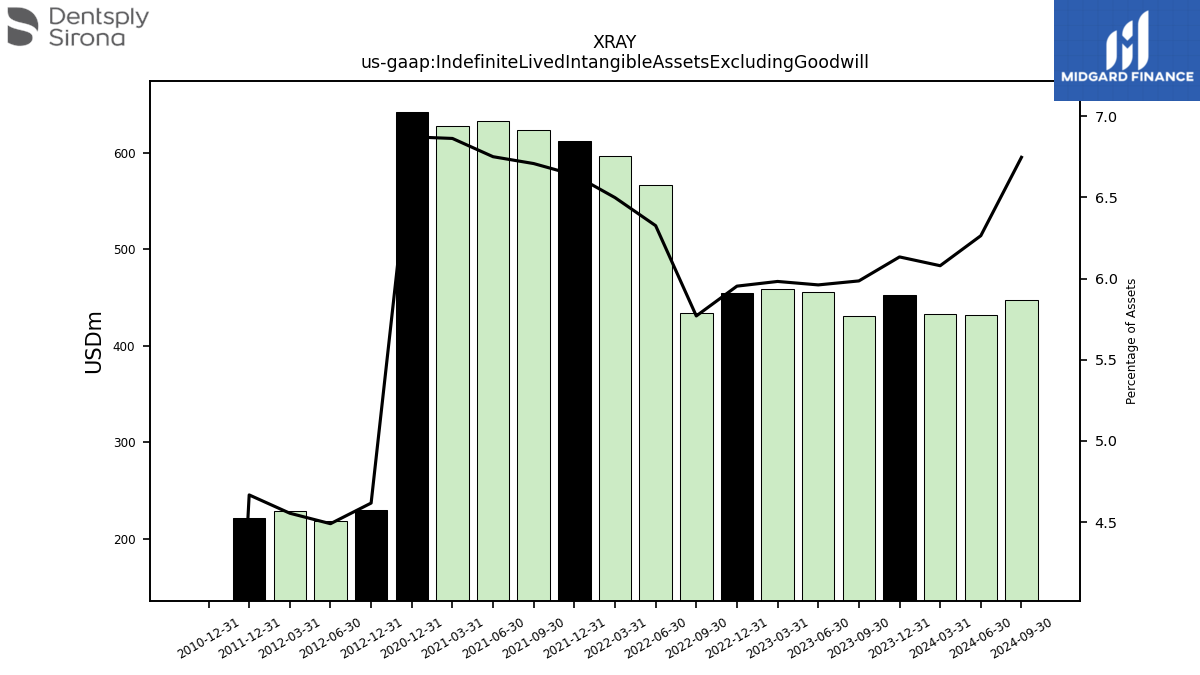
| Indefinite Lived Intangible Assets Excluding Goodwill | 452.00 | 431.00 | 456.00 | 459.00 | 455.00 | 434.00 | 566.00 | 596.00 | 612.00 | 623.00 | 633.00 | 627.00 | 642.00 | NA | NA | NA | NA | NA | NA | NA | NA | NA | NA | NA | NA | NA | NA | NA | NA | NA | NA | NA | NA | NA | NA | NA | NA | NA | NA | NA | NA | NA | NA | NA | 229.62 | NA | 218.74 | 228.46 | 221.99 | NA | NA | NA | 0.00 | NA | NA | NA | |
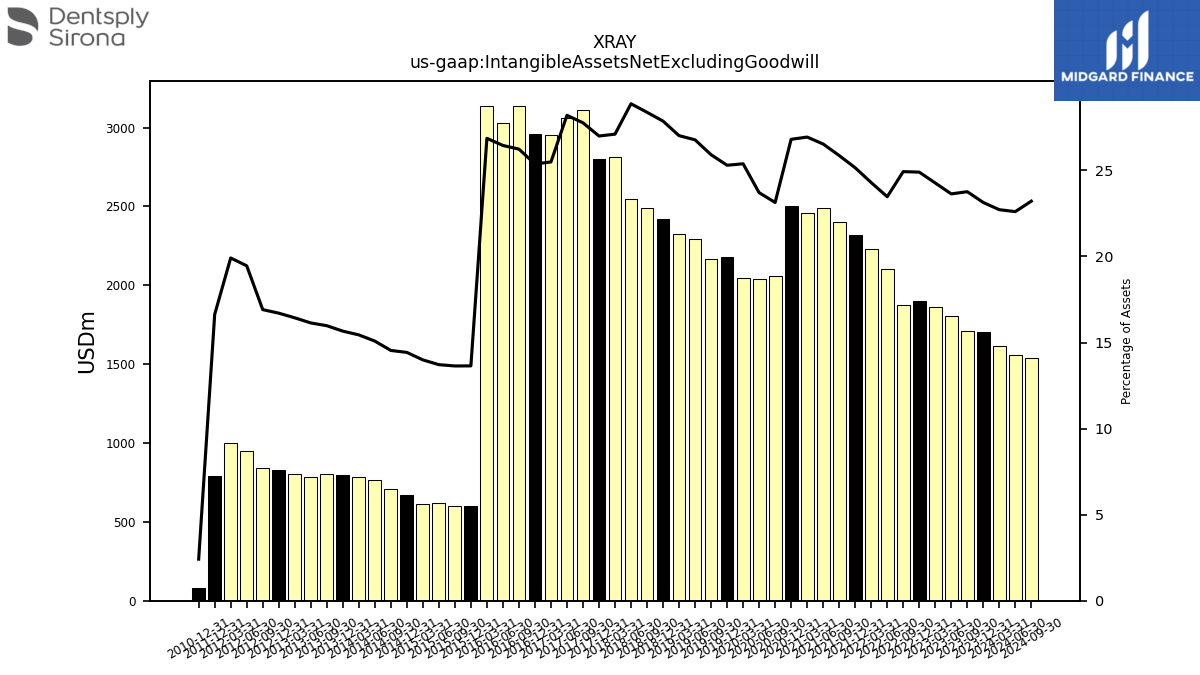
| Intangible Assets Net Excluding Goodwill | 1705.00 | 1711.00 | 1808.00 | 1862.00 | 1903.00 | 1875.00 | 2100.00 | 2228.00 | 2319.00 | 2402.00 | 2488.00 | 2461.00 | 2504.00 | 2058.10 | 2039.60 | 2045.40 | 2176.30 | 2167.70 | 2295.90 | 2324.70 | 2420.30 | 2488.00 | 2546.80 | 2811.40 | 2800.70 | 3109.20 | 3059.40 | 2955.10 | 2957.60 | 3135.60 | 3028.50 | 3138.10 | 600.70 | 600.40 | 616.67 | 613.46 | 670.84 | 710.11 | 765.11 | 786.00 | 795.32 | 800.47 | 786.67 | 805.65 | 830.64 | 841.75 | 947.75 | 998.54 | 791.10 | NA | NA | NA | 78.74 | NA | NA | NA | |
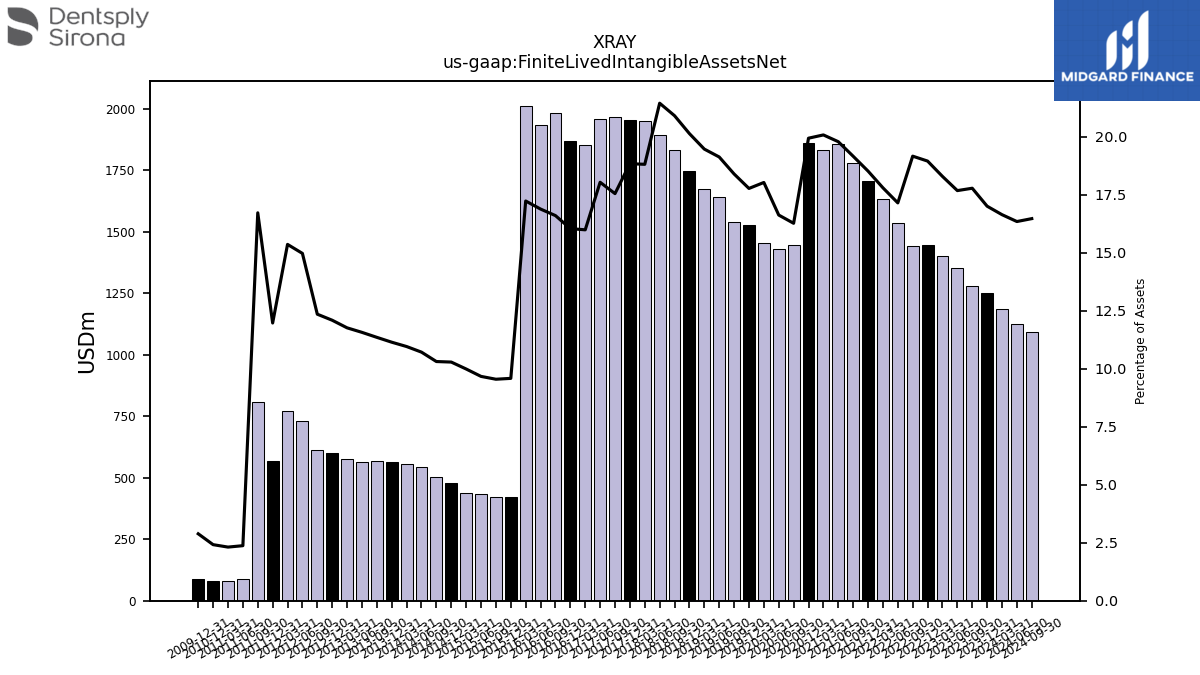
| Finite Lived Intangible Assets Net | 1253.00 | 1280.00 | 1352.00 | 1403.00 | 1448.00 | 1441.00 | 1534.00 | 1632.00 | 1707.00 | 1779.00 | 1855.00 | 1834.00 | 1862.00 | 1446.90 | 1430.00 | 1452.40 | 1528.40 | 1538.70 | 1639.80 | 1674.60 | 1748.60 | 1832.80 | 1891.40 | 1950.70 | 1953.90 | 1964.70 | 1956.50 | 1853.10 | 1869.20 | 1983.60 | 1932.70 | 2012.30 | 421.90 | 420.20 | 434.71 | 437.87 | 478.26 | 503.43 | 543.37 | 557.51 | 565.72 | 568.63 | 563.76 | 576.49 | 601.02 | 614.59 | 729.00 | 770.08 | 569.11 | 808.04 | 86.77 | 79.47 | 78.74 | NA | NA | NA | |
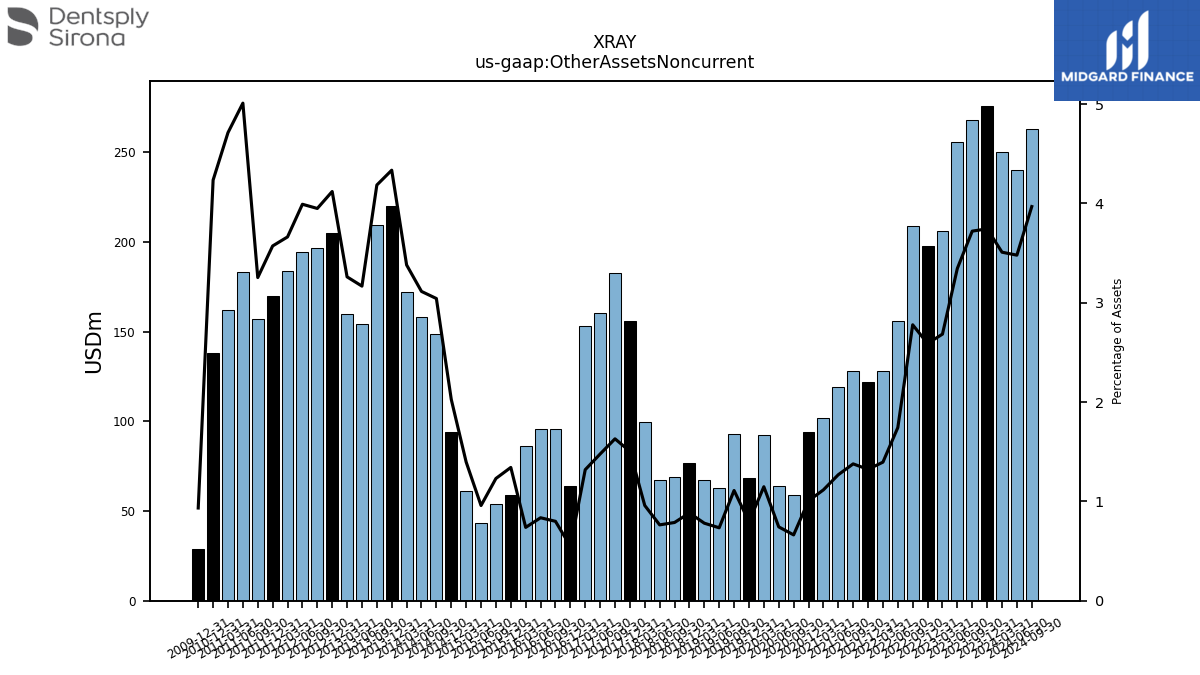
| Other Assets Noncurrent | 276.00 | 268.00 | 256.00 | 206.00 | 198.00 | 209.00 | 156.00 | 128.00 | 122.00 | 128.00 | 119.00 | 102.00 | 94.00 | 59.00 | 64.00 | 92.50 | 68.50 | 92.90 | 63.00 | 67.20 | 76.80 | 69.10 | 67.40 | 99.50 | 156.10 | 182.60 | 160.30 | 153.00 | 64.10 | 95.60 | 95.70 | 86.30 | 59.10 | 54.20 | 43.11 | 61.25 | 94.27 | 148.63 | 157.98 | 172.08 | 220.15 | 209.72 | 154.43 | 159.87 | 204.90 | 196.61 | 194.46 | 183.73 | 169.89 | 157.31 | 183.21 | 162.02 | 138.00 | NA | NA | NA |
| 2023-12-31 | 2023-09-30 | 2023-06-30 | 2023-03-31 | 2022-12-31 | 2022-09-30 | 2022-06-30 | 2022-03-31 | 2021-12-31 | 2021-09-30 | 2021-06-30 | 2021-03-31 | 2020-12-31 | 2020-09-30 | 2020-06-30 | 2020-03-31 | 2019-12-31 | 2019-09-30 | 2019-06-30 | 2019-03-31 | 2018-12-31 | 2018-09-30 | 2018-06-30 | 2018-03-31 | 2017-12-31 | 2017-09-30 | 2017-06-30 | 2017-03-31 | 2016-12-31 | 2016-09-30 | 2016-06-30 | 2016-03-31 | 2015-12-31 | 2015-09-30 | 2015-06-30 | 2015-03-31 | 2014-12-31 | 2014-09-30 | 2014-06-30 | 2014-03-31 | 2013-12-31 | 2013-09-30 | 2013-06-30 | 2013-03-31 | 2012-12-31 | 2012-09-30 | 2012-06-30 | 2012-03-31 | 2011-12-31 | 2011-09-30 | 2011-06-30 | 2011-03-31 | 2010-12-31 | 2010-09-30 | 2010-06-30 | 2010-03-31 | ||
|---|---|---|---|---|---|---|---|---|---|---|---|---|---|---|---|---|---|---|---|---|---|---|---|---|---|---|---|---|---|---|---|---|---|---|---|---|---|---|---|---|---|---|---|---|---|---|---|---|---|---|---|---|---|---|---|---|---|
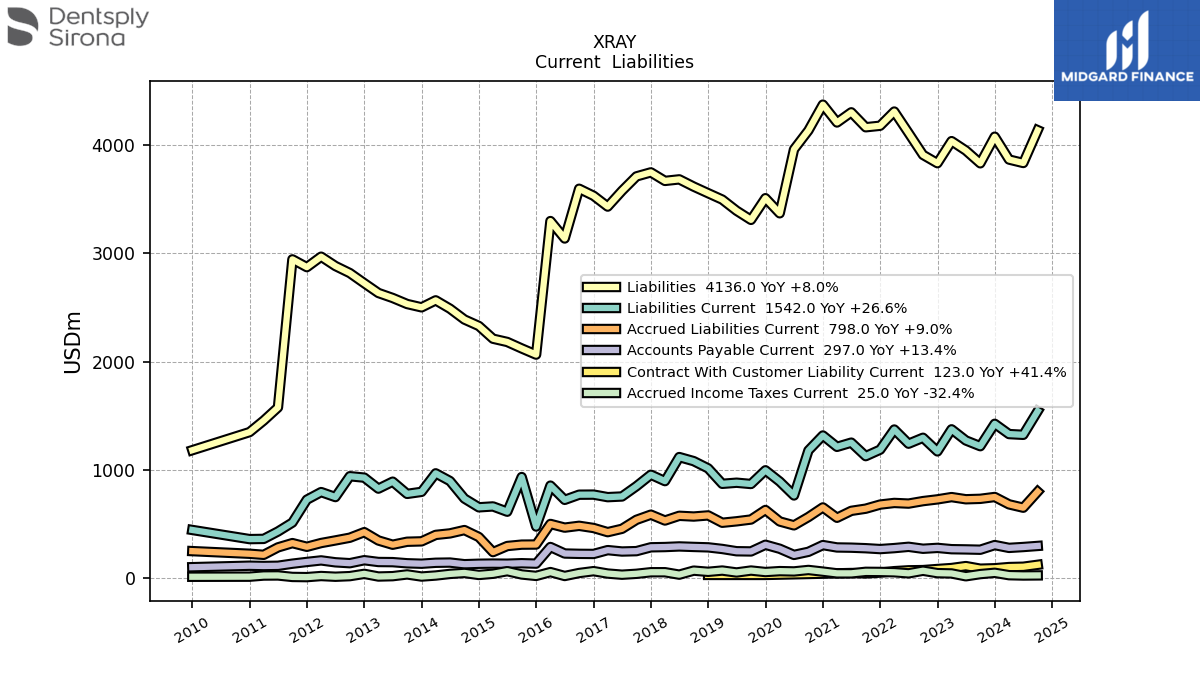
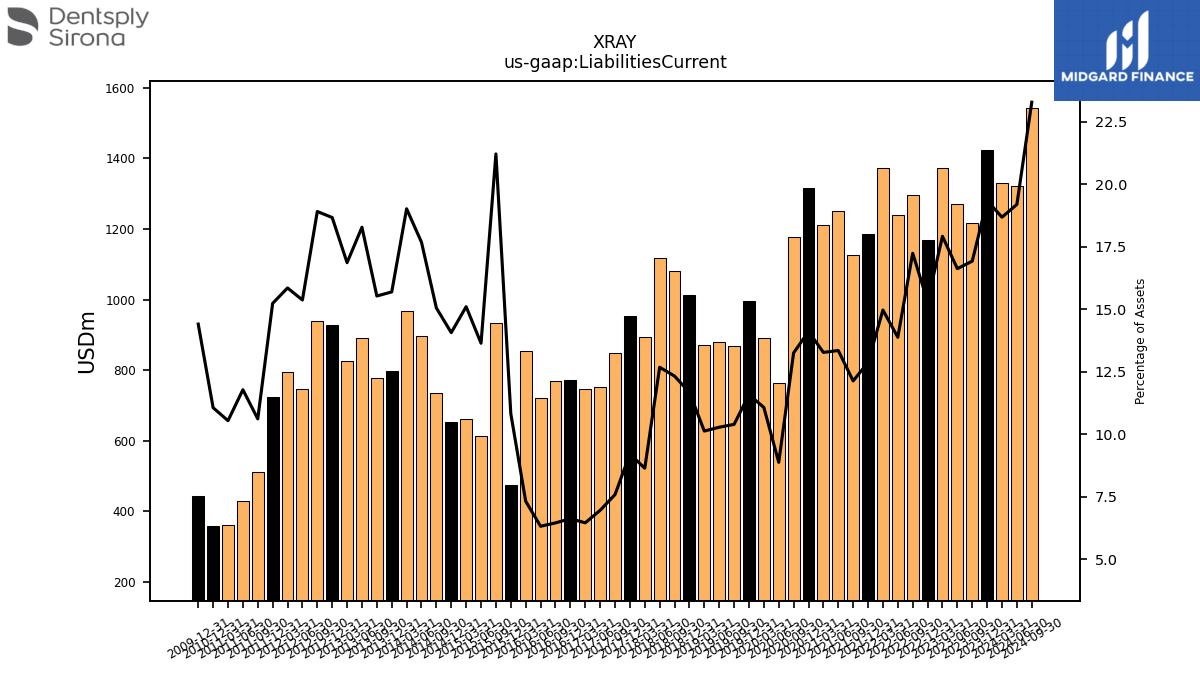
| Liabilities Current | 1425.00 | 1218.00 | 1271.00 | 1374.00 | 1170.00 | 1296.00 | 1241.00 | 1372.00 | 1186.00 | 1126.00 | 1251.00 | 1212.00 | 1317.00 | 1178.20 | 763.00 | 891.50 | 995.50 | 868.90 | 880.80 | 870.60 | 1013.30 | 1080.10 | 1117.70 | 895.40 | 954.50 | 848.40 | 753.70 | 747.50 | 771.00 | 770.20 | 722.50 | 854.20 | 476.00 | 933.40 | 612.97 | 661.83 | 653.59 | 734.57 | 896.31 | 967.45 | 796.40 | 777.56 | 890.62 | 826.16 | 927.78 | 940.72 | 748.20 | 794.48 | 724.07 | 512.69 | 430.43 | 362.01 | 360.09 | NA | NA | NA | |
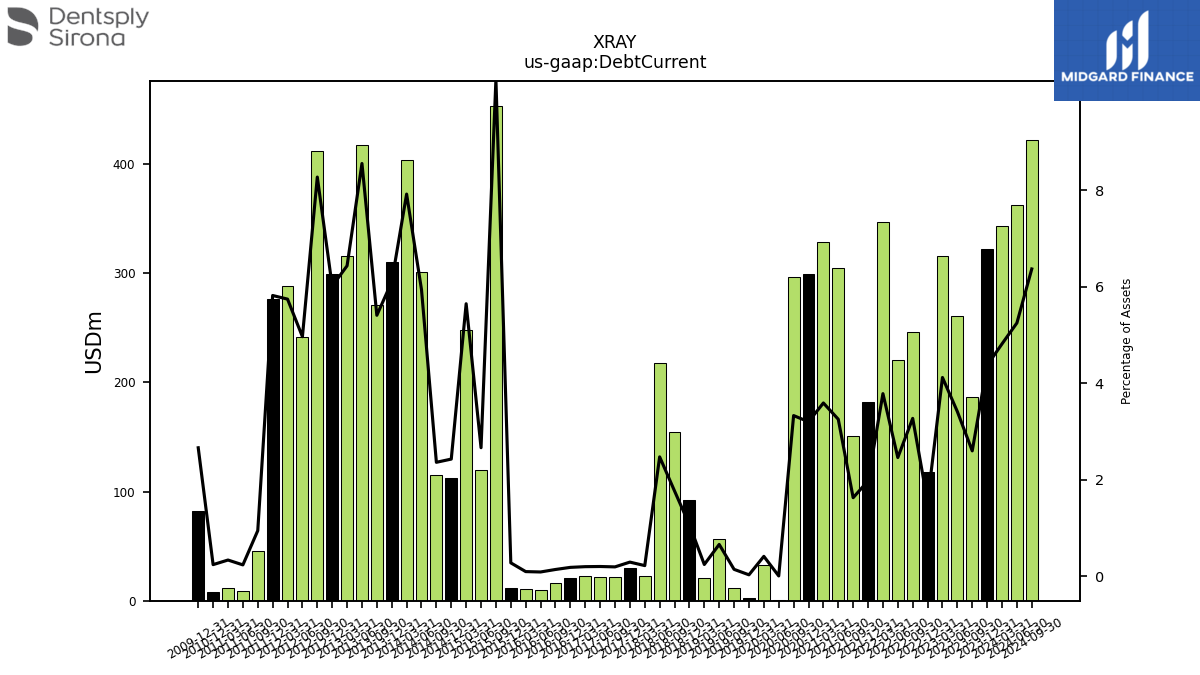
| Debt Current | 322.00 | 187.00 | 261.00 | 316.00 | 118.00 | 246.00 | 220.00 | 347.00 | 182.00 | 151.00 | 305.00 | 328.00 | 299.00 | 296.10 | 0.30 | 33.00 | 2.30 | 11.70 | 56.30 | 20.70 | 92.40 | 154.80 | 218.10 | 22.60 | 30.10 | 21.40 | 21.60 | 22.70 | 21.10 | 16.40 | 9.80 | 10.90 | 12.10 | 453.20 | 119.70 | 247.63 | 112.83 | 115.25 | 301.29 | 403.14 | 309.86 | 270.95 | 417.06 | 315.44 | 298.96 | 411.84 | 241.80 | 288.04 | 276.70 | 45.57 | 8.50 | 11.45 | 7.75 | NA | NA | NA | |
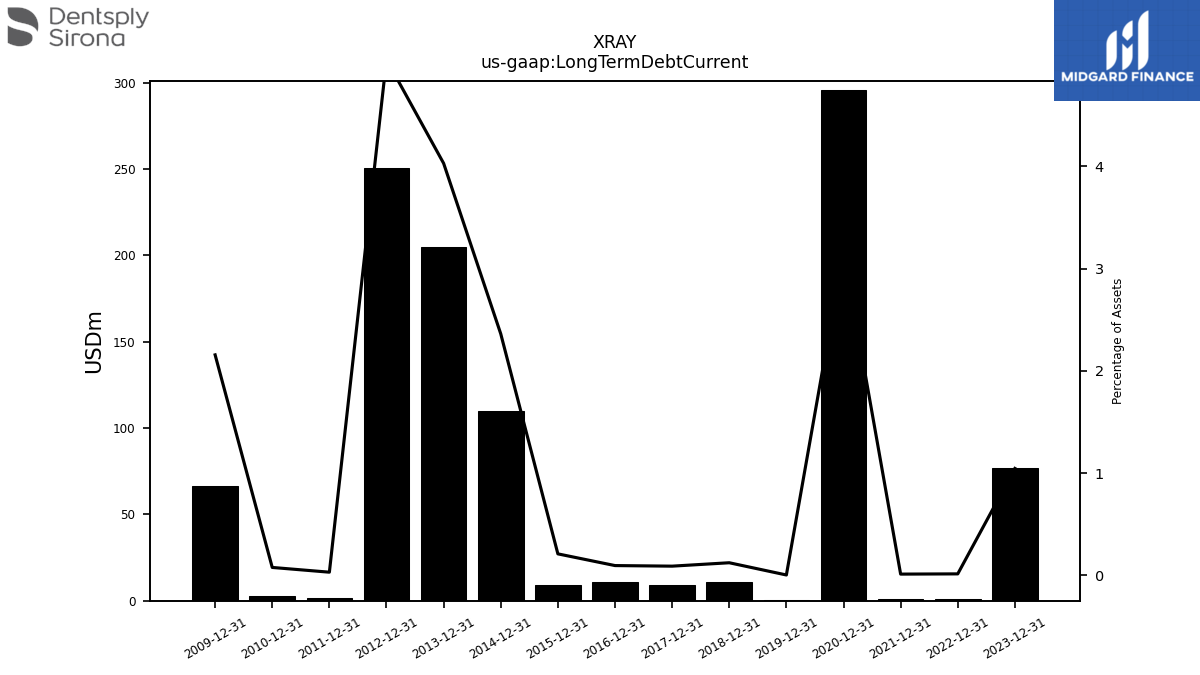
| Long Term Debt Current | 77.00 | NA | NA | NA | 1.00 | NA | NA | NA | 1.00 | NA | NA | NA | 296.00 | NA | NA | NA | 0.20 | NA | NA | NA | 10.60 | NA | NA | NA | 9.20 | NA | NA | NA | 11.00 | NA | NA | NA | 9.20 | NA | NA | NA | 109.83 | NA | NA | NA | 204.66 | NA | NA | NA | 250.88 | NA | NA | NA | 1.41 | NA | NA | NA | 2.48 | NA | NA | NA | |
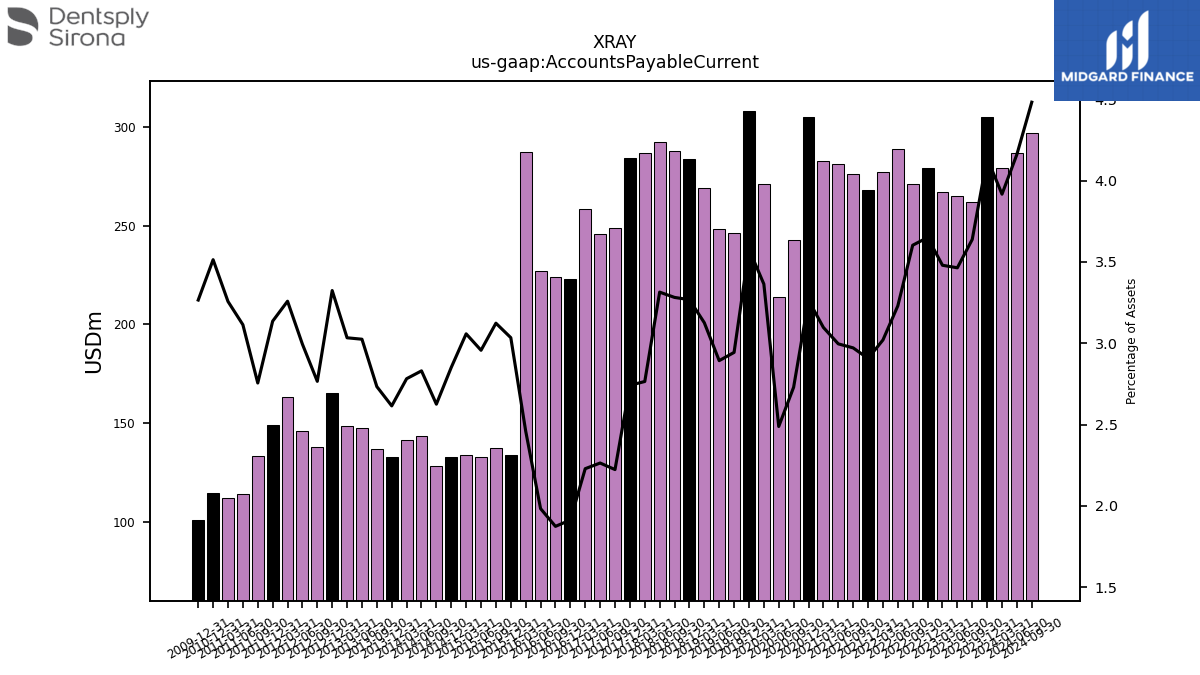
| Accounts Payable Current | 305.00 | 262.00 | 265.00 | 267.00 | 279.00 | 271.00 | 289.00 | 277.00 | 268.00 | 276.00 | 281.00 | 283.00 | 305.00 | 242.80 | 214.10 | 271.10 | 307.90 | 246.30 | 248.10 | 269.00 | 283.90 | 287.80 | 292.40 | 286.80 | 284.40 | 249.00 | 245.60 | 258.40 | 223.00 | 224.00 | 227.10 | 287.40 | 133.60 | 137.50 | 132.97 | 134.09 | 132.61 | 128.23 | 143.56 | 141.59 | 132.79 | 136.94 | 147.46 | 148.72 | 165.29 | 137.67 | 145.85 | 163.42 | 149.12 | 133.20 | 113.87 | 111.94 | 114.48 | NA | NA | NA | |
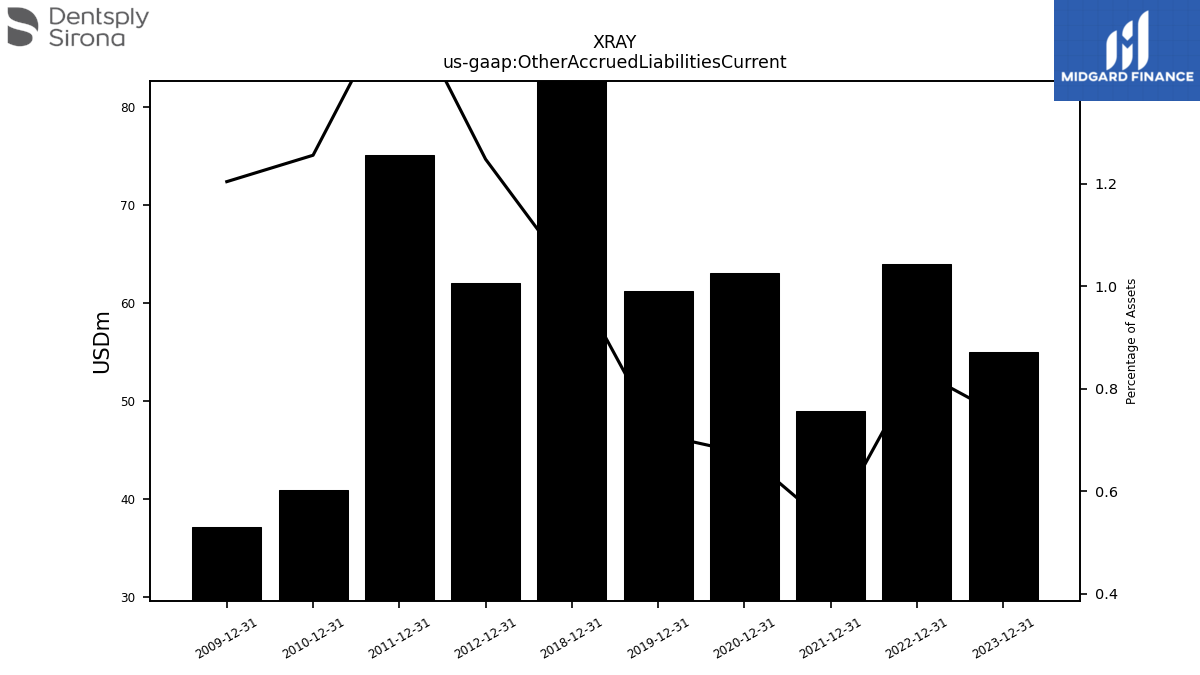
| Other Accrued Liabilities Current | 55.00 | NA | NA | NA | 64.00 | NA | NA | NA | 49.00 | NA | NA | NA | 63.00 | NA | NA | NA | 61.20 | NA | NA | NA | 88.70 | NA | NA | NA | NA | NA | NA | NA | NA | NA | NA | NA | NA | NA | NA | NA | NA | NA | NA | NA | NA | NA | NA | NA | 62.04 | NA | NA | NA | 75.04 | NA | NA | NA | 40.90 | NA | NA | NA | |
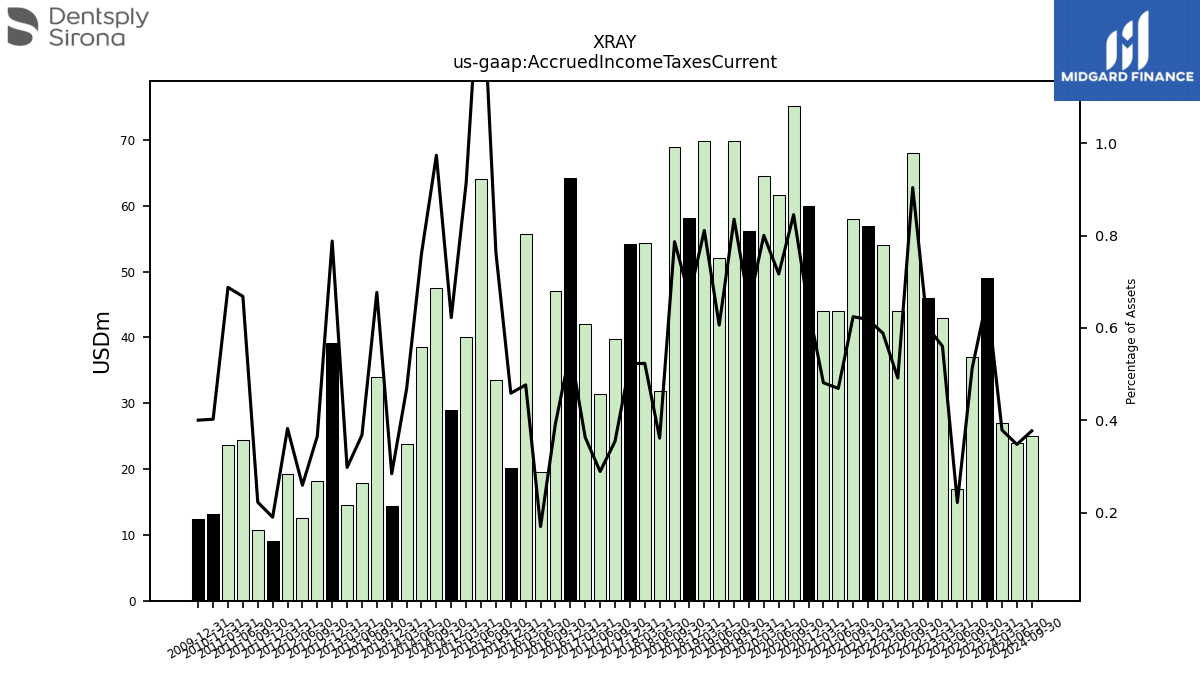
| Accrued Income Taxes Current | 49.00 | 37.00 | 17.00 | 43.00 | 46.00 | 68.00 | 44.00 | 54.00 | 57.00 | 58.00 | 44.00 | 44.00 | 60.00 | 75.20 | 61.70 | 64.50 | 56.10 | 69.90 | 52.00 | 69.80 | 58.10 | 69.00 | 31.90 | 54.30 | 54.20 | 39.70 | 31.40 | 42.10 | 64.20 | 47.00 | 19.50 | 55.70 | 20.20 | 33.60 | 64.02 | 40.07 | 28.95 | 47.57 | 38.60 | 23.83 | 14.45 | 33.92 | 17.95 | 14.62 | 39.19 | 18.21 | 12.65 | 19.18 | 9.05 | 10.78 | 24.44 | 23.64 | 13.11 | NA | NA | NA | |
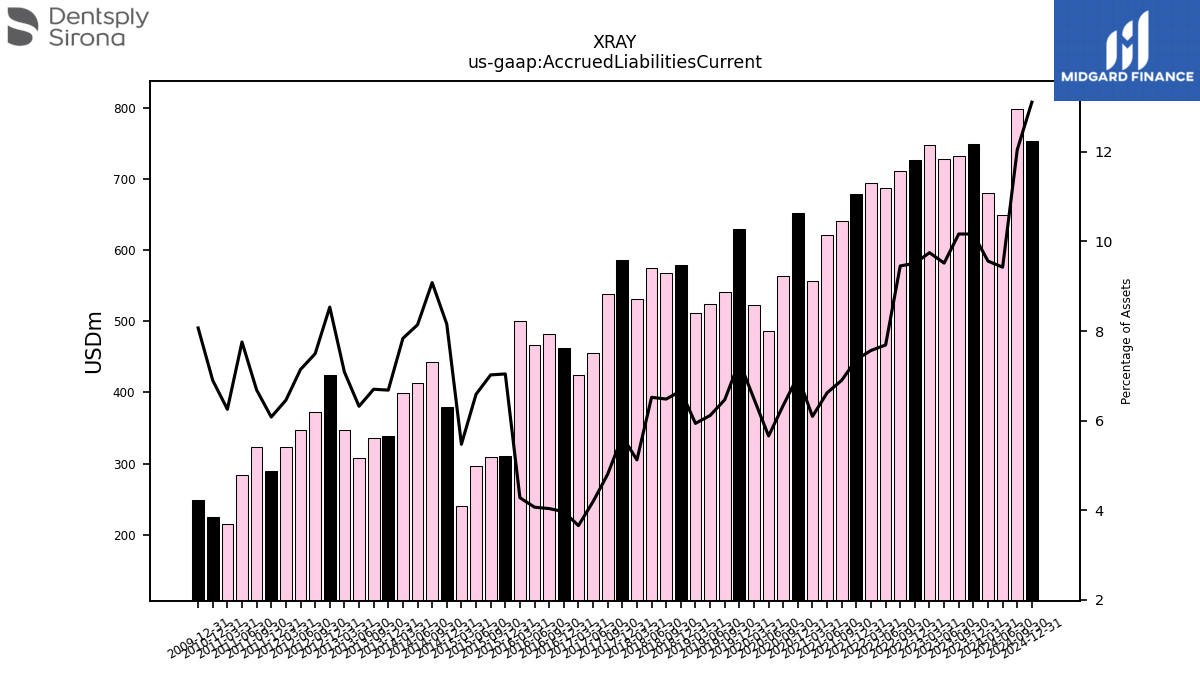
| Accrued Liabilities Current | 749.00 | 732.00 | 728.00 | 748.00 | 727.00 | 711.00 | 688.00 | 694.00 | 679.00 | 641.00 | 621.00 | 557.00 | 653.00 | 564.10 | 486.90 | 522.90 | 629.20 | 541.00 | 524.40 | 511.10 | 578.90 | 568.50 | 575.30 | 531.70 | 585.80 | 538.30 | 455.10 | 424.30 | 462.70 | 482.80 | 466.10 | 500.20 | 310.10 | 309.10 | 296.28 | 240.04 | 379.20 | 443.52 | 412.85 | 398.88 | 339.31 | 335.75 | 308.15 | 347.40 | 424.34 | 373.00 | 347.91 | 323.85 | 289.20 | 323.14 | 283.62 | 214.97 | 224.75 | NA | NA | NA | |
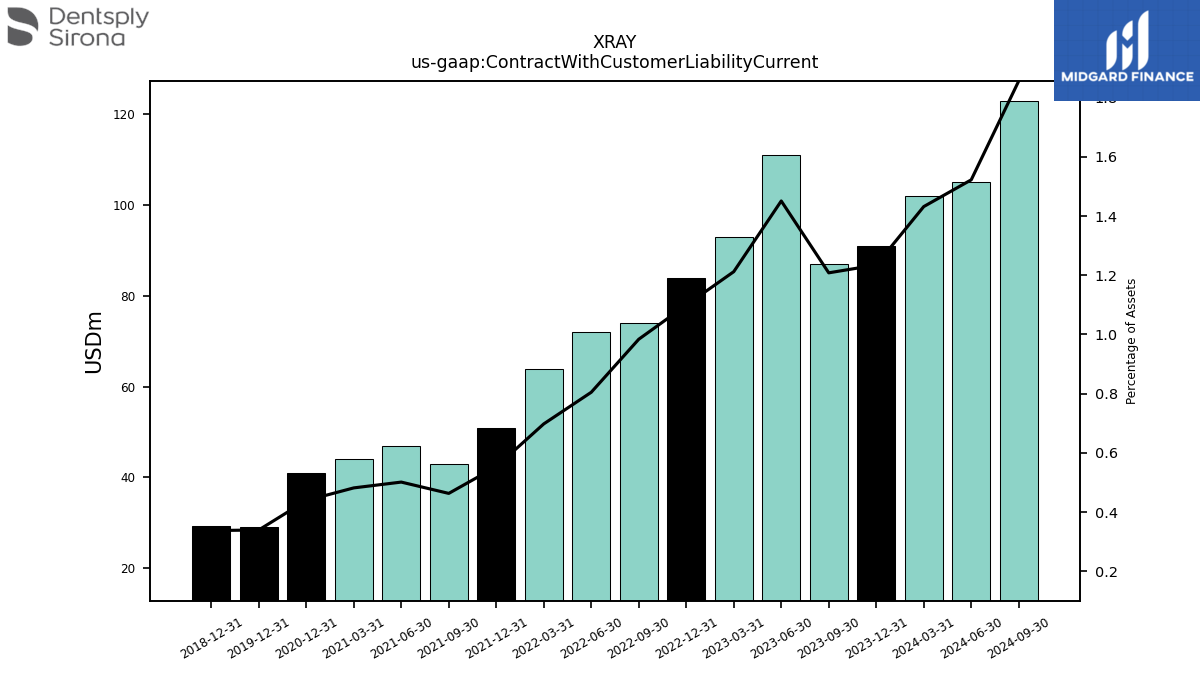
| Contract With Customer Liability Current | 91.00 | 87.00 | 111.00 | 93.00 | 84.00 | 74.00 | 72.00 | 64.00 | 51.00 | 43.00 | 47.00 | 44.00 | 41.00 | NA | NA | NA | 29.20 | NA | NA | NA | 29.30 | NA | NA | NA | NA | NA | NA | NA | NA | NA | NA | NA | NA | NA | NA | NA | NA | NA | NA | NA | NA | NA | NA | NA | NA | NA | NA | NA | NA | NA | NA | NA | NA | NA | NA | NA |
| 2023-12-31 | 2023-09-30 | 2023-06-30 | 2023-03-31 | 2022-12-31 | 2022-09-30 | 2022-06-30 | 2022-03-31 | 2021-12-31 | 2021-09-30 | 2021-06-30 | 2021-03-31 | 2020-12-31 | 2020-09-30 | 2020-06-30 | 2020-03-31 | 2019-12-31 | 2019-09-30 | 2019-06-30 | 2019-03-31 | 2018-12-31 | 2018-09-30 | 2018-06-30 | 2018-03-31 | 2017-12-31 | 2017-09-30 | 2017-06-30 | 2017-03-31 | 2016-12-31 | 2016-09-30 | 2016-06-30 | 2016-03-31 | 2015-12-31 | 2015-09-30 | 2015-06-30 | 2015-03-31 | 2014-12-31 | 2014-09-30 | 2014-06-30 | 2014-03-31 | 2013-12-31 | 2013-09-30 | 2013-06-30 | 2013-03-31 | 2012-12-31 | 2012-09-30 | 2012-06-30 | 2012-03-31 | 2011-12-31 | 2011-09-30 | 2011-06-30 | 2011-03-31 | 2010-12-31 | 2010-09-30 | 2010-06-30 | 2010-03-31 | ||
|---|---|---|---|---|---|---|---|---|---|---|---|---|---|---|---|---|---|---|---|---|---|---|---|---|---|---|---|---|---|---|---|---|---|---|---|---|---|---|---|---|---|---|---|---|---|---|---|---|---|---|---|---|---|---|---|---|---|
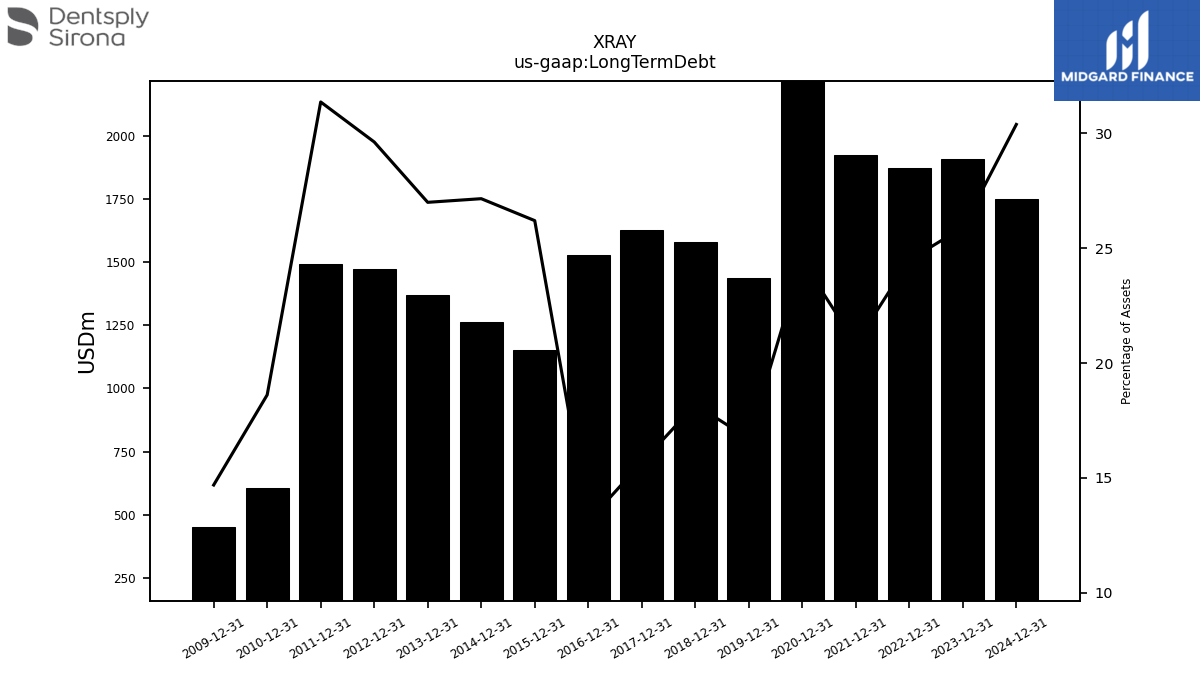
| Long Term Debt | 1909.00 | NA | NA | NA | 1871.00 | NA | NA | NA | 1922.00 | NA | NA | NA | 2284.00 | NA | NA | NA | 1437.80 | NA | NA | NA | 1580.00 | NA | NA | NA | 1626.10 | NA | NA | NA | 1528.20 | NA | NA | NA | 1153.50 | NA | NA | NA | 1262.71 | NA | NA | NA | 1370.83 | NA | NA | NA | 1472.91 | NA | NA | NA | 1491.42 | NA | NA | NA | 606.49 | NA | NA | NA | |
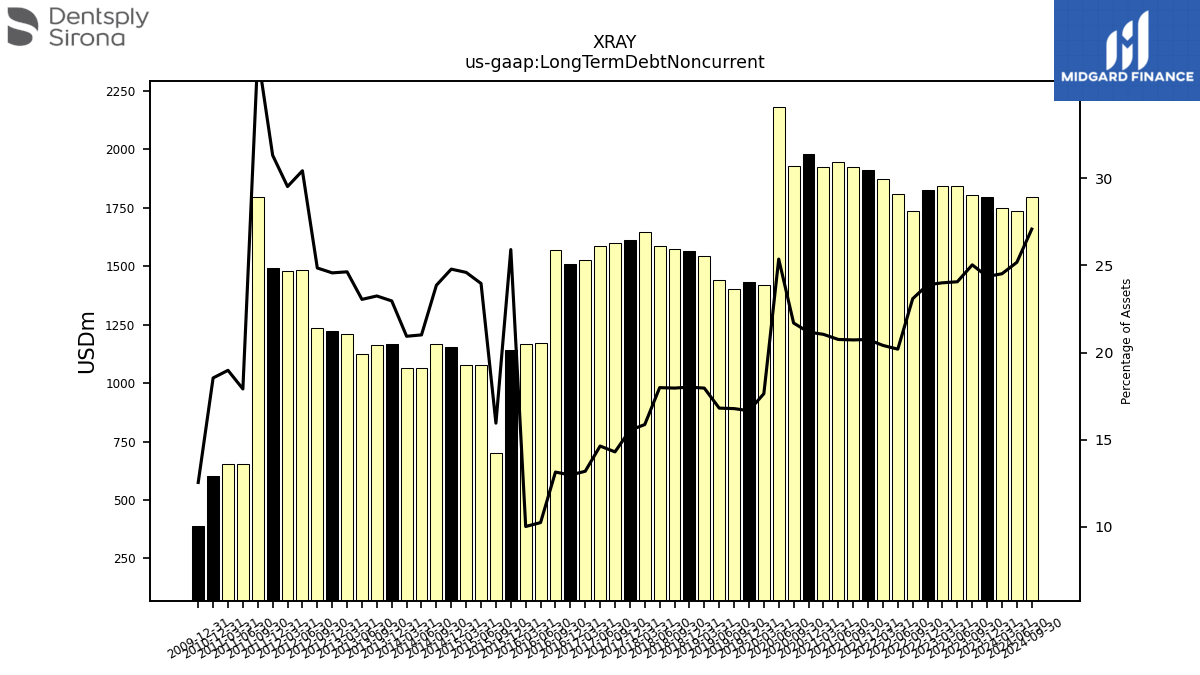
| Long Term Debt Noncurrent | 1796.00 | 1803.00 | 1841.00 | 1842.00 | 1826.00 | 1737.00 | 1807.00 | 1872.00 | 1913.00 | 1925.00 | 1946.00 | 1923.00 | 1978.00 | 1930.00 | 2182.70 | 1421.20 | 1433.10 | 1403.90 | 1441.30 | 1545.10 | 1564.90 | 1574.80 | 1586.60 | 1645.50 | 1611.60 | 1600.70 | 1587.30 | 1528.10 | 1511.10 | 1569.80 | 1171.80 | 1169.10 | 1141.00 | 701.90 | 1077.78 | 1078.82 | 1152.88 | 1165.57 | 1065.88 | 1065.46 | 1166.18 | 1164.79 | 1123.79 | 1207.72 | 1222.04 | 1237.24 | 1482.78 | 1481.22 | 1490.01 | 1793.98 | 654.87 | 652.29 | 604.01 | NA | NA | NA | |
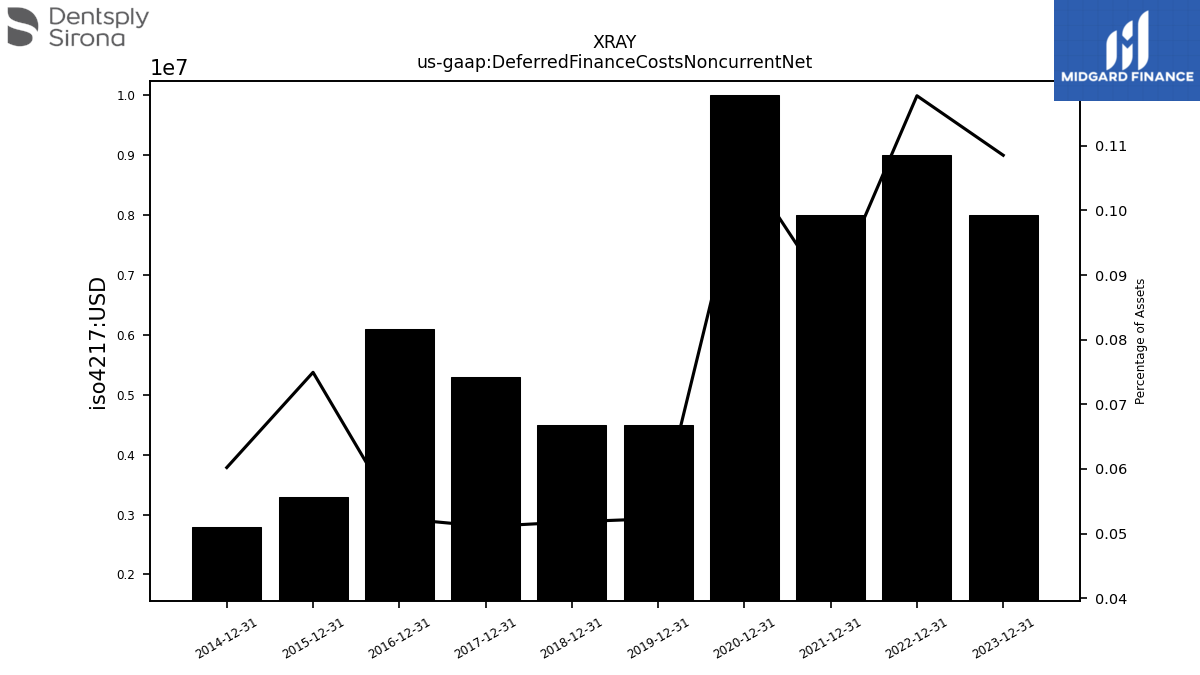
| Deferred Finance Costs Noncurrent Net | 8.00 | NA | NA | NA | 9.00 | NA | NA | NA | 8.00 | NA | NA | NA | 10.00 | NA | NA | NA | 4.50 | NA | NA | NA | 4.50 | NA | NA | NA | 5.30 | NA | NA | NA | 6.10 | NA | NA | NA | 3.30 | NA | NA | NA | 2.80 | NA | NA | NA | NA | NA | NA | NA | NA | NA | NA | NA | NA | NA | NA | NA | NA | NA | NA | NA | |
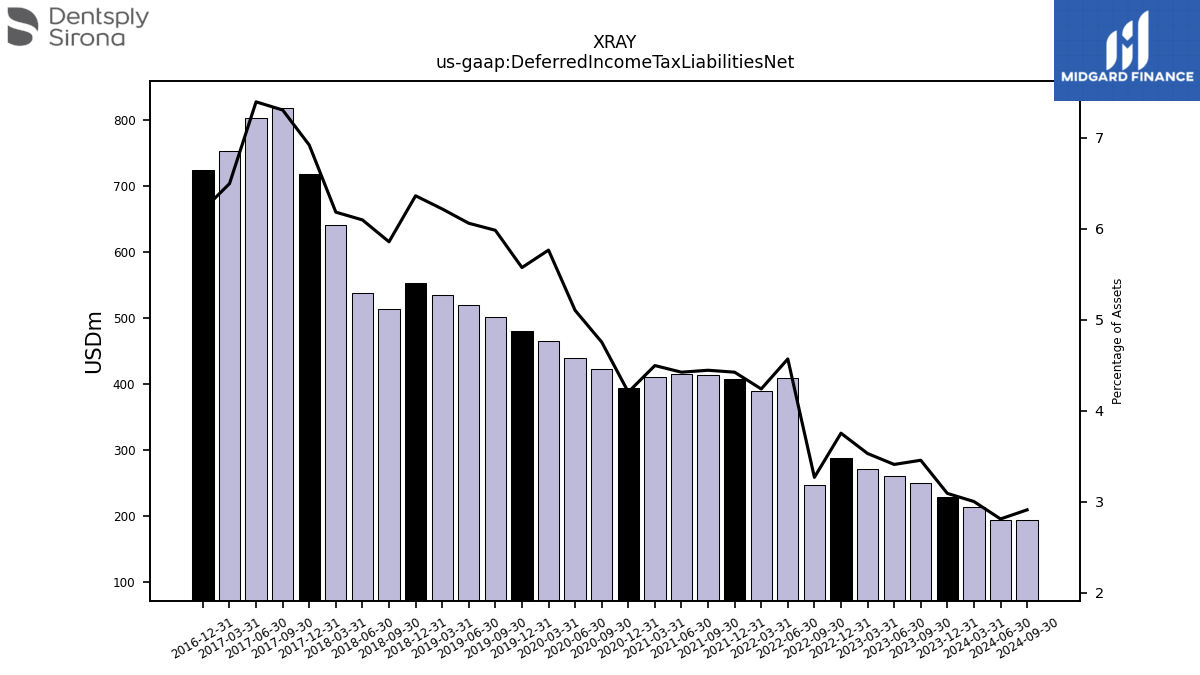
| Deferred Income Tax Liabilities Net | 228.00 | 249.00 | 261.00 | 271.00 | 287.00 | 246.00 | 409.00 | 389.00 | 408.00 | 413.00 | 415.00 | 411.00 | 393.00 | 423.10 | 439.20 | 464.70 | 479.60 | 500.70 | 519.80 | 535.10 | 552.80 | 513.70 | 538.00 | 641.40 | 718.00 | 818.20 | 802.40 | 753.20 | 723.50 | NA | NA | NA | NA | NA | NA | NA | NA | NA | NA | NA | NA | NA | NA | NA | NA | NA | NA | NA | NA | NA | NA | NA | NA | NA | NA | NA | |
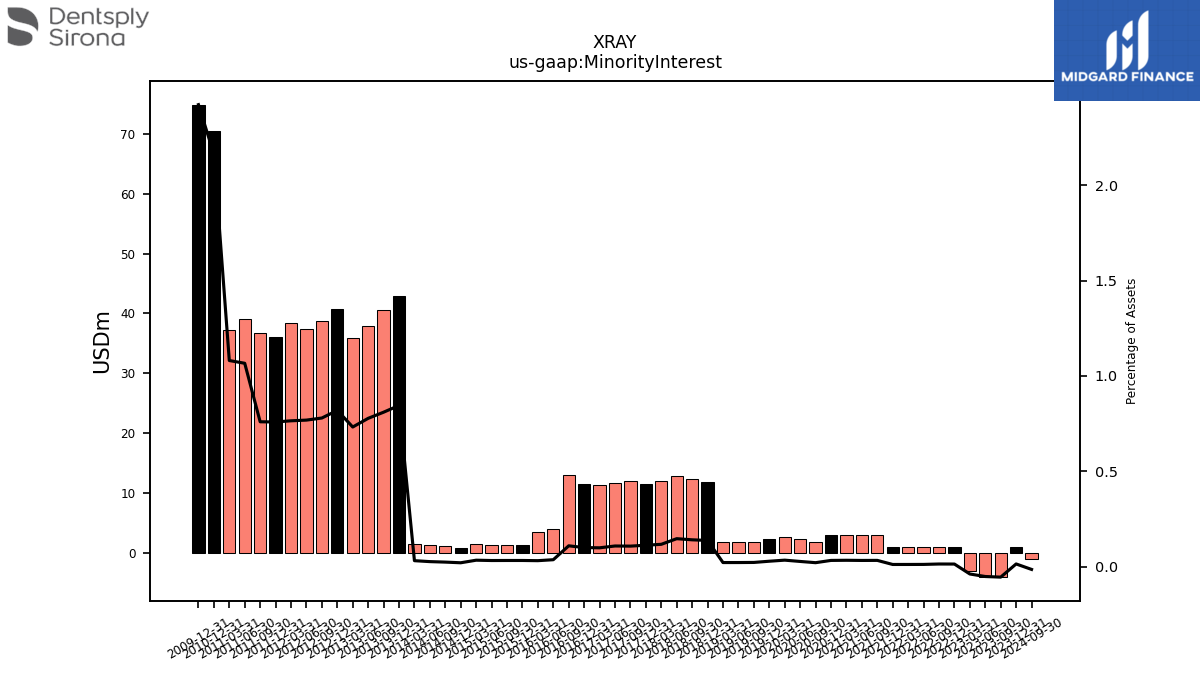
| Minority Interest | 1.00 | -4.00 | -4.00 | -3.00 | 1.00 | 1.00 | 1.00 | 1.00 | 1.00 | 3.00 | 3.00 | 3.00 | 3.00 | 1.80 | 2.30 | 2.70 | 2.40 | 1.80 | 1.80 | 1.80 | 11.90 | 12.30 | 12.90 | 12.10 | 11.60 | 12.00 | 11.70 | 11.40 | 11.60 | 13.00 | 4.10 | 3.60 | 1.40 | 1.40 | 1.42 | 1.46 | 0.92 | 1.14 | 1.31 | 1.56 | 42.92 | 40.58 | 37.91 | 35.89 | 40.74 | 38.80 | 37.43 | 38.36 | 36.07 | 36.72 | 39.00 | 37.16 | 70.53 | NA | NA | NA | |
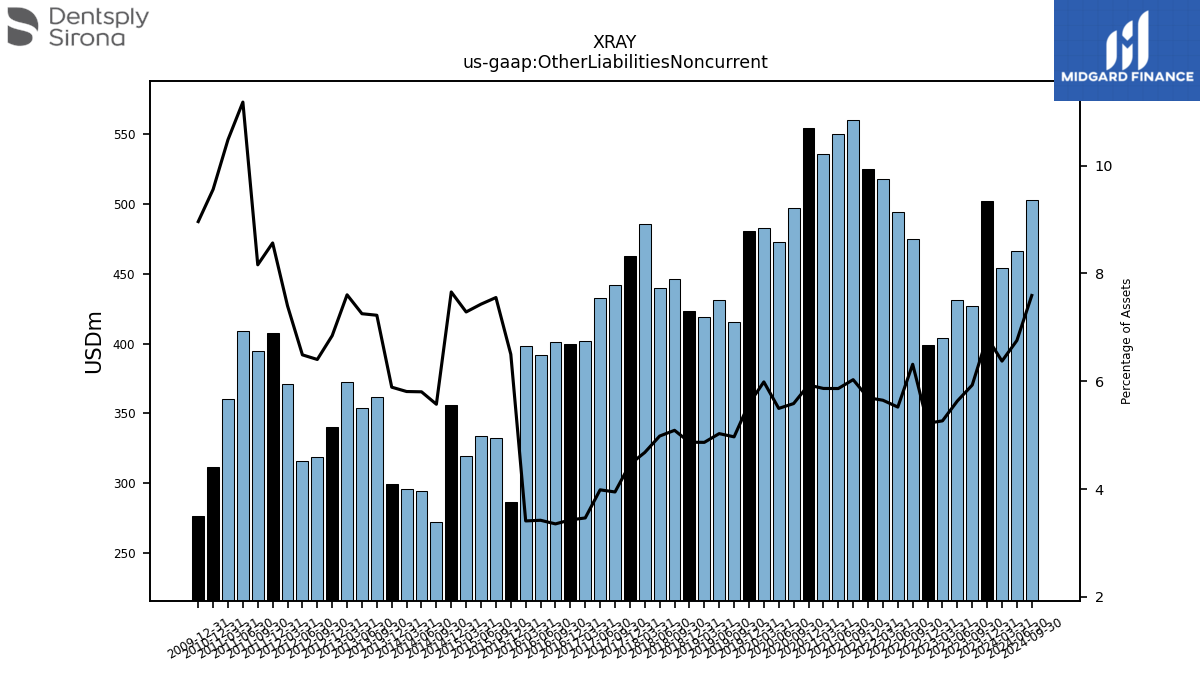
| Other Liabilities Noncurrent | 502.00 | 427.00 | 431.00 | 404.00 | 399.00 | 475.00 | 494.00 | 518.00 | 525.00 | 560.00 | 550.00 | 536.00 | 554.00 | 496.90 | 472.90 | 482.50 | 480.30 | 415.70 | 431.20 | 418.70 | 423.00 | 446.30 | 439.60 | 485.30 | 462.50 | 441.90 | 432.40 | 401.60 | 399.50 | 400.80 | 391.70 | 398.20 | 286.20 | 332.50 | 334.13 | 319.45 | 356.04 | 272.20 | 294.40 | 295.66 | 299.10 | 361.94 | 353.56 | 372.75 | 340.40 | 318.76 | 316.10 | 371.02 | 407.34 | 394.47 | 408.79 | 360.29 | 311.44 | NA | NA | NA | |
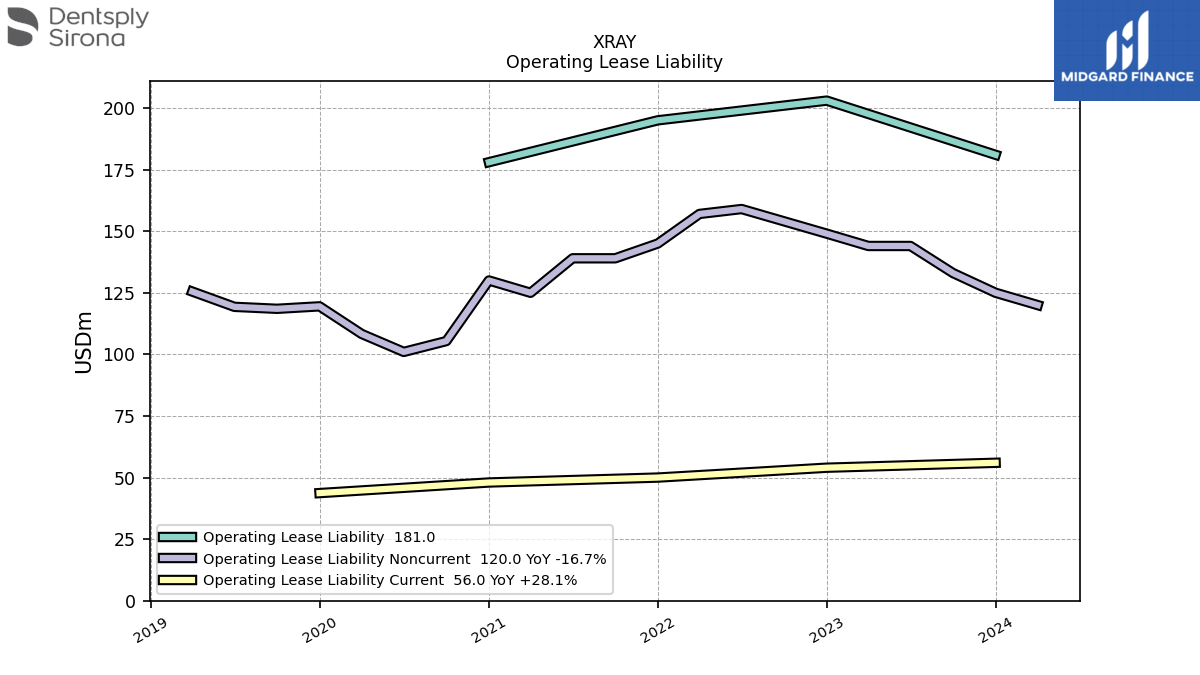
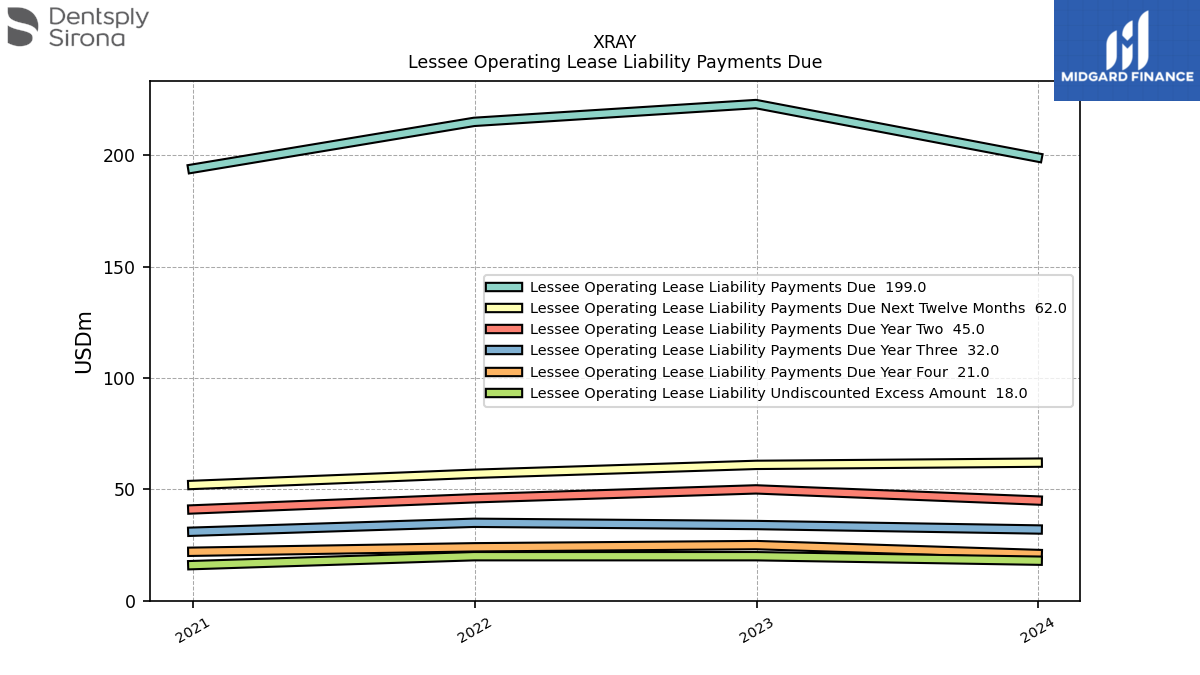
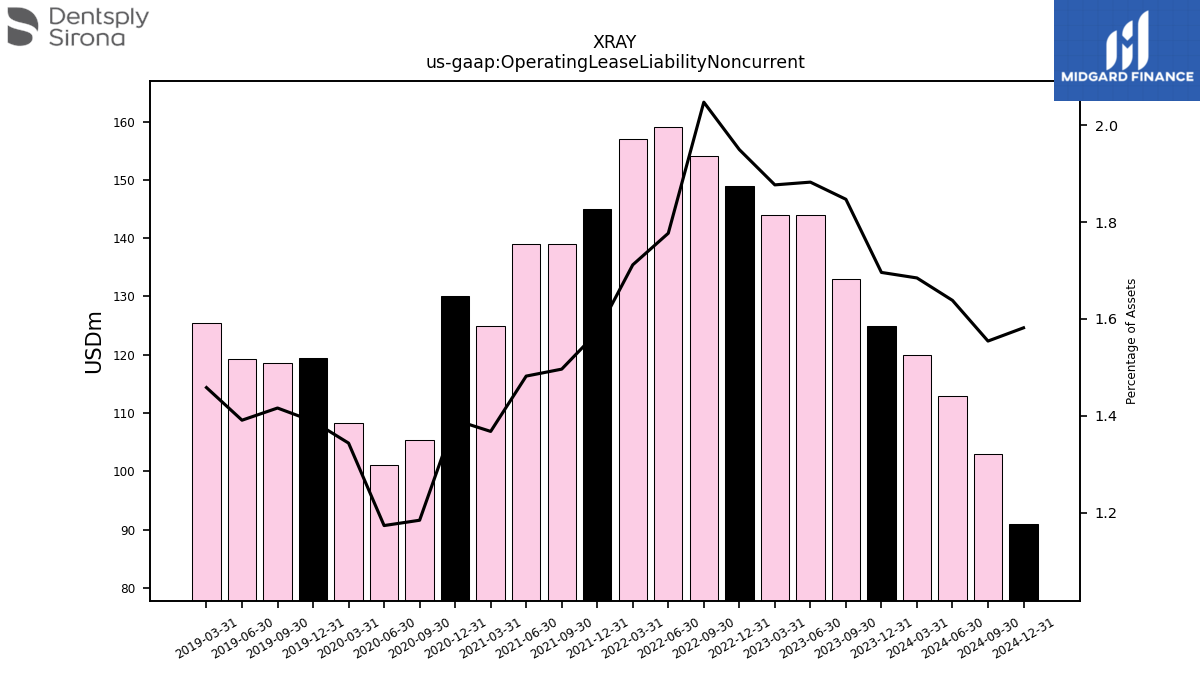
| Operating Lease Liability Noncurrent | 125.00 | 133.00 | 144.00 | 144.00 | 149.00 | 154.00 | 159.00 | 157.00 | 145.00 | 139.00 | 139.00 | 125.00 | 130.00 | 105.40 | 101.00 | 108.30 | 119.50 | 118.50 | 119.30 | 125.50 | NA | NA | NA | NA | NA | NA | NA | NA | NA | NA | NA | NA | NA | NA | NA | NA | NA | NA | NA | NA | NA | NA | NA | NA | NA | NA | NA | NA | NA | NA | NA | NA | NA | NA | NA | NA |
| 2023-12-31 | 2023-09-30 | 2023-06-30 | 2023-03-31 | 2022-12-31 | 2022-09-30 | 2022-06-30 | 2022-03-31 | 2021-12-31 | 2021-09-30 | 2021-06-30 | 2021-03-31 | 2020-12-31 | 2020-09-30 | 2020-06-30 | 2020-03-31 | 2019-12-31 | 2019-09-30 | 2019-06-30 | 2019-03-31 | 2018-12-31 | 2018-09-30 | 2018-06-30 | 2018-03-31 | 2017-12-31 | 2017-09-30 | 2017-06-30 | 2017-03-31 | 2016-12-31 | 2016-09-30 | 2016-06-30 | 2016-03-31 | 2015-12-31 | 2015-09-30 | 2015-06-30 | 2015-03-31 | 2014-12-31 | 2014-09-30 | 2014-06-30 | 2014-03-31 | 2013-12-31 | 2013-09-30 | 2013-06-30 | 2013-03-31 | 2012-12-31 | 2012-09-30 | 2012-06-30 | 2012-03-31 | 2011-12-31 | 2011-09-30 | 2011-06-30 | 2011-03-31 | 2010-12-31 | 2010-09-30 | 2010-06-30 | 2010-03-31 | ||
|---|---|---|---|---|---|---|---|---|---|---|---|---|---|---|---|---|---|---|---|---|---|---|---|---|---|---|---|---|---|---|---|---|---|---|---|---|---|---|---|---|---|---|---|---|---|---|---|---|---|---|---|---|---|---|---|---|---|
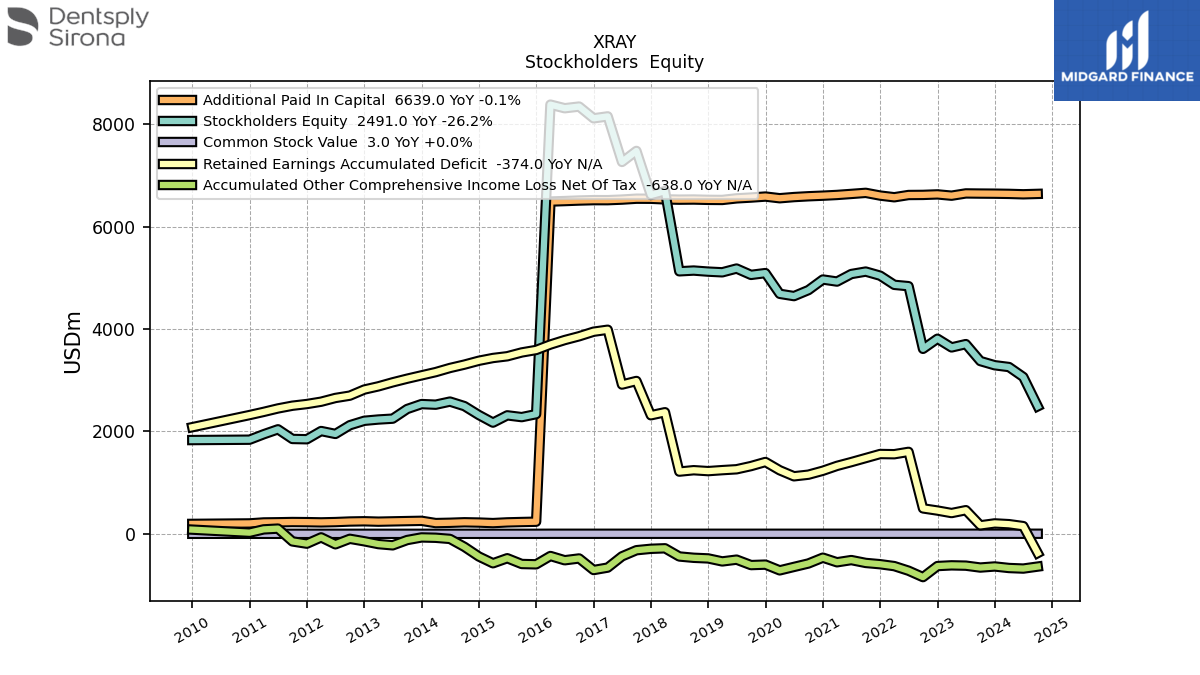
| Stockholders Equity | 3293.00 | 3375.00 | 3706.00 | 3641.00 | 3811.00 | 3613.00 | 4837.00 | 4863.00 | 5042.00 | 5122.00 | 5074.00 | 4927.00 | 4967.00 | 4760.50 | 4643.10 | 4687.50 | 5092.50 | 5057.30 | 5181.10 | 5107.70 | 5121.10 | 5142.00 | 5127.20 | 6693.10 | 6616.30 | 7477.80 | 7262.50 | 8152.20 | 8114.30 | 8344.10 | 8311.50 | 8381.80 | 2338.00 | 2280.10 | 2314.87 | 2172.79 | 2321.28 | 2495.11 | 2583.46 | 2523.03 | 2535.05 | 2438.44 | 2250.18 | 2233.50 | 2208.70 | 2122.07 | 1951.57 | 2008.62 | 1848.08 | 1853.69 | 2042.23 | 1945.34 | 1839.39 | NA | NA | NA | |
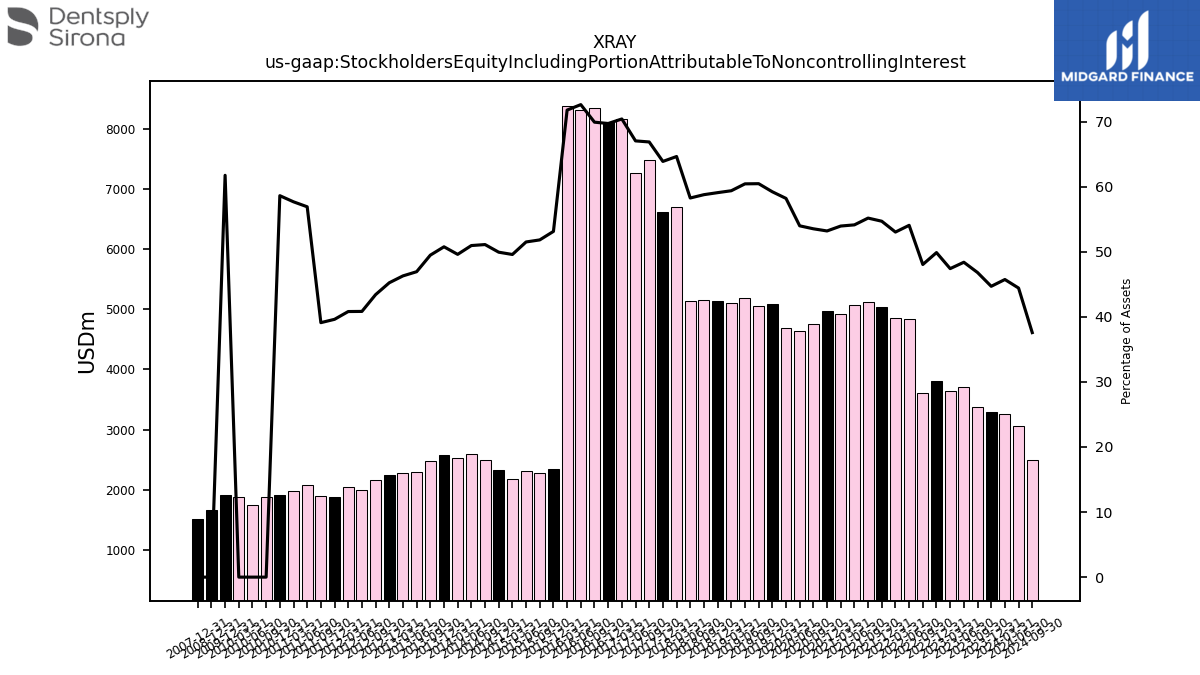
| Stockholders Equity Including Portion Attributable To Noncontrolling Interest | 3294.00 | 3371.00 | 3702.00 | 3638.00 | 3812.00 | 3614.00 | 4838.00 | 4864.00 | 5043.00 | 5125.00 | 5077.00 | 4930.00 | 4970.00 | 4762.30 | 4645.40 | 4690.20 | 5094.90 | 5059.10 | 5182.90 | 5109.50 | 5133.00 | 5154.30 | 5140.10 | 6705.20 | 6627.90 | 7489.80 | 7274.20 | 8163.60 | 8125.90 | 8357.10 | 8315.60 | 8385.40 | 2339.40 | 2281.50 | 2316.29 | 2174.25 | 2322.20 | 2496.24 | 2584.77 | 2524.60 | 2577.97 | 2479.02 | 2288.10 | 2269.39 | 2249.44 | 2160.87 | 1989.00 | 2046.97 | 1884.15 | 1890.41 | 2081.23 | 1982.50 | 1909.91 | 1876.56 | 1741.41 | 1882.62 | |
| Common Stock Value | 3.00 | 3.00 | 3.00 | 3.00 | 3.00 | 3.00 | 3.00 | 3.00 | 3.00 | 3.00 | 3.00 | 3.00 | 3.00 | 2.60 | 2.60 | 2.60 | 2.60 | 2.60 | 2.60 | 2.60 | 2.60 | 2.60 | 2.60 | 2.60 | 2.60 | 2.60 | 2.60 | 2.60 | 2.60 | 2.60 | 2.60 | 2.60 | 1.60 | 1.60 | 1.63 | 1.63 | 1.63 | 1.63 | 1.63 | 1.63 | 1.63 | 1.63 | 1.63 | 1.63 | 1.63 | 1.63 | 1.63 | 1.63 | 1.63 | 1.63 | 1.63 | 1.63 | 1.63 | NA | NA | NA | |
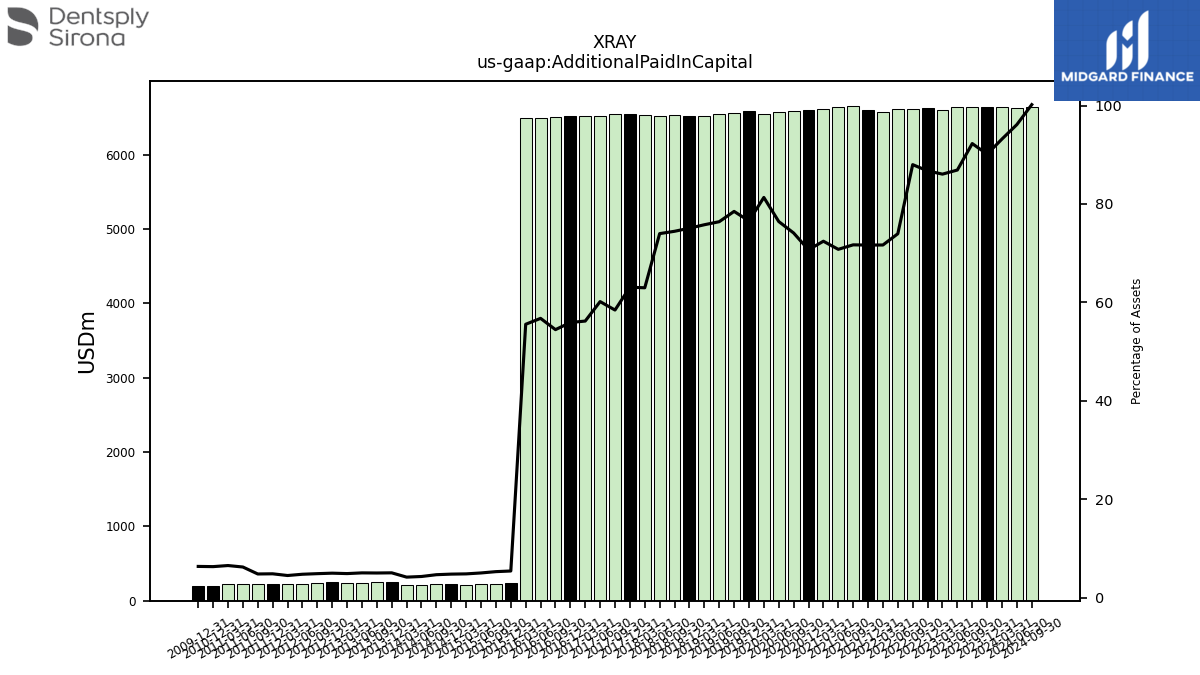
| Additional Paid In Capital | 6643.00 | 6645.00 | 6648.00 | 6604.00 | 6629.00 | 6619.00 | 6617.00 | 6573.00 | 6606.00 | 6659.00 | 6638.00 | 6618.00 | 6604.00 | 6592.40 | 6576.70 | 6553.90 | 6586.70 | 6567.20 | 6551.30 | 6520.40 | 6522.30 | 6528.70 | 6526.20 | 6531.70 | 6543.90 | 6544.90 | 6527.40 | 6516.20 | 6516.70 | 6509.30 | 6498.80 | 6489.70 | 237.80 | 232.00 | 225.00 | 211.11 | 221.67 | 227.03 | 217.27 | 211.47 | 255.27 | 250.15 | 244.60 | 238.94 | 246.55 | 241.84 | 230.86 | 224.84 | 229.69 | 231.82 | 227.07 | 223.75 | 204.90 | NA | NA | NA | |
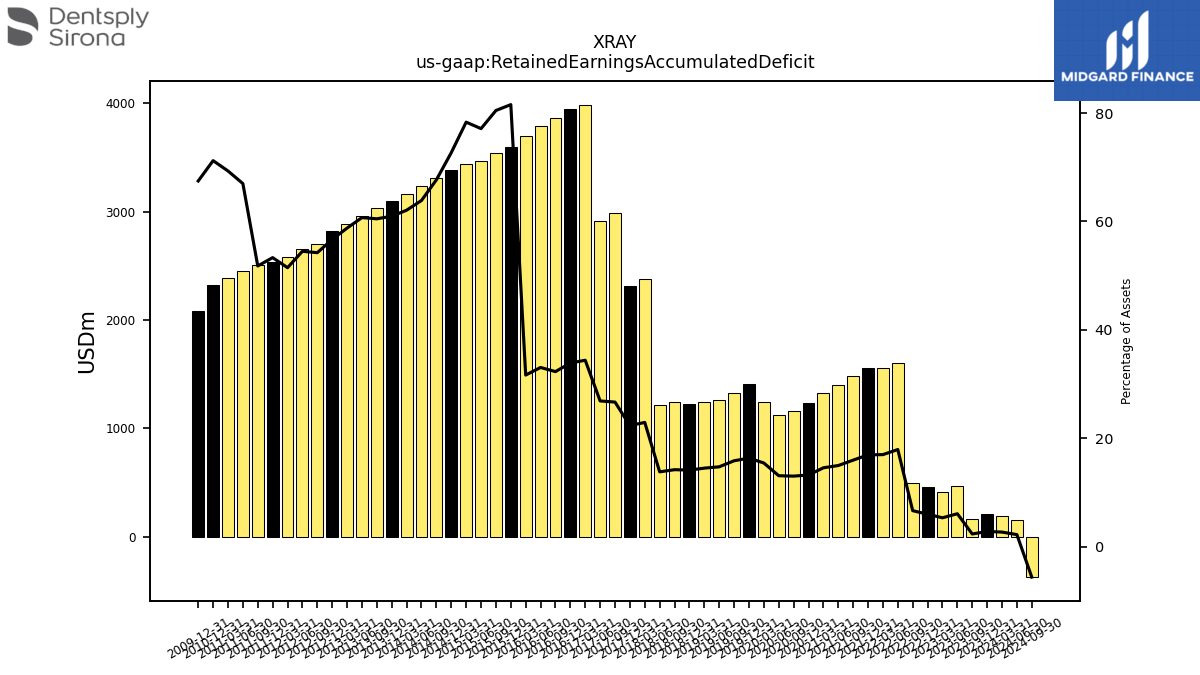
| Retained Earnings Accumulated Deficit | 205.00 | 167.00 | 463.00 | 407.00 | 456.00 | 498.00 | 1602.00 | 1556.00 | 1560.00 | 1481.00 | 1402.00 | 1328.00 | 1233.00 | 1156.20 | 1124.70 | 1242.20 | 1404.20 | 1324.30 | 1261.80 | 1245.00 | 1225.90 | 1243.60 | 1216.20 | 2375.90 | 2316.20 | 2986.00 | 2915.60 | 3986.40 | 3948.00 | 3859.00 | 3784.70 | 3697.50 | 3591.00 | 3542.70 | 3468.36 | 3434.48 | 3380.75 | 3305.45 | 3239.64 | 3159.12 | 3095.72 | 3030.25 | 2959.39 | 2881.13 | 2818.46 | 2699.55 | 2654.04 | 2581.13 | 2535.71 | 2502.95 | 2449.46 | 2382.34 | 2320.35 | NA | NA | NA | |
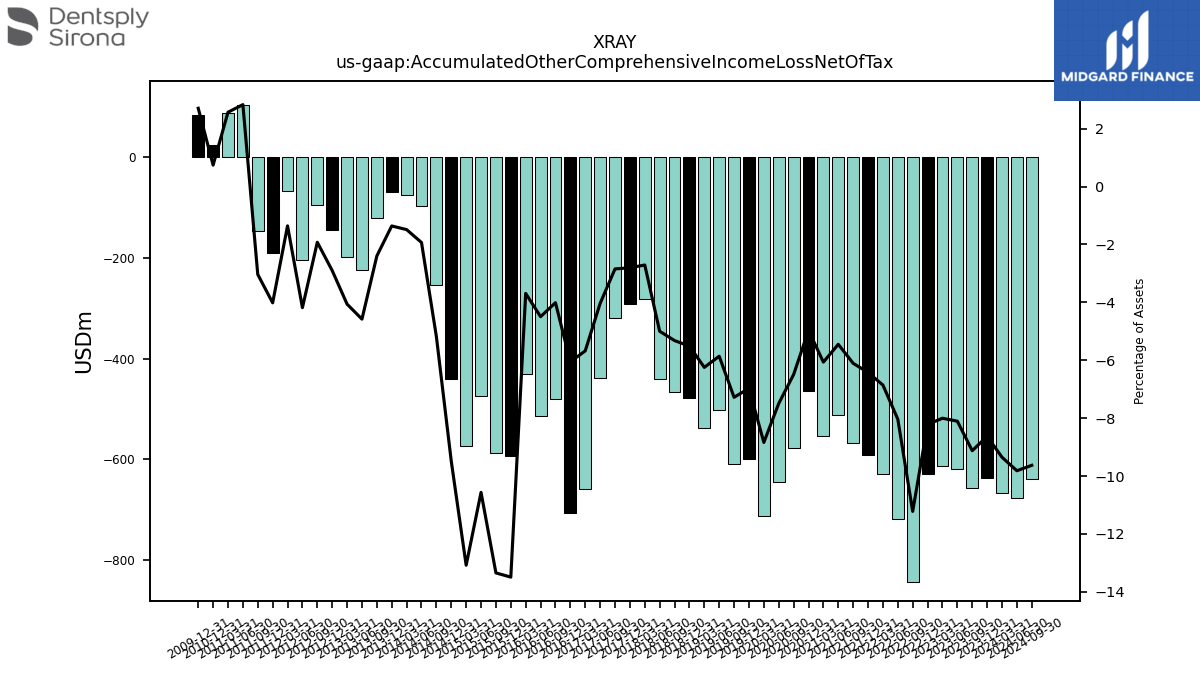
| Accumulated Other Comprehensive Income Loss Net Of Tax | -636.00 | -657.00 | -620.00 | -614.00 | -628.00 | -844.00 | -719.00 | -629.00 | -592.00 | -567.00 | -511.00 | -554.00 | -464.00 | -577.60 | -644.70 | -712.20 | -599.70 | -609.10 | -502.60 | -537.40 | -478.70 | -466.50 | -440.80 | -281.00 | -291.00 | -318.60 | -438.00 | -658.00 | -705.70 | -479.40 | -514.60 | -431.20 | -594.00 | -587.50 | -475.01 | -573.57 | -441.14 | -253.06 | -98.00 | -75.67 | -69.06 | -120.10 | -223.22 | -199.10 | -144.20 | -95.78 | -203.71 | -68.03 | -190.97 | -146.68 | 103.51 | 88.27 | 24.16 | NA | NA | NA | |
| Minority Interest | 1.00 | -4.00 | -4.00 | -3.00 | 1.00 | 1.00 | 1.00 | 1.00 | 1.00 | 3.00 | 3.00 | 3.00 | 3.00 | 1.80 | 2.30 | 2.70 | 2.40 | 1.80 | 1.80 | 1.80 | 11.90 | 12.30 | 12.90 | 12.10 | 11.60 | 12.00 | 11.70 | 11.40 | 11.60 | 13.00 | 4.10 | 3.60 | 1.40 | 1.40 | 1.42 | 1.46 | 0.92 | 1.14 | 1.31 | 1.56 | 42.92 | 40.58 | 37.91 | 35.89 | 40.74 | 38.80 | 37.43 | 38.36 | 36.07 | 36.72 | 39.00 | 37.16 | 70.53 | NA | NA | NA |
| 2023-12-31 | 2023-09-30 | 2023-06-30 | 2023-03-31 | 2022-12-31 | 2022-09-30 | 2022-06-30 | 2022-03-31 | 2021-12-31 | 2021-09-30 | 2021-06-30 | 2021-03-31 | 2020-12-31 | 2020-09-30 | 2020-06-30 | 2020-03-31 | 2019-12-31 | 2019-09-30 | 2019-06-30 | 2019-03-31 | 2018-12-31 | 2018-09-30 | 2018-06-30 | 2018-03-31 | 2017-12-31 | 2017-09-30 | 2017-06-30 | 2017-03-31 | 2016-12-31 | 2016-09-30 | 2016-06-30 | 2016-03-31 | 2015-12-31 | 2015-09-30 | 2015-06-30 | 2015-03-31 | 2014-12-31 | 2014-09-30 | 2014-06-30 | 2014-03-31 | 2013-12-31 | 2013-09-30 | 2013-06-30 | 2013-03-31 | 2012-12-31 | 2012-09-30 | 2012-06-30 | 2012-03-31 | 2011-12-31 | 2011-09-30 | 2011-06-30 | 2011-03-31 | 2010-12-31 | 2010-09-30 | 2010-06-30 | 2010-03-31 | ||
|---|---|---|---|---|---|---|---|---|---|---|---|---|---|---|---|---|---|---|---|---|---|---|---|---|---|---|---|---|---|---|---|---|---|---|---|---|---|---|---|---|---|---|---|---|---|---|---|---|---|---|---|---|---|---|---|---|---|
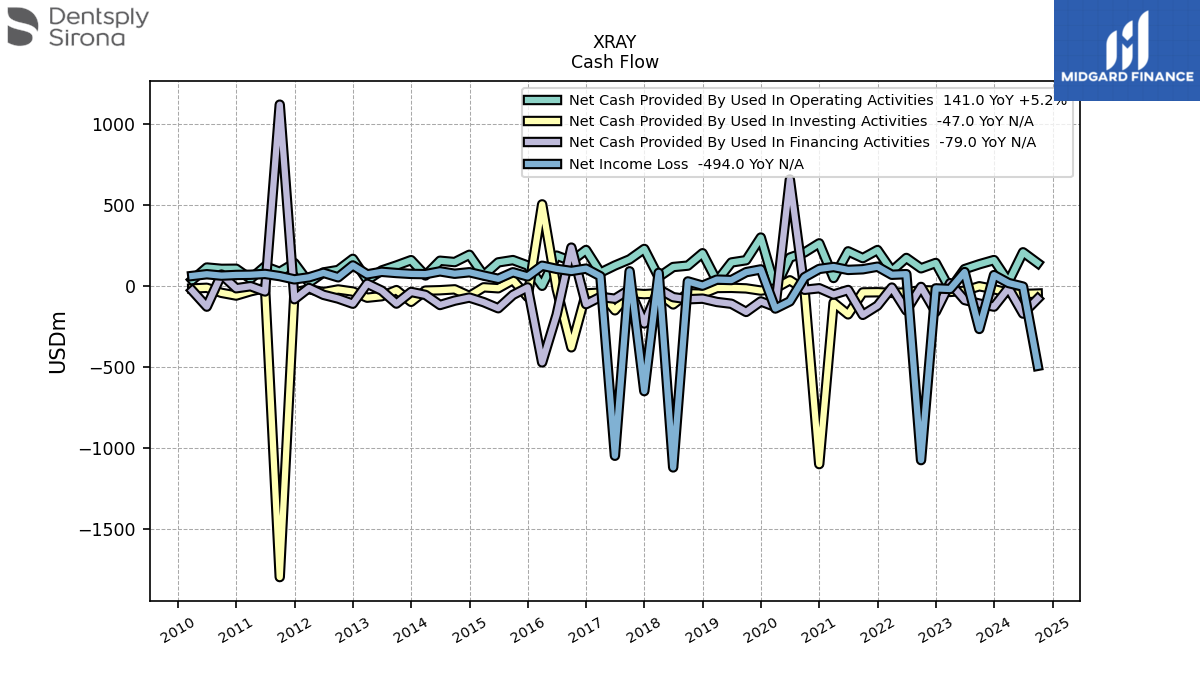
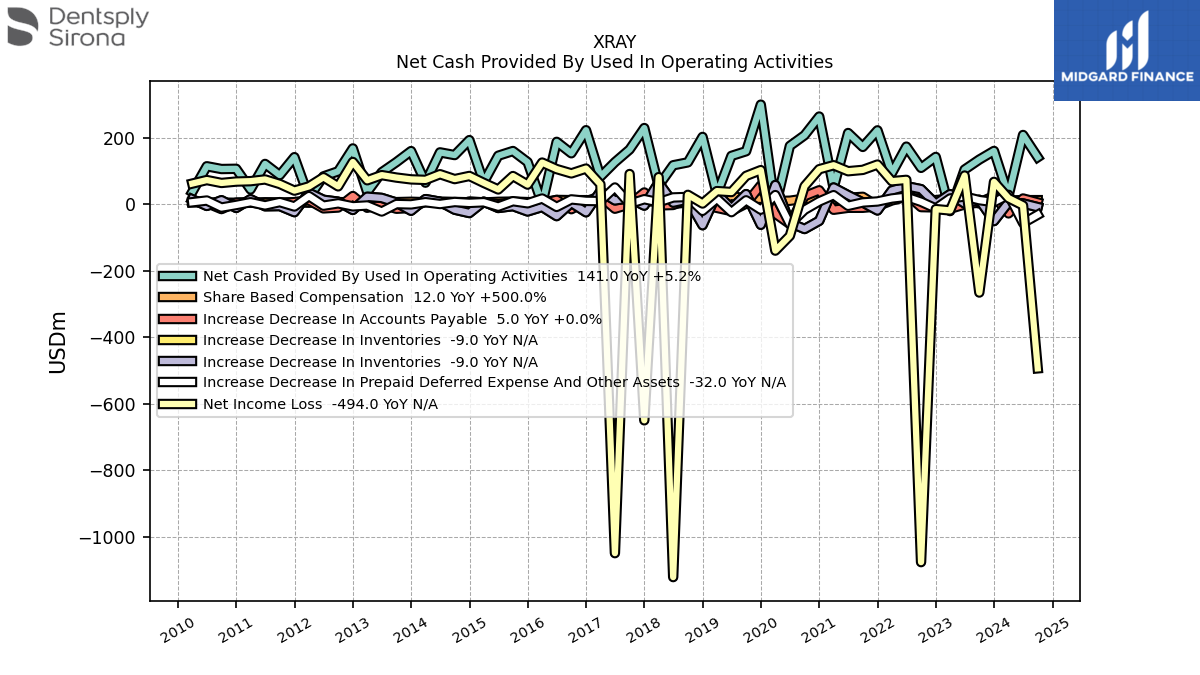
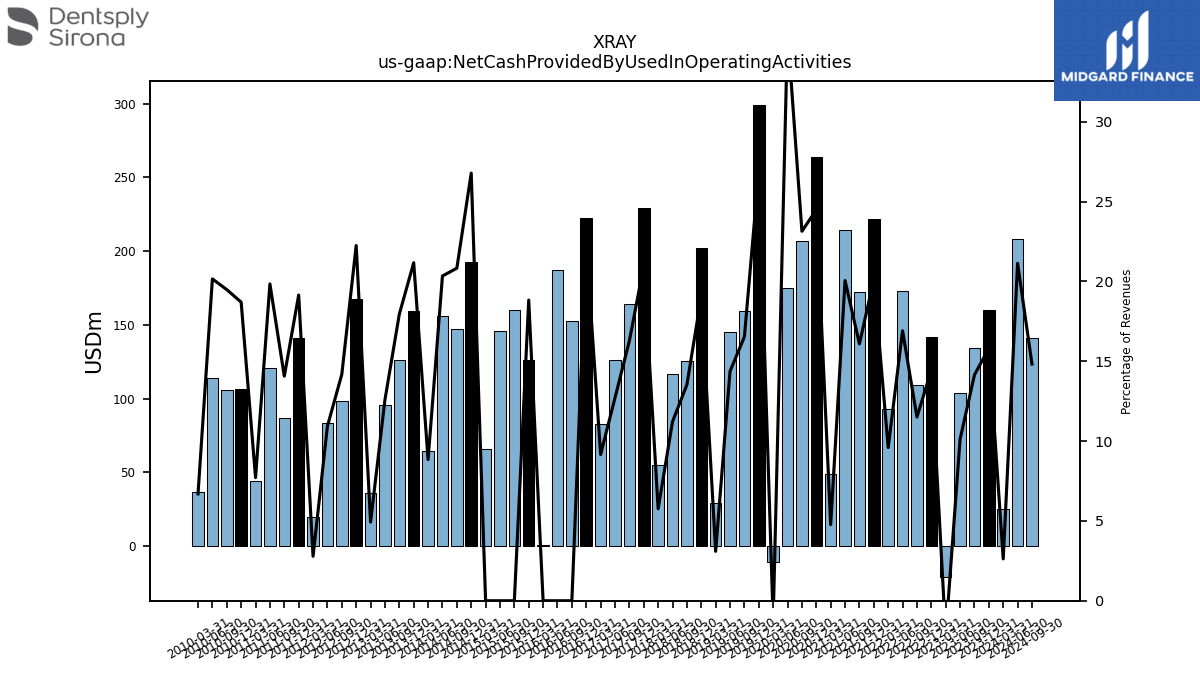
| Net Cash Provided By Used In Operating Activities | 160.00 | 134.00 | 104.00 | -21.00 | 142.00 | 109.00 | 173.00 | 93.00 | 222.00 | 172.00 | 214.00 | 49.00 | 263.50 | 207.10 | 175.10 | -10.70 | 299.30 | 159.10 | 145.10 | 29.30 | 202.20 | 125.60 | 116.90 | 55.10 | 228.90 | 164.30 | 126.20 | 82.50 | 222.40 | 152.90 | 187.40 | 0.70 | 126.40 | 159.75 | 145.61 | 65.63 | 192.62 | 147.53 | 155.68 | 64.56 | 159.58 | 126.40 | 95.78 | 36.09 | 167.62 | 98.67 | 83.44 | 19.95 | 141.32 | 87.18 | 120.96 | 44.01 | 106.27 | 105.59 | 113.92 | 36.54 | |
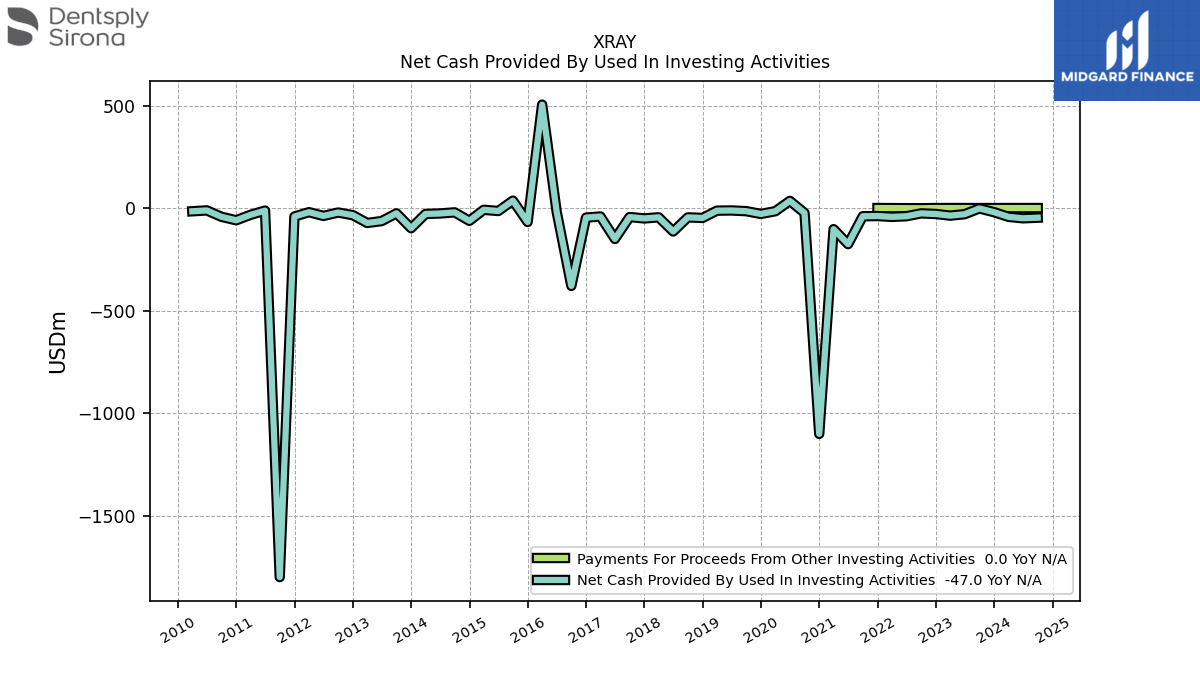
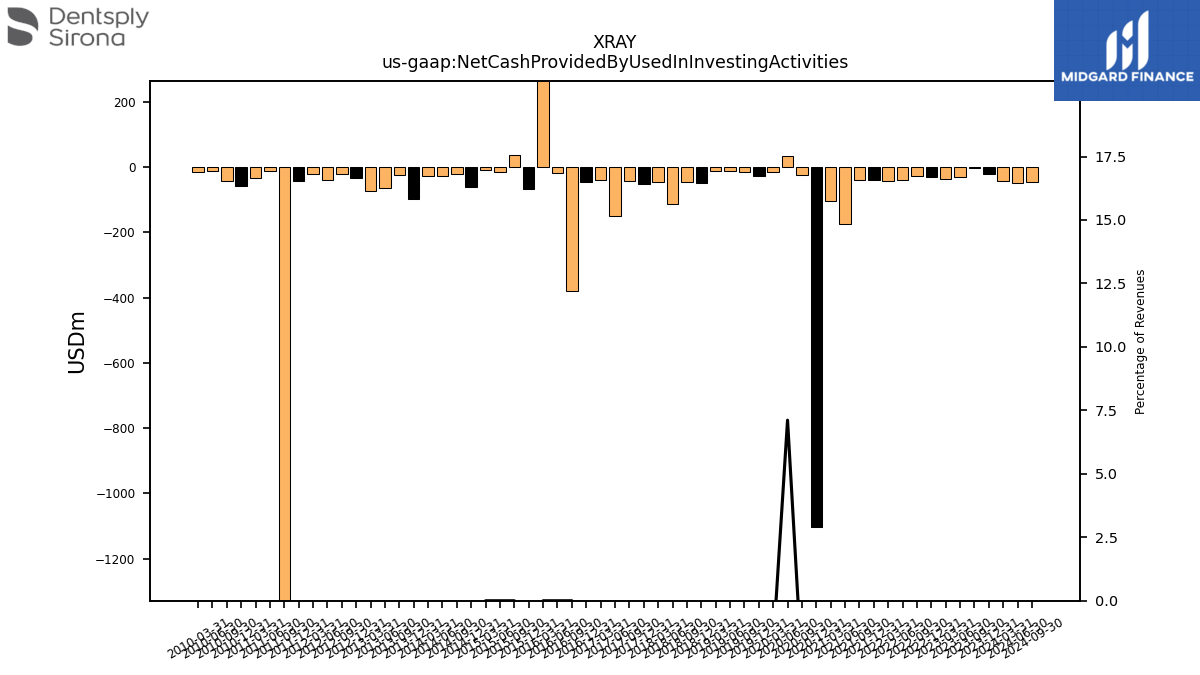
| Net Cash Provided By Used In Investing Activities | -20.00 | -2.00 | -30.00 | -37.00 | -29.00 | -26.00 | -40.00 | -43.00 | -39.00 | -40.00 | -176.00 | -103.00 | -1101.60 | -23.80 | 34.90 | -15.50 | -28.70 | -15.20 | -11.80 | -12.70 | -48.30 | -45.50 | -114.30 | -45.20 | -50.60 | -43.90 | -150.80 | -41.10 | -46.60 | -379.70 | -18.10 | 504.40 | -68.10 | 36.18 | -14.43 | -8.55 | -62.29 | -21.06 | -26.50 | -28.84 | -98.34 | -25.70 | -63.47 | -72.72 | -34.72 | -21.79 | -38.31 | -20.20 | -41.26 | -1800.00 | -12.48 | -33.10 | -59.58 | -42.73 | -11.47 | -15.71 | |
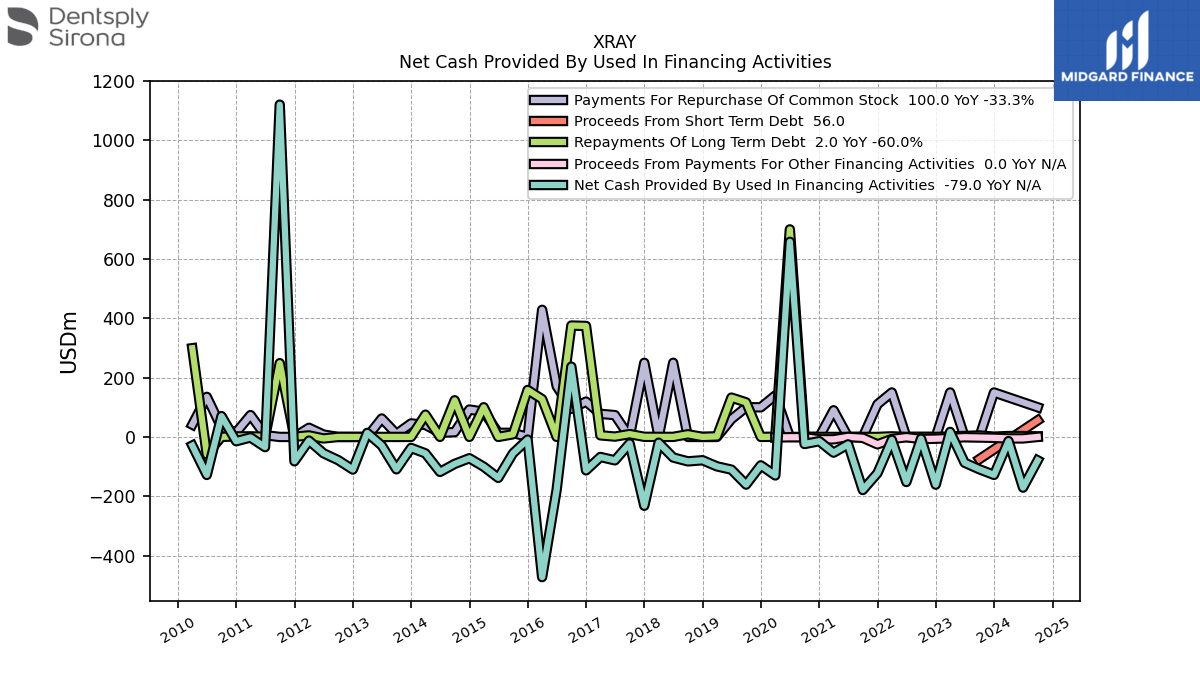
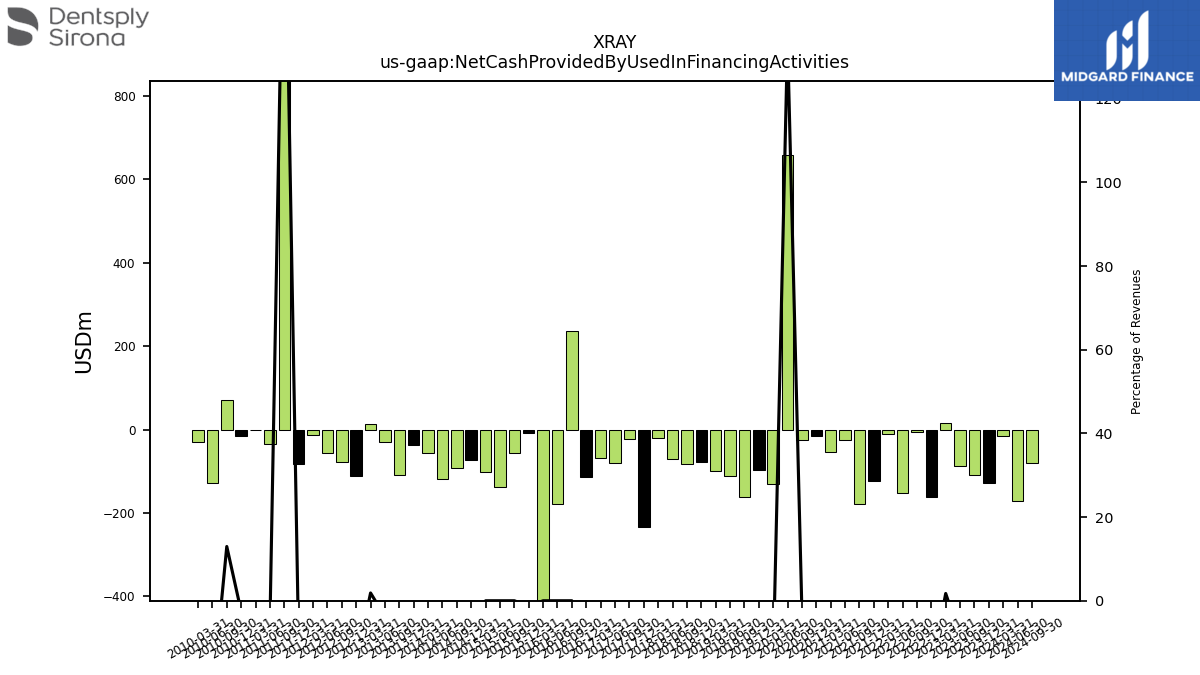
| Net Cash Provided By Used In Financing Activities | -128.00 | -109.00 | -87.00 | 17.00 | -161.00 | -6.00 | -152.00 | -10.00 | -122.00 | -179.00 | -25.00 | -53.00 | -14.30 | -23.90 | 658.10 | -129.90 | -95.80 | -160.80 | -110.30 | -99.20 | -78.60 | -82.40 | -69.40 | -19.40 | -232.20 | -22.10 | -78.90 | -67.60 | -112.70 | 237.10 | -177.80 | -472.80 | -8.90 | -55.49 | -138.05 | -100.46 | -71.81 | -90.93 | -117.97 | -55.48 | -37.03 | -109.21 | -29.04 | 13.60 | -110.02 | -78.17 | -55.03 | -12.38 | -82.26 | 1120.78 | -34.42 | -1.72 | -14.48 | 70.28 | -128.17 | -29.04 |
| 2023-12-31 | 2023-09-30 | 2023-06-30 | 2023-03-31 | 2022-12-31 | 2022-09-30 | 2022-06-30 | 2022-03-31 | 2021-12-31 | 2021-09-30 | 2021-06-30 | 2021-03-31 | 2020-12-31 | 2020-09-30 | 2020-06-30 | 2020-03-31 | 2019-12-31 | 2019-09-30 | 2019-06-30 | 2019-03-31 | 2018-12-31 | 2018-09-30 | 2018-06-30 | 2018-03-31 | 2017-12-31 | 2017-09-30 | 2017-06-30 | 2017-03-31 | 2016-12-31 | 2016-09-30 | 2016-06-30 | 2016-03-31 | 2015-12-31 | 2015-09-30 | 2015-06-30 | 2015-03-31 | 2014-12-31 | 2014-09-30 | 2014-06-30 | 2014-03-31 | 2013-12-31 | 2013-09-30 | 2013-06-30 | 2013-03-31 | 2012-12-31 | 2012-09-30 | 2012-06-30 | 2012-03-31 | 2011-12-31 | 2011-09-30 | 2011-06-30 | 2011-03-31 | 2010-12-31 | 2010-09-30 | 2010-06-30 | 2010-03-31 | ||
|---|---|---|---|---|---|---|---|---|---|---|---|---|---|---|---|---|---|---|---|---|---|---|---|---|---|---|---|---|---|---|---|---|---|---|---|---|---|---|---|---|---|---|---|---|---|---|---|---|---|---|---|---|---|---|---|---|---|
| Net Cash Provided By Used In Operating Activities | 160.00 | 134.00 | 104.00 | -21.00 | 142.00 | 109.00 | 173.00 | 93.00 | 222.00 | 172.00 | 214.00 | 49.00 | 263.50 | 207.10 | 175.10 | -10.70 | 299.30 | 159.10 | 145.10 | 29.30 | 202.20 | 125.60 | 116.90 | 55.10 | 228.90 | 164.30 | 126.20 | 82.50 | 222.40 | 152.90 | 187.40 | 0.70 | 126.40 | 159.75 | 145.61 | 65.63 | 192.62 | 147.53 | 155.68 | 64.56 | 159.58 | 126.40 | 95.78 | 36.09 | 167.62 | 98.67 | 83.44 | 19.95 | 141.32 | 87.18 | 120.96 | 44.01 | 106.27 | 105.59 | 113.92 | 36.54 | |
| Net Income Loss | 67.00 | -266.00 | 86.00 | -19.00 | -15.00 | -1077.00 | 73.00 | 69.00 | 119.00 | 103.00 | 99.00 | 117.00 | 105.00 | 53.80 | -95.40 | -139.90 | 102.30 | 85.00 | 36.40 | 39.20 | 1.80 | 28.00 | -1122.00 | 81.20 | -650.40 | 90.60 | -1050.00 | 59.80 | 107.00 | 92.50 | 105.40 | 125.00 | 58.60 | 84.50 | 44.10 | 63.96 | 84.71 | 75.27 | 89.99 | 72.88 | 74.43 | 79.85 | 87.23 | 71.69 | 126.80 | 53.36 | 80.76 | 53.28 | 40.60 | 60.60 | 74.24 | 69.08 | 67.83 | 63.65 | 72.39 | 61.84 | |
| Profit Loss | 72.00 | -266.00 | 85.00 | -23.00 | -15.00 | -1077.00 | 73.00 | 69.00 | 119.00 | 103.00 | 99.00 | 117.00 | 105.00 | 54.20 | -95.90 | -139.90 | 102.50 | 85.00 | 36.40 | 39.20 | 1.50 | 27.50 | -1121.00 | 81.10 | -650.20 | 90.50 | -1050.30 | 59.70 | 107.90 | 92.30 | 105.90 | 125.30 | 58.60 | 84.40 | 44.06 | 63.95 | 84.71 | 75.27 | 90.01 | 72.92 | 76.03 | 80.87 | 88.69 | 72.57 | 127.93 | 54.29 | 82.04 | 54.23 | 41.39 | 61.20 | 75.39 | 69.46 | 67.98 | 63.81 | 73.35 | 62.19 | |
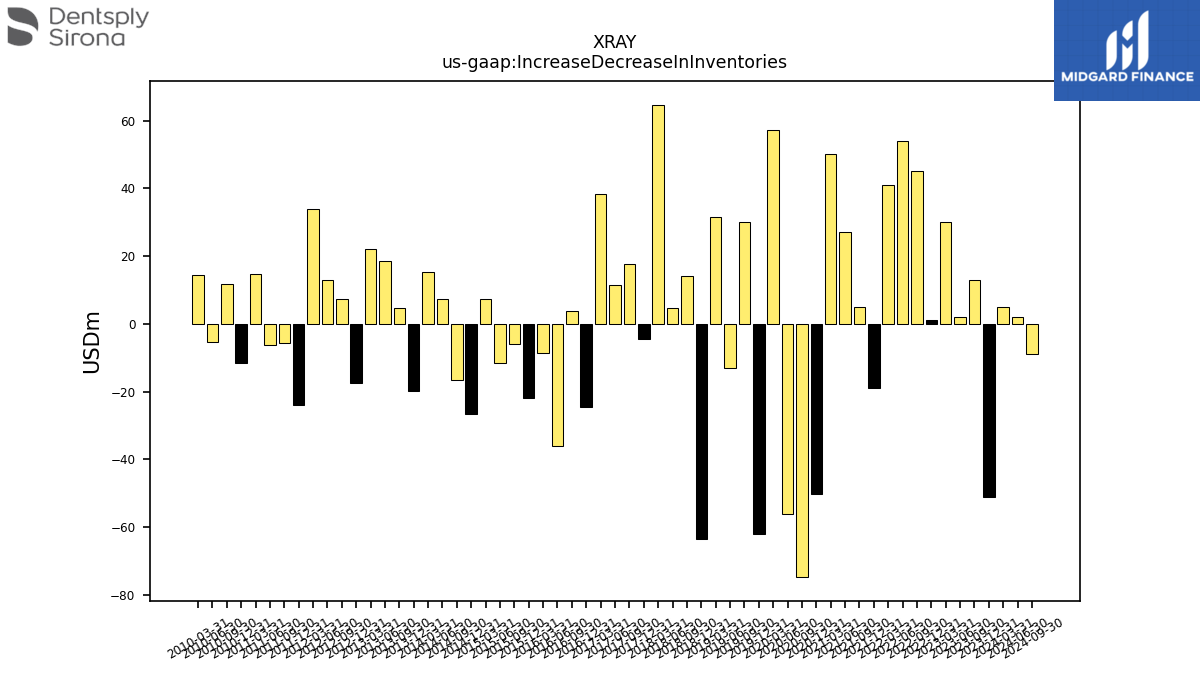
| Increase Decrease In Inventories | -51.00 | 13.00 | 2.00 | 30.00 | 1.00 | 45.00 | 54.00 | 41.00 | -19.00 | 5.00 | 27.00 | 50.00 | -50.20 | -74.80 | -56.30 | 57.30 | -62.10 | 30.10 | -13.20 | 31.50 | -63.40 | 14.00 | 4.60 | 64.70 | -4.40 | 17.70 | 11.30 | 38.30 | -24.50 | 3.80 | -36.10 | -8.60 | -22.00 | -5.97 | -11.56 | 7.43 | -26.79 | -16.67 | 7.25 | 15.18 | -19.92 | 4.58 | 18.62 | 22.08 | -17.54 | 7.29 | 13.03 | 34.01 | -24.11 | -5.76 | -6.36 | 14.73 | -11.49 | 11.69 | -5.36 | 14.47 | |
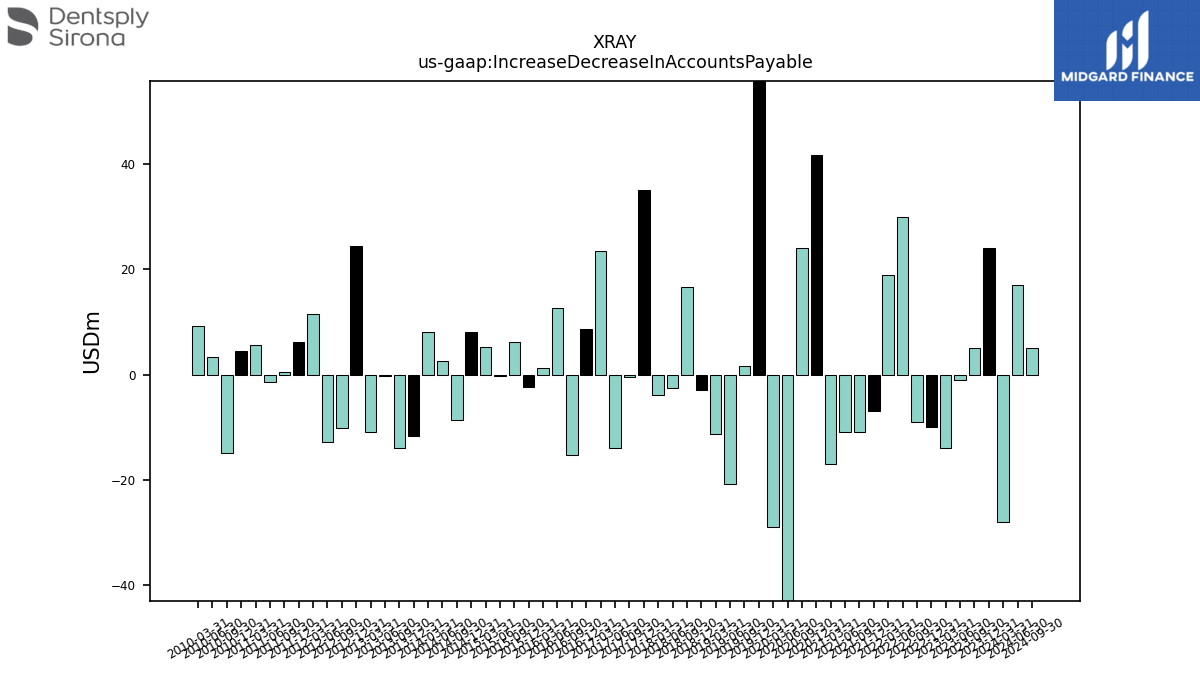
| Increase Decrease In Accounts Payable | 24.00 | 5.00 | -1.00 | -14.00 | -10.00 | -9.00 | 30.00 | 19.00 | -7.00 | -11.00 | -11.00 | -17.00 | 41.70 | 24.00 | -59.80 | -28.90 | 56.60 | 1.70 | -20.90 | -11.30 | -3.00 | 16.60 | -2.60 | -3.90 | 35.10 | -0.40 | -13.90 | 23.40 | 8.60 | -15.30 | 12.70 | 1.20 | -2.40 | 6.26 | -0.31 | 5.25 | 8.10 | -8.67 | 2.57 | 8.05 | -11.63 | -13.96 | -0.21 | -10.93 | 24.40 | -10.24 | -12.85 | 11.53 | 6.15 | 0.54 | -1.44 | 5.57 | 4.55 | -14.99 | 3.41 | 9.20 | |
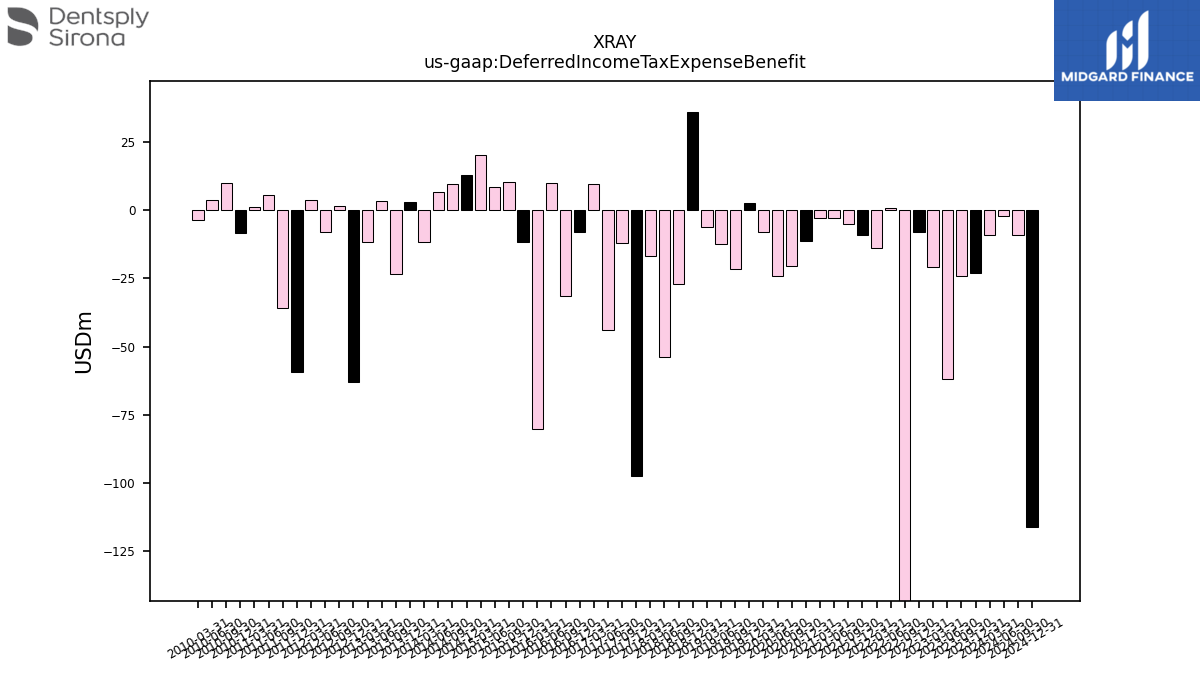
| Deferred Income Tax Expense Benefit | -23.00 | -24.00 | -62.00 | -21.00 | -8.00 | -207.00 | 1.00 | -14.00 | -9.00 | -5.00 | -3.00 | -3.00 | -11.30 | -20.30 | -24.30 | -8.10 | 2.50 | -21.50 | -12.40 | -6.00 | 35.90 | -27.10 | -54.00 | -16.80 | -97.50 | -12.10 | -44.00 | 9.80 | -8.10 | -31.50 | 9.90 | -80.40 | -11.80 | 10.50 | 8.53 | 20.17 | 12.85 | 9.53 | 6.61 | -11.51 | 2.94 | -23.53 | 3.23 | -11.79 | -62.83 | 1.73 | -8.12 | 3.69 | -59.45 | -35.85 | 5.67 | 1.22 | -8.45 | 9.90 | 3.69 | -3.75 | |
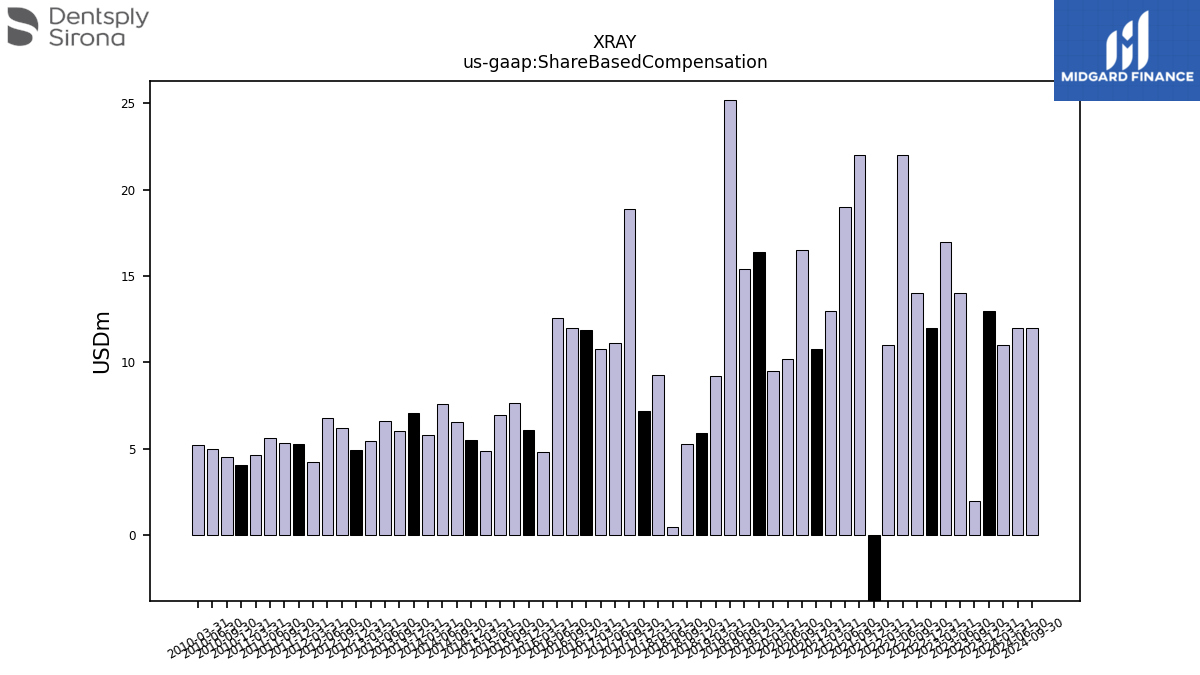
| Share Based Compensation | 13.00 | 2.00 | 14.00 | 17.00 | 12.00 | 14.00 | 22.00 | 11.00 | -6.00 | 22.00 | 19.00 | 13.00 | 10.80 | 16.50 | 10.20 | 9.50 | 16.40 | 15.40 | 25.20 | 9.20 | 5.90 | 5.30 | 0.50 | 9.30 | 7.20 | 18.90 | 11.10 | 10.80 | 11.90 | 12.00 | 12.60 | 4.80 | 6.10 | 7.67 | 6.93 | 4.89 | 5.53 | 6.54 | 7.57 | 5.79 | 7.07 | 6.00 | 6.59 | 5.43 | 4.94 | 6.22 | 6.81 | 4.22 | 5.29 | 5.34 | 5.65 | 4.67 | 4.03 | 4.53 | 5.01 | 5.22 |
| 2023-12-31 | 2023-09-30 | 2023-06-30 | 2023-03-31 | 2022-12-31 | 2022-09-30 | 2022-06-30 | 2022-03-31 | 2021-12-31 | 2021-09-30 | 2021-06-30 | 2021-03-31 | 2020-12-31 | 2020-09-30 | 2020-06-30 | 2020-03-31 | 2019-12-31 | 2019-09-30 | 2019-06-30 | 2019-03-31 | 2018-12-31 | 2018-09-30 | 2018-06-30 | 2018-03-31 | 2017-12-31 | 2017-09-30 | 2017-06-30 | 2017-03-31 | 2016-12-31 | 2016-09-30 | 2016-06-30 | 2016-03-31 | 2015-12-31 | 2015-09-30 | 2015-06-30 | 2015-03-31 | 2014-12-31 | 2014-09-30 | 2014-06-30 | 2014-03-31 | 2013-12-31 | 2013-09-30 | 2013-06-30 | 2013-03-31 | 2012-12-31 | 2012-09-30 | 2012-06-30 | 2012-03-31 | 2011-12-31 | 2011-09-30 | 2011-06-30 | 2011-03-31 | 2010-12-31 | 2010-09-30 | 2010-06-30 | 2010-03-31 | ||
|---|---|---|---|---|---|---|---|---|---|---|---|---|---|---|---|---|---|---|---|---|---|---|---|---|---|---|---|---|---|---|---|---|---|---|---|---|---|---|---|---|---|---|---|---|---|---|---|---|---|---|---|---|---|---|---|---|---|
| Net Cash Provided By Used In Investing Activities | -20.00 | -2.00 | -30.00 | -37.00 | -29.00 | -26.00 | -40.00 | -43.00 | -39.00 | -40.00 | -176.00 | -103.00 | -1101.60 | -23.80 | 34.90 | -15.50 | -28.70 | -15.20 | -11.80 | -12.70 | -48.30 | -45.50 | -114.30 | -45.20 | -50.60 | -43.90 | -150.80 | -41.10 | -46.60 | -379.70 | -18.10 | 504.40 | -68.10 | 36.18 | -14.43 | -8.55 | -62.29 | -21.06 | -26.50 | -28.84 | -98.34 | -25.70 | -63.47 | -72.72 | -34.72 | -21.79 | -38.31 | -20.20 | -41.26 | -1800.00 | -12.48 | -33.10 | -59.58 | -42.73 | -11.47 | -15.71 | |
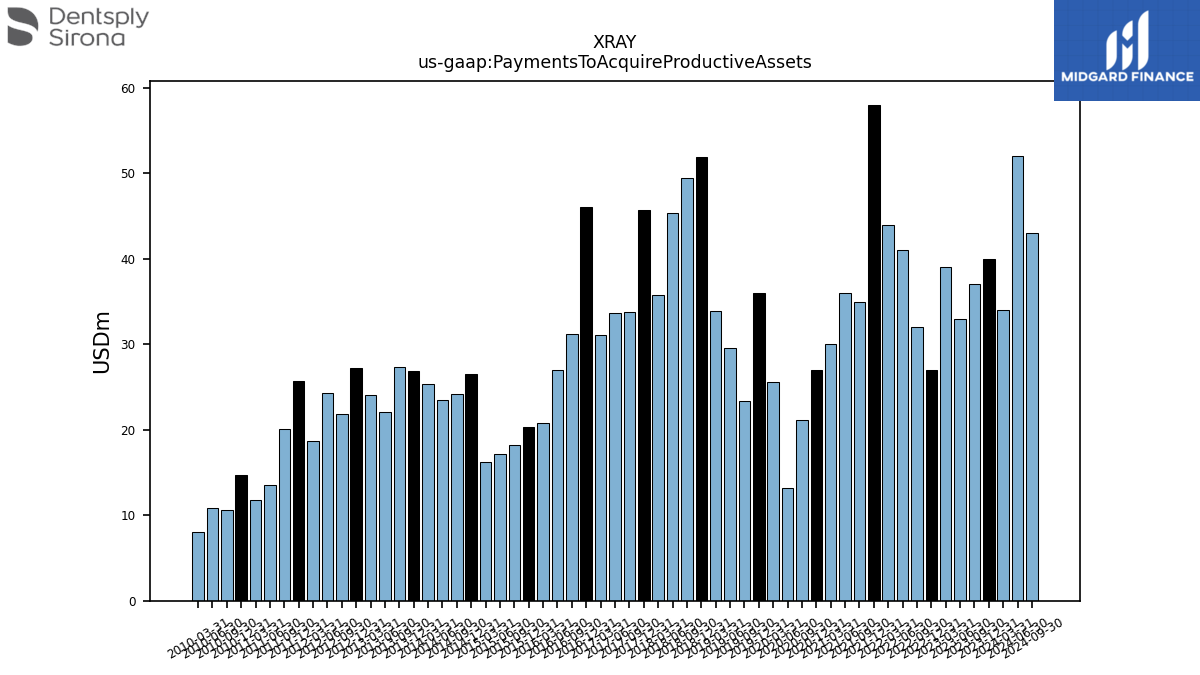
| Payments To Acquire Productive Assets | 40.00 | 37.00 | 33.00 | 39.00 | 27.00 | 32.00 | 41.00 | 44.00 | 58.00 | 35.00 | 36.00 | 30.00 | 27.00 | 21.20 | 13.20 | 25.60 | 36.00 | 23.40 | 29.60 | 33.90 | 51.90 | 49.40 | 45.40 | 35.80 | 45.70 | 33.80 | 33.70 | 31.10 | 46.00 | 31.20 | 27.00 | 20.80 | 20.30 | 18.27 | 17.19 | 16.24 | 26.55 | 24.19 | 23.51 | 25.32 | 26.84 | 27.35 | 22.12 | 24.03 | 27.21 | 21.87 | 24.34 | 18.64 | 25.73 | 20.12 | 13.56 | 11.77 | 14.67 | 10.67 | 10.87 | 8.03 |
| 2023-12-31 | 2023-09-30 | 2023-06-30 | 2023-03-31 | 2022-12-31 | 2022-09-30 | 2022-06-30 | 2022-03-31 | 2021-12-31 | 2021-09-30 | 2021-06-30 | 2021-03-31 | 2020-12-31 | 2020-09-30 | 2020-06-30 | 2020-03-31 | 2019-12-31 | 2019-09-30 | 2019-06-30 | 2019-03-31 | 2018-12-31 | 2018-09-30 | 2018-06-30 | 2018-03-31 | 2017-12-31 | 2017-09-30 | 2017-06-30 | 2017-03-31 | 2016-12-31 | 2016-09-30 | 2016-06-30 | 2016-03-31 | 2015-12-31 | 2015-09-30 | 2015-06-30 | 2015-03-31 | 2014-12-31 | 2014-09-30 | 2014-06-30 | 2014-03-31 | 2013-12-31 | 2013-09-30 | 2013-06-30 | 2013-03-31 | 2012-12-31 | 2012-09-30 | 2012-06-30 | 2012-03-31 | 2011-12-31 | 2011-09-30 | 2011-06-30 | 2011-03-31 | 2010-12-31 | 2010-09-30 | 2010-06-30 | 2010-03-31 | ||
|---|---|---|---|---|---|---|---|---|---|---|---|---|---|---|---|---|---|---|---|---|---|---|---|---|---|---|---|---|---|---|---|---|---|---|---|---|---|---|---|---|---|---|---|---|---|---|---|---|---|---|---|---|---|---|---|---|---|
| Net Cash Provided By Used In Financing Activities | -128.00 | -109.00 | -87.00 | 17.00 | -161.00 | -6.00 | -152.00 | -10.00 | -122.00 | -179.00 | -25.00 | -53.00 | -14.30 | -23.90 | 658.10 | -129.90 | -95.80 | -160.80 | -110.30 | -99.20 | -78.60 | -82.40 | -69.40 | -19.40 | -232.20 | -22.10 | -78.90 | -67.60 | -112.70 | 237.10 | -177.80 | -472.80 | -8.90 | -55.49 | -138.05 | -100.46 | -71.81 | -90.93 | -117.97 | -55.48 | -37.03 | -109.21 | -29.04 | 13.60 | -110.02 | -78.17 | -55.03 | -12.38 | -82.26 | 1120.78 | -34.42 | -1.72 | -14.48 | 70.28 | -128.17 | -29.04 | |
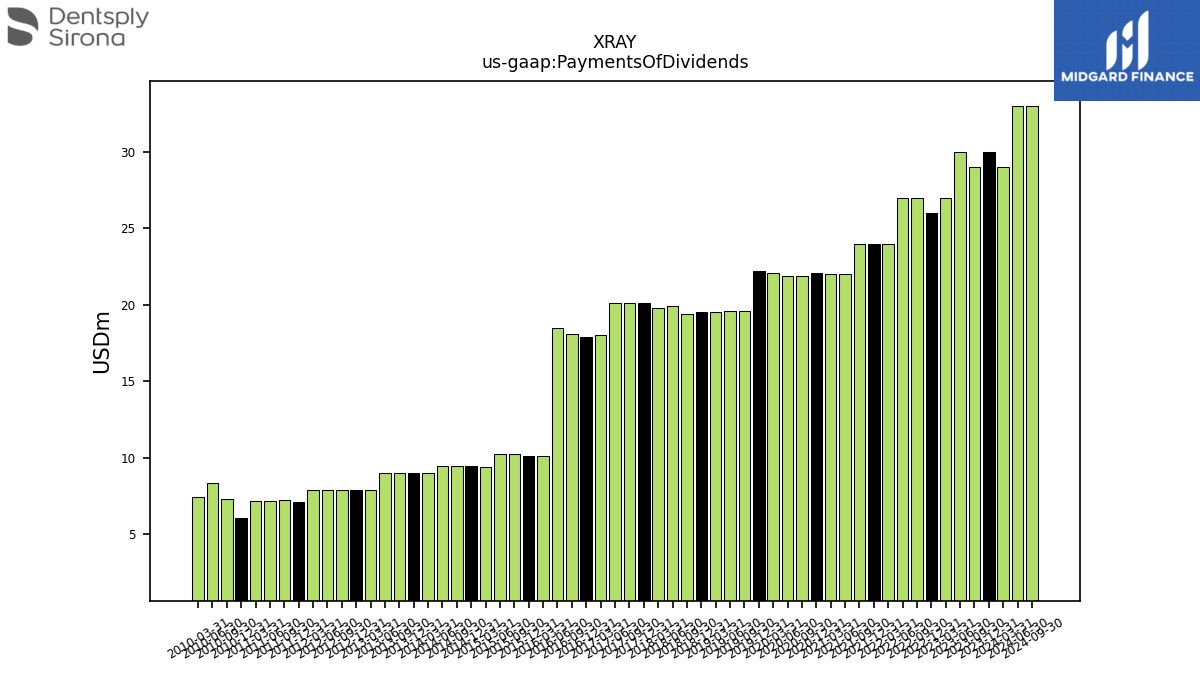
| Payments Of Dividends | 30.00 | 29.00 | 30.00 | 27.00 | 26.00 | 27.00 | 27.00 | 24.00 | 24.00 | 24.00 | 22.00 | 22.00 | 22.10 | 21.90 | 21.90 | 22.10 | 22.20 | 19.60 | 19.60 | 19.50 | 19.50 | 19.40 | 19.90 | 19.80 | 20.10 | 20.10 | 20.10 | 18.00 | 17.90 | 18.10 | 18.50 | 10.10 | 10.10 | 10.26 | 10.22 | 9.42 | 9.46 | 9.47 | 9.47 | 8.98 | 8.98 | 8.97 | 9.02 | 7.91 | 7.86 | 7.86 | 7.86 | 7.85 | 7.12 | 7.20 | 7.18 | 7.13 | 6.03 | 7.31 | 8.33 | 7.41 | |
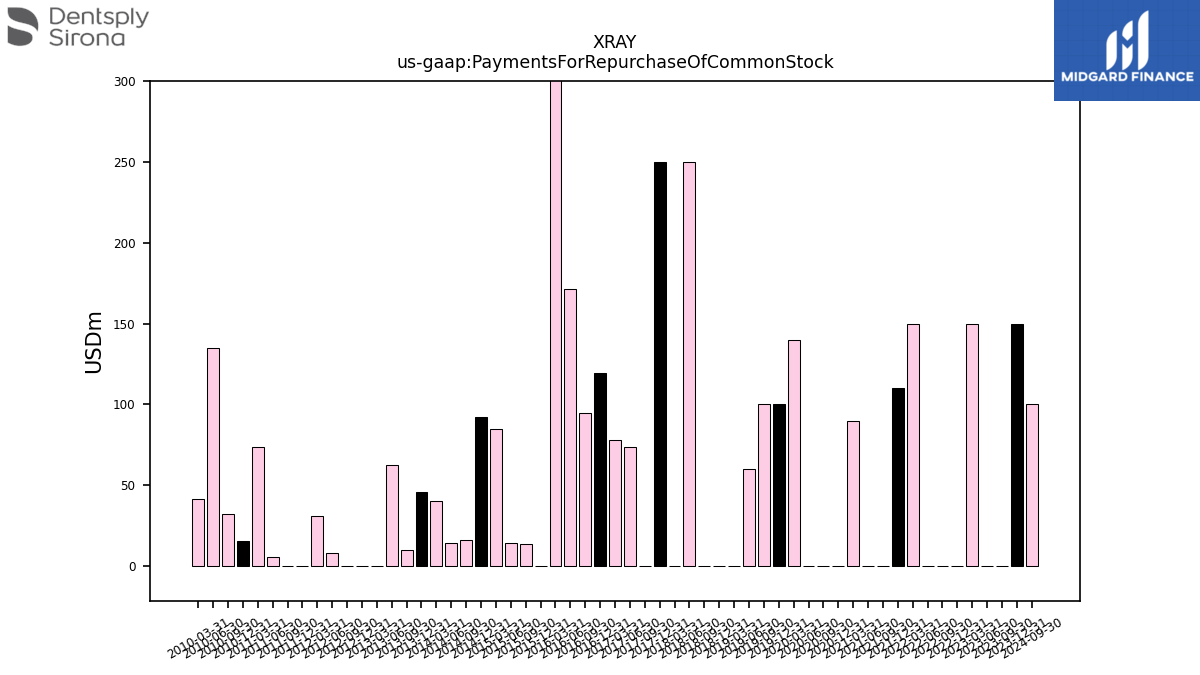
| Payments For Repurchase Of Common Stock | 150.00 | 0.00 | 0.00 | 150.00 | 0.00 | 0.00 | 0.00 | 150.00 | 110.00 | 0.00 | 0.00 | 90.00 | 0.00 | 0.00 | 0.00 | 140.00 | 100.00 | 100.00 | 60.00 | 0.00 | 0.00 | 0.00 | 250.20 | 0.00 | 250.00 | -0.10 | 73.60 | 77.90 | 119.20 | 94.70 | 171.20 | 428.80 | 0.00 | 13.72 | 13.97 | 85.01 | 92.44 | 16.17 | 14.19 | 40.40 | 45.64 | 10.10 | 62.28 | 0.00 | -0.00 | -0.00 | 7.97 | 30.87 | 0.00 | 0.00 | 5.82 | 73.68 | 15.46 | 31.91 | 135.21 | 41.42 |
| 2023-12-31 | 2023-09-30 | 2023-06-30 | 2023-03-31 | 2022-12-31 | 2022-09-30 | 2022-06-30 | 2022-03-31 | 2021-12-31 | 2021-09-30 | 2021-06-30 | 2021-03-31 | 2020-12-31 | 2020-09-30 | 2020-06-30 | 2020-03-31 | 2019-12-31 | 2019-09-30 | 2019-06-30 | 2019-03-31 | 2018-12-31 | 2018-09-30 | 2018-06-30 | 2018-03-31 | 2017-12-31 | 2017-09-30 | 2017-06-30 | 2017-03-31 | 2016-12-31 | 2016-09-30 | 2016-06-30 | 2016-03-31 | 2015-12-31 | 2015-09-30 | 2015-06-30 | 2015-03-31 | 2014-12-31 | 2014-09-30 | 2014-06-30 | 2014-03-31 | 2013-12-31 | 2013-09-30 | 2013-06-30 | 2013-03-31 | 2012-12-31 | 2012-09-30 | 2012-06-30 | 2012-03-31 | 2011-12-31 | 2011-09-30 | 2011-06-30 | 2011-03-31 | 2010-12-31 | 2010-09-30 | 2010-06-30 | 2010-03-31 | ||
|---|---|---|---|---|---|---|---|---|---|---|---|---|---|---|---|---|---|---|---|---|---|---|---|---|---|---|---|---|---|---|---|---|---|---|---|---|---|---|---|---|---|---|---|---|---|---|---|---|---|---|---|---|---|---|---|---|---|
| Revenues | 1012.00 | 947.00 | 1028.00 | 978.00 | 983.00 | 947.00 | 1023.00 | 969.00 | 1103.00 | 1069.00 | 1067.00 | 1027.00 | 1076.00 | 894.80 | 490.60 | 874.30 | 1111.50 | 962.10 | 1009.40 | 946.20 | 1059.70 | 928.40 | 1042.10 | 956.10 | 1091.00 | 1009.20 | 992.70 | 900.50 | 996.50 | 0.00 | 0.00 | 0.00 | 671.10 | 0.00 | 0.00 | 0.00 | 719.04 | 708.24 | 765.23 | 730.11 | 753.66 | 704.02 | 761.01 | 732.08 | 753.29 | 695.73 | 762.99 | 716.41 | 738.01 | 619.76 | 609.44 | 570.50 | 568.17 | 541.82 | 565.09 | 545.94 | |
| Revenue From Contract With Customer Excluding Assessed Tax | 1012.00 | 947.00 | 1028.00 | 978.00 | 983.00 | 947.00 | 1023.00 | 969.00 | 1103.00 | 1069.00 | 1067.00 | 1027.00 | 1076.00 | 894.80 | 490.60 | 874.00 | 1111.50 | 962.10 | 1009.40 | 946.20 | 1059.70 | 928.40 | 1042.10 | 956.10 | 1091.00 | 1009.20 | 992.70 | 900.50 | 996.50 | 0.00 | 0.00 | 0.00 | 671.10 | 0.00 | 0.00 | 0.00 | 719.04 | 708.24 | 765.23 | 730.11 | 753.66 | 704.02 | 761.01 | 732.08 | 753.29 | 695.73 | 762.99 | 716.41 | 738.01 | 619.76 | 609.44 | 570.50 | 568.17 | 541.82 | 565.09 | 545.94 | |
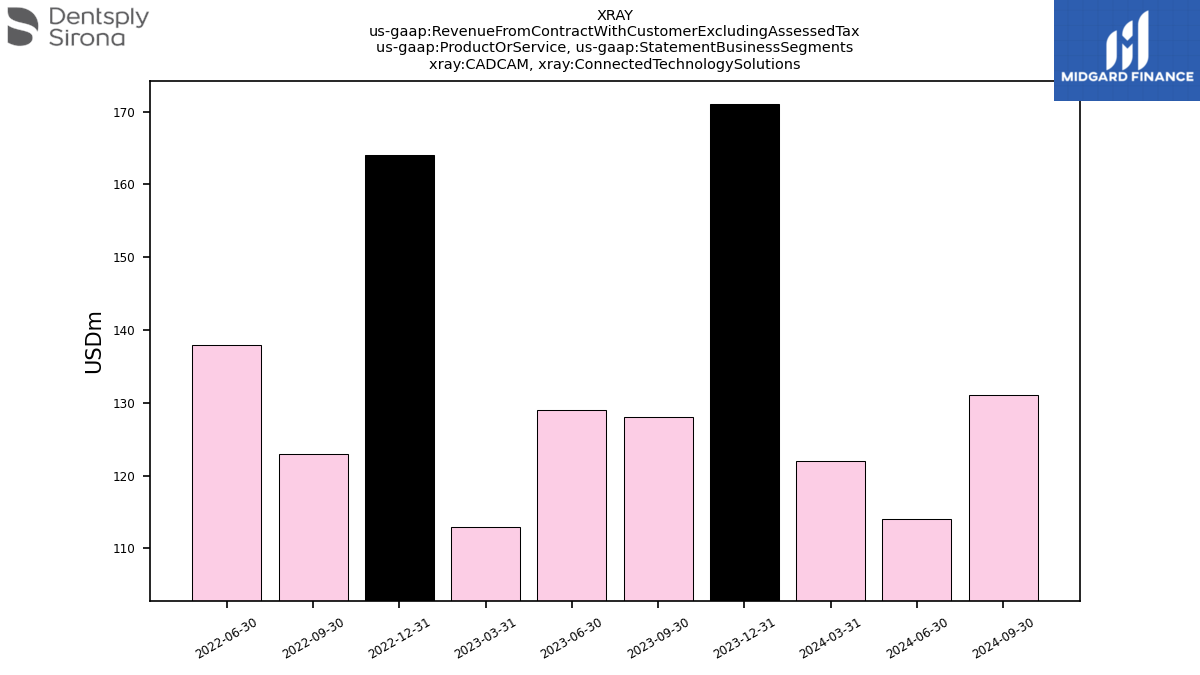
| CADCAM, Connected Technology Solutions | 171.00 | 128.00 | 129.00 | NA | 164.00 | 123.00 | 138.00 | NA | NA | NA | NA | NA | NA | NA | NA | NA | NA | NA | NA | NA | NA | NA | NA | NA | NA | NA | NA | NA | NA | NA | NA | NA | NA | NA | NA | NA | NA | NA | NA | NA | NA | NA | NA | NA | NA | NA | NA | NA | NA | NA | NA | NA | NA | NA | NA | NA | |
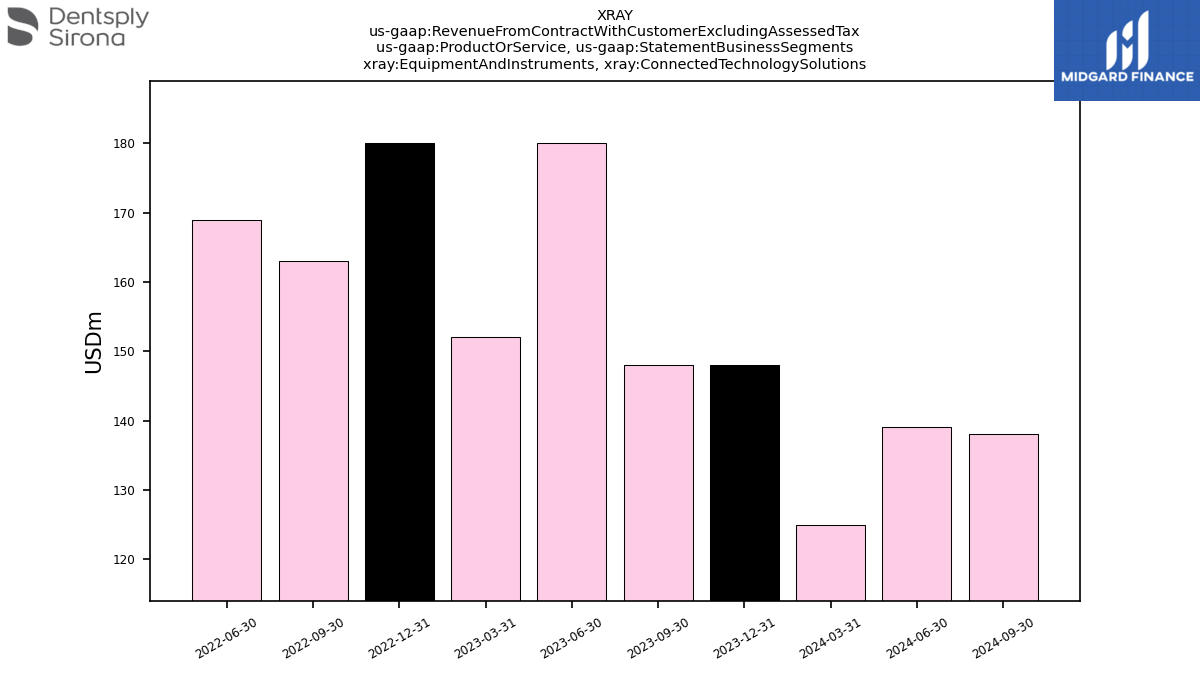
| Equipment And Instruments, Connected Technology Solutions | 148.00 | 148.00 | 180.00 | NA | 180.00 | 163.00 | 169.00 | NA | NA | NA | NA | NA | NA | NA | NA | NA | NA | NA | NA | NA | NA | NA | NA | NA | NA | NA | NA | NA | NA | NA | NA | NA | NA | NA | NA | NA | NA | NA | NA | NA | NA | NA | NA | NA | NA | NA | NA | NA | NA | NA | NA | NA | NA | NA | NA | NA | |
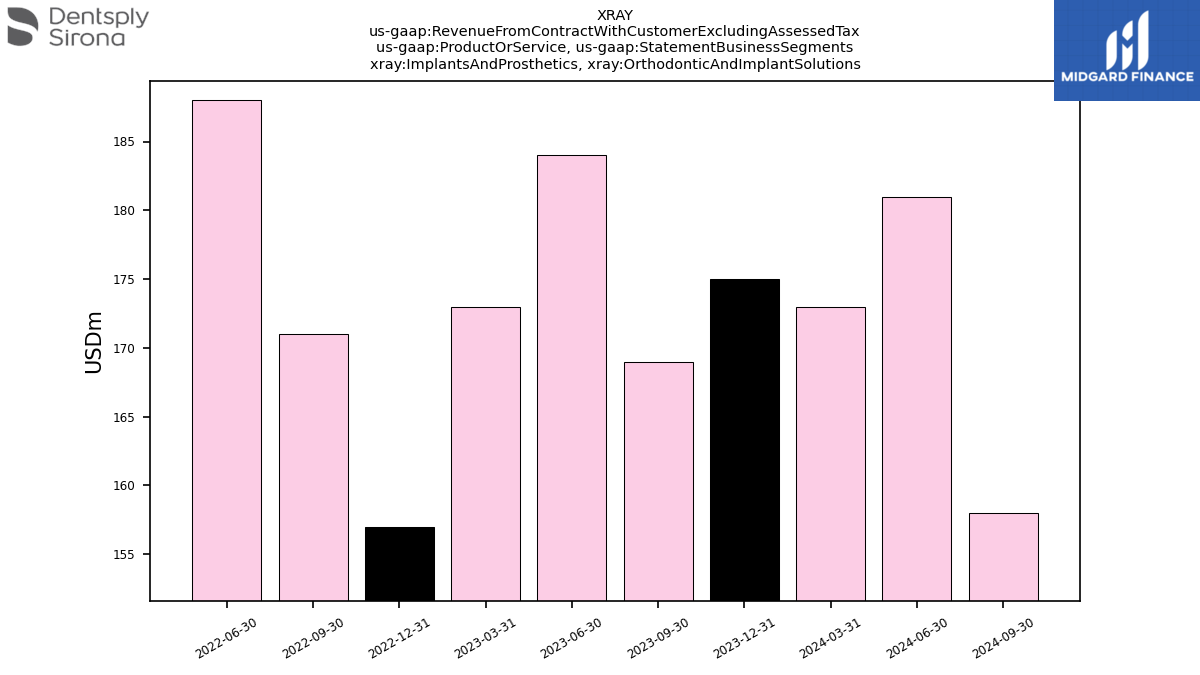
| Implants And Prosthetics, Orthodontic And Implant Solutions | 175.00 | 169.00 | 184.00 | NA | 157.00 | 171.00 | 188.00 | NA | NA | NA | NA | NA | NA | NA | NA | NA | NA | NA | NA | NA | NA | NA | NA | NA | NA | NA | NA | NA | NA | NA | NA | NA | NA | NA | NA | NA | NA | NA | NA | NA | NA | NA | NA | NA | NA | NA | NA | NA | NA | NA | NA | NA | NA | NA | NA | NA | |
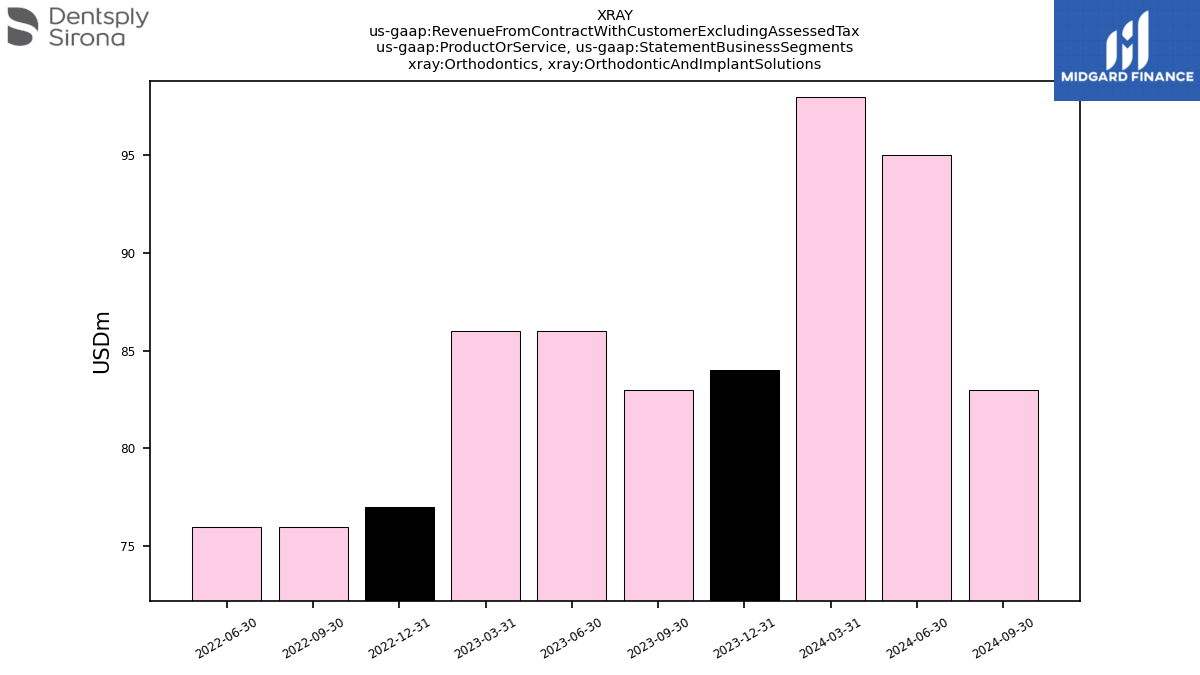
| Orthodontics, Orthodontic And Implant Solutions | 84.00 | 83.00 | 86.00 | NA | 77.00 | 76.00 | 76.00 | NA | NA | NA | NA | NA | NA | NA | NA | NA | NA | NA | NA | NA | NA | NA | NA | NA | NA | NA | NA | NA | NA | NA | NA | NA | NA | NA | NA | NA | NA | NA | NA | NA | NA | NA | NA | NA | NA | NA | NA | NA | NA | NA | NA | NA | NA | NA | NA | NA | |
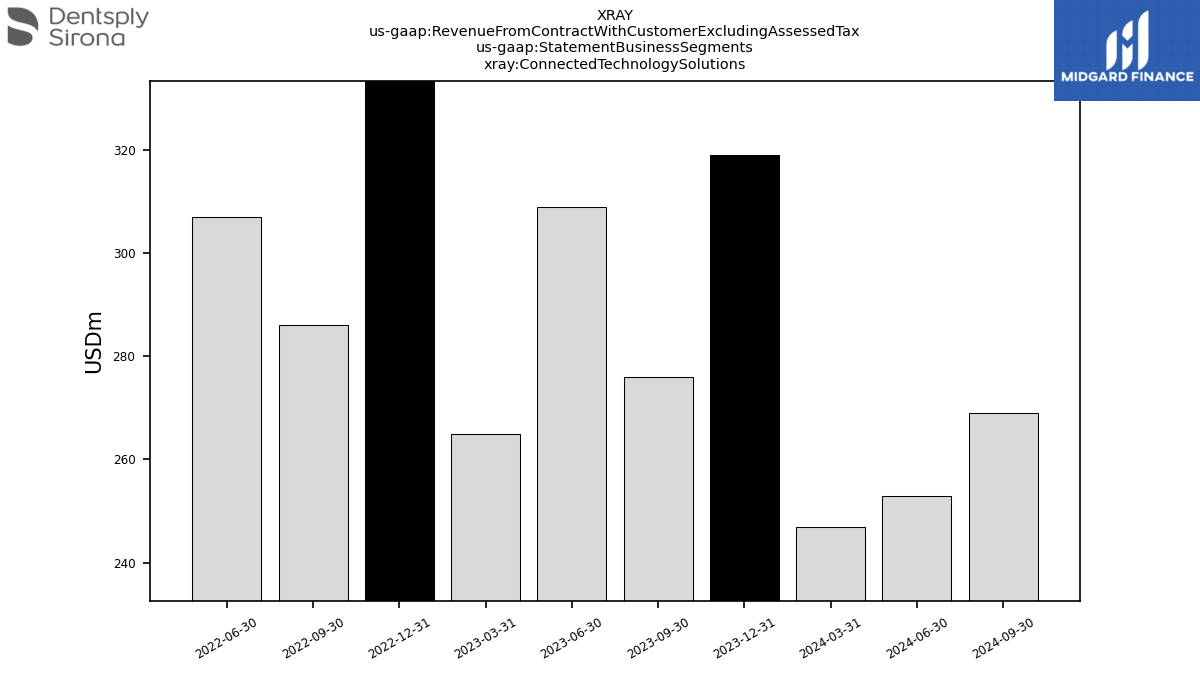
| Connected Technology Solutions | 319.00 | 276.00 | 309.00 | NA | 344.00 | 286.00 | 307.00 | NA | NA | NA | NA | NA | NA | NA | NA | NA | NA | NA | NA | NA | NA | NA | NA | NA | NA | NA | NA | NA | NA | NA | NA | NA | NA | NA | NA | NA | NA | NA | NA | NA | NA | NA | NA | NA | NA | NA | NA | NA | NA | NA | NA | NA | NA | NA | NA | NA | |
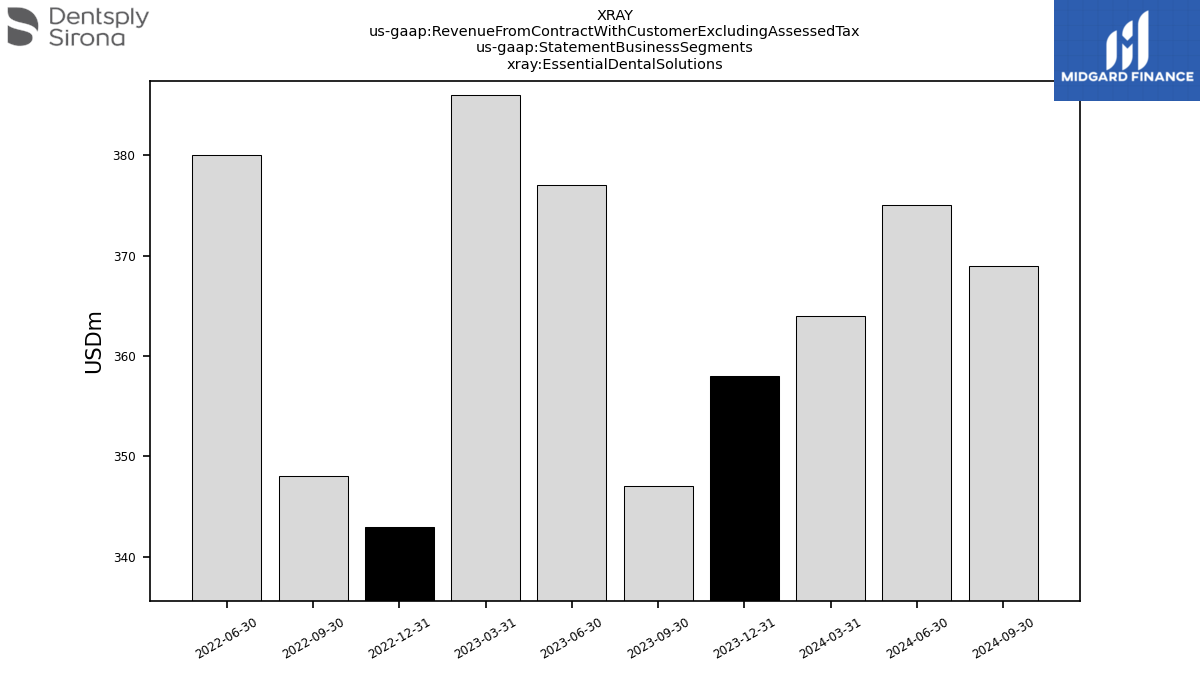
| Essential Dental Solutions | 358.00 | 347.00 | 377.00 | NA | 343.00 | 348.00 | 380.00 | NA | NA | NA | NA | NA | NA | NA | NA | NA | NA | NA | NA | NA | NA | NA | NA | NA | NA | NA | NA | NA | NA | NA | NA | NA | NA | NA | NA | NA | NA | NA | NA | NA | NA | NA | NA | NA | NA | NA | NA | NA | NA | NA | NA | NA | NA | NA | NA | NA | |
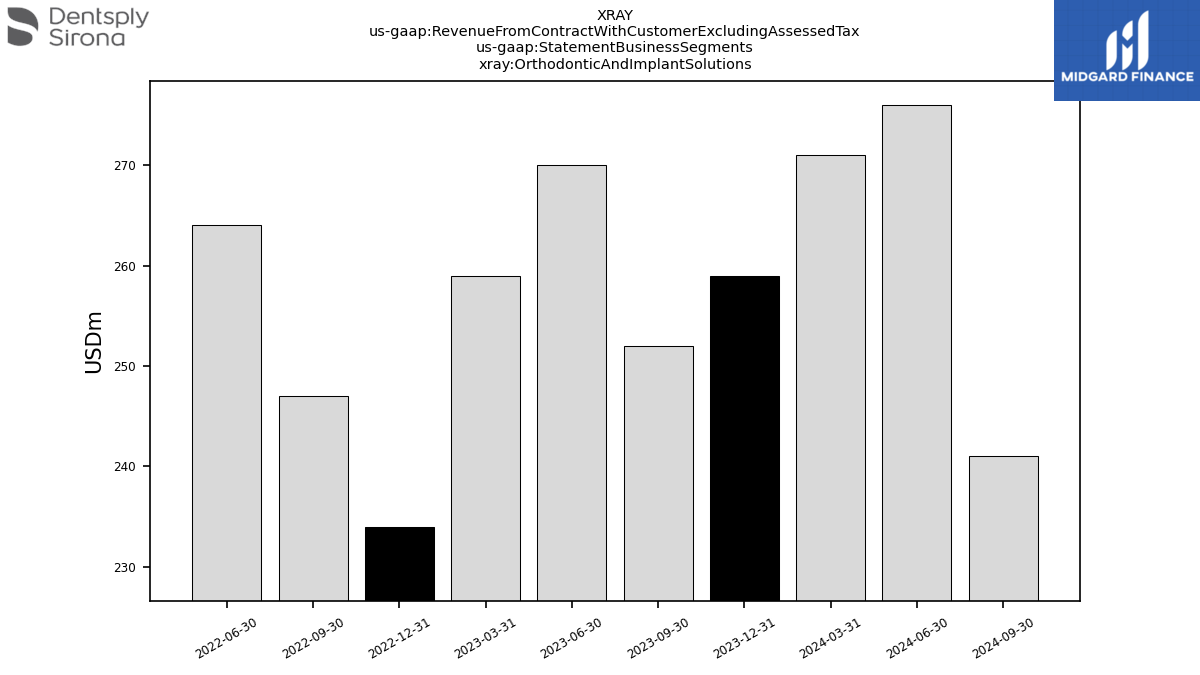
| Orthodontic And Implant Solutions | 259.00 | 252.00 | 270.00 | NA | 234.00 | 247.00 | 264.00 | NA | NA | NA | NA | NA | NA | NA | NA | NA | NA | NA | NA | NA | NA | NA | NA | NA | NA | NA | NA | NA | NA | NA | NA | NA | NA | NA | NA | NA | NA | NA | NA | NA | NA | NA | NA | NA | NA | NA | NA | NA | NA | NA | NA | NA | NA | NA | NA | NA | |
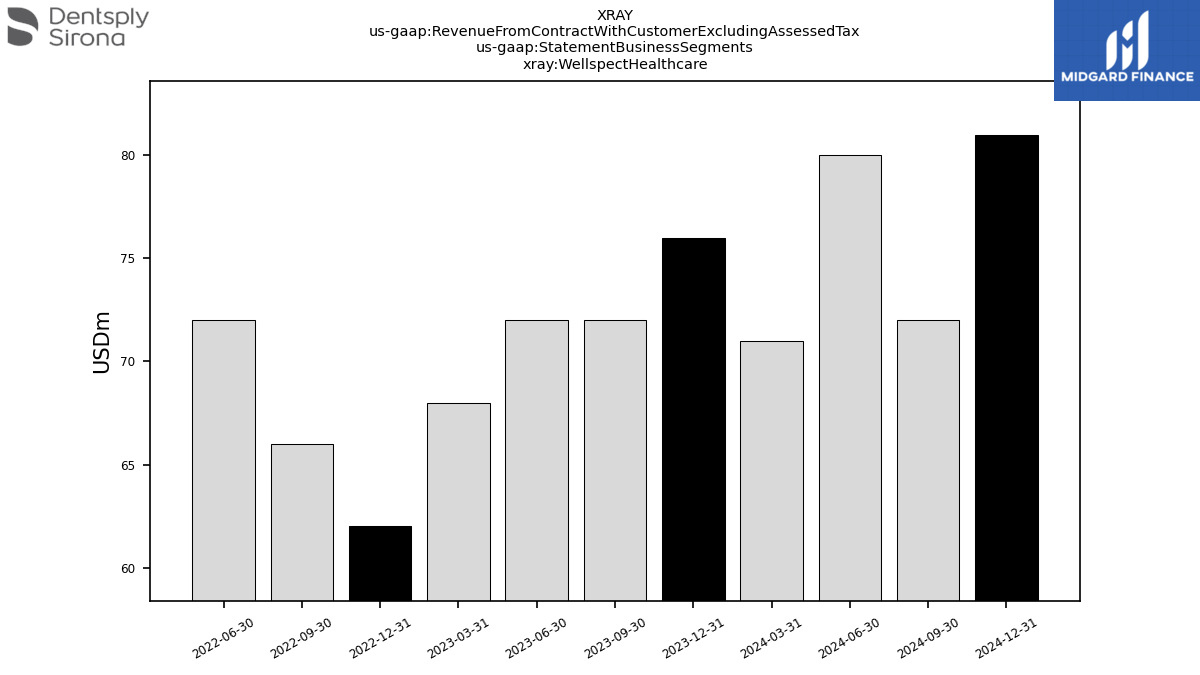
| Wellspect Healthcare | 76.00 | 72.00 | 72.00 | NA | 62.00 | 66.00 | 72.00 | NA | NA | NA | NA | NA | NA | NA | NA | NA | NA | NA | NA | NA | NA | NA | NA | NA | NA | NA | NA | NA | NA | NA | NA | NA | NA | NA | NA | NA | NA | NA | NA | NA | NA | NA | NA | NA | NA | NA | NA | NA | NA | NA | NA | NA | NA | NA | NA | NA | |
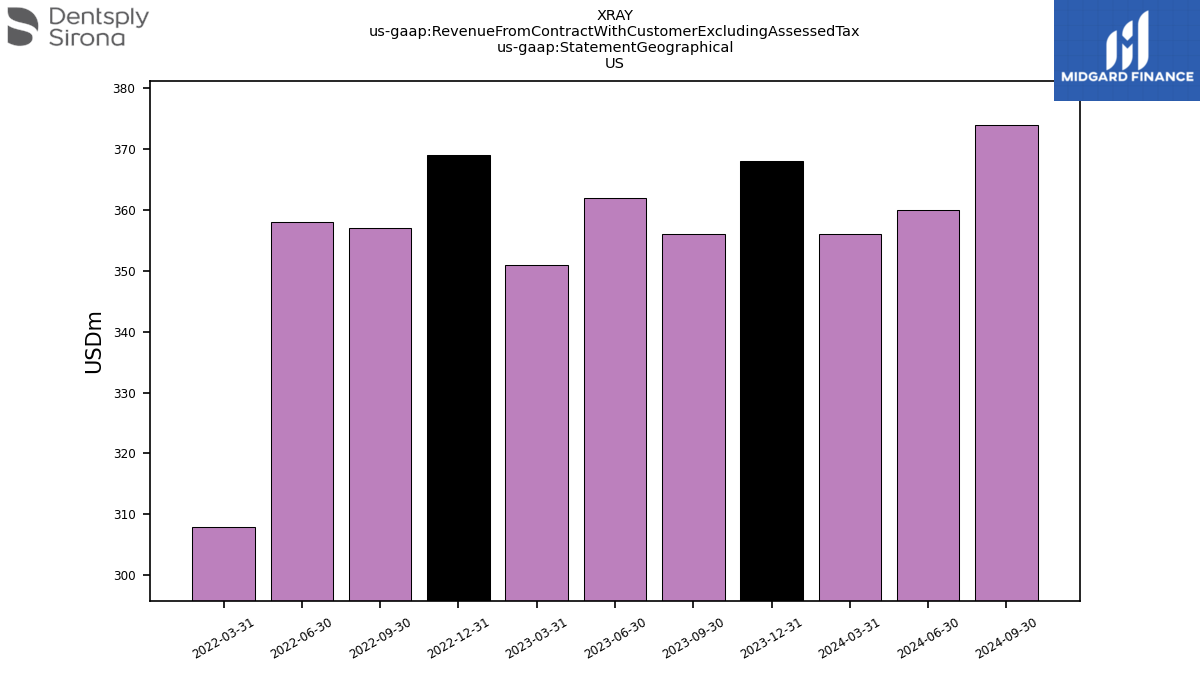
| US | 368.00 | 356.00 | 362.00 | 351.00 | 369.00 | 357.00 | 358.00 | 308.00 | NA | NA | NA | NA | NA | NA | NA | NA | NA | NA | NA | NA | NA | NA | NA | NA | NA | NA | NA | NA | NA | NA | NA | NA | NA | NA | NA | NA | NA | NA | NA | NA | NA | NA | NA | NA | NA | NA | NA | NA | NA | NA | NA | NA | NA | NA | NA | NA | |
| Revenue From Contract With Customer Including Assessed Tax | 1012.00 | 947.00 | 1028.00 | 978.00 | 983.00 | 947.00 | 1023.00 | 969.00 | 1103.00 | 1069.00 | 1067.00 | 1027.00 | 1076.00 | 894.80 | 490.60 | 874.30 | 1111.50 | 962.10 | 1009.40 | 946.20 | 1059.70 | 928.40 | 1042.10 | 956.10 | 1091.00 | 1009.20 | 992.70 | 900.50 | 996.50 | 0.00 | 0.00 | 0.00 | 671.10 | 0.00 | 0.00 | 0.00 | 719.04 | 708.24 | 765.23 | 730.11 | 753.66 | 704.02 | 761.01 | 732.08 | 753.29 | 695.73 | 762.99 | 716.41 | 738.01 | 619.76 | 609.44 | 570.50 | 568.17 | 541.82 | 565.09 | 545.94 |