
| 2023-12-31 | 2023-09-30 | 2023-06-30 | 2023-03-31 | 2022-12-31 | 2022-09-30 | 2022-06-30 | 2022-03-31 | 2021-12-31 | 2021-09-30 | 2021-06-30 | 2021-03-31 | 2020-12-31 | 2020-09-30 | 2020-06-30 | 2020-03-31 | 2019-12-31 | 2019-09-30 | 2019-06-30 | 2019-03-31 | 2018-12-31 | 2018-09-30 | 2018-06-30 | 2018-03-31 | 2017-12-31 | 2017-09-30 | 2017-06-30 | 2017-03-31 | 2016-12-31 | 2016-09-30 | 2016-06-30 | 2016-03-31 | 2015-12-31 | 2015-09-30 | 2015-06-30 | 2015-03-31 | 2014-12-31 | 2014-09-30 | 2014-06-30 | 2014-03-31 | 2013-12-31 | 2013-09-30 | 2013-06-30 | 2013-03-31 | 2012-12-31 | 2012-09-30 | 2012-06-30 | 2012-03-31 | 2011-12-31 | 2011-09-30 | 2011-06-30 | 2011-03-31 | 2010-12-31 | 2010-09-30 | 2010-06-30 | 2010-03-31 | ||
|---|---|---|---|---|---|---|---|---|---|---|---|---|---|---|---|---|---|---|---|---|---|---|---|---|---|---|---|---|---|---|---|---|---|---|---|---|---|---|---|---|---|---|---|---|---|---|---|---|---|---|---|---|---|---|---|---|---|
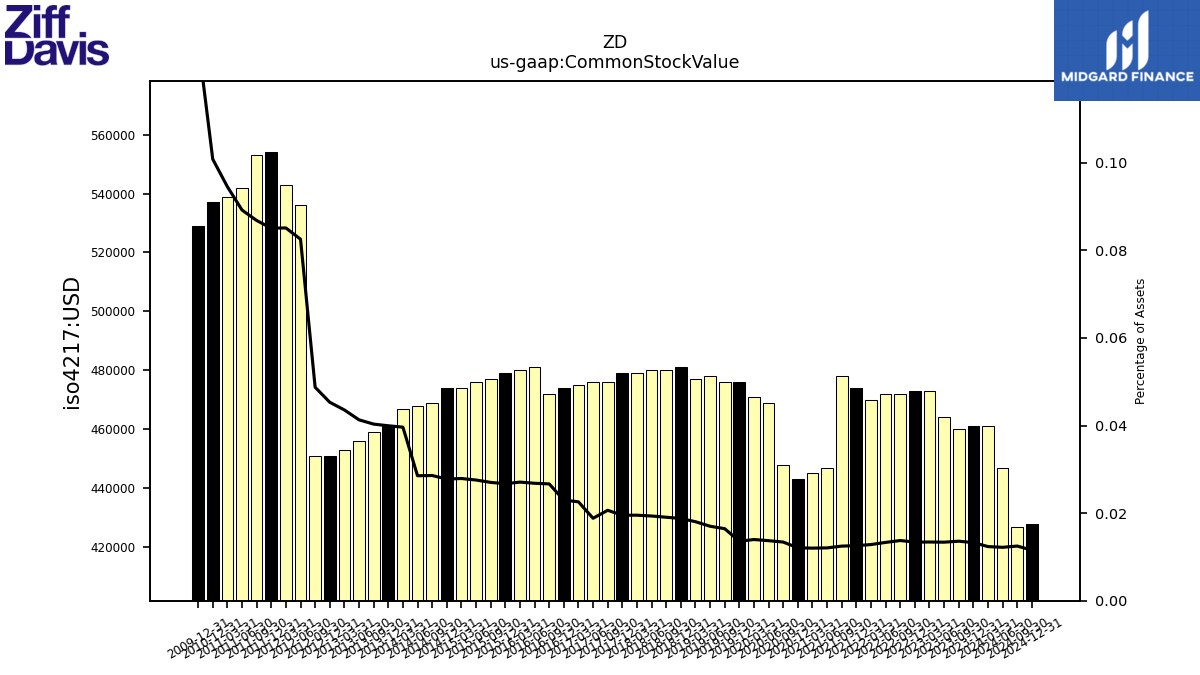
| Common Stock Value | 0.46 | 0.46 | 0.46 | 0.47 | 0.47 | 0.47 | 0.47 | 0.47 | 0.47 | 0.48 | 0.45 | 0.45 | 0.44 | 0.45 | 0.47 | 0.47 | 0.48 | 0.48 | 0.48 | 0.48 | 0.48 | 0.48 | 0.48 | 0.48 | 0.48 | 0.48 | 0.48 | 0.47 | 0.47 | 0.47 | 0.48 | 0.48 | 0.48 | 0.48 | 0.48 | 0.47 | 0.47 | 0.47 | 0.47 | 0.47 | 0.46 | 0.46 | 0.46 | 0.45 | 0.45 | 0.45 | 0.54 | 0.54 | 0.55 | 0.55 | 0.54 | 0.54 | 0.54 | NA | NA | NA | |
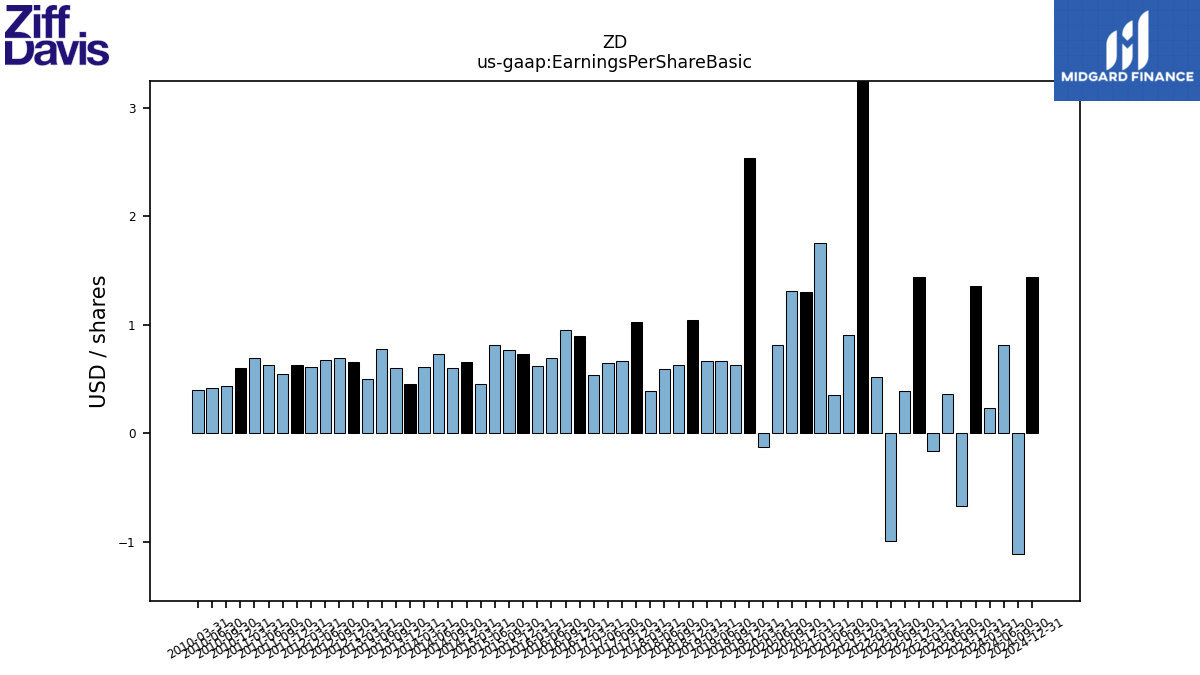
| Earnings Per Share Basic | 1.36 | -0.67 | 0.36 | -0.16 | 1.44 | 0.39 | -0.99 | 0.52 | 7.54 | 0.91 | 0.35 | 1.75 | 1.30 | 1.31 | 0.81 | -0.13 | 2.54 | 0.63 | 0.67 | 0.67 | 1.04 | 0.63 | 0.59 | 0.39 | 1.03 | 0.67 | 0.65 | 0.54 | 0.90 | 0.95 | 0.69 | 0.62 | 0.73 | 0.77 | 0.81 | 0.45 | 0.66 | 0.60 | 0.73 | 0.61 | 0.45 | 0.60 | 0.78 | 0.50 | 0.66 | 0.69 | 0.68 | 0.61 | 0.63 | 0.55 | 0.63 | 0.69 | 0.60 | 0.44 | 0.42 | 0.40 | |
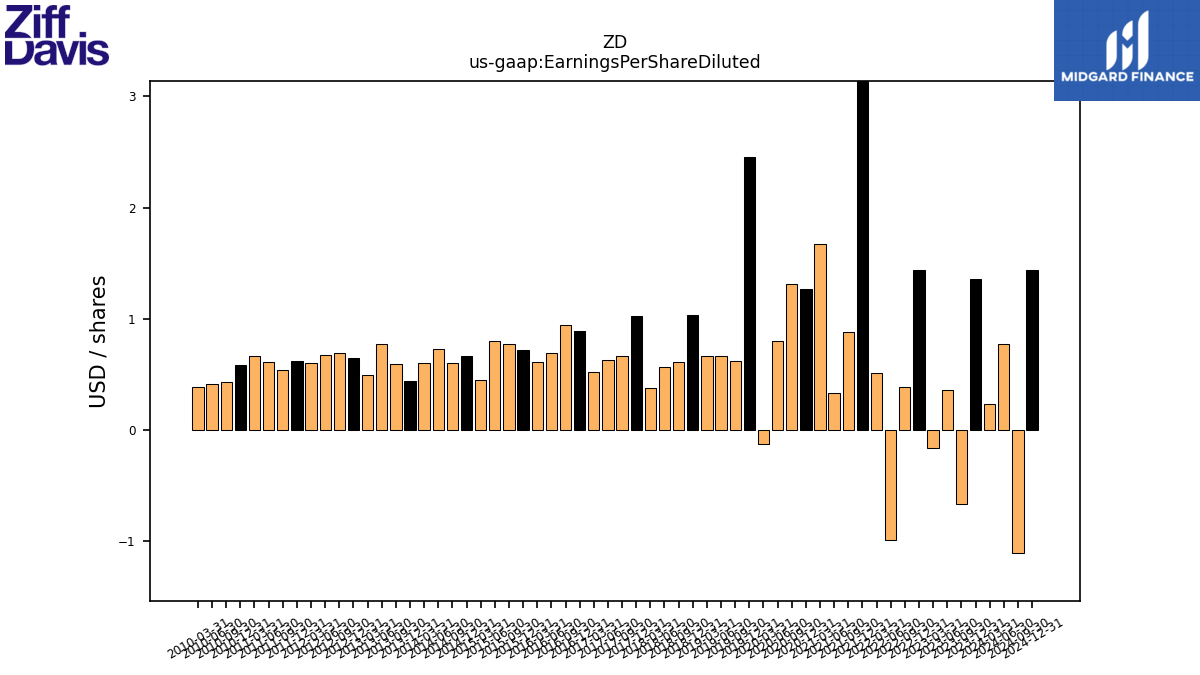
| Earnings Per Share Diluted | 1.36 | -0.67 | 0.36 | -0.16 | 1.44 | 0.39 | -0.99 | 0.51 | 7.43 | 0.88 | 0.33 | 1.67 | 1.27 | 1.31 | 0.80 | -0.13 | 2.45 | 0.62 | 0.66 | 0.66 | 1.03 | 0.61 | 0.57 | 0.38 | 1.02 | 0.66 | 0.63 | 0.52 | 0.89 | 0.94 | 0.69 | 0.61 | 0.72 | 0.77 | 0.80 | 0.45 | 0.66 | 0.60 | 0.73 | 0.60 | 0.44 | 0.59 | 0.77 | 0.49 | 0.65 | 0.69 | 0.67 | 0.60 | 0.62 | 0.54 | 0.61 | 0.66 | 0.58 | 0.43 | 0.41 | 0.39 | |
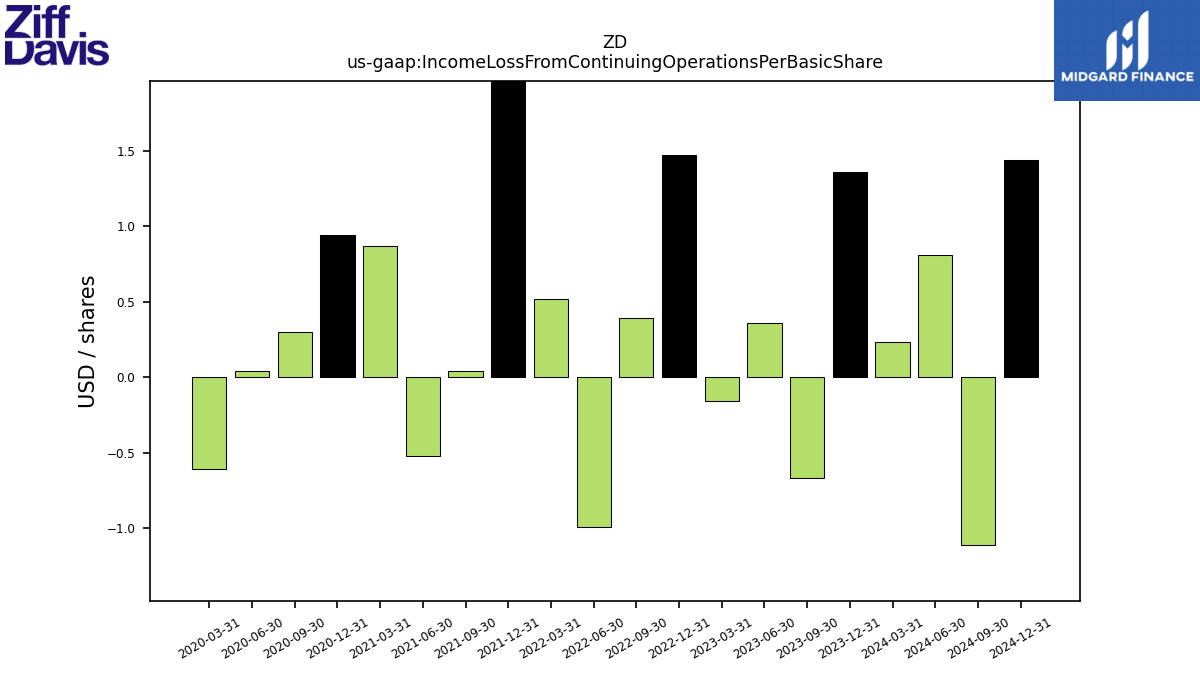
| Income Loss From Continuing Operations Per Basic Share | 0.00 | -0.00 | 0.00 | -0.00 | 0.00 | 0.00 | -0.00 | 0.00 | 0.00 | 0.00 | -0.00 | 0.00 | 0.00 | 0.00 | 0.00 | -0.00 | NA | NA | NA | NA | NA | NA | NA | NA | NA | NA | NA | NA | NA | NA | NA | NA | NA | NA | NA | NA | NA | NA | NA | NA | NA | NA | NA | NA | NA | NA | NA | NA | NA | NA | NA | NA | NA | NA | NA | NA | |
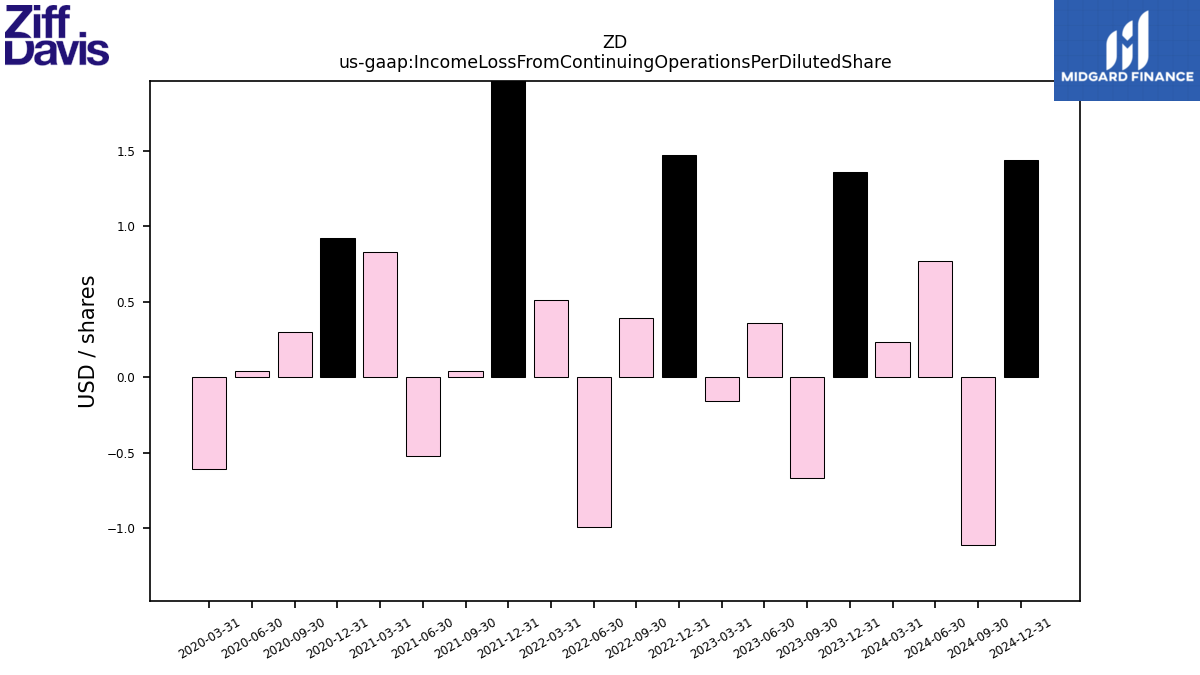
| Income Loss From Continuing Operations Per Diluted Share | 0.00 | -0.00 | 0.00 | -0.00 | 0.00 | 0.00 | -0.00 | 0.00 | 0.00 | 0.00 | -0.00 | 0.00 | 0.00 | 0.00 | 0.00 | -0.00 | NA | NA | NA | NA | NA | NA | NA | NA | NA | NA | NA | NA | NA | NA | NA | NA | NA | NA | NA | NA | NA | NA | NA | NA | NA | NA | NA | NA | NA | NA | NA | NA | NA | NA | NA | NA | NA | NA | NA | NA |
| 2023-12-31 | 2023-09-30 | 2023-06-30 | 2023-03-31 | 2022-12-31 | 2022-09-30 | 2022-06-30 | 2022-03-31 | 2021-12-31 | 2021-09-30 | 2021-06-30 | 2021-03-31 | 2020-12-31 | 2020-09-30 | 2020-06-30 | 2020-03-31 | 2019-12-31 | 2019-09-30 | 2019-06-30 | 2019-03-31 | 2018-12-31 | 2018-09-30 | 2018-06-30 | 2018-03-31 | 2017-12-31 | 2017-09-30 | 2017-06-30 | 2017-03-31 | 2016-12-31 | 2016-09-30 | 2016-06-30 | 2016-03-31 | 2015-12-31 | 2015-09-30 | 2015-06-30 | 2015-03-31 | 2014-12-31 | 2014-09-30 | 2014-06-30 | 2014-03-31 | 2013-12-31 | 2013-09-30 | 2013-06-30 | 2013-03-31 | 2012-12-31 | 2012-09-30 | 2012-06-30 | 2012-03-31 | 2011-12-31 | 2011-09-30 | 2011-06-30 | 2011-03-31 | 2010-12-31 | 2010-09-30 | 2010-06-30 | 2010-03-31 | ||
|---|---|---|---|---|---|---|---|---|---|---|---|---|---|---|---|---|---|---|---|---|---|---|---|---|---|---|---|---|---|---|---|---|---|---|---|---|---|---|---|---|---|---|---|---|---|---|---|---|---|---|---|---|---|---|---|---|---|
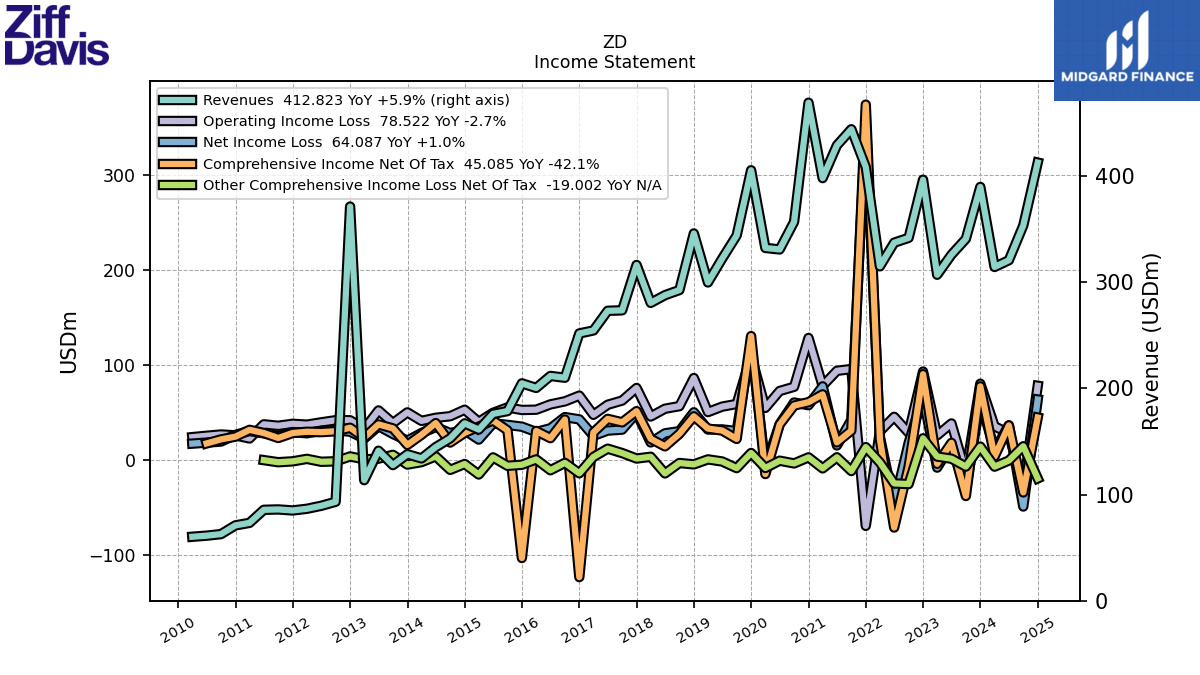
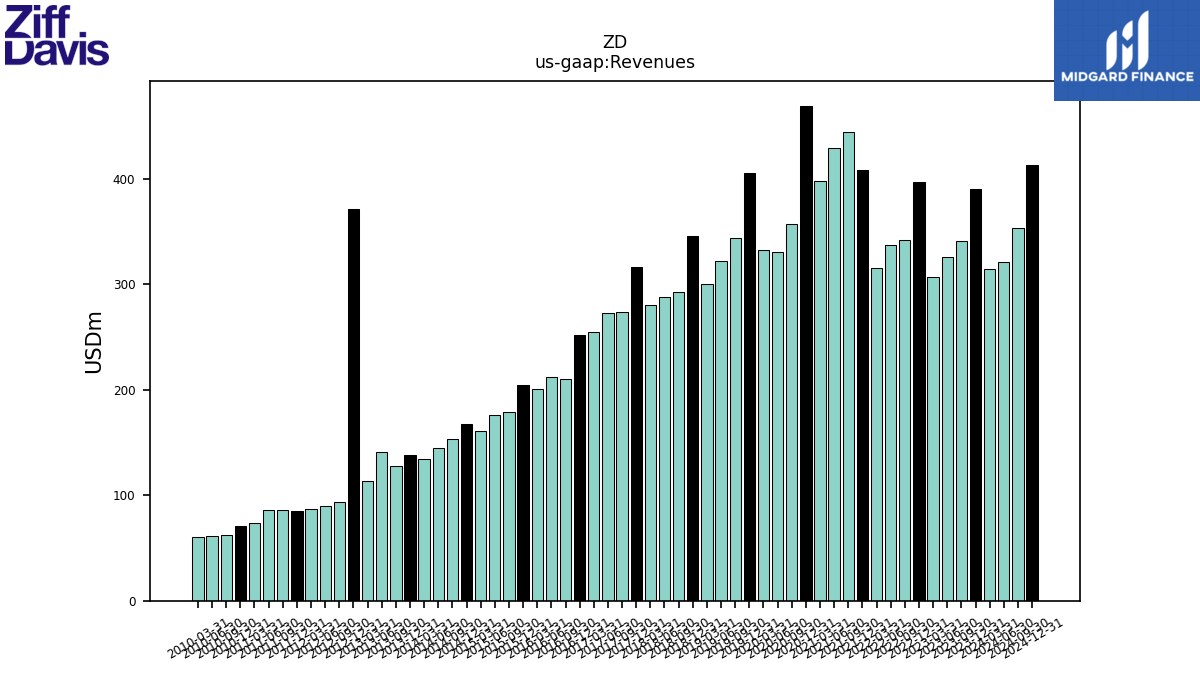
| Revenues | 389.88 | 340.99 | 326.02 | 307.14 | 396.70 | 341.87 | 337.36 | 315.07 | 408.63 | 444.25 | 429.04 | 398.19 | 469.24 | 356.98 | 330.98 | 332.39 | 405.59 | 344.14 | 322.43 | 299.89 | 346.06 | 292.72 | 287.89 | 280.62 | 316.38 | 273.62 | 273.17 | 254.67 | 251.84 | 210.12 | 211.80 | 200.50 | 204.82 | 178.70 | 176.04 | 161.25 | 167.14 | 153.02 | 144.74 | 134.12 | 138.03 | 127.79 | 141.36 | 113.62 | 371.40 | 93.25 | 89.47 | 86.65 | 85.07 | 86.03 | 85.68 | 73.38 | 71.03 | 62.78 | 61.31 | 60.28 | |
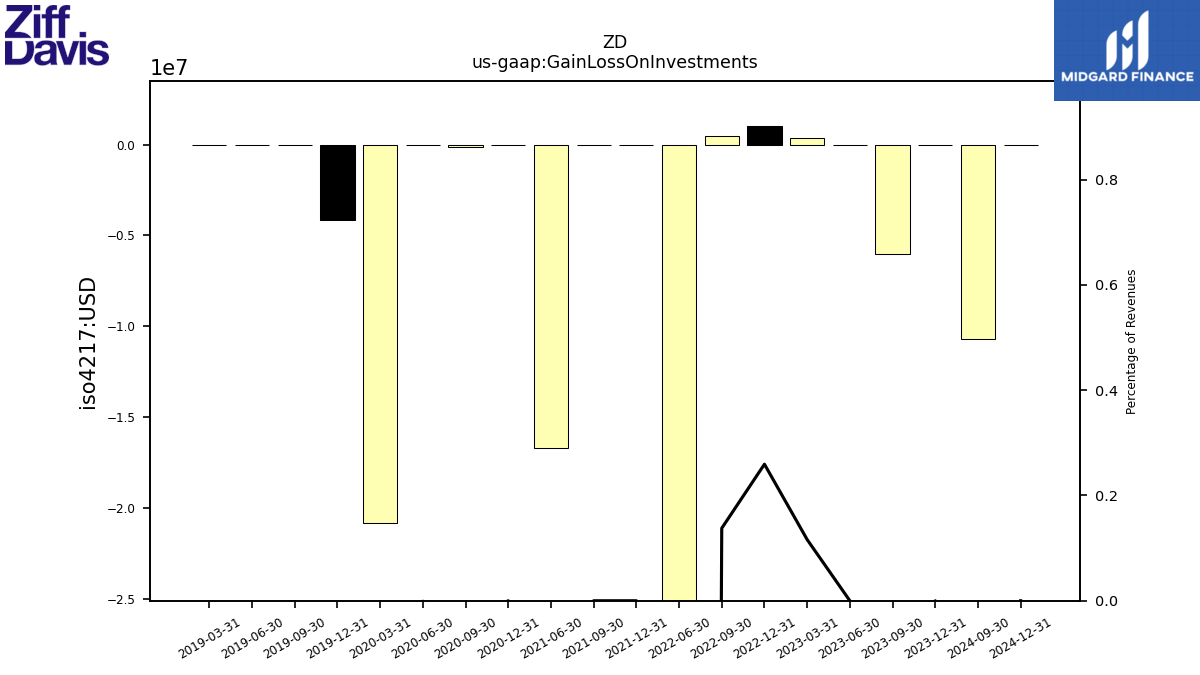
| Gain Loss On Investments | 0.00 | 0.00 | 0.00 | 0.36 | 1.03 | 0.47 | -48.24 | NA | 0.00 | 0.00 | -16.68 | NA | 0.00 | -0.16 | -0.00 | -20.83 | -4.17 | -0.01 | -0.02 | -0.01 | NA | NA | NA | NA | NA | NA | NA | NA | NA | NA | NA | NA | NA | NA | NA | NA | NA | NA | NA | NA | NA | NA | NA | NA | NA | NA | NA | NA | NA | NA | NA | NA | NA | NA | NA | NA | |
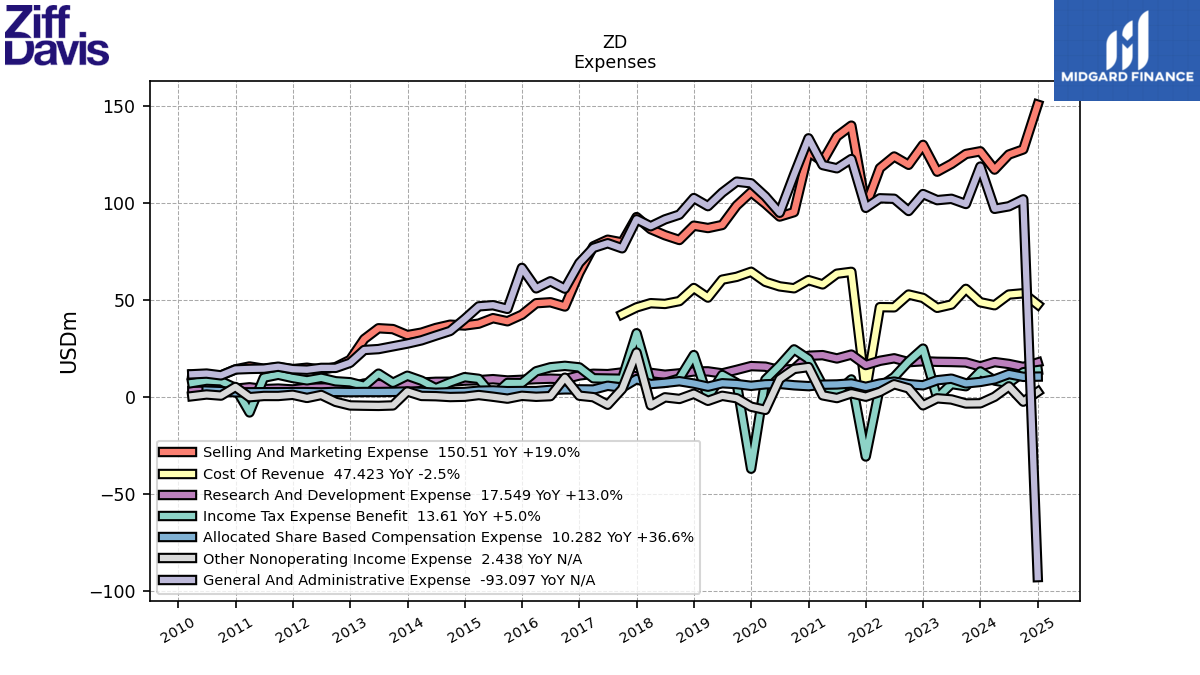
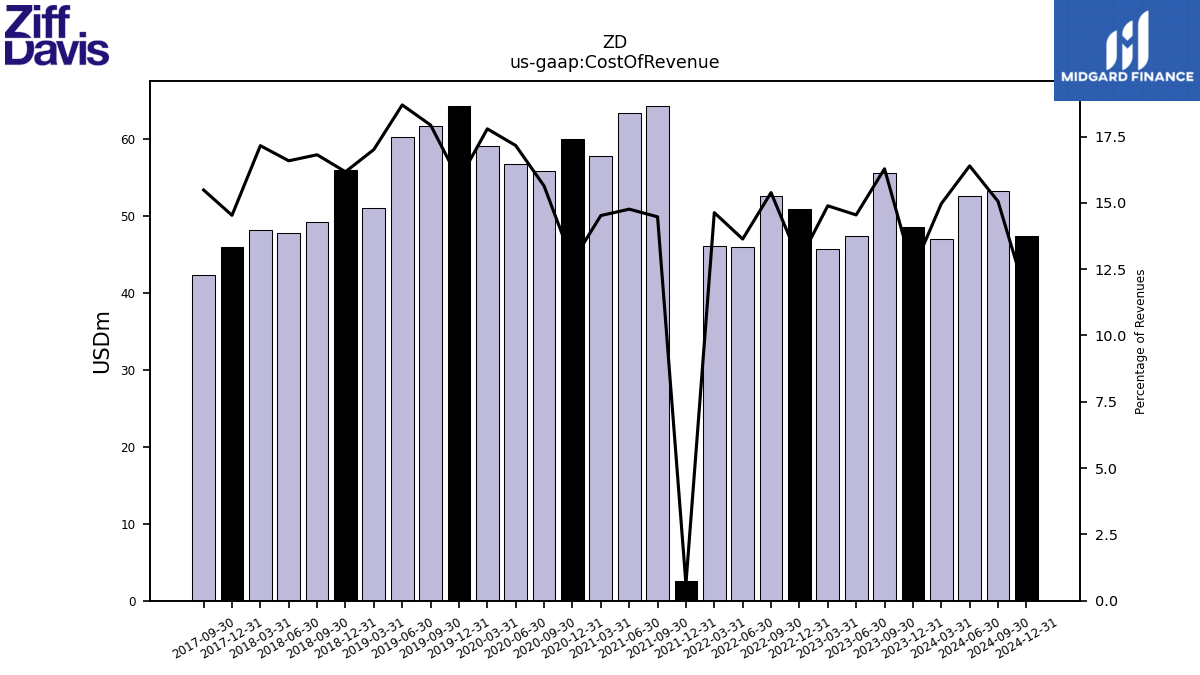
| Cost Of Revenue | 48.62 | 55.53 | 47.42 | 45.73 | 50.85 | 52.60 | 46.00 | 46.10 | 2.59 | 64.30 | 63.34 | 57.82 | 60.03 | 55.82 | 56.80 | 59.13 | 64.33 | 61.72 | 60.27 | 51.01 | 55.96 | 49.22 | 47.75 | 48.15 | 45.97 | 42.37 | NA | NA | NA | NA | NA | NA | NA | NA | NA | NA | NA | NA | NA | NA | NA | NA | NA | NA | NA | NA | NA | NA | NA | NA | NA | NA | NA | NA | NA | NA | |
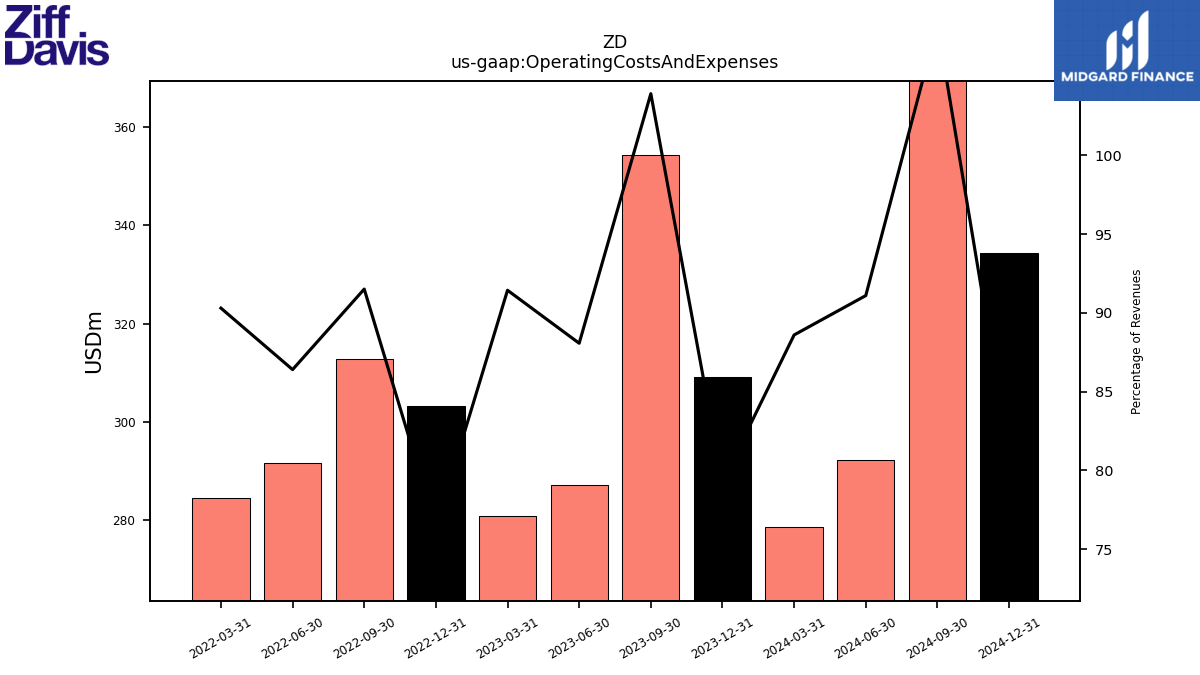
| Operating Costs And Expenses | 309.17 | 354.30 | 287.12 | 280.83 | 303.24 | 312.84 | 291.47 | 284.51 | NA | NA | NA | NA | NA | NA | NA | NA | NA | NA | NA | NA | NA | NA | NA | NA | NA | NA | NA | NA | NA | NA | NA | NA | NA | NA | NA | NA | NA | NA | NA | NA | NA | NA | NA | NA | NA | NA | NA | NA | NA | NA | NA | NA | NA | NA | NA | NA | |
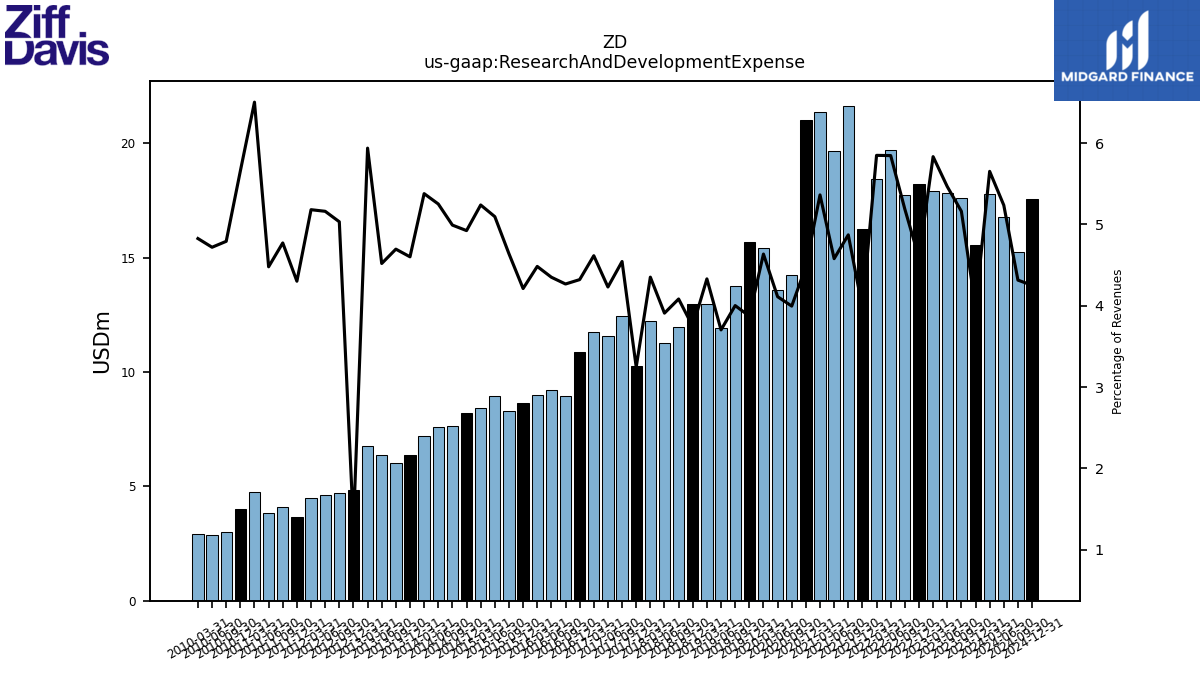
| Research And Development Expense | 15.53 | 17.60 | 17.82 | 17.91 | 18.21 | 17.73 | 19.72 | 18.43 | 16.24 | 21.64 | 19.64 | 21.35 | 21.02 | 14.26 | 13.61 | 15.41 | 15.70 | 13.77 | 11.94 | 12.98 | 12.96 | 11.95 | 11.25 | 12.21 | 10.27 | 12.43 | 11.55 | 11.75 | 10.88 | 8.96 | 9.21 | 8.99 | 8.62 | 8.29 | 8.97 | 8.45 | 8.23 | 7.64 | 7.60 | 7.21 | 6.35 | 6.00 | 6.39 | 6.75 | 4.83 | 4.69 | 4.62 | 4.49 | 3.66 | 4.11 | 3.84 | 4.77 | 4.02 | 3.01 | 2.89 | 2.91 | |
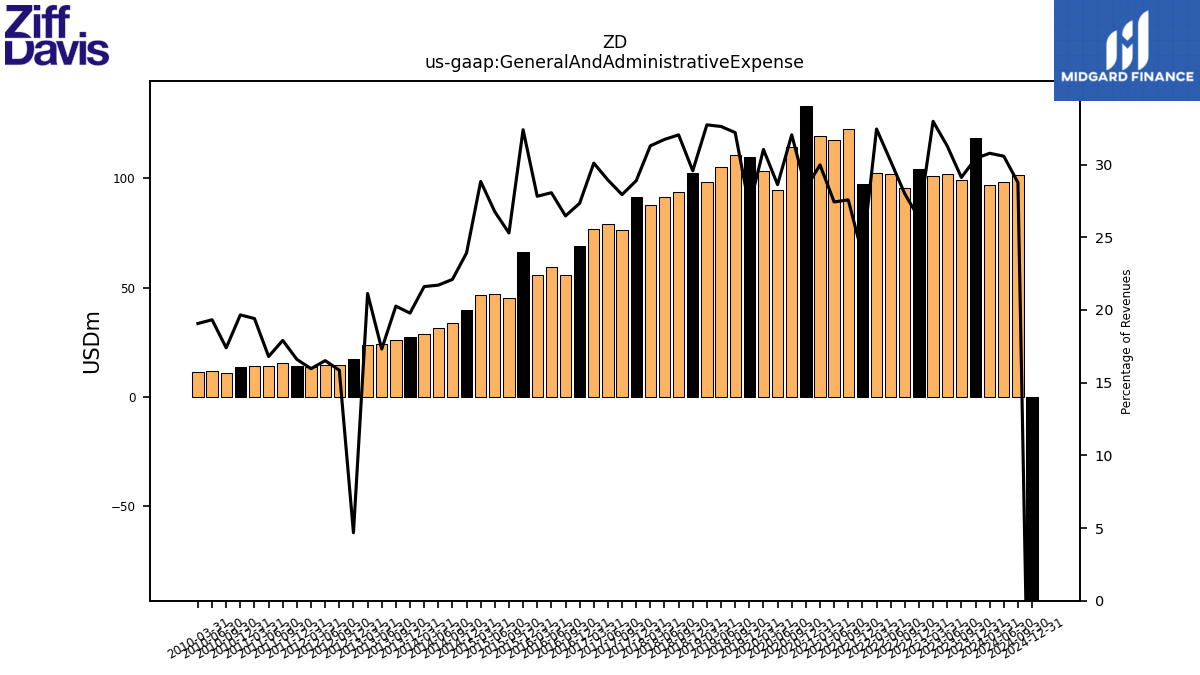
| General And Administrative Expense | 118.57 | 99.27 | 101.95 | 101.26 | 104.42 | 95.66 | 101.97 | 102.22 | 97.28 | 122.48 | 117.68 | 119.35 | 133.15 | 114.38 | 94.73 | 103.17 | 109.94 | 110.81 | 105.17 | 98.15 | 102.34 | 93.79 | 91.33 | 87.80 | 91.40 | 76.42 | 79.04 | 76.66 | 68.85 | 55.61 | 59.43 | 55.78 | 66.35 | 45.20 | 47.09 | 46.50 | 39.98 | 33.81 | 31.42 | 28.98 | 27.31 | 25.89 | 24.47 | 24.01 | 17.39 | 14.78 | 14.77 | 13.83 | 14.12 | 15.40 | 14.39 | 14.24 | 13.96 | 10.92 | 11.85 | 11.49 | |
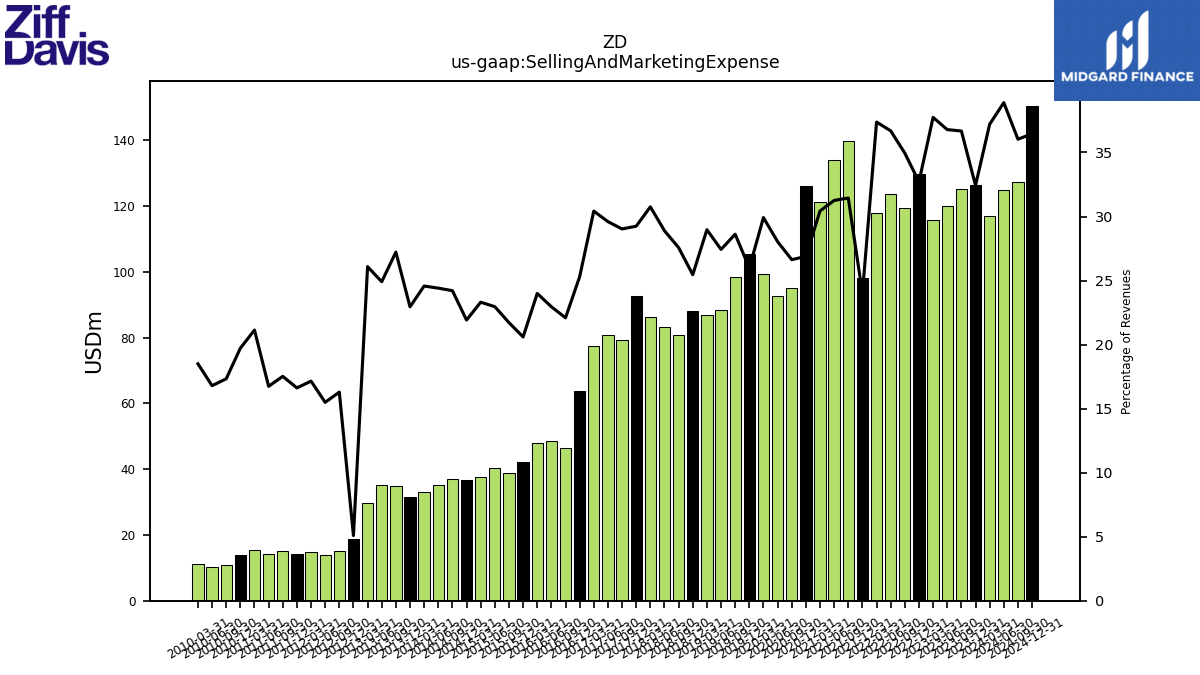
| Selling And Marketing Expense | 126.45 | 125.06 | 119.93 | 115.92 | 129.76 | 119.47 | 123.78 | 117.76 | 98.07 | 139.69 | 134.10 | 121.19 | 126.16 | 95.07 | 92.81 | 99.44 | 105.37 | 98.49 | 88.45 | 86.88 | 88.11 | 80.71 | 83.17 | 86.31 | 92.52 | 79.43 | 80.86 | 77.48 | 63.72 | 46.42 | 48.62 | 48.11 | 42.19 | 38.81 | 40.42 | 37.59 | 36.63 | 37.05 | 35.33 | 32.96 | 31.68 | 34.79 | 35.21 | 29.64 | 18.91 | 15.19 | 13.86 | 14.86 | 14.14 | 15.07 | 14.35 | 15.51 | 14.01 | 10.88 | 10.30 | 11.15 | |
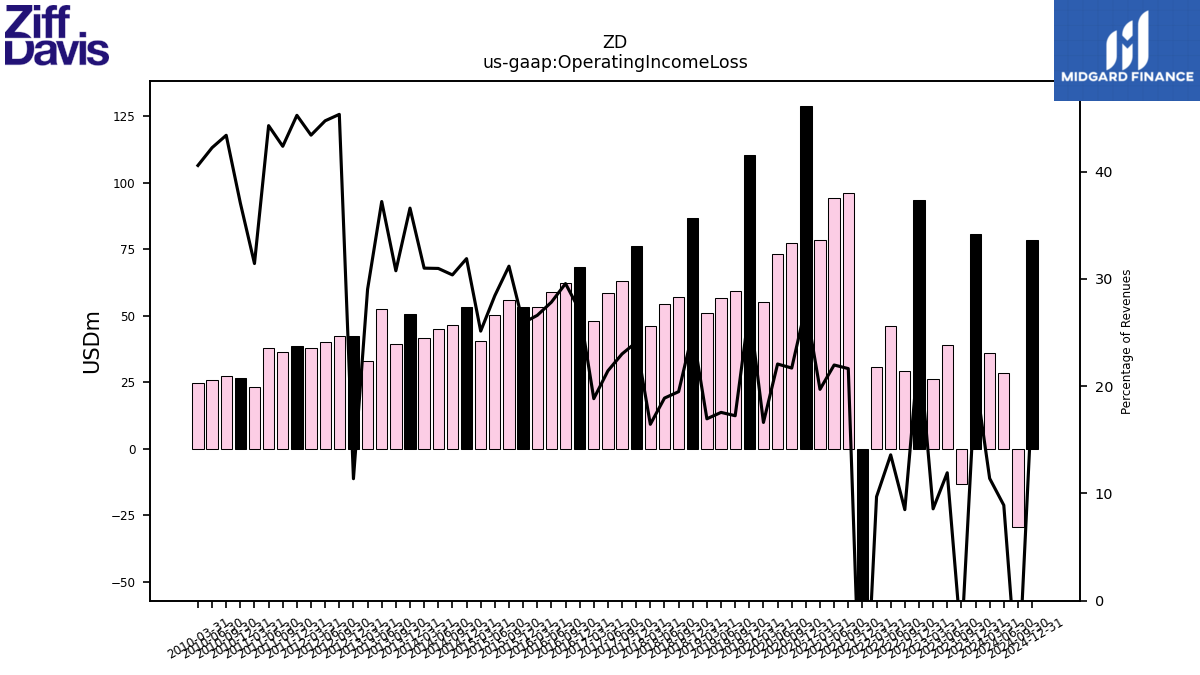
| Operating Income Loss | 80.72 | -13.32 | 38.90 | 26.32 | 93.46 | 29.03 | 45.89 | 30.56 | -68.94 | 96.14 | 94.28 | 78.48 | 128.89 | 77.44 | 73.04 | 55.25 | 110.25 | 59.36 | 56.61 | 50.86 | 86.68 | 57.06 | 54.38 | 46.16 | 76.22 | 62.96 | 58.56 | 47.98 | 68.16 | 62.12 | 58.95 | 53.34 | 53.05 | 55.73 | 50.07 | 40.53 | 53.31 | 46.48 | 44.84 | 41.59 | 50.52 | 39.31 | 52.61 | 32.99 | 42.25 | 42.28 | 40.03 | 37.61 | 38.49 | 36.44 | 37.94 | 23.07 | 26.33 | 27.24 | 25.89 | 24.46 | |
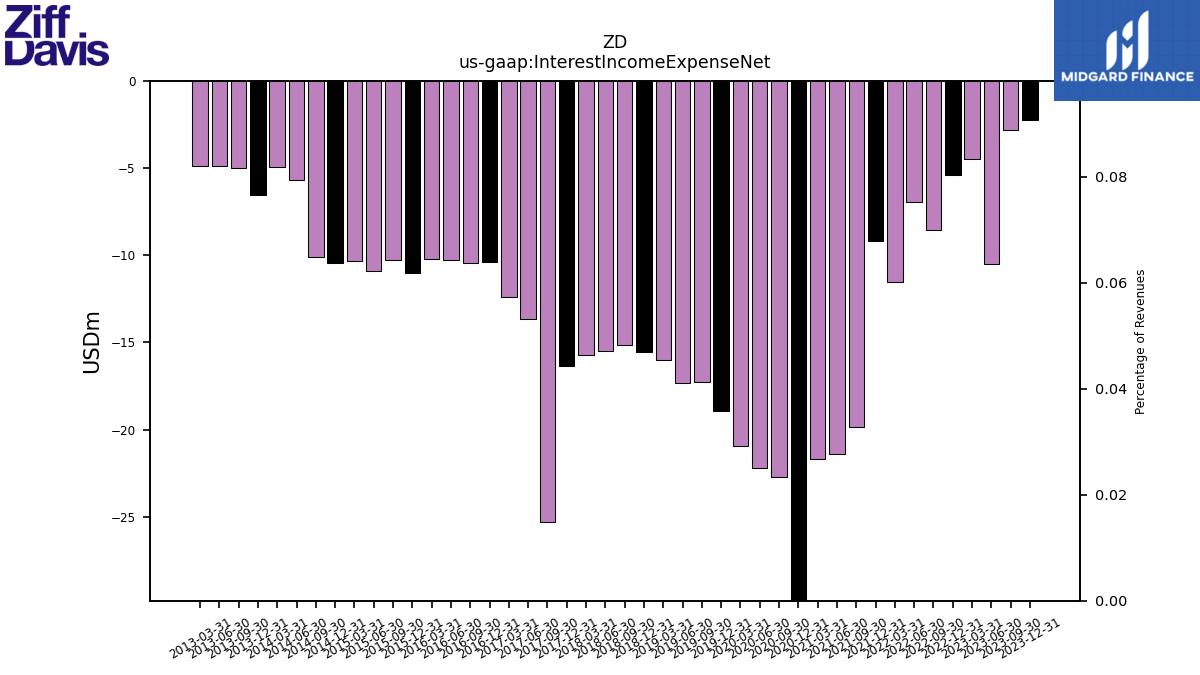
| Interest Income Expense Net | -2.25 | -2.82 | -10.48 | -4.48 | -5.42 | -8.56 | -6.96 | -11.51 | -9.19 | -19.86 | -21.40 | -21.70 | -66.10 | -22.71 | -22.20 | -20.97 | -18.92 | -17.27 | -17.34 | -16.02 | -15.56 | -15.18 | -15.50 | -15.75 | -16.37 | -25.33 | -13.67 | -12.41 | -10.40 | -10.44 | -10.30 | -10.23 | -11.01 | -10.26 | -10.88 | -10.31 | -10.45 | -10.12 | -5.68 | -4.95 | -6.54 | -4.97 | -4.86 | -4.88 | NA | NA | NA | NA | NA | NA | NA | NA | NA | NA | NA | NA | |
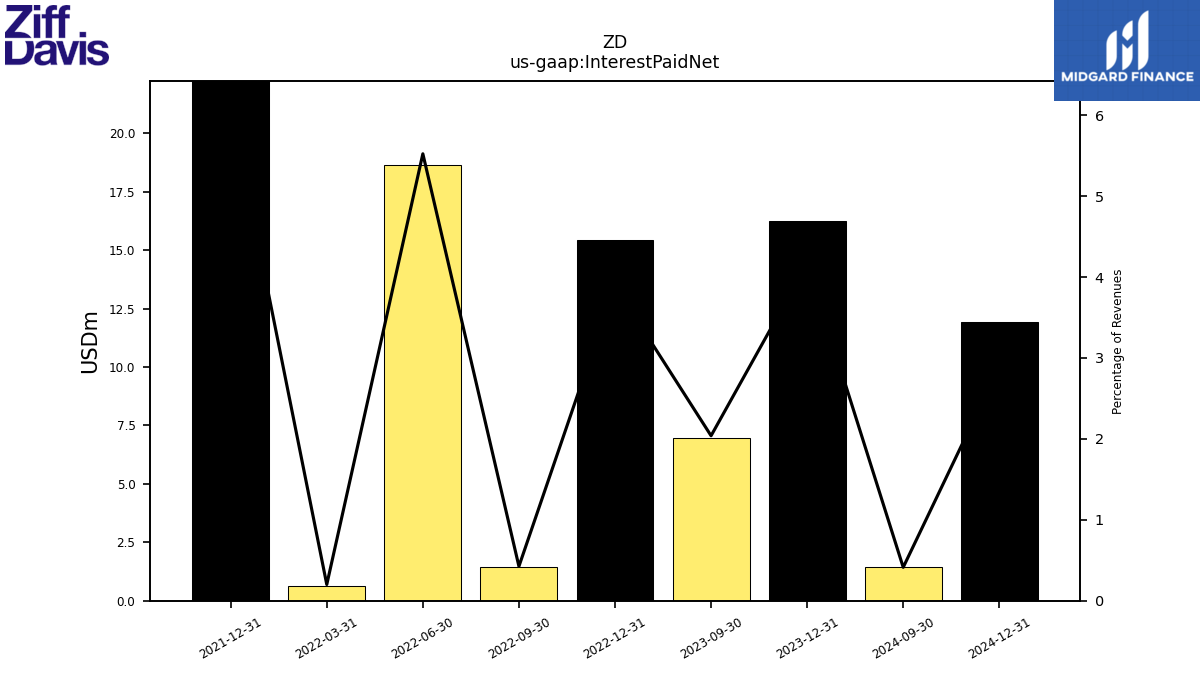
| Interest Paid Net | 16.26 | 6.95 | NA | NA | 15.45 | 1.45 | 18.63 | 0.63 | 25.03 | NA | NA | NA | NA | NA | NA | NA | NA | NA | NA | NA | NA | NA | NA | NA | NA | NA | NA | NA | NA | NA | NA | NA | NA | NA | NA | NA | NA | NA | NA | NA | NA | NA | NA | NA | NA | NA | NA | NA | NA | NA | NA | NA | NA | NA | NA | NA | |
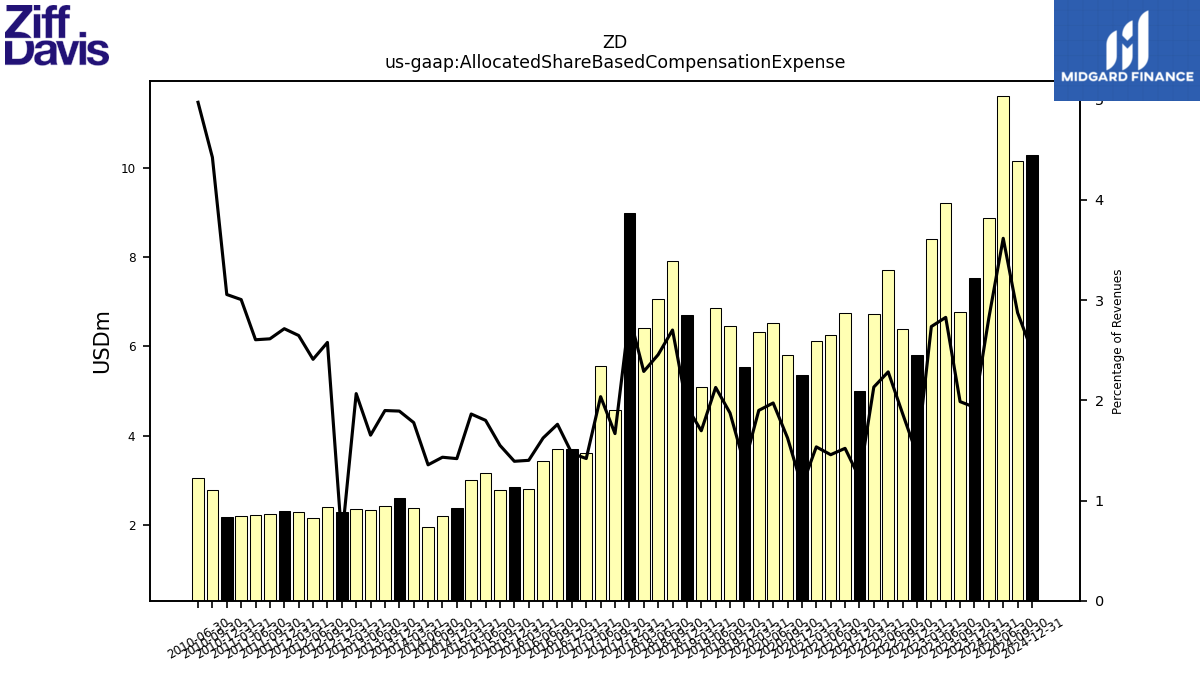
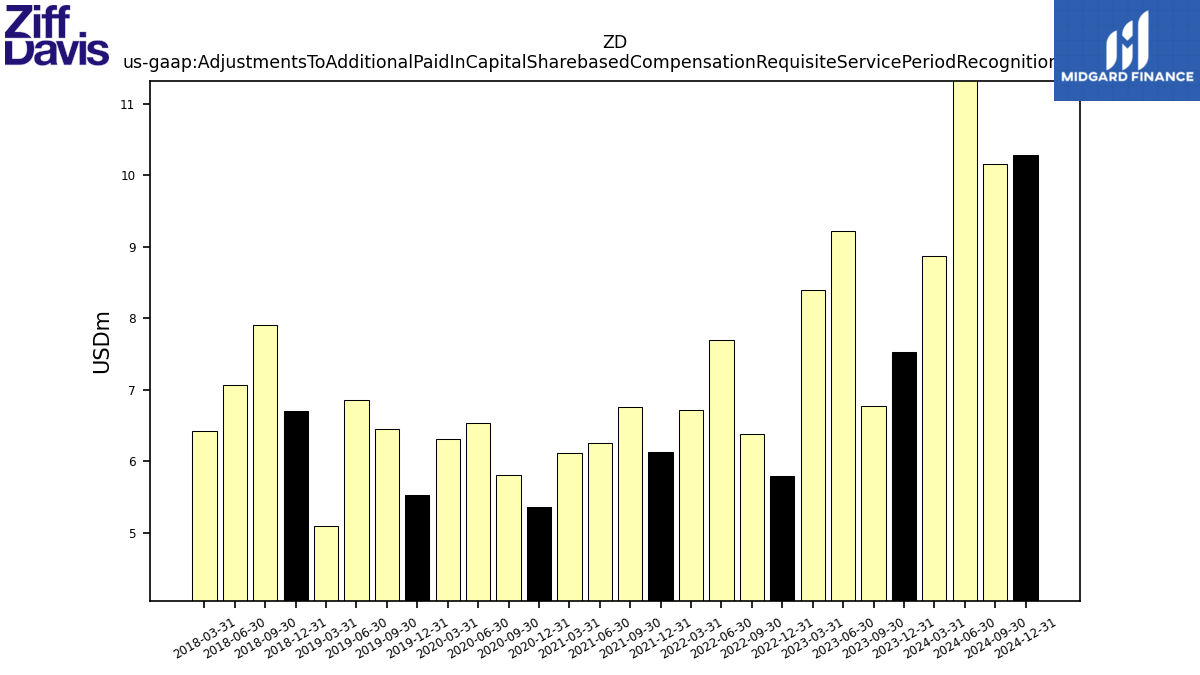
| Allocated Share Based Compensation Expense | 7.53 | 6.77 | 9.22 | 8.40 | 5.79 | 6.39 | 7.70 | 6.72 | 5.01 | 6.75 | 6.25 | 6.11 | 5.36 | 5.80 | 6.53 | 6.31 | 5.53 | 6.45 | 6.86 | 5.09 | 6.70 | 7.91 | 7.07 | 6.42 | 9.00 | 4.56 | 5.56 | 3.61 | 3.70 | 3.70 | 3.44 | 2.81 | 2.85 | 2.77 | 3.17 | 3.00 | 2.37 | 2.19 | 1.96 | 2.38 | 2.61 | 2.42 | 2.33 | 2.35 | 2.28 | 2.40 | 2.15 | 2.29 | 2.31 | 2.25 | 2.23 | 2.21 | 2.17 | 2.78 | 3.05 | NA | |
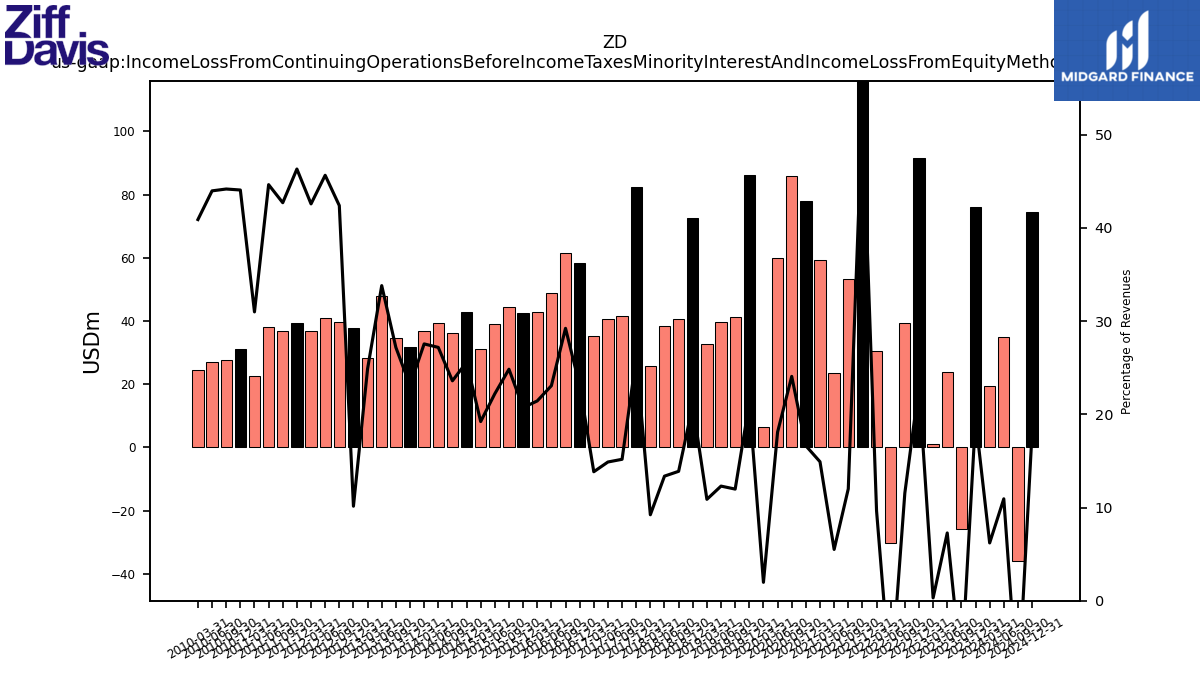
| Income Loss From Continuing Operations Before Income Taxes Minority Interest And Income Loss From Equity Method Investments | 76.05 | -25.73 | 23.71 | 0.94 | 91.56 | 39.48 | -30.28 | 30.40 | 215.01 | 53.34 | 23.62 | 59.38 | 78.01 | 85.92 | 59.90 | 6.57 | 86.09 | 41.22 | 39.66 | 32.63 | 72.57 | 40.64 | 38.49 | 25.89 | 82.54 | 41.52 | 40.66 | 35.24 | 58.20 | 61.40 | 48.86 | 42.98 | 42.43 | 44.39 | 39.10 | 31.00 | 42.77 | 36.10 | 39.34 | 36.96 | 31.90 | 34.73 | 47.79 | 28.27 | 37.66 | 39.53 | 40.84 | 36.89 | 39.40 | 36.73 | 38.24 | 22.74 | 31.30 | 27.73 | 26.96 | 24.65 | |
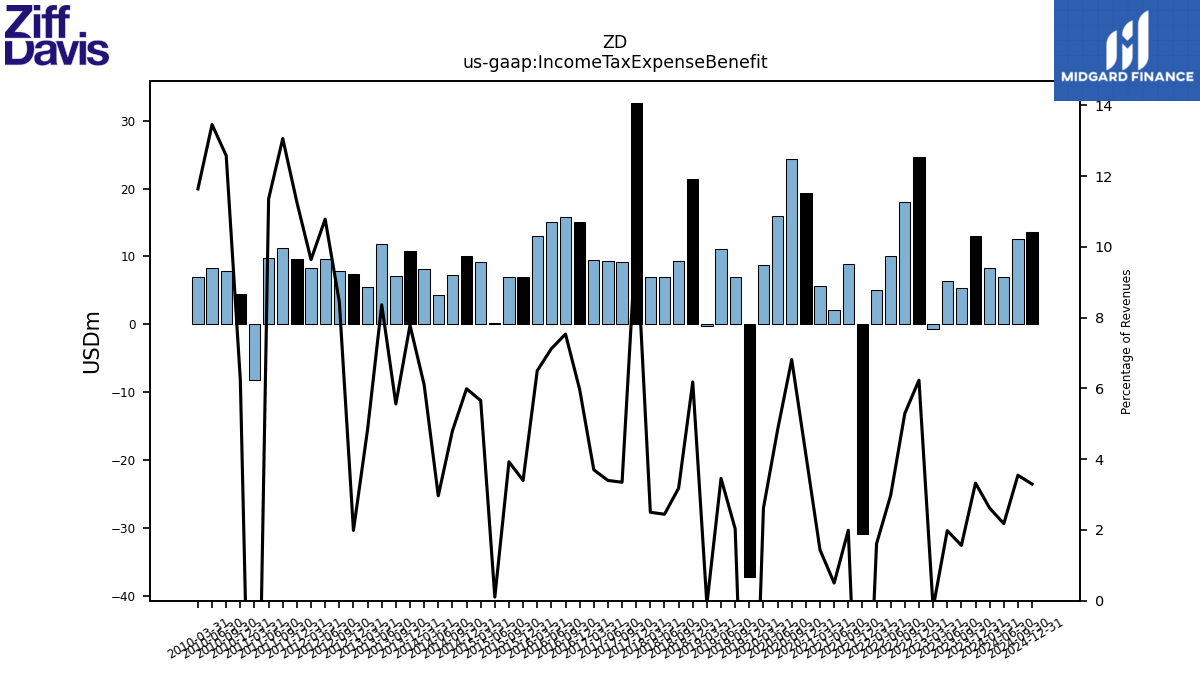
| Income Tax Expense Benefit | 12.96 | 5.33 | 6.46 | -0.62 | 24.73 | 18.10 | 10.05 | 5.08 | -30.92 | 8.85 | 2.15 | 5.72 | 19.38 | 24.33 | 15.98 | 8.70 | -37.23 | 7.00 | 11.15 | -0.29 | 21.39 | 9.31 | 7.04 | 7.02 | 32.67 | 9.16 | 9.29 | 9.42 | 15.04 | 15.84 | 15.09 | 13.04 | 6.97 | 7.01 | 0.18 | 9.12 | 10.01 | 7.34 | 4.29 | 8.19 | 10.75 | 7.11 | 11.82 | 5.50 | 7.38 | 7.88 | 9.65 | 8.35 | 9.58 | 11.24 | 9.73 | -8.20 | 4.43 | 7.90 | 8.25 | 7.01 | |
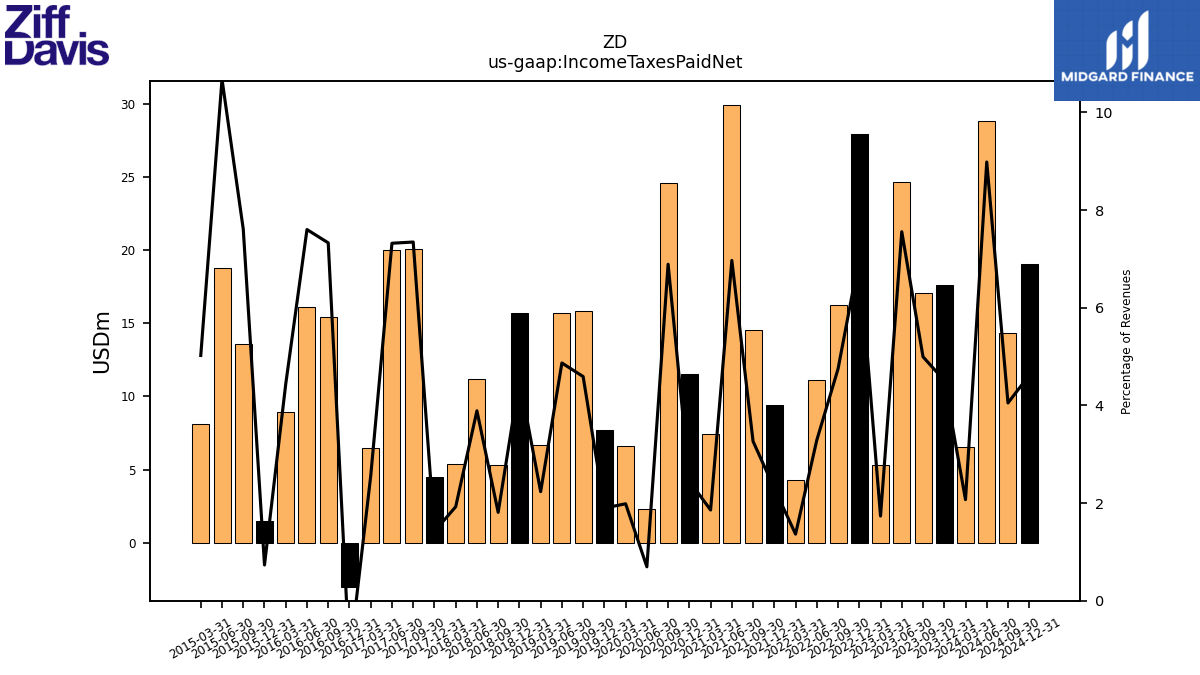
| Income Taxes Paid Net | 17.59 | 17.04 | 24.64 | 5.33 | 27.91 | 16.23 | 11.10 | 4.30 | 9.40 | 14.50 | 29.90 | 7.40 | 11.50 | 24.60 | 2.30 | 6.60 | 7.70 | 15.80 | 15.70 | 6.70 | 15.70 | 5.30 | 11.20 | 5.40 | 4.50 | 20.10 | 20.00 | 6.50 | -3.00 | 15.40 | 16.10 | 8.90 | 1.50 | 13.60 | 18.80 | 8.10 | NA | NA | NA | NA | NA | NA | NA | NA | NA | NA | NA | NA | NA | NA | NA | NA | NA | NA | NA | NA | |
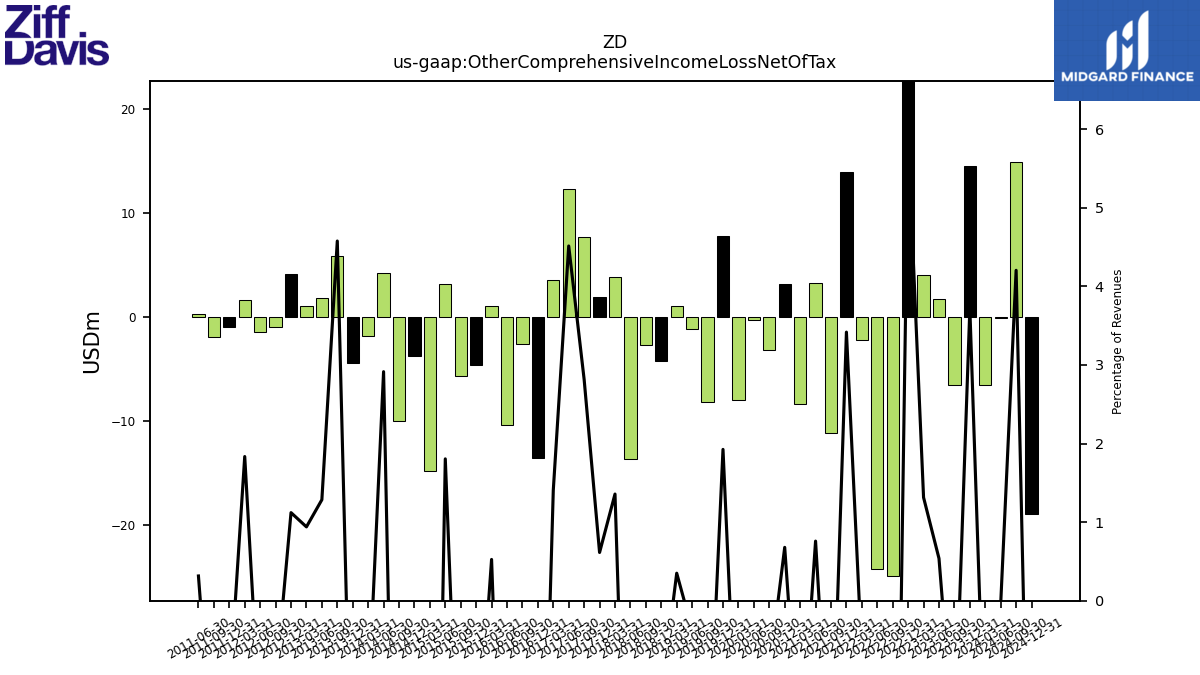
| Other Comprehensive Income Loss Net Of Tax | 14.49 | -6.53 | 1.75 | 4.04 | 23.25 | -24.92 | -24.27 | -2.21 | 13.97 | -11.21 | 3.26 | -8.42 | 3.19 | -3.19 | -0.33 | -8.01 | 7.81 | -8.17 | -1.18 | 1.05 | -4.22 | -2.76 | -13.72 | 3.81 | 1.94 | 7.70 | 12.33 | 3.58 | -13.60 | -2.58 | -10.40 | 1.05 | -4.61 | -5.71 | 3.18 | -14.86 | -3.79 | -9.98 | 4.22 | -1.80 | -4.41 | 5.85 | 1.82 | 1.07 | 4.16 | -0.98 | -1.46 | 1.59 | -1.00 | -1.94 | 0.27 | NA | NA | NA | NA | NA | |
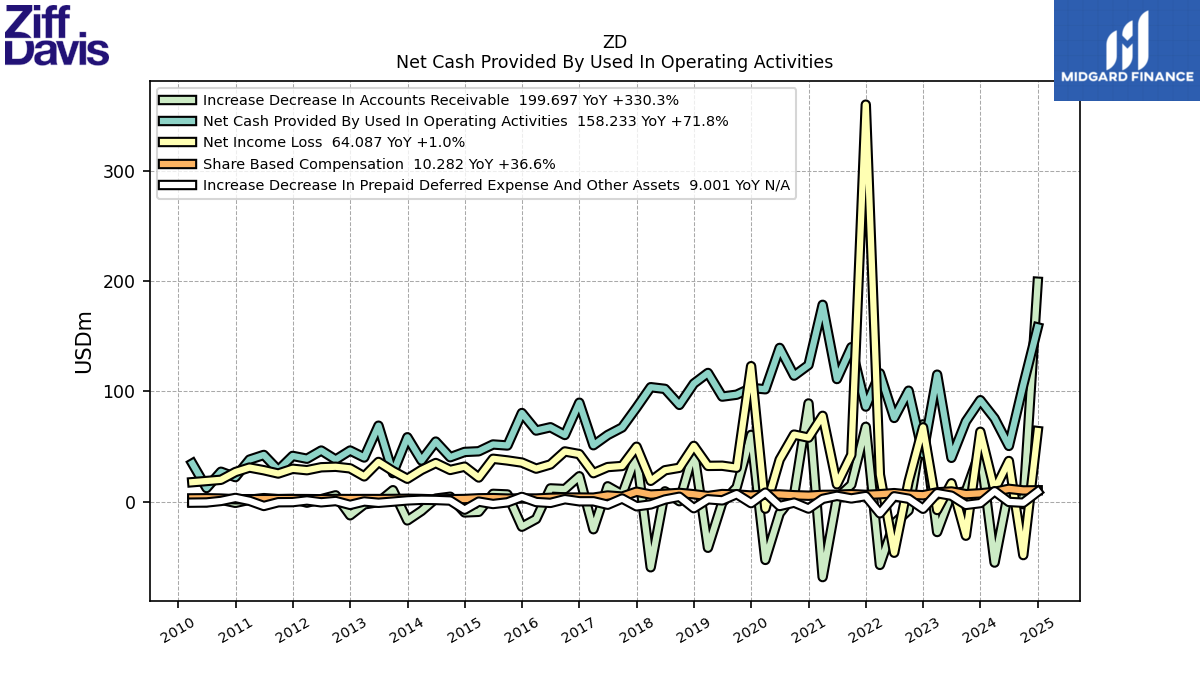
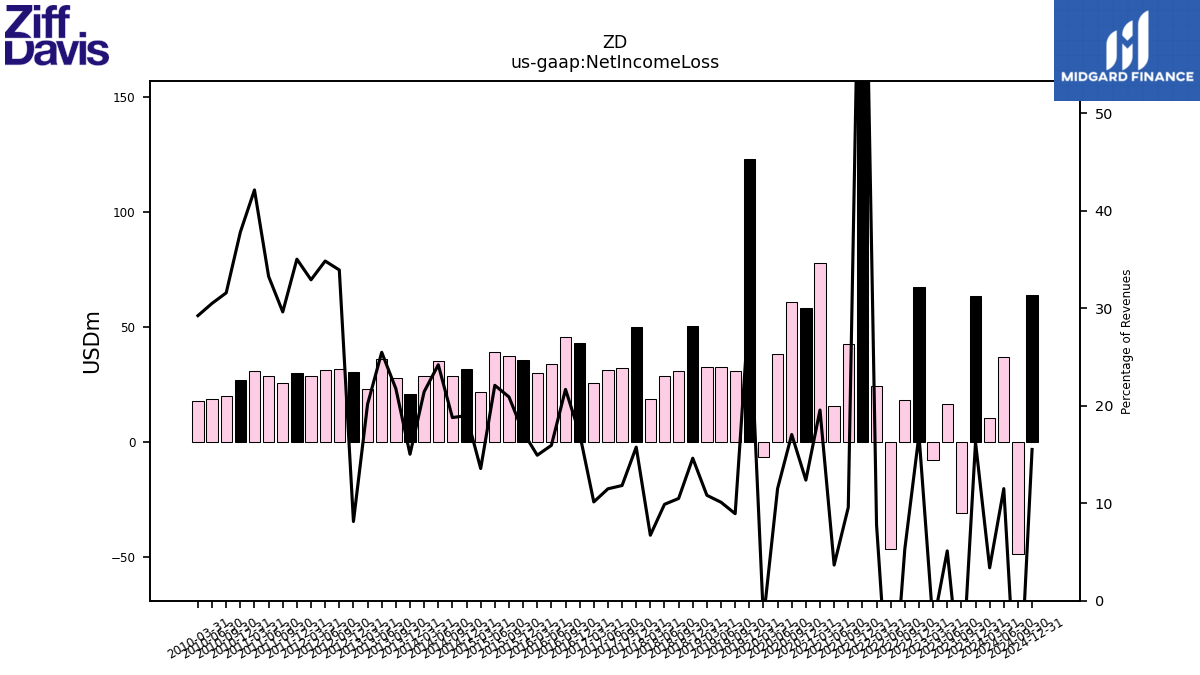
| Net Income Loss | 63.42 | -30.97 | 16.68 | -7.63 | 67.47 | 18.18 | -46.44 | 24.54 | 360.51 | 42.57 | 15.72 | 77.92 | 58.09 | 60.88 | 38.10 | -6.40 | 123.02 | 30.75 | 32.59 | 32.45 | 50.61 | 30.72 | 28.48 | 18.87 | 49.87 | 32.36 | 31.38 | 25.82 | 43.16 | 45.57 | 33.77 | 29.94 | 35.47 | 37.38 | 38.92 | 21.88 | 31.76 | 28.76 | 35.05 | 28.77 | 20.75 | 27.81 | 36.04 | 22.92 | 30.20 | 31.65 | 31.19 | 28.54 | 29.82 | 25.50 | 28.51 | 30.93 | 26.87 | 19.83 | 18.71 | 17.64 | |
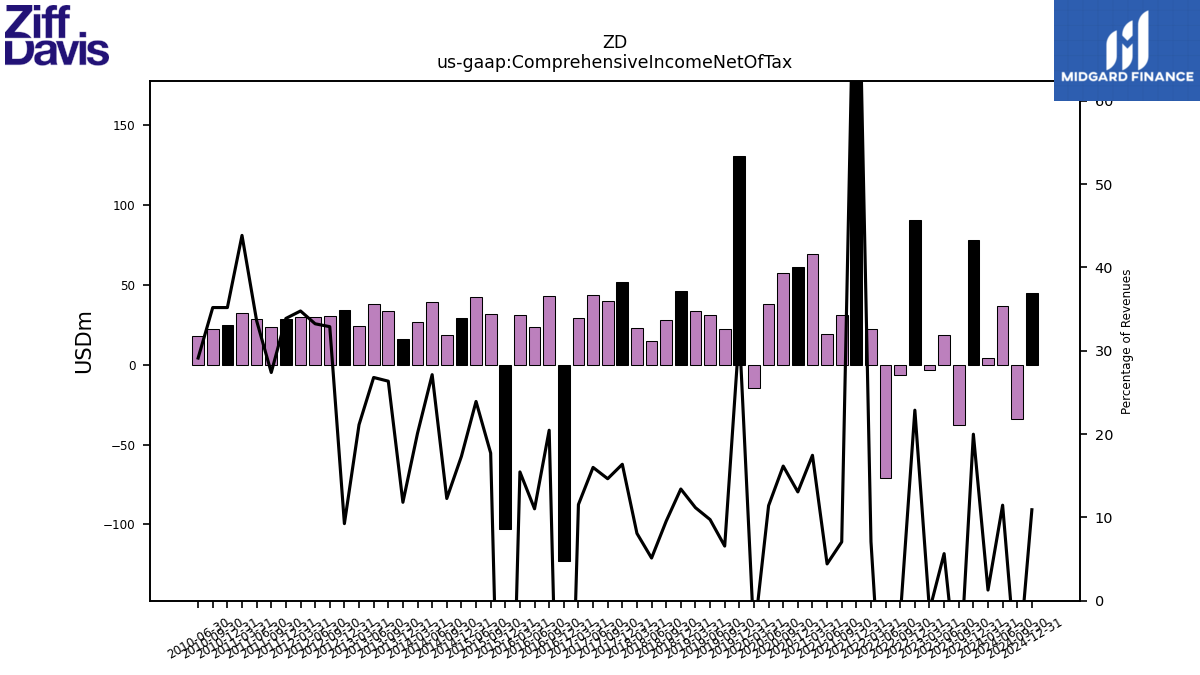
| Comprehensive Income Net Of Tax | 77.92 | -37.50 | 18.43 | -3.59 | 90.72 | -6.74 | -70.70 | 22.33 | 374.47 | 31.35 | 18.97 | 69.50 | 61.28 | 57.69 | 37.77 | -14.41 | 130.83 | 22.58 | 31.41 | 33.50 | 46.40 | 27.97 | 14.75 | 22.68 | 51.81 | 40.06 | 43.71 | 29.40 | -122.88 | 42.99 | 23.37 | 31.00 | -102.78 | 31.67 | 42.09 | NA | 28.96 | 18.78 | 39.27 | 26.96 | 16.31 | 33.67 | 37.87 | 24.00 | 34.37 | 30.66 | 29.73 | 30.13 | 28.82 | 23.56 | 28.78 | 32.17 | 24.99 | 22.09 | 17.86 | NA | |
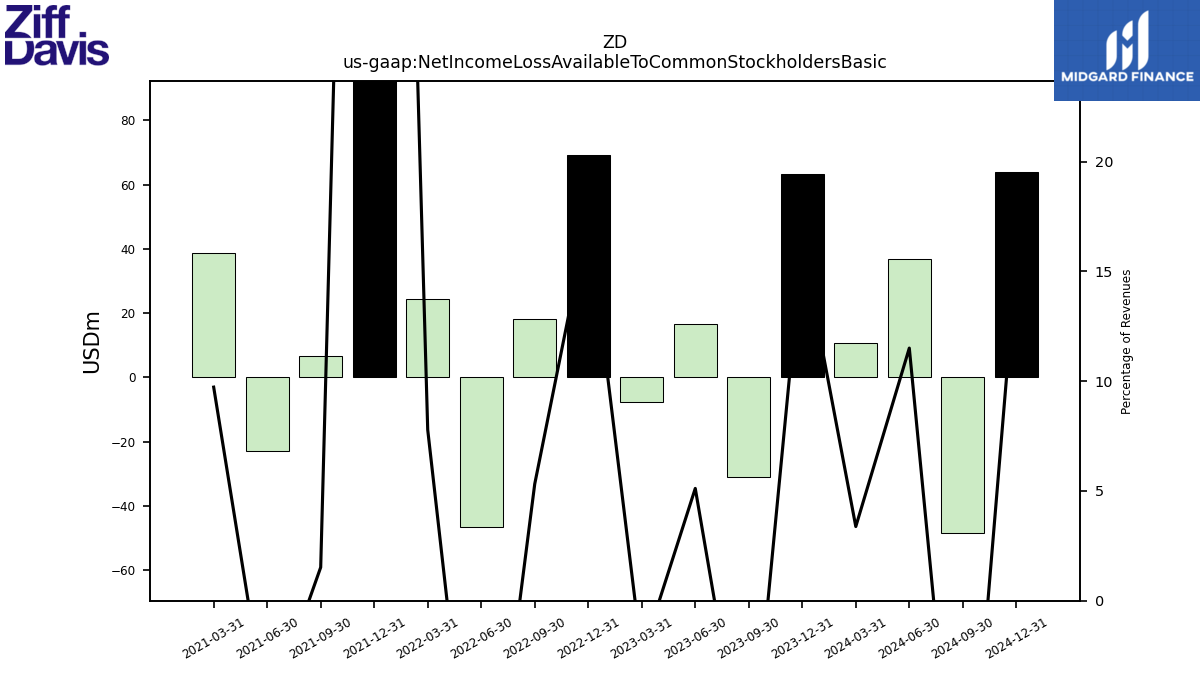
| Net Income Loss Available To Common Stockholders Basic | 63.42 | -30.97 | 16.68 | -7.63 | 69.16 | 18.18 | -46.44 | 24.53 | 378.59 | 6.76 | -23.05 | 38.74 | NA | NA | NA | NA | NA | NA | NA | NA | NA | NA | NA | NA | NA | NA | NA | NA | NA | NA | NA | NA | NA | NA | NA | NA | NA | NA | NA | NA | NA | NA | NA | NA | NA | NA | NA | NA | NA | NA | NA | NA | NA | NA | NA | NA | |
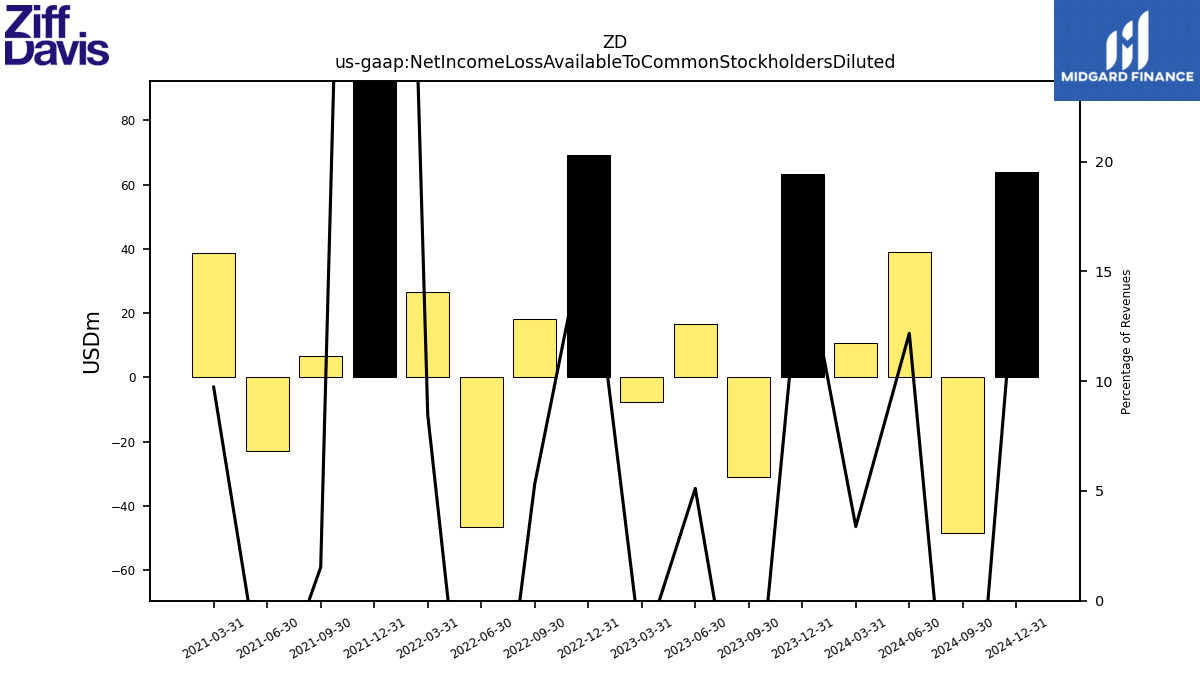
| Net Income Loss Available To Common Stockholders Diluted | 63.42 | -30.97 | 16.68 | -7.63 | 69.16 | 18.18 | -46.44 | 26.71 | 378.59 | 6.76 | -23.05 | 38.74 | NA | NA | NA | NA | NA | NA | NA | NA | NA | NA | NA | NA | NA | NA | NA | NA | NA | NA | NA | NA | NA | NA | NA | NA | NA | NA | NA | NA | NA | NA | NA | NA | NA | NA | NA | NA | NA | NA | NA | NA | NA | NA | NA | NA | |
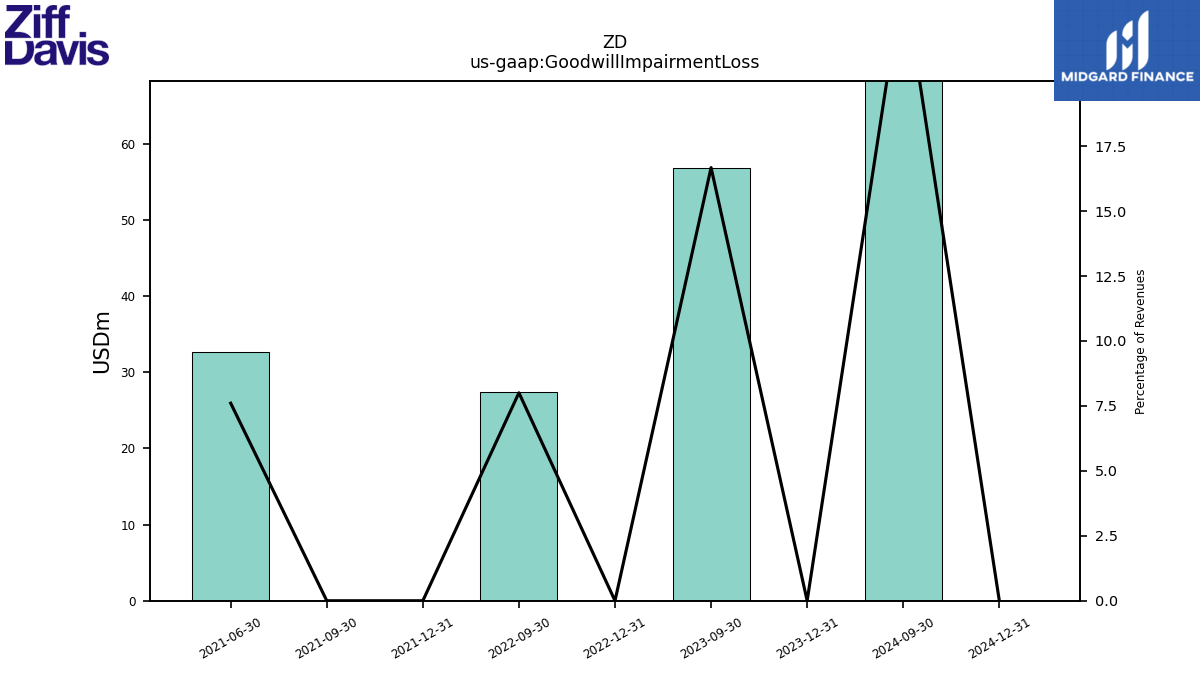
| Goodwill Impairment Loss | 0.00 | 56.85 | NA | NA | 0.00 | 27.37 | NA | NA | 0.00 | 0.00 | 32.63 | NA | NA | NA | NA | NA | NA | NA | NA | NA | NA | NA | NA | NA | NA | NA | NA | NA | NA | NA | NA | NA | NA | NA | NA | NA | NA | NA | NA | NA | NA | NA | NA | NA | NA | NA | NA | NA | NA | NA | NA | NA | NA | NA | NA | NA |
| 2023-12-31 | 2023-09-30 | 2023-06-30 | 2023-03-31 | 2022-12-31 | 2022-09-30 | 2022-06-30 | 2022-03-31 | 2021-12-31 | 2021-09-30 | 2021-06-30 | 2021-03-31 | 2020-12-31 | 2020-09-30 | 2020-06-30 | 2020-03-31 | 2019-12-31 | 2019-09-30 | 2019-06-30 | 2019-03-31 | 2018-12-31 | 2018-09-30 | 2018-06-30 | 2018-03-31 | 2017-12-31 | 2017-09-30 | 2017-06-30 | 2017-03-31 | 2016-12-31 | 2016-09-30 | 2016-06-30 | 2016-03-31 | 2015-12-31 | 2015-09-30 | 2015-06-30 | 2015-03-31 | 2014-12-31 | 2014-09-30 | 2014-06-30 | 2014-03-31 | 2013-12-31 | 2013-09-30 | 2013-06-30 | 2013-03-31 | 2012-12-31 | 2012-09-30 | 2012-06-30 | 2012-03-31 | 2011-12-31 | 2011-09-30 | 2011-06-30 | 2011-03-31 | 2010-12-31 | 2010-09-30 | 2010-06-30 | 2010-03-31 | ||
|---|---|---|---|---|---|---|---|---|---|---|---|---|---|---|---|---|---|---|---|---|---|---|---|---|---|---|---|---|---|---|---|---|---|---|---|---|---|---|---|---|---|---|---|---|---|---|---|---|---|---|---|---|---|---|---|---|---|
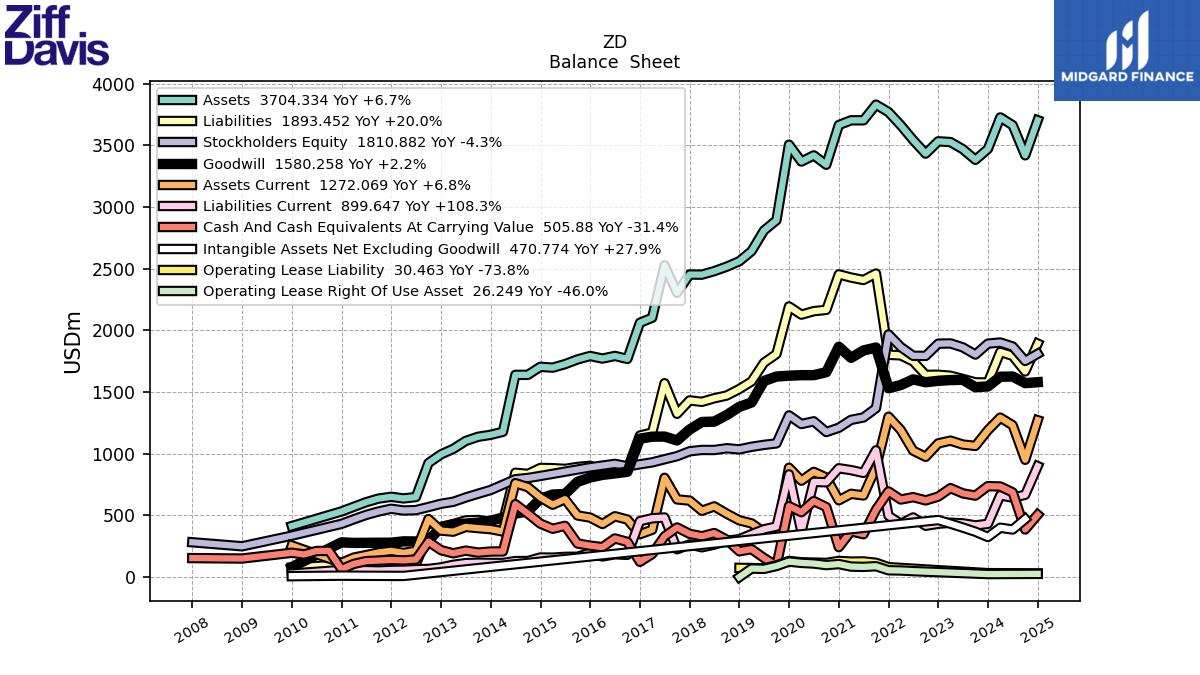
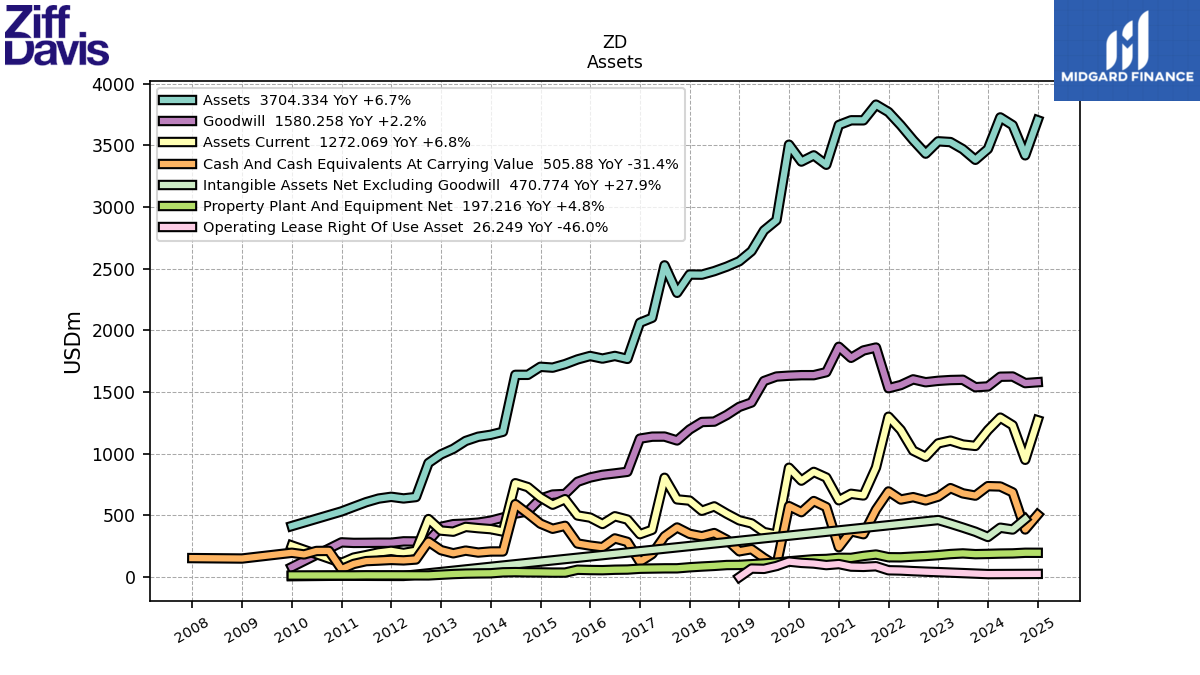
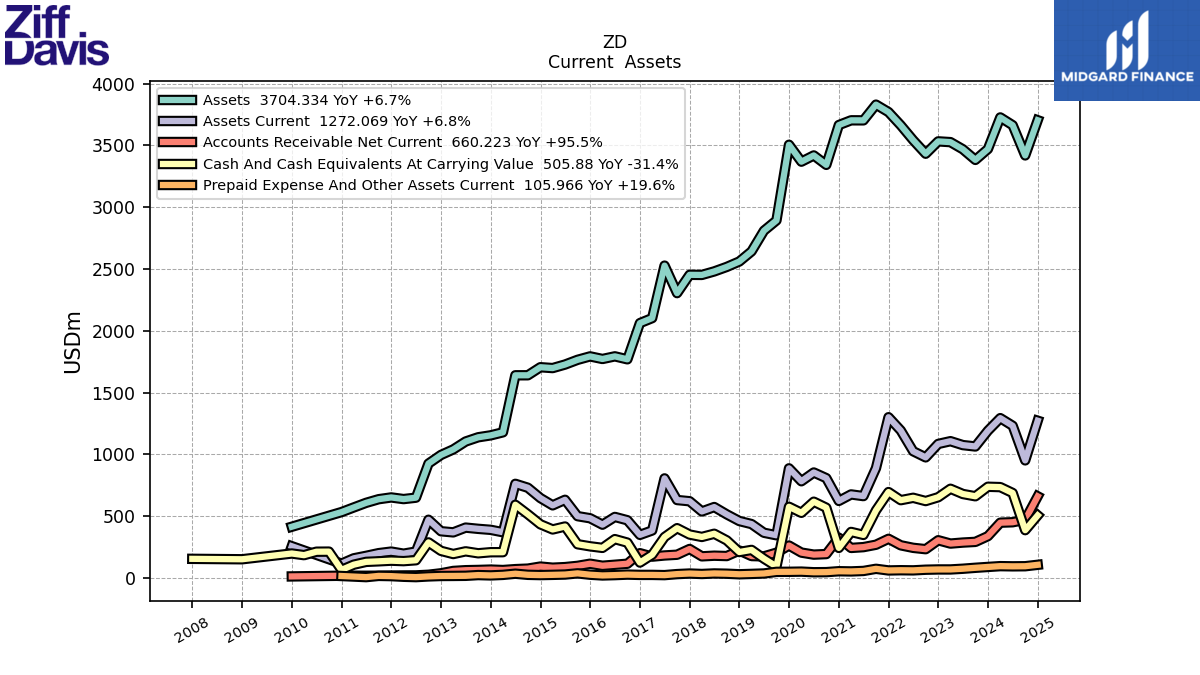
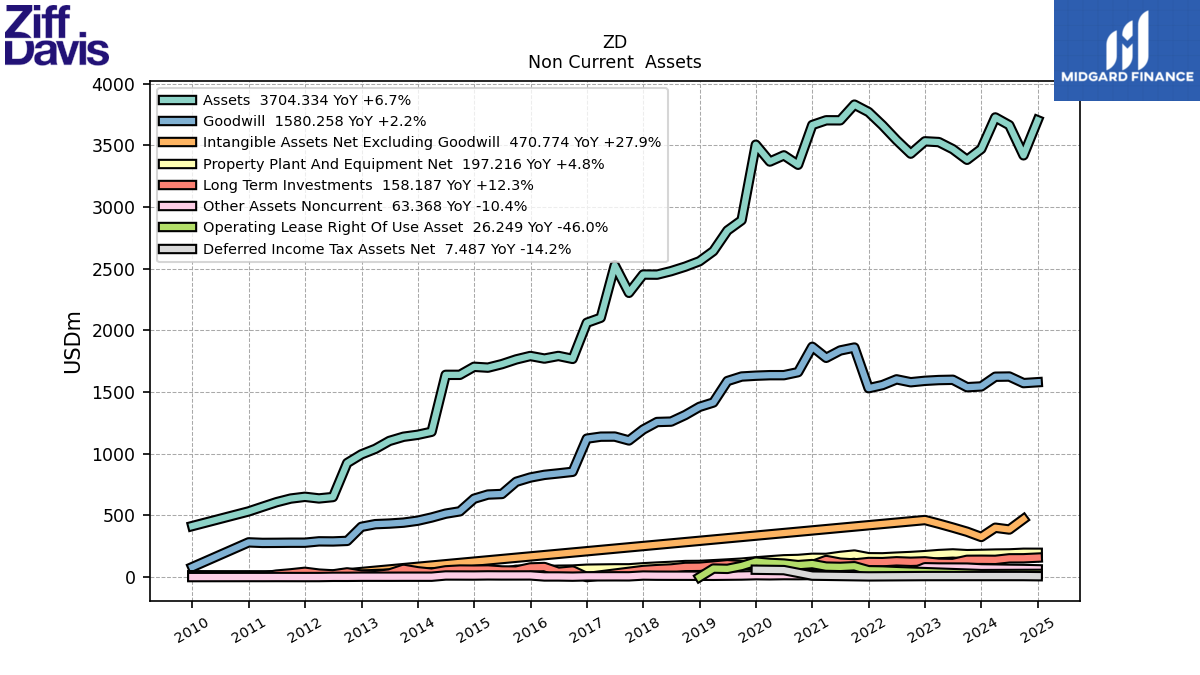
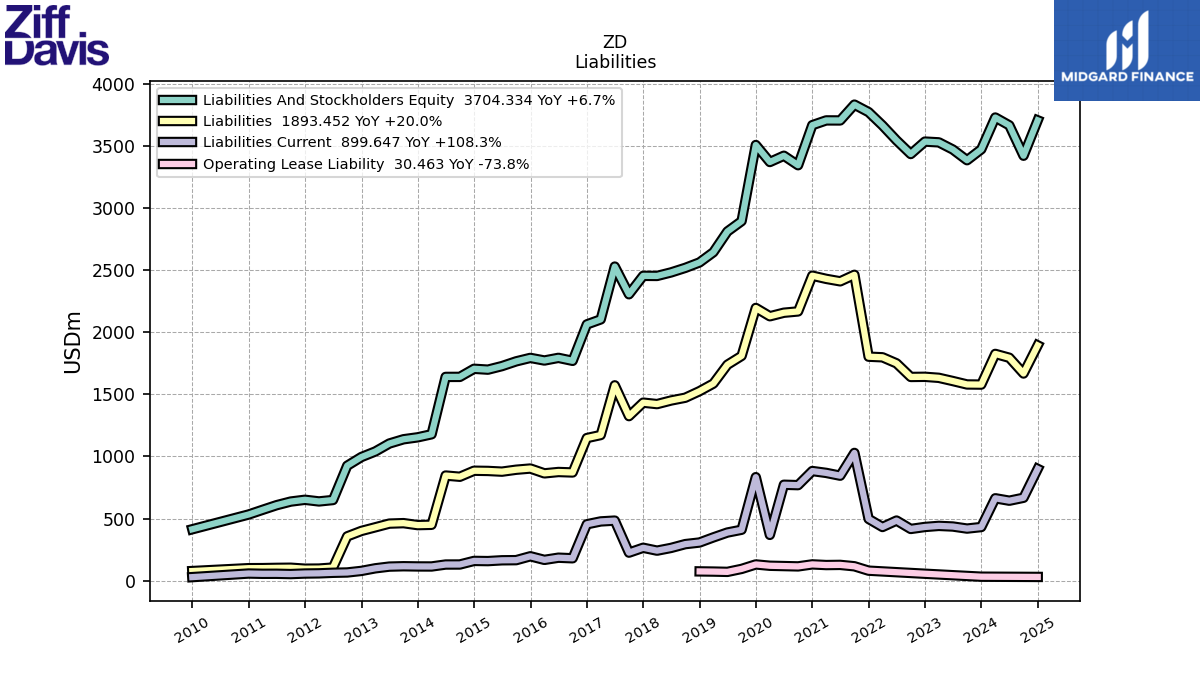
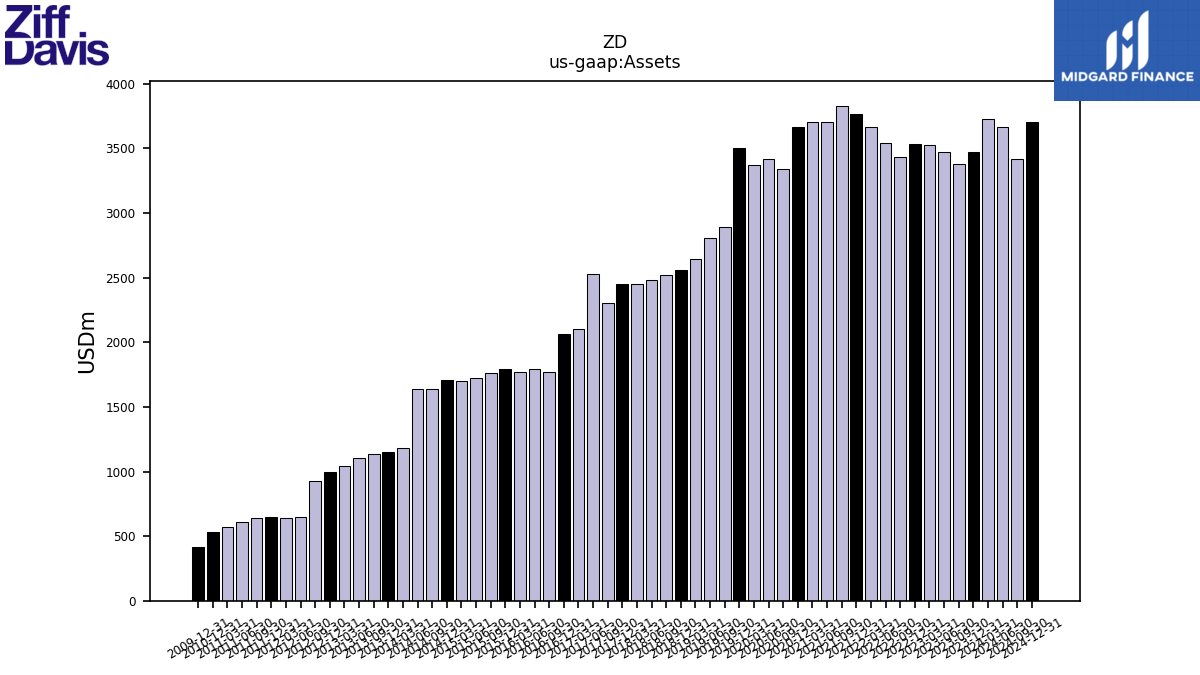
| Assets | 3471.02 | 3383.23 | 3469.29 | 3527.07 | 3533.27 | 3433.07 | 3543.09 | 3663.17 | 3770.28 | 3830.66 | 3703.37 | 3703.66 | 3665.33 | 3342.99 | 3419.45 | 3368.89 | 3505.85 | 2893.30 | 2809.93 | 2642.91 | 2560.83 | 2517.16 | 2480.66 | 2452.22 | 2453.09 | 2304.69 | 2527.66 | 2102.55 | 2062.33 | 1769.14 | 1793.15 | 1771.83 | 1792.87 | 1765.00 | 1726.81 | 1698.24 | 1705.20 | 1640.00 | 1639.82 | 1178.28 | 1153.79 | 1138.09 | 1103.88 | 1039.83 | 995.17 | 925.21 | 649.28 | 637.93 | 651.17 | 636.90 | 607.54 | 570.12 | 532.62 | NA | NA | NA | |
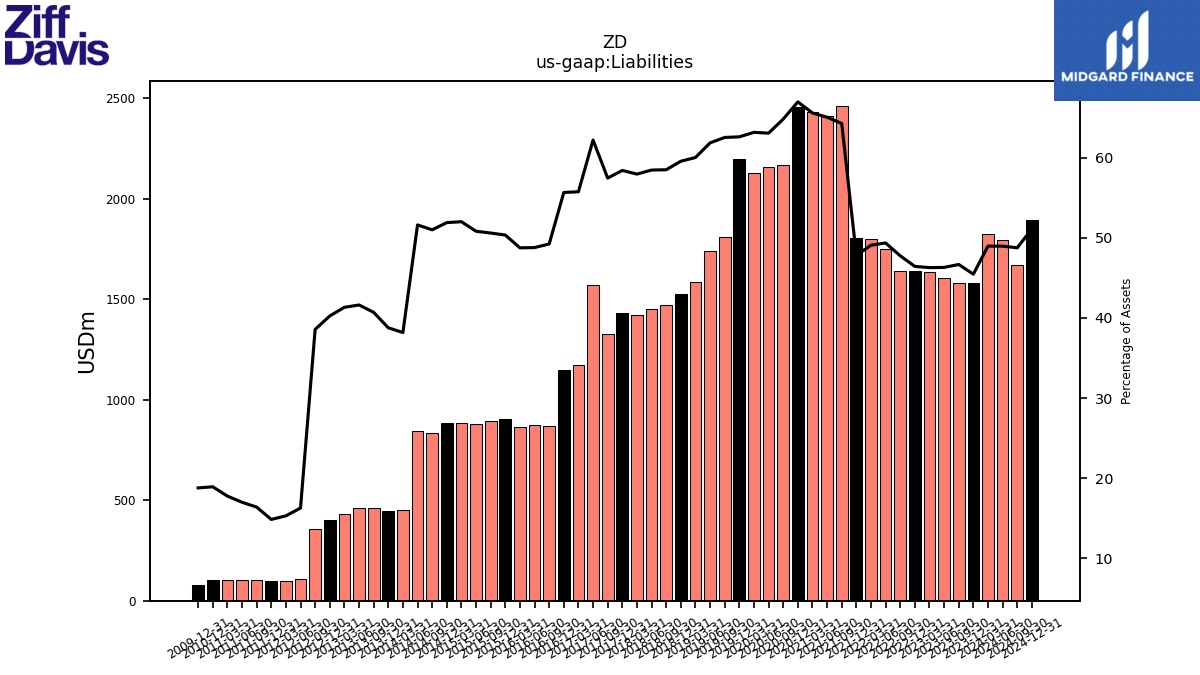
| Liabilities | 1578.02 | 1579.09 | 1606.61 | 1632.45 | 1640.66 | 1639.42 | 1748.90 | 1797.68 | 1802.55 | 2461.40 | 2408.87 | 2428.75 | 2454.31 | 2166.66 | 2156.28 | 2127.81 | 2194.65 | 1808.93 | 1737.83 | 1586.26 | 1525.09 | 1472.34 | 1450.05 | 1421.05 | 1432.79 | 1324.15 | 1572.10 | 1172.13 | 1147.79 | 870.95 | 874.76 | 863.79 | 902.66 | 893.03 | 877.61 | 883.28 | 884.97 | 836.44 | 846.23 | 449.92 | 447.37 | 463.25 | 459.48 | 429.77 | 400.57 | 356.87 | 105.77 | 97.70 | 96.80 | 104.51 | 103.34 | 101.37 | 100.88 | NA | NA | NA | |
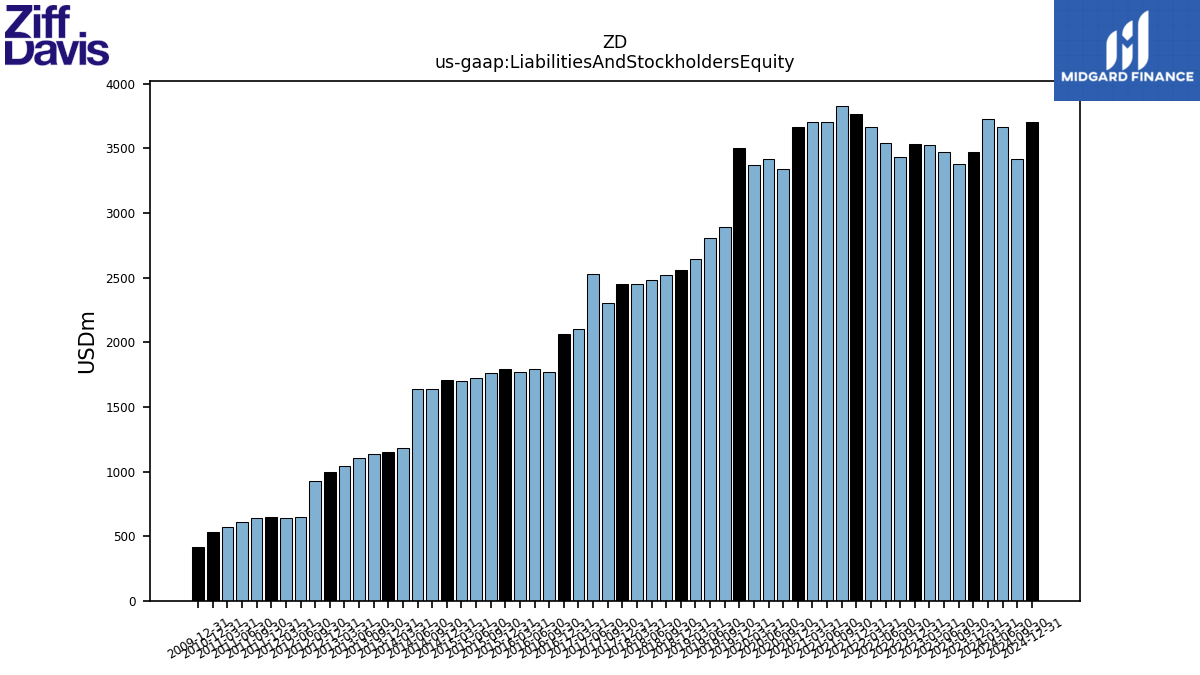
| Liabilities And Stockholders Equity | 3471.02 | 3383.23 | 3469.29 | 3527.07 | 3533.27 | 3433.07 | 3543.09 | 3663.17 | 3770.28 | 3830.66 | 3703.37 | 3703.66 | 3665.33 | 3342.99 | 3419.45 | 3368.89 | 3505.85 | 2893.30 | 2809.93 | 2642.91 | 2560.83 | 2517.16 | 2480.66 | 2452.22 | 2453.09 | 2304.69 | 2527.66 | 2102.55 | 2062.33 | 1769.14 | 1793.15 | 1771.83 | 1792.87 | 1765.00 | 1726.81 | 1698.24 | 1705.20 | 1640.00 | 1639.82 | 1178.28 | 1153.79 | 1138.09 | 1103.88 | 1039.83 | 995.17 | 925.21 | 649.28 | 637.93 | 651.17 | 636.90 | 607.54 | 570.12 | 532.62 | NA | NA | NA | |
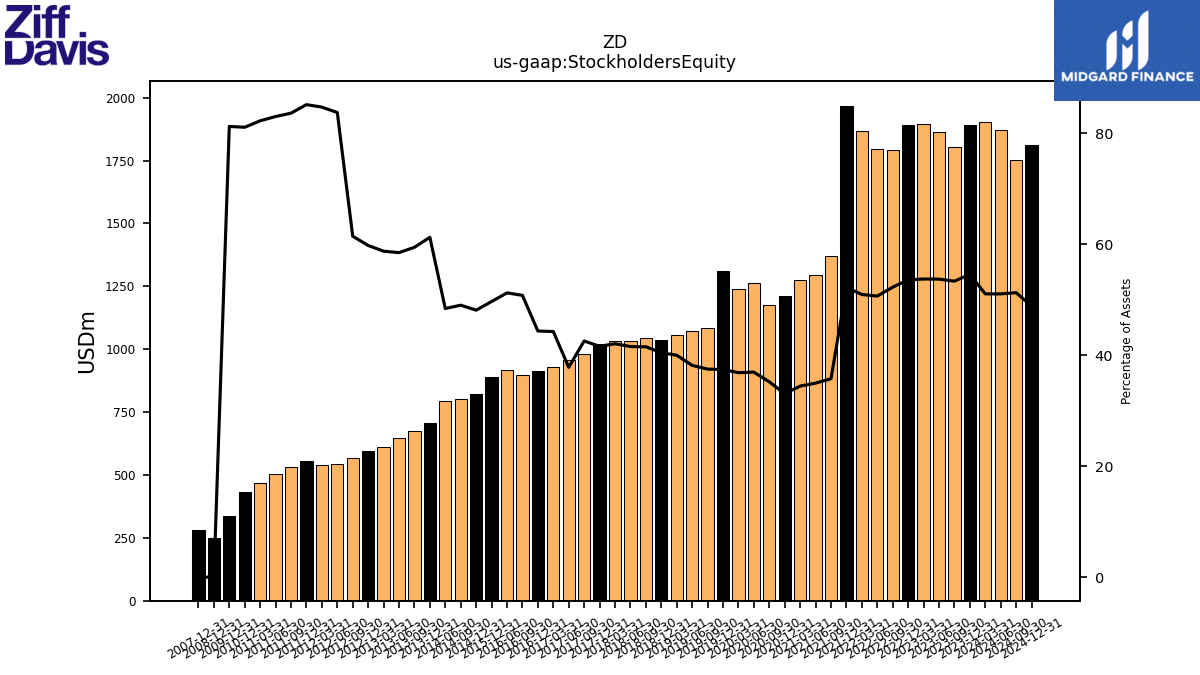
| Stockholders Equity | 1893.00 | 1804.14 | 1862.68 | 1894.62 | 1892.61 | 1793.64 | 1794.20 | 1865.49 | 1967.73 | 1369.26 | 1294.50 | 1274.91 | 1211.02 | 1176.34 | 1263.17 | 1241.08 | 1311.19 | 1084.37 | 1072.10 | 1056.65 | 1035.74 | 1044.82 | 1030.61 | 1031.17 | 1020.30 | 980.54 | 955.56 | 930.43 | 914.54 | 898.19 | 918.39 | NA | 890.21 | NA | NA | NA | 820.24 | 803.56 | 793.59 | NA | 706.42 | 676.37 | 645.41 | 610.64 | 594.70 | 568.33 | 543.51 | 540.24 | 554.38 | 532.40 | 504.20 | 468.75 | 431.75 | NA | NA | NA |
| 2023-12-31 | 2023-09-30 | 2023-06-30 | 2023-03-31 | 2022-12-31 | 2022-09-30 | 2022-06-30 | 2022-03-31 | 2021-12-31 | 2021-09-30 | 2021-06-30 | 2021-03-31 | 2020-12-31 | 2020-09-30 | 2020-06-30 | 2020-03-31 | 2019-12-31 | 2019-09-30 | 2019-06-30 | 2019-03-31 | 2018-12-31 | 2018-09-30 | 2018-06-30 | 2018-03-31 | 2017-12-31 | 2017-09-30 | 2017-06-30 | 2017-03-31 | 2016-12-31 | 2016-09-30 | 2016-06-30 | 2016-03-31 | 2015-12-31 | 2015-09-30 | 2015-06-30 | 2015-03-31 | 2014-12-31 | 2014-09-30 | 2014-06-30 | 2014-03-31 | 2013-12-31 | 2013-09-30 | 2013-06-30 | 2013-03-31 | 2012-12-31 | 2012-09-30 | 2012-06-30 | 2012-03-31 | 2011-12-31 | 2011-09-30 | 2011-06-30 | 2011-03-31 | 2010-12-31 | 2010-09-30 | 2010-06-30 | 2010-03-31 | ||
|---|---|---|---|---|---|---|---|---|---|---|---|---|---|---|---|---|---|---|---|---|---|---|---|---|---|---|---|---|---|---|---|---|---|---|---|---|---|---|---|---|---|---|---|---|---|---|---|---|---|---|---|---|---|---|---|---|---|
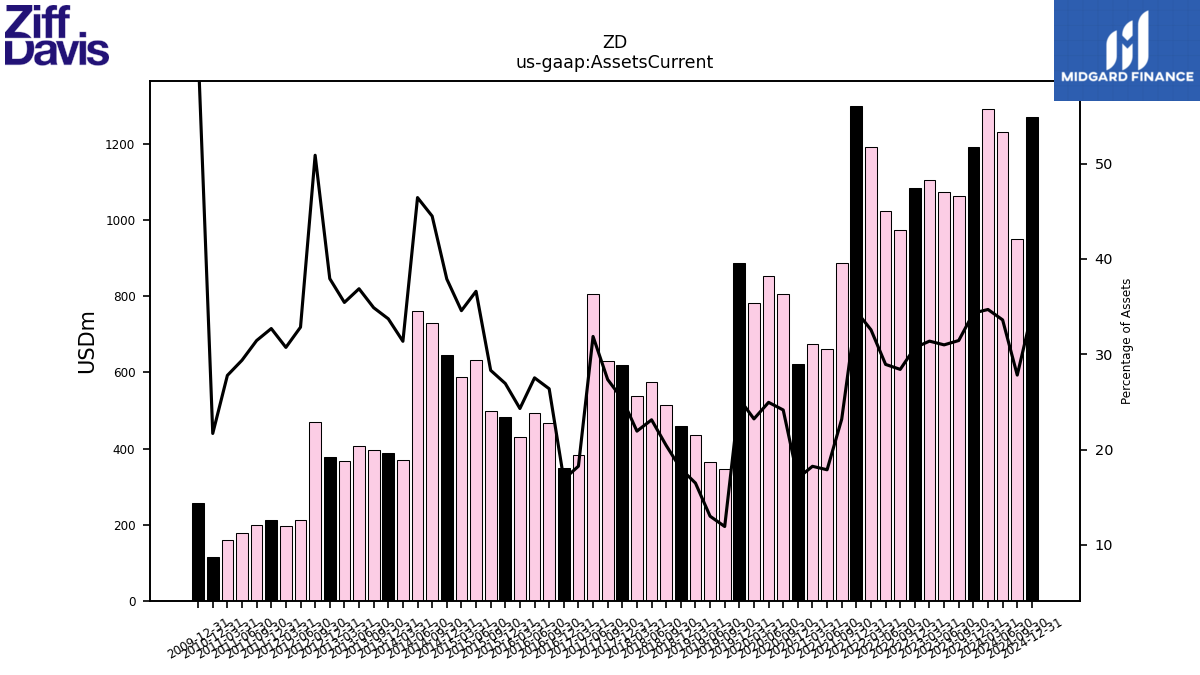
| Assets Current | 1190.99 | 1063.66 | 1074.86 | 1106.58 | 1084.27 | 975.30 | 1025.08 | 1192.93 | 1300.67 | 888.27 | 661.98 | 675.50 | 622.84 | 807.32 | 853.14 | 782.10 | 886.89 | 344.91 | 365.33 | 435.56 | 460.33 | 514.15 | 573.49 | 537.77 | 620.43 | 630.21 | 805.46 | 383.71 | 348.00 | 466.62 | 493.51 | 430.61 | 482.81 | 499.68 | 632.09 | 587.11 | 646.18 | 729.70 | 761.47 | 369.49 | 389.02 | 397.01 | 407.02 | 368.46 | 377.50 | 470.76 | 213.22 | 195.96 | 212.90 | 200.22 | 178.44 | 158.36 | 115.50 | NA | NA | NA | |
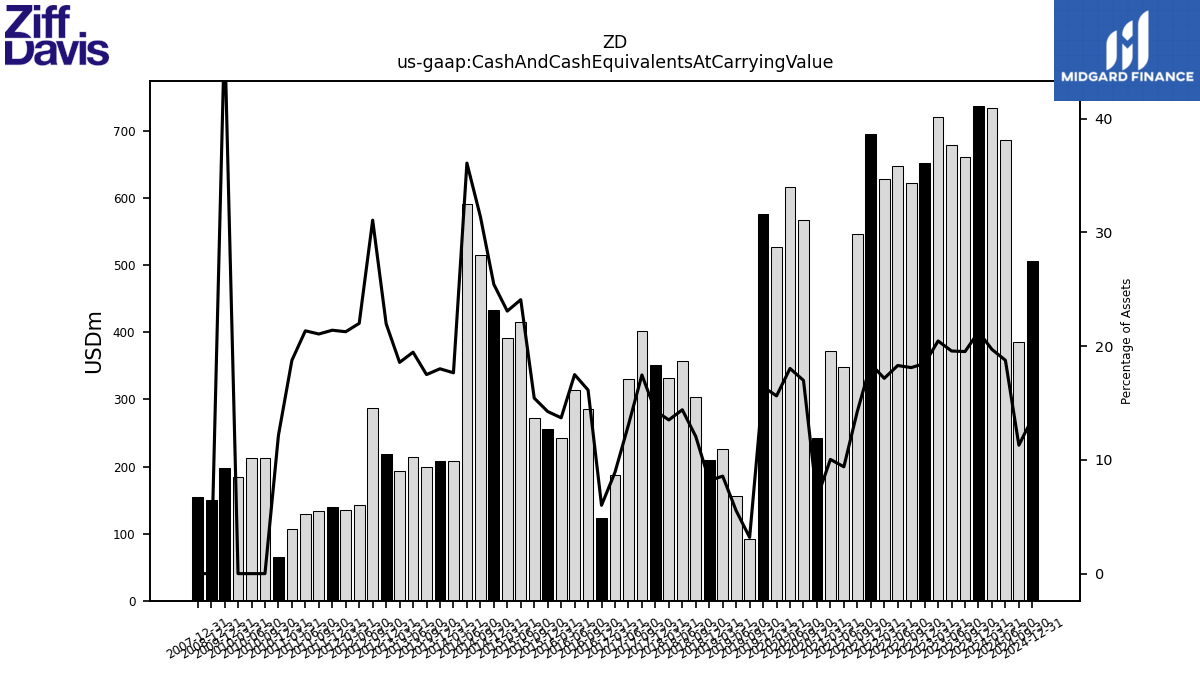
| Cash And Cash Equivalents At Carrying Value | 737.61 | 660.62 | 679.09 | 721.50 | 652.79 | 621.92 | 648.29 | 629.03 | 694.84 | 546.47 | 347.86 | 371.97 | 242.65 | 567.93 | 616.82 | 526.55 | 575.62 | 92.19 | 155.48 | 226.61 | 209.47 | 303.52 | 357.37 | 331.37 | 350.94 | 402.54 | 330.74 | 187.41 | 123.95 | 285.56 | 313.75 | 242.75 | 255.53 | 272.37 | 415.93 | 392.02 | 433.66 | 515.00 | 591.88 | 208.07 | 207.80 | 199.18 | 214.93 | 193.13 | 218.68 | 287.51 | 142.87 | 135.68 | 139.36 | 134.19 | 129.71 | 106.92 | 64.75 | 212.70 | 211.99 | 184.01 | |
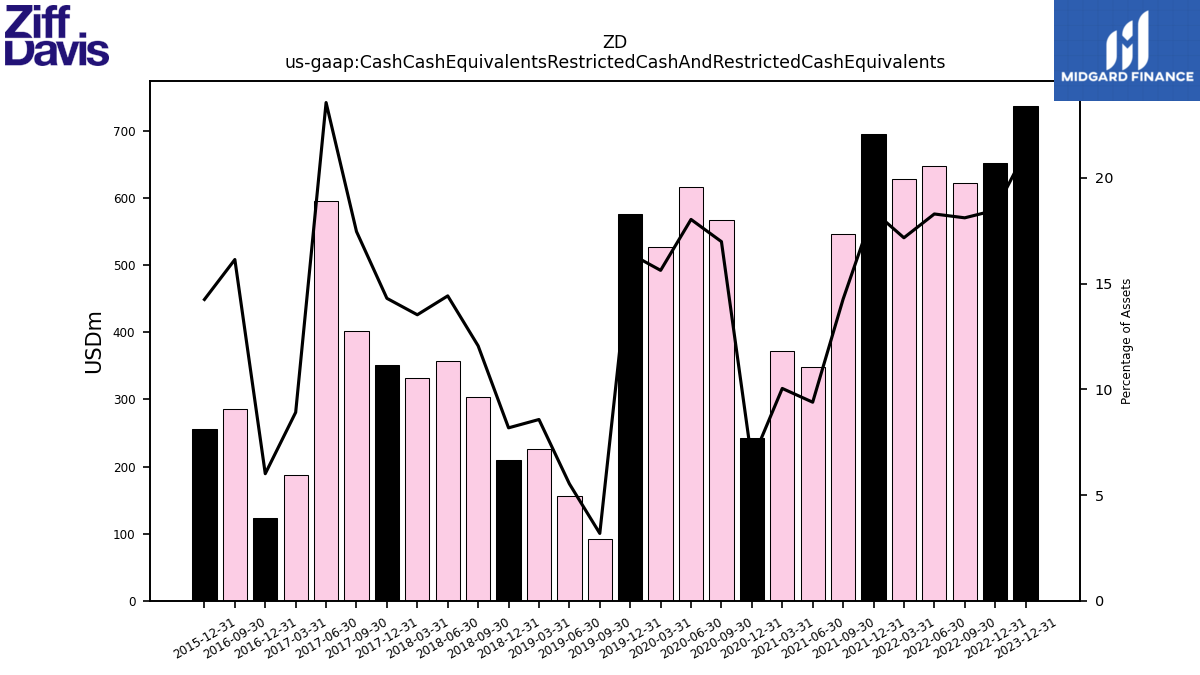
| Cash Cash Equivalents Restricted Cash And Restricted Cash Equivalents | 737.61 | NA | NA | NA | 652.79 | 621.92 | 648.29 | 629.03 | 694.84 | 546.47 | 347.86 | 371.97 | 242.65 | 567.93 | 616.82 | 526.55 | 575.62 | 92.19 | 155.48 | 226.61 | 209.47 | 303.52 | 357.77 | 331.77 | 350.94 | 402.54 | 595.74 | 187.41 | 123.95 | 285.56 | NA | NA | 255.53 | NA | NA | NA | NA | NA | NA | NA | NA | NA | NA | NA | NA | NA | NA | NA | NA | NA | NA | NA | NA | NA | NA | NA | |
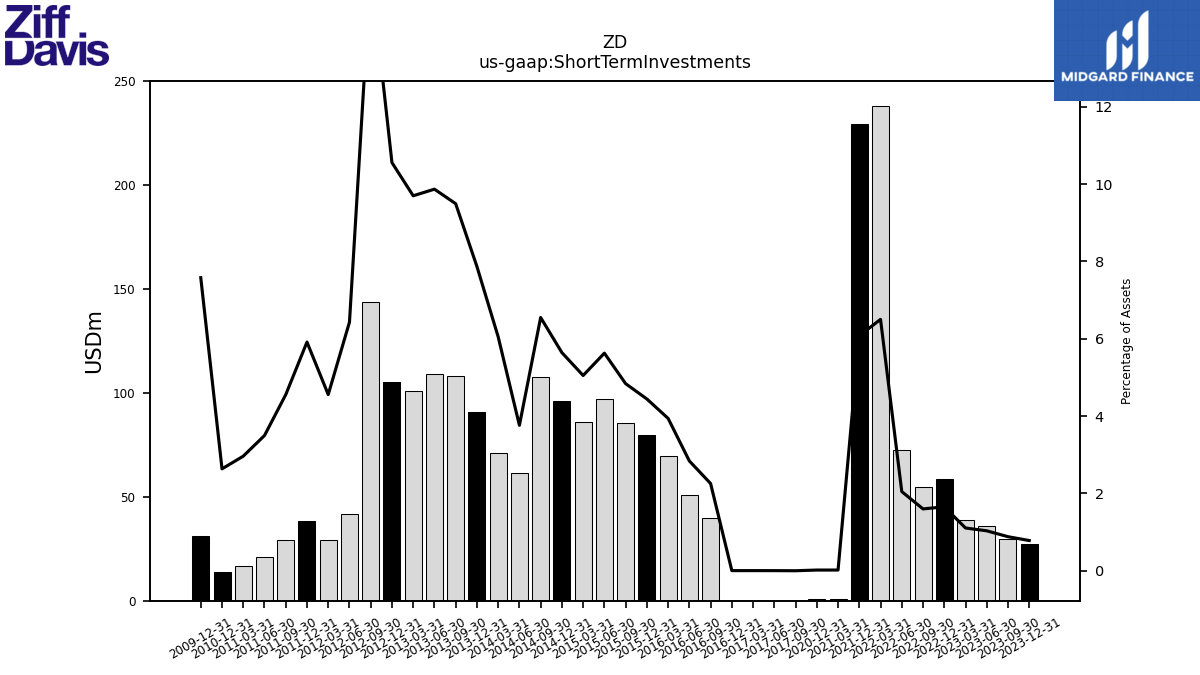
| Short Term Investments | 27.11 | 29.80 | 35.82 | 39.01 | 58.42 | 54.90 | 72.53 | 238.15 | 229.20 | NA | NA | 0.66 | 0.66 | NA | NA | NA | NA | NA | NA | NA | NA | NA | NA | NA | NA | 0.00 | 0.07 | 0.07 | 0.06 | 39.91 | 50.91 | 69.82 | 79.66 | 85.41 | 97.19 | 85.76 | 96.21 | 107.42 | 61.69 | 71.30 | 90.79 | 108.04 | 108.95 | 100.85 | 105.05 | 143.63 | 41.74 | 29.07 | 38.51 | 29.00 | 21.25 | 16.89 | 14.04 | NA | NA | NA | |
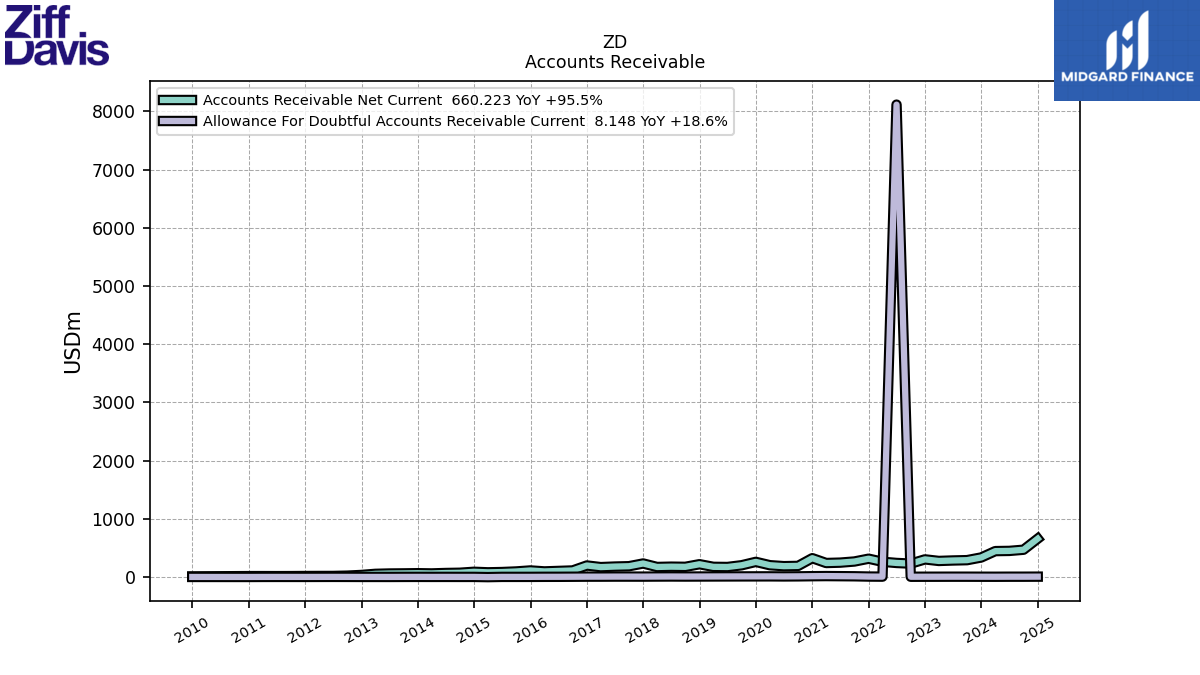
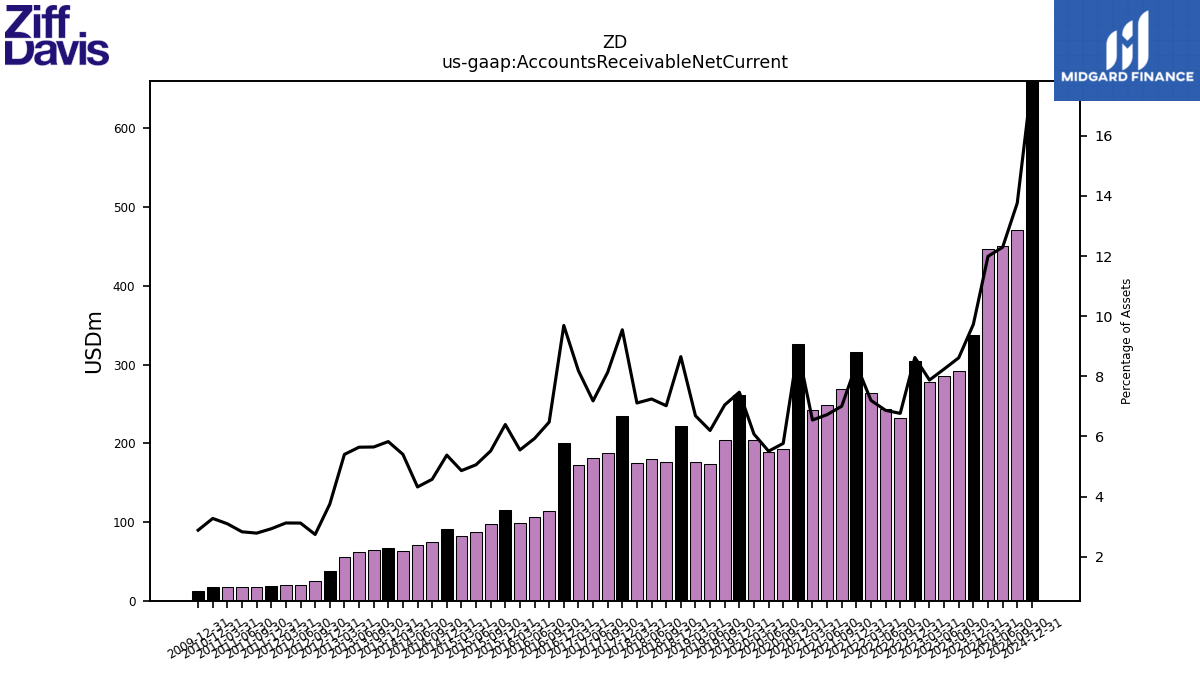
| Accounts Receivable Net Current | 337.70 | 291.49 | 285.91 | 277.76 | 304.74 | 232.30 | 243.30 | 263.66 | 316.34 | 268.35 | 249.00 | 242.42 | 325.62 | 192.80 | 188.38 | 204.78 | 261.93 | 203.87 | 174.14 | 176.74 | 221.62 | 176.76 | 179.72 | 174.41 | 234.19 | 187.48 | 181.53 | 172.06 | 199.87 | 114.58 | 106.36 | 98.33 | 114.68 | 97.38 | 87.32 | 82.57 | 91.70 | 75.02 | 70.83 | 63.67 | 67.25 | 64.28 | 62.27 | 56.16 | 37.28 | 25.33 | 20.24 | 19.91 | 19.07 | 17.72 | 17.18 | 17.64 | 17.42 | NA | NA | NA | |
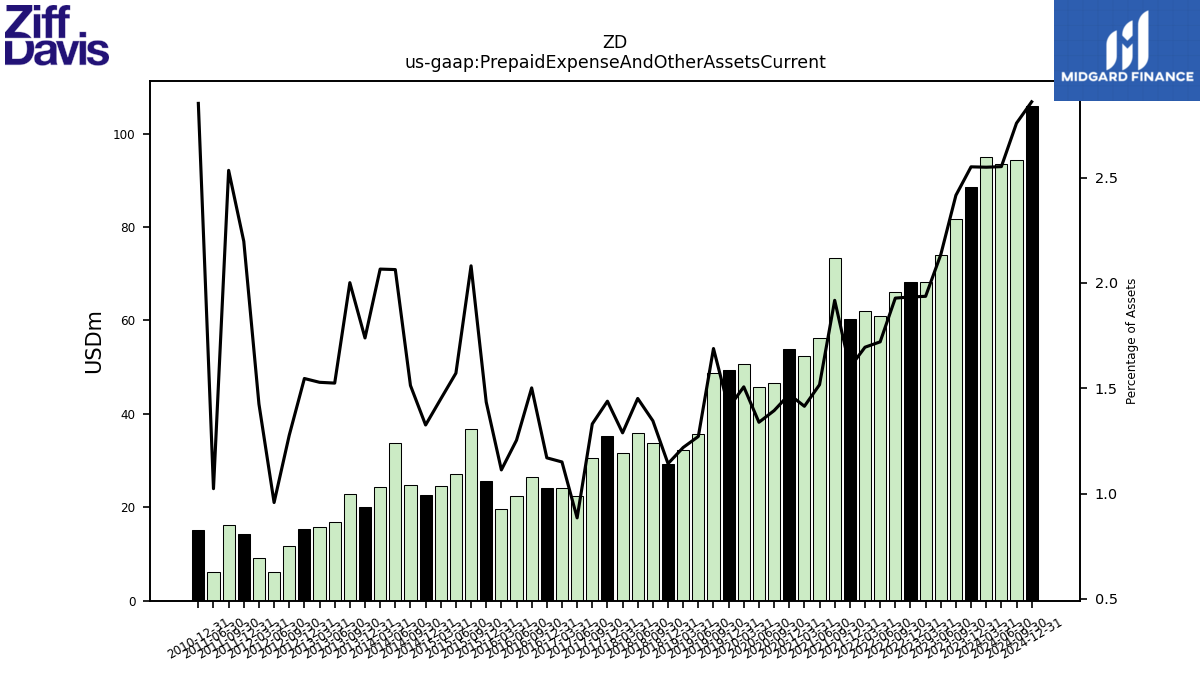
| Prepaid Expense And Other Assets Current | 88.57 | 81.76 | 74.04 | 68.31 | 68.32 | 66.19 | 60.96 | 62.09 | 60.29 | 73.46 | 56.18 | 52.39 | 53.91 | 46.59 | 45.77 | 50.76 | 49.35 | 48.86 | 35.72 | 32.21 | 29.24 | 33.86 | 36.01 | 31.59 | 35.29 | 30.66 | 22.35 | 24.18 | 24.12 | 26.57 | 22.47 | 19.71 | 25.72 | 36.74 | 27.14 | 24.61 | 22.60 | 24.82 | 33.84 | 24.34 | 20.06 | 22.78 | 16.83 | 15.89 | 15.39 | 11.81 | 6.21 | 9.09 | 14.31 | 16.14 | 6.21 | NA | 15.20 | NA | NA | NA |
| 2023-12-31 | 2023-09-30 | 2023-06-30 | 2023-03-31 | 2022-12-31 | 2022-09-30 | 2022-06-30 | 2022-03-31 | 2021-12-31 | 2021-09-30 | 2021-06-30 | 2021-03-31 | 2020-12-31 | 2020-09-30 | 2020-06-30 | 2020-03-31 | 2019-12-31 | 2019-09-30 | 2019-06-30 | 2019-03-31 | 2018-12-31 | 2018-09-30 | 2018-06-30 | 2018-03-31 | 2017-12-31 | 2017-09-30 | 2017-06-30 | 2017-03-31 | 2016-12-31 | 2016-09-30 | 2016-06-30 | 2016-03-31 | 2015-12-31 | 2015-09-30 | 2015-06-30 | 2015-03-31 | 2014-12-31 | 2014-09-30 | 2014-06-30 | 2014-03-31 | 2013-12-31 | 2013-09-30 | 2013-06-30 | 2013-03-31 | 2012-12-31 | 2012-09-30 | 2012-06-30 | 2012-03-31 | 2011-12-31 | 2011-09-30 | 2011-06-30 | 2011-03-31 | 2010-12-31 | 2010-09-30 | 2010-06-30 | 2010-03-31 | ||
|---|---|---|---|---|---|---|---|---|---|---|---|---|---|---|---|---|---|---|---|---|---|---|---|---|---|---|---|---|---|---|---|---|---|---|---|---|---|---|---|---|---|---|---|---|---|---|---|---|---|---|---|---|---|---|---|---|---|
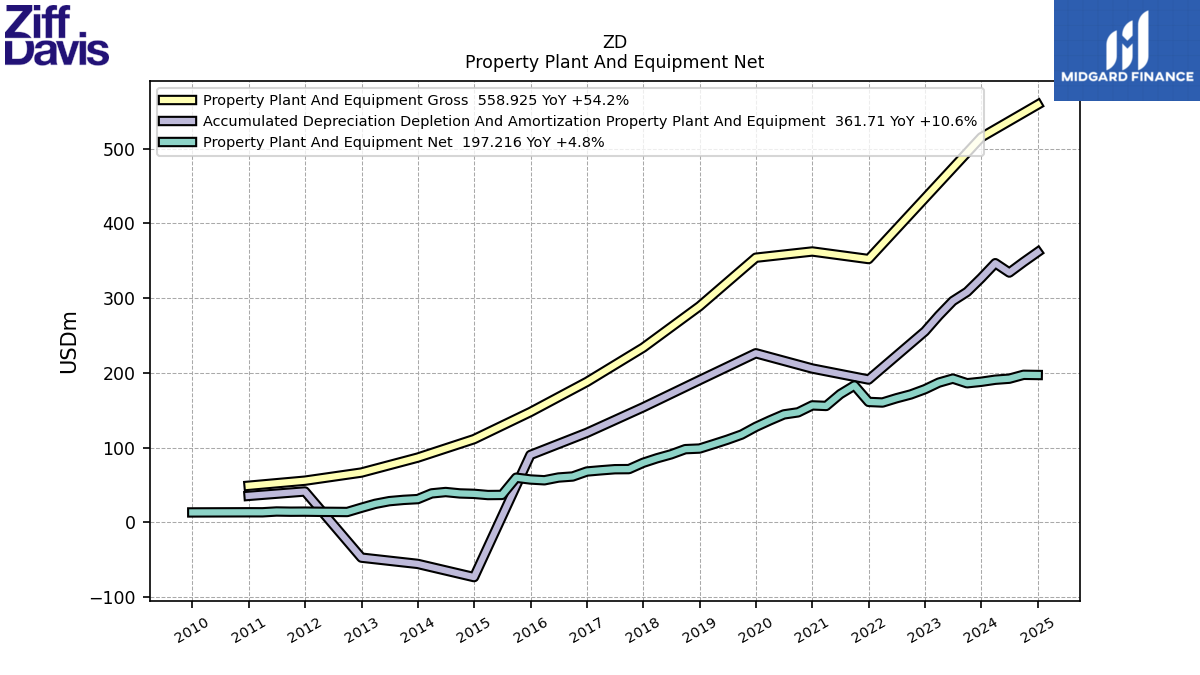
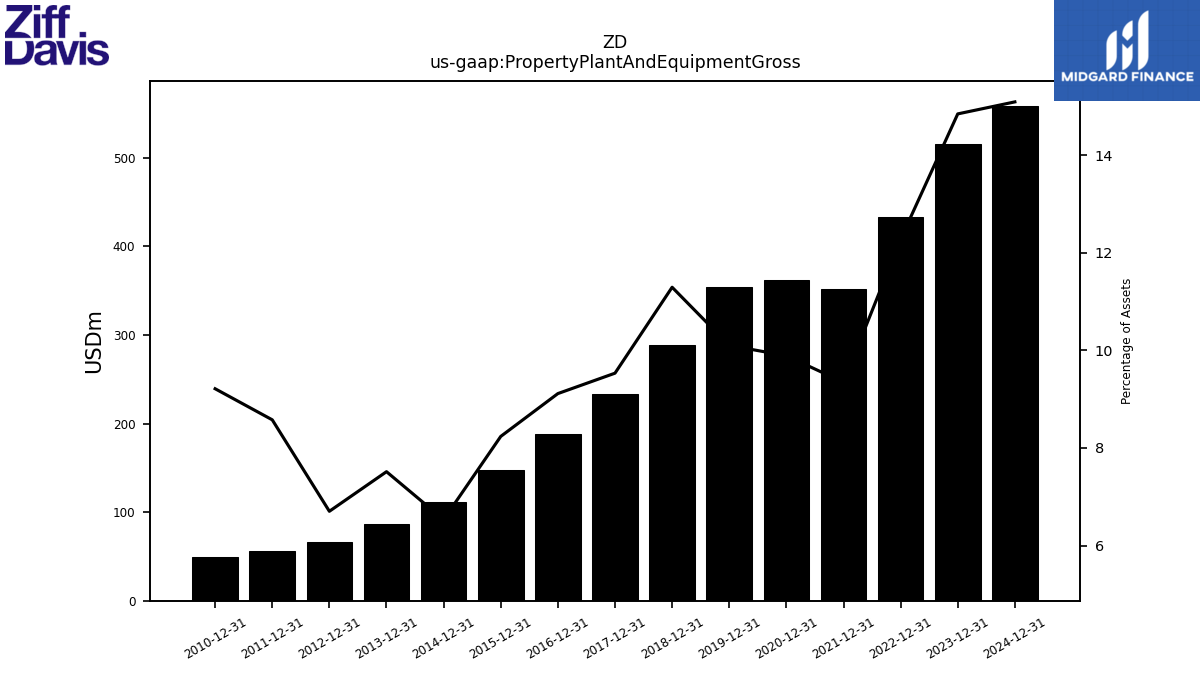
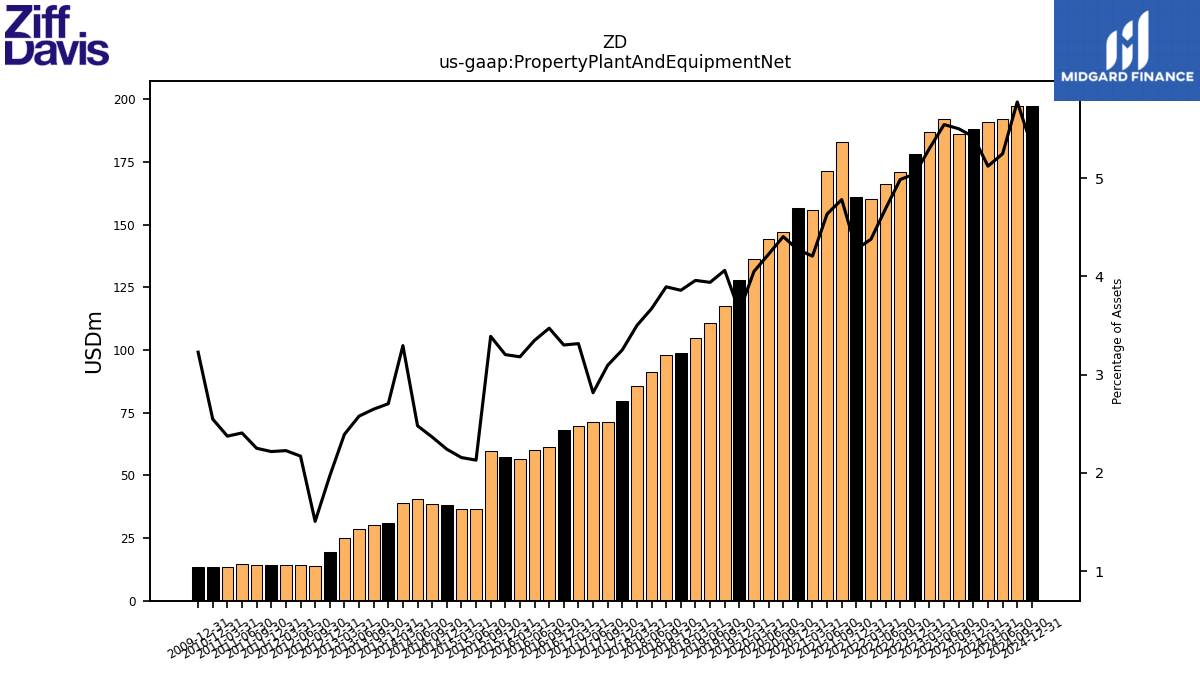
| Property Plant And Equipment Gross | 515.18 | NA | NA | NA | 433.77 | NA | NA | NA | 352.32 | NA | NA | NA | 362.47 | NA | NA | NA | 354.12 | NA | NA | NA | 289.16 | NA | NA | NA | 233.83 | NA | NA | NA | 187.96 | NA | NA | NA | 147.67 | NA | NA | NA | 111.40 | NA | NA | NA | 86.70 | NA | NA | NA | 66.71 | NA | NA | NA | 55.85 | NA | NA | NA | 49.07 | NA | NA | NA | |
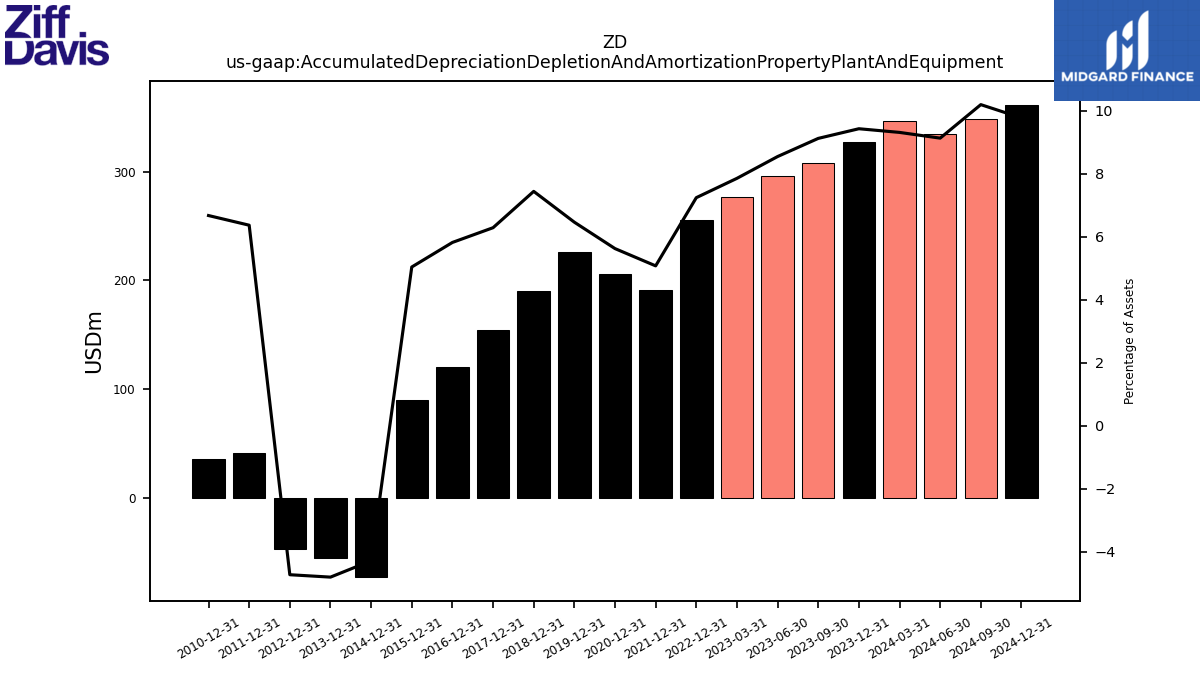
| Accumulated Depreciation Depletion And Amortization Property Plant And Equipment | 327.01 | 308.37 | 296.22 | 276.76 | 255.59 | NA | NA | NA | 191.11 | NA | NA | NA | 205.89 | NA | NA | NA | 226.30 | NA | NA | NA | 190.35 | NA | NA | NA | 154.06 | NA | NA | NA | 119.87 | NA | NA | NA | 90.23 | NA | NA | NA | -73.18 | NA | NA | NA | -55.50 | NA | NA | NA | -47.11 | NA | NA | NA | 41.41 | NA | NA | NA | 35.51 | NA | NA | NA | |
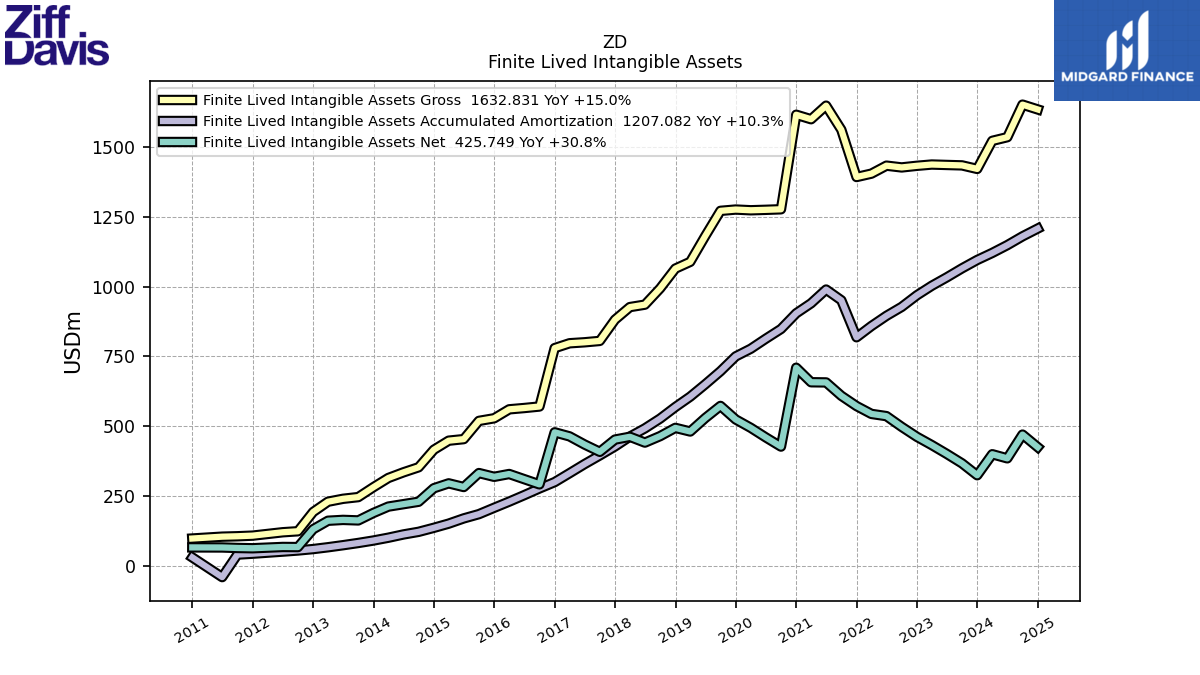
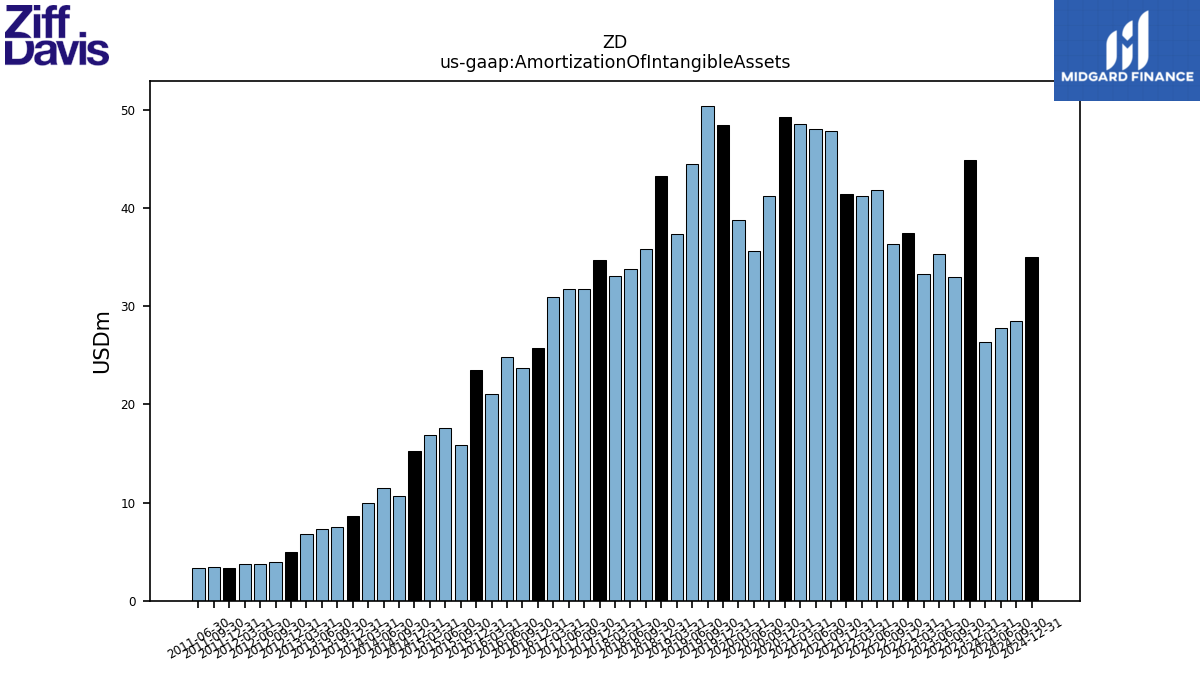
| Amortization Of Intangible Assets | 44.90 | 33.00 | 35.30 | 33.30 | 37.40 | 36.30 | 41.80 | 41.20 | 41.40 | 47.80 | 48.00 | 48.50 | 49.30 | 41.20 | 35.60 | 38.80 | 48.40 | 50.40 | 44.50 | 37.30 | 43.20 | 35.80 | 33.80 | 33.10 | 34.70 | 31.70 | 31.70 | 30.90 | 25.70 | 23.70 | 24.80 | 21.10 | 23.50 | 15.90 | 17.60 | 16.90 | 15.20 | 10.70 | 11.50 | 10.00 | 8.60 | 7.50 | 7.30 | 6.80 | 5.00 | 3.90 | 3.70 | 3.70 | 3.30 | 3.40 | 3.30 | NA | NA | NA | NA | NA | |
| Property Plant And Equipment Net | 188.17 | 186.16 | 192.38 | 187.03 | 178.18 | 171.18 | 166.15 | 160.40 | 161.21 | 183.18 | 171.65 | 155.80 | 156.58 | 147.27 | 144.49 | 136.44 | 127.82 | 117.50 | 110.70 | 104.64 | 98.81 | 98.02 | 91.08 | 85.85 | 79.77 | 71.33 | 71.17 | 69.71 | 68.09 | 61.44 | 60.05 | 56.37 | 57.44 | 59.83 | 36.78 | 36.62 | 38.22 | 38.79 | 40.66 | 38.83 | 31.20 | 30.14 | 28.45 | 24.87 | 19.60 | 13.94 | 14.10 | 14.21 | 14.44 | 14.34 | 14.62 | 13.54 | 13.57 | NA | NA | NA | |
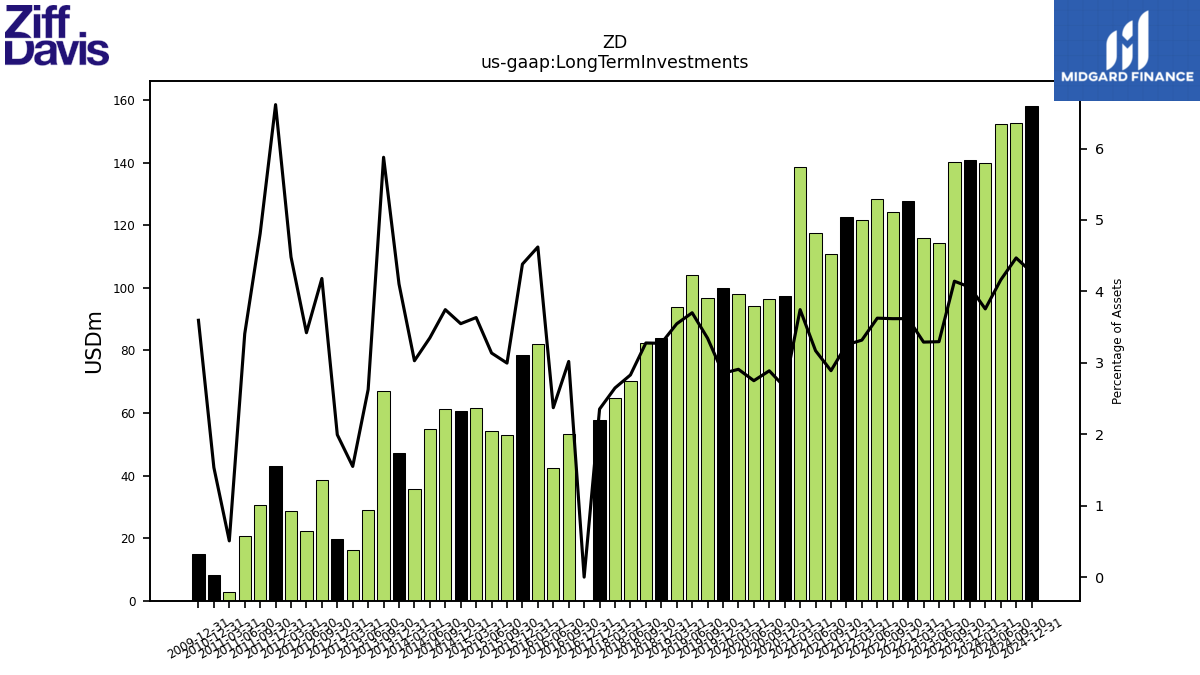
| Long Term Investments | 140.91 | 140.17 | 114.36 | 116.06 | 127.87 | 124.23 | 128.46 | 121.55 | 122.59 | 110.72 | 117.40 | 138.70 | 97.50 | 96.58 | 94.04 | 98.02 | 100.08 | 96.79 | 104.00 | 93.73 | 83.83 | 82.52 | 70.22 | 64.95 | 57.72 | NA | NA | NA | 0.00 | 53.42 | 42.54 | 81.90 | 78.56 | 52.89 | 54.18 | 61.72 | 60.51 | 61.41 | 54.93 | 35.70 | 47.35 | 66.90 | 29.00 | 16.12 | 19.84 | 38.69 | 22.22 | 28.59 | 43.08 | 30.64 | 20.69 | 2.89 | 8.18 | NA | NA | NA | |
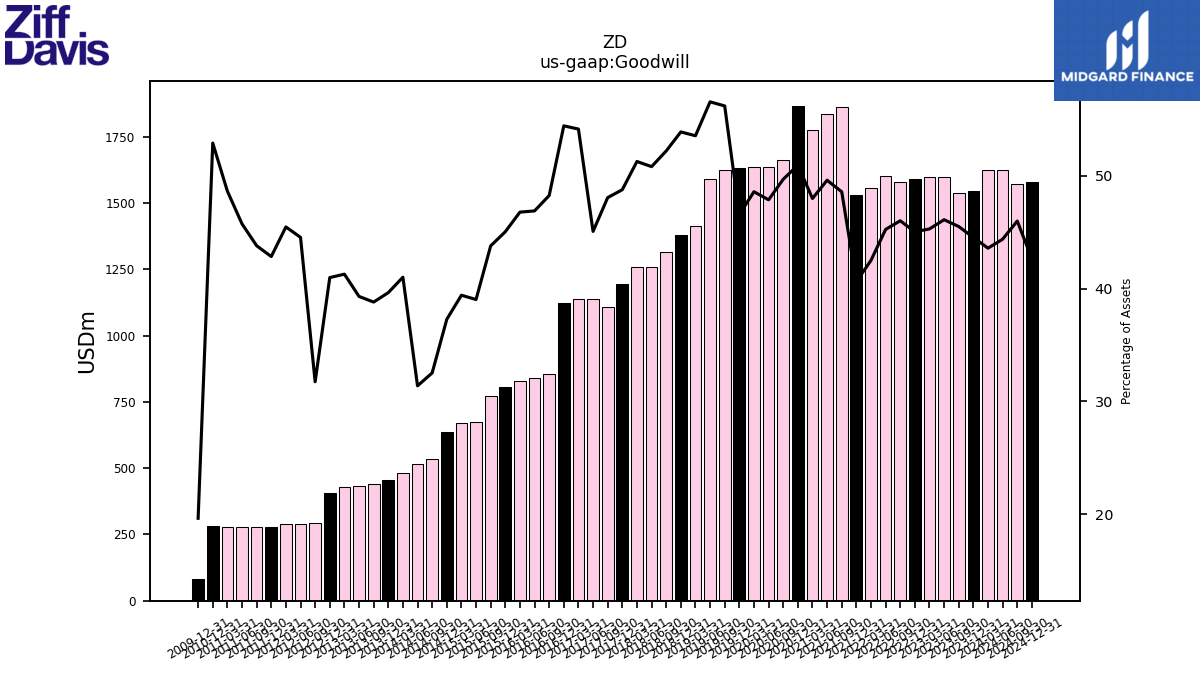
| Goodwill | 1546.07 | 1539.66 | 1599.90 | 1597.68 | 1591.47 | 1579.96 | 1603.34 | 1557.08 | 1531.45 | 1861.33 | 1837.54 | 1777.74 | 1867.43 | 1661.55 | 1637.29 | 1637.19 | 1633.03 | 1626.27 | 1589.70 | 1415.63 | 1380.38 | 1314.30 | 1260.81 | 1257.52 | 1196.61 | 1107.99 | 1139.43 | 1138.70 | 1122.81 | 853.79 | 840.95 | 829.01 | 807.66 | 772.92 | 674.08 | 669.37 | 635.67 | 533.40 | 514.54 | 483.25 | 457.42 | 441.69 | 433.94 | 429.29 | 407.82 | 293.69 | 289.26 | 290.10 | 279.02 | 279.01 | 277.95 | 277.36 | 281.85 | NA | NA | NA | |
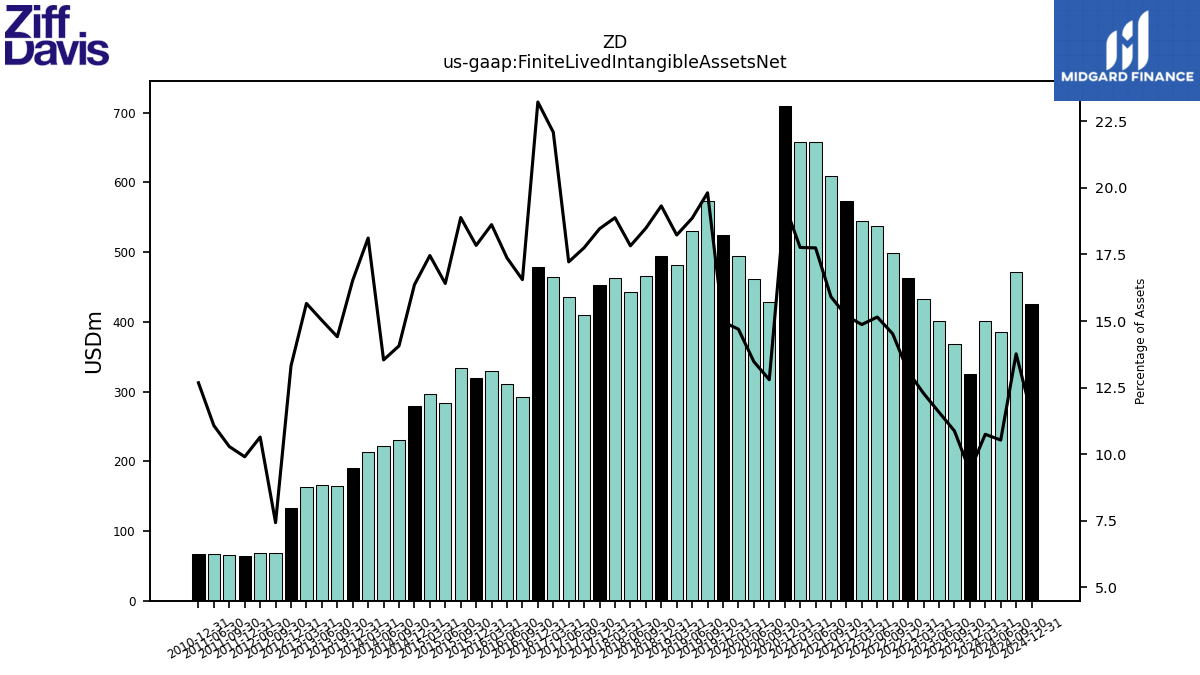
| Finite Lived Intangible Assets Net | 325.41 | 367.94 | 401.64 | 433.31 | 462.81 | 498.45 | 536.74 | 544.65 | 572.73 | 609.43 | 657.18 | 657.83 | 709.78 | 427.83 | 460.77 | 494.97 | 524.87 | 573.22 | 529.91 | 481.77 | 494.78 | 465.30 | 442.13 | 462.90 | 452.94 | 409.12 | 435.27 | 464.39 | 478.88 | 292.84 | 311.44 | 329.88 | 319.83 | 333.28 | 283.36 | 296.49 | 278.99 | 230.69 | 222.02 | 213.45 | 190.72 | 164.00 | 165.85 | 162.83 | 132.50 | 68.75 | 69.11 | NA | 64.50 | 65.52 | 67.28 | NA | 67.54 | NA | NA | NA | |
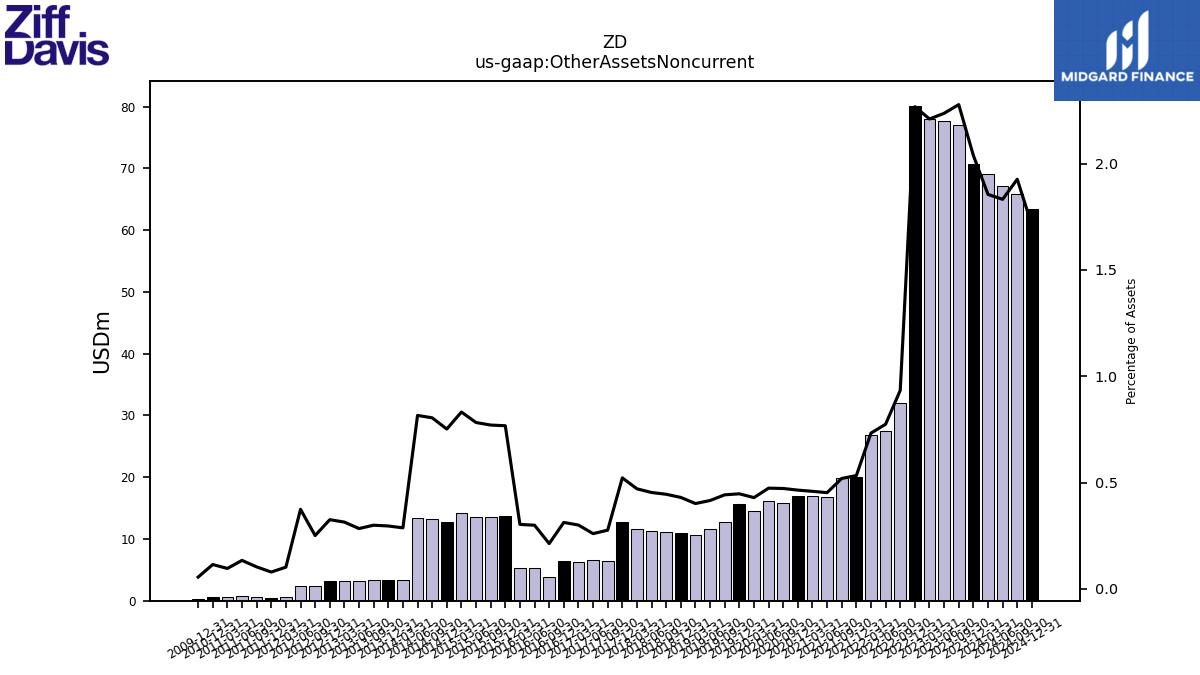
| Other Assets Noncurrent | 70.75 | 77.05 | 77.60 | 77.95 | 80.13 | 32.05 | 27.44 | 26.84 | 20.09 | 19.90 | 16.76 | 16.99 | 17.03 | 15.79 | 16.20 | 14.46 | 15.68 | 12.80 | 11.68 | 10.61 | 11.01 | 11.20 | 11.24 | 11.54 | 12.81 | 6.36 | 6.57 | 6.31 | 6.45 | 3.77 | 5.37 | 5.37 | 13.76 | 13.60 | 13.51 | 14.12 | 12.82 | 13.20 | 13.38 | 3.38 | 3.41 | 3.41 | 3.13 | 3.27 | 3.24 | 2.32 | 2.43 | 0.65 | 0.52 | 0.66 | 0.81 | 0.55 | 0.61 | NA | NA | NA |
| 2023-12-31 | 2023-09-30 | 2023-06-30 | 2023-03-31 | 2022-12-31 | 2022-09-30 | 2022-06-30 | 2022-03-31 | 2021-12-31 | 2021-09-30 | 2021-06-30 | 2021-03-31 | 2020-12-31 | 2020-09-30 | 2020-06-30 | 2020-03-31 | 2019-12-31 | 2019-09-30 | 2019-06-30 | 2019-03-31 | 2018-12-31 | 2018-09-30 | 2018-06-30 | 2018-03-31 | 2017-12-31 | 2017-09-30 | 2017-06-30 | 2017-03-31 | 2016-12-31 | 2016-09-30 | 2016-06-30 | 2016-03-31 | 2015-12-31 | 2015-09-30 | 2015-06-30 | 2015-03-31 | 2014-12-31 | 2014-09-30 | 2014-06-30 | 2014-03-31 | 2013-12-31 | 2013-09-30 | 2013-06-30 | 2013-03-31 | 2012-12-31 | 2012-09-30 | 2012-06-30 | 2012-03-31 | 2011-12-31 | 2011-09-30 | 2011-06-30 | 2011-03-31 | 2010-12-31 | 2010-09-30 | 2010-06-30 | 2010-03-31 | ||
|---|---|---|---|---|---|---|---|---|---|---|---|---|---|---|---|---|---|---|---|---|---|---|---|---|---|---|---|---|---|---|---|---|---|---|---|---|---|---|---|---|---|---|---|---|---|---|---|---|---|---|---|---|---|---|---|---|---|
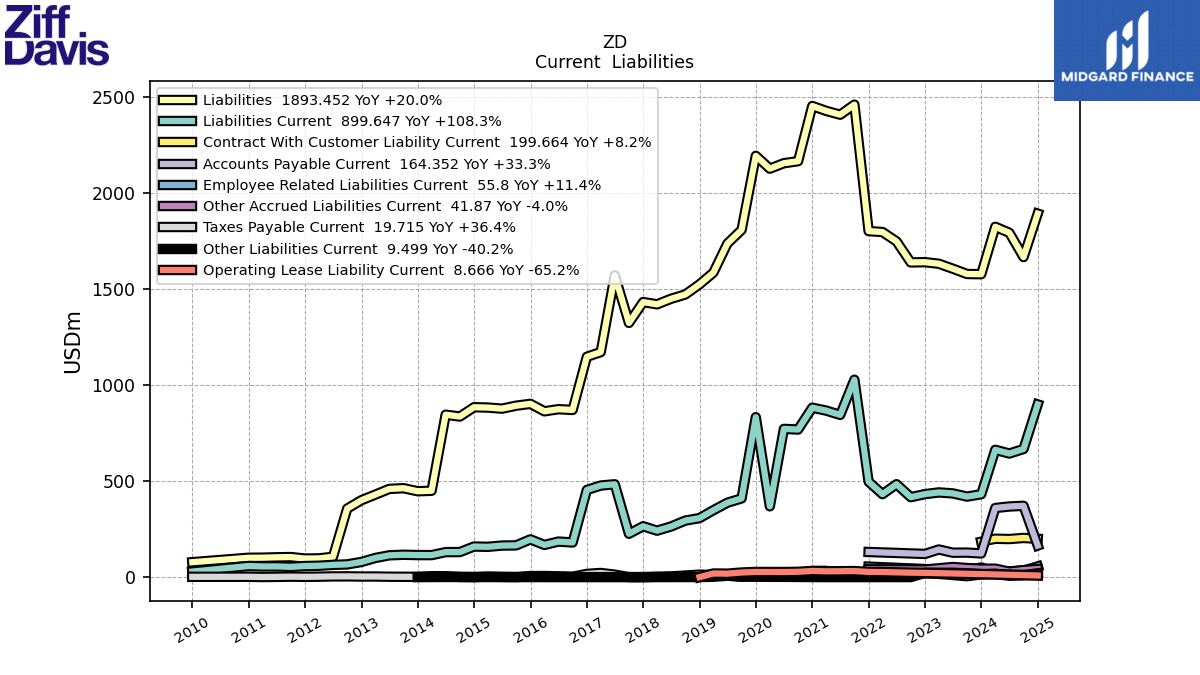
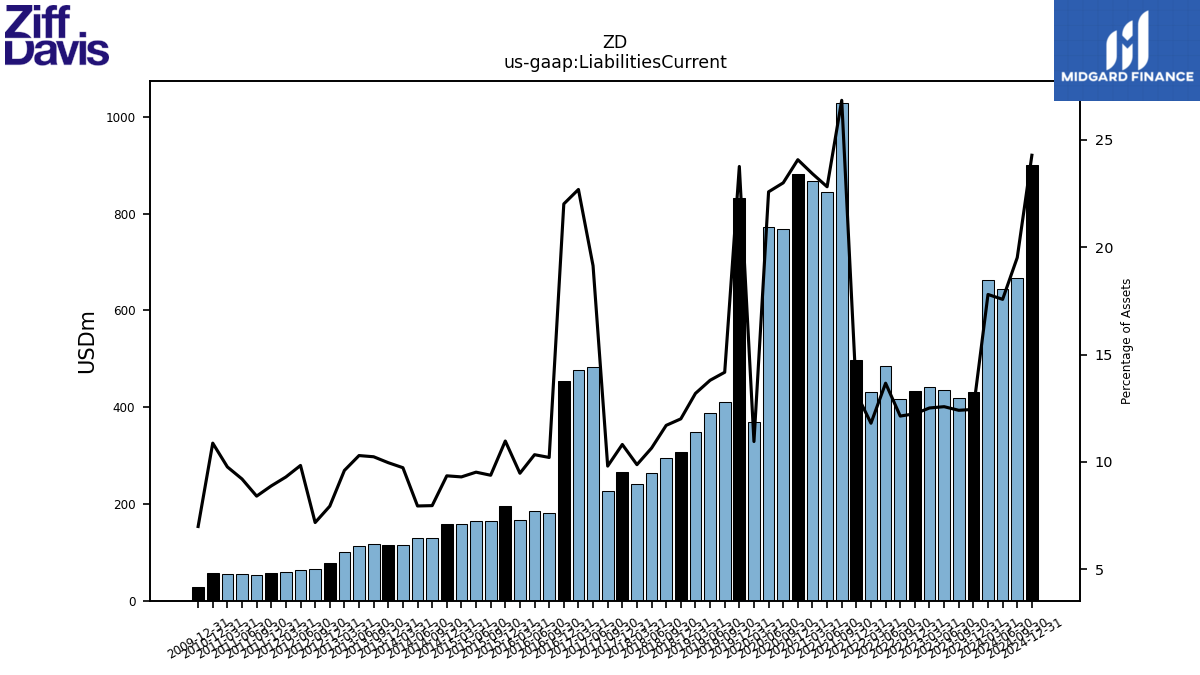
| Liabilities Current | 431.83 | 419.50 | 436.04 | 441.18 | 432.45 | 416.45 | 484.05 | 432.19 | 497.24 | 1028.40 | 845.02 | 867.53 | 882.56 | 768.91 | 772.18 | 368.68 | 833.10 | 410.05 | 387.71 | 348.52 | 307.32 | 294.45 | 263.92 | 241.94 | 265.10 | 225.85 | 483.67 | 477.11 | 454.09 | 180.49 | 185.25 | 167.72 | 196.65 | 165.43 | 164.34 | 157.87 | 159.37 | 130.50 | 130.22 | 114.58 | 114.89 | 116.47 | 113.59 | 99.79 | 78.93 | 66.33 | 63.82 | 59.28 | 57.80 | 53.50 | 55.89 | 55.65 | 57.89 | NA | NA | NA | |
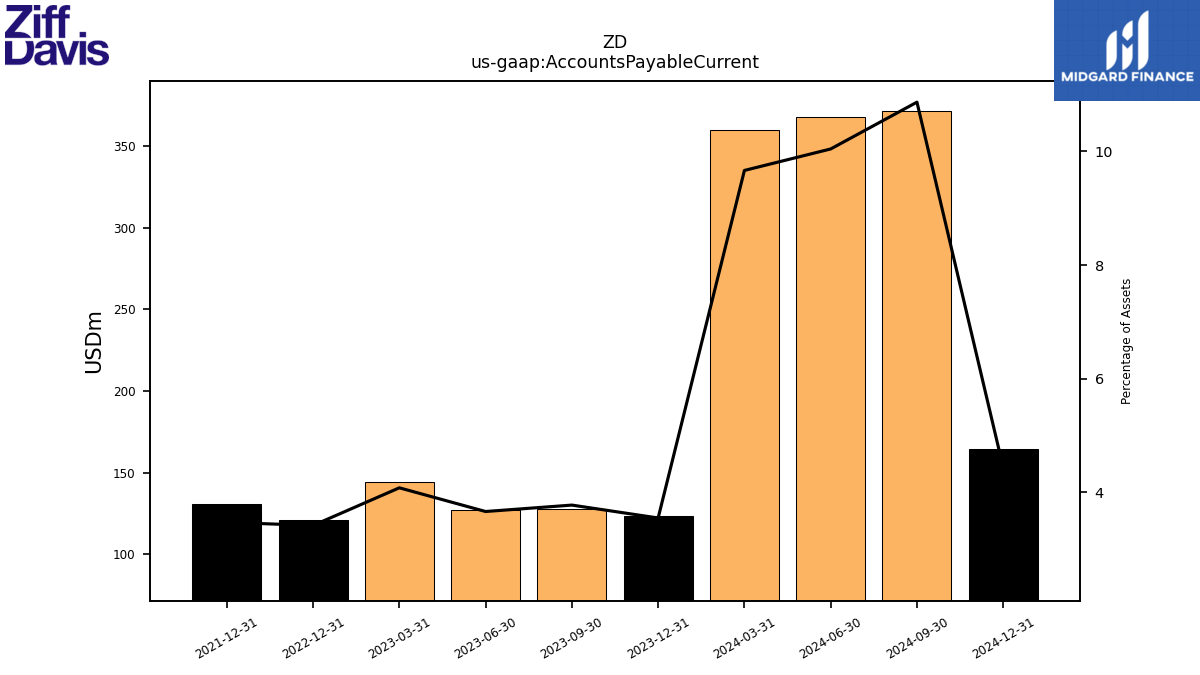
| Accounts Payable Current | 123.26 | 127.82 | 127.14 | 143.97 | 120.83 | NA | NA | NA | 130.98 | NA | NA | NA | NA | NA | NA | NA | NA | NA | NA | NA | NA | NA | NA | NA | NA | NA | NA | NA | NA | NA | NA | NA | NA | NA | NA | NA | NA | NA | NA | NA | NA | NA | NA | NA | NA | NA | NA | NA | NA | NA | NA | NA | NA | NA | NA | NA | |
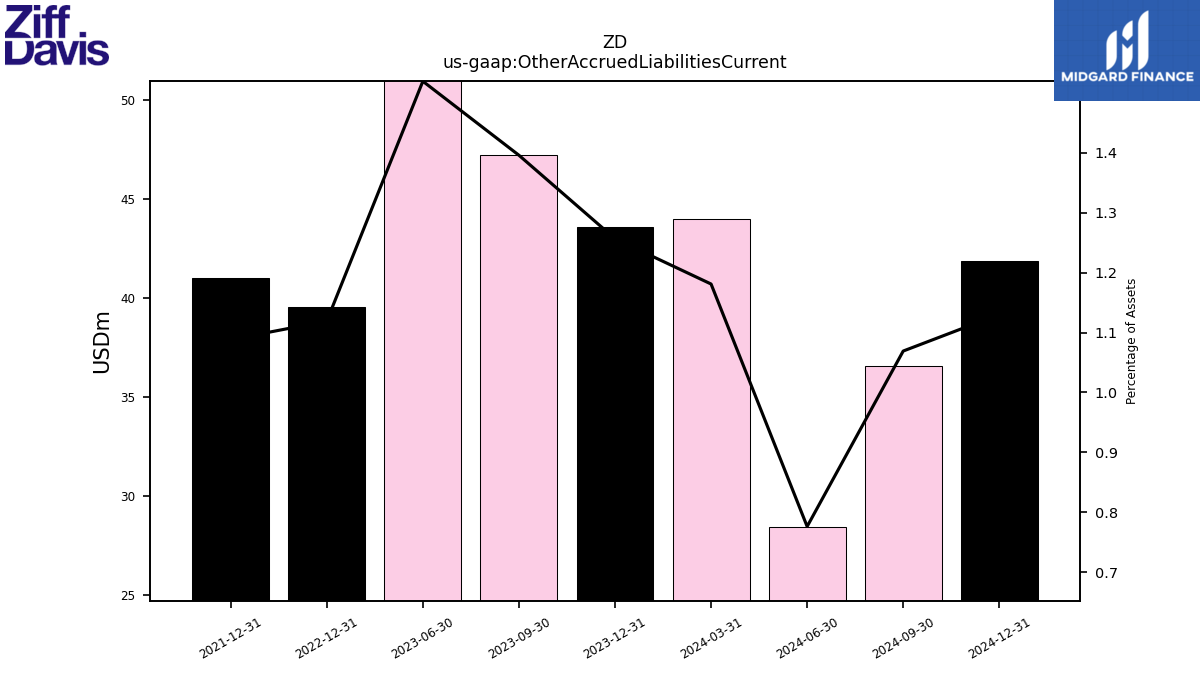
| Other Accrued Liabilities Current | 43.61 | 47.22 | 52.70 | NA | 39.54 | NA | NA | NA | 41.03 | NA | NA | NA | NA | NA | NA | NA | NA | NA | NA | NA | NA | NA | NA | NA | NA | NA | NA | NA | NA | NA | NA | NA | NA | NA | NA | NA | NA | NA | NA | NA | NA | NA | NA | NA | NA | NA | NA | NA | NA | NA | NA | NA | NA | NA | NA | NA | |
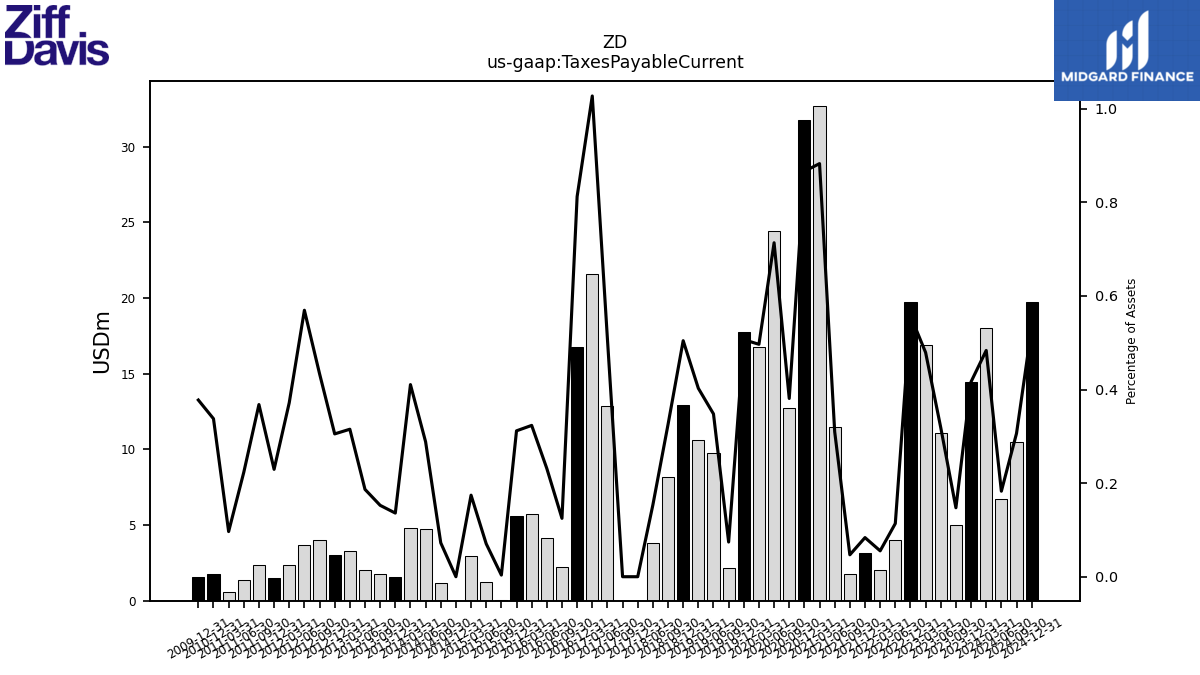
| Taxes Payable Current | 14.46 | 4.99 | 11.05 | 16.90 | 19.71 | NA | 4.03 | 2.02 | 3.15 | 1.79 | 11.47 | 32.69 | 31.75 | 12.73 | 24.40 | 16.73 | 17.76 | 2.14 | 9.78 | 10.64 | 12.91 | 8.19 | 3.81 | NA | 0.00 | 0.00 | 12.85 | 21.60 | 16.75 | 2.21 | 4.15 | 5.73 | 5.59 | 0.06 | 1.22 | 2.96 | 0.00 | 1.19 | 4.73 | 4.84 | 1.57 | 1.74 | 2.06 | 3.28 | 3.04 | 4.01 | 3.70 | 2.37 | 1.49 | 2.34 | 1.36 | 0.55 | 1.80 | NA | NA | NA | |
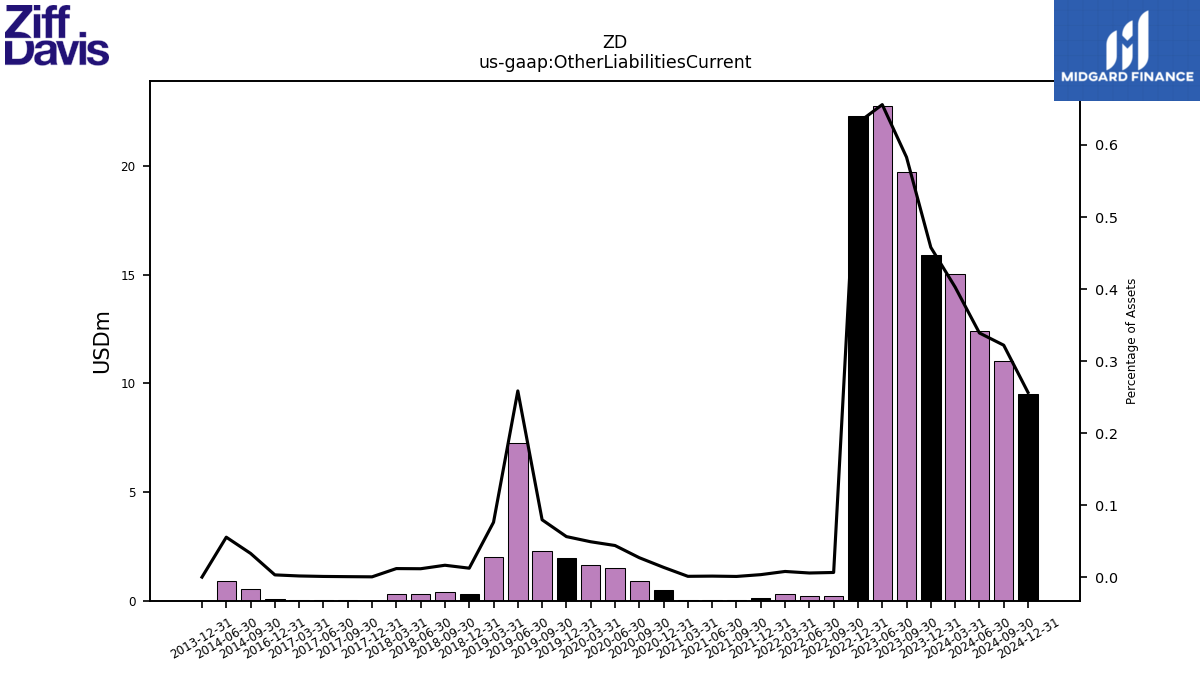
| Other Liabilities Current | 15.89 | 19.72 | 22.76 | NA | 22.29 | 0.22 | 0.20 | 0.29 | 0.13 | 0.04 | 0.05 | 0.04 | 0.50 | 0.90 | 1.50 | 1.65 | 1.97 | 2.30 | 7.26 | 2.01 | 0.32 | 0.41 | 0.29 | 0.29 | 0.01 | 0.01 | 0.02 | 0.03 | 0.06 | NA | NA | NA | NA | NA | NA | NA | NA | 0.54 | 0.91 | NA | 0.00 | NA | NA | NA | NA | NA | NA | NA | NA | NA | NA | NA | NA | NA | NA | NA |
| 2023-12-31 | 2023-09-30 | 2023-06-30 | 2023-03-31 | 2022-12-31 | 2022-09-30 | 2022-06-30 | 2022-03-31 | 2021-12-31 | 2021-09-30 | 2021-06-30 | 2021-03-31 | 2020-12-31 | 2020-09-30 | 2020-06-30 | 2020-03-31 | 2019-12-31 | 2019-09-30 | 2019-06-30 | 2019-03-31 | 2018-12-31 | 2018-09-30 | 2018-06-30 | 2018-03-31 | 2017-12-31 | 2017-09-30 | 2017-06-30 | 2017-03-31 | 2016-12-31 | 2016-09-30 | 2016-06-30 | 2016-03-31 | 2015-12-31 | 2015-09-30 | 2015-06-30 | 2015-03-31 | 2014-12-31 | 2014-09-30 | 2014-06-30 | 2014-03-31 | 2013-12-31 | 2013-09-30 | 2013-06-30 | 2013-03-31 | 2012-12-31 | 2012-09-30 | 2012-06-30 | 2012-03-31 | 2011-12-31 | 2011-09-30 | 2011-06-30 | 2011-03-31 | 2010-12-31 | 2010-09-30 | 2010-06-30 | 2010-03-31 | ||
|---|---|---|---|---|---|---|---|---|---|---|---|---|---|---|---|---|---|---|---|---|---|---|---|---|---|---|---|---|---|---|---|---|---|---|---|---|---|---|---|---|---|---|---|---|---|---|---|---|---|---|---|---|---|---|---|---|---|
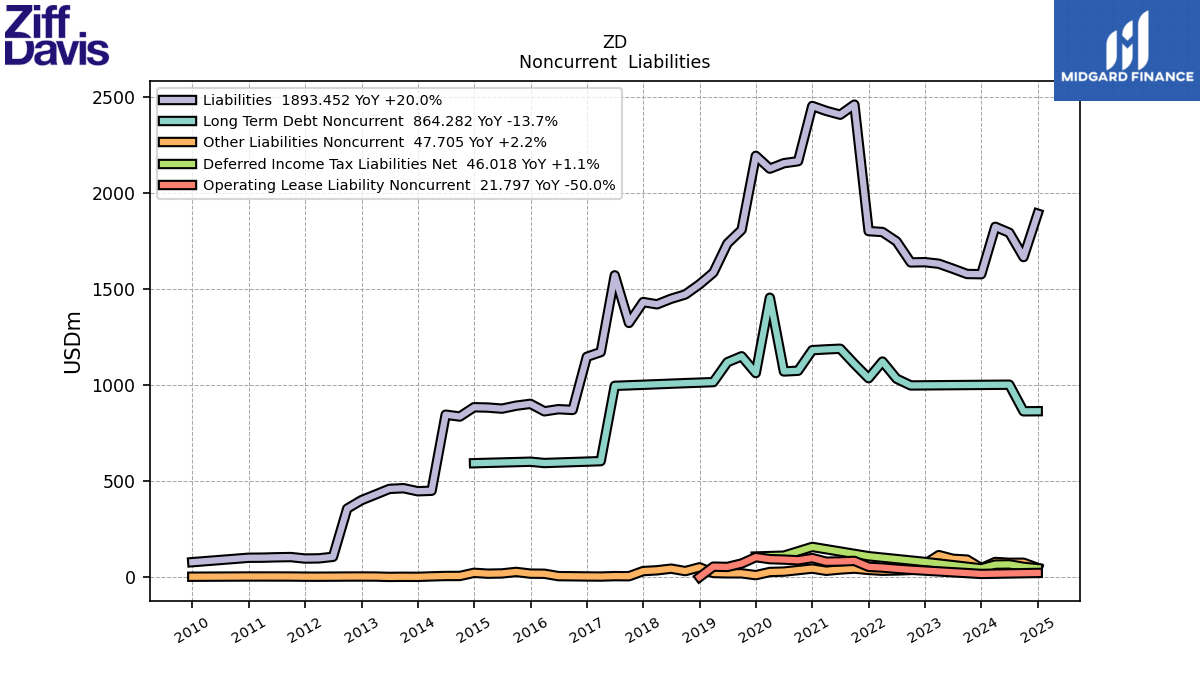
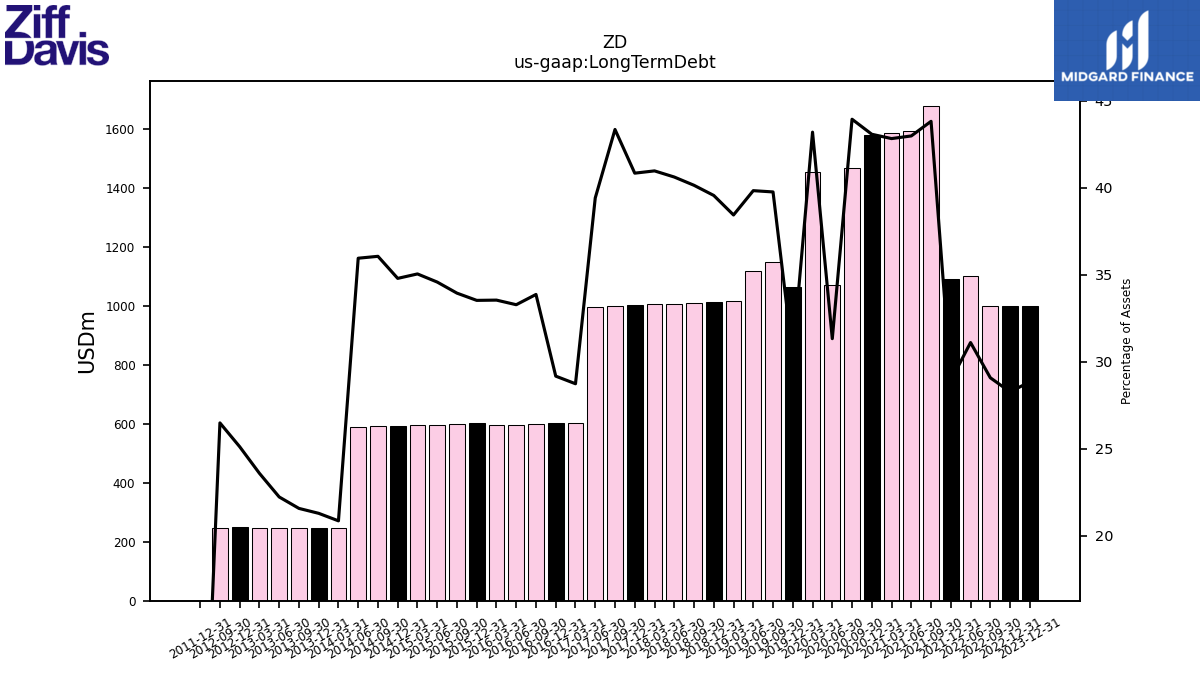
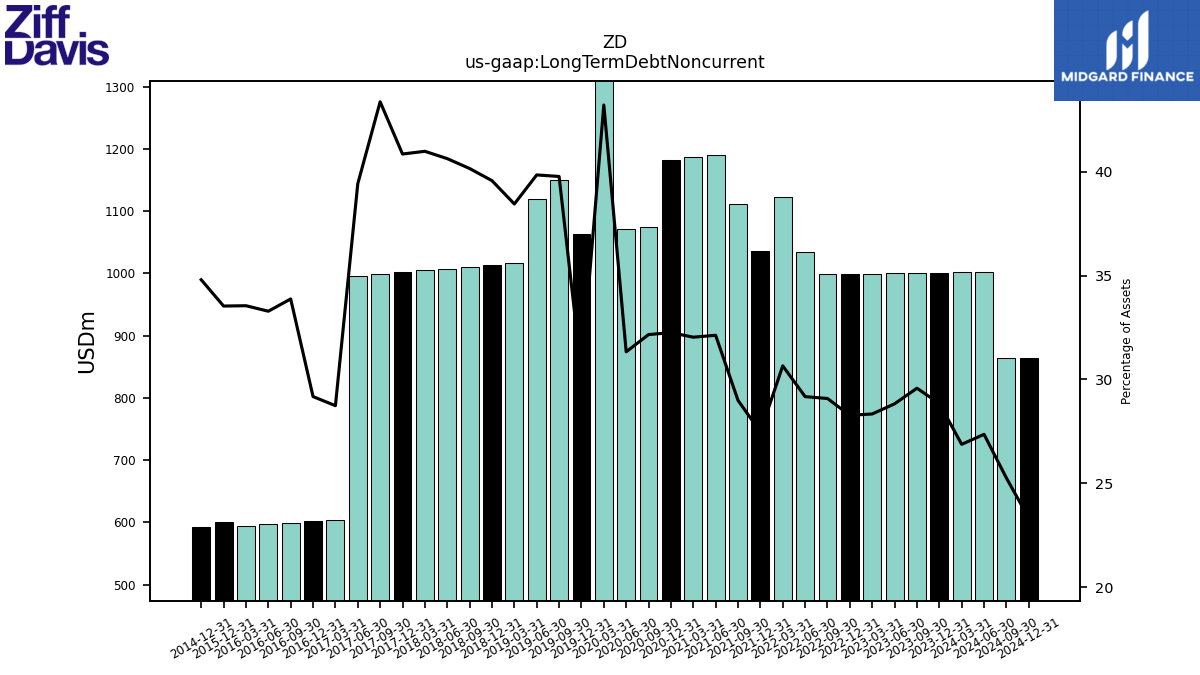
| Long Term Debt | 1001.31 | NA | NA | NA | 999.05 | 998.50 | 1102.20 | NA | 1090.63 | 1678.75 | 1591.86 | 1586.33 | 1579.02 | 1469.05 | 1071.36 | 1455.45 | 1062.93 | 1150.52 | 1119.44 | 1015.97 | 1013.13 | 1010.57 | 1007.69 | 1004.80 | 1001.94 | 999.20 | 996.38 | 604.27 | 601.75 | 599.26 | 596.81 | 594.41 | 601.19 | 599.18 | 597.21 | 595.27 | 593.35 | 591.46 | 589.60 | 245.80 | 245.67 | 245.55 | 245.43 | 245.31 | 250.00 | 245.08 | NA | NA | 0.00 | NA | NA | NA | NA | NA | NA | NA | |
| Long Term Debt Noncurrent | 1001.31 | 1000.74 | 1000.18 | 999.62 | 999.05 | 998.50 | 1033.69 | 1122.94 | 1036.02 | 1110.70 | 1189.73 | 1186.44 | 1182.22 | 1075.07 | 1071.36 | 1455.45 | 1062.93 | 1150.52 | 1119.44 | 1015.97 | 1013.13 | 1010.57 | 1007.69 | 1004.80 | 1001.94 | 999.20 | 996.38 | 604.27 | 601.75 | 599.26 | 596.81 | 594.41 | 601.19 | NA | NA | NA | 593.35 | NA | NA | NA | NA | NA | NA | NA | NA | NA | NA | NA | NA | NA | NA | NA | NA | NA | NA | NA | |
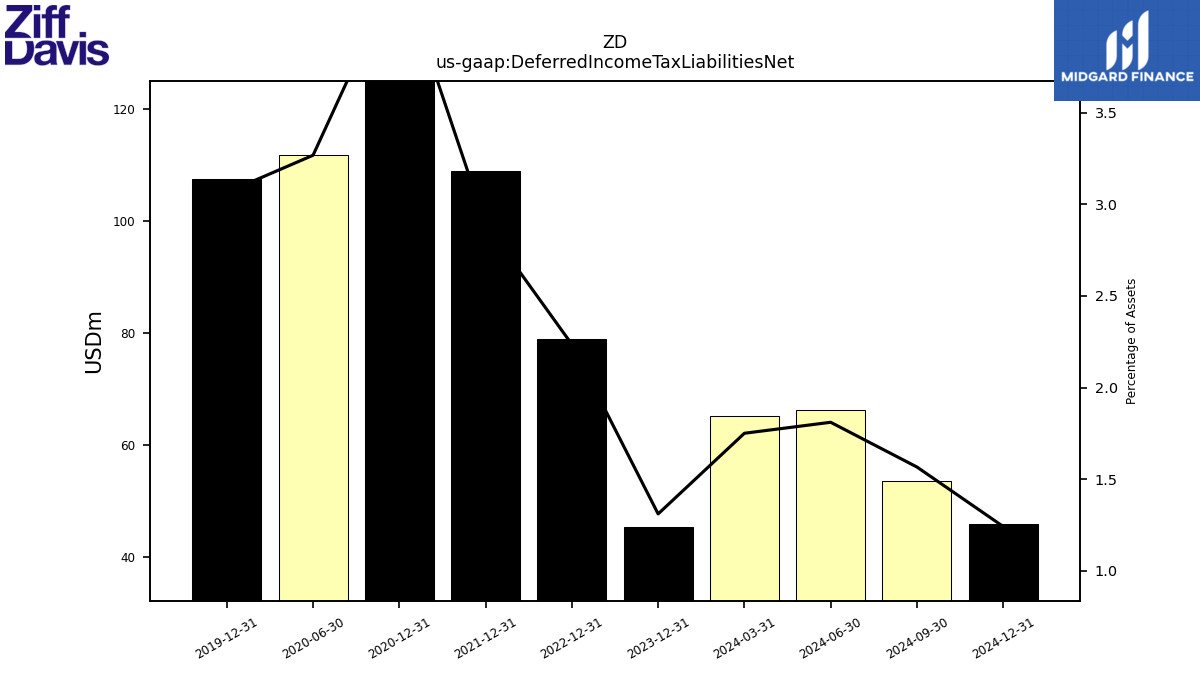
| Deferred Income Tax Liabilities Net | 45.50 | NA | NA | NA | 79.01 | NA | NA | NA | 108.98 | NA | NA | NA | 157.31 | NA | 111.75 | NA | 107.45 | NA | NA | NA | NA | NA | NA | NA | NA | NA | NA | NA | NA | NA | NA | NA | NA | NA | NA | NA | NA | NA | NA | NA | NA | NA | NA | NA | NA | NA | NA | NA | NA | NA | NA | NA | NA | NA | NA | NA | |
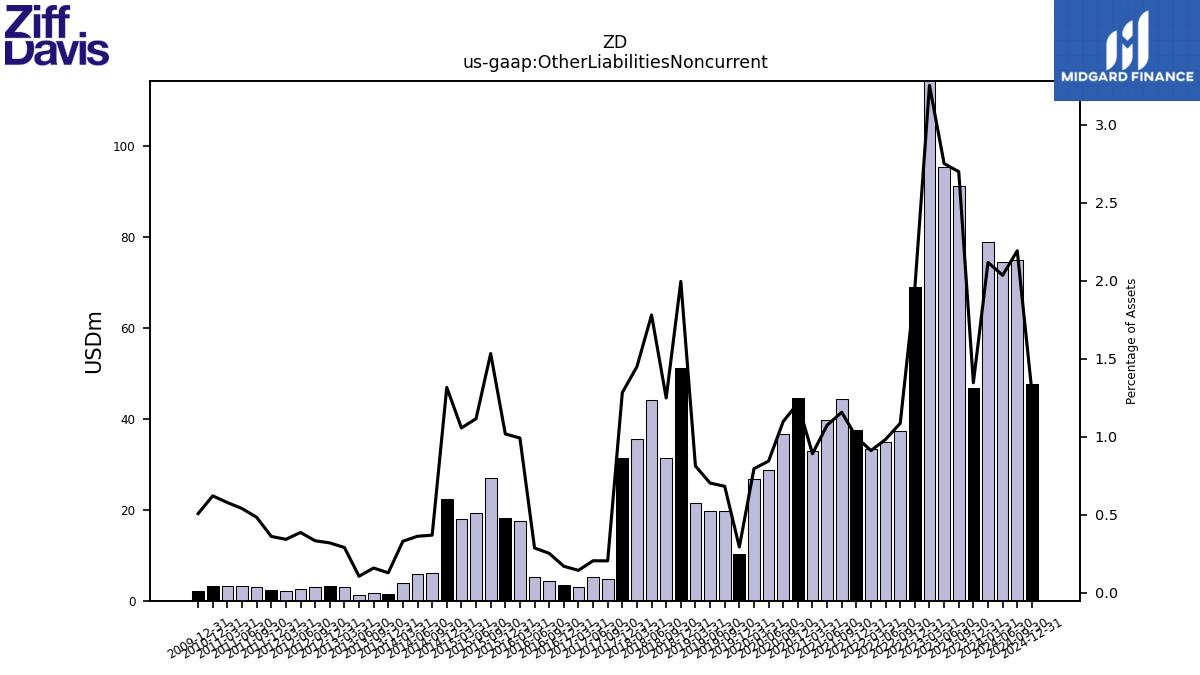
| Other Liabilities Noncurrent | 46.67 | 91.26 | 95.40 | 114.65 | 68.99 | 37.24 | 34.79 | 33.33 | 37.54 | 44.26 | 39.72 | 32.95 | 44.46 | 36.65 | 28.81 | 26.74 | 10.23 | 19.70 | 19.72 | 21.43 | 51.07 | 31.39 | 44.13 | 35.51 | 31.43 | 4.68 | 5.14 | 2.99 | 3.48 | 4.45 | 5.12 | 17.55 | 18.23 | 27.04 | 19.24 | 17.91 | 22.42 | 6.03 | 5.92 | 3.87 | 1.46 | 1.79 | 1.16 | 3.00 | 3.17 | 3.07 | 2.50 | 2.17 | 2.34 | 3.07 | 3.27 | 3.29 | 3.30 | NA | NA | NA | |
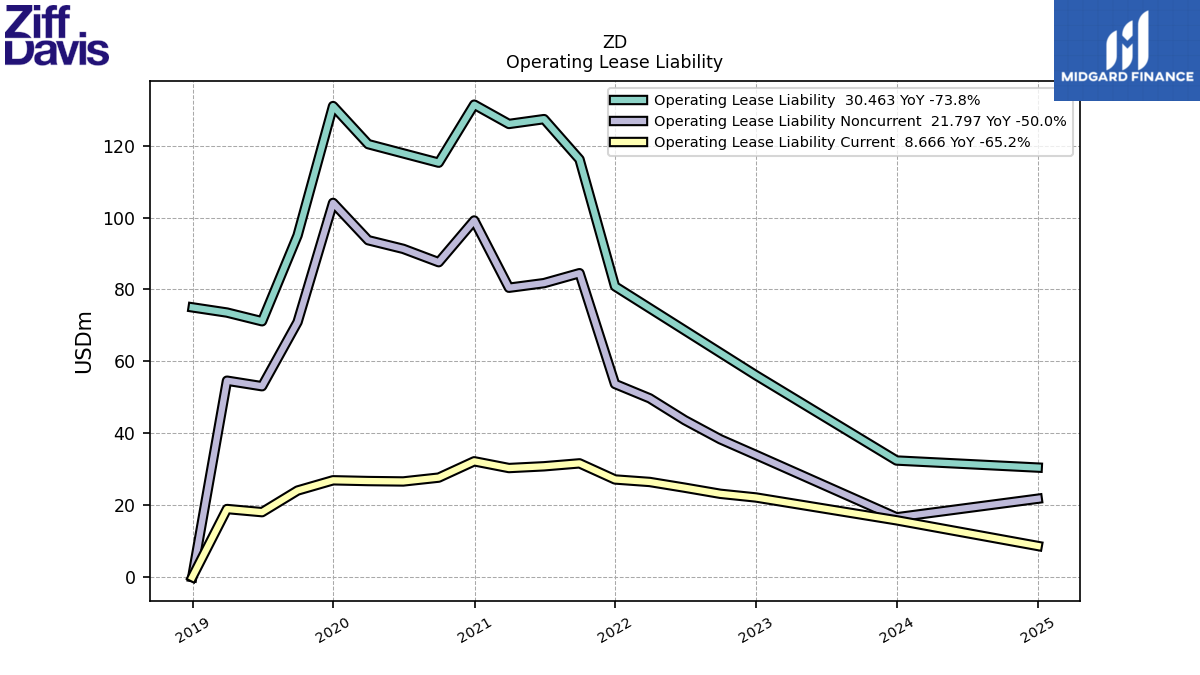
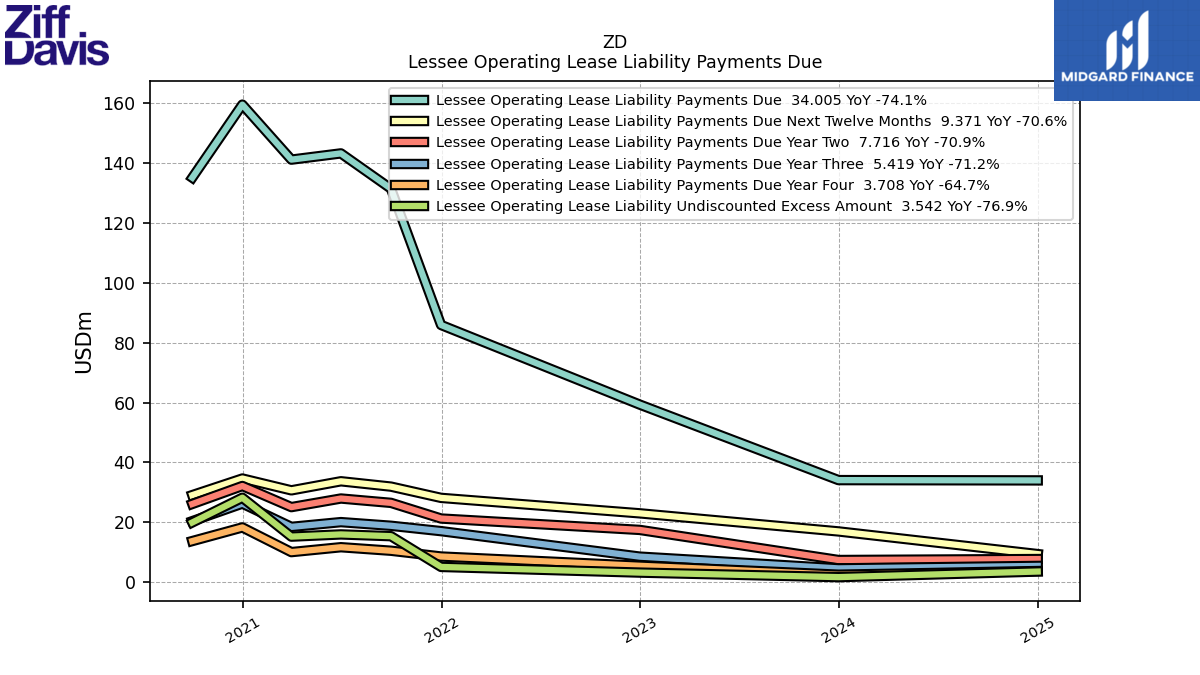
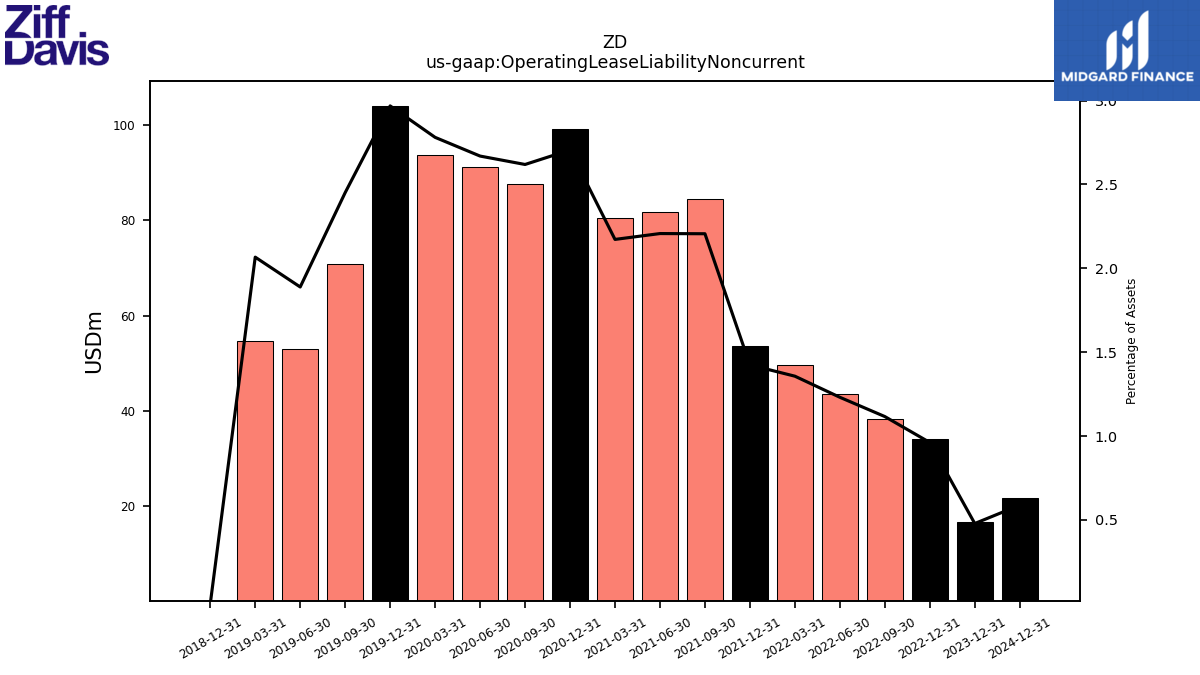
| Operating Lease Liability Noncurrent | 16.63 | NA | NA | NA | 34.00 | 38.33 | 43.63 | 49.72 | 53.71 | 84.52 | 81.75 | 80.47 | 99.18 | 87.56 | 91.28 | 93.69 | 104.07 | 70.93 | 53.08 | 54.63 | 0.00 | NA | NA | NA | NA | NA | NA | NA | NA | NA | NA | NA | NA | NA | NA | NA | NA | NA | NA | NA | NA | NA | NA | NA | NA | NA | NA | NA | NA | NA | NA | NA | NA | NA | NA | NA |
| 2023-12-31 | 2023-09-30 | 2023-06-30 | 2023-03-31 | 2022-12-31 | 2022-09-30 | 2022-06-30 | 2022-03-31 | 2021-12-31 | 2021-09-30 | 2021-06-30 | 2021-03-31 | 2020-12-31 | 2020-09-30 | 2020-06-30 | 2020-03-31 | 2019-12-31 | 2019-09-30 | 2019-06-30 | 2019-03-31 | 2018-12-31 | 2018-09-30 | 2018-06-30 | 2018-03-31 | 2017-12-31 | 2017-09-30 | 2017-06-30 | 2017-03-31 | 2016-12-31 | 2016-09-30 | 2016-06-30 | 2016-03-31 | 2015-12-31 | 2015-09-30 | 2015-06-30 | 2015-03-31 | 2014-12-31 | 2014-09-30 | 2014-06-30 | 2014-03-31 | 2013-12-31 | 2013-09-30 | 2013-06-30 | 2013-03-31 | 2012-12-31 | 2012-09-30 | 2012-06-30 | 2012-03-31 | 2011-12-31 | 2011-09-30 | 2011-06-30 | 2011-03-31 | 2010-12-31 | 2010-09-30 | 2010-06-30 | 2010-03-31 | ||
|---|---|---|---|---|---|---|---|---|---|---|---|---|---|---|---|---|---|---|---|---|---|---|---|---|---|---|---|---|---|---|---|---|---|---|---|---|---|---|---|---|---|---|---|---|---|---|---|---|---|---|---|---|---|---|---|---|---|
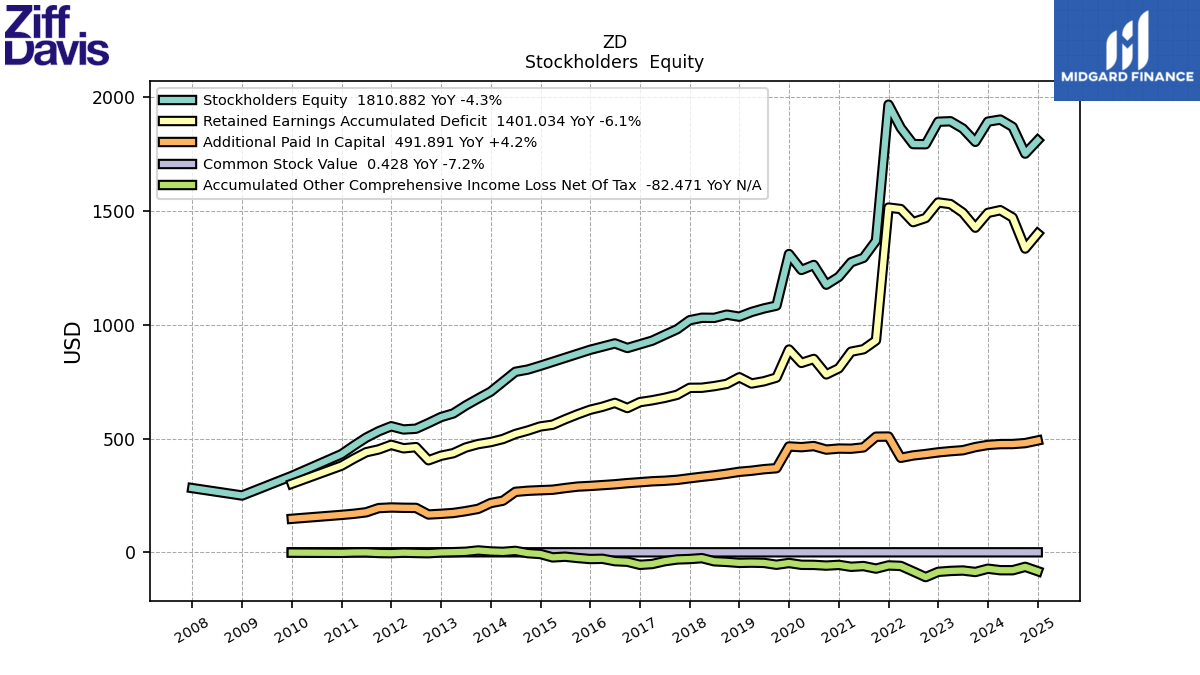
| Stockholders Equity | 1893.00 | 1804.14 | 1862.68 | 1894.62 | 1892.61 | 1793.64 | 1794.20 | 1865.49 | 1967.73 | 1369.26 | 1294.50 | 1274.91 | 1211.02 | 1176.34 | 1263.17 | 1241.08 | 1311.19 | 1084.37 | 1072.10 | 1056.65 | 1035.74 | 1044.82 | 1030.61 | 1031.17 | 1020.30 | 980.54 | 955.56 | 930.43 | 914.54 | 898.19 | 918.39 | NA | 890.21 | NA | NA | NA | 820.24 | 803.56 | 793.59 | NA | 706.42 | 676.37 | 645.41 | 610.64 | 594.70 | 568.33 | 543.51 | 540.24 | 554.38 | 532.40 | 504.20 | 468.75 | 431.75 | NA | NA | NA | |
| Common Stock Value | 0.46 | 0.46 | 0.46 | 0.47 | 0.47 | 0.47 | 0.47 | 0.47 | 0.47 | 0.48 | 0.45 | 0.45 | 0.44 | 0.45 | 0.47 | 0.47 | 0.48 | 0.48 | 0.48 | 0.48 | 0.48 | 0.48 | 0.48 | 0.48 | 0.48 | 0.48 | 0.48 | 0.47 | 0.47 | 0.47 | 0.48 | 0.48 | 0.48 | 0.48 | 0.48 | 0.47 | 0.47 | 0.47 | 0.47 | 0.47 | 0.46 | 0.46 | 0.46 | 0.45 | 0.45 | 0.45 | 0.54 | 0.54 | 0.55 | 0.55 | 0.54 | 0.54 | 0.54 | NA | NA | NA | |
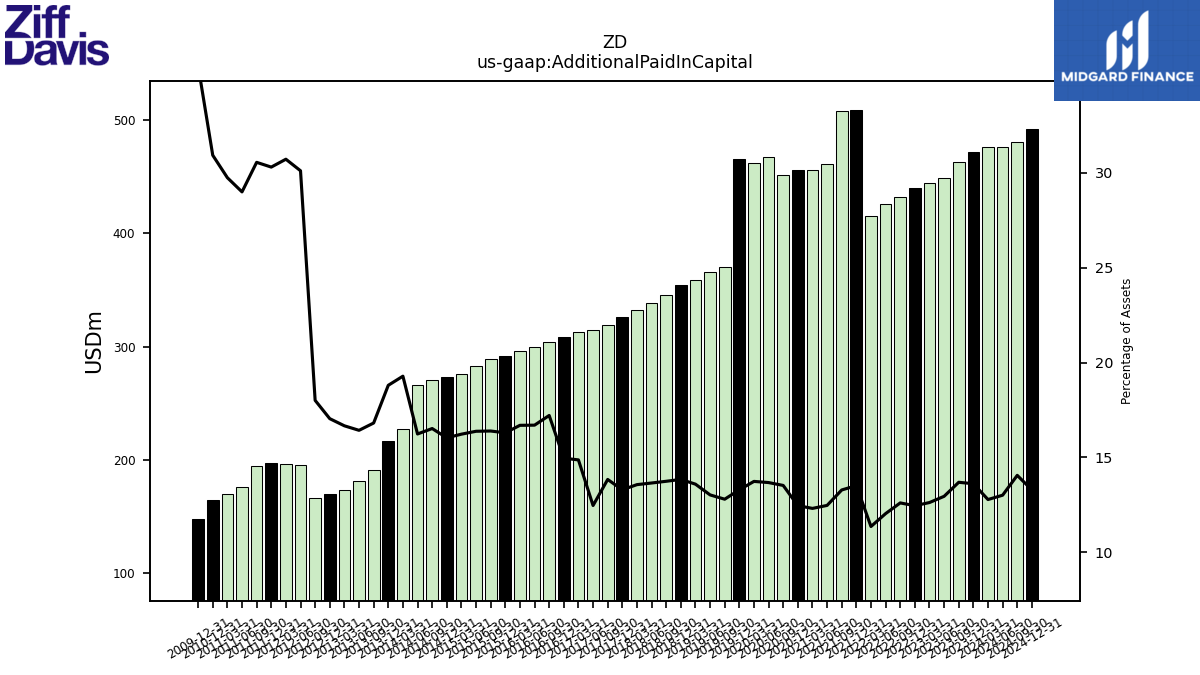
| Additional Paid In Capital | 472.20 | 462.81 | 448.92 | 444.81 | 439.68 | 432.27 | 426.10 | 415.65 | 509.12 | 508.49 | 461.42 | 455.62 | 456.27 | 451.74 | 467.27 | 462.43 | 465.65 | 369.97 | 365.69 | 358.93 | 354.21 | 345.67 | 338.41 | 332.41 | 325.85 | 318.71 | 314.79 | 312.47 | 308.33 | 304.38 | 299.35 | 295.63 | 292.06 | 289.20 | 282.70 | 275.42 | 273.30 | 270.86 | 266.12 | 227.15 | 216.87 | 191.29 | 181.27 | 173.23 | 169.54 | 166.56 | 195.54 | 196.01 | 197.37 | 194.65 | 176.20 | 169.62 | 164.77 | NA | NA | NA | |
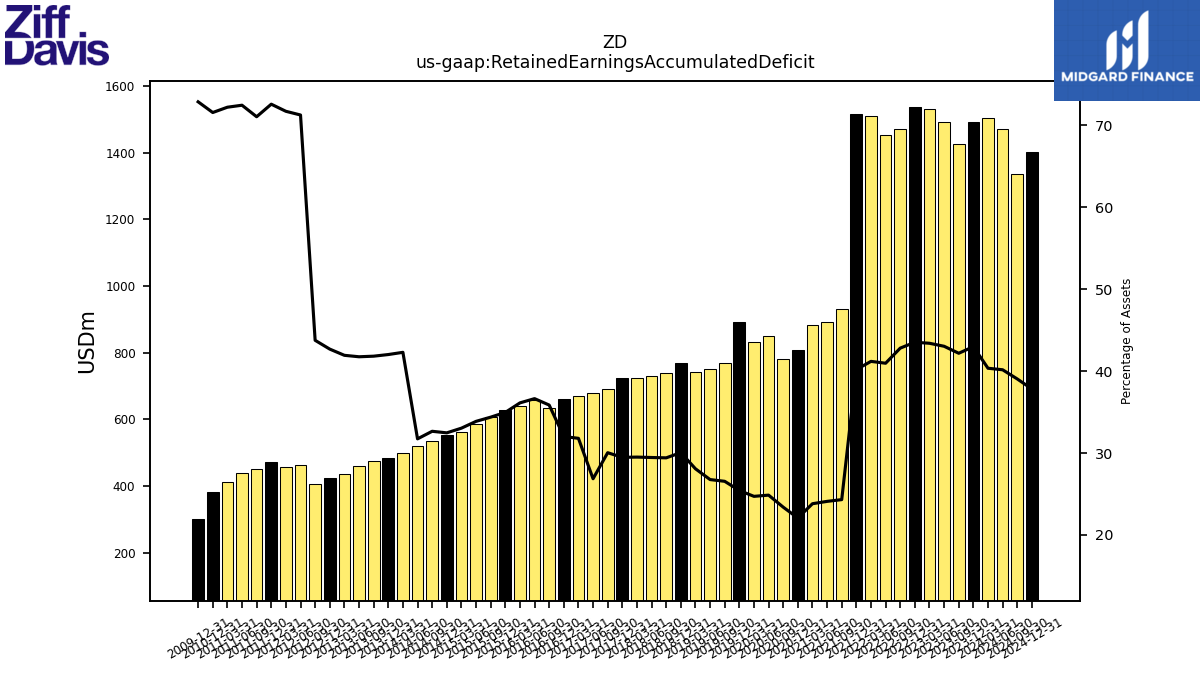
| Retained Earnings Accumulated Deficit | 1491.96 | 1426.98 | 1492.88 | 1530.66 | 1537.83 | 1469.52 | 1451.32 | 1508.80 | 1515.36 | 931.48 | 892.61 | 882.07 | 809.11 | 782.14 | 850.23 | 832.65 | 891.53 | 768.19 | 752.04 | 742.17 | 769.58 | 740.43 | 730.73 | 723.56 | 723.06 | 692.39 | 679.03 | 668.55 | 660.38 | 634.39 | 657.03 | 640.00 | 626.79 | 606.81 | 584.83 | 561.05 | 553.58 | 535.57 | 520.35 | 498.32 | 484.85 | 475.98 | 460.88 | 435.98 | 424.79 | 404.86 | 462.66 | 457.46 | 472.60 | 452.49 | 440.17 | 411.66 | 381.14 | NA | NA | NA | |
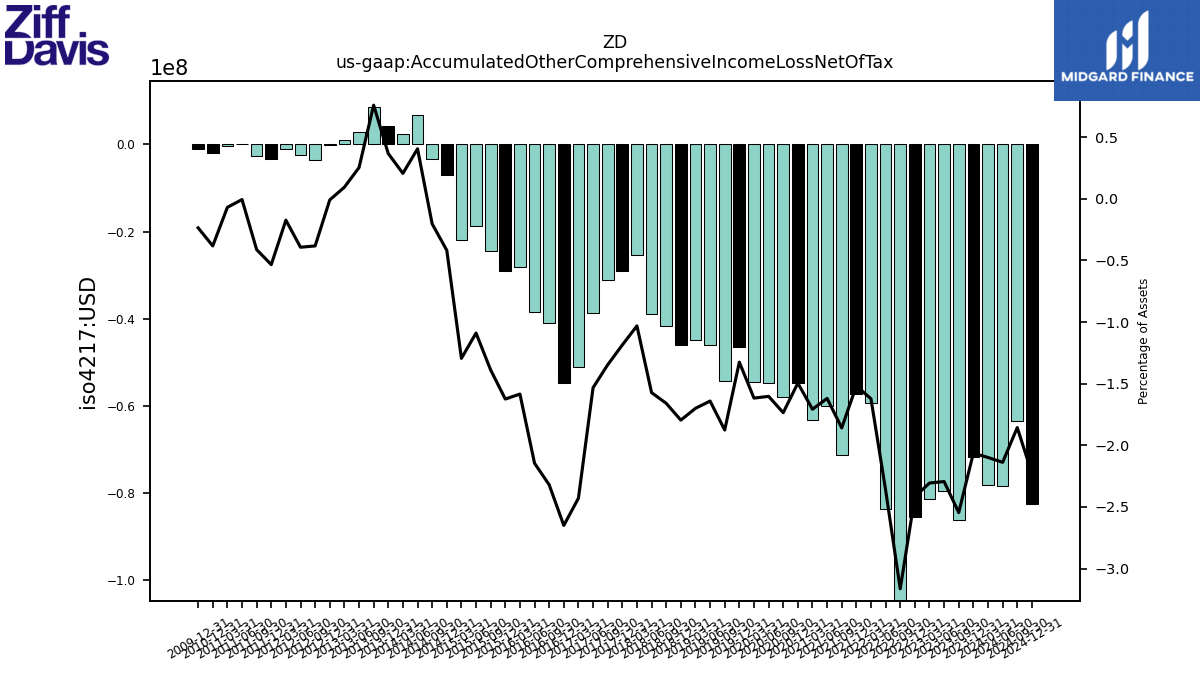
| Accumulated Other Comprehensive Income Loss Net Of Tax | -71.62 | -86.11 | -79.58 | -81.34 | -85.37 | -108.62 | -83.70 | -59.43 | -57.22 | -71.19 | -59.97 | -63.23 | -54.81 | -57.99 | -54.80 | -54.47 | -46.46 | -54.27 | -46.11 | -44.93 | -45.98 | -41.76 | -39.01 | -25.28 | -29.09 | -31.03 | -38.74 | -51.07 | -54.65 | -41.05 | -38.47 | -28.07 | -29.12 | -24.52 | -18.81 | -21.98 | -7.13 | -3.33 | 6.65 | 2.43 | 4.24 | 8.65 | 2.80 | 0.98 | -0.09 | -3.54 | -2.55 | -1.10 | -3.48 | -2.62 | -0.04 | -0.40 | -2.04 | NA | NA | NA | |
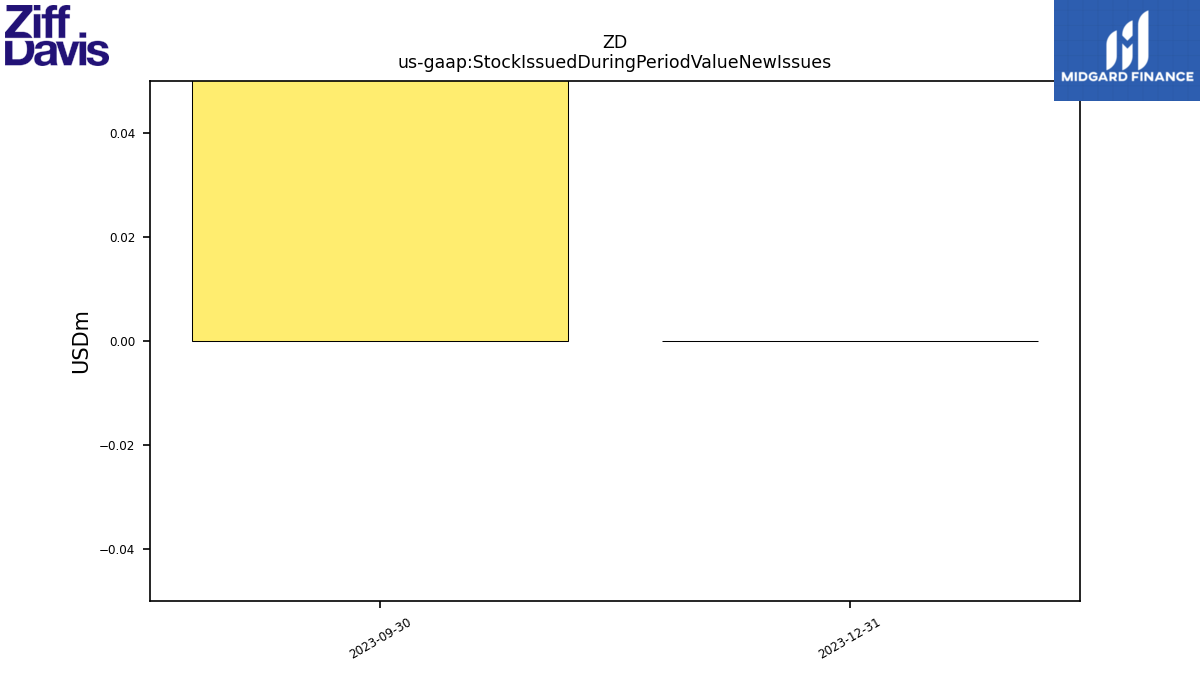
| Stock Issued During Period Value New Issues | 0.00 | 13.42 | NA | NA | NA | NA | NA | NA | NA | NA | NA | NA | NA | NA | NA | NA | NA | NA | NA | NA | NA | NA | NA | NA | NA | NA | NA | NA | NA | NA | NA | NA | NA | NA | NA | NA | NA | NA | NA | NA | NA | NA | NA | NA | NA | NA | NA | NA | NA | NA | NA | NA | NA | NA | NA | NA | |
| Adjustments To Additional Paid In Capital Sharebased Compensation Requisite Service Period Recognition Value | 7.53 | 6.77 | 9.22 | 8.40 | 5.79 | 6.39 | 7.70 | 6.72 | 6.13 | 6.75 | 6.25 | 6.11 | 5.36 | 5.80 | 6.53 | 6.31 | 5.53 | 6.45 | 6.86 | 5.09 | 6.70 | 7.91 | 7.07 | 6.42 | NA | NA | NA | NA | NA | NA | NA | NA | NA | NA | NA | NA | NA | NA | NA | NA | NA | NA | NA | NA | NA | NA | NA | NA | NA | NA | NA | NA | NA | NA | NA | NA |
| 2023-12-31 | 2023-09-30 | 2023-06-30 | 2023-03-31 | 2022-12-31 | 2022-09-30 | 2022-06-30 | 2022-03-31 | 2021-12-31 | 2021-09-30 | 2021-06-30 | 2021-03-31 | 2020-12-31 | 2020-09-30 | 2020-06-30 | 2020-03-31 | 2019-12-31 | 2019-09-30 | 2019-06-30 | 2019-03-31 | 2018-12-31 | 2018-09-30 | 2018-06-30 | 2018-03-31 | 2017-12-31 | 2017-09-30 | 2017-06-30 | 2017-03-31 | 2016-12-31 | 2016-09-30 | 2016-06-30 | 2016-03-31 | 2015-12-31 | 2015-09-30 | 2015-06-30 | 2015-03-31 | 2014-12-31 | 2014-09-30 | 2014-06-30 | 2014-03-31 | 2013-12-31 | 2013-09-30 | 2013-06-30 | 2013-03-31 | 2012-12-31 | 2012-09-30 | 2012-06-30 | 2012-03-31 | 2011-12-31 | 2011-09-30 | 2011-06-30 | 2011-03-31 | 2010-12-31 | 2010-09-30 | 2010-06-30 | 2010-03-31 | ||
|---|---|---|---|---|---|---|---|---|---|---|---|---|---|---|---|---|---|---|---|---|---|---|---|---|---|---|---|---|---|---|---|---|---|---|---|---|---|---|---|---|---|---|---|---|---|---|---|---|---|---|---|---|---|---|---|---|---|
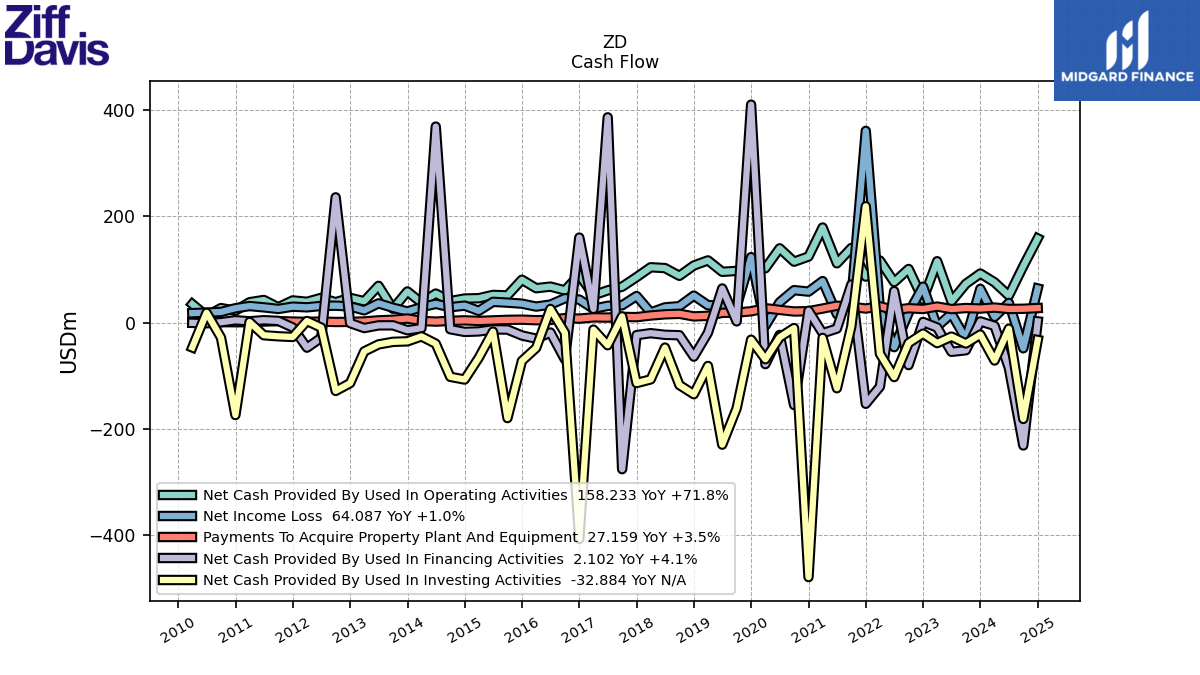
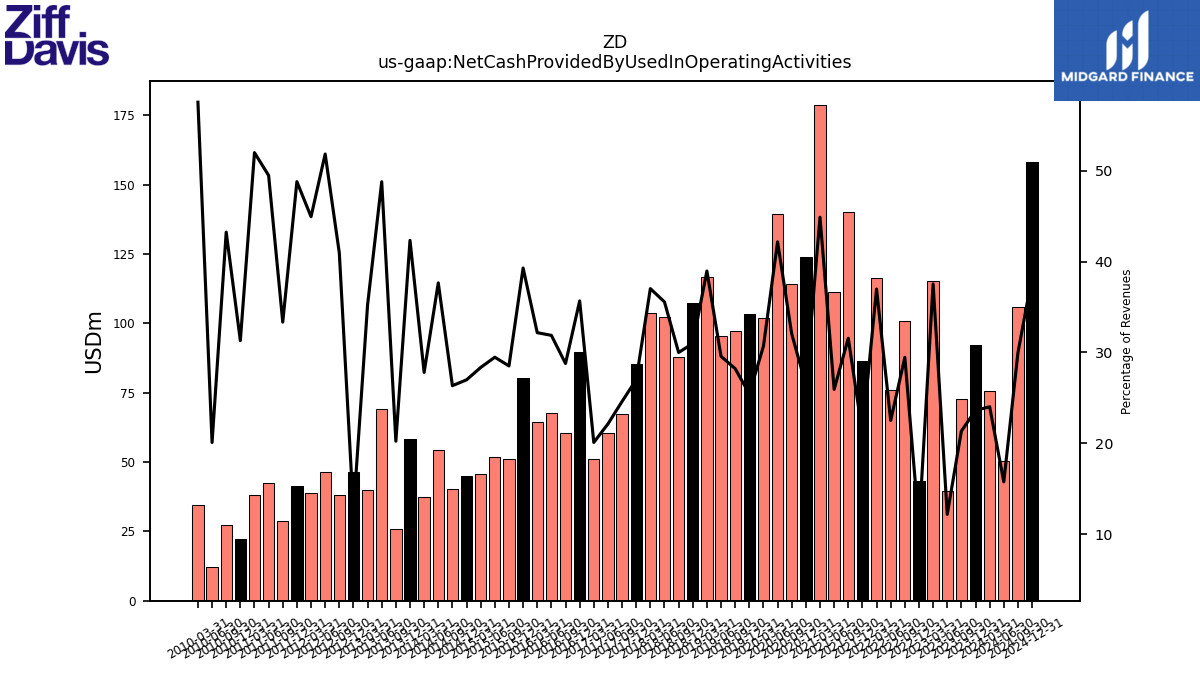
| Net Cash Provided By Used In Operating Activities | 92.12 | 72.81 | 39.73 | 115.31 | 43.23 | 100.73 | 75.97 | 116.51 | 86.28 | 140.23 | 111.30 | 178.72 | 124.07 | 114.38 | 139.59 | 102.04 | 103.23 | 97.10 | 95.36 | 116.85 | 107.21 | 87.82 | 102.38 | 103.91 | 85.42 | 67.34 | 60.46 | 51.19 | 89.85 | 60.49 | 67.53 | 64.52 | 80.49 | 50.96 | 51.89 | 45.72 | 45.11 | 40.31 | 54.51 | 37.29 | 58.44 | 25.86 | 68.97 | 40.05 | 46.39 | 38.19 | 46.38 | 38.94 | 41.52 | 28.68 | 42.40 | 38.15 | 22.23 | 27.15 | 12.32 | 34.69 | |
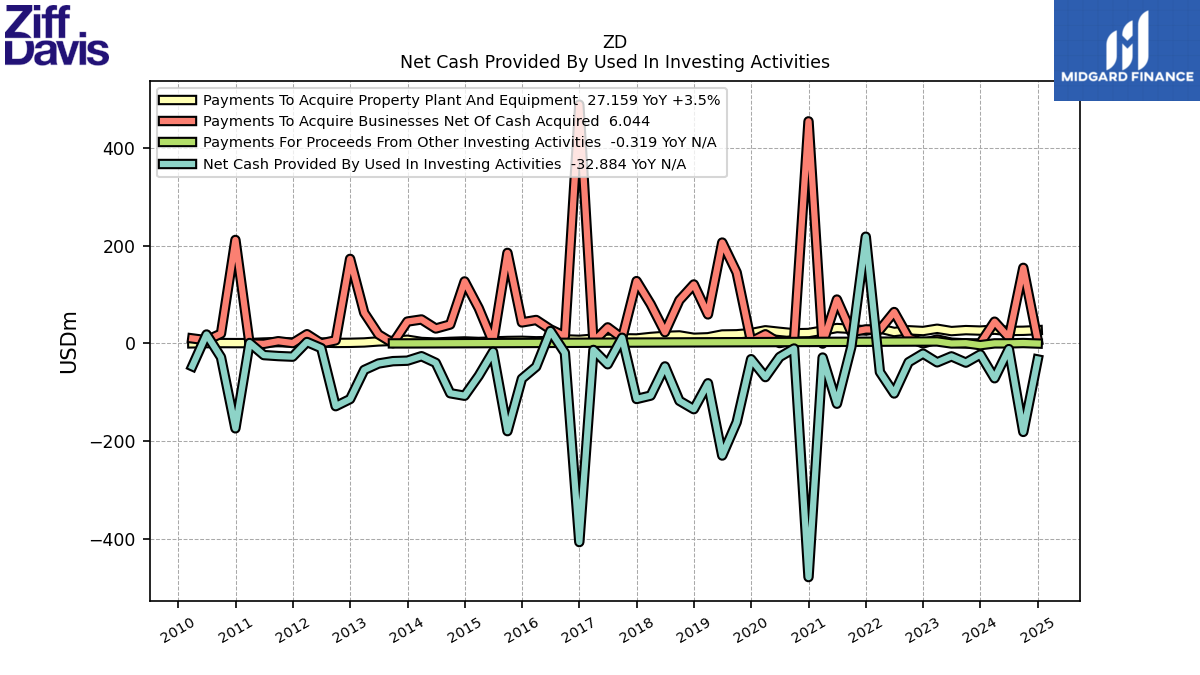
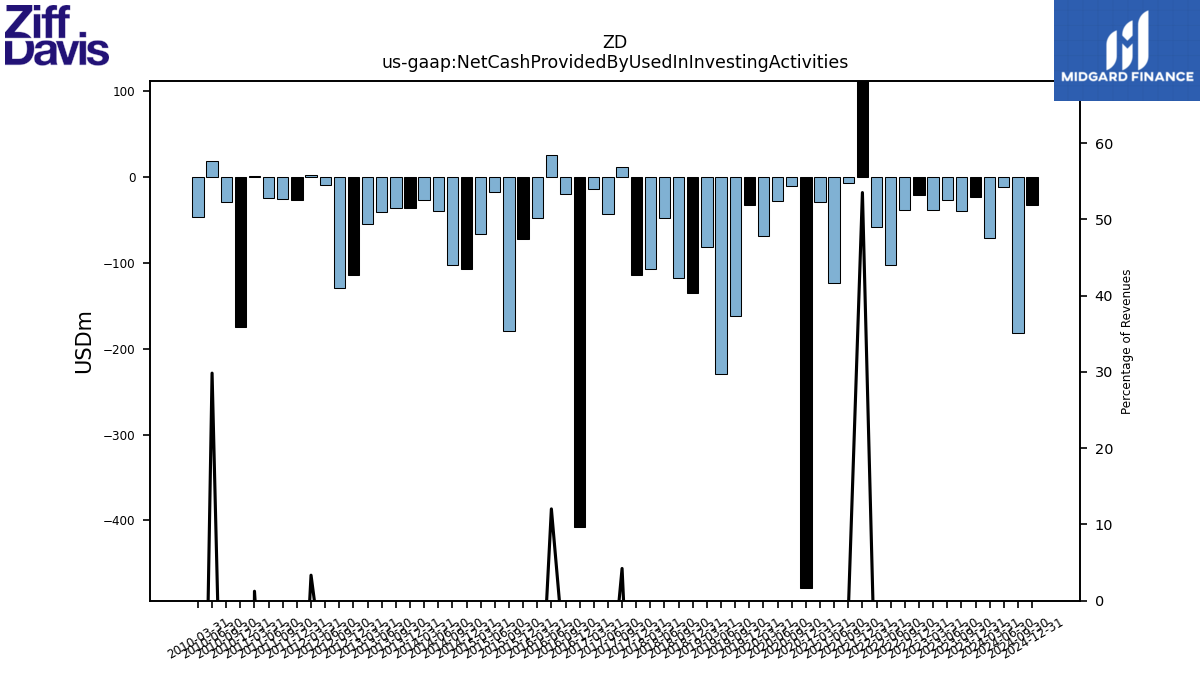
| Net Cash Provided By Used In Investing Activities | -22.67 | -39.42 | -26.53 | -38.79 | -20.91 | -38.56 | -102.66 | -58.64 | 218.66 | -6.96 | -123.66 | -28.96 | -478.93 | -10.42 | -27.81 | -69.06 | -32.34 | -161.47 | -229.79 | -81.66 | -134.88 | -117.61 | -47.16 | -106.97 | -113.92 | 11.58 | -42.78 | -13.37 | -407.17 | -19.39 | 25.50 | -47.80 | -72.38 | -179.83 | -17.17 | -66.32 | -107.27 | -102.14 | -39.84 | -26.22 | -35.41 | -36.38 | -41.20 | -54.41 | -114.09 | -128.68 | -9.62 | 2.90 | -27.18 | -25.95 | -23.96 | 0.91 | -174.11 | -28.42 | 18.29 | -46.89 | |
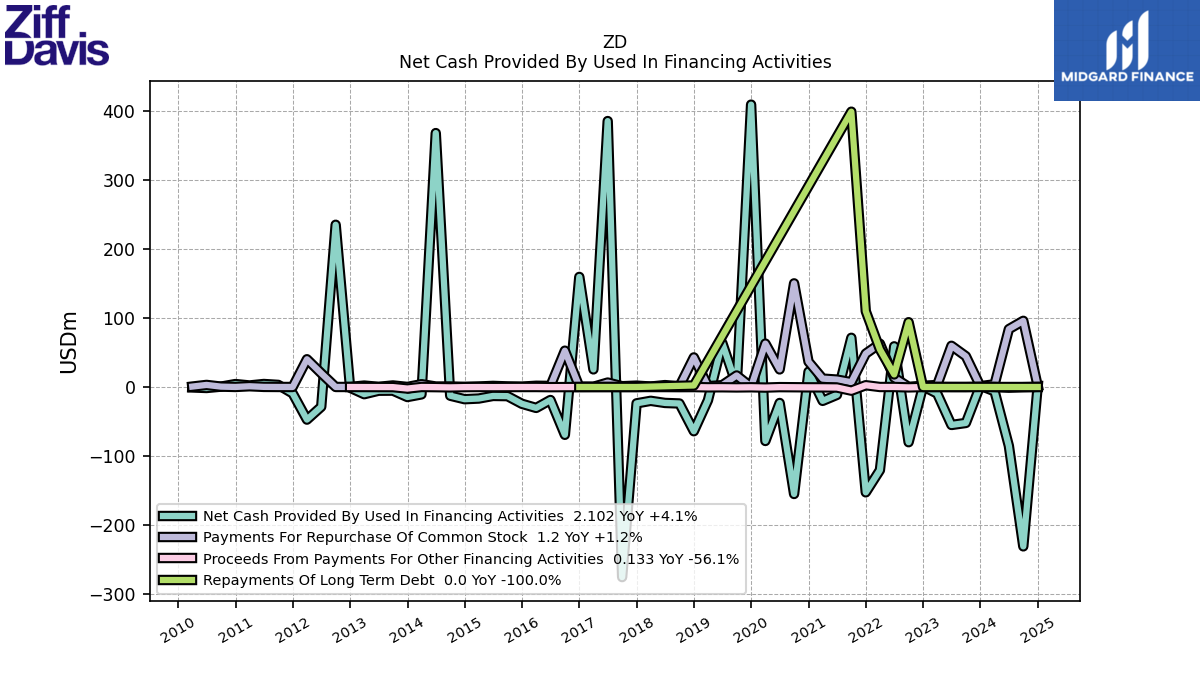
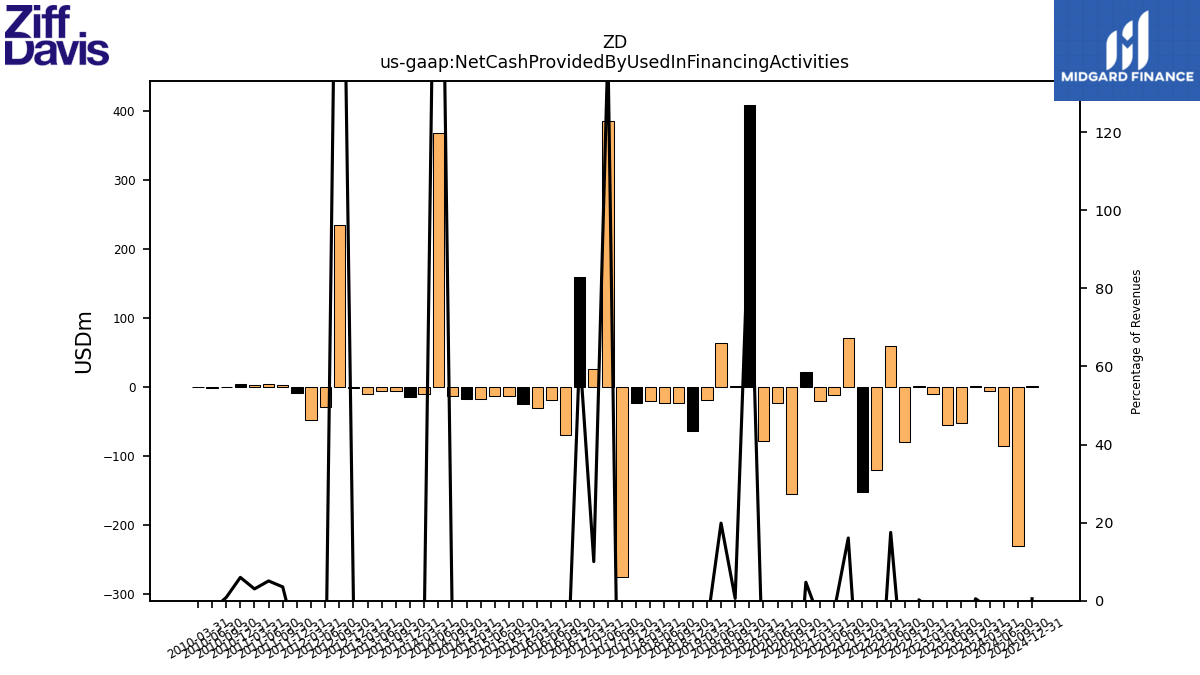
| Net Cash Provided By Used In Financing Activities | 2.02 | -52.20 | -55.13 | -9.48 | 1.00 | -80.15 | 59.03 | -120.71 | -152.93 | 71.43 | -11.45 | -20.14 | 22.22 | -155.31 | -23.19 | -78.36 | 409.84 | 2.05 | 64.08 | -19.28 | -64.21 | -23.93 | -23.14 | -20.08 | -23.74 | -275.96 | 385.99 | 25.53 | 159.80 | -69.42 | -18.85 | -30.38 | -24.37 | -13.26 | -12.97 | -16.76 | -17.71 | -12.64 | 368.59 | -10.71 | -14.54 | -5.29 | -5.42 | -10.44 | -1.05 | 235.49 | -28.70 | -47.34 | -9.28 | 3.05 | 4.35 | 2.23 | 4.25 | 0.53 | -1.44 | -0.66 |
| 2023-12-31 | 2023-09-30 | 2023-06-30 | 2023-03-31 | 2022-12-31 | 2022-09-30 | 2022-06-30 | 2022-03-31 | 2021-12-31 | 2021-09-30 | 2021-06-30 | 2021-03-31 | 2020-12-31 | 2020-09-30 | 2020-06-30 | 2020-03-31 | 2019-12-31 | 2019-09-30 | 2019-06-30 | 2019-03-31 | 2018-12-31 | 2018-09-30 | 2018-06-30 | 2018-03-31 | 2017-12-31 | 2017-09-30 | 2017-06-30 | 2017-03-31 | 2016-12-31 | 2016-09-30 | 2016-06-30 | 2016-03-31 | 2015-12-31 | 2015-09-30 | 2015-06-30 | 2015-03-31 | 2014-12-31 | 2014-09-30 | 2014-06-30 | 2014-03-31 | 2013-12-31 | 2013-09-30 | 2013-06-30 | 2013-03-31 | 2012-12-31 | 2012-09-30 | 2012-06-30 | 2012-03-31 | 2011-12-31 | 2011-09-30 | 2011-06-30 | 2011-03-31 | 2010-12-31 | 2010-09-30 | 2010-06-30 | 2010-03-31 | ||
|---|---|---|---|---|---|---|---|---|---|---|---|---|---|---|---|---|---|---|---|---|---|---|---|---|---|---|---|---|---|---|---|---|---|---|---|---|---|---|---|---|---|---|---|---|---|---|---|---|---|---|---|---|---|---|---|---|---|
| Net Cash Provided By Used In Operating Activities | 92.12 | 72.81 | 39.73 | 115.31 | 43.23 | 100.73 | 75.97 | 116.51 | 86.28 | 140.23 | 111.30 | 178.72 | 124.07 | 114.38 | 139.59 | 102.04 | 103.23 | 97.10 | 95.36 | 116.85 | 107.21 | 87.82 | 102.38 | 103.91 | 85.42 | 67.34 | 60.46 | 51.19 | 89.85 | 60.49 | 67.53 | 64.52 | 80.49 | 50.96 | 51.89 | 45.72 | 45.11 | 40.31 | 54.51 | 37.29 | 58.44 | 25.86 | 68.97 | 40.05 | 46.39 | 38.19 | 46.38 | 38.94 | 41.52 | 28.68 | 42.40 | 38.15 | 22.23 | 27.15 | 12.32 | 34.69 | |
| Net Income Loss | 63.42 | -30.97 | 16.68 | -7.63 | 67.47 | 18.18 | -46.44 | 24.54 | 360.51 | 42.57 | 15.72 | 77.92 | 58.09 | 60.88 | 38.10 | -6.40 | 123.02 | 30.75 | 32.59 | 32.45 | 50.61 | 30.72 | 28.48 | 18.87 | 49.87 | 32.36 | 31.38 | 25.82 | 43.16 | 45.57 | 33.77 | 29.94 | 35.47 | 37.38 | 38.92 | 21.88 | 31.76 | 28.76 | 35.05 | 28.77 | 20.75 | 27.81 | 36.04 | 22.92 | 30.20 | 31.65 | 31.19 | 28.54 | 29.82 | 25.50 | 28.51 | 30.93 | 26.87 | 19.83 | 18.71 | 17.64 | |
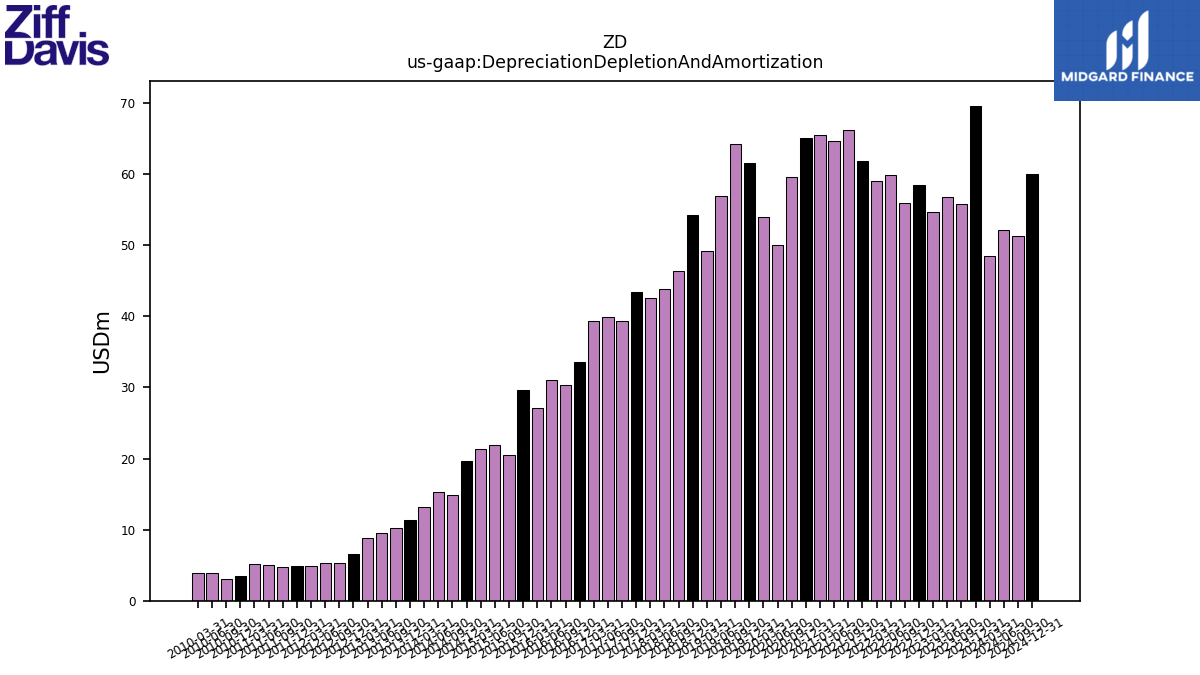
| Depreciation Depletion And Amortization | 69.63 | 55.85 | 56.86 | 54.62 | 58.52 | 55.94 | 59.87 | 59.07 | 61.86 | 66.22 | 64.73 | 65.49 | 65.06 | 59.61 | 50.09 | 53.98 | 61.62 | 64.20 | 57.00 | 49.21 | 54.32 | 46.38 | 43.86 | 42.62 | 43.44 | 39.37 | 39.90 | 39.32 | 33.52 | 30.34 | 31.06 | 27.17 | 29.58 | 20.45 | 21.89 | 21.29 | 19.65 | 14.85 | 15.32 | 13.14 | 11.36 | 10.18 | 9.48 | 8.76 | 6.61 | 5.36 | 5.27 | 4.93 | 4.86 | 4.81 | 4.97 | 5.11 | 3.54 | 3.08 | 3.93 | 3.97 | |
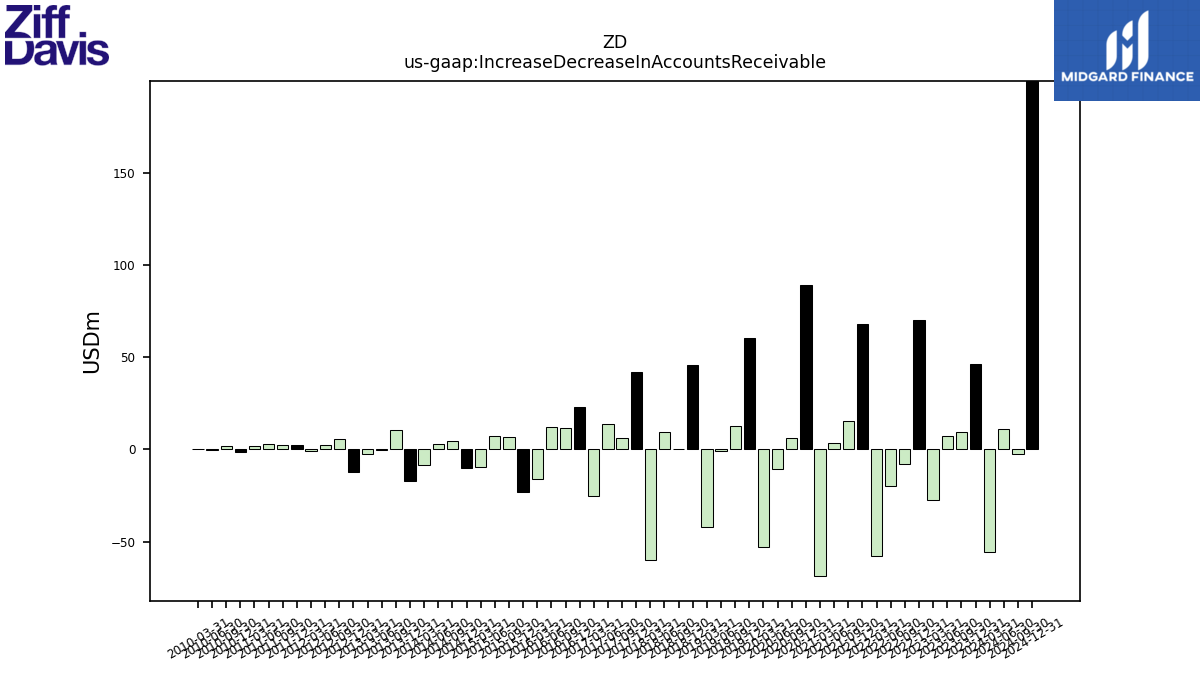
| Increase Decrease In Accounts Receivable | 46.41 | 9.43 | 7.16 | -27.63 | 70.17 | -7.95 | -19.68 | -57.48 | 67.94 | 15.42 | 3.25 | -68.56 | 89.17 | 6.12 | -10.73 | -52.95 | 60.63 | 12.98 | -1.00 | -41.93 | 45.90 | 0.37 | 9.34 | -59.65 | 42.26 | 6.48 | 13.91 | -25.11 | 23.06 | 11.39 | 12.01 | -15.77 | -22.80 | 6.50 | 7.05 | -9.25 | -9.81 | 4.42 | 2.76 | -8.45 | -17.08 | 10.38 | -0.39 | -2.50 | -12.45 | 5.72 | 2.25 | -0.94 | 2.44 | 2.24 | 3.15 | 1.68 | -1.11 | 1.69 | -0.41 | 0.08 | |
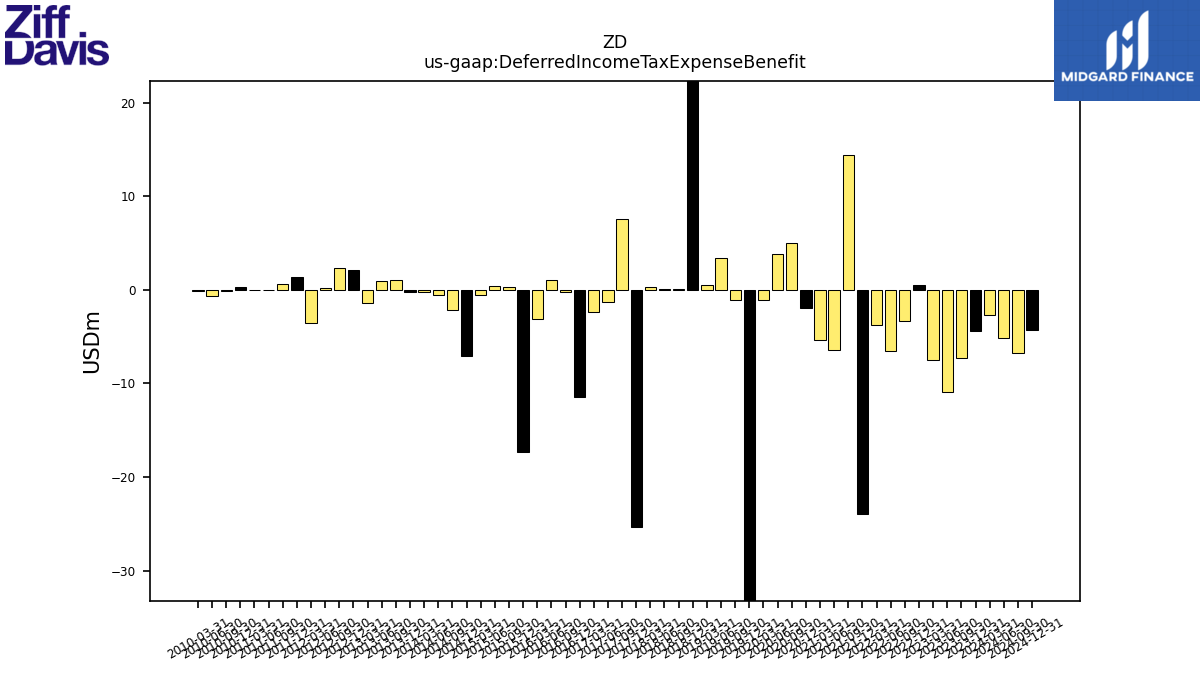
| Deferred Income Tax Expense Benefit | -4.36 | -7.33 | -10.89 | -7.44 | 0.56 | -3.29 | -6.52 | -3.75 | -23.98 | 14.39 | -6.47 | -5.38 | -1.98 | 5.06 | 3.86 | -1.11 | -66.29 | -1.06 | 3.36 | 0.55 | 24.49 | 0.11 | 0.10 | 0.35 | -25.29 | 7.54 | -1.32 | -2.36 | -11.45 | -0.26 | 1.04 | -3.10 | -17.30 | 0.29 | 0.42 | -0.49 | -7.08 | -2.17 | -0.57 | -0.21 | -0.22 | 1.01 | 0.90 | -1.45 | 2.16 | 2.29 | 0.19 | -3.50 | 1.43 | 0.60 | -0.01 | -0.05 | 0.27 | -0.10 | -0.61 | -0.11 | |
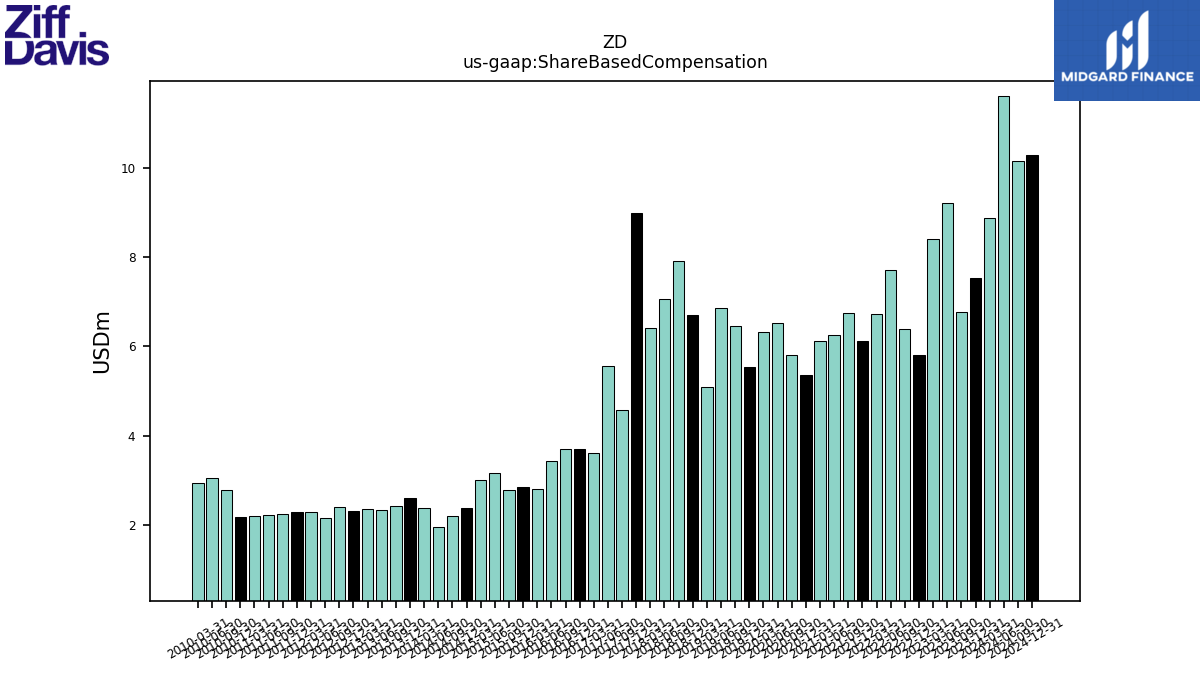
| Share Based Compensation | 7.53 | 6.77 | 9.22 | 8.40 | 5.79 | 6.39 | 7.70 | 6.72 | 6.13 | 6.76 | 6.25 | 6.11 | 5.36 | 5.80 | 6.53 | 6.31 | 5.53 | 6.45 | 6.86 | 5.09 | 6.70 | 7.91 | 7.07 | 6.42 | 9.00 | 4.56 | 5.56 | 3.61 | 3.70 | 3.70 | 3.44 | 2.81 | 2.85 | 2.77 | 3.17 | 3.00 | 2.37 | 2.19 | 1.96 | 2.38 | 2.61 | 2.42 | 2.33 | 2.35 | 2.32 | 2.39 | 2.15 | 2.28 | 2.30 | 2.24 | 2.23 | 2.21 | 2.17 | 2.78 | 3.05 | 2.94 |
| 2023-12-31 | 2023-09-30 | 2023-06-30 | 2023-03-31 | 2022-12-31 | 2022-09-30 | 2022-06-30 | 2022-03-31 | 2021-12-31 | 2021-09-30 | 2021-06-30 | 2021-03-31 | 2020-12-31 | 2020-09-30 | 2020-06-30 | 2020-03-31 | 2019-12-31 | 2019-09-30 | 2019-06-30 | 2019-03-31 | 2018-12-31 | 2018-09-30 | 2018-06-30 | 2018-03-31 | 2017-12-31 | 2017-09-30 | 2017-06-30 | 2017-03-31 | 2016-12-31 | 2016-09-30 | 2016-06-30 | 2016-03-31 | 2015-12-31 | 2015-09-30 | 2015-06-30 | 2015-03-31 | 2014-12-31 | 2014-09-30 | 2014-06-30 | 2014-03-31 | 2013-12-31 | 2013-09-30 | 2013-06-30 | 2013-03-31 | 2012-12-31 | 2012-09-30 | 2012-06-30 | 2012-03-31 | 2011-12-31 | 2011-09-30 | 2011-06-30 | 2011-03-31 | 2010-12-31 | 2010-09-30 | 2010-06-30 | 2010-03-31 | ||
|---|---|---|---|---|---|---|---|---|---|---|---|---|---|---|---|---|---|---|---|---|---|---|---|---|---|---|---|---|---|---|---|---|---|---|---|---|---|---|---|---|---|---|---|---|---|---|---|---|---|---|---|---|---|---|---|---|---|
| Net Cash Provided By Used In Investing Activities | -22.67 | -39.42 | -26.53 | -38.79 | -20.91 | -38.56 | -102.66 | -58.64 | 218.66 | -6.96 | -123.66 | -28.96 | -478.93 | -10.42 | -27.81 | -69.06 | -32.34 | -161.47 | -229.79 | -81.66 | -134.88 | -117.61 | -47.16 | -106.97 | -113.92 | 11.58 | -42.78 | -13.37 | -407.17 | -19.39 | 25.50 | -47.80 | -72.38 | -179.83 | -17.17 | -66.32 | -107.27 | -102.14 | -39.84 | -26.22 | -35.41 | -36.38 | -41.20 | -54.41 | -114.09 | -128.68 | -9.62 | 2.90 | -27.18 | -25.95 | -23.96 | 0.91 | -174.11 | -28.42 | 18.29 | -46.89 | |
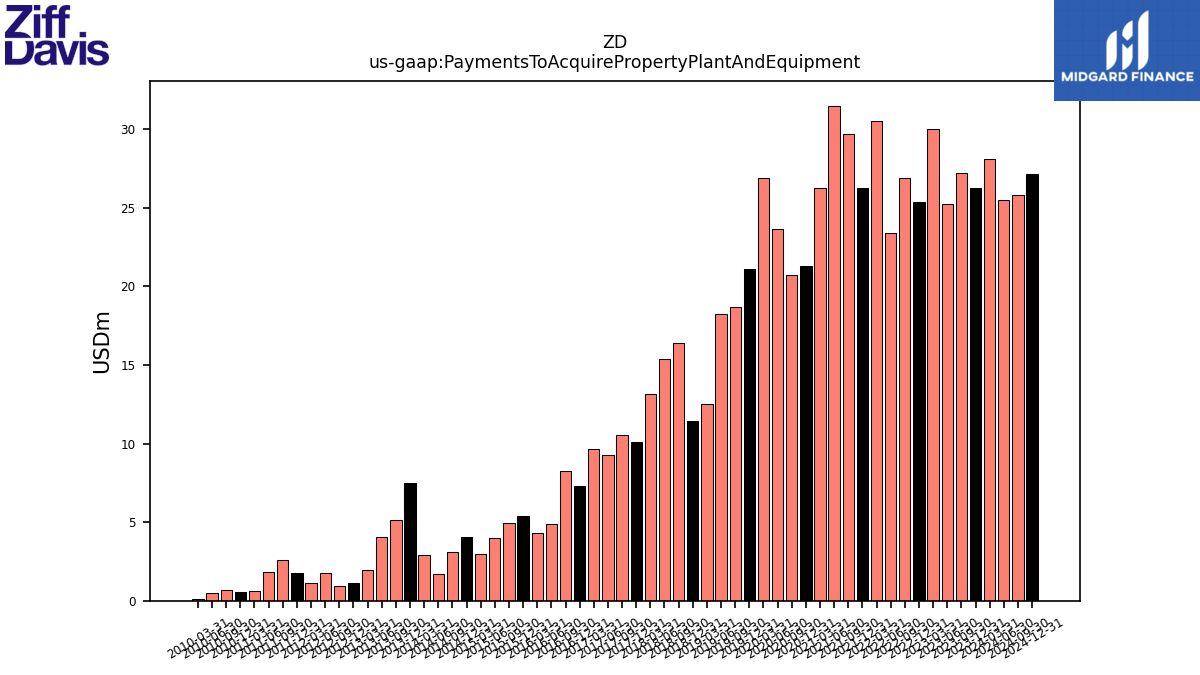
| Payments To Acquire Property Plant And Equipment | 26.25 | 27.23 | 25.23 | 30.02 | 25.39 | 26.89 | 23.37 | 30.50 | 26.25 | 29.73 | 31.50 | 26.27 | 21.29 | 20.73 | 23.65 | 26.89 | 21.11 | 18.69 | 18.26 | 12.53 | 11.45 | 16.37 | 15.39 | 13.16 | 10.11 | 10.54 | 9.29 | 9.66 | 7.30 | 8.26 | 4.87 | 4.32 | 5.37 | 4.97 | 4.00 | 2.96 | 4.07 | 3.12 | 1.70 | 2.94 | 7.51 | 5.13 | 4.06 | 1.93 | 1.16 | 0.97 | 1.78 | 1.16 | 1.77 | 2.59 | 1.86 | 0.62 | 0.57 | 0.69 | 0.49 | 0.09 |
| 2023-12-31 | 2023-09-30 | 2023-06-30 | 2023-03-31 | 2022-12-31 | 2022-09-30 | 2022-06-30 | 2022-03-31 | 2021-12-31 | 2021-09-30 | 2021-06-30 | 2021-03-31 | 2020-12-31 | 2020-09-30 | 2020-06-30 | 2020-03-31 | 2019-12-31 | 2019-09-30 | 2019-06-30 | 2019-03-31 | 2018-12-31 | 2018-09-30 | 2018-06-30 | 2018-03-31 | 2017-12-31 | 2017-09-30 | 2017-06-30 | 2017-03-31 | 2016-12-31 | 2016-09-30 | 2016-06-30 | 2016-03-31 | 2015-12-31 | 2015-09-30 | 2015-06-30 | 2015-03-31 | 2014-12-31 | 2014-09-30 | 2014-06-30 | 2014-03-31 | 2013-12-31 | 2013-09-30 | 2013-06-30 | 2013-03-31 | 2012-12-31 | 2012-09-30 | 2012-06-30 | 2012-03-31 | 2011-12-31 | 2011-09-30 | 2011-06-30 | 2011-03-31 | 2010-12-31 | 2010-09-30 | 2010-06-30 | 2010-03-31 | ||
|---|---|---|---|---|---|---|---|---|---|---|---|---|---|---|---|---|---|---|---|---|---|---|---|---|---|---|---|---|---|---|---|---|---|---|---|---|---|---|---|---|---|---|---|---|---|---|---|---|---|---|---|---|---|---|---|---|---|
| Net Cash Provided By Used In Financing Activities | 2.02 | -52.20 | -55.13 | -9.48 | 1.00 | -80.15 | 59.03 | -120.71 | -152.93 | 71.43 | -11.45 | -20.14 | 22.22 | -155.31 | -23.19 | -78.36 | 409.84 | 2.05 | 64.08 | -19.28 | -64.21 | -23.93 | -23.14 | -20.08 | -23.74 | -275.96 | 385.99 | 25.53 | 159.80 | -69.42 | -18.85 | -30.38 | -24.37 | -13.26 | -12.97 | -16.76 | -17.71 | -12.64 | 368.59 | -10.71 | -14.54 | -5.29 | -5.42 | -10.44 | -1.05 | 235.49 | -28.70 | -47.34 | -9.28 | 3.05 | 4.35 | 2.23 | 4.25 | 0.53 | -1.44 | -0.66 | |
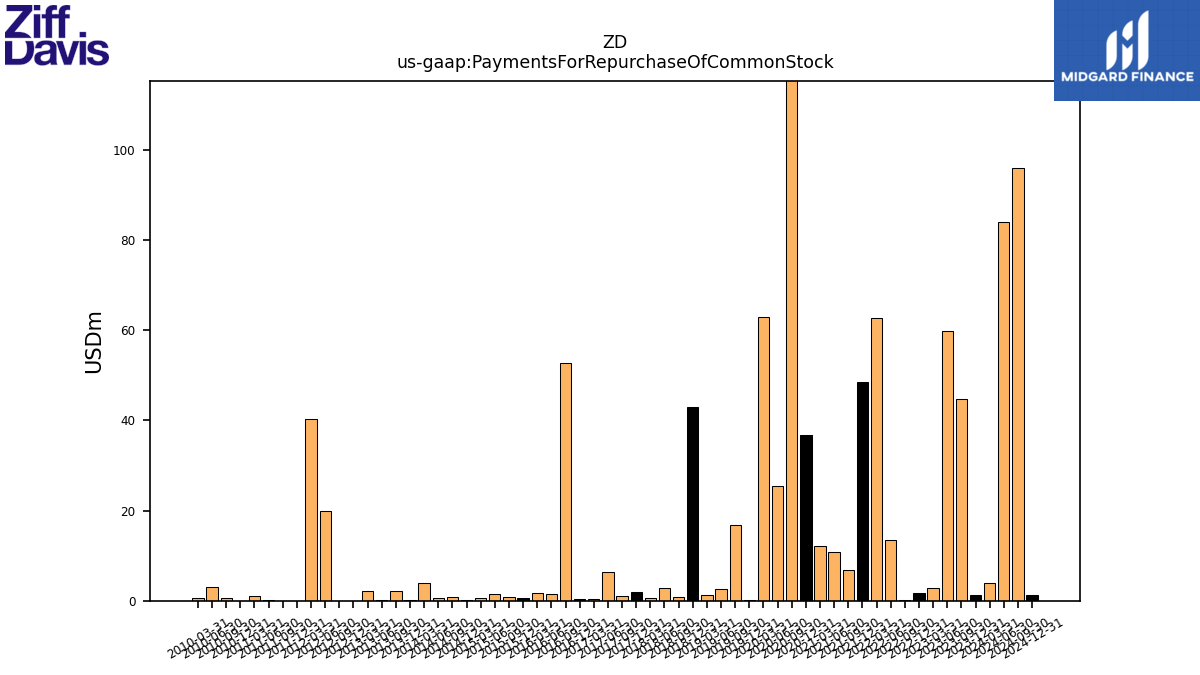
| Payments For Repurchase Of Common Stock | 1.19 | 44.66 | 59.80 | 2.88 | 1.75 | 0.20 | 13.54 | 62.81 | 48.47 | 6.92 | 10.76 | 12.18 | 36.75 | 150.44 | 25.50 | 62.97 | 0.24 | 16.75 | 2.63 | 1.18 | 42.94 | 0.81 | 2.75 | 0.61 | 1.99 | 1.12 | 6.42 | 0.31 | 0.41 | 52.73 | 1.57 | 1.79 | 0.52 | 0.86 | 1.60 | 0.70 | 0.19 | 0.74 | 0.69 | 4.04 | 0.07 | 2.25 | 0.20 | 2.07 | 0.02 | 0.04 | 19.95 | 40.27 | 0.01 | 0.03 | 0.15 | 1.09 | 0.05 | 0.55 | 3.02 | 0.61 |
| 2023-12-31 | 2023-09-30 | 2023-06-30 | 2023-03-31 | 2022-12-31 | 2022-09-30 | 2022-06-30 | 2022-03-31 | 2021-12-31 | 2021-09-30 | 2021-06-30 | 2021-03-31 | 2020-12-31 | 2020-09-30 | 2020-06-30 | 2020-03-31 | 2019-12-31 | 2019-09-30 | 2019-06-30 | 2019-03-31 | 2018-12-31 | 2018-09-30 | 2018-06-30 | 2018-03-31 | 2017-12-31 | 2017-09-30 | 2017-06-30 | 2017-03-31 | 2016-12-31 | 2016-09-30 | 2016-06-30 | 2016-03-31 | 2015-12-31 | 2015-09-30 | 2015-06-30 | 2015-03-31 | 2014-12-31 | 2014-09-30 | 2014-06-30 | 2014-03-31 | 2013-12-31 | 2013-09-30 | 2013-06-30 | 2013-03-31 | 2012-12-31 | 2012-09-30 | 2012-06-30 | 2012-03-31 | 2011-12-31 | 2011-09-30 | 2011-06-30 | 2011-03-31 | 2010-12-31 | 2010-09-30 | 2010-06-30 | 2010-03-31 | ||
|---|---|---|---|---|---|---|---|---|---|---|---|---|---|---|---|---|---|---|---|---|---|---|---|---|---|---|---|---|---|---|---|---|---|---|---|---|---|---|---|---|---|---|---|---|---|---|---|---|---|---|---|---|---|---|---|---|---|
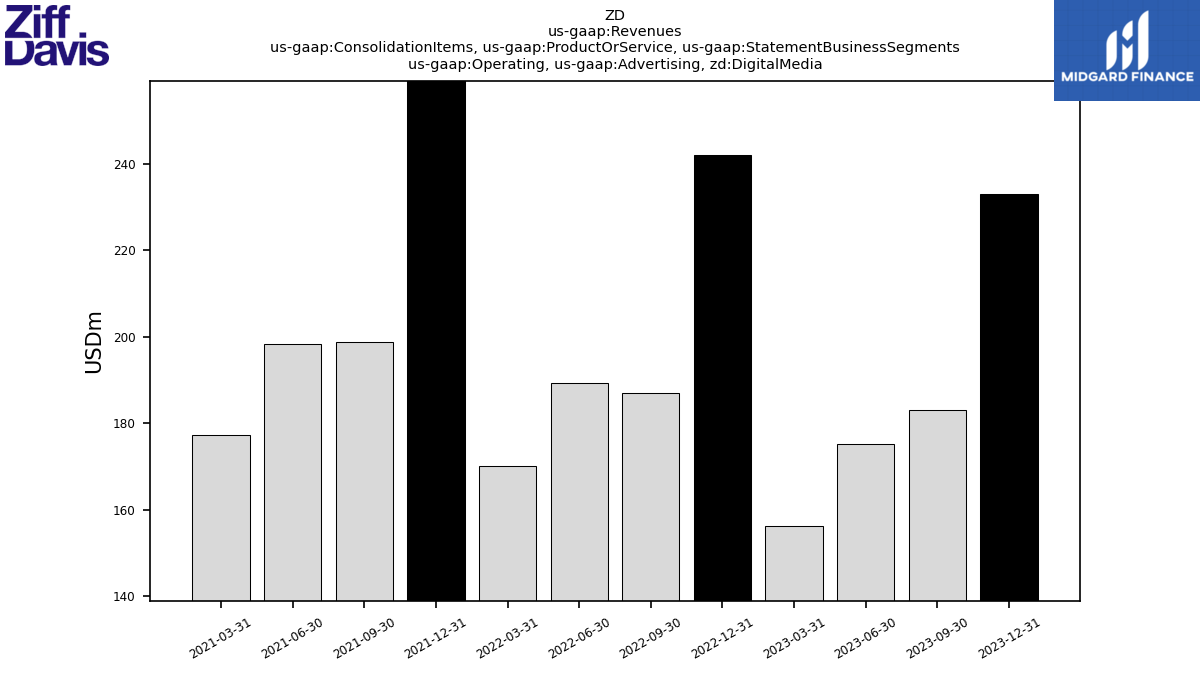
| Revenues | 389.88 | 340.99 | 326.02 | 307.14 | 396.70 | 341.87 | 337.36 | 315.07 | 408.63 | 444.25 | 429.04 | 398.19 | 469.24 | 356.98 | 330.98 | 332.39 | 405.59 | 344.14 | 322.43 | 299.89 | 346.06 | 292.72 | 287.89 | 280.62 | 316.38 | 273.62 | 273.17 | 254.67 | 251.84 | 210.12 | 211.80 | 200.50 | 204.82 | 178.70 | 176.04 | 161.25 | 167.14 | 153.02 | 144.74 | 134.12 | 138.03 | 127.79 | 141.36 | 113.62 | 371.40 | 93.25 | 89.47 | 86.65 | 85.07 | 86.03 | 85.68 | 73.38 | 71.03 | 62.78 | 61.31 | 60.28 | |
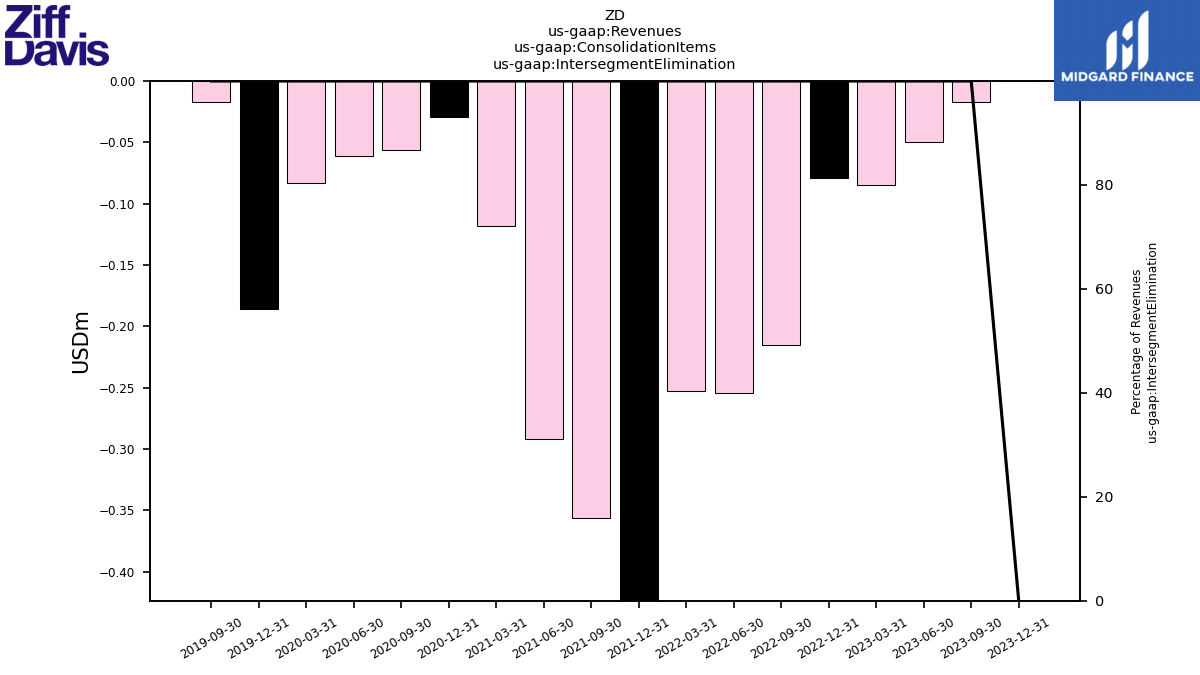
| Intersegment Elimination | 0.00 | -0.02 | -0.05 | -0.09 | -0.08 | -0.21 | -0.25 | -0.25 | -0.42 | -0.36 | -0.29 | -0.12 | -0.03 | -0.06 | -0.06 | -0.08 | -0.19 | -0.02 | NA | NA | NA | NA | NA | NA | NA | NA | NA | NA | NA | NA | NA | NA | NA | NA | NA | NA | NA | NA | NA | NA | NA | NA | NA | NA | NA | NA | NA | NA | NA | NA | NA | NA | NA | NA | NA | NA | |
| Operating, Advertising, Digital Media | 233.08 | 183.01 | 175.08 | 156.08 | 241.95 | 186.92 | 189.20 | 170.07 | 263.61 | 198.79 | 198.38 | 177.29 | NA | NA | NA | NA | NA | NA | NA | NA | NA | NA | NA | NA | NA | NA | NA | NA | NA | NA | NA | NA | NA | NA | NA | NA | NA | NA | NA | NA | NA | NA | NA | NA | NA | NA | NA | NA | NA | NA | NA | NA | NA | NA | NA | NA | |
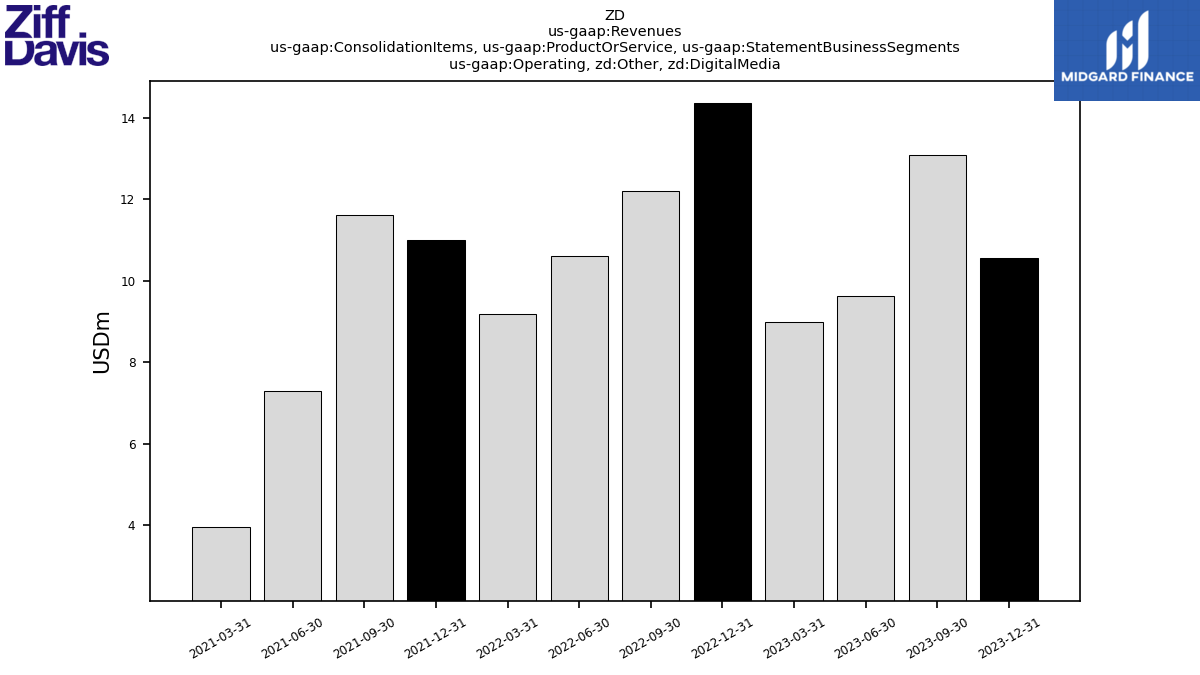
| Operating, Other, Digital Media | 10.55 | 13.09 | 9.63 | 8.98 | 14.36 | 12.20 | 10.60 | 9.18 | 10.99 | 11.62 | 7.29 | 3.96 | NA | NA | NA | NA | NA | NA | NA | NA | NA | NA | NA | NA | NA | NA | NA | NA | NA | NA | NA | NA | NA | NA | NA | NA | NA | NA | NA | NA | NA | NA | NA | NA | NA | NA | NA | NA | NA | NA | NA | NA | NA | NA | NA | NA | |
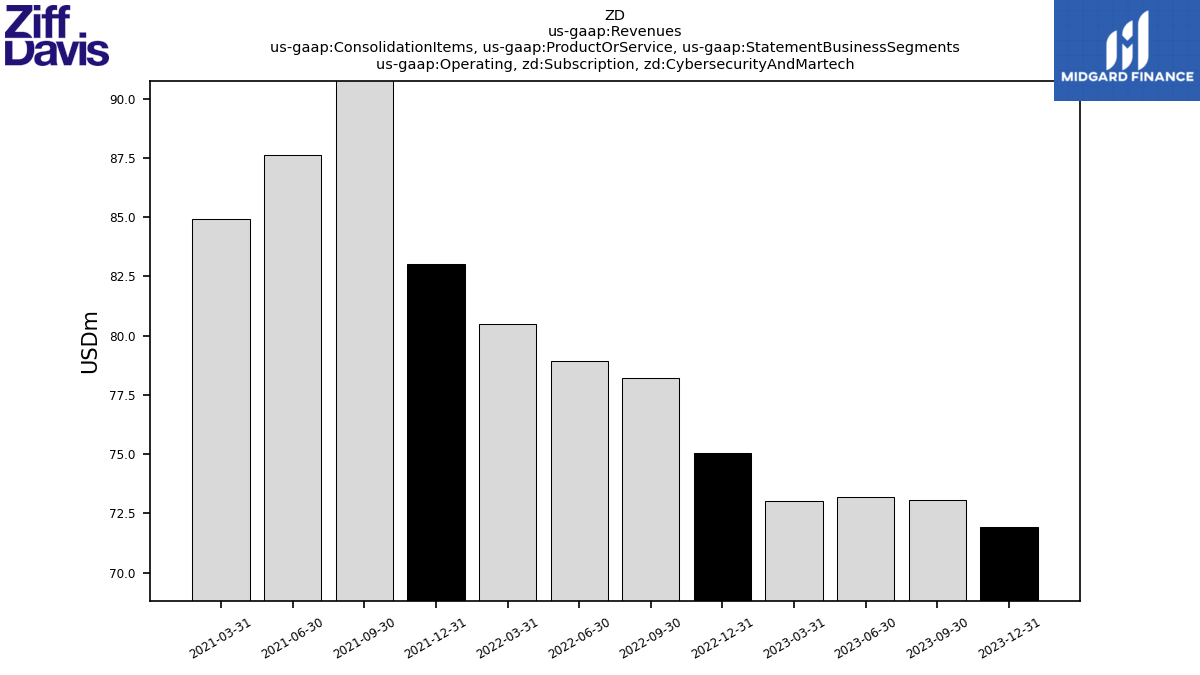
| Operating, Subscription, Cybersecurity And Martech | 71.95 | 73.05 | 73.20 | 73.02 | 75.03 | 78.19 | 78.91 | 80.49 | 83.03 | 93.07 | 87.61 | 84.90 | NA | NA | NA | NA | NA | NA | NA | NA | NA | NA | NA | NA | NA | NA | NA | NA | NA | NA | NA | NA | NA | NA | NA | NA | NA | NA | NA | NA | NA | NA | NA | NA | NA | NA | NA | NA | NA | NA | NA | NA | NA | NA | NA | NA | |
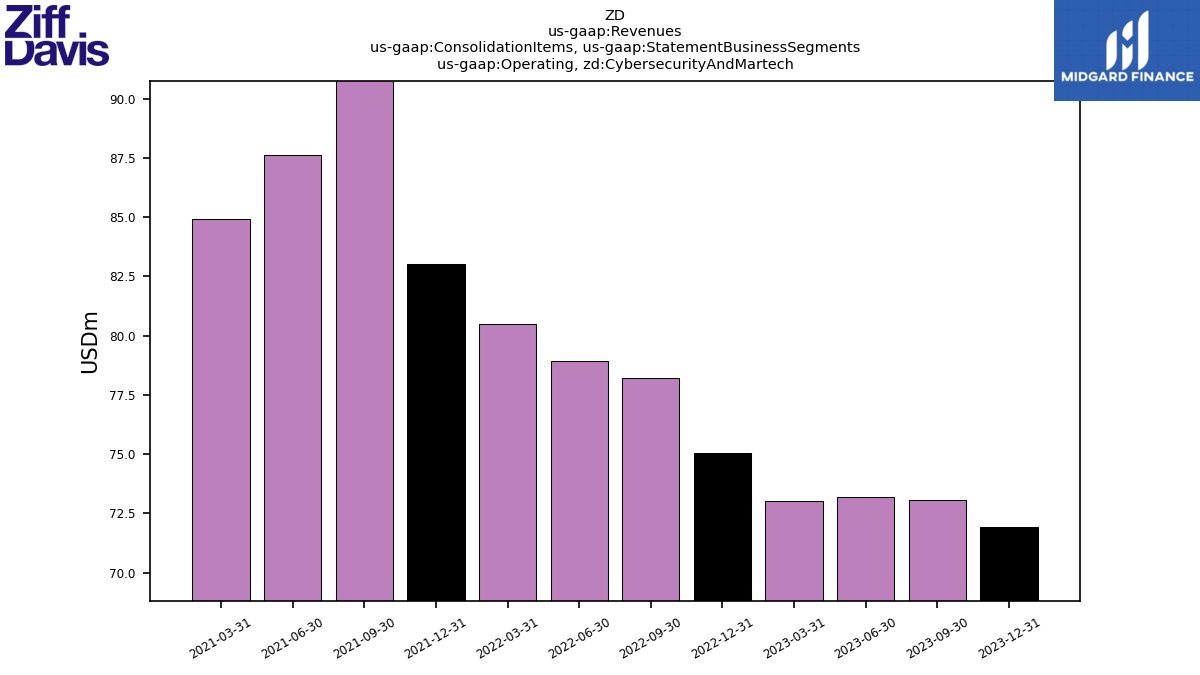
| Operating, Cybersecurity And Martech | 71.95 | 73.05 | 73.20 | 73.02 | 75.03 | 78.19 | 78.91 | 80.49 | 83.03 | 93.07 | 87.61 | 84.90 | NA | NA | NA | NA | NA | NA | NA | NA | NA | NA | NA | NA | NA | NA | NA | NA | NA | NA | NA | NA | NA | NA | NA | NA | NA | NA | NA | NA | NA | NA | NA | NA | NA | NA | NA | NA | NA | NA | NA | NA | NA | NA | NA | NA | |
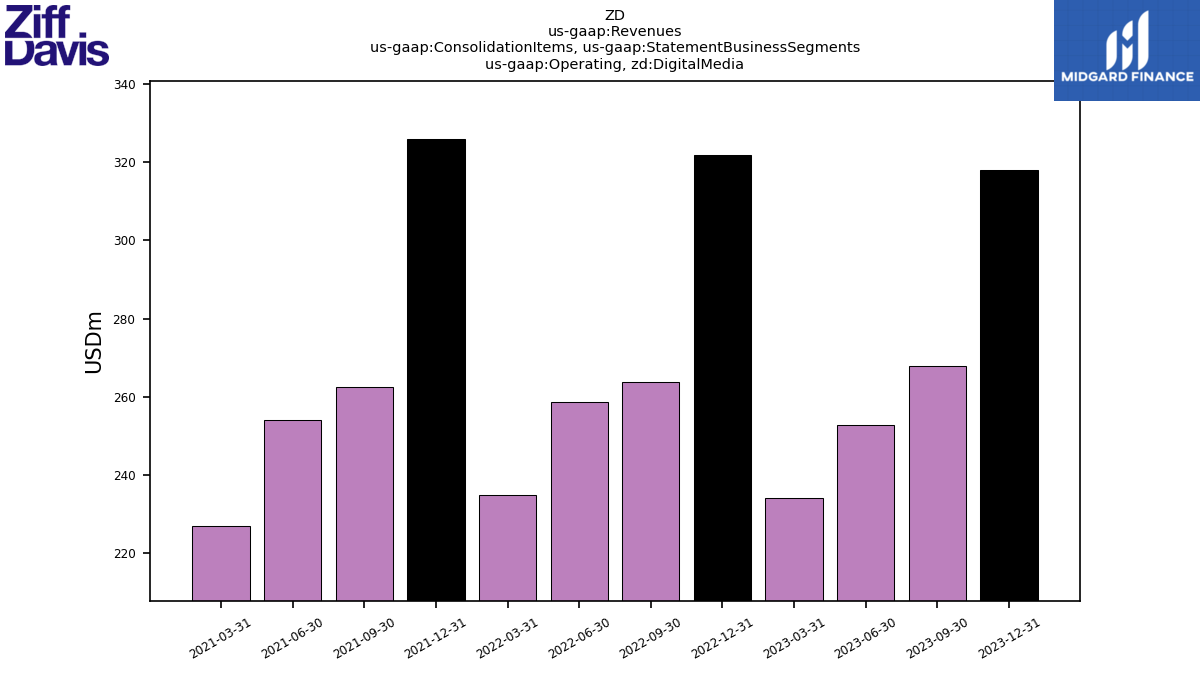
| Operating, Digital Media | 317.94 | 267.95 | 252.87 | 234.21 | 321.75 | 263.90 | 258.70 | 234.83 | 326.02 | 262.43 | 253.98 | 226.87 | NA | NA | NA | NA | NA | NA | NA | NA | NA | NA | NA | NA | NA | NA | NA | NA | NA | NA | NA | NA | NA | NA | NA | NA | NA | NA | NA | NA | NA | NA | NA | NA | NA | NA | NA | NA | NA | NA | NA | NA | NA | NA | NA | NA |