| Ticker | 10K | 10Q | 8K | Sector | Industry | Logo | Forward P/E | Revenue Growth | Ticker | Income | EPS | Revenues | Ticker | GrossProfit | OperatingIncome | LongTermDebt | Ticker | InterestExpense | RetainedEarnnings | CashFlowOperating | Ticker | Dividends | SharesOutstanding | TTMGreenblattROC | Ticker |
|---|---|---|---|---|---|---|---|---|---|---|---|---|---|---|---|---|---|---|---|---|---|---|---|---|---|
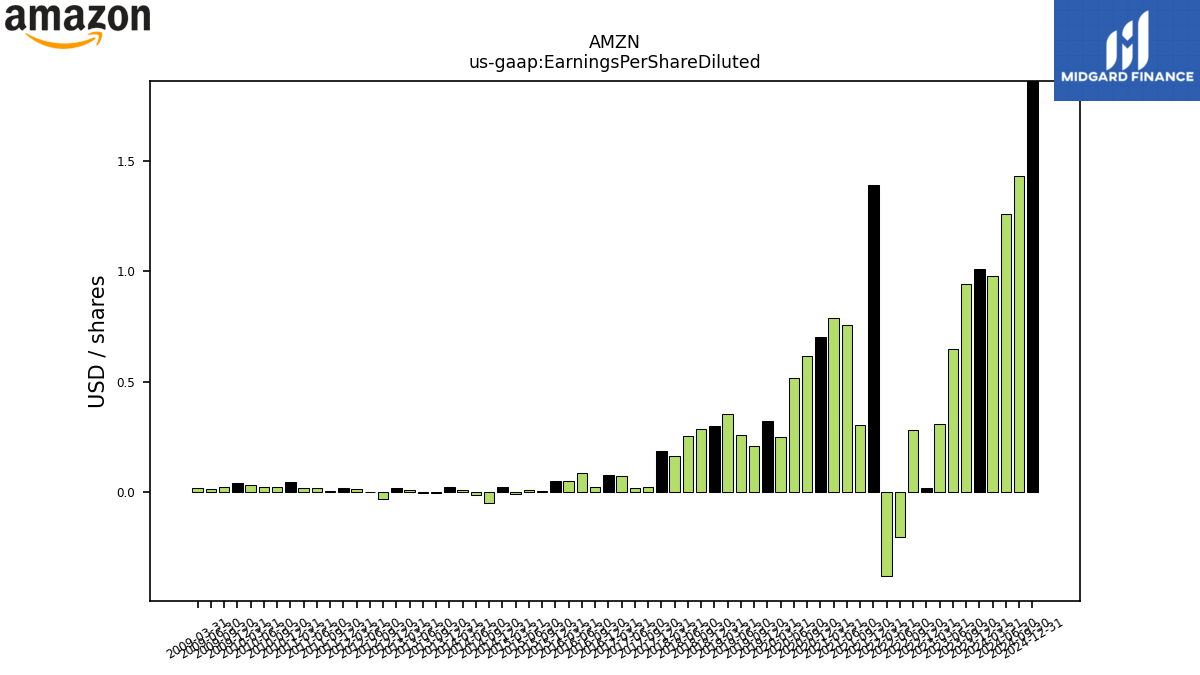
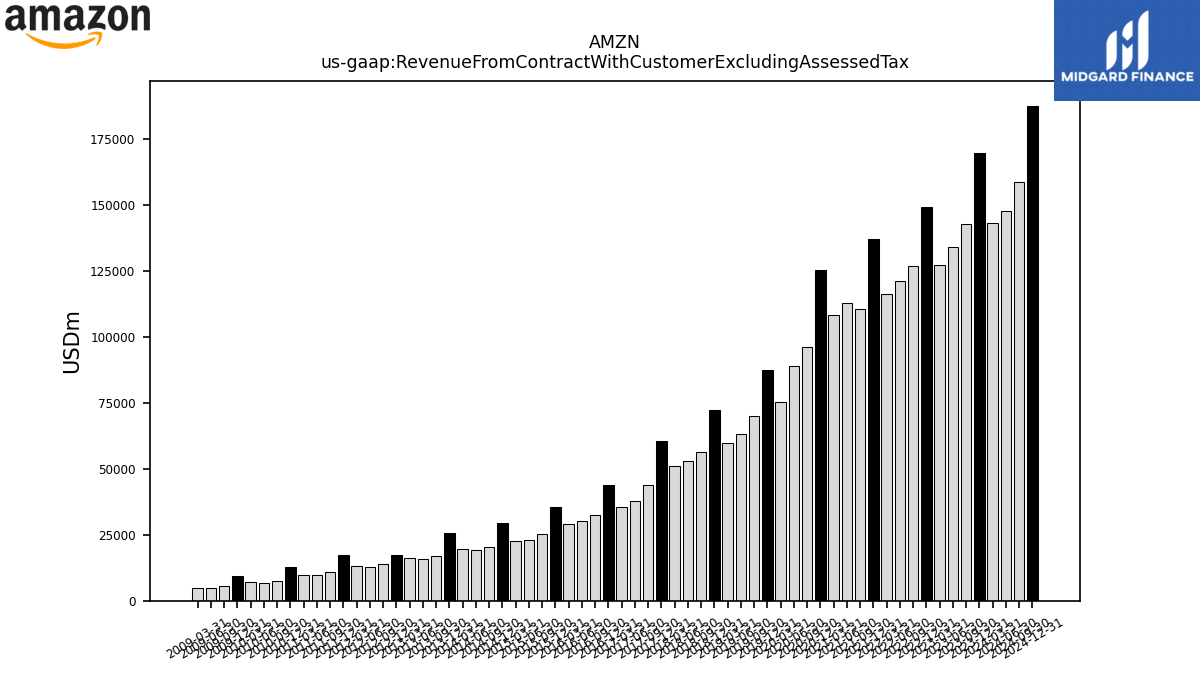
| $AMZN$ | 2025-02-07 | 2025-05-02 | 2025-05-01 | NA | NA | AMZN | 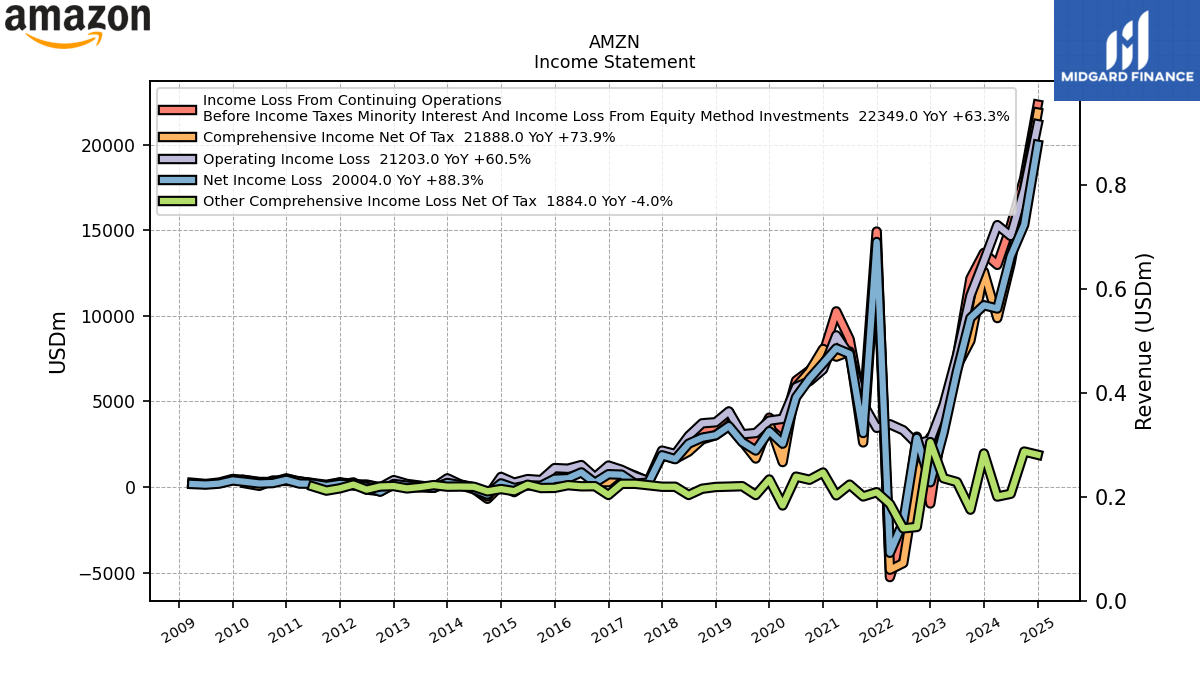 |
 |
 |
AMZN | 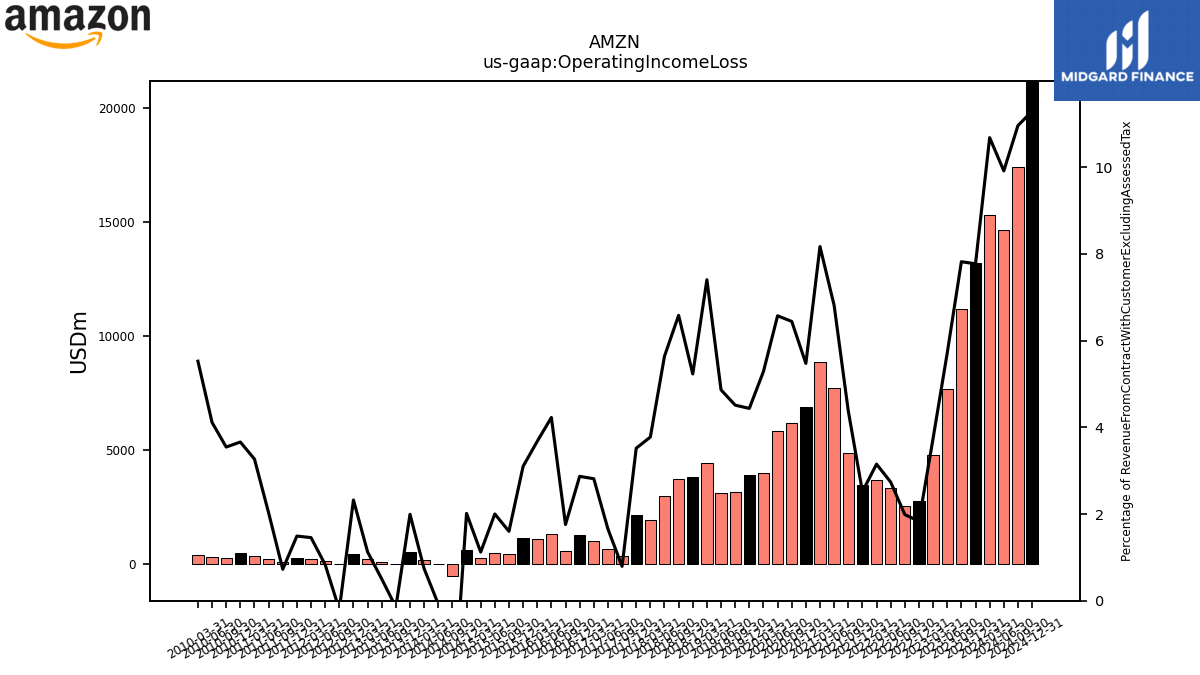 |
 |
AMZN |  |
 |
 |
AMZN | 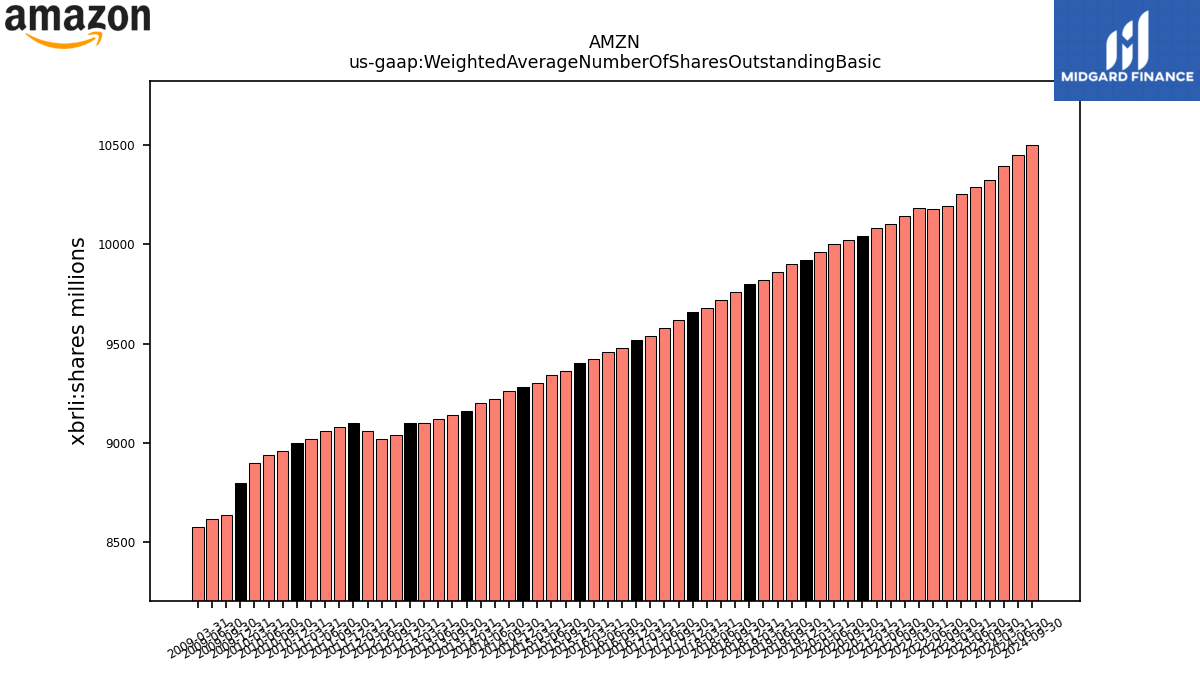 |
AMZN | ||||||
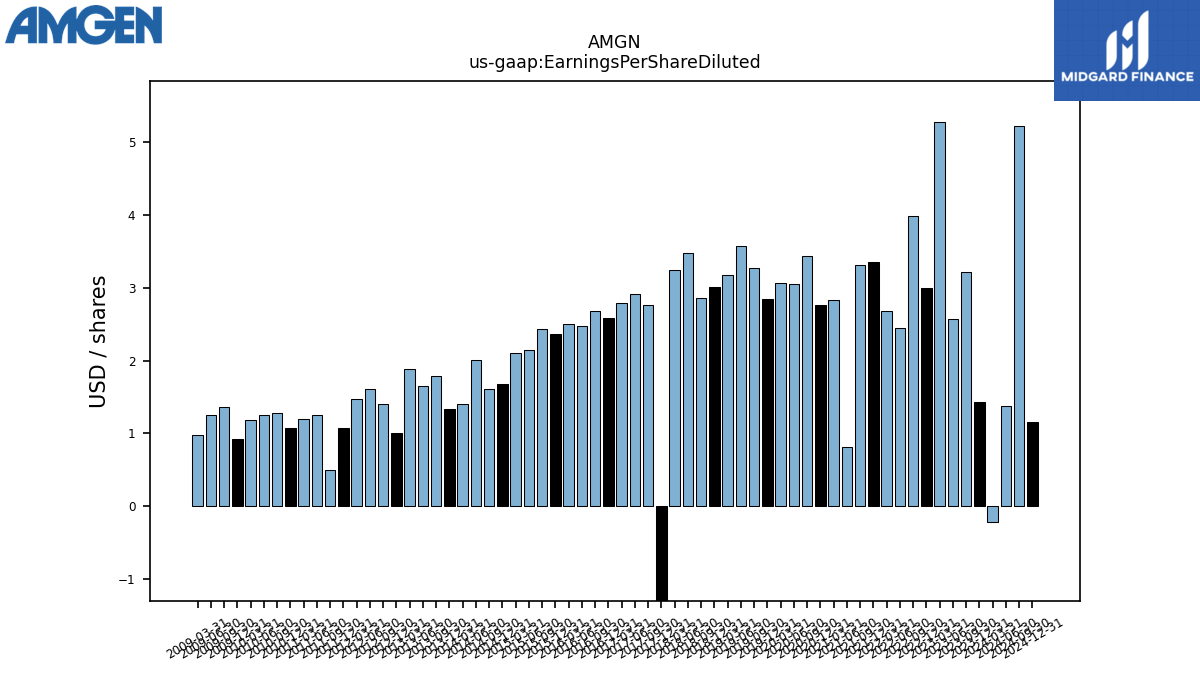
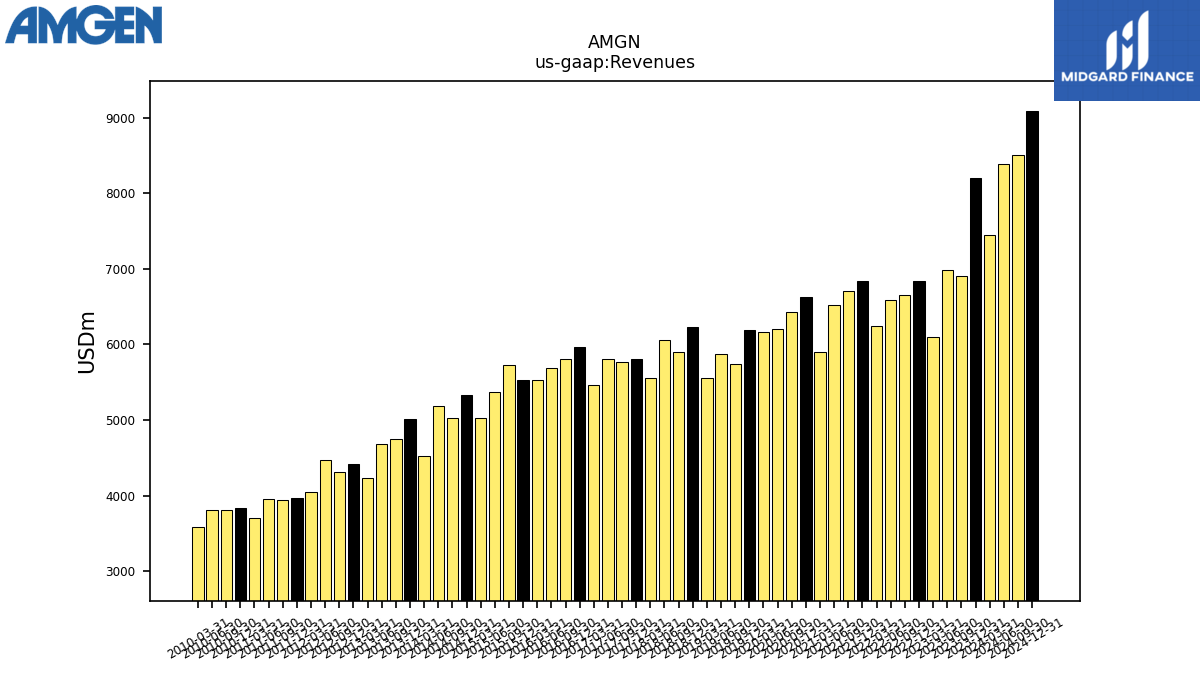
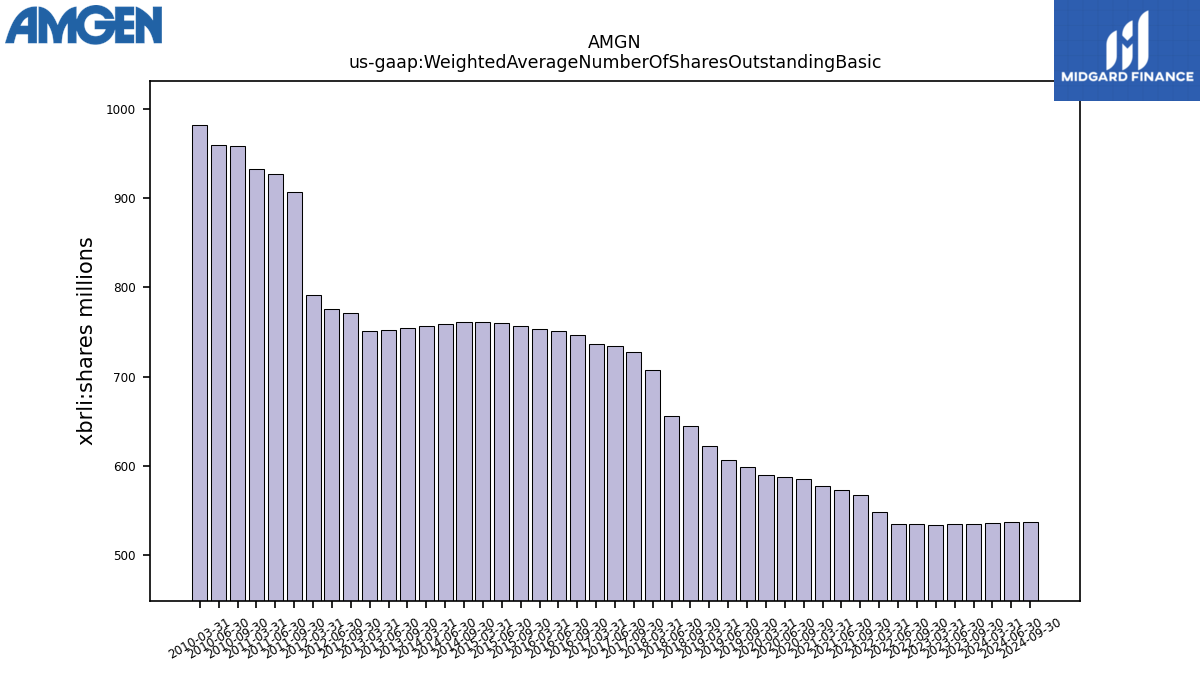
| $AMGN$ | 2025-02-14 | 2025-05-02 | 2025-05-01 |  |
NA | NA | AMGN | 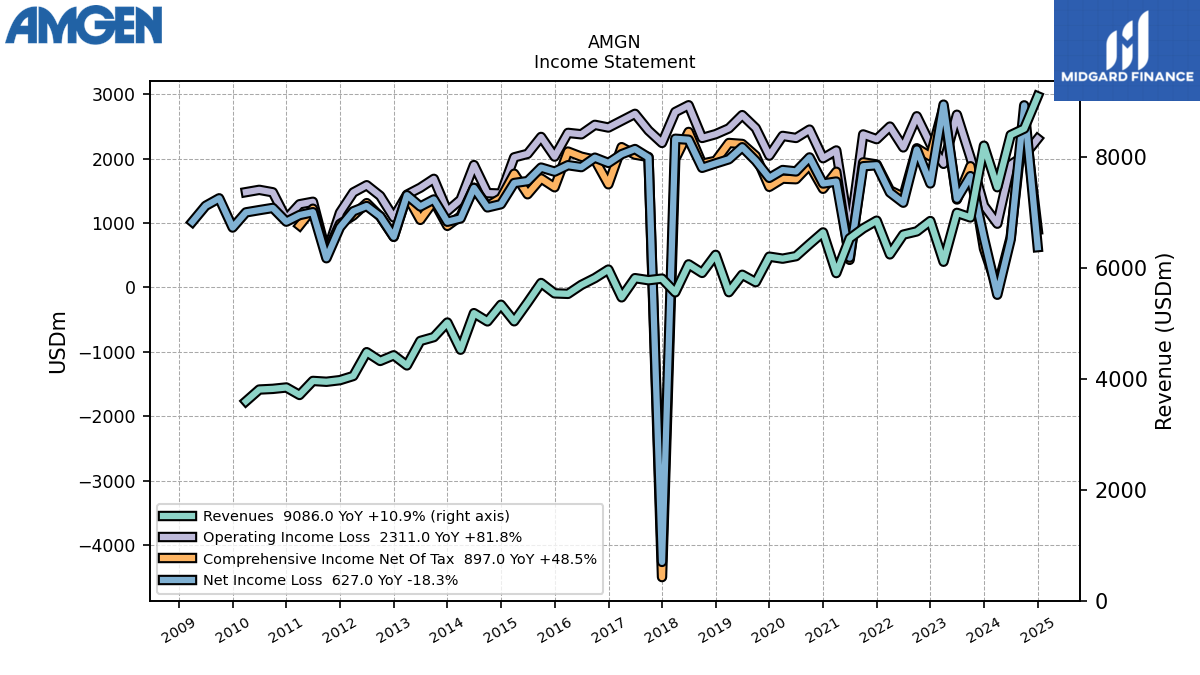 |
 |
 |
AMGN |  |
 |
AMGN |  |
 |
AMGN | 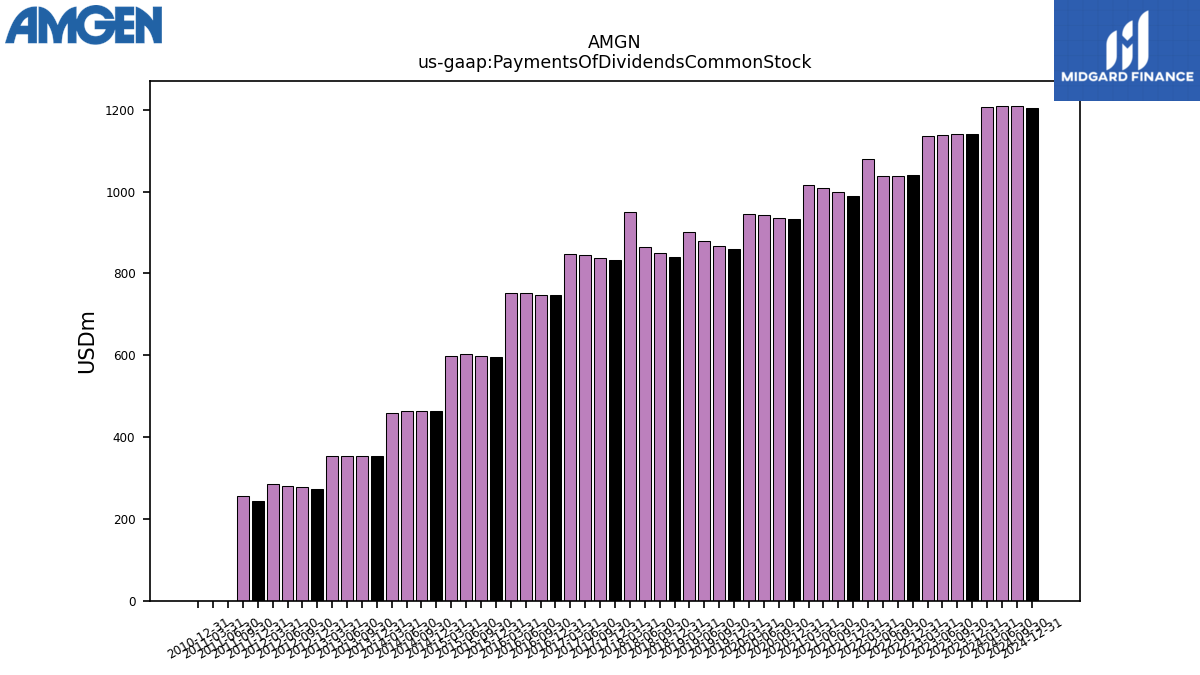 |
 |
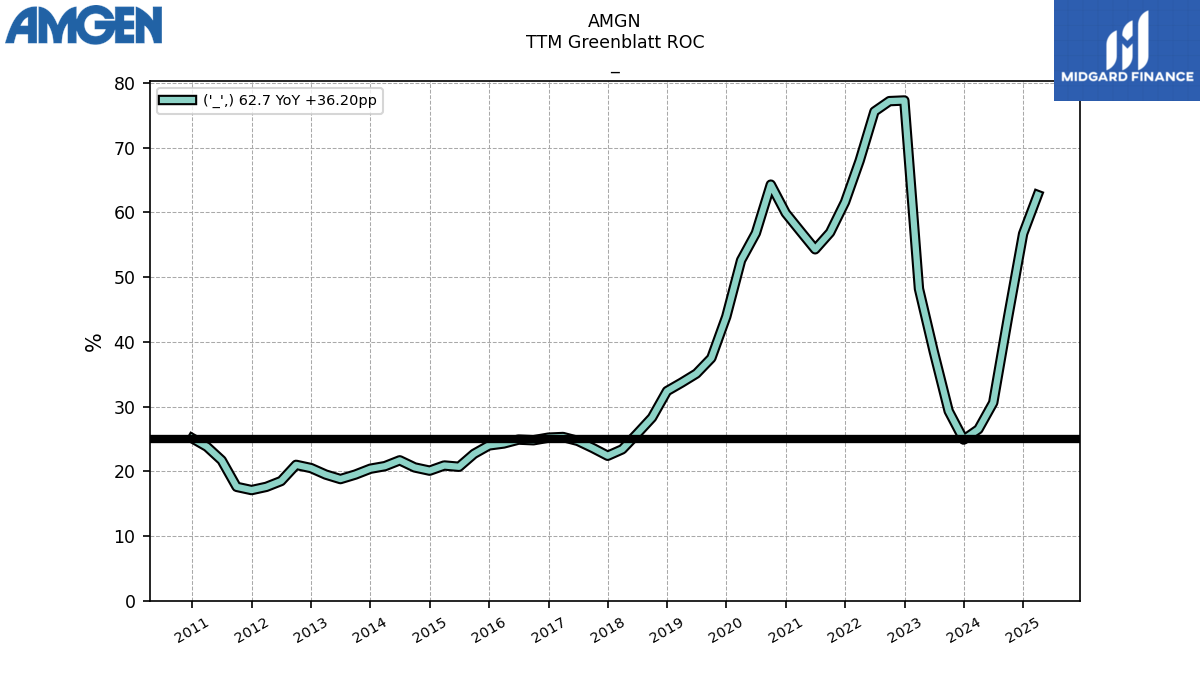 |
AMGN | ||||
| $AIG$ | 2025-02-13 | 2025-05-02 | 2025-05-01 | NA | NA | AIG | 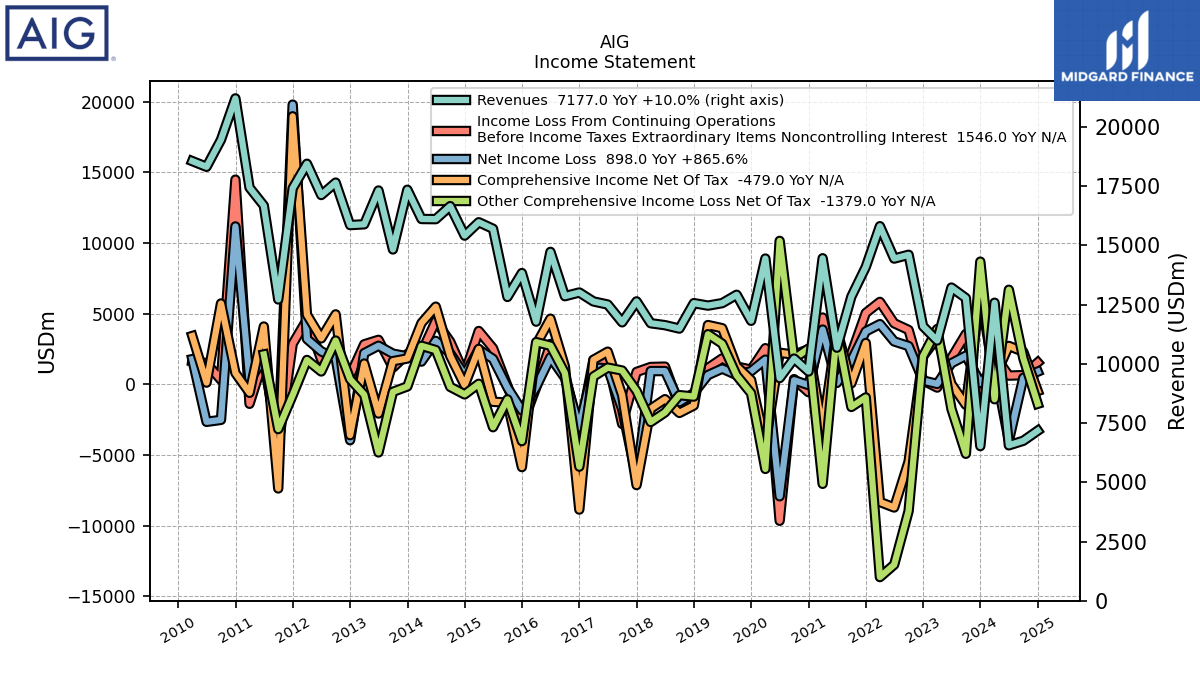 |
 |
 |
AIG |  |
AIG |  |
 |
 |
AIG |  |
 |
AIG | ||||||
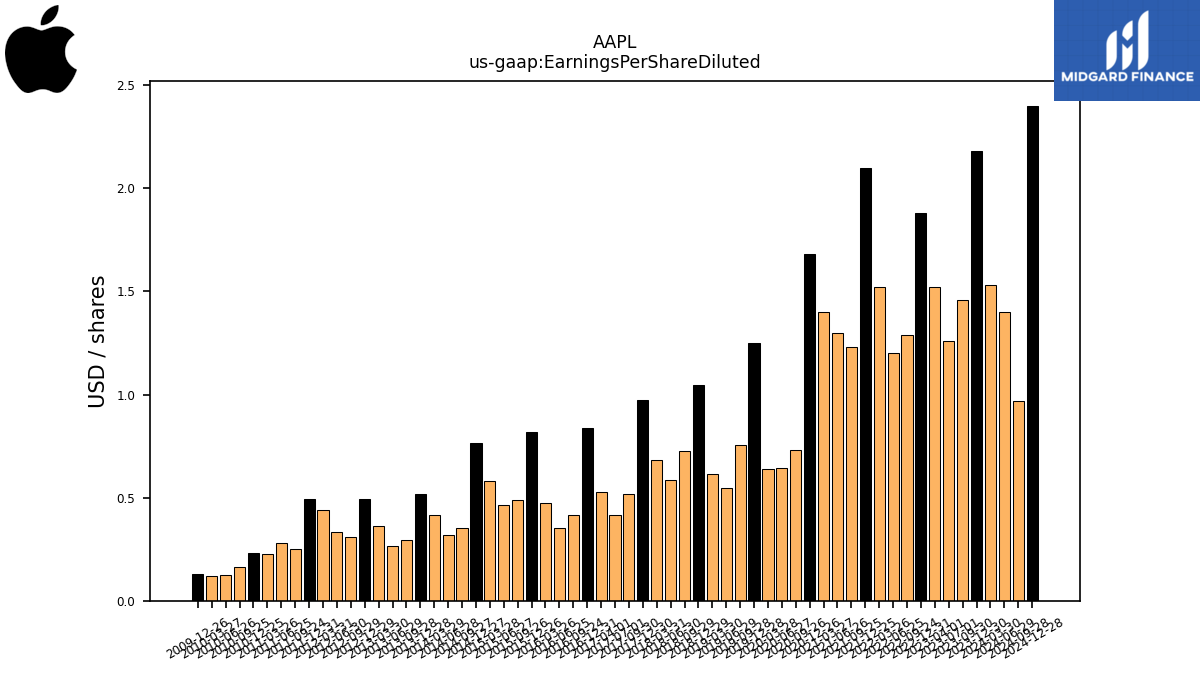
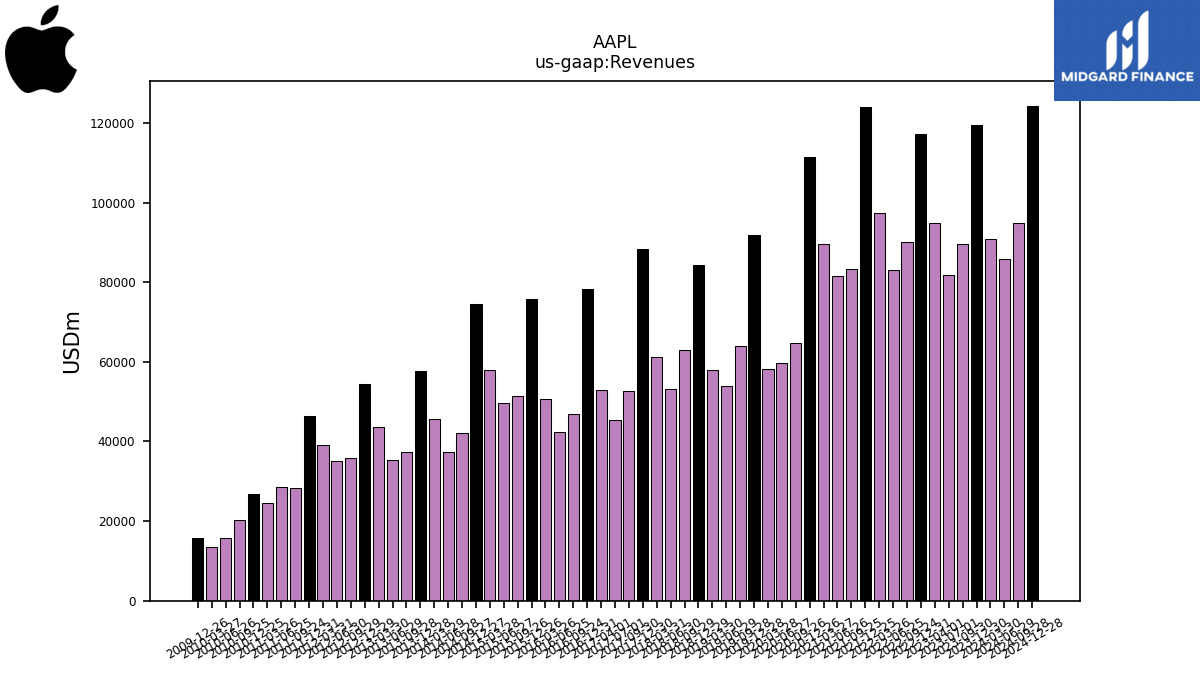
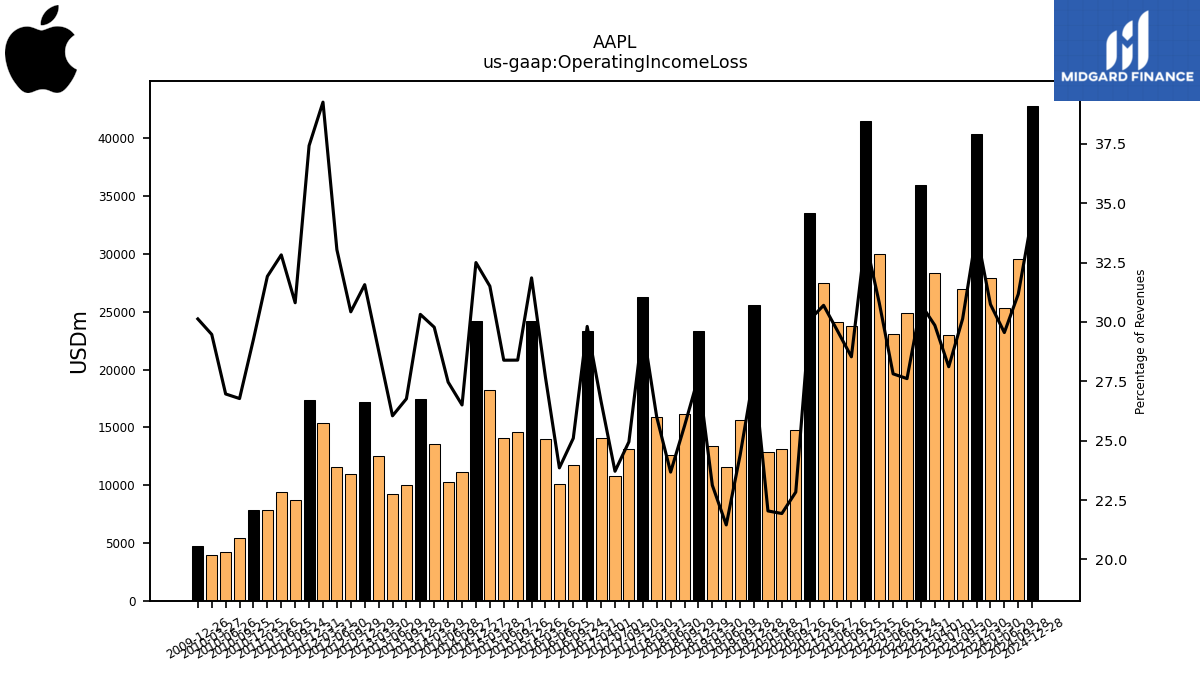
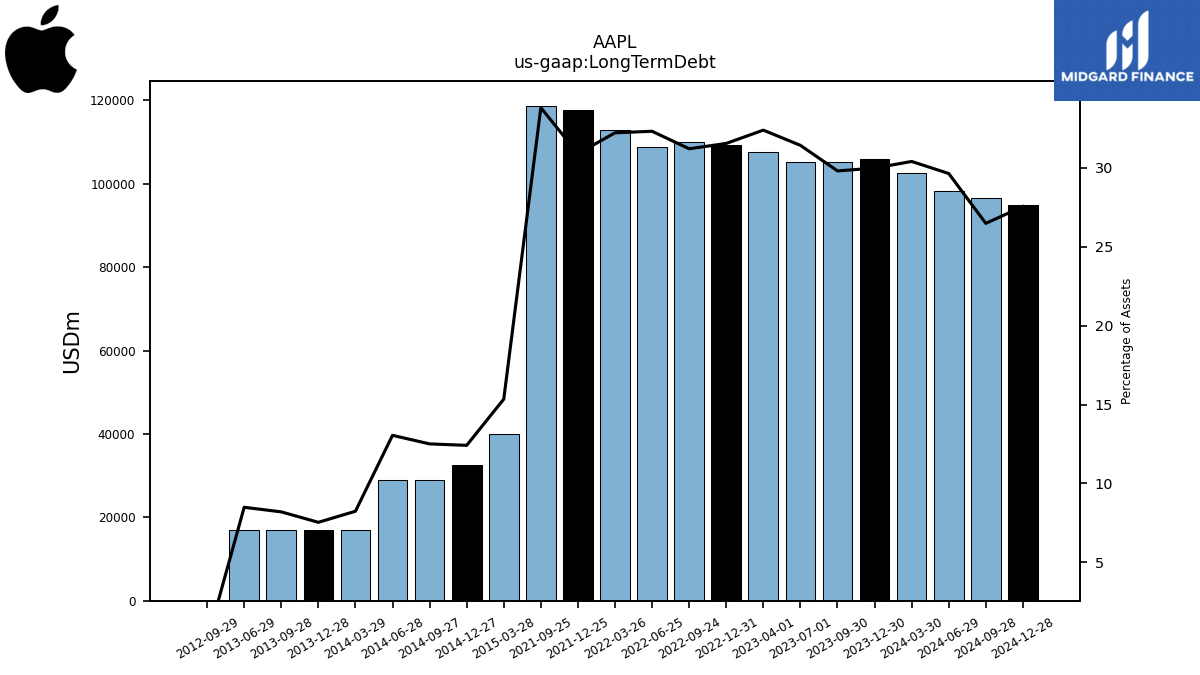
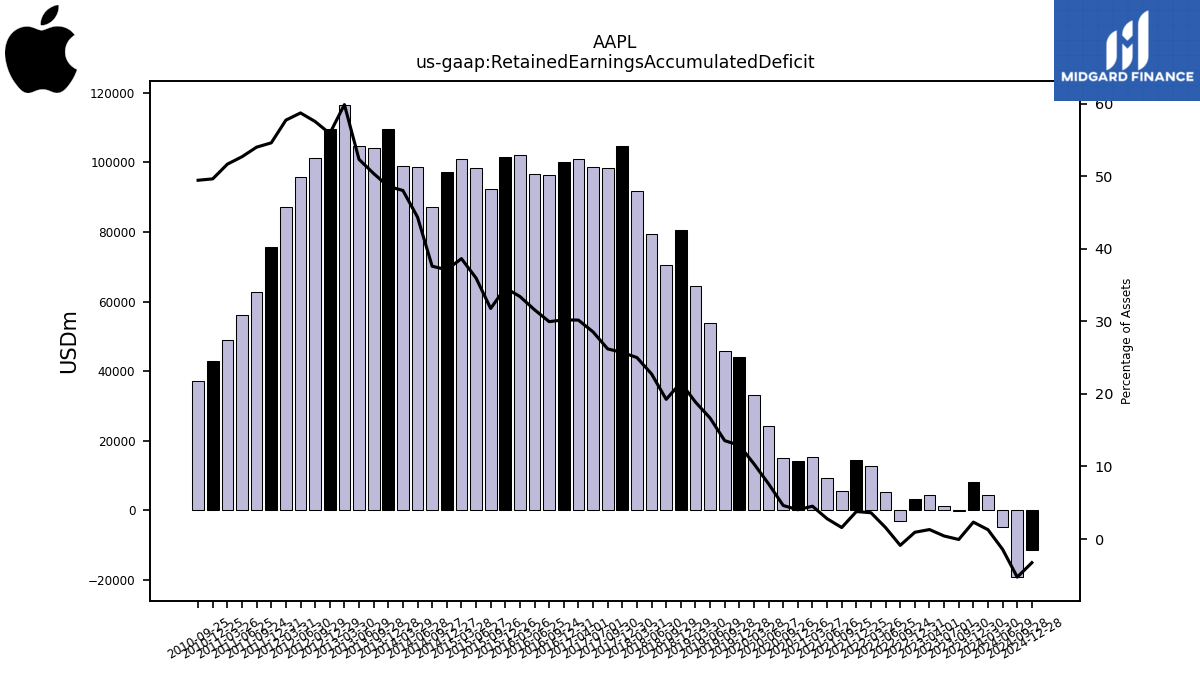
| $AAPL$ | 2024-11-01 | 2025-05-02 | 2025-05-01 | NA | NA | AAPL | 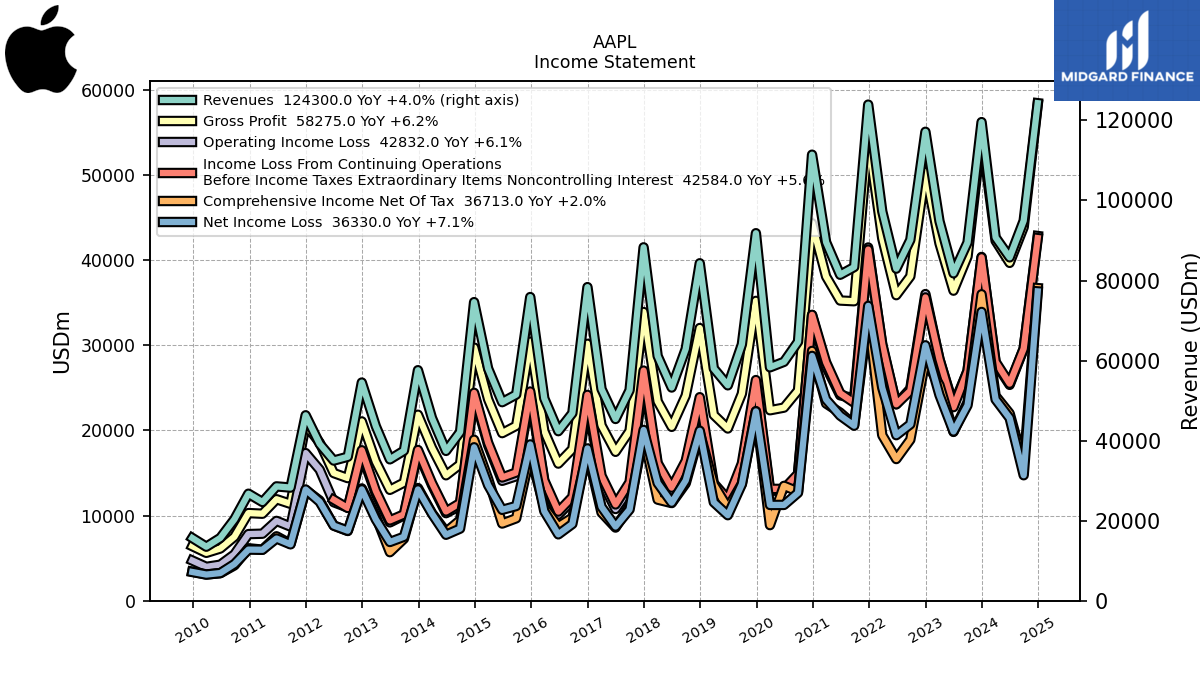 |
 |
 |
AAPL | 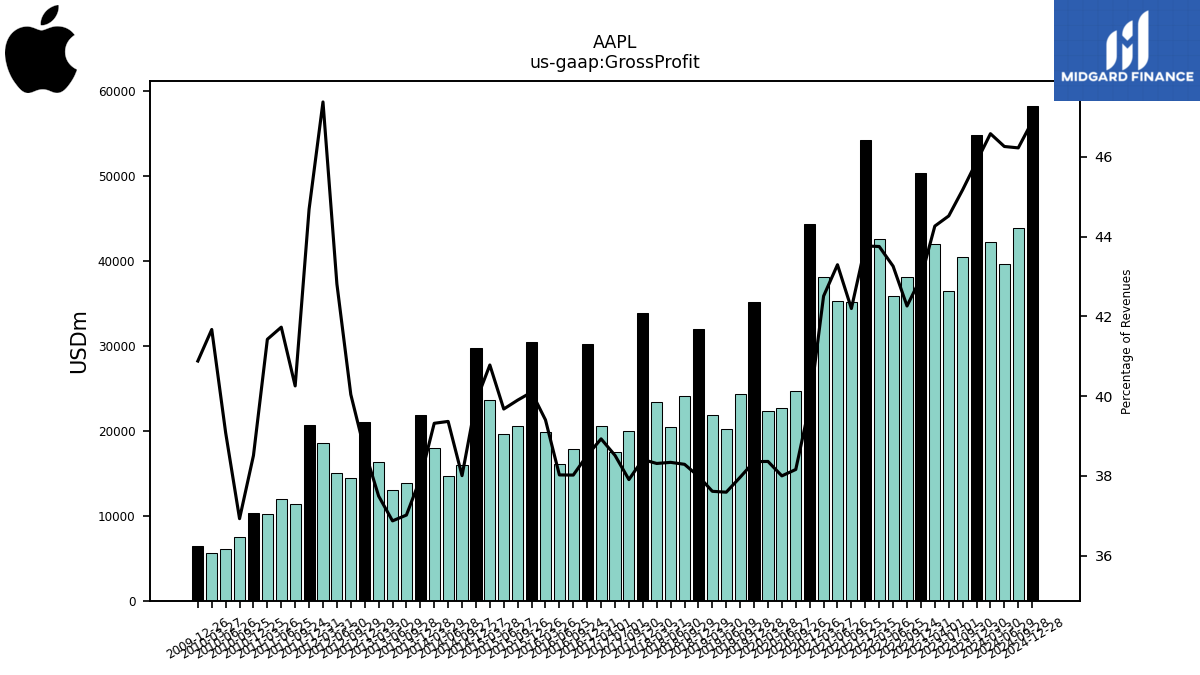 |
 |
 |
AAPL | 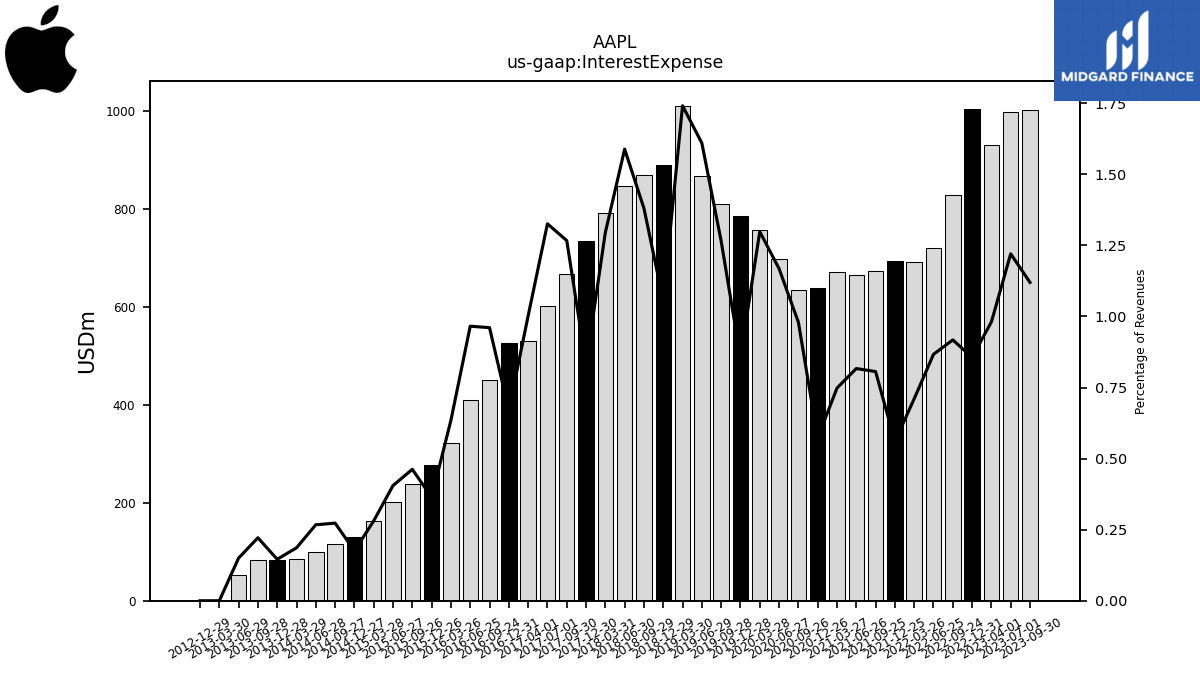 |
 |
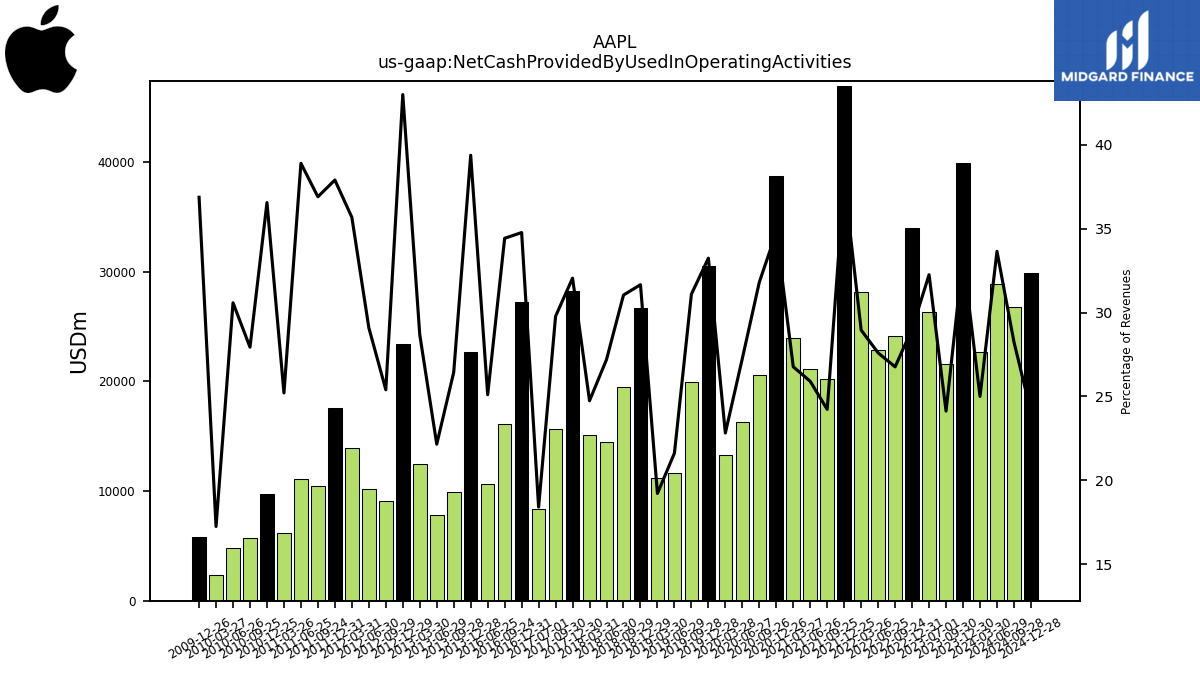 |
AAPL | 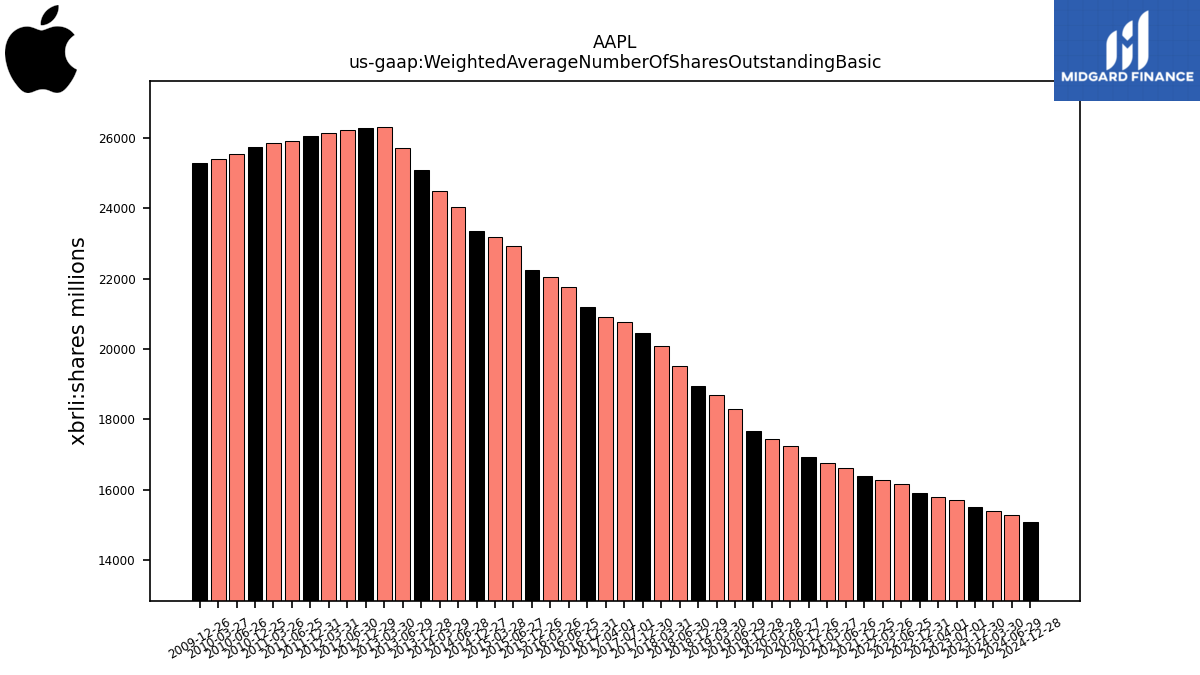 |
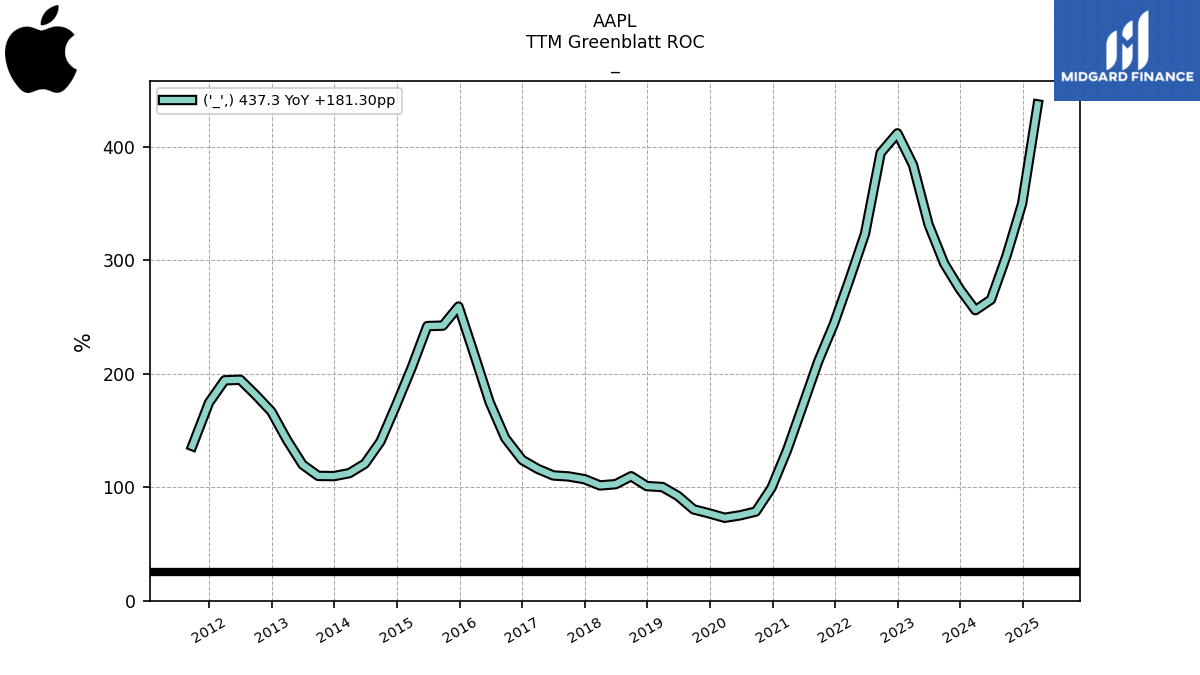 |
AAPL | ||||
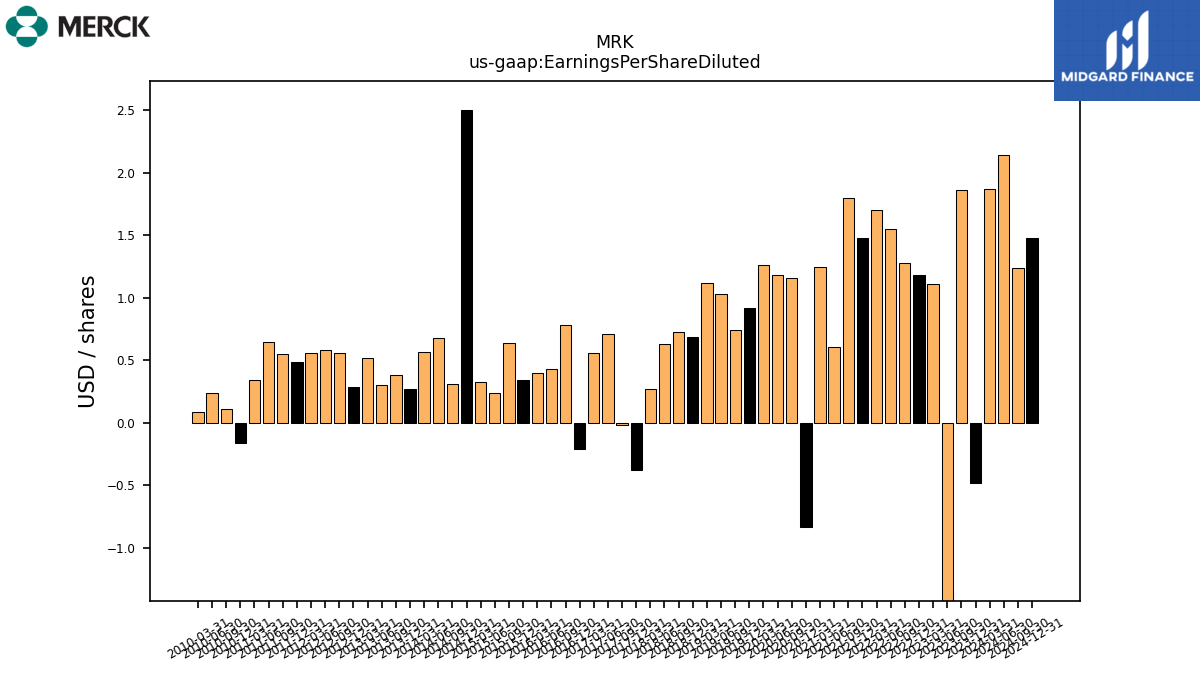
| $MRK$ | 2025-02-25 | 2025-05-02 | 2025-04-24 | NA | NA | MRK | 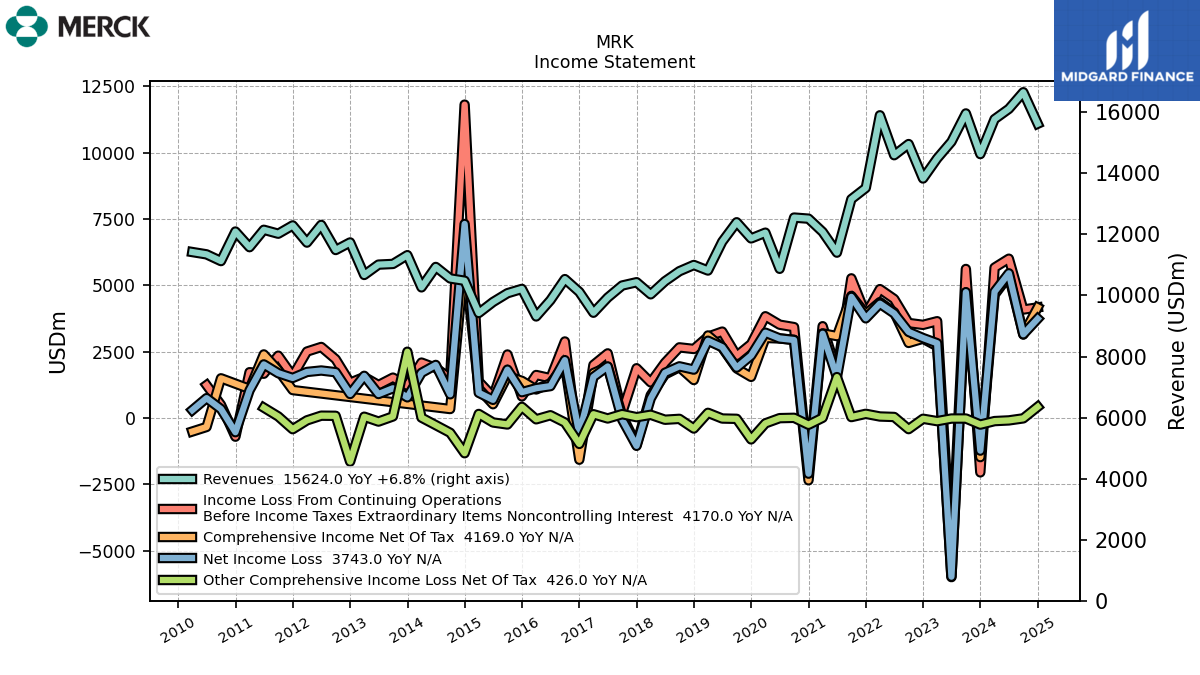 |
 |
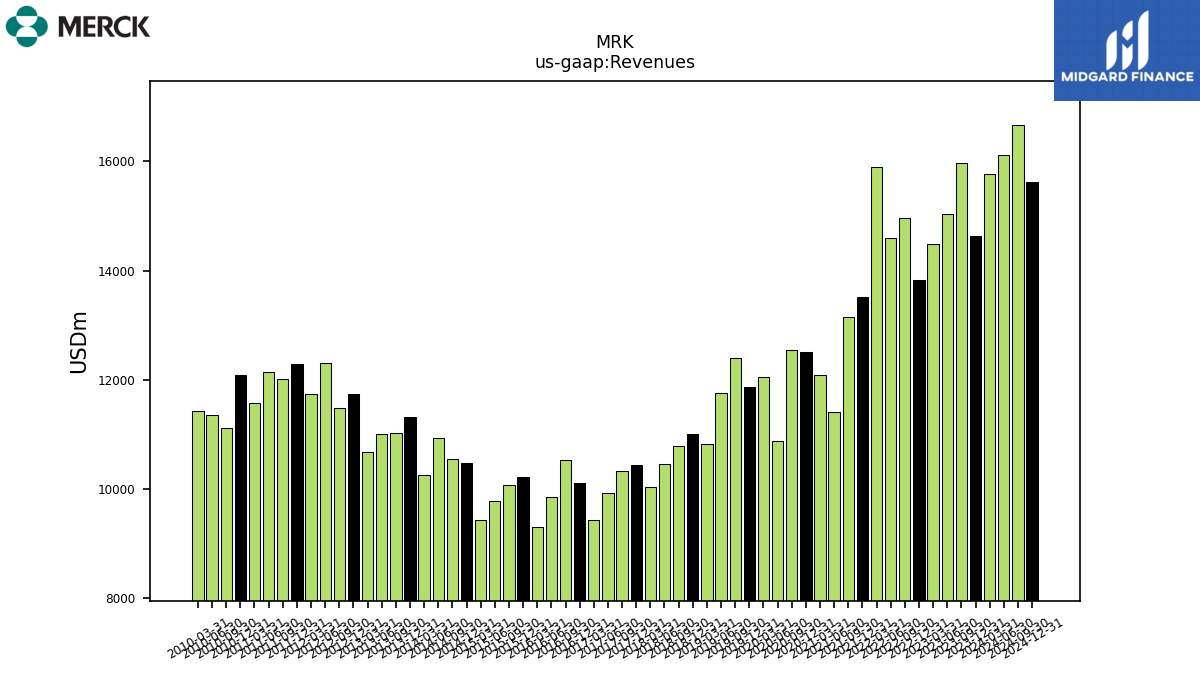 |
MRK | 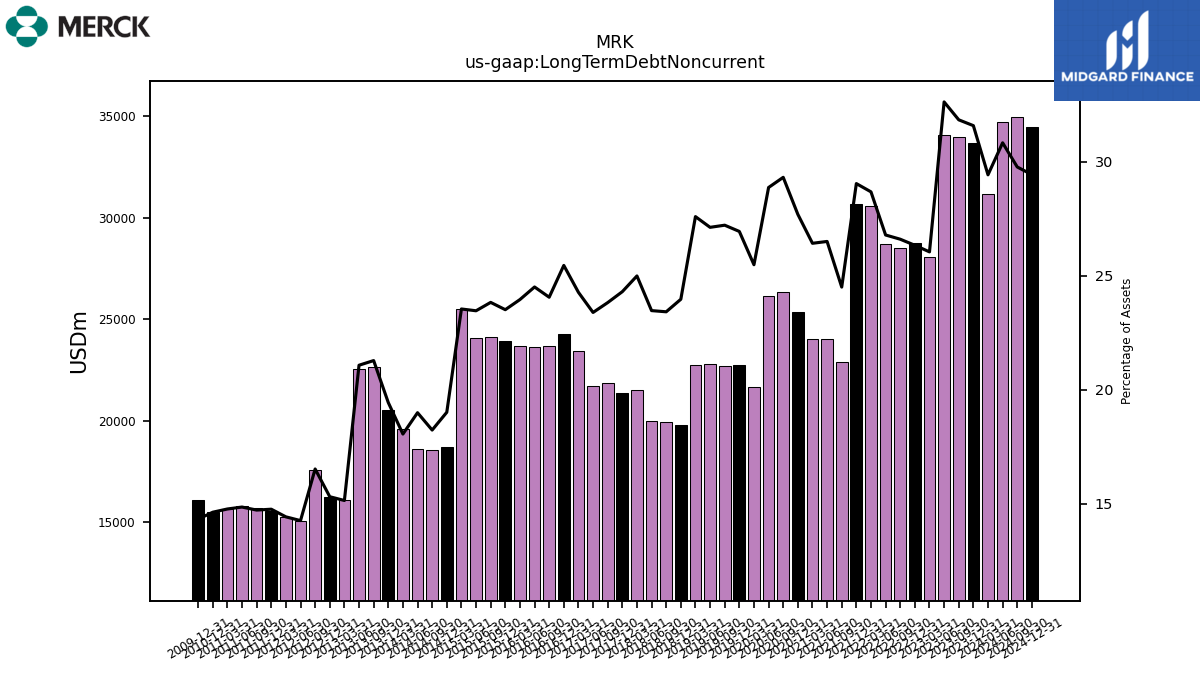 |
MRK | 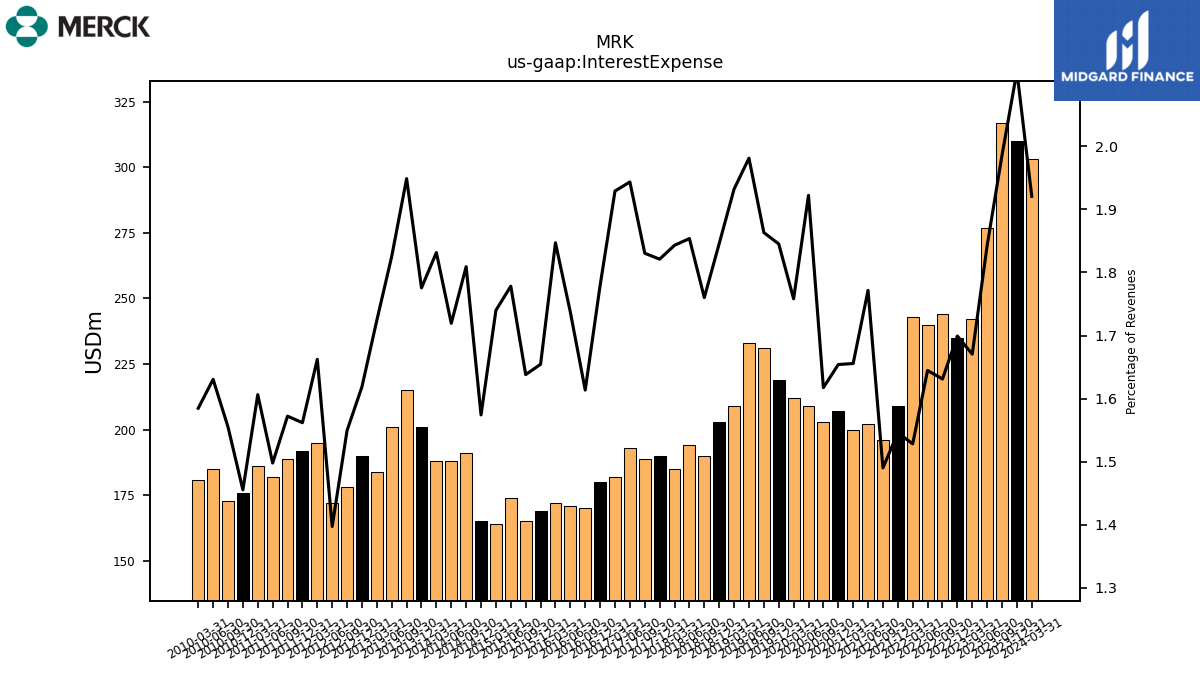 |
 |
 |
MRK |  |
 |
MRK | ||||||
| Ticker | 10K | 10Q | 8K | Sector | Industry | Logo | Forward P/E | Revenue Growth | Ticker | Income | EPS | Revenues | Ticker | GrossProfit | OperatingIncome | LongTermDebt | Ticker | InterestExpense | RetainedEarnnings | CashFlowOperating | Ticker | Dividends | SharesOutstanding | TTMGreenblattROC | |
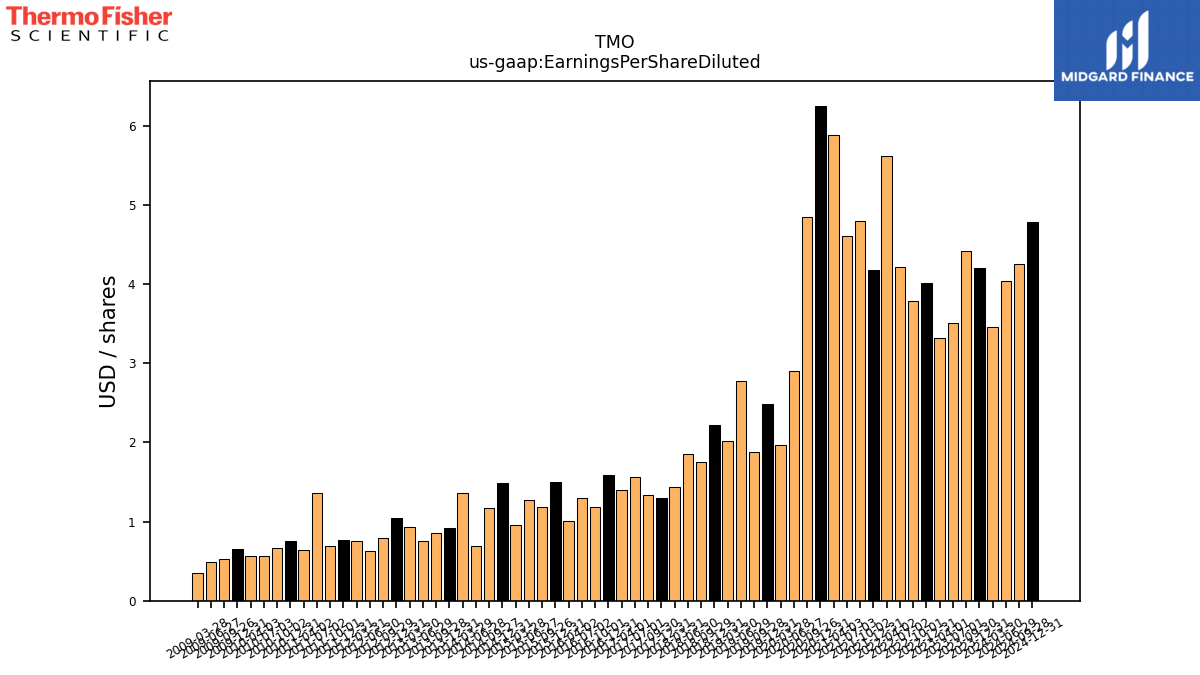
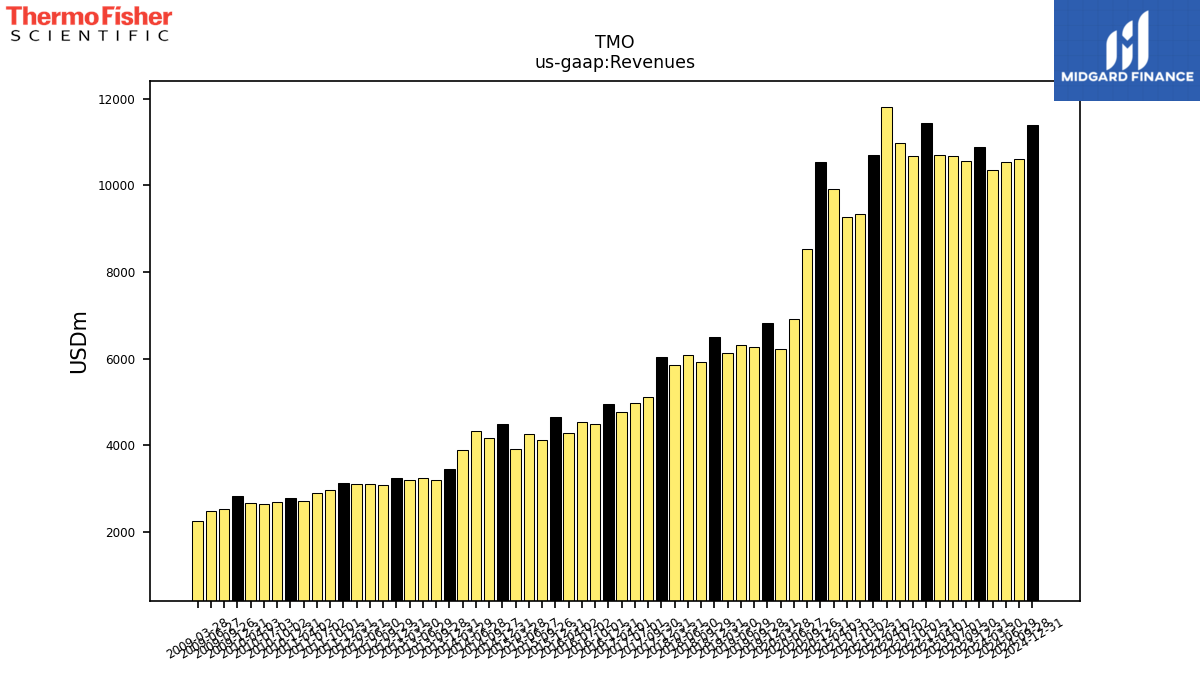
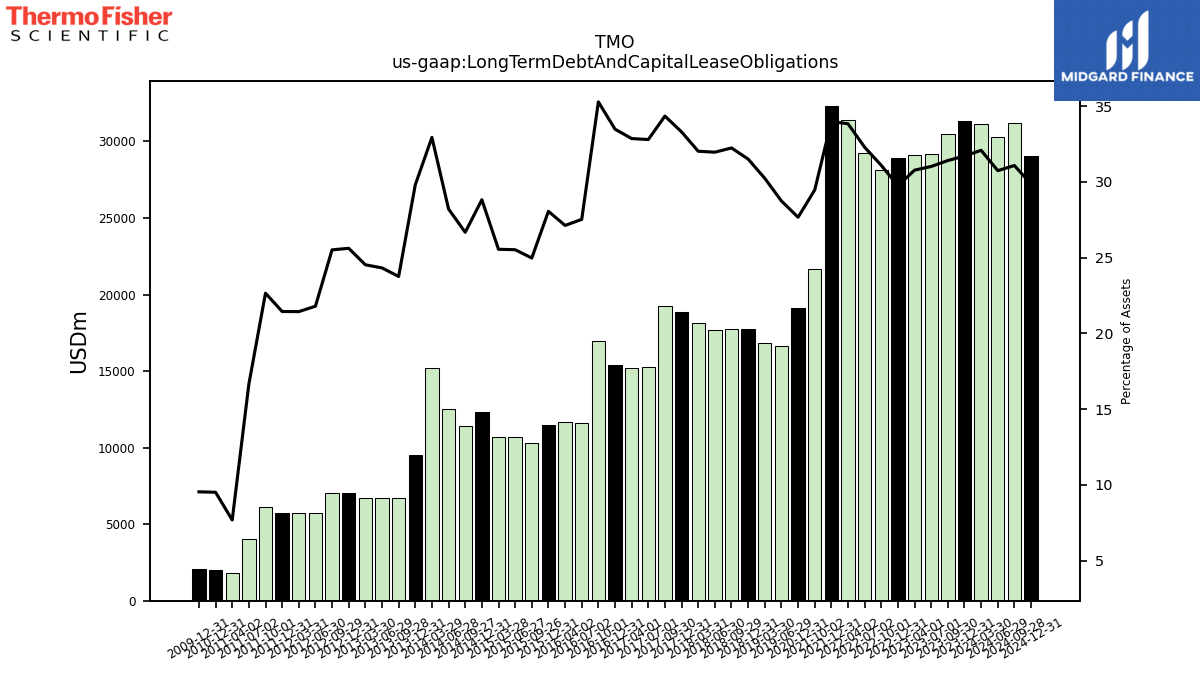
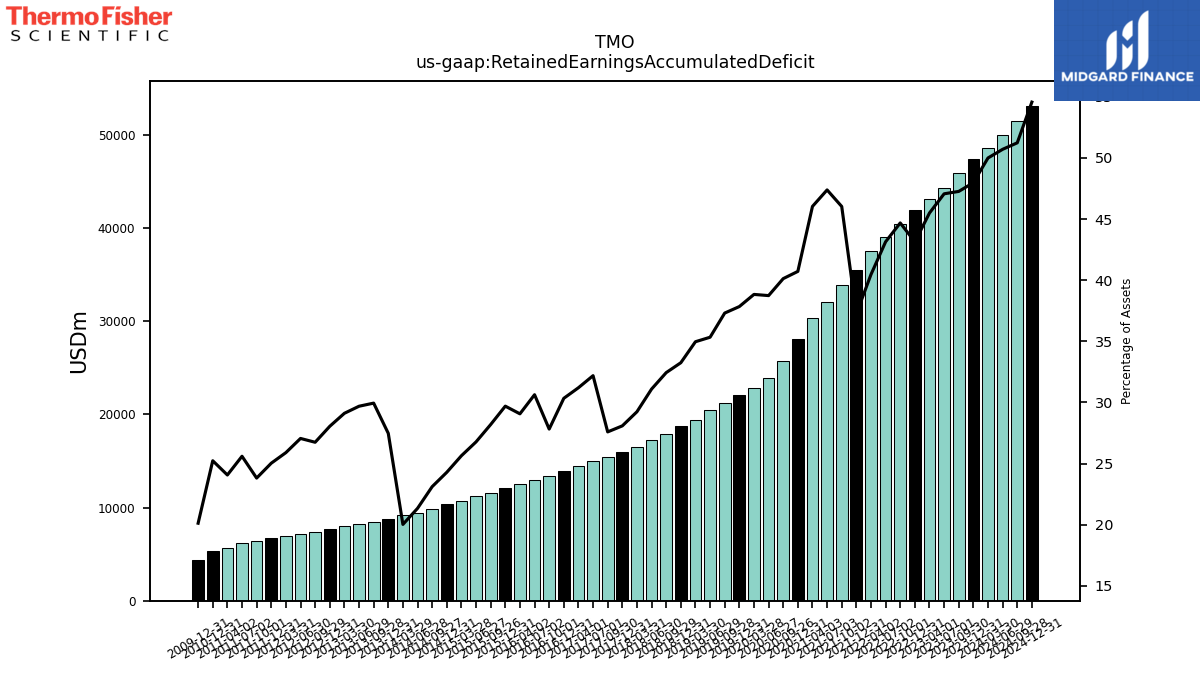
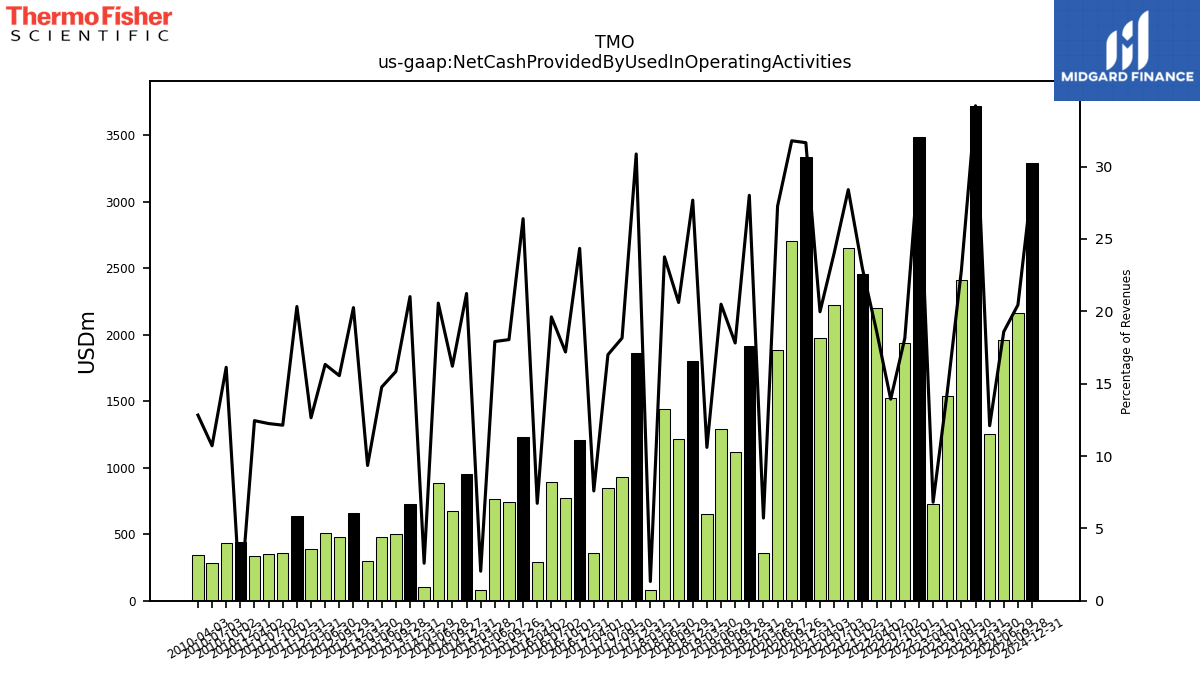
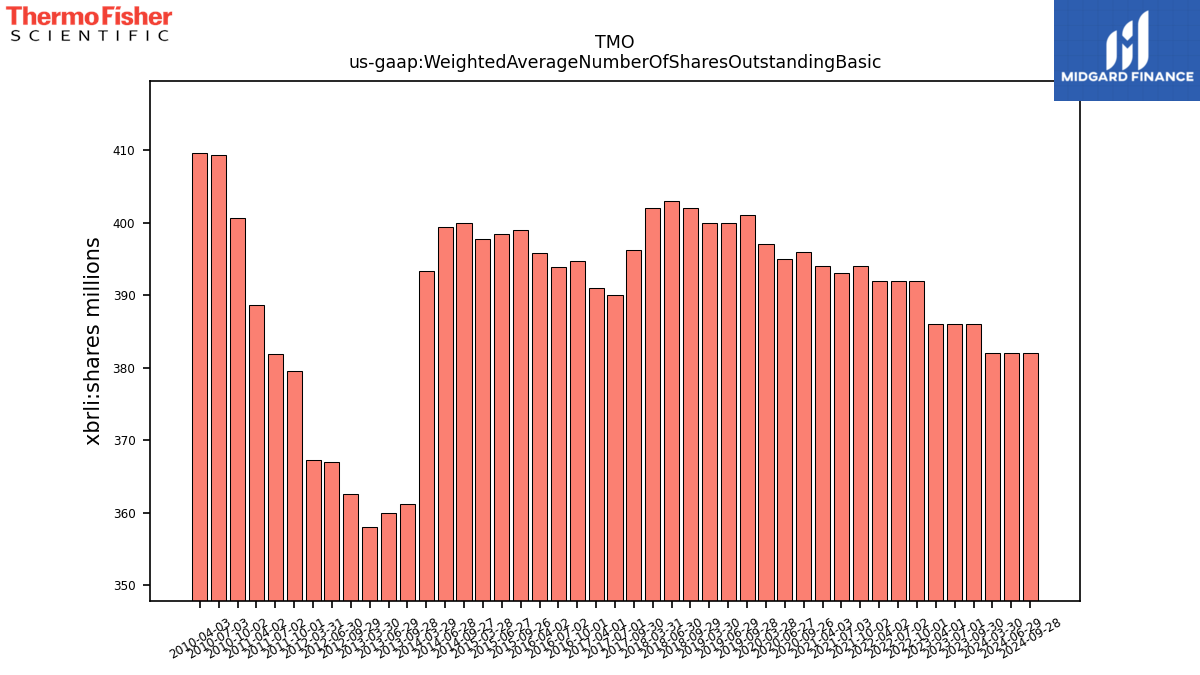
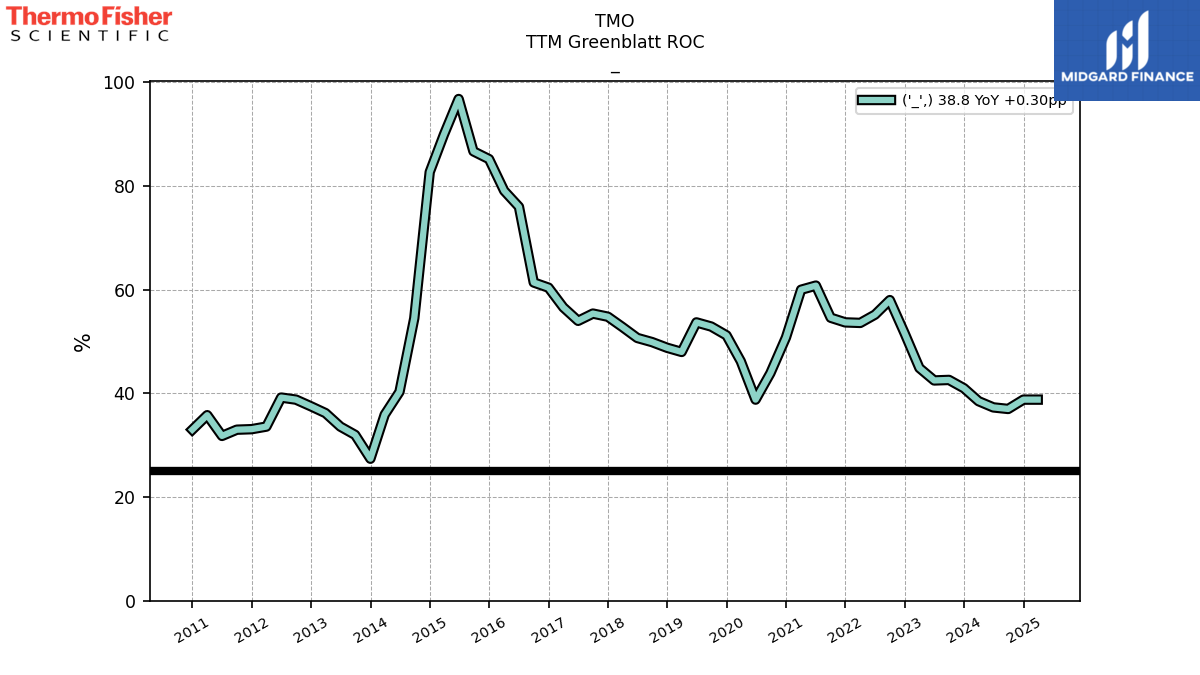
| $TMO$ | 2025-02-20 | 2025-05-02 | 2025-04-23 | NA | NA | TMO | 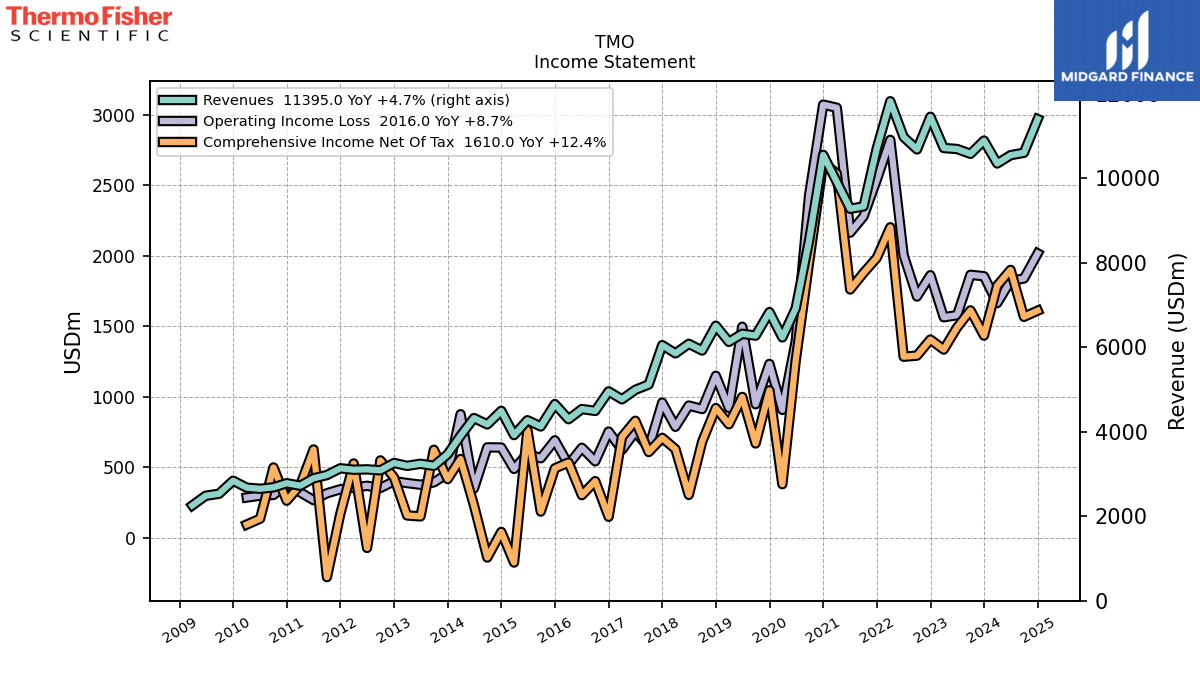 |
 |
 |
TMO | 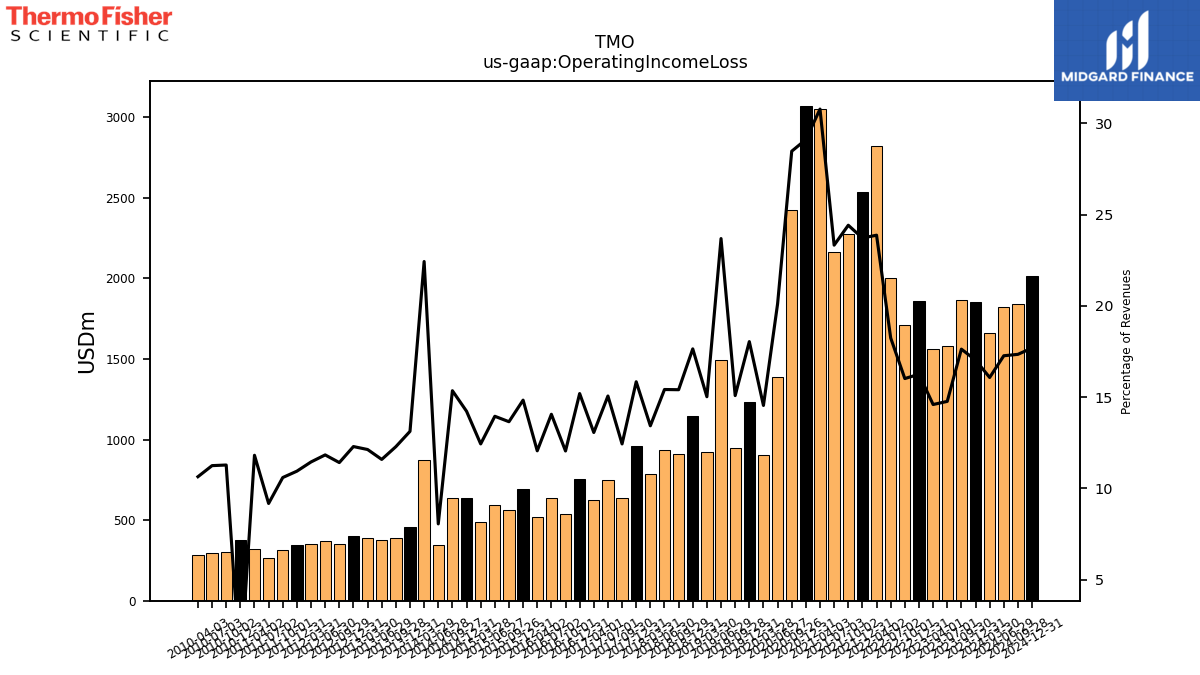 |
 |
TMO | 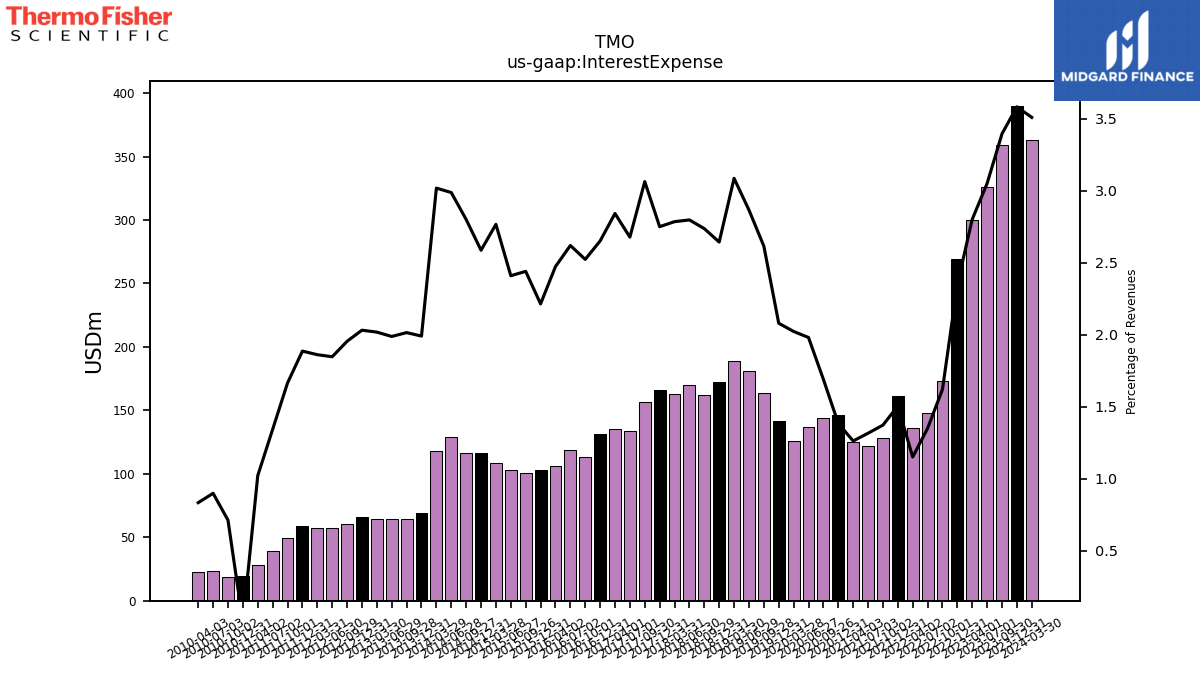 |
 |
 |
TMO | 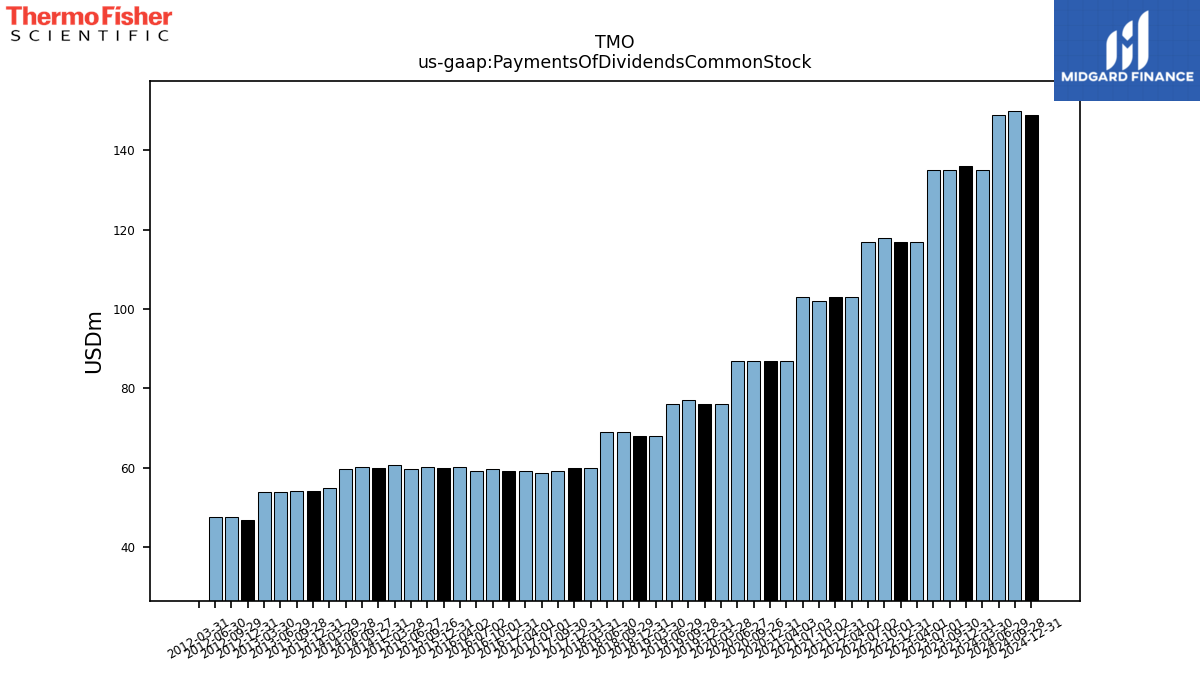 |
 |
 |
TMO | ||||
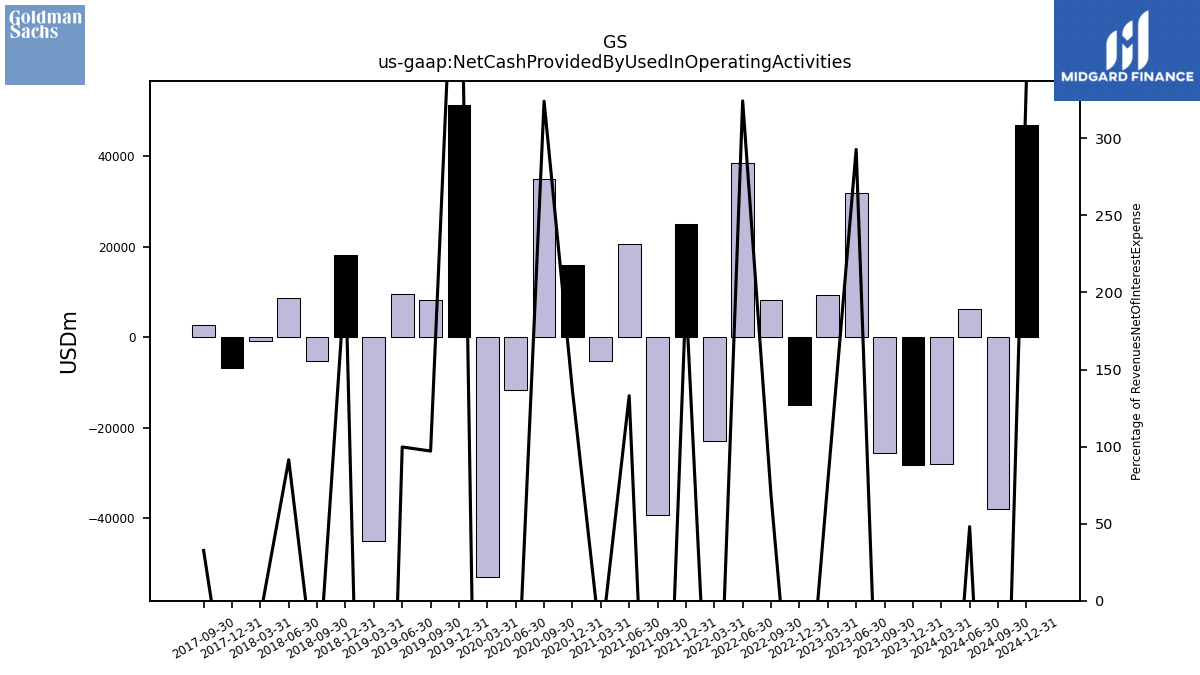
| $GS$ | 2025-02-27 | 2025-05-02 | 2025-04-23 |  |
NA | NA | GS | 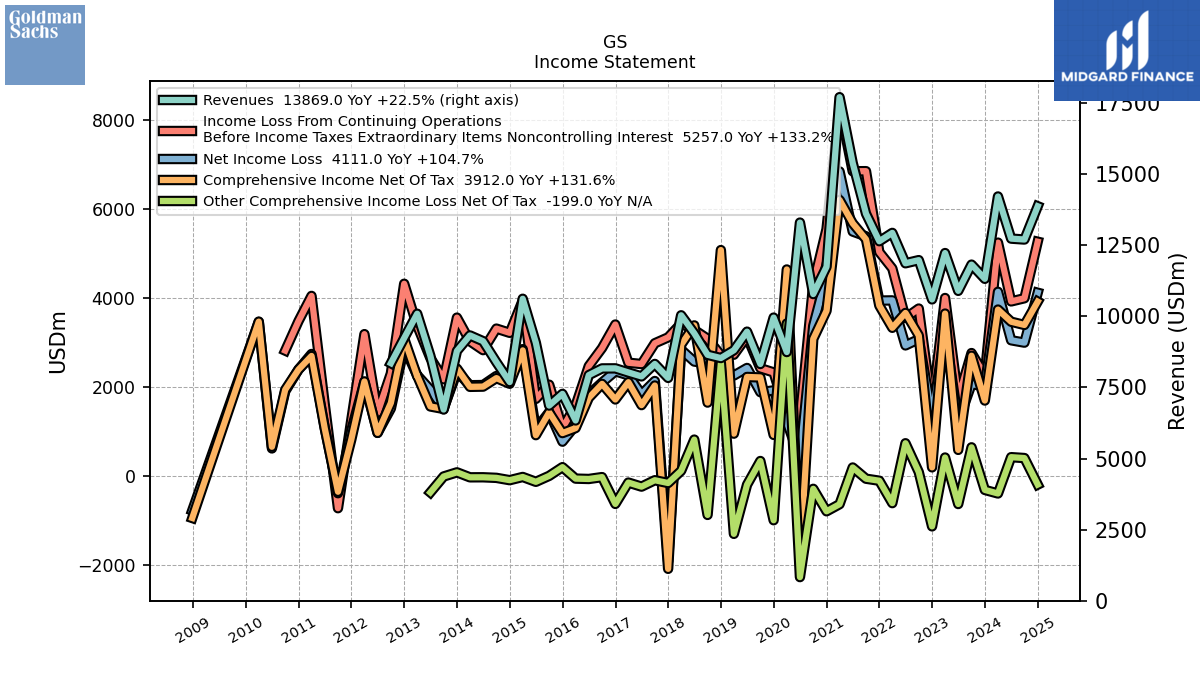 |
 |
 |
GS | GS |  |
 |
 |
GS | 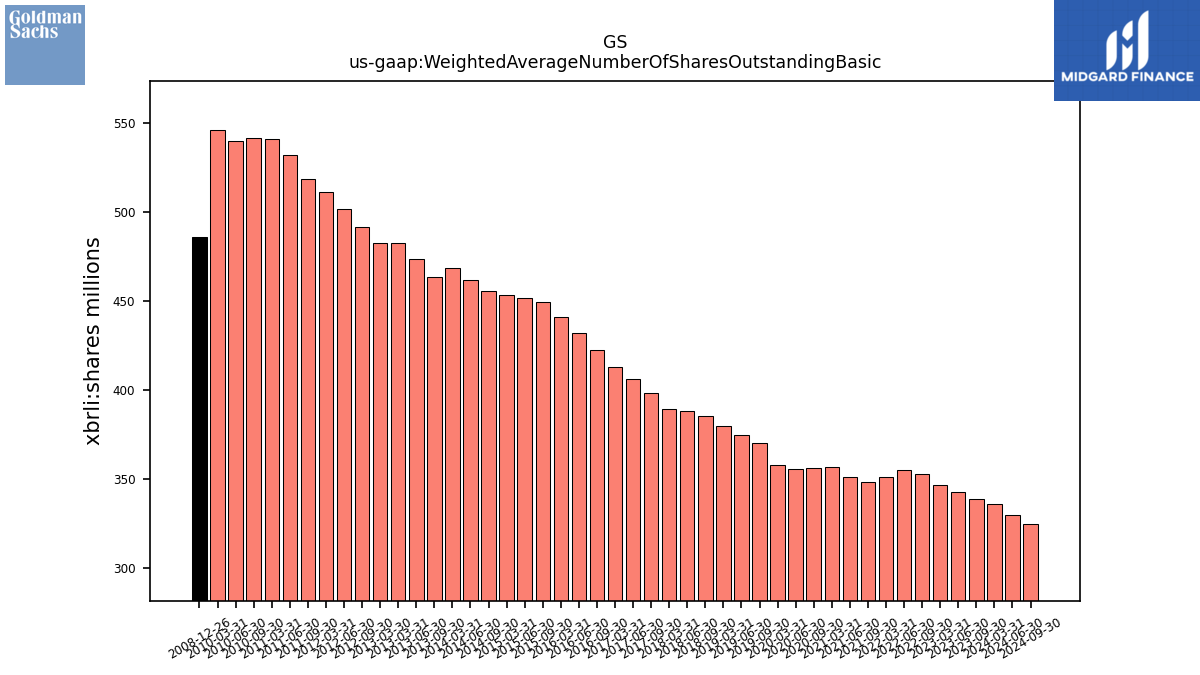 |
GS | |||||||
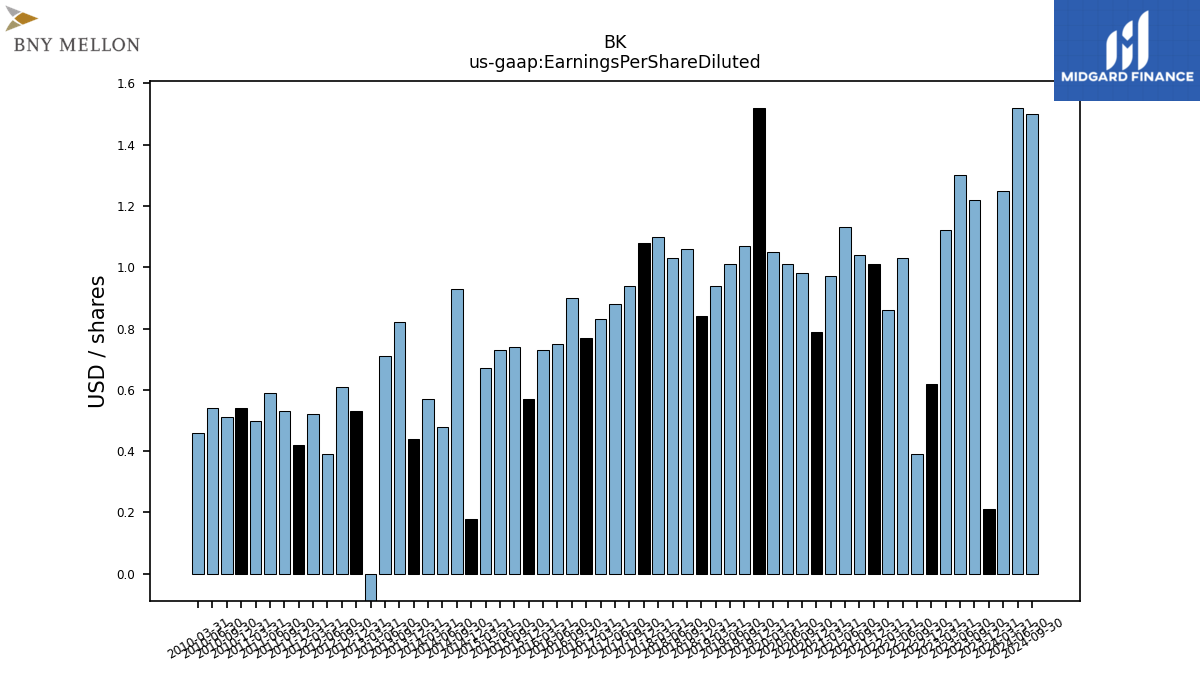
| $BK$ | 2025-02-27 | 2025-05-02 | 2025-04-11 |  |
NA | NA | BK | 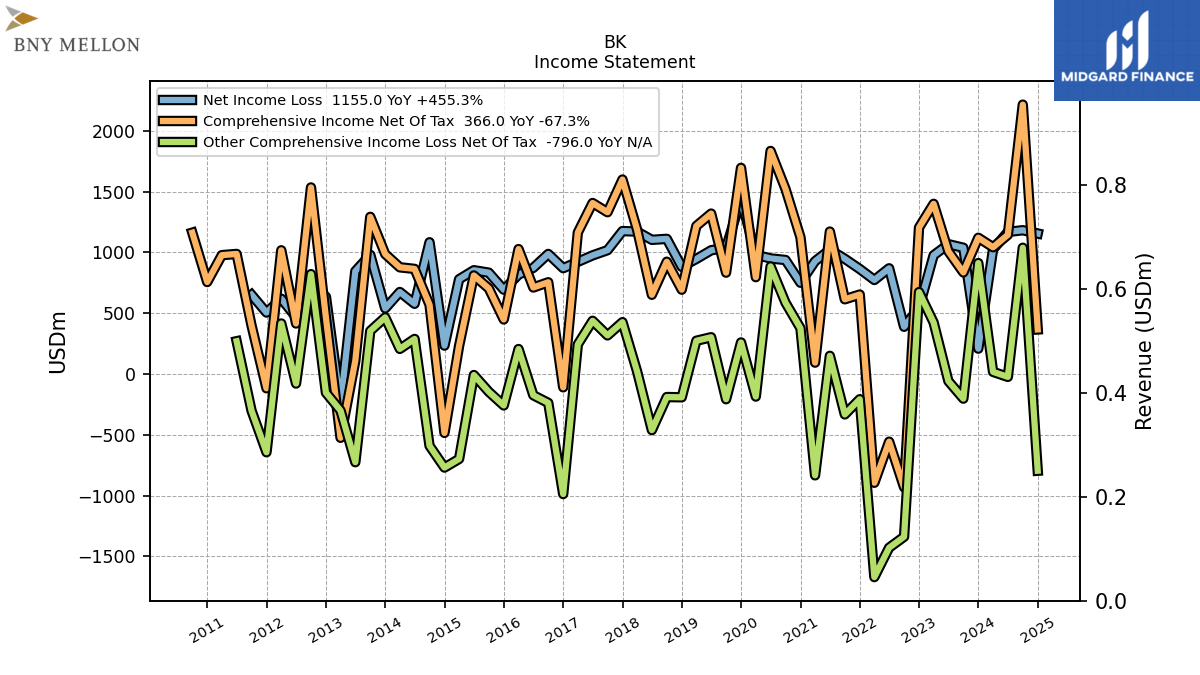 |
 |
BK |  |
BK |  |
 |
 |
BK | 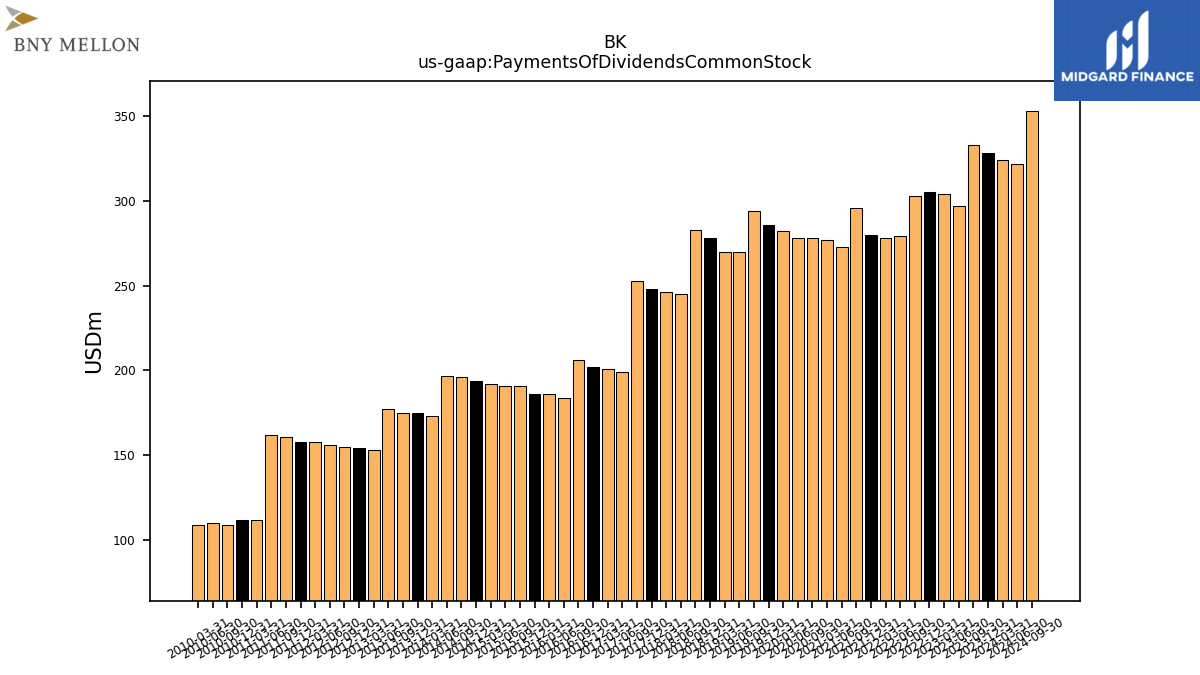 |
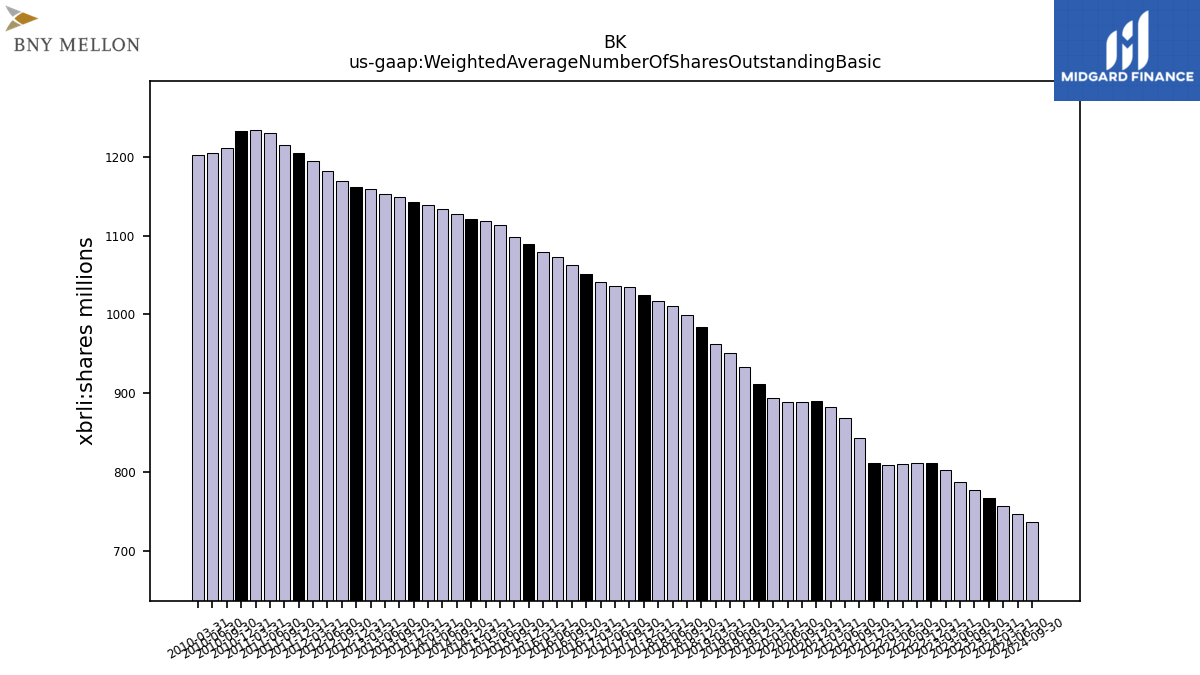 |
BK | ||||||
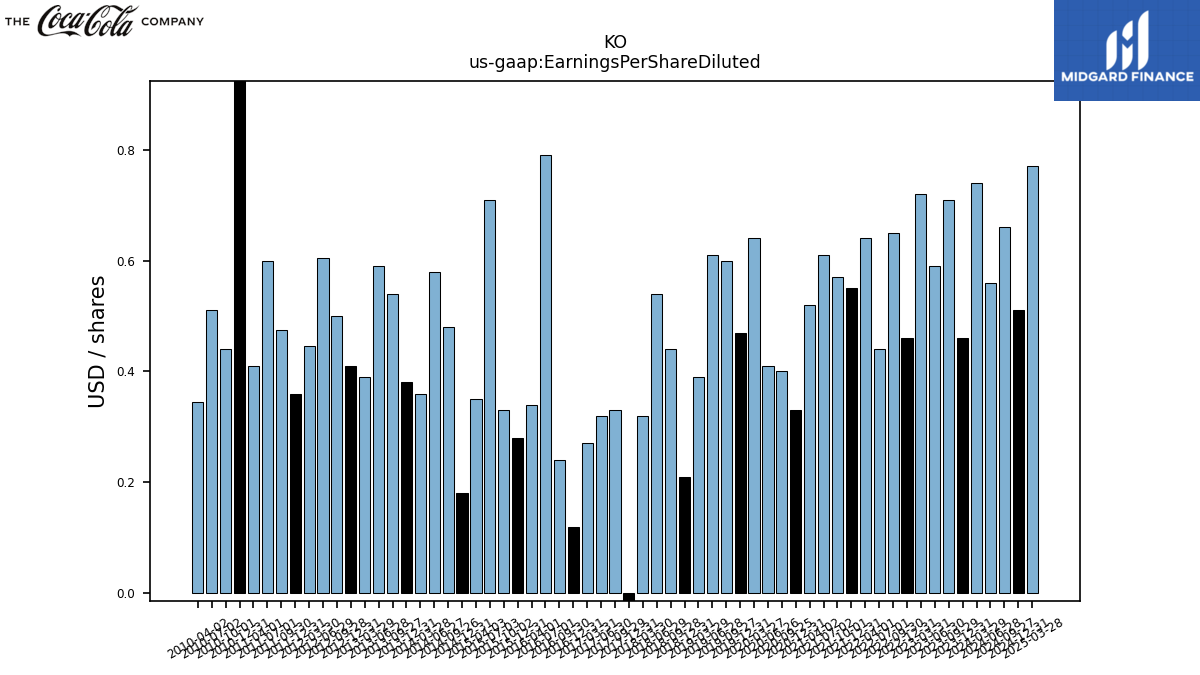
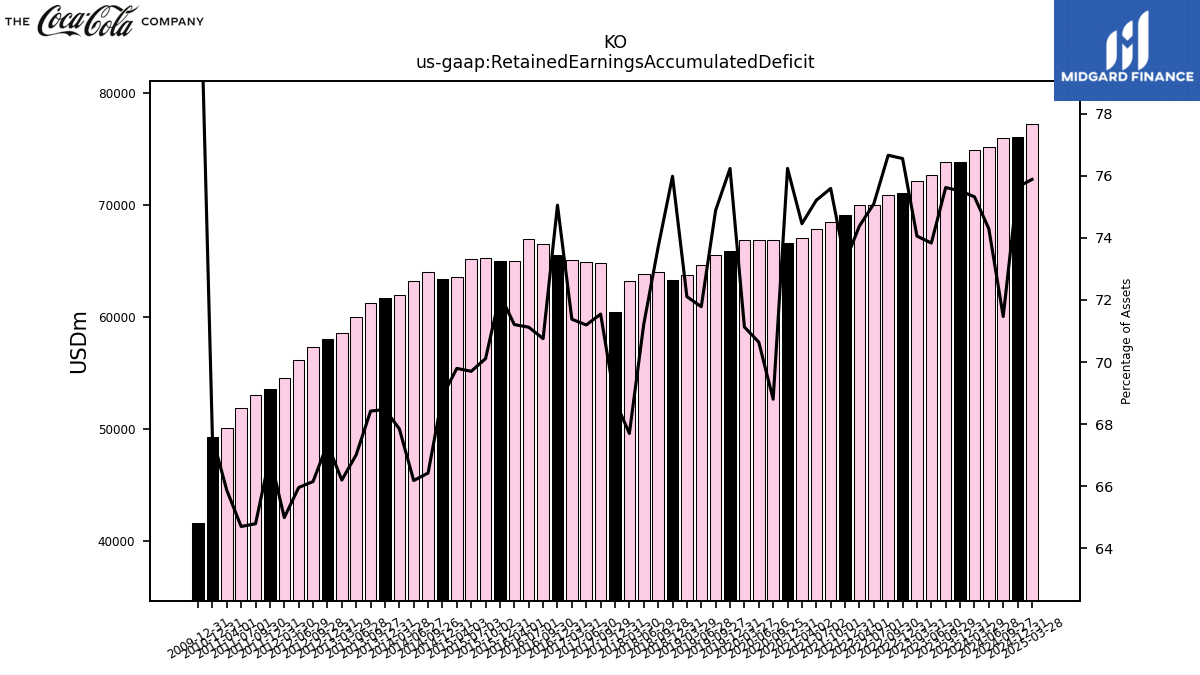
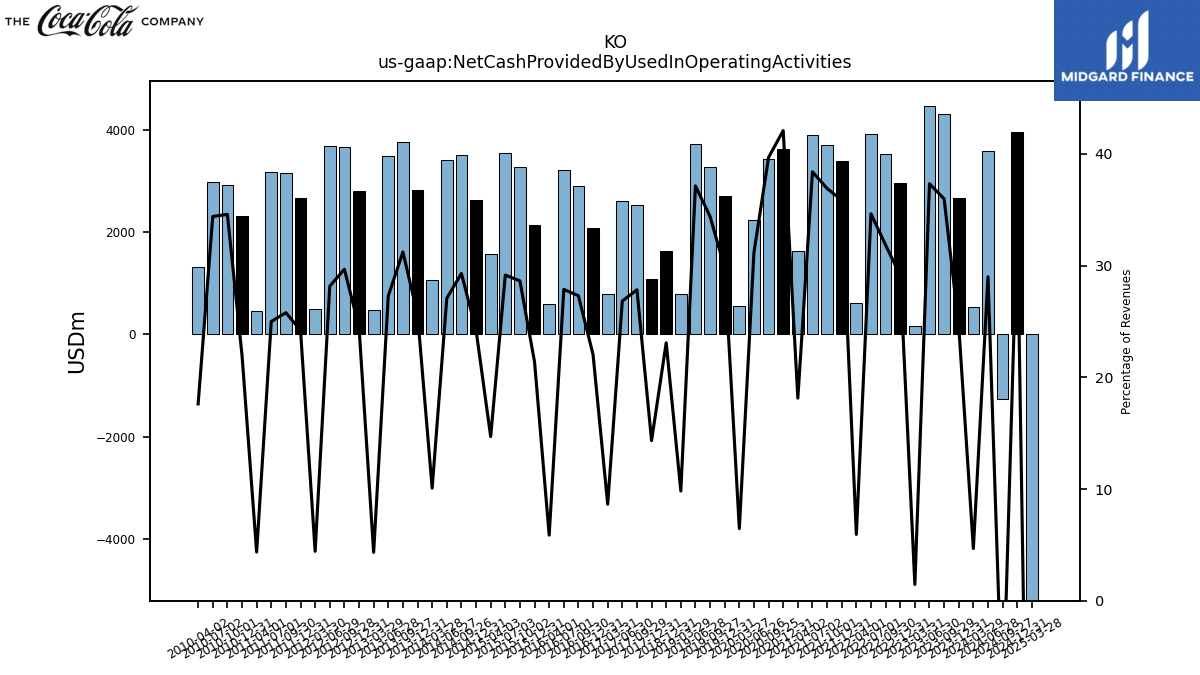
| $KO$ | 2025-02-20 | 2025-05-01 | 2025-05-02 |  |
NA | NA | KO | 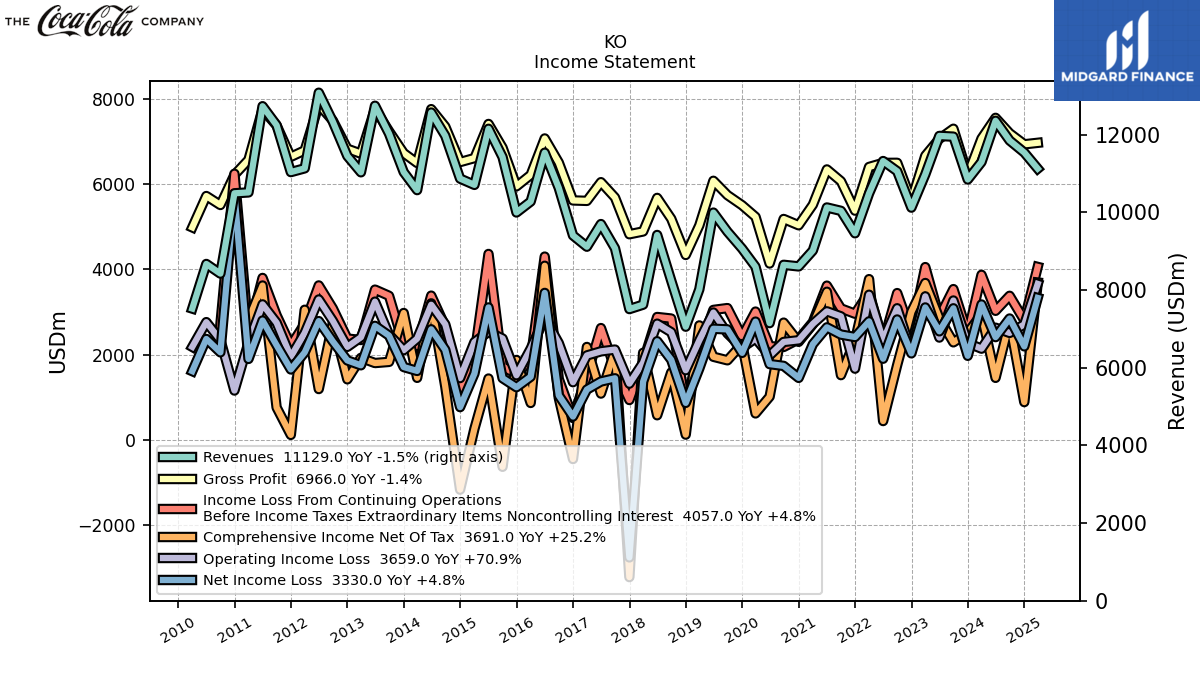 |
 |
 |
KO |  |
 |
 |
KO | 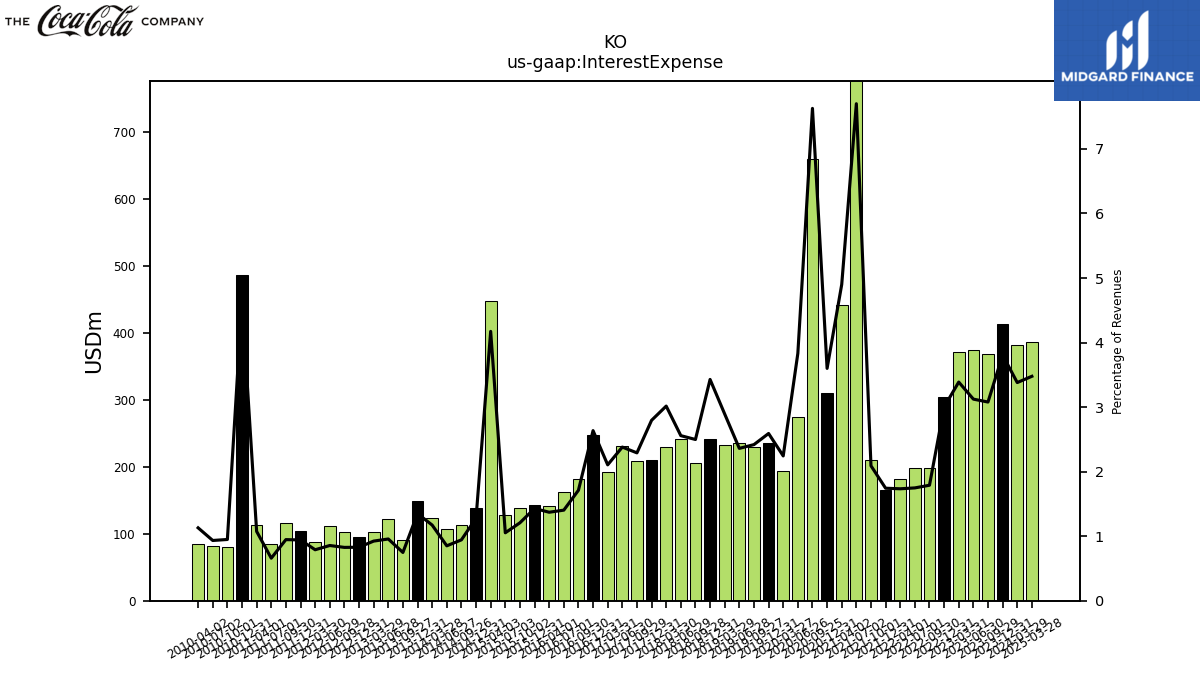 |
 |
 |
KO | 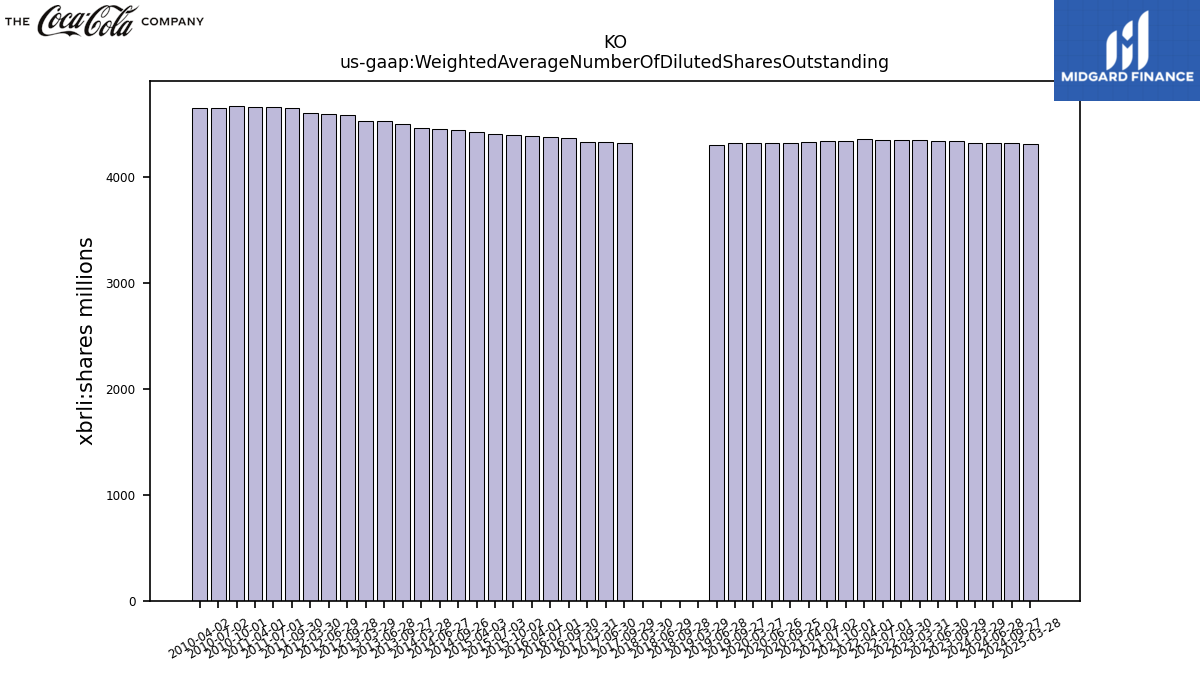 |
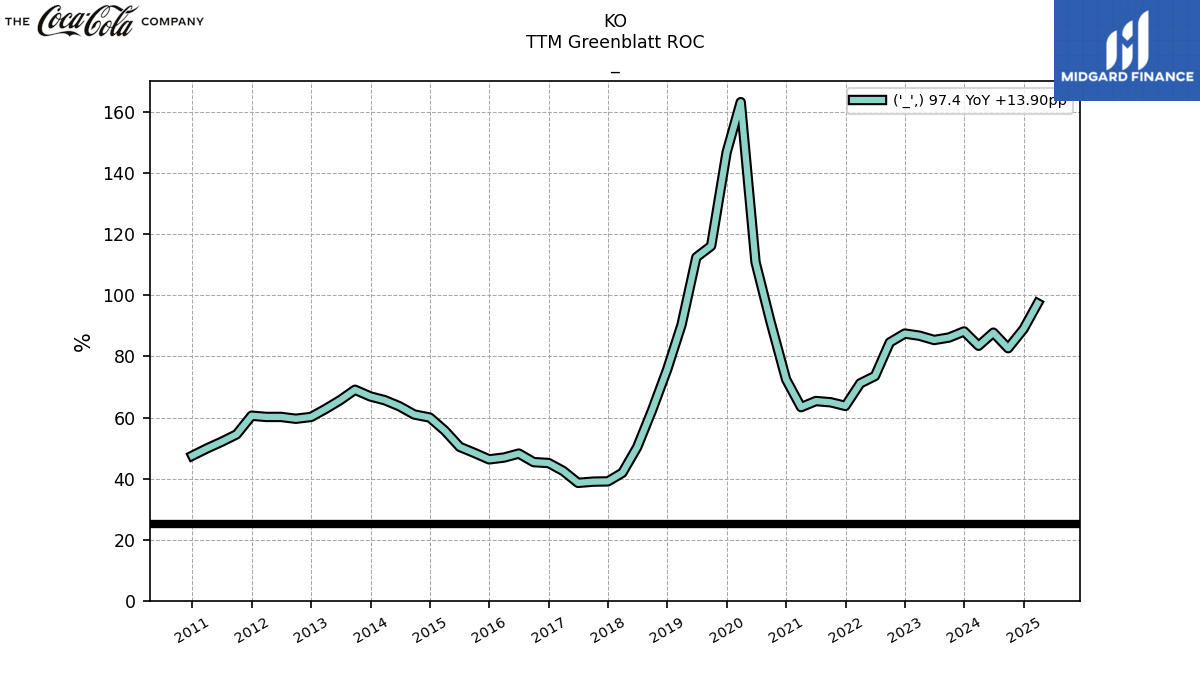 |
KO | |||
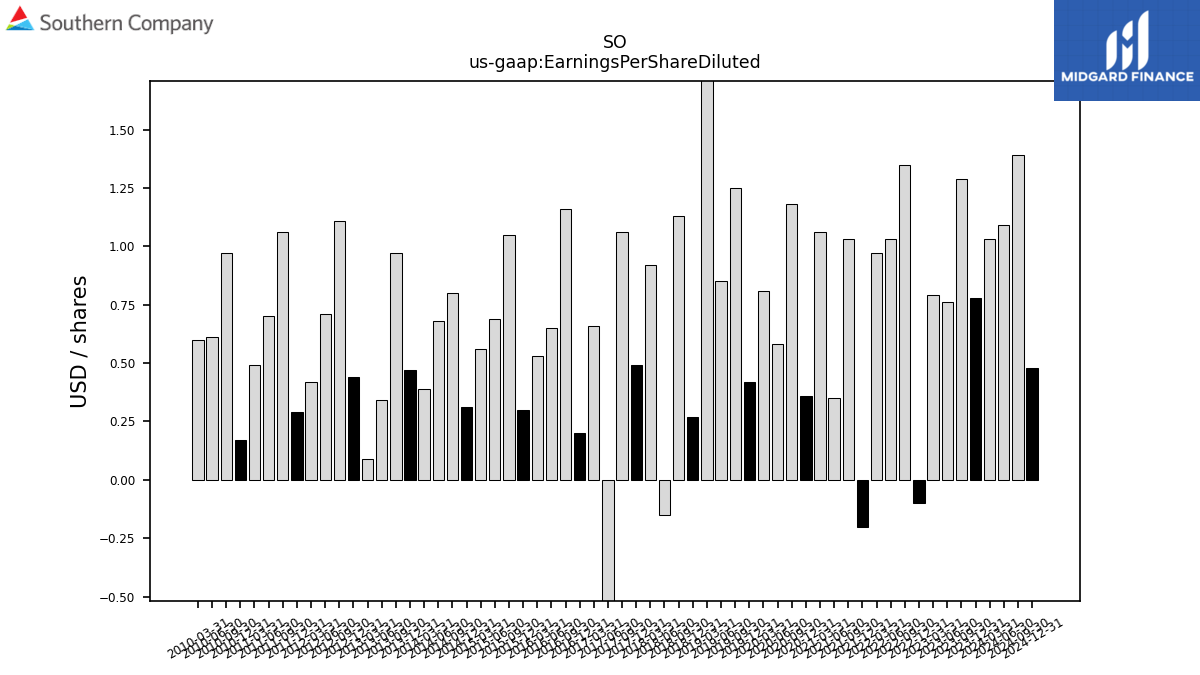
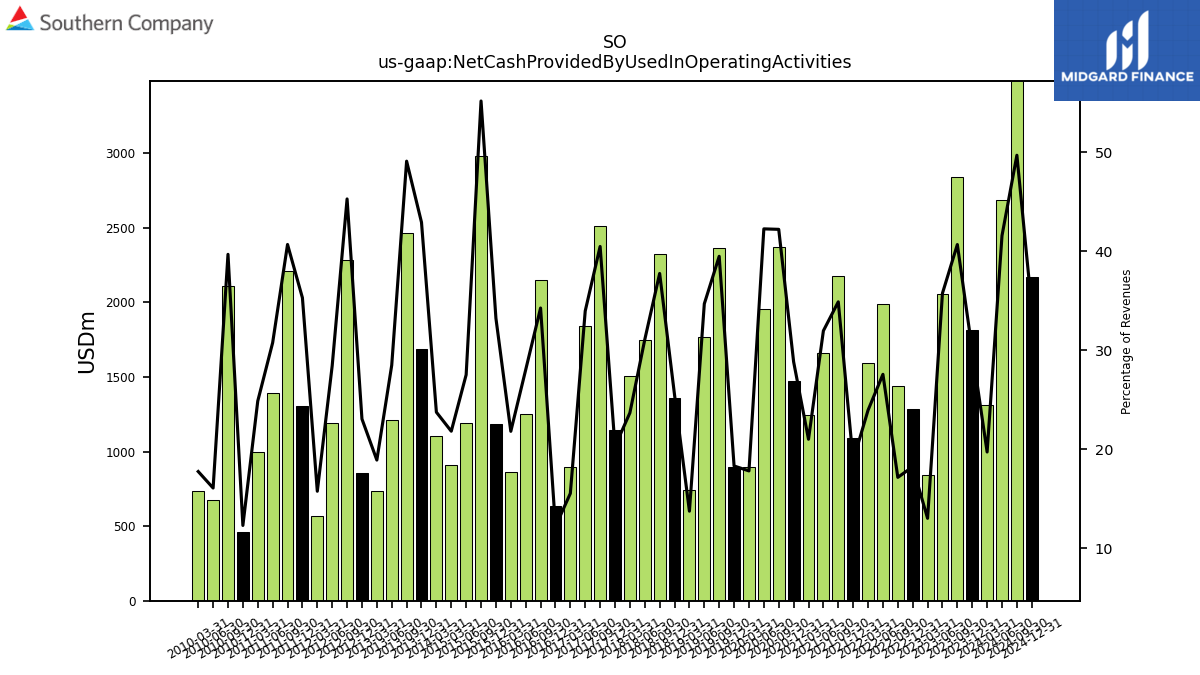
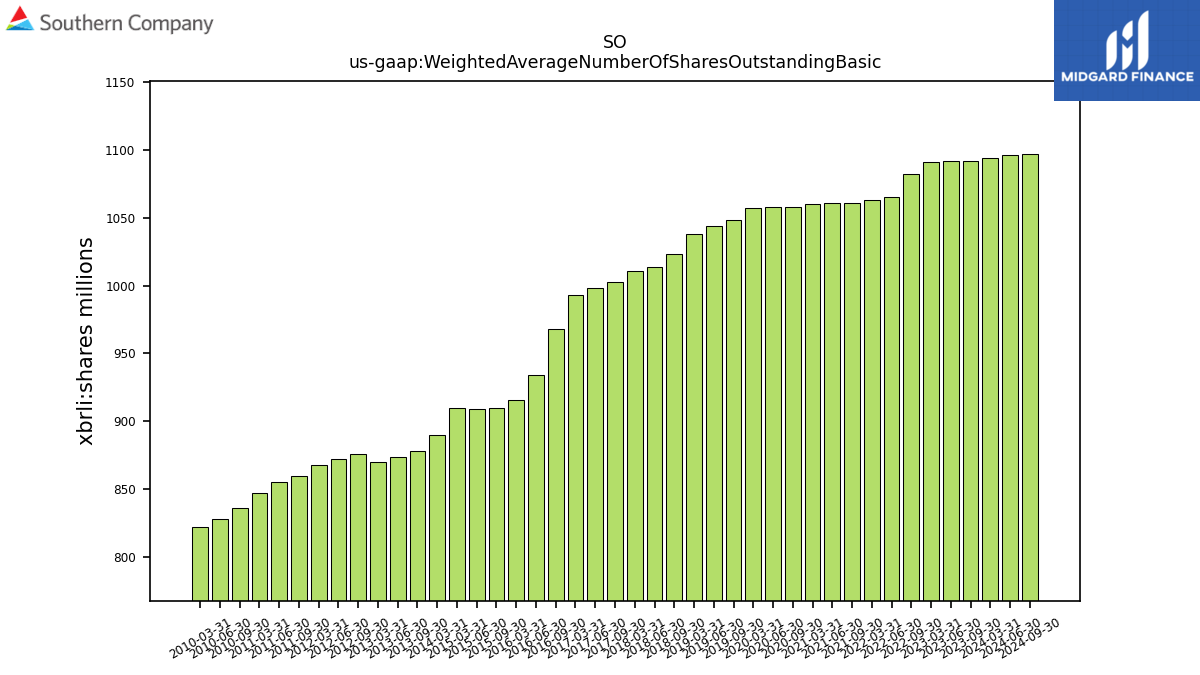
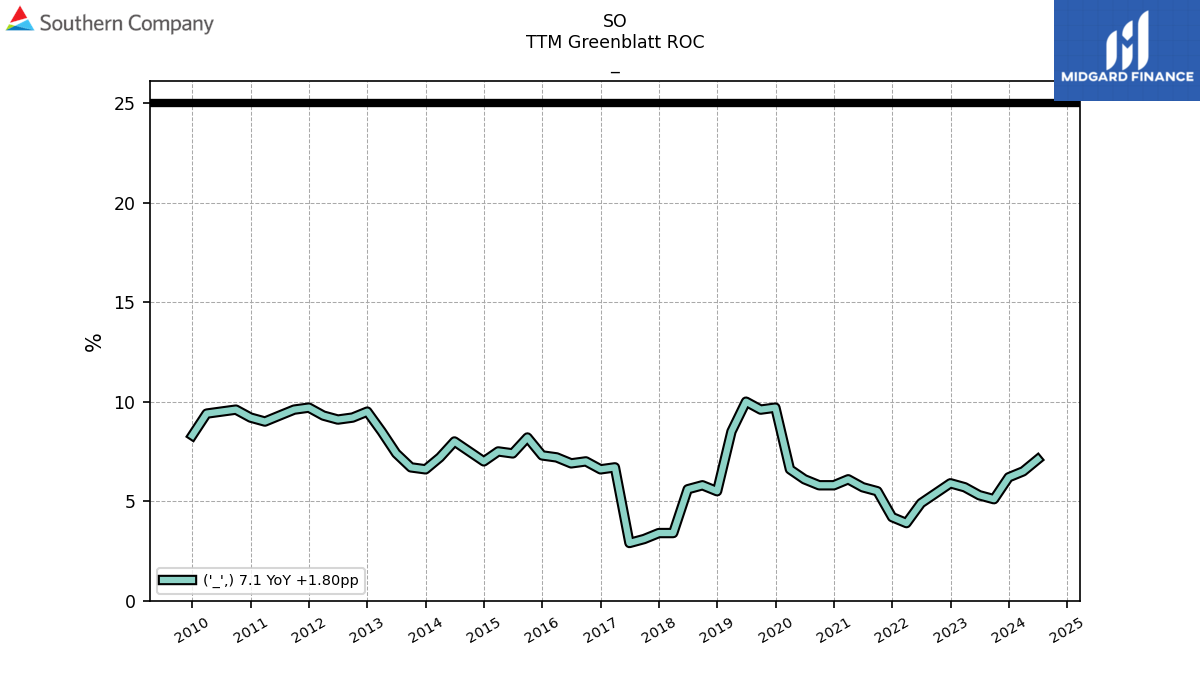
| $SO$ | 2025-02-20 | 2025-05-01 | 2025-05-01 | NA | NA | SO | 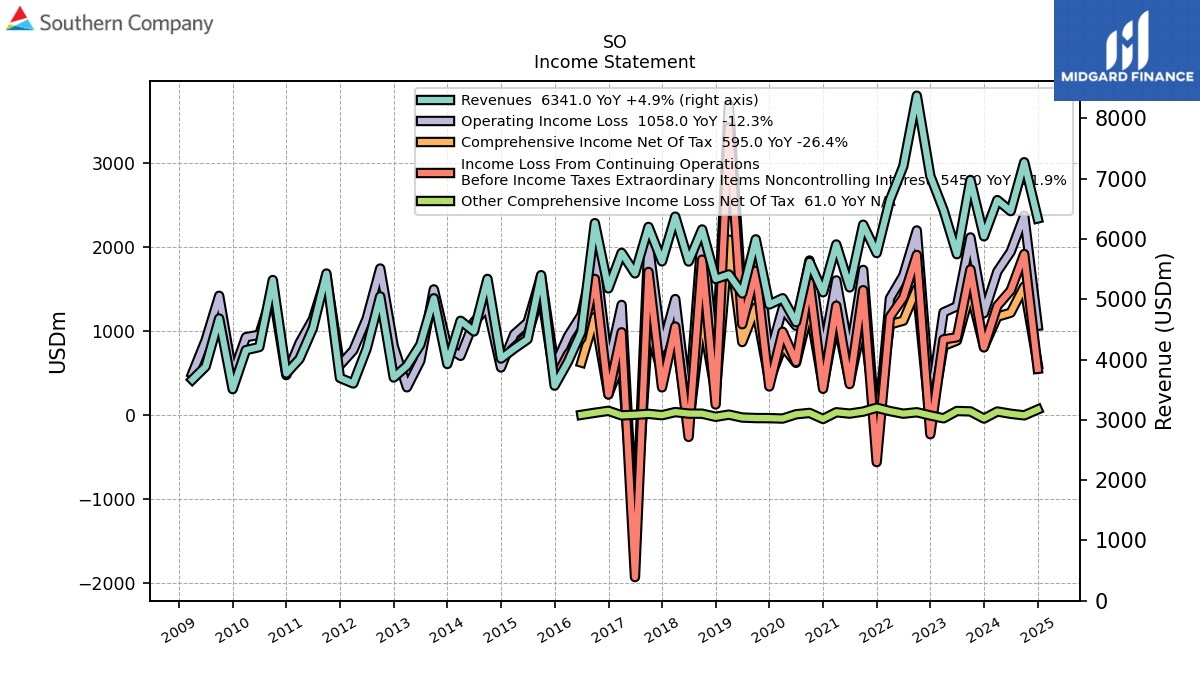 |
 |
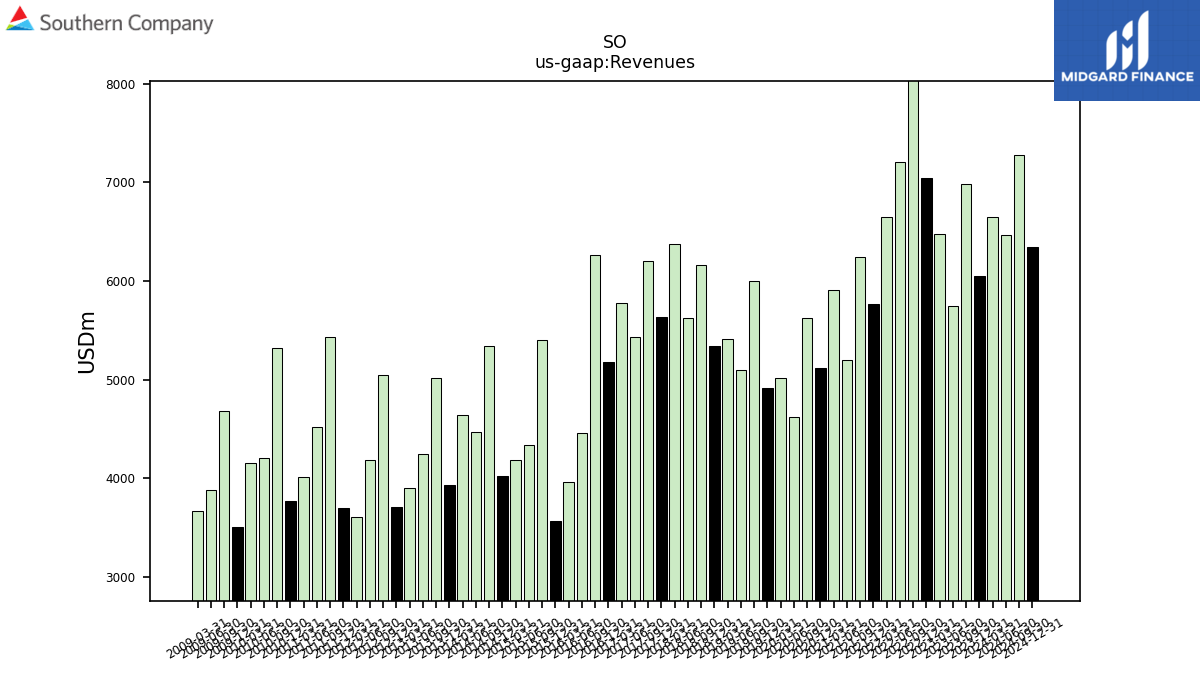 |
SO | 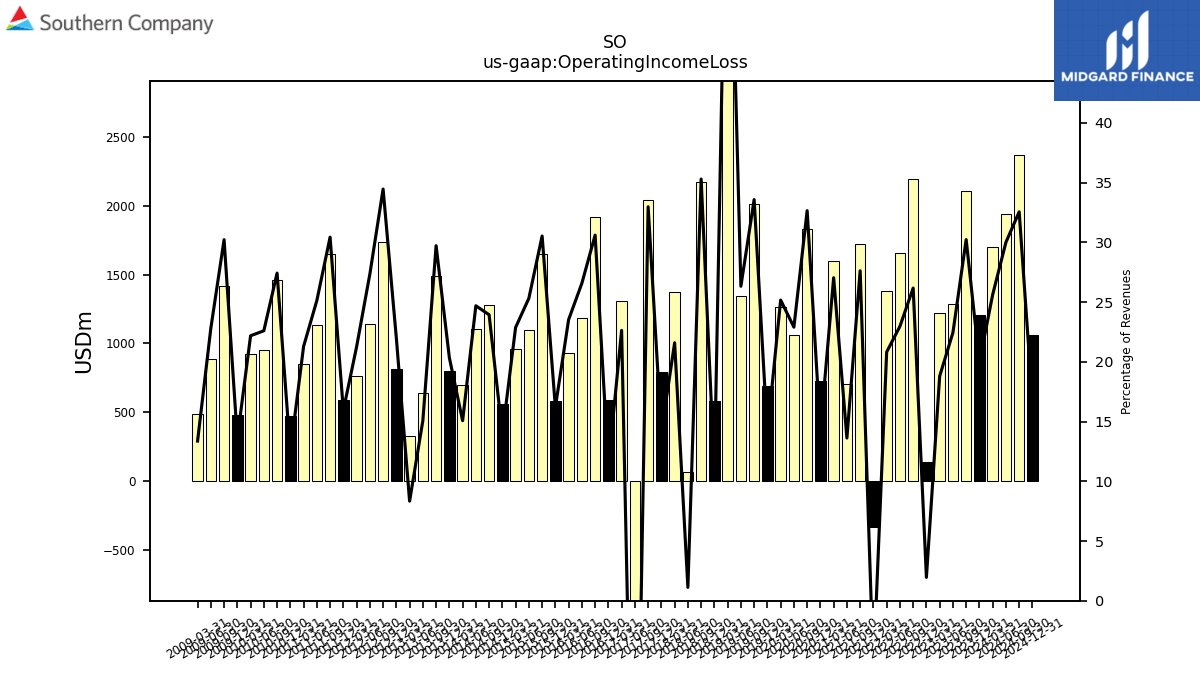 |
 |
SO | 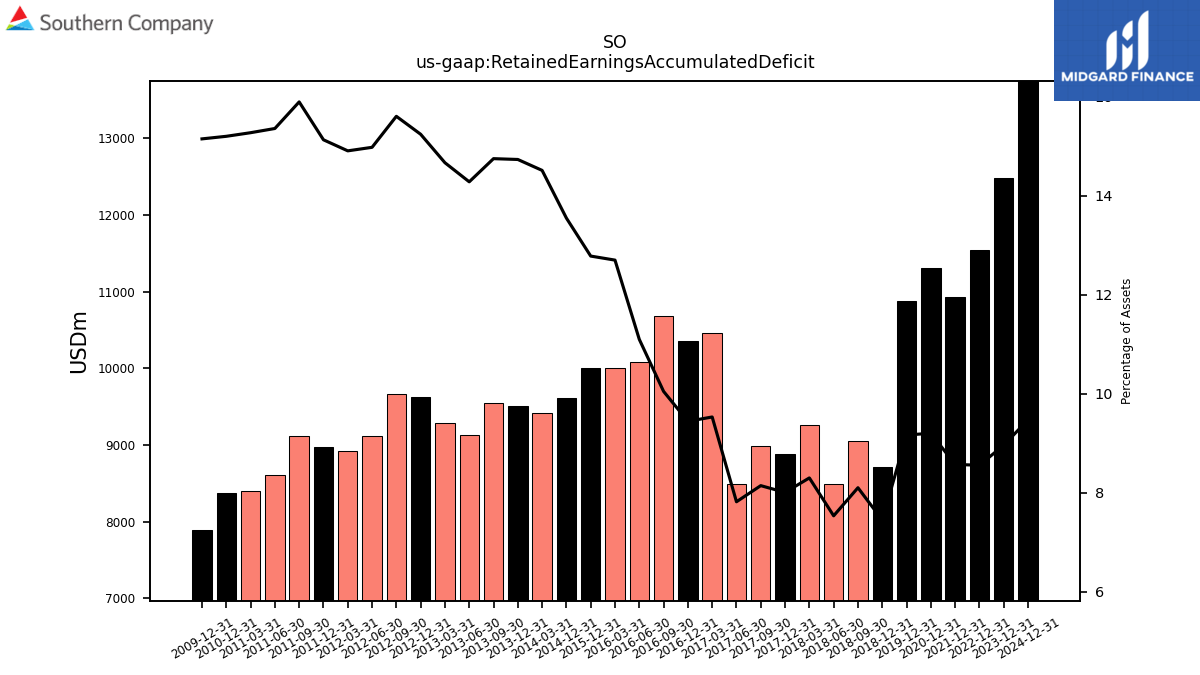 |
 |
SO | 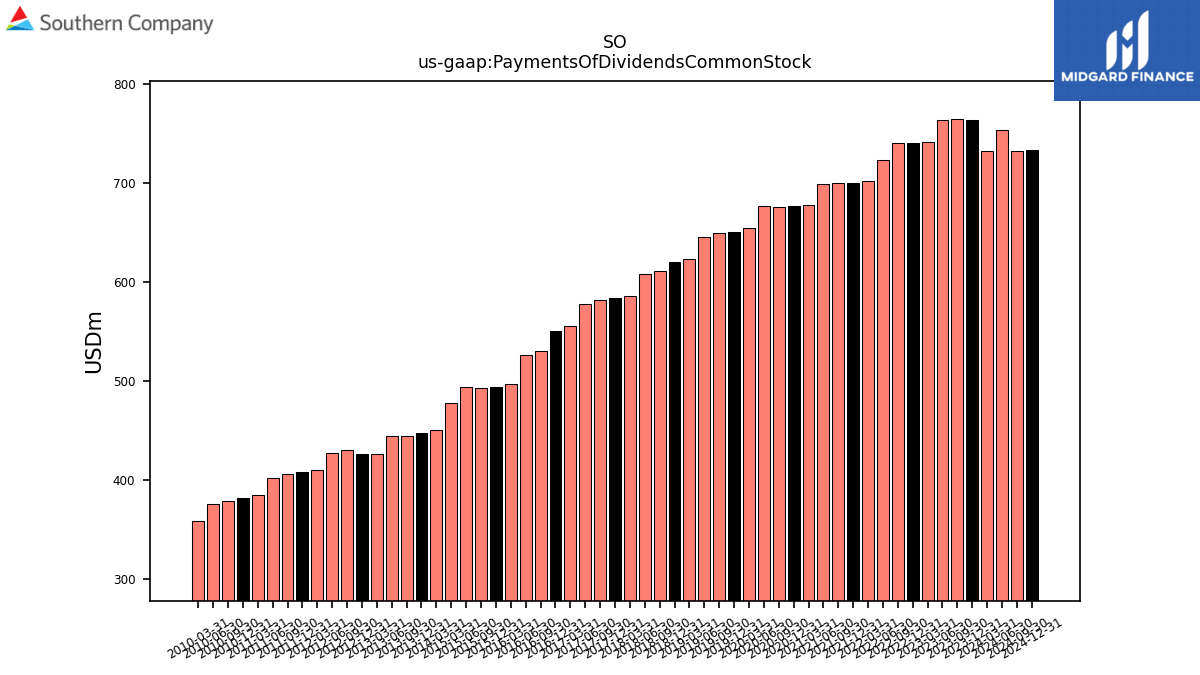 |
 |
 |
SO | |||||
| Ticker | 10K | 10Q | 8K | Sector | Industry | Logo | Forward P/E | Revenue Growth | Ticker | Income | EPS | Revenues | Ticker | GrossProfit | OperatingIncome | LongTermDebt | Ticker | InterestExpense | RetainedEarnnings | CashFlowOperating | Ticker | Dividends | SharesOutstanding | TTMGreenblattROC | |
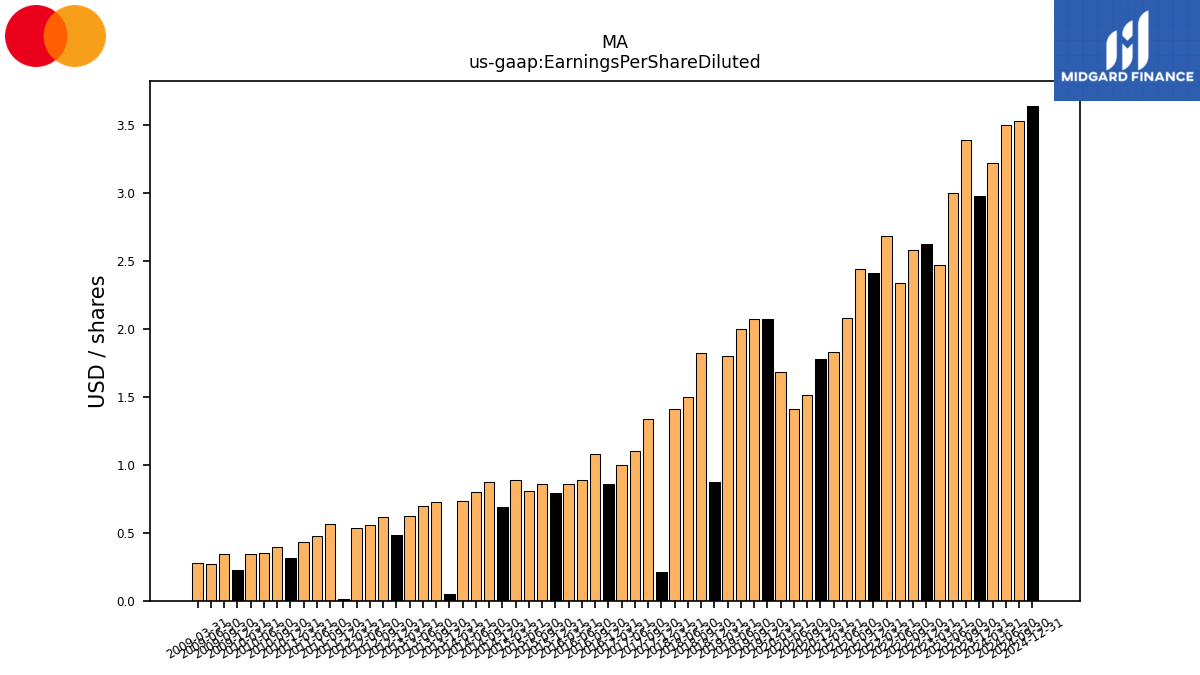
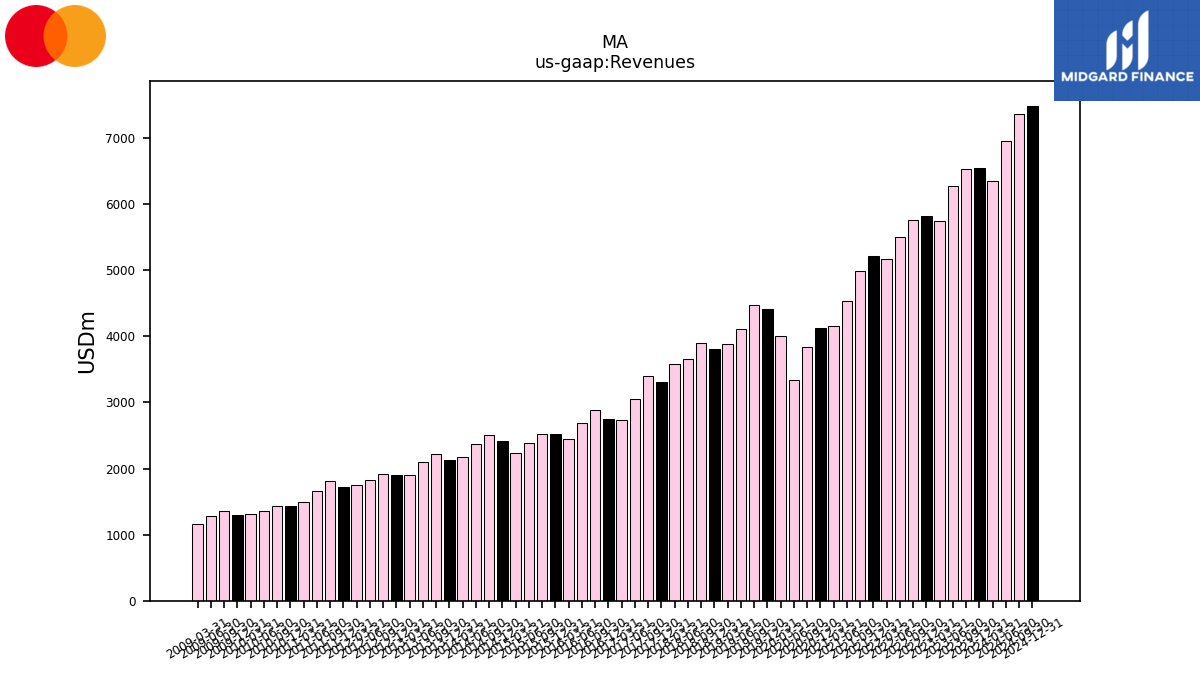
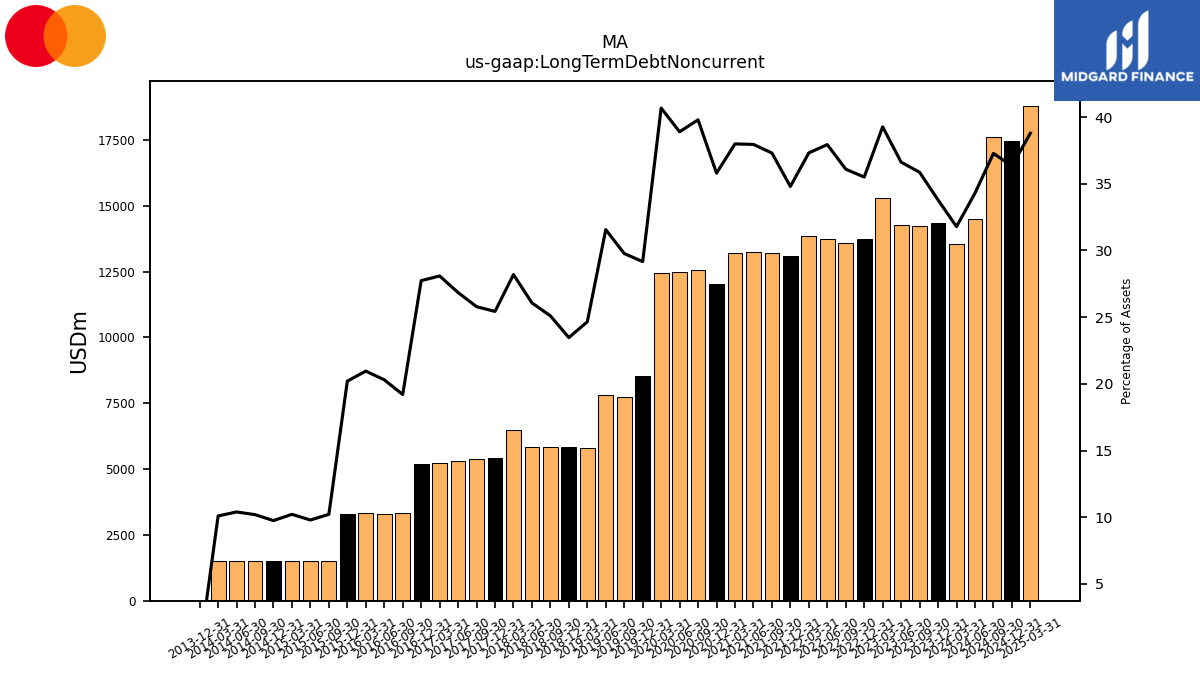
| $MA$ | 2025-02-12 | 2025-05-01 | 2025-05-01 | NA | NA | MA | 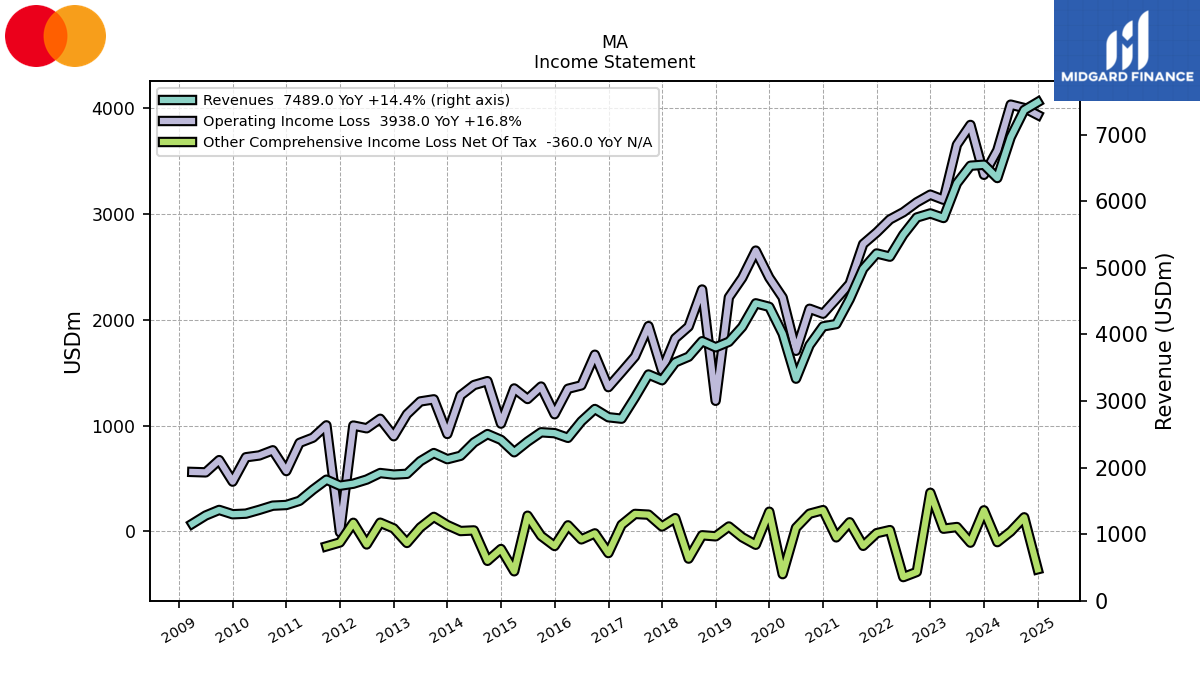 |
 |
 |
MA | 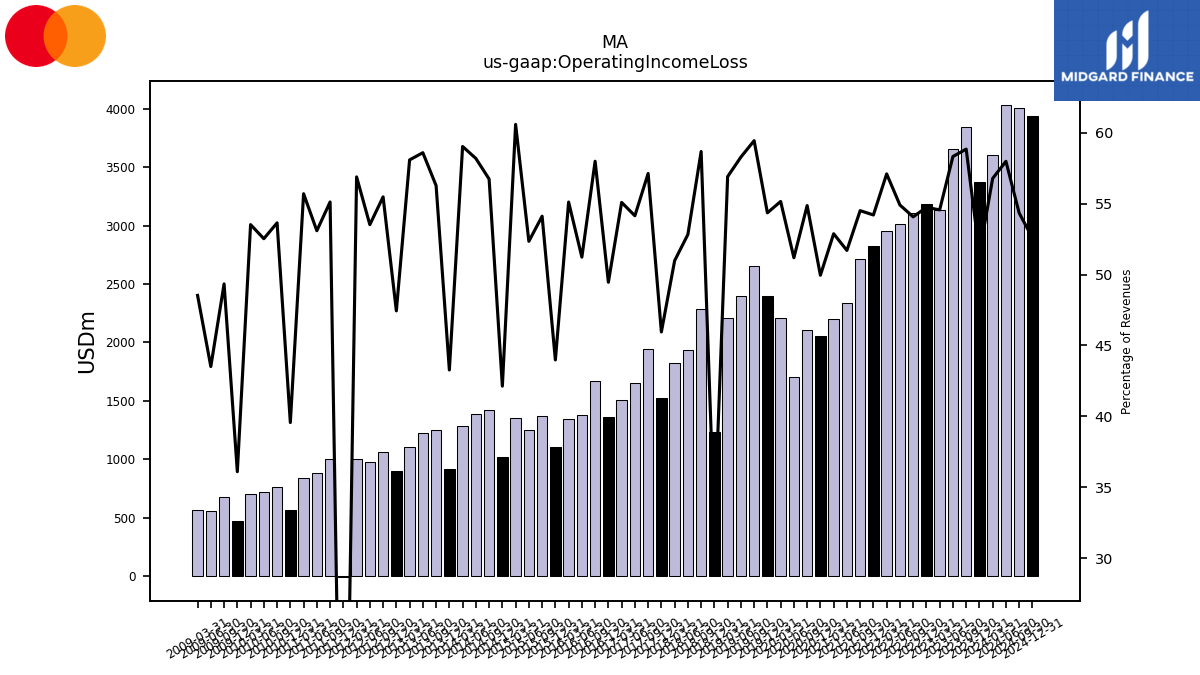 |
 |
MA | 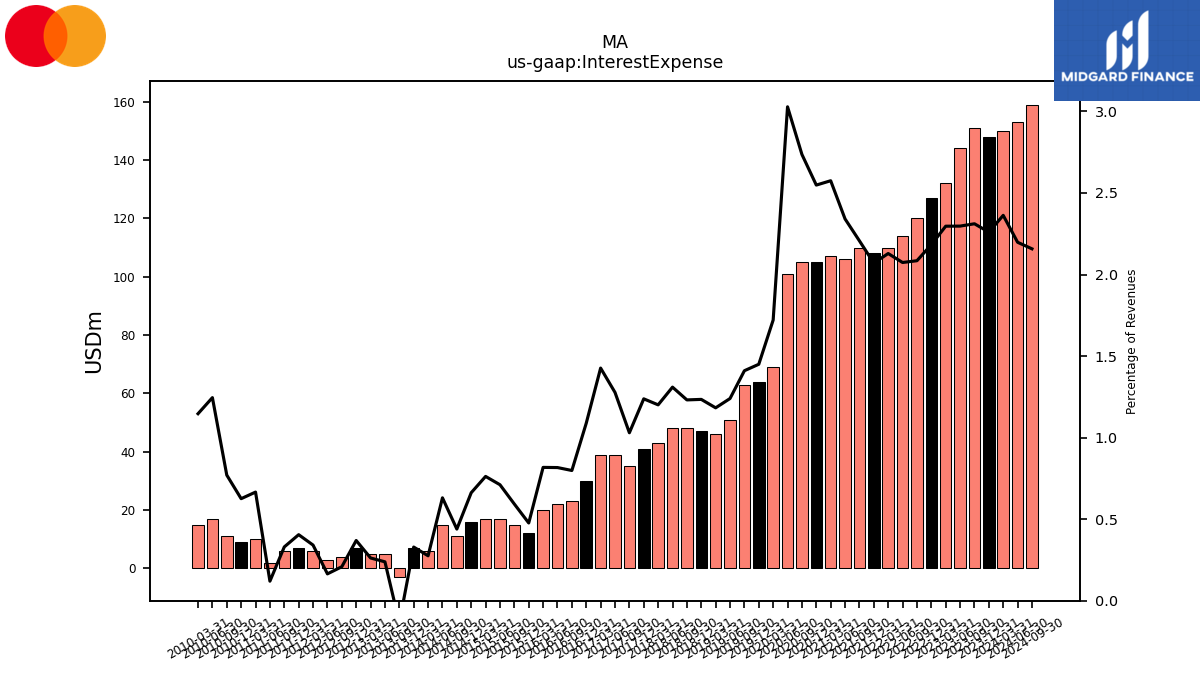 |
 |
 |
MA |  |
 |
MA | |||||
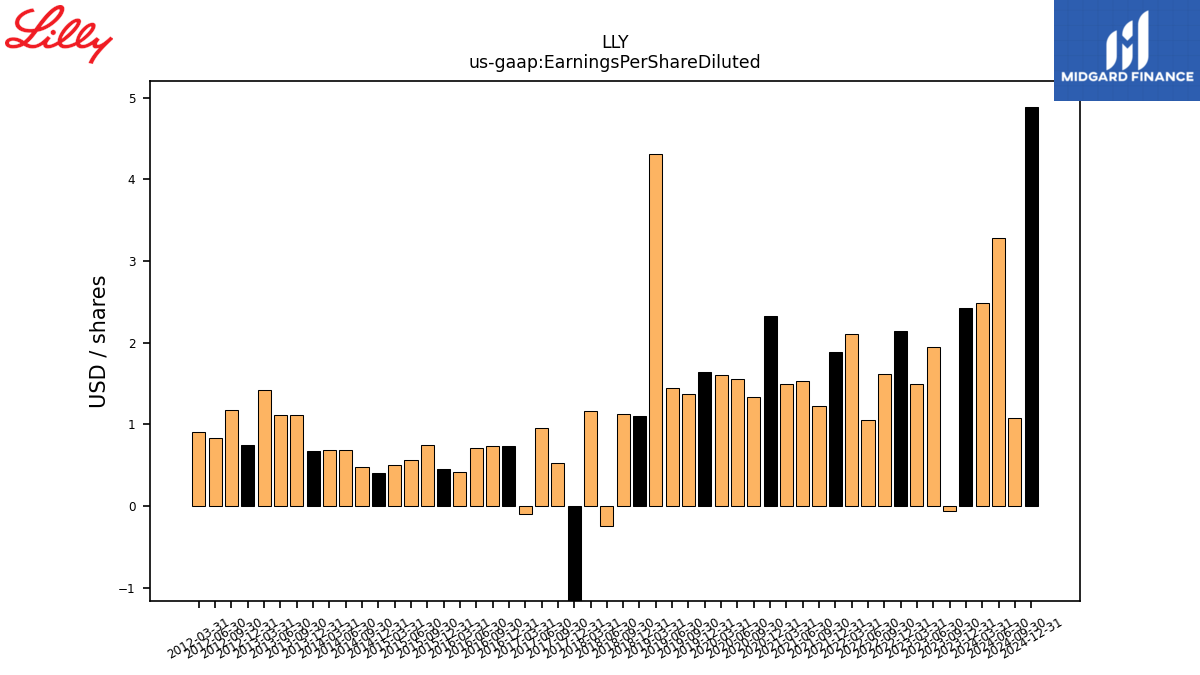
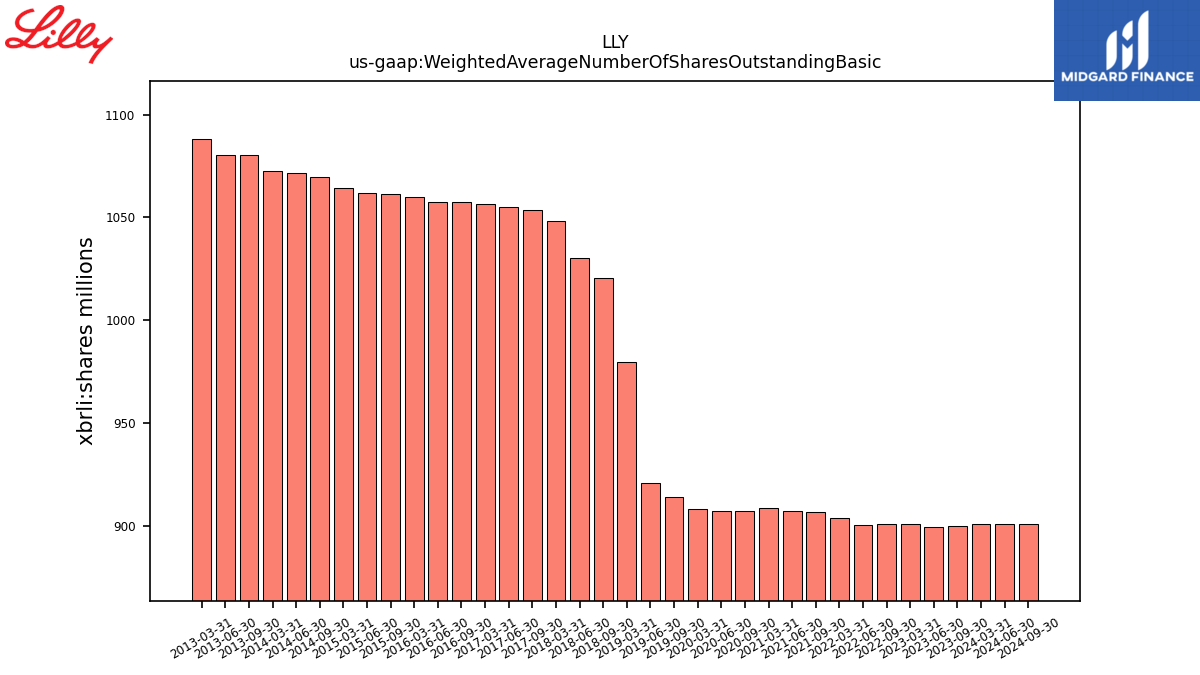
| $LLY$ | 2025-02-19 | 2025-05-01 | 2025-05-01 |  |
NA | NA | LLY | 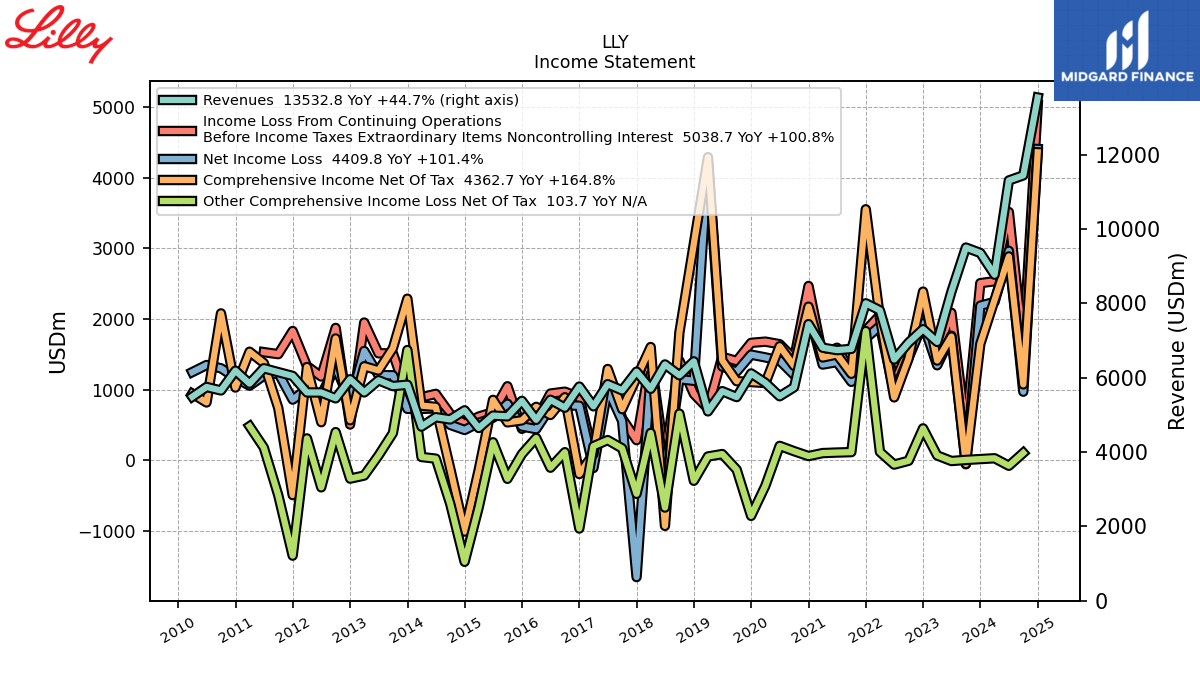 |
 |
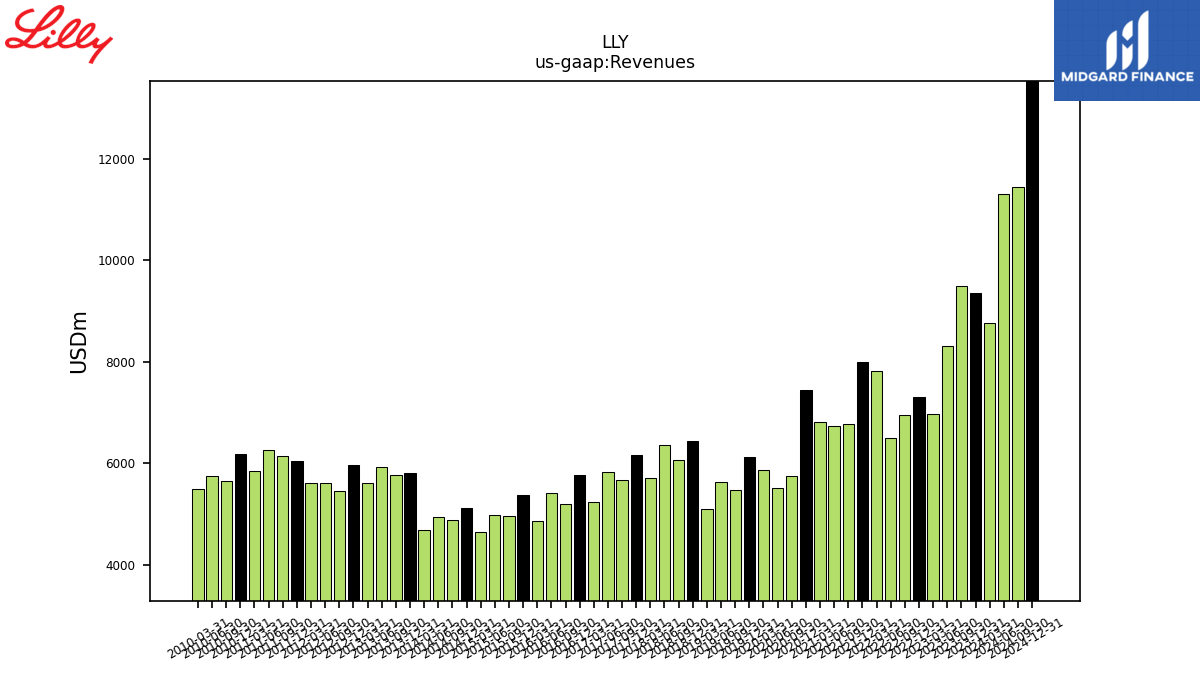 |
LLY | 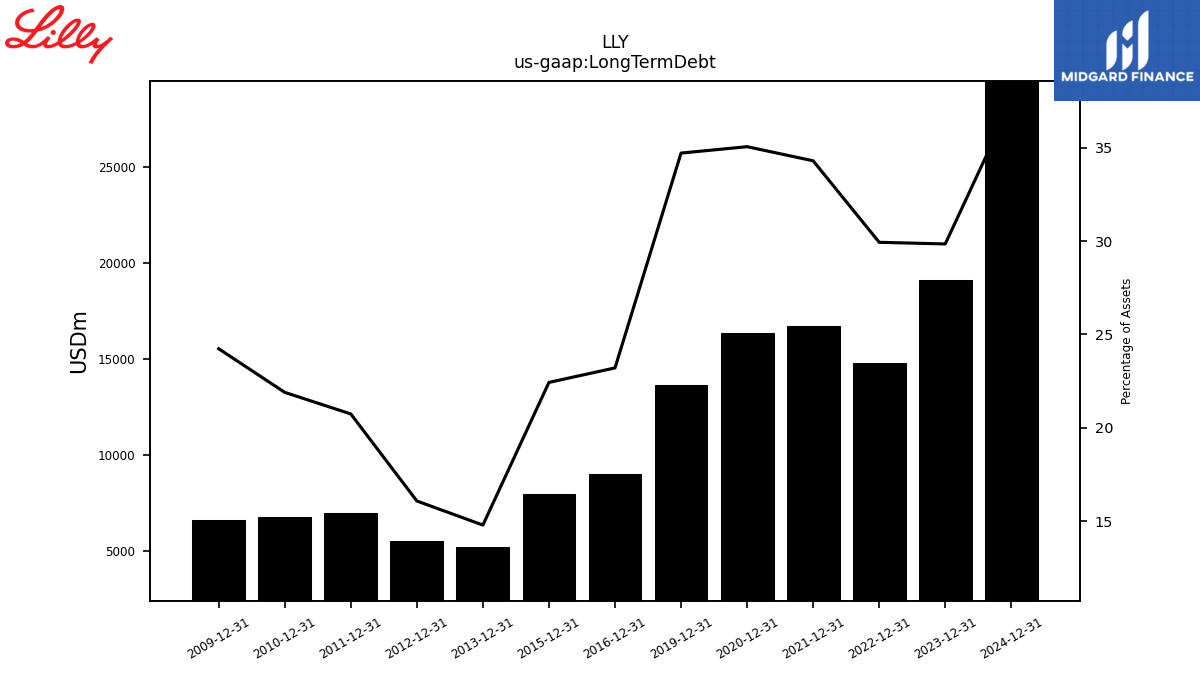 |
LLY |  |
 |
 |
LLY |  |
 |
LLY | |||||
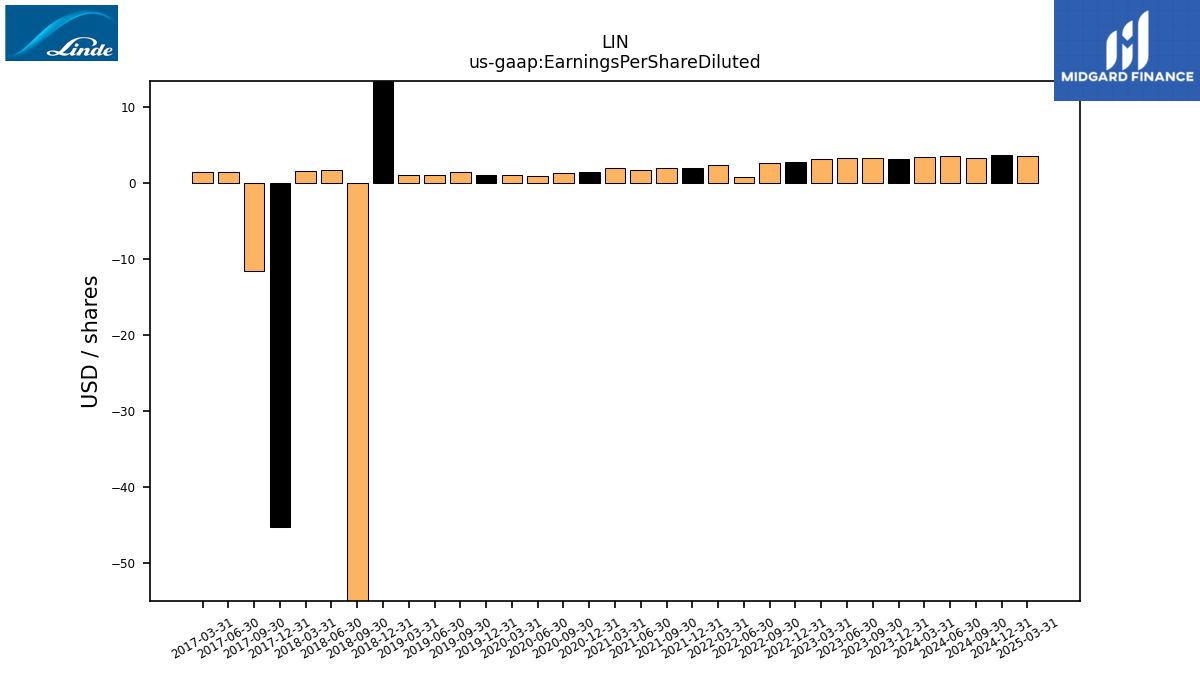
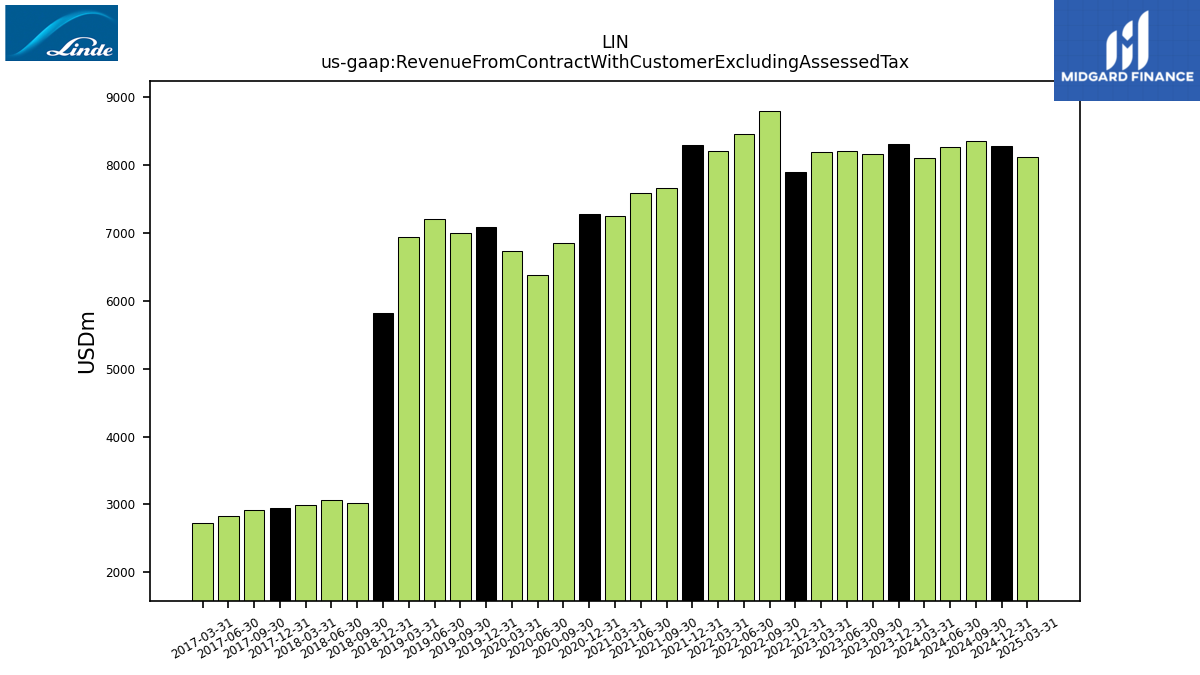
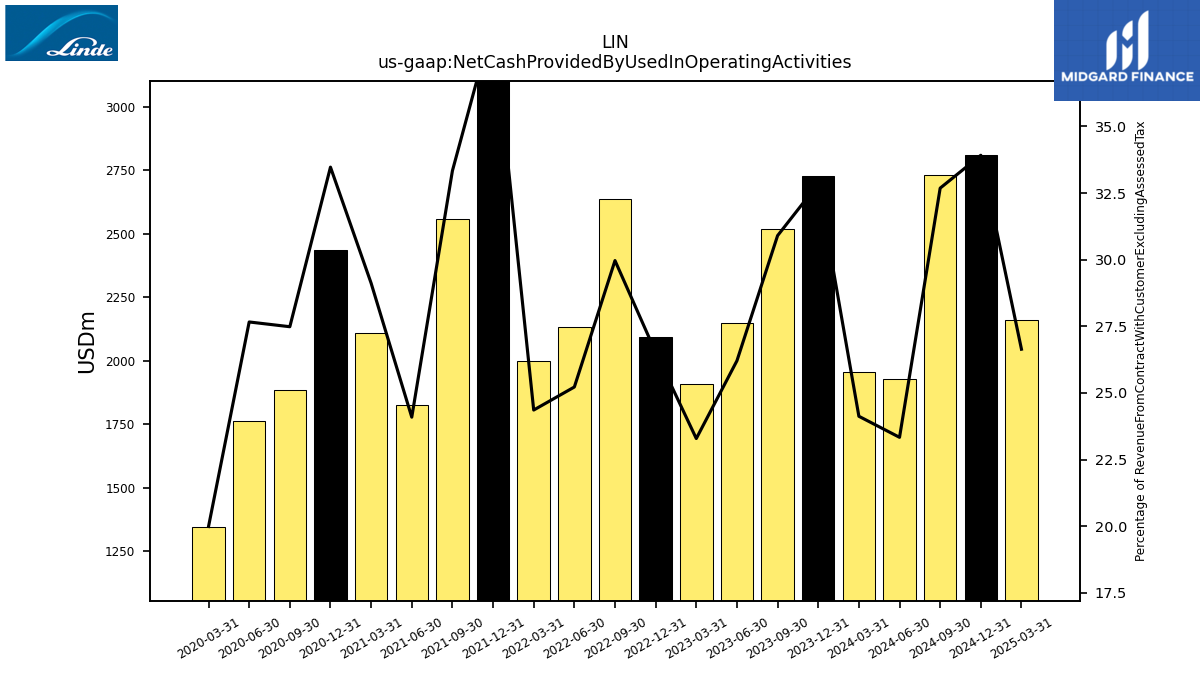
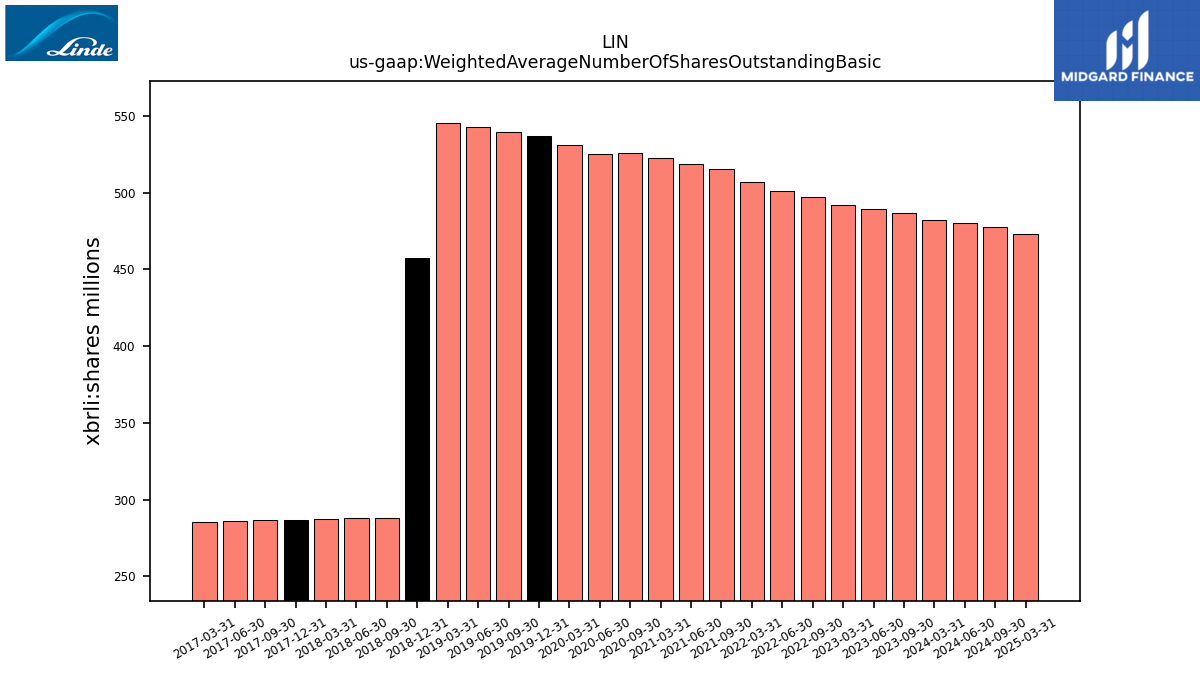
| $LIN$ | 2025-02-26 | 2025-05-01 | 2025-05-01 |  |
NA | NA | LIN | 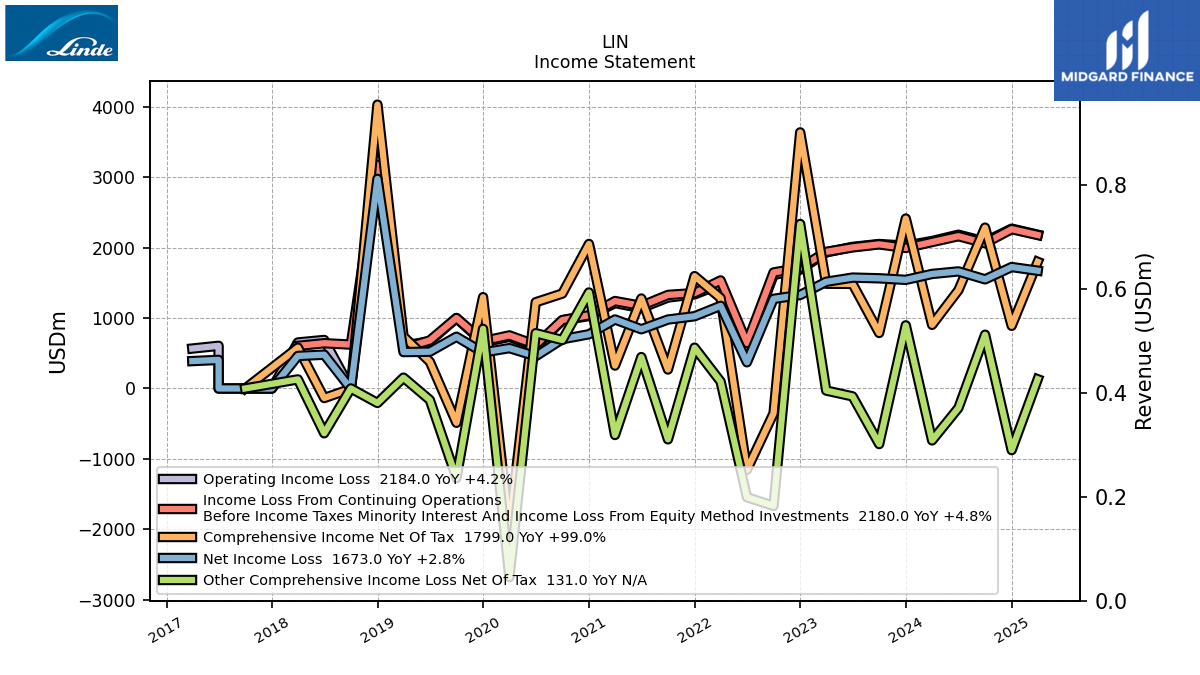 |
 |
 |
LIN | 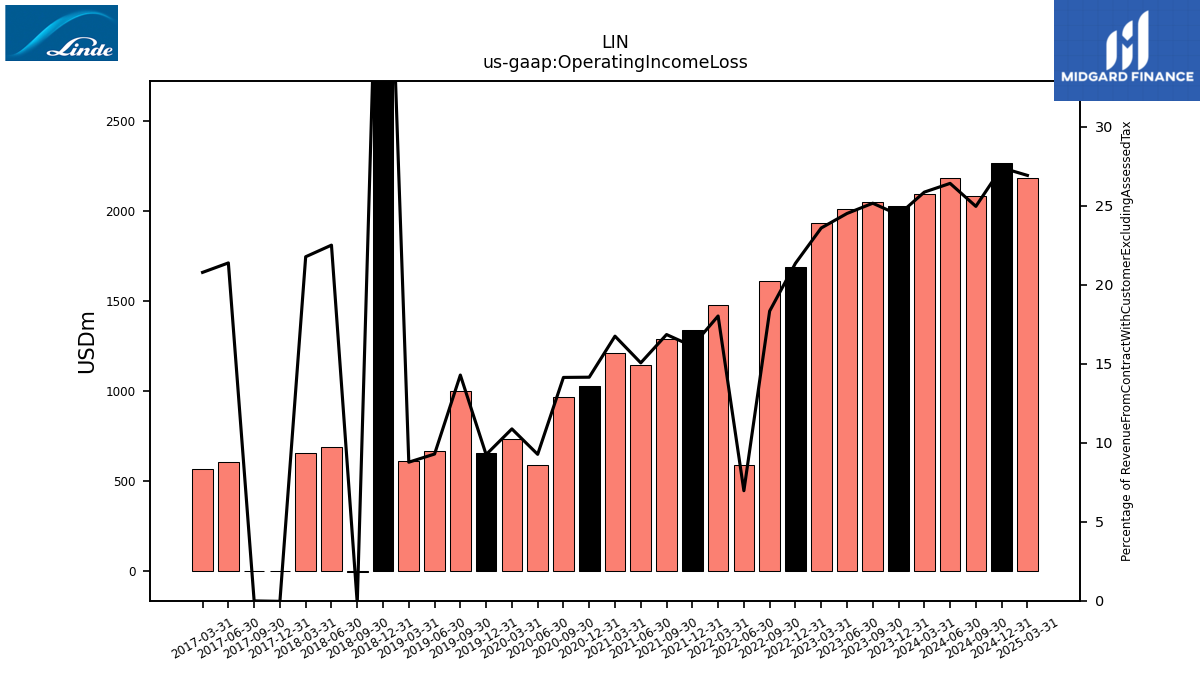 |
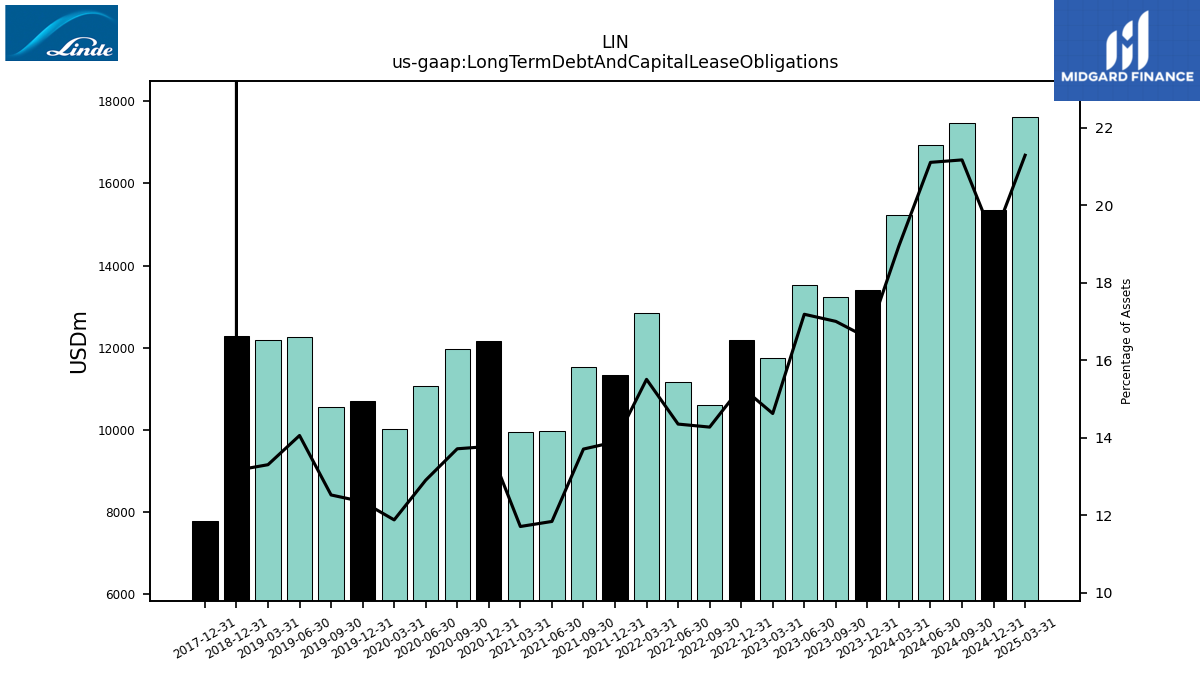 |
LIN | 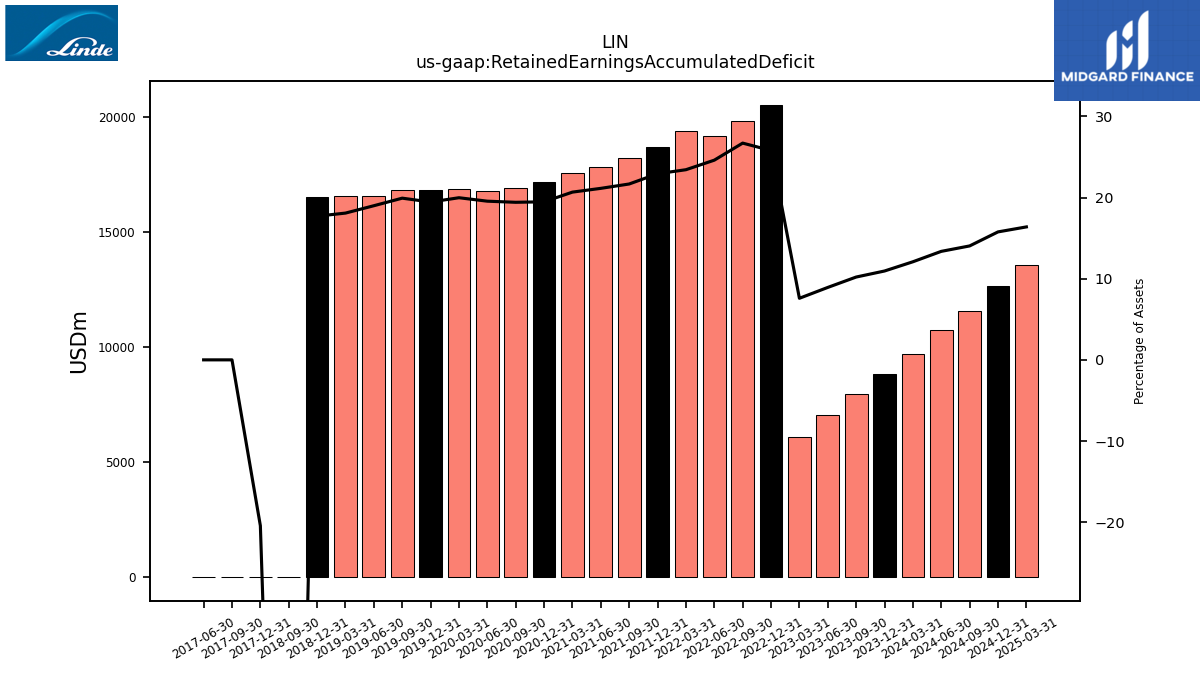 |
 |
LIN | 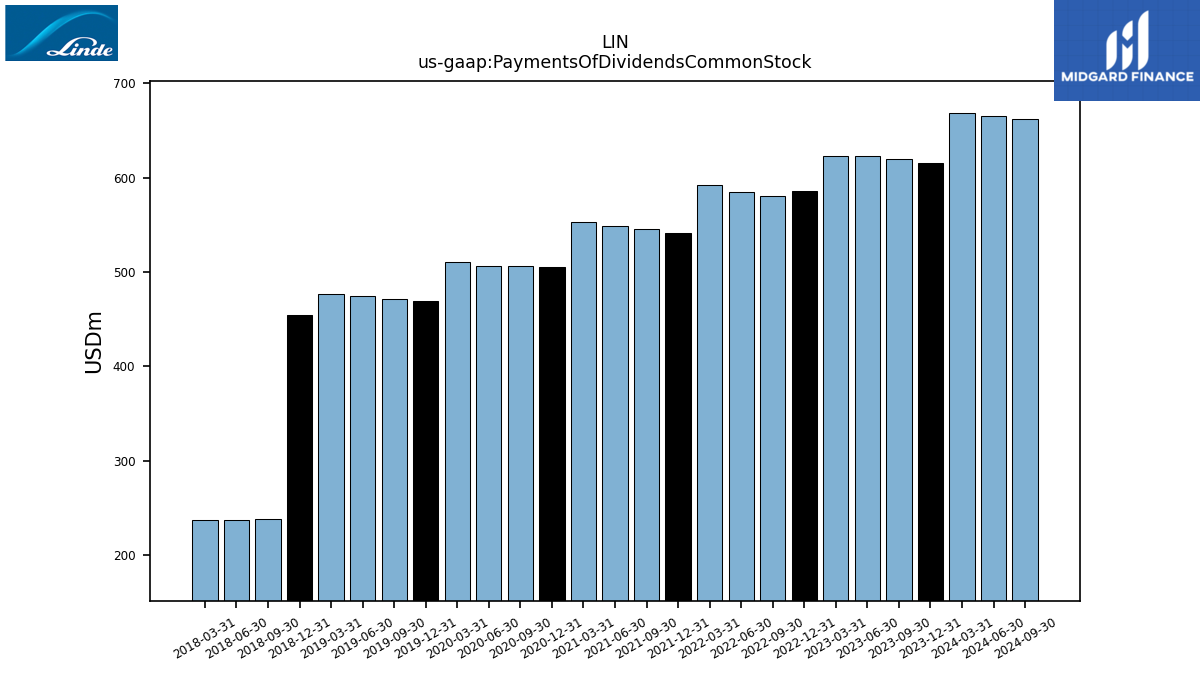 |
 |
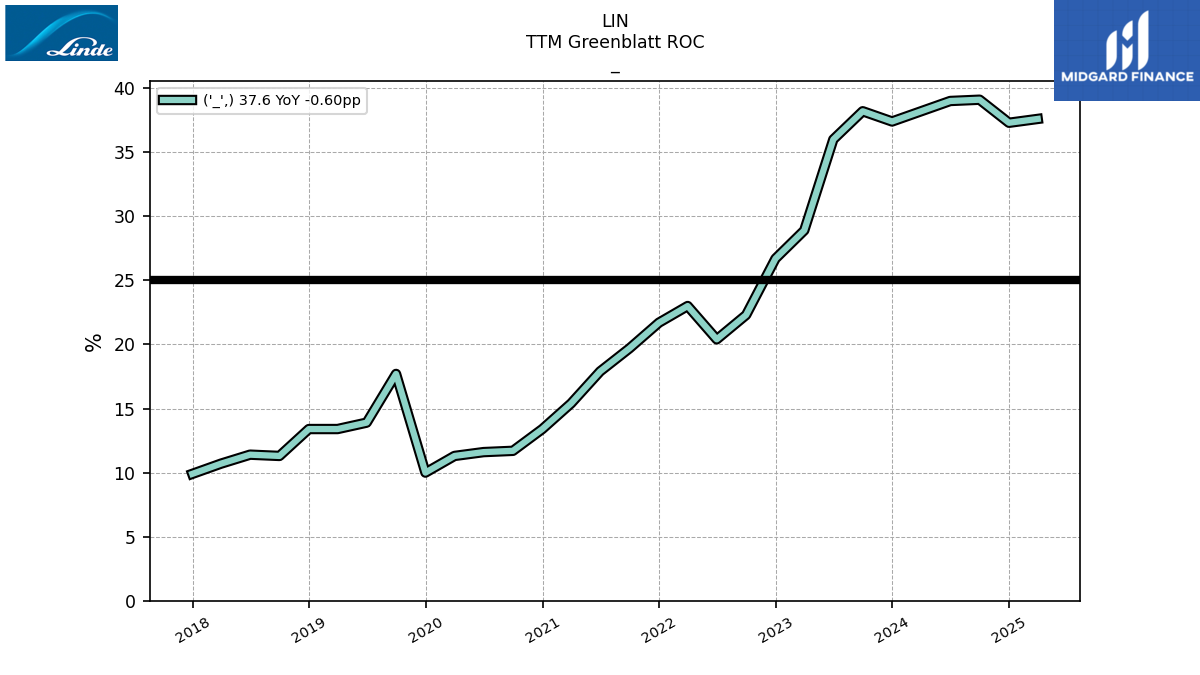 |
LIN | ||||
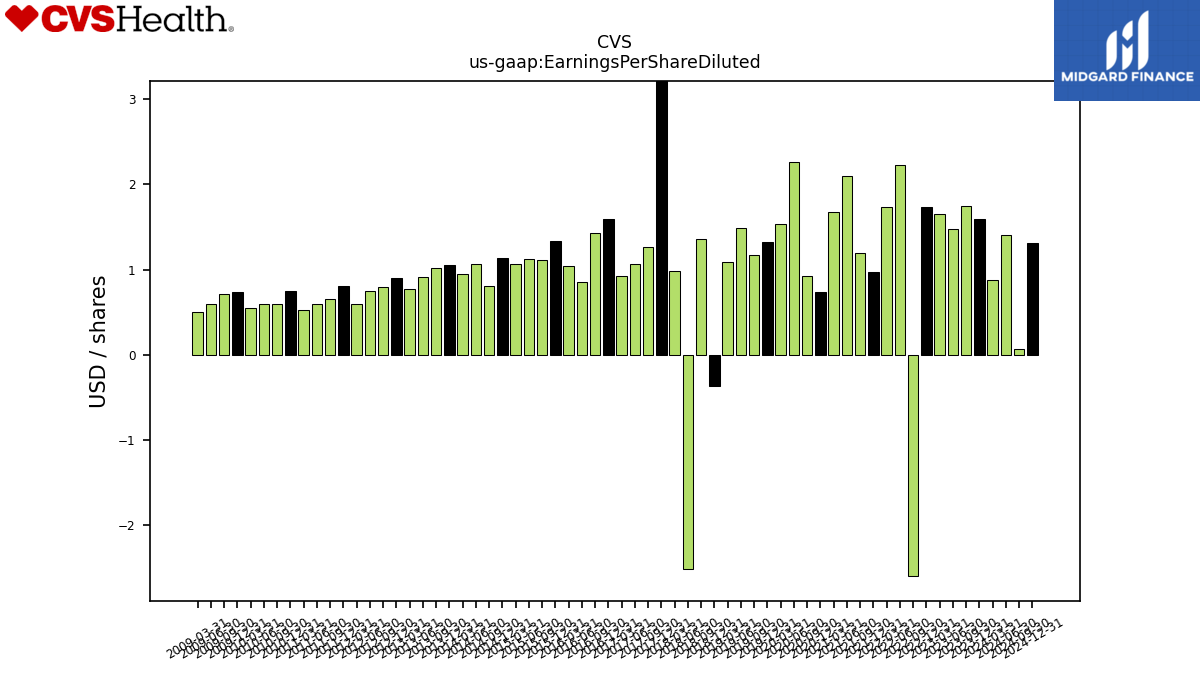
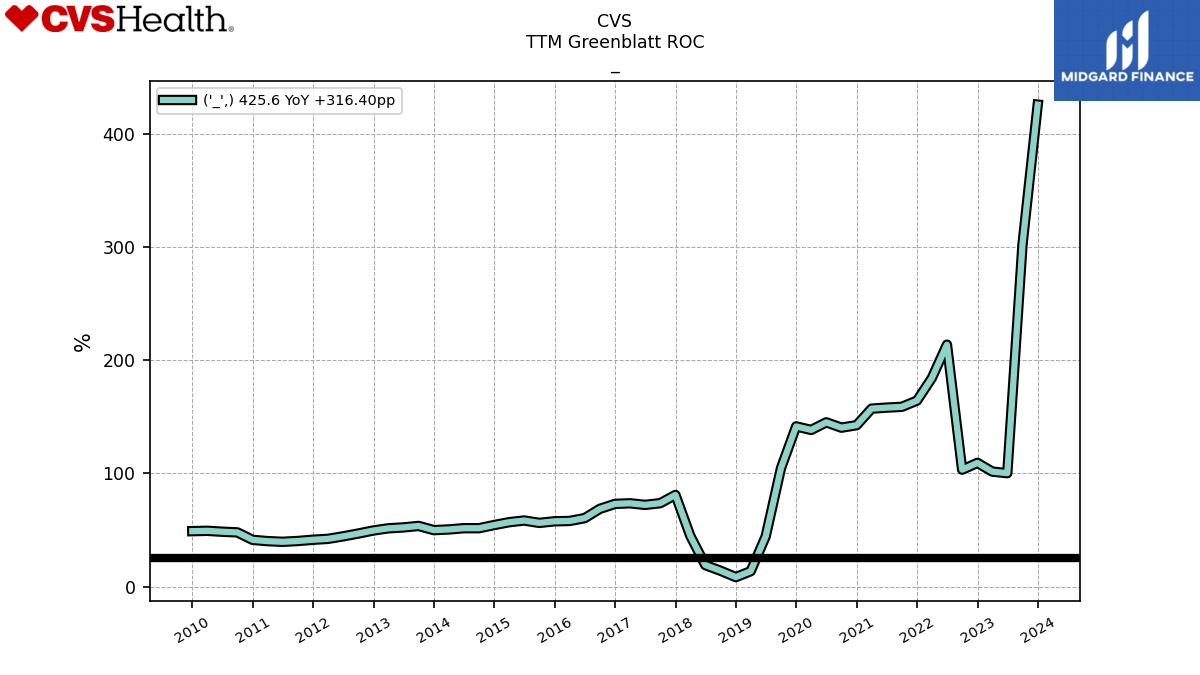
| $CVS$ | 2025-02-12 | 2025-05-01 | 2025-05-01 | NA | NA | CVS | 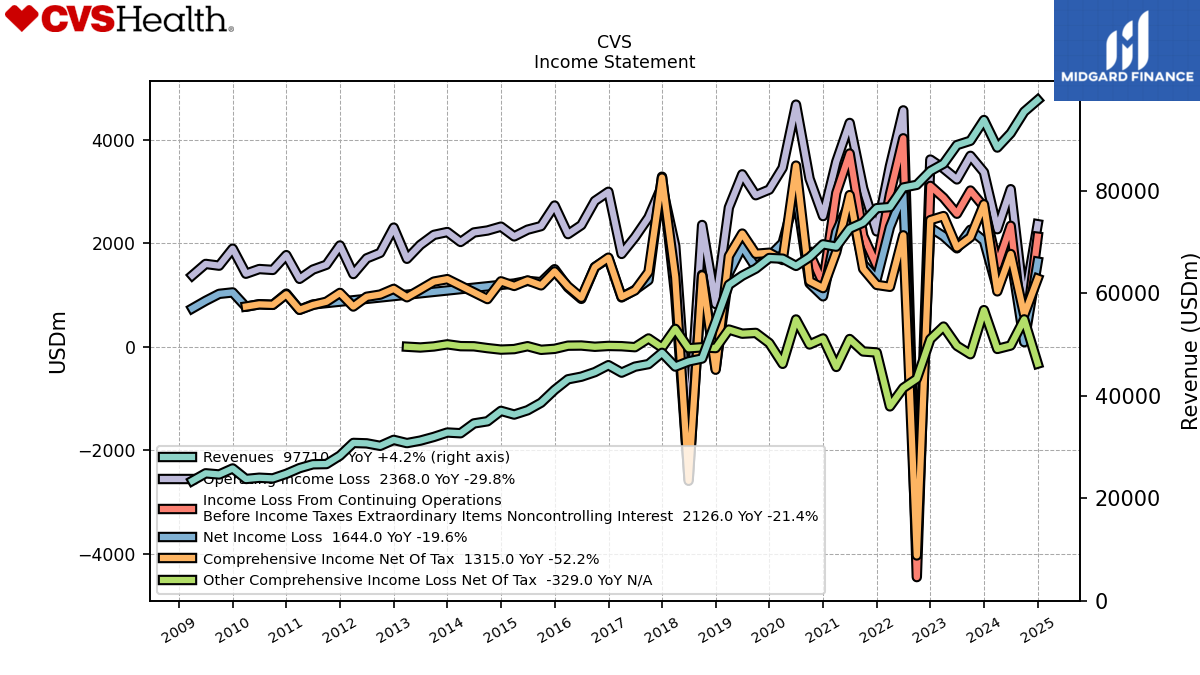 |
 |
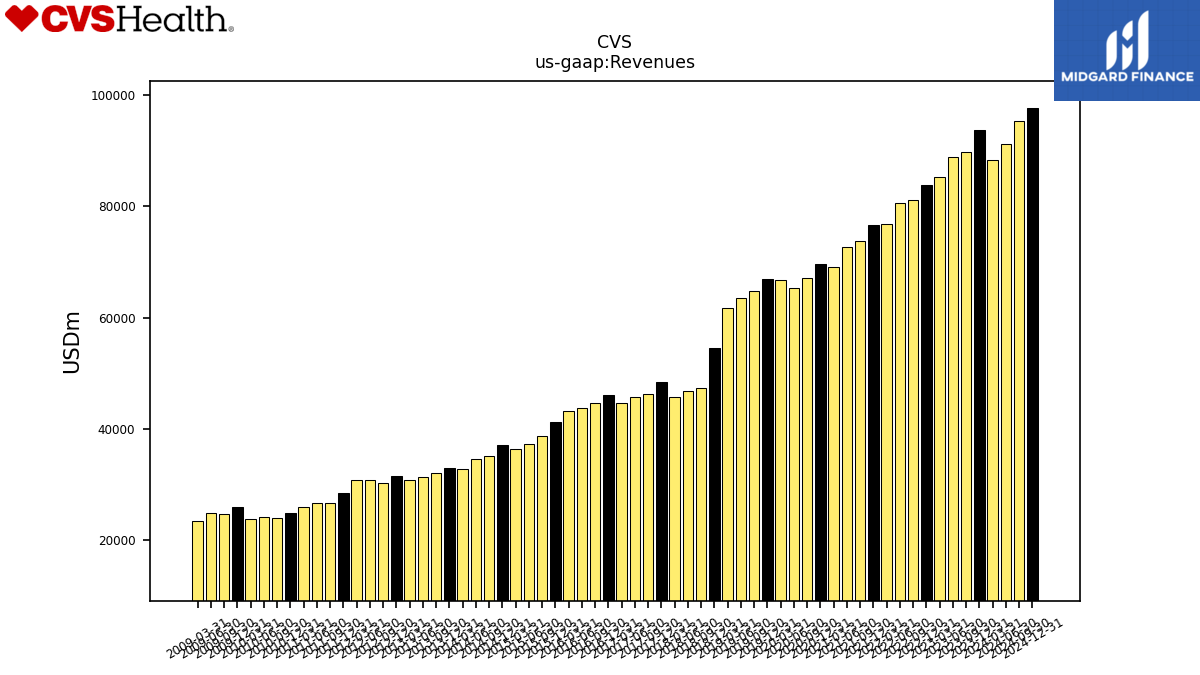 |
CVS | 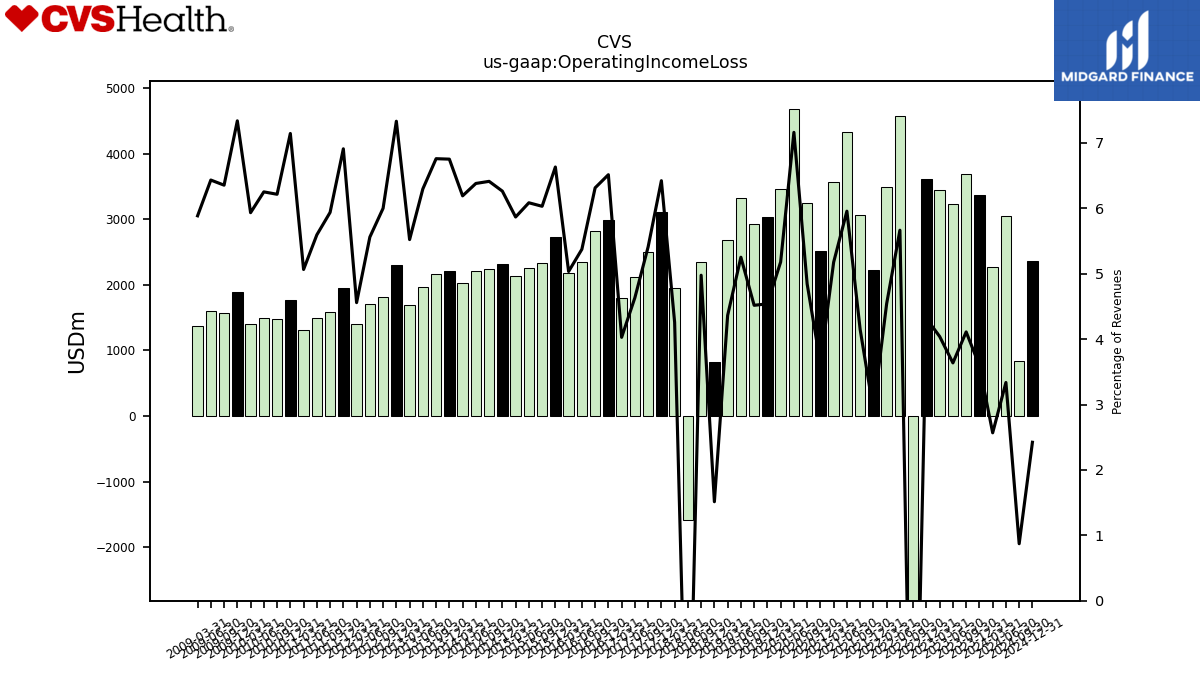 |
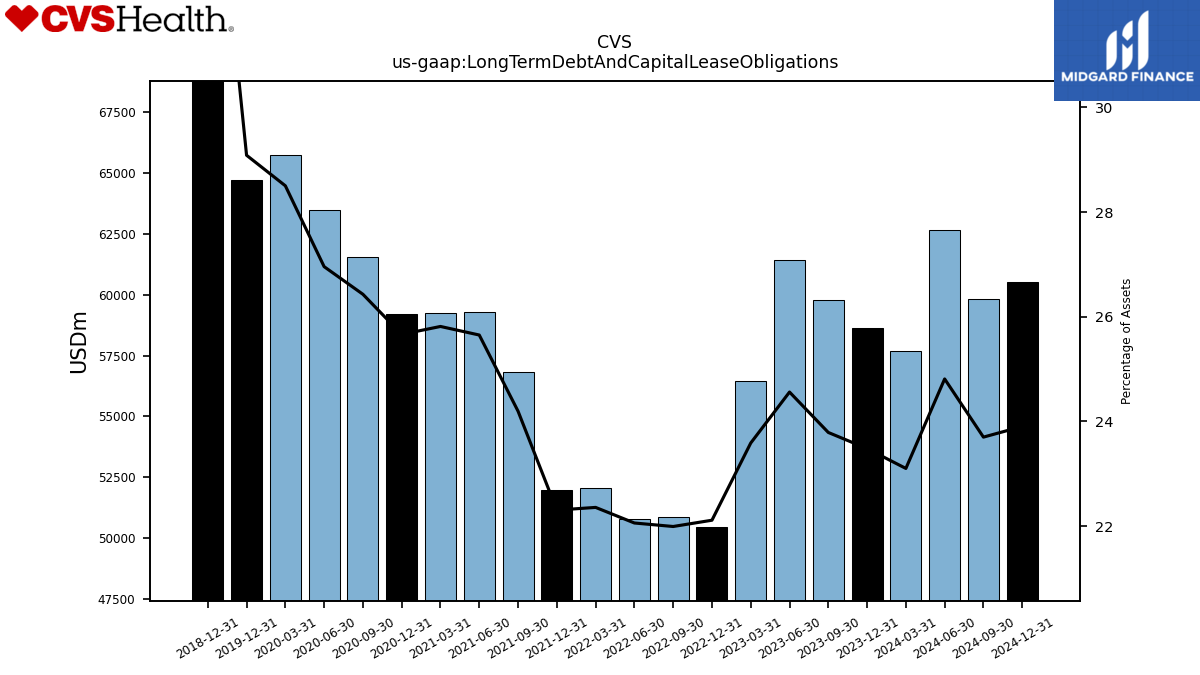 |
CVS |  |
 |
 |
CVS |  |
 |
CVS | |||||
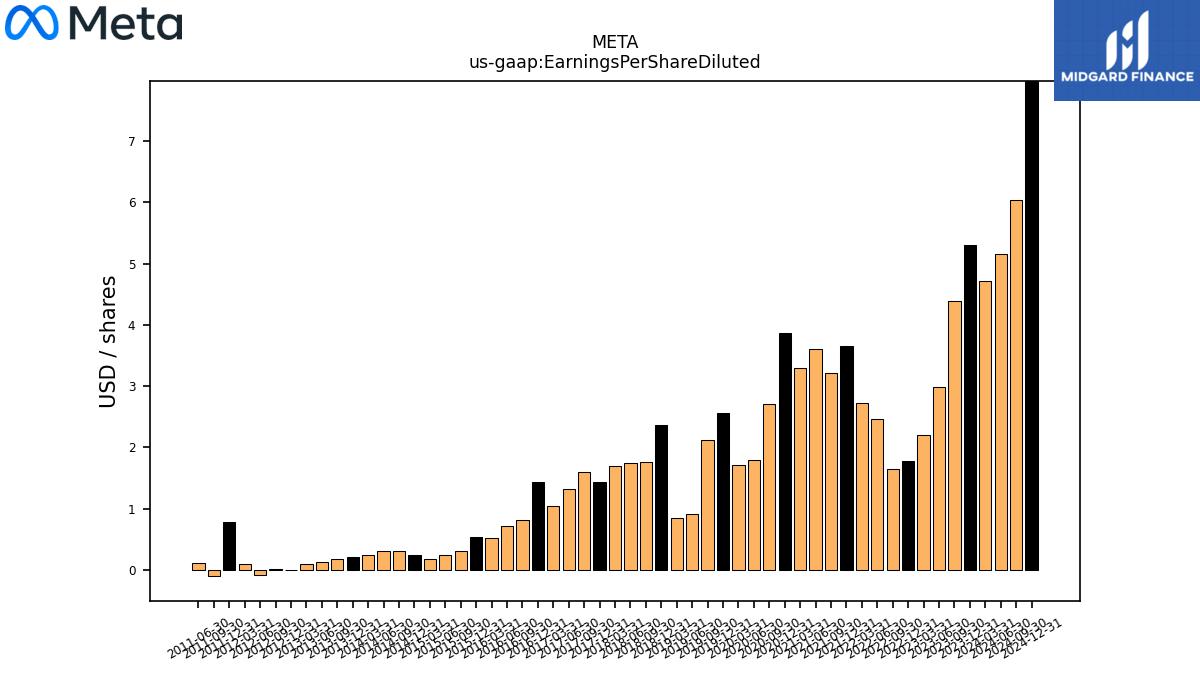
| $META$ | 2025-01-30 | 2025-05-01 | 2025-04-30 | NA | NA | META | 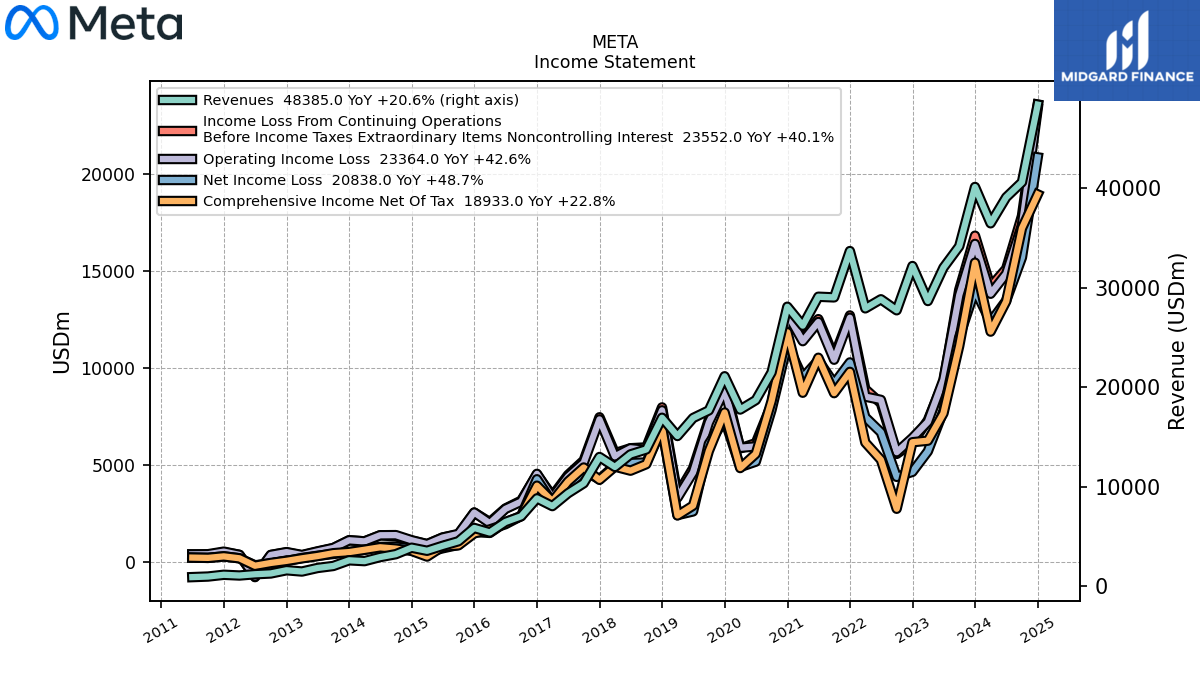 |
 |
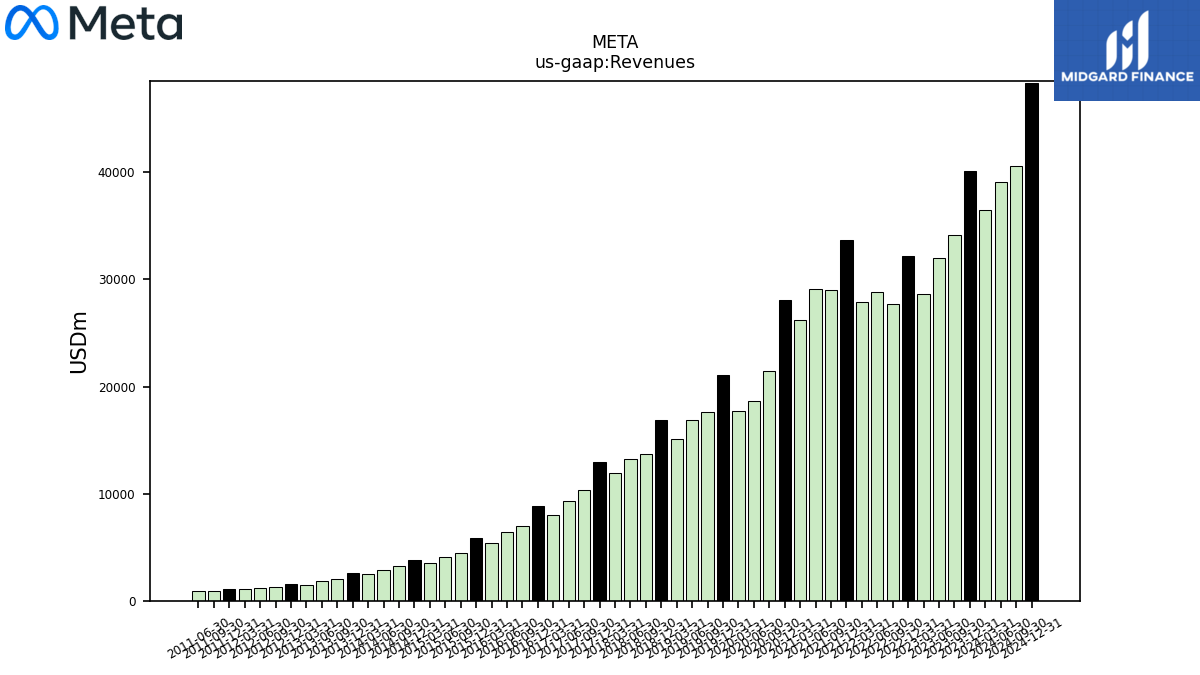 |
META | 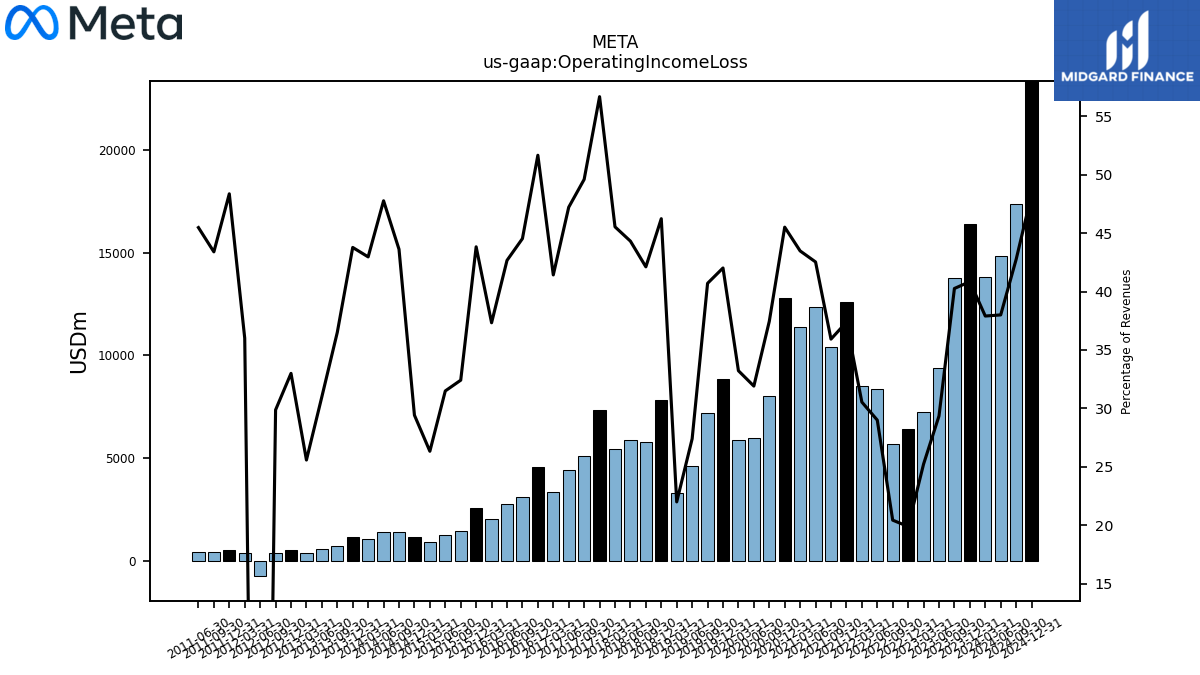 |
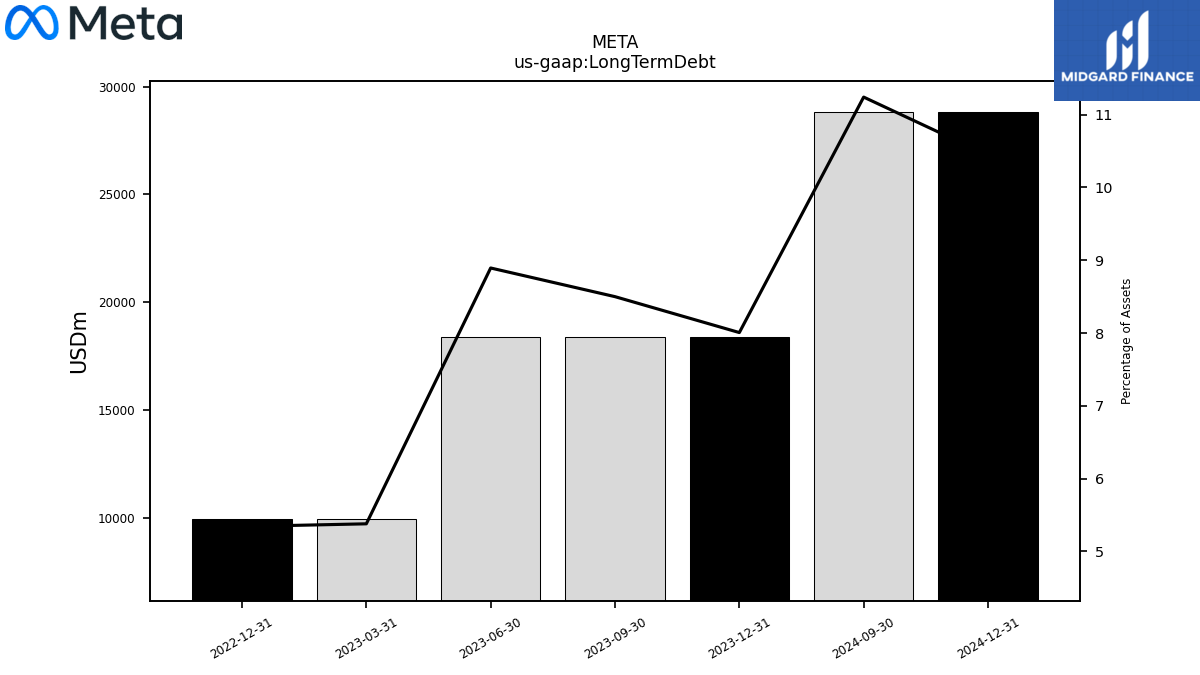 |
META | 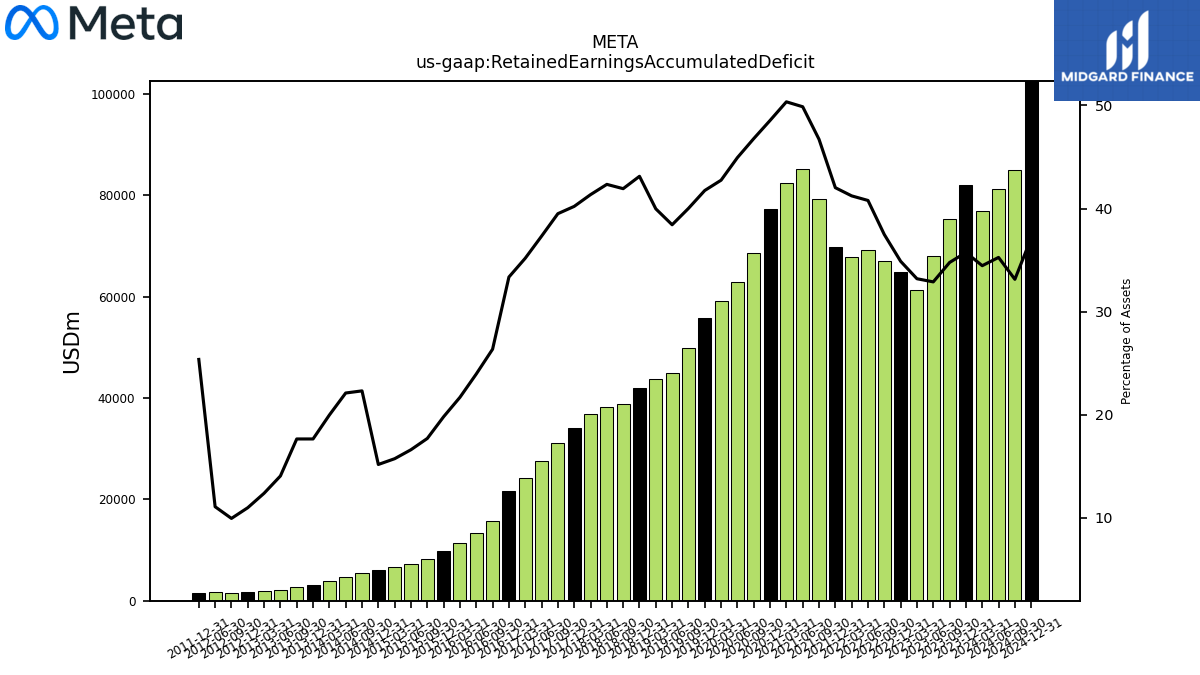 |
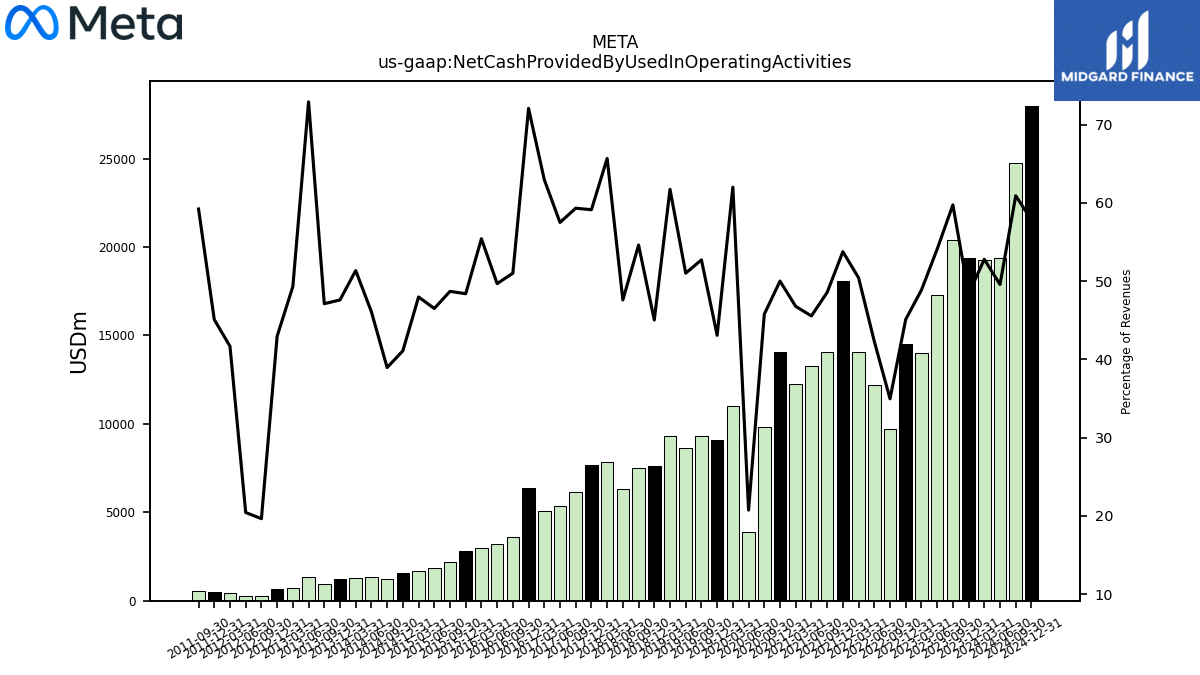 |
META | 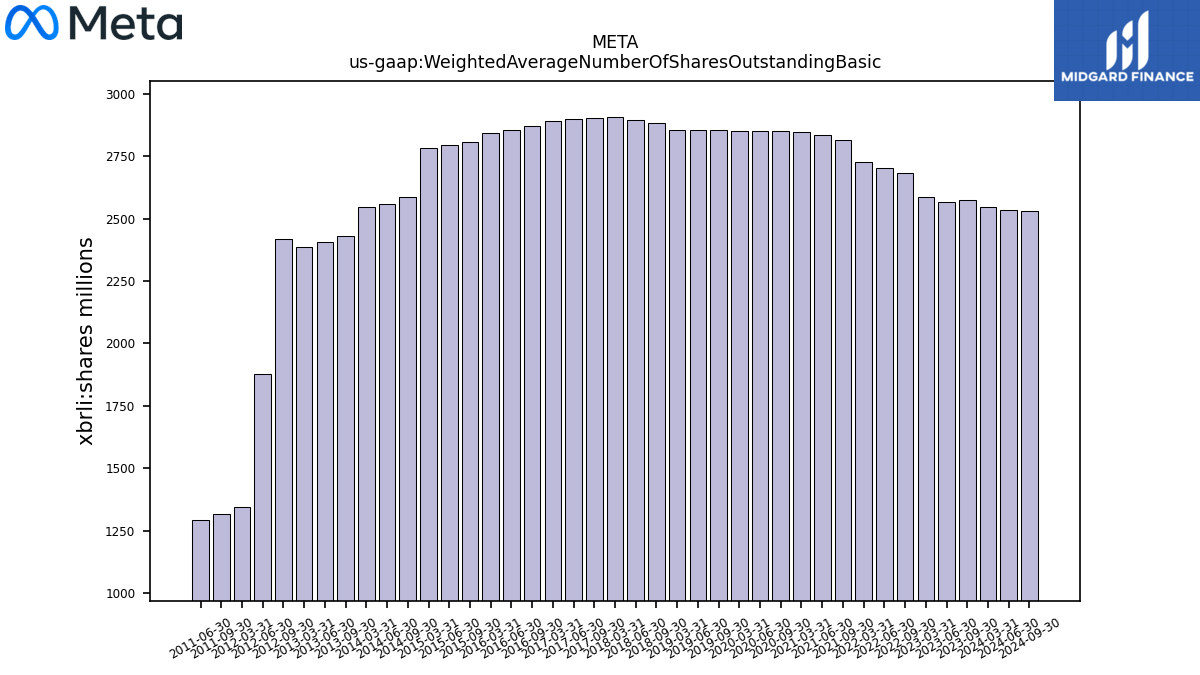 |
META | |||||||
| Ticker | 10K | 10Q | 8K | Sector | Industry | Logo | Forward P/E | Revenue Growth | Ticker | Income | EPS | Revenues | Ticker | GrossProfit | OperatingIncome | LongTermDebt | Ticker | InterestExpense | RetainedEarnnings | CashFlowOperating | Ticker | Dividends | SharesOutstanding | TTMGreenblattROC | |
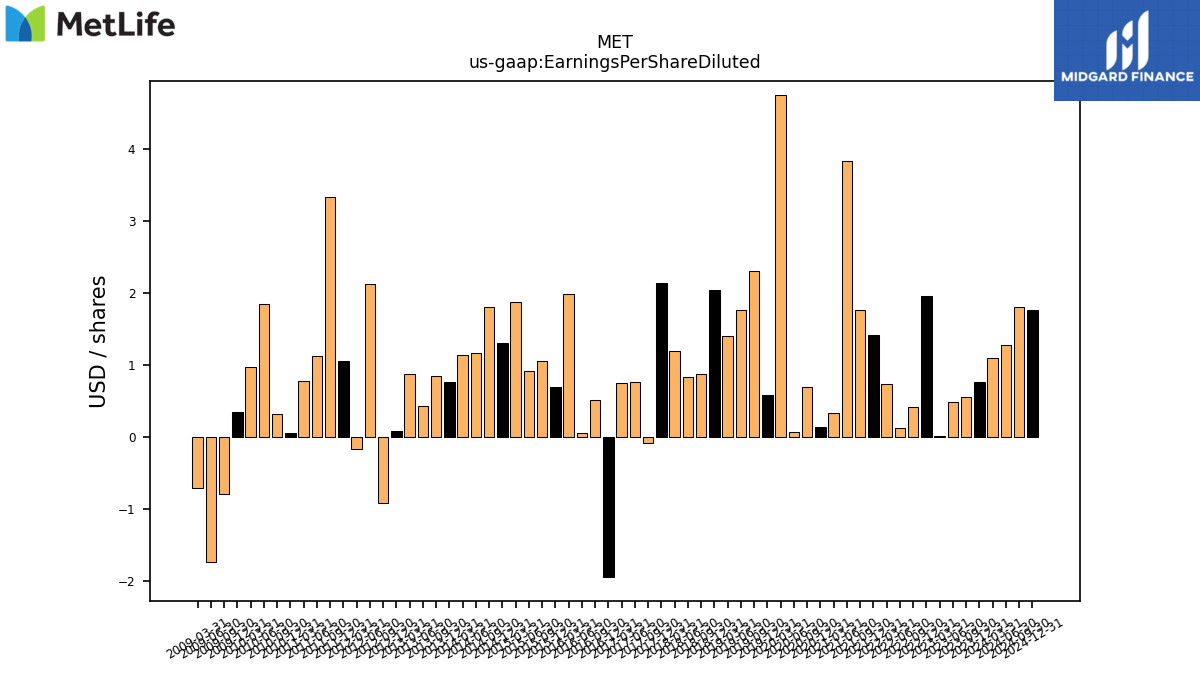
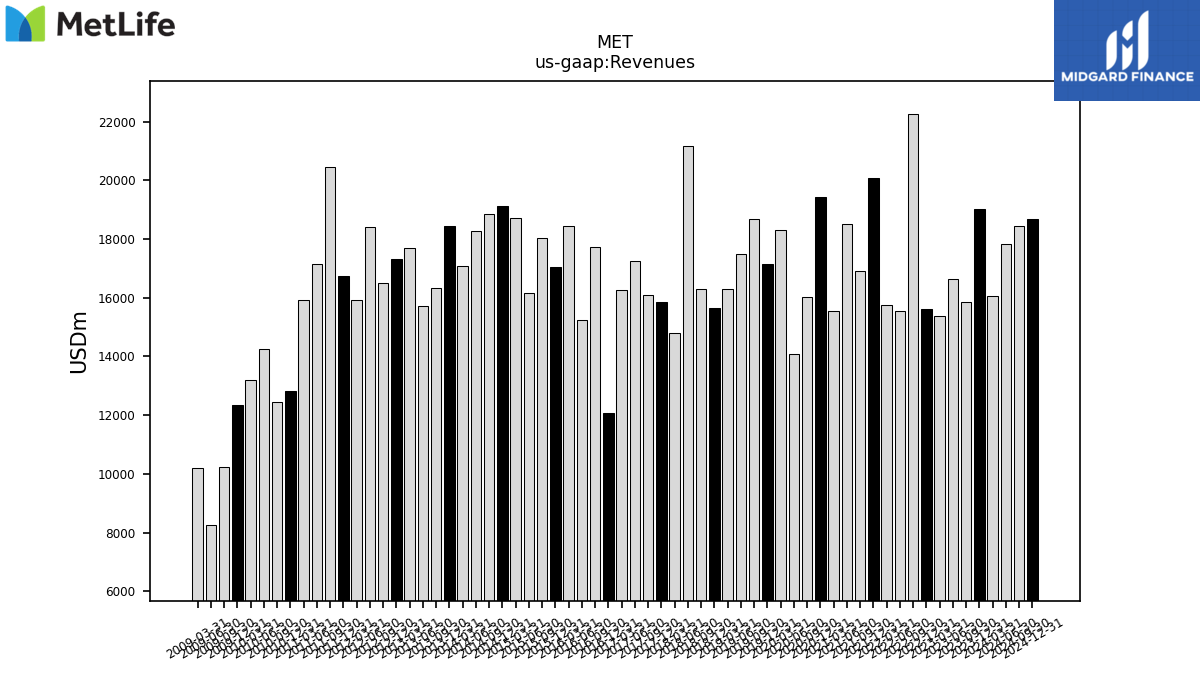
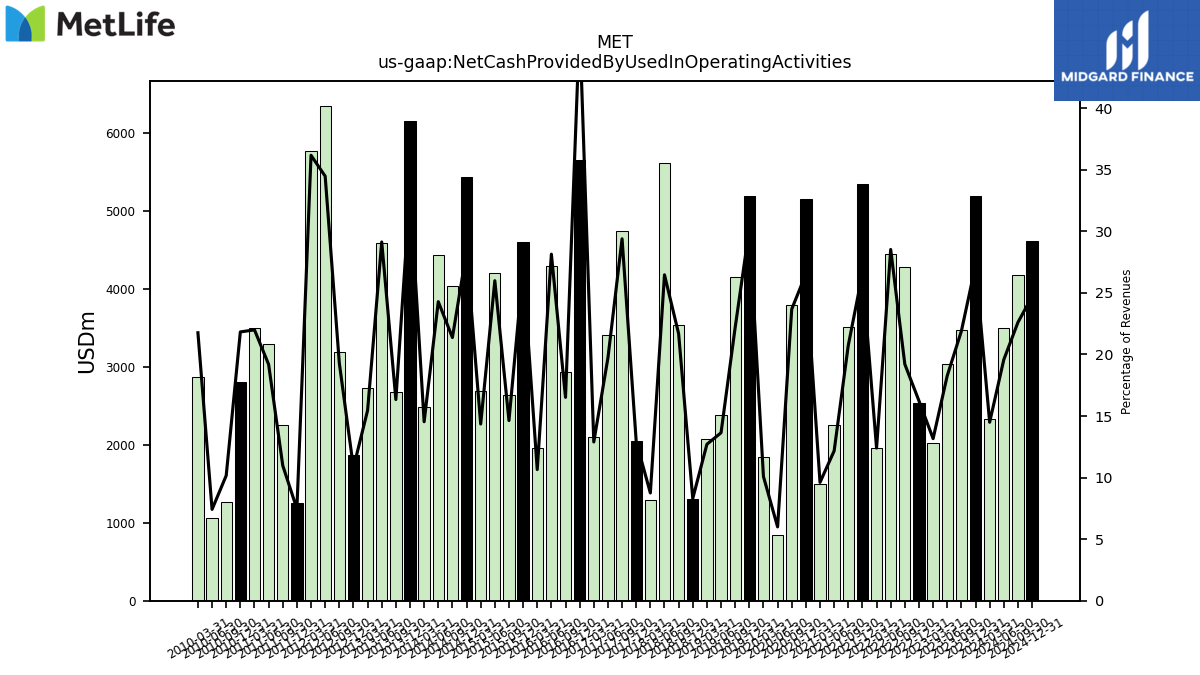
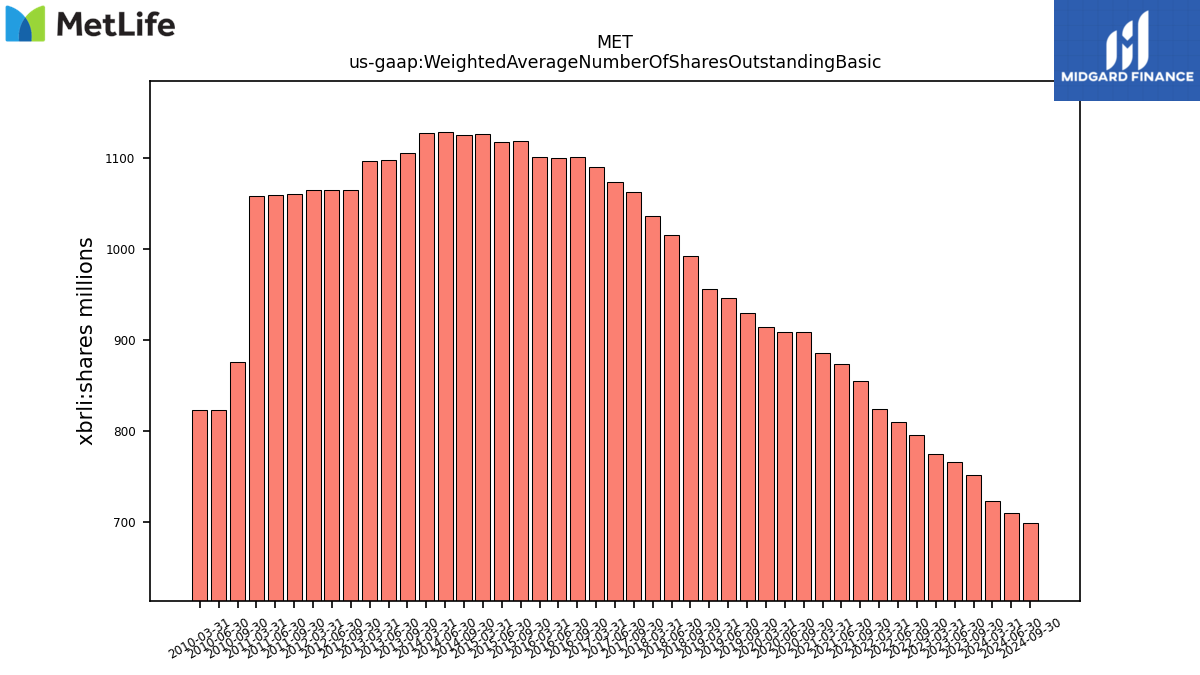
| $MET$ | 2025-02-21 | 2025-05-01 | 2025-04-30 | NA | NA | MET | 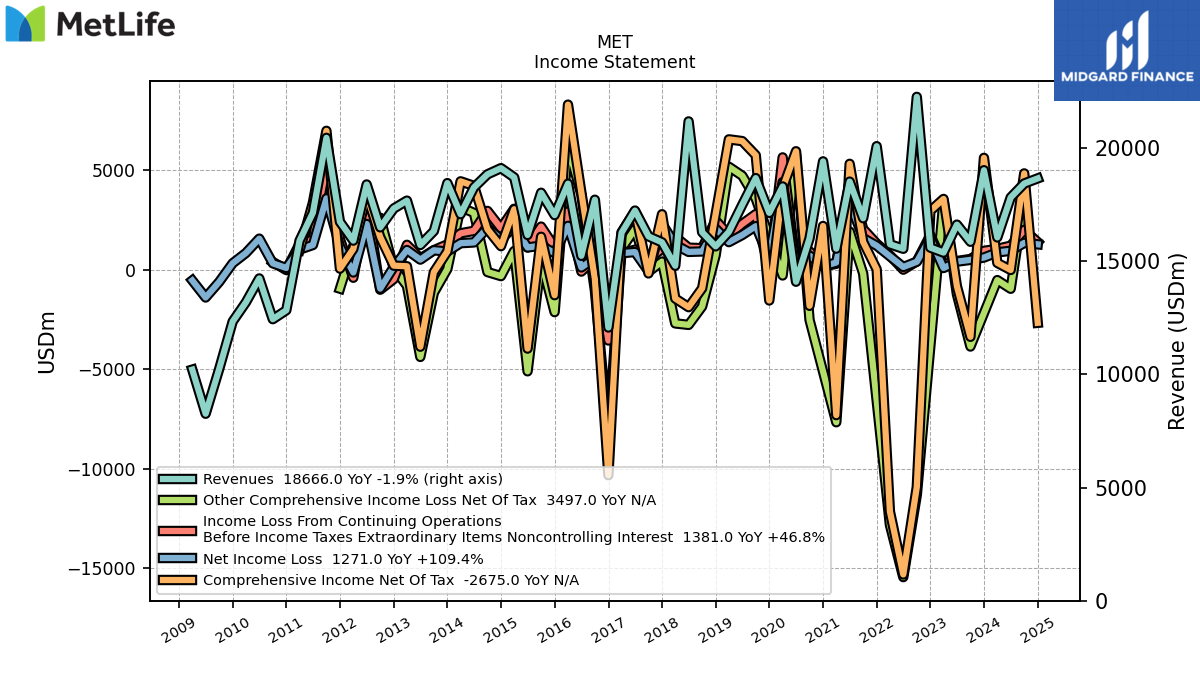 |
 |
 |
MET | MET | 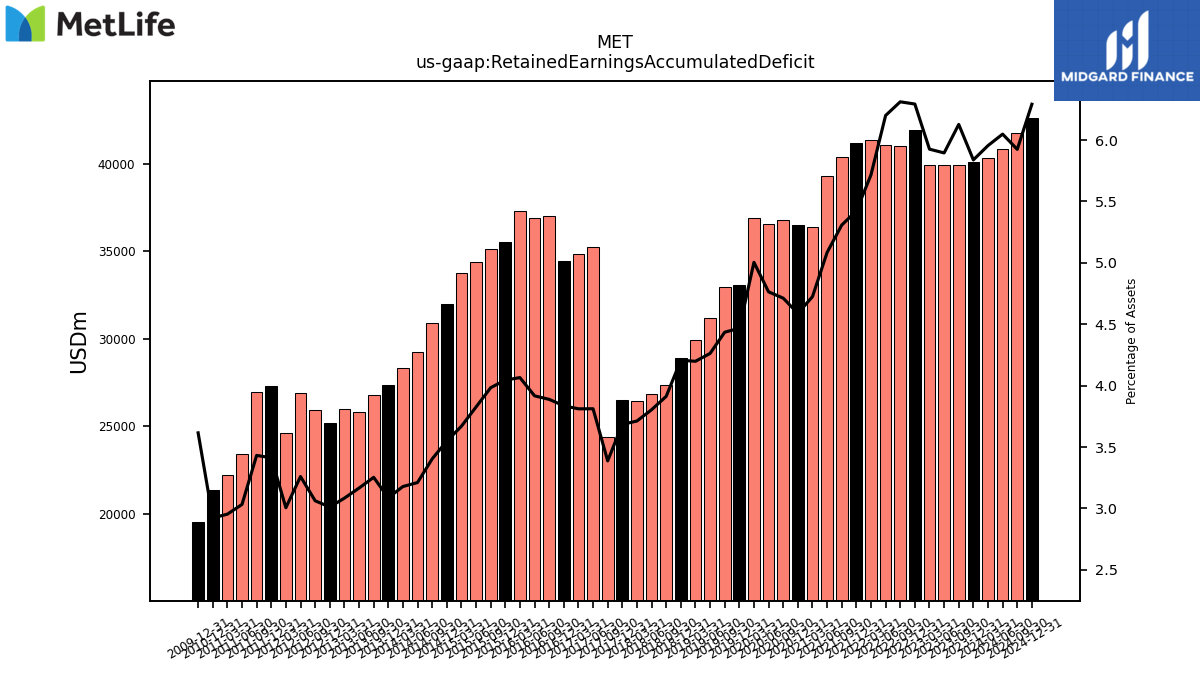 |
 |
MET | 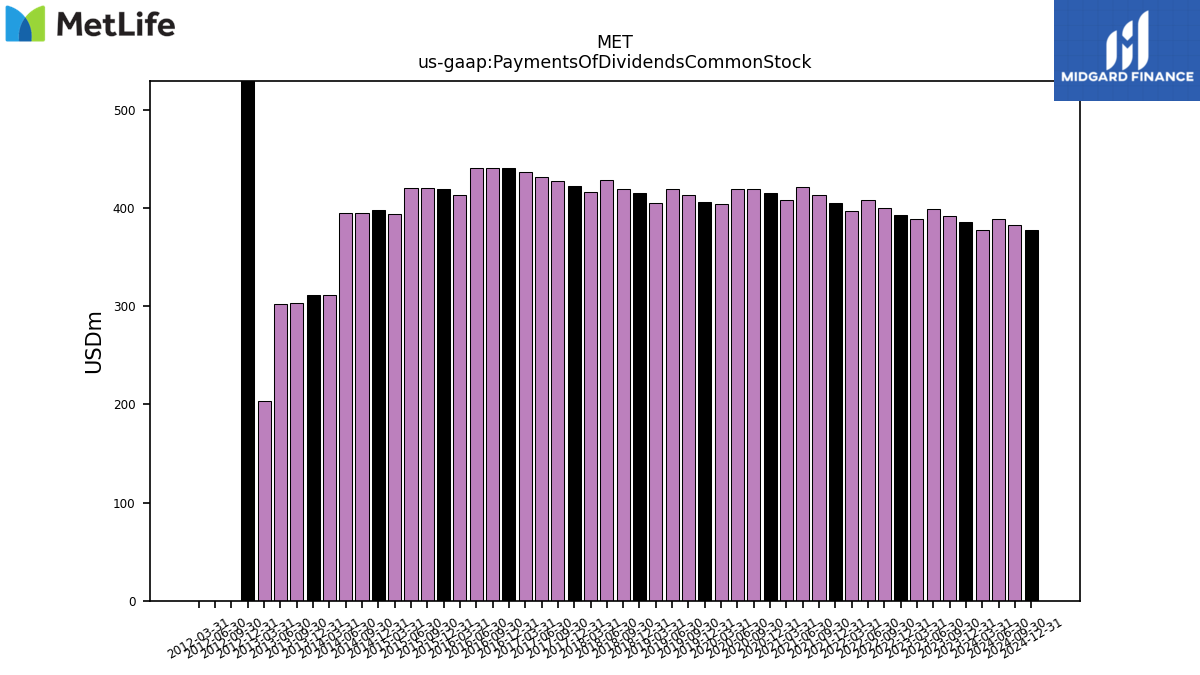 |
 |
MET | ||||||||
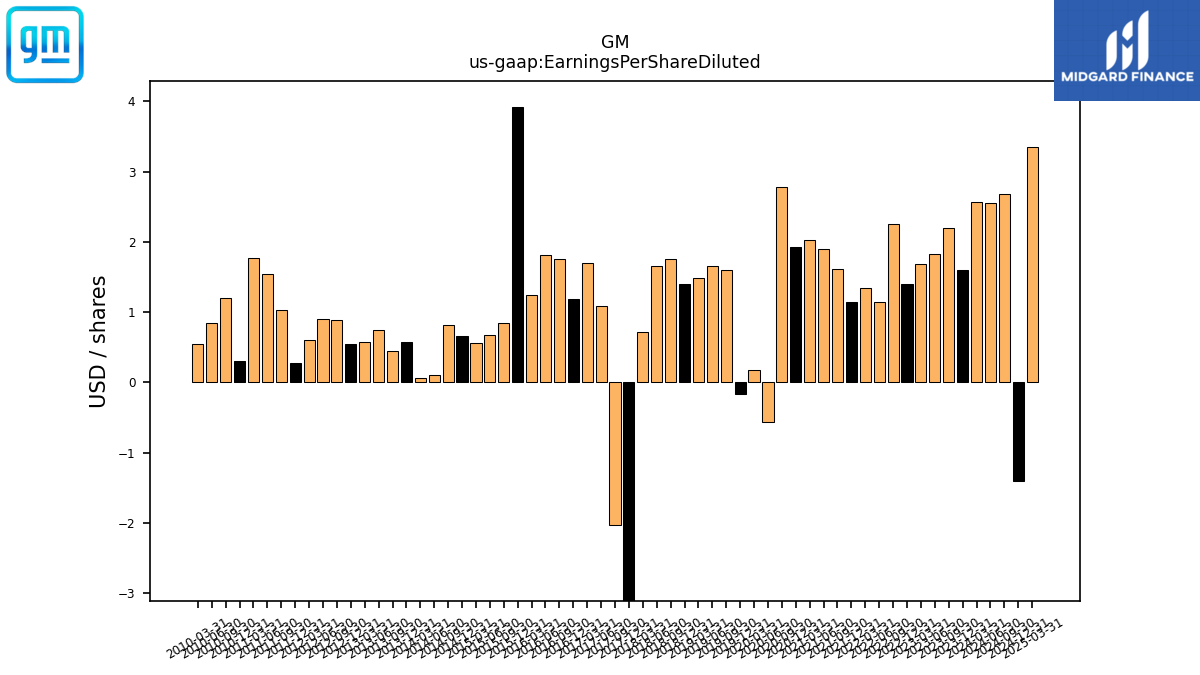
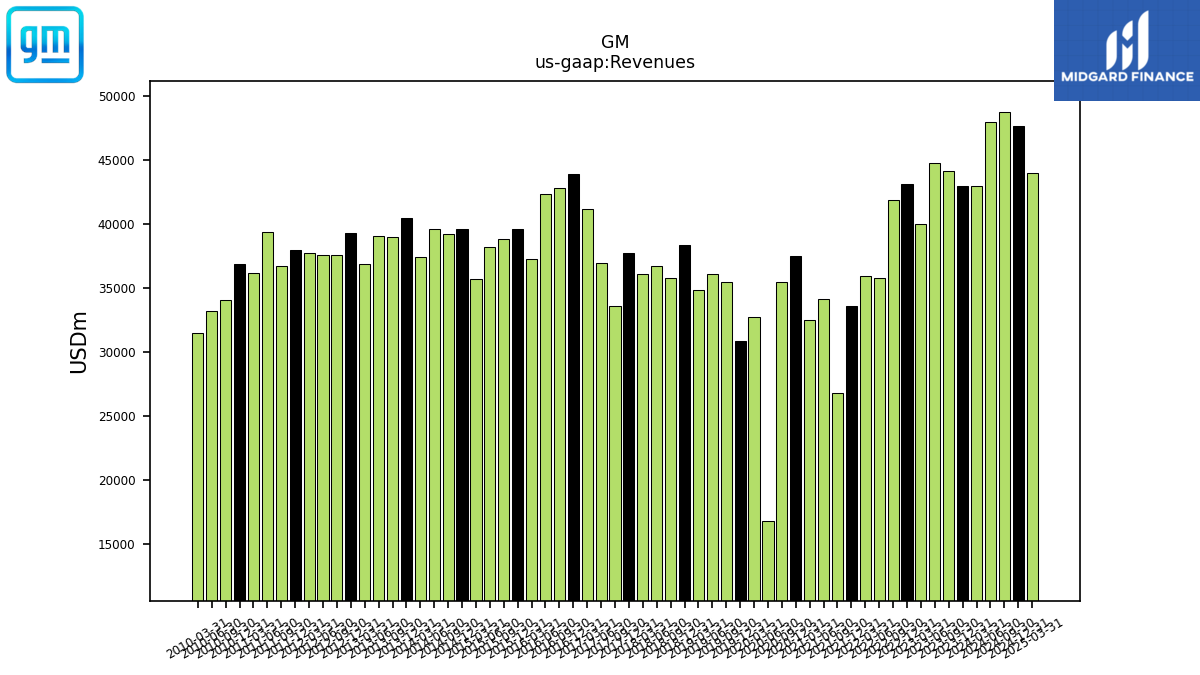
| $GM$ | 2025-01-28 | 2025-05-01 | 2025-04-29 | NA | NA | GM | 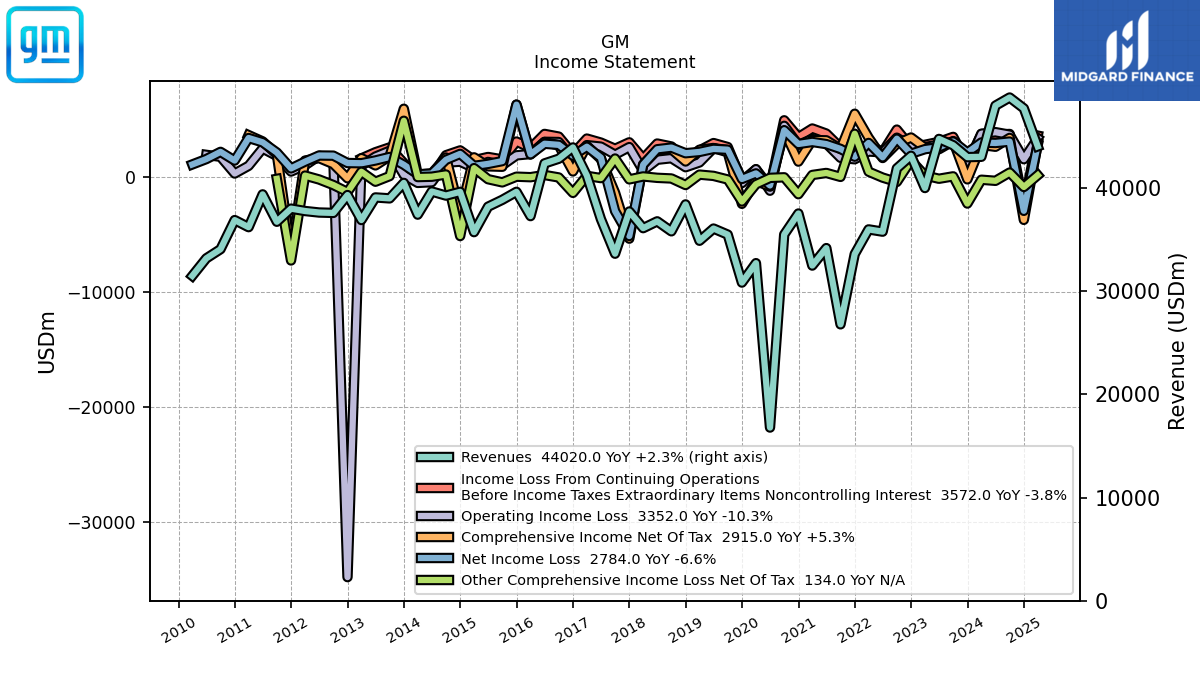 |
 |
 |
GM | 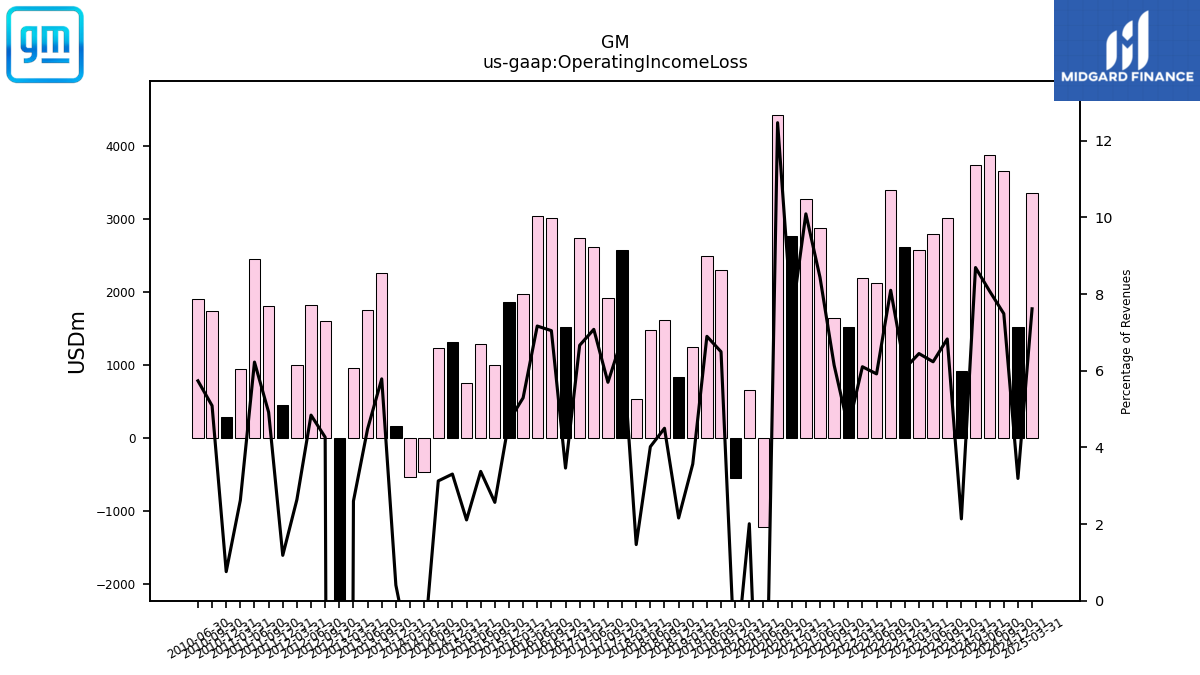 |
GM | 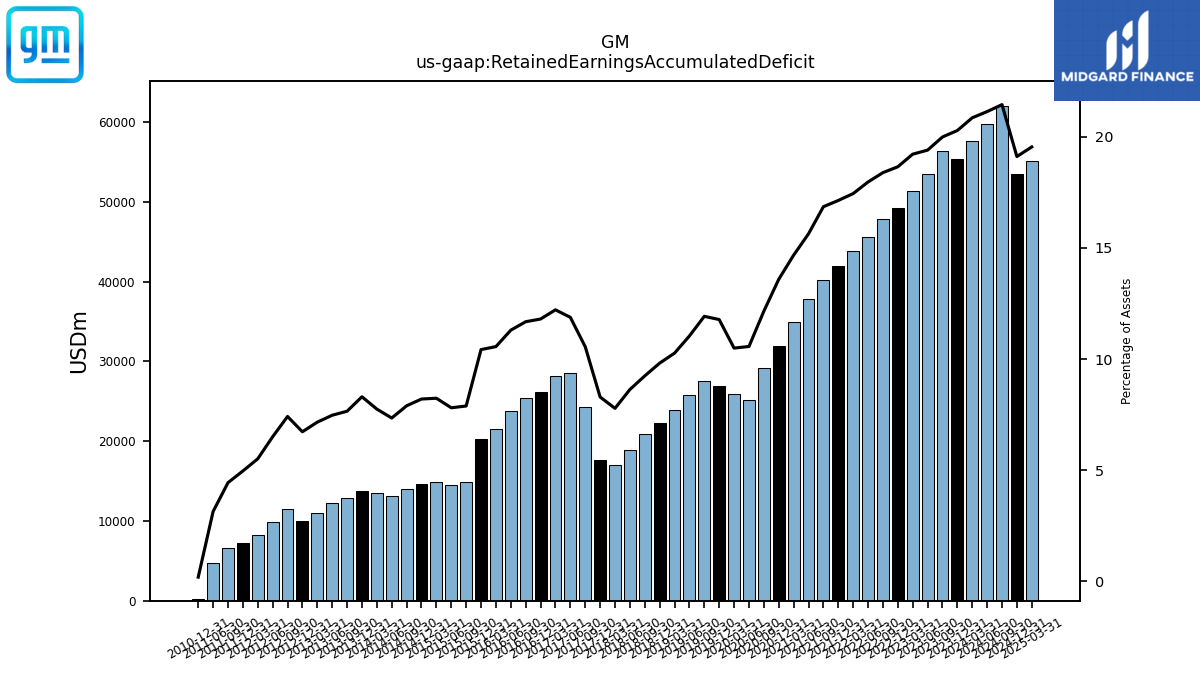 |
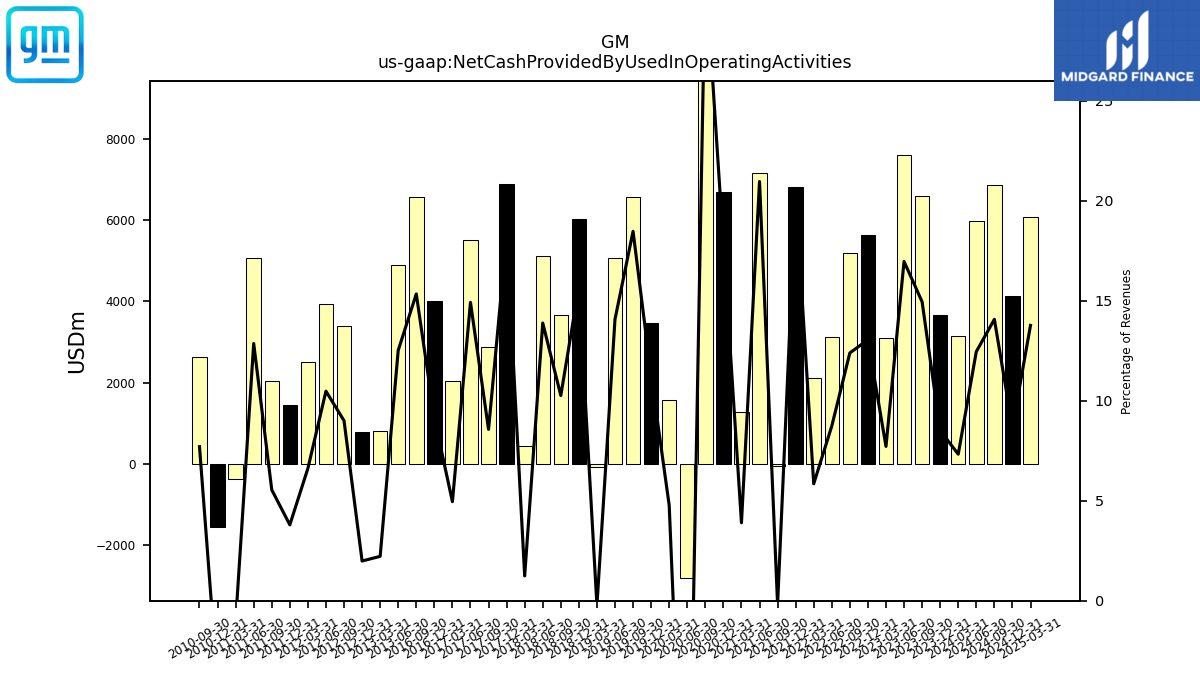 |
GM | 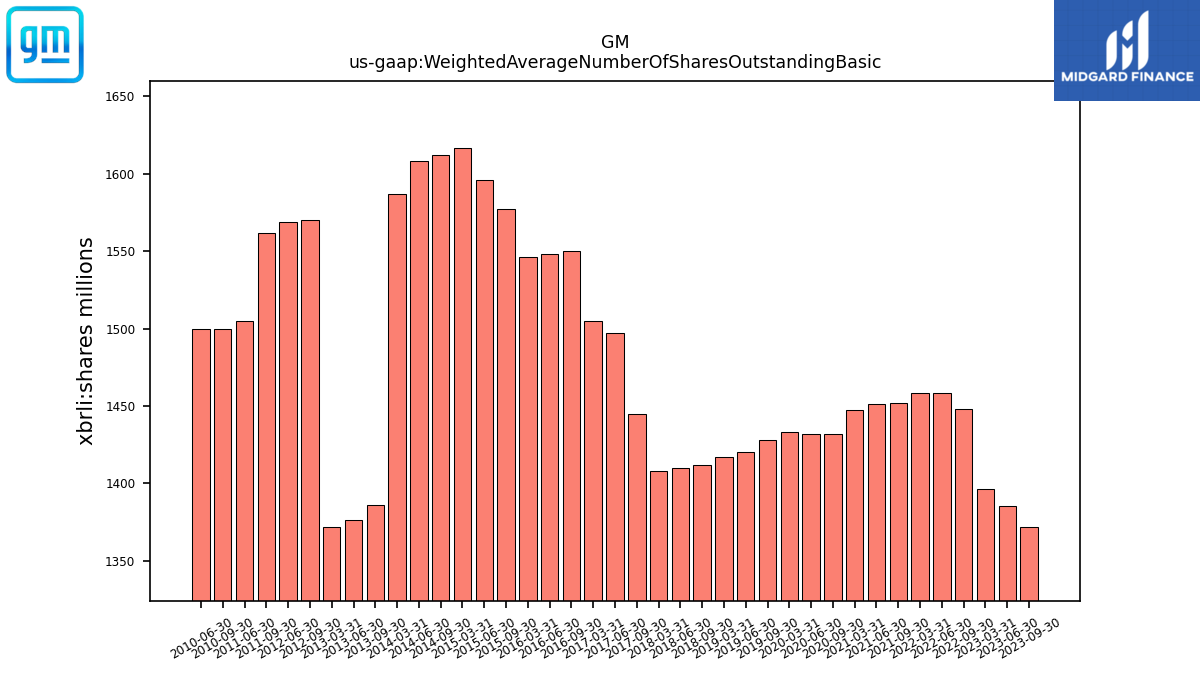 |
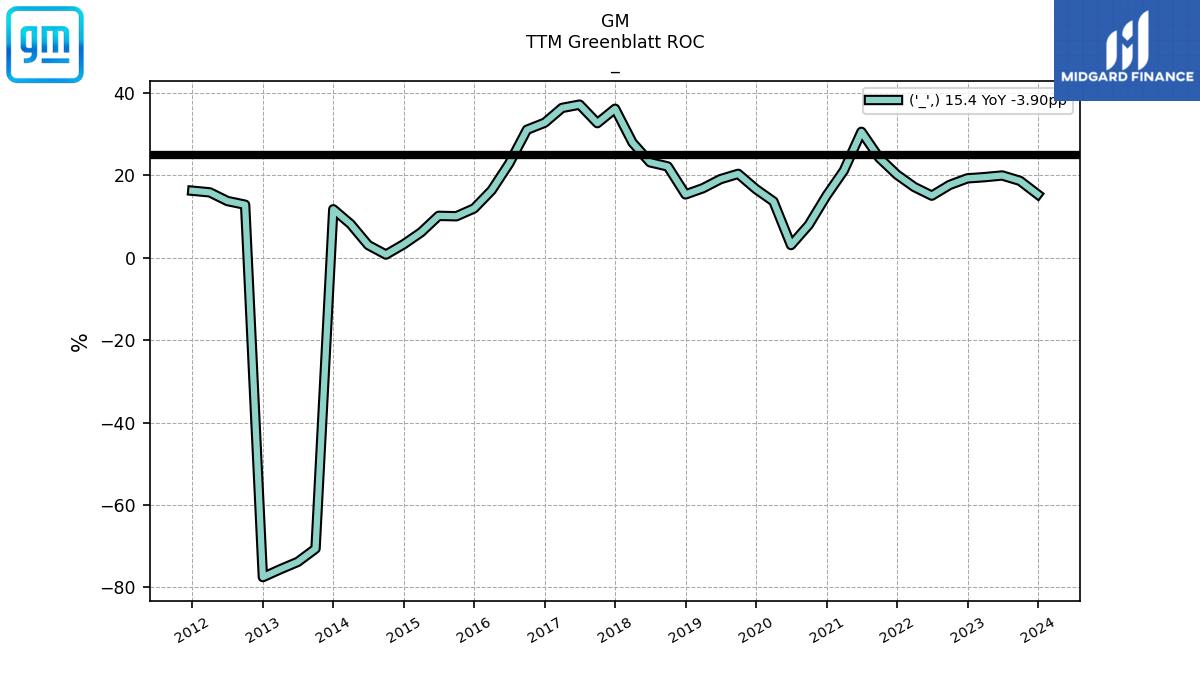 |
GM | |||||||
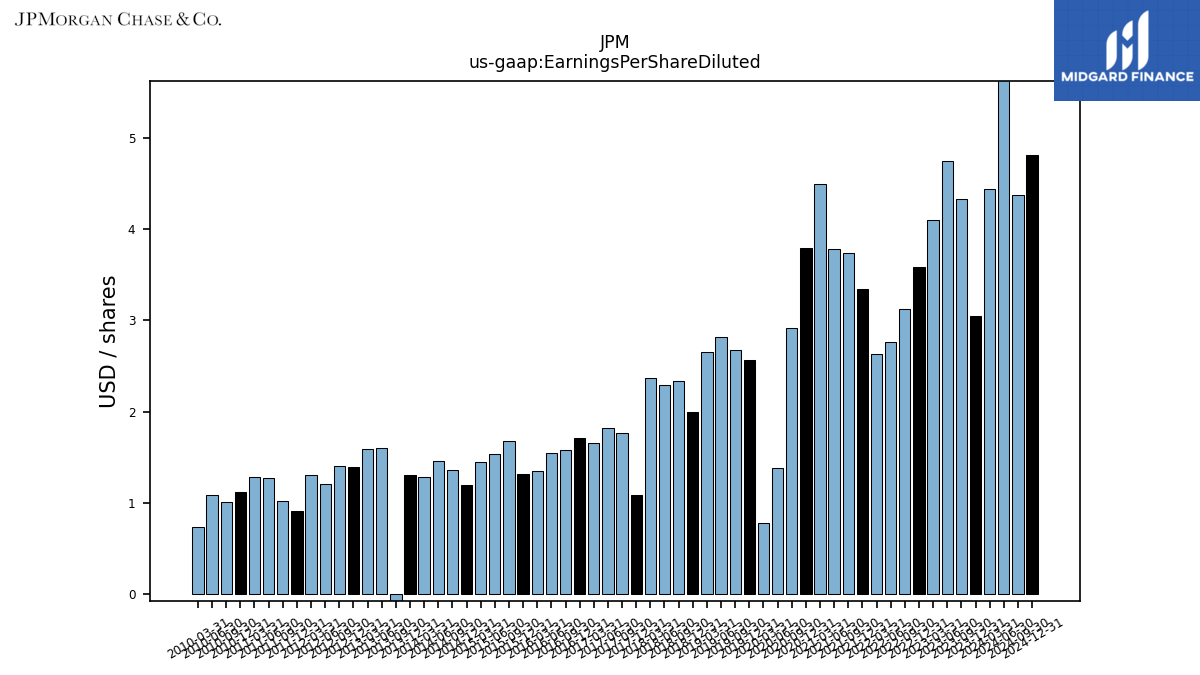
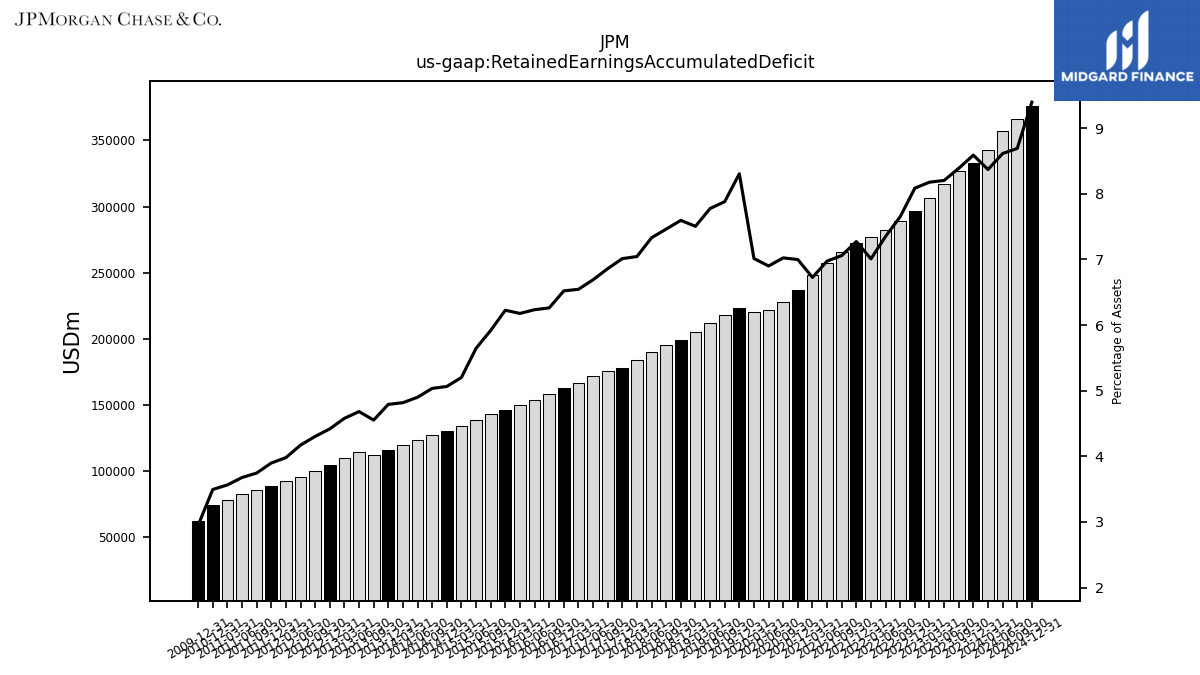
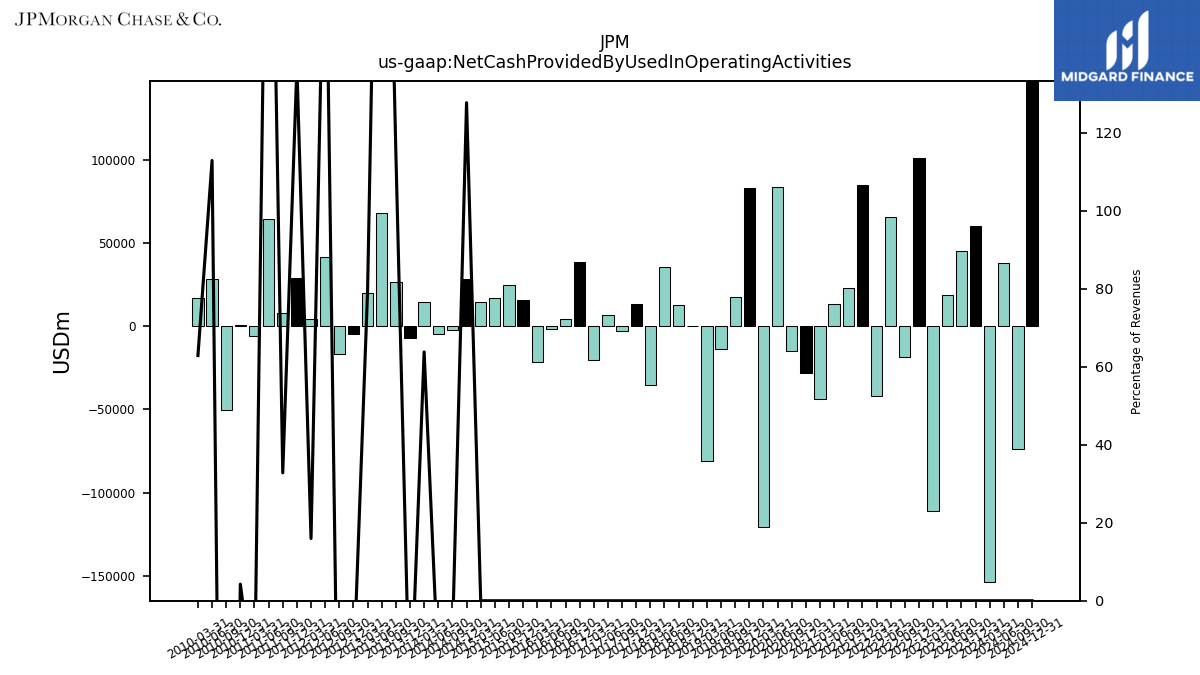
| $JPM$ | 2025-02-14 | 2025-05-01 | 2025-04-11 | NA | NA | JPM | 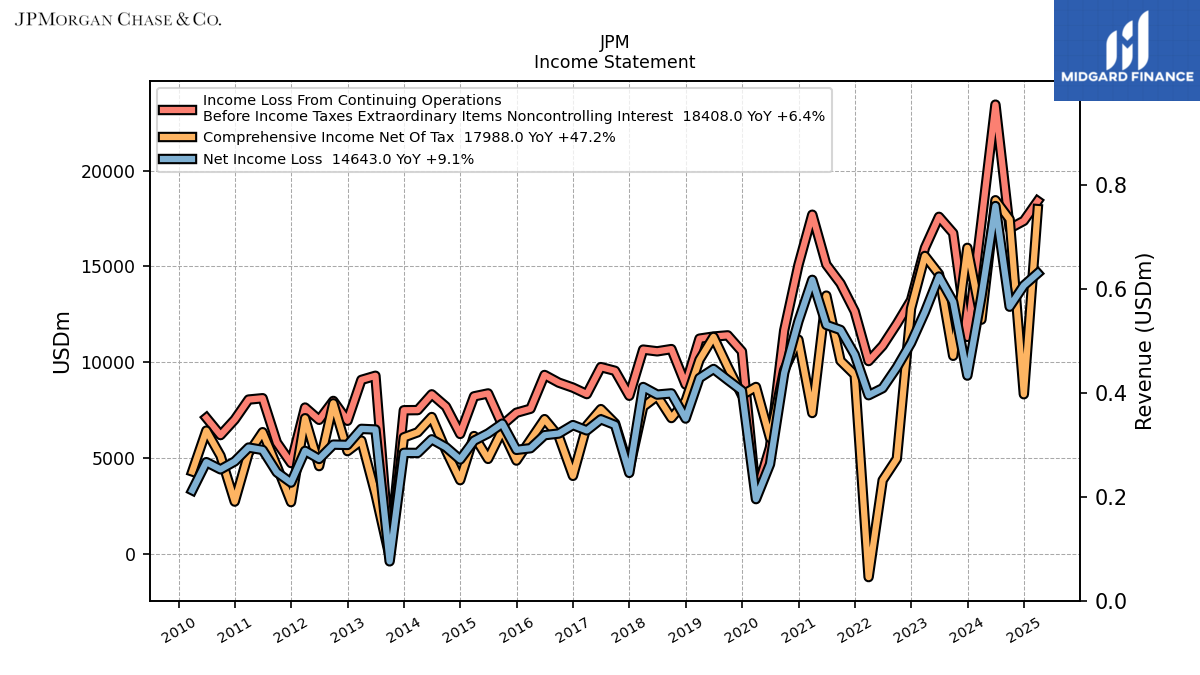 |
 |
JPM | JPM | 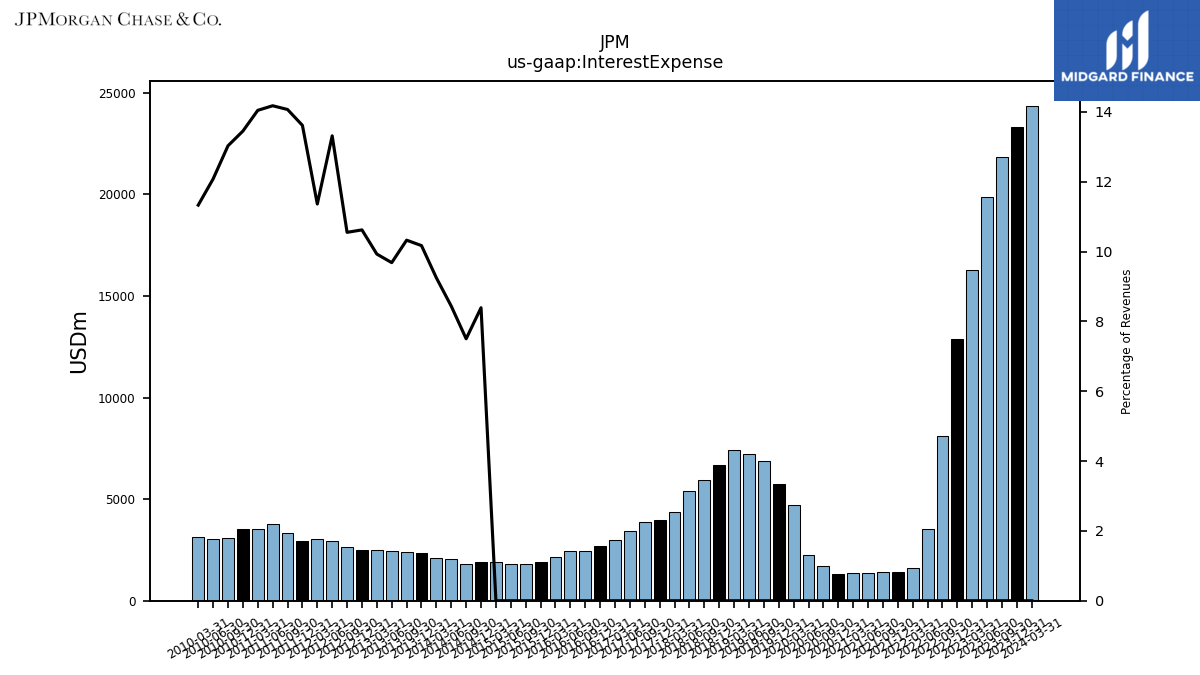 |
 |
 |
JPM | 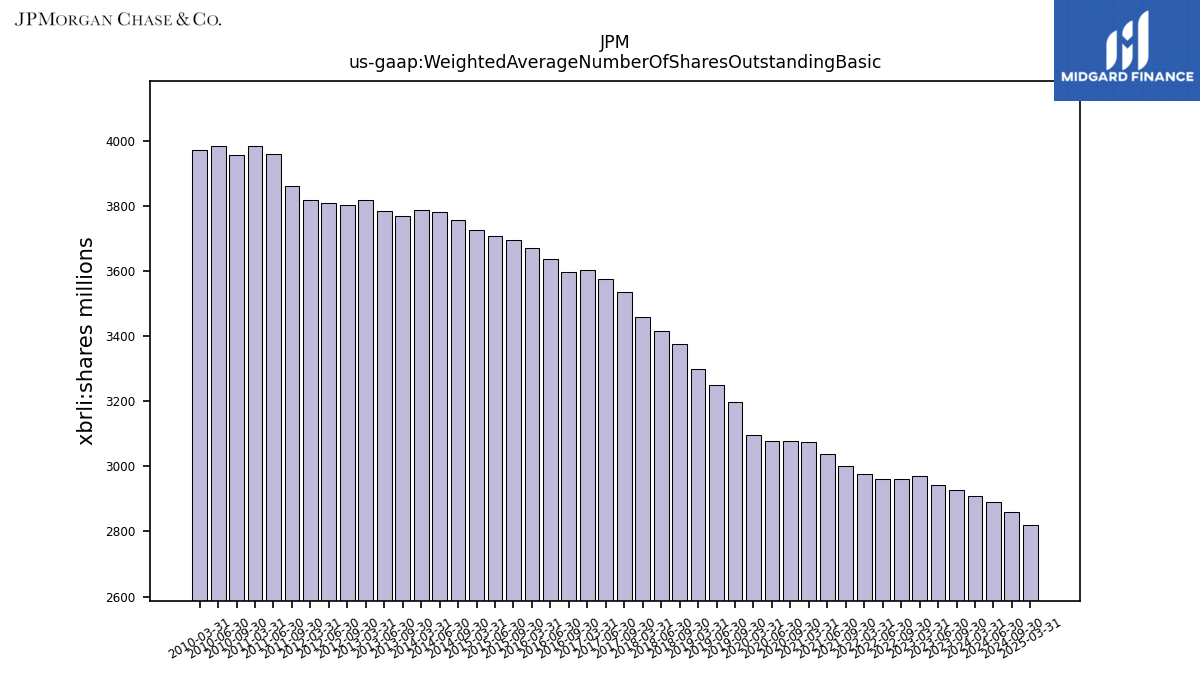 |
JPM | |||||||||
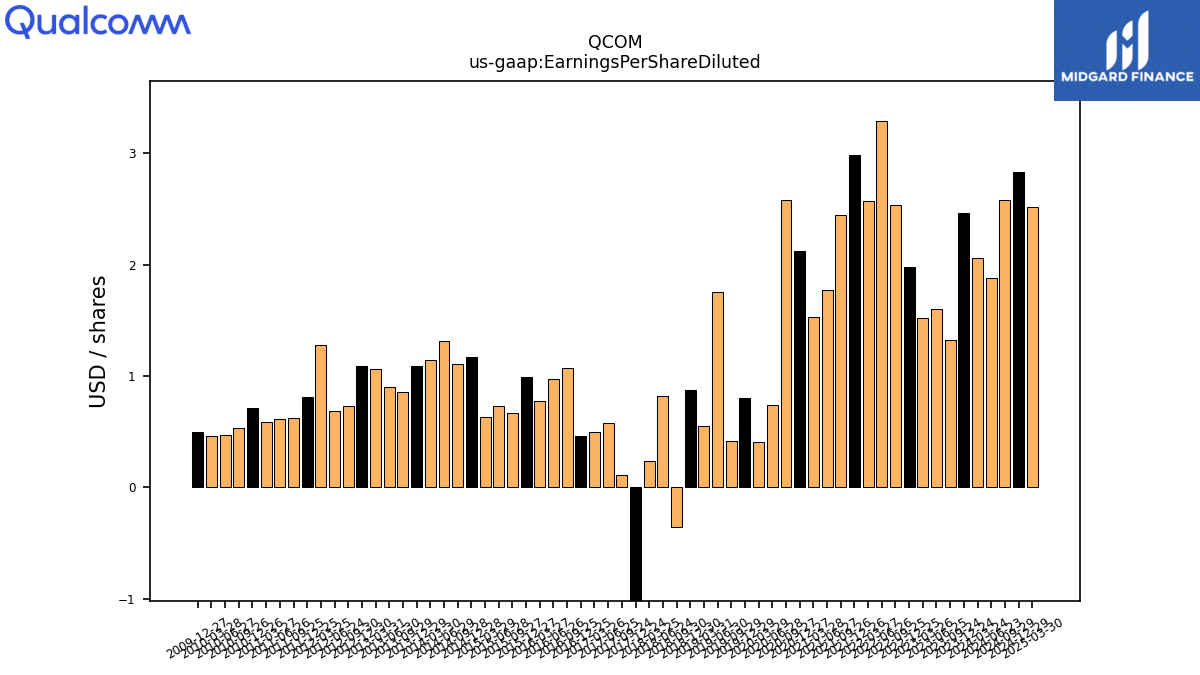
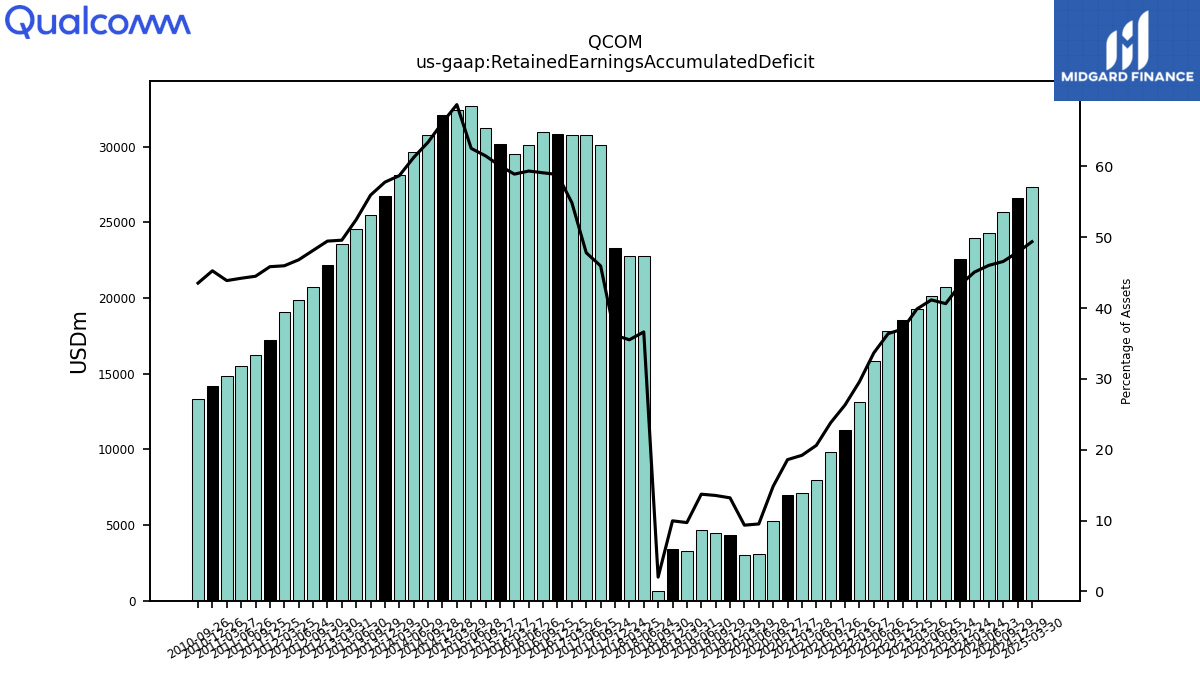
| $QCOM$ | 2024-11-06 | 2025-04-30 | 2025-04-30 | NA | NA | QCOM | 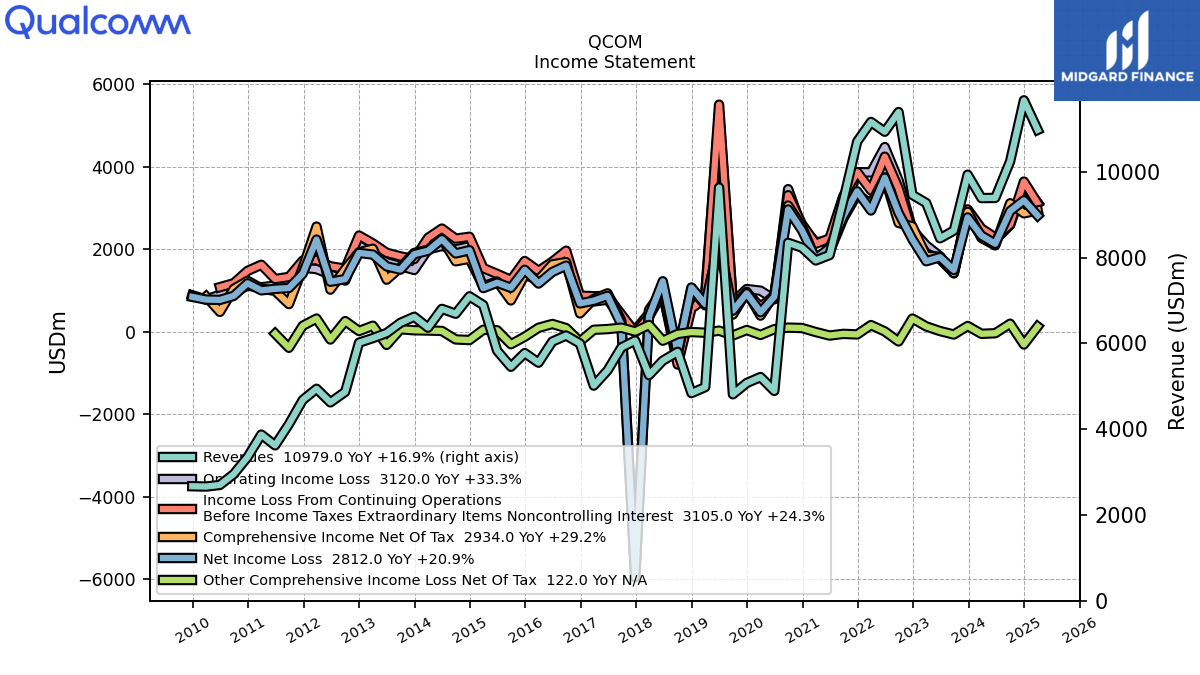 |
 |
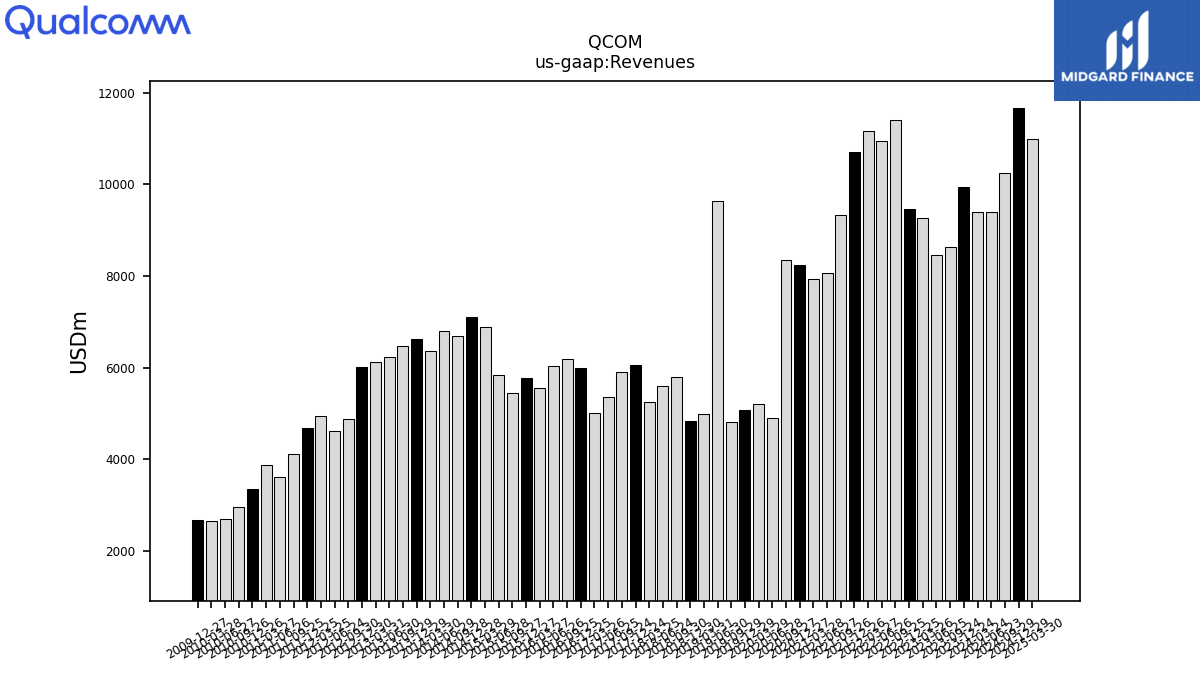 |
QCOM | 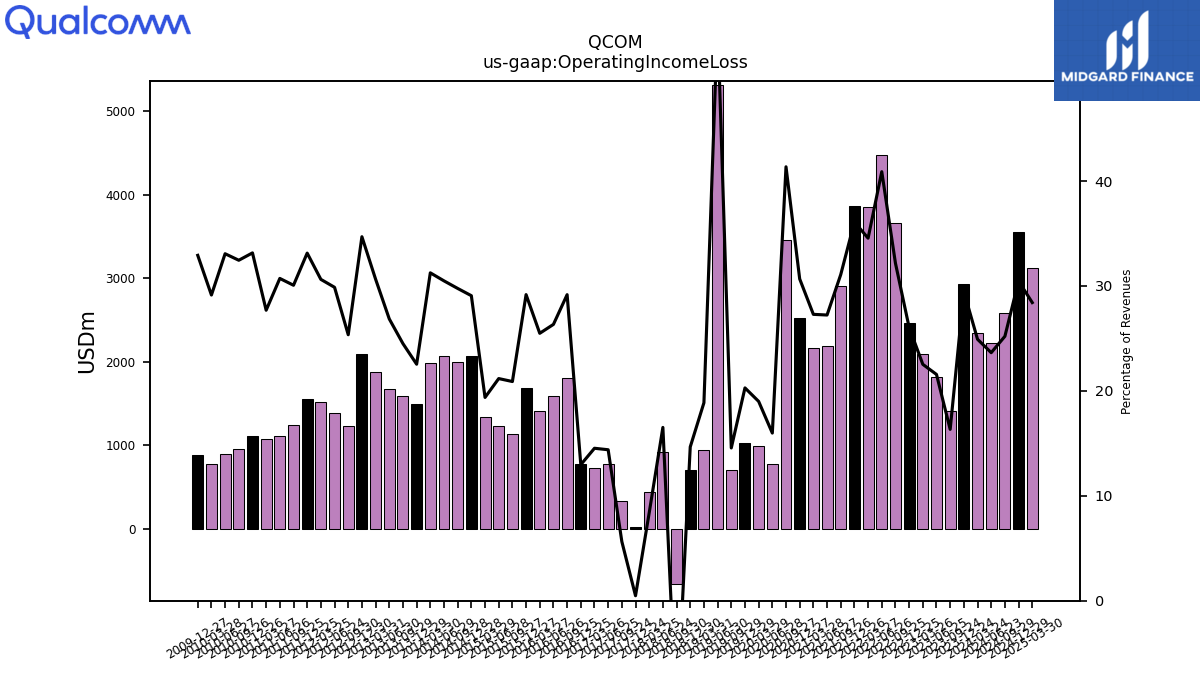 |
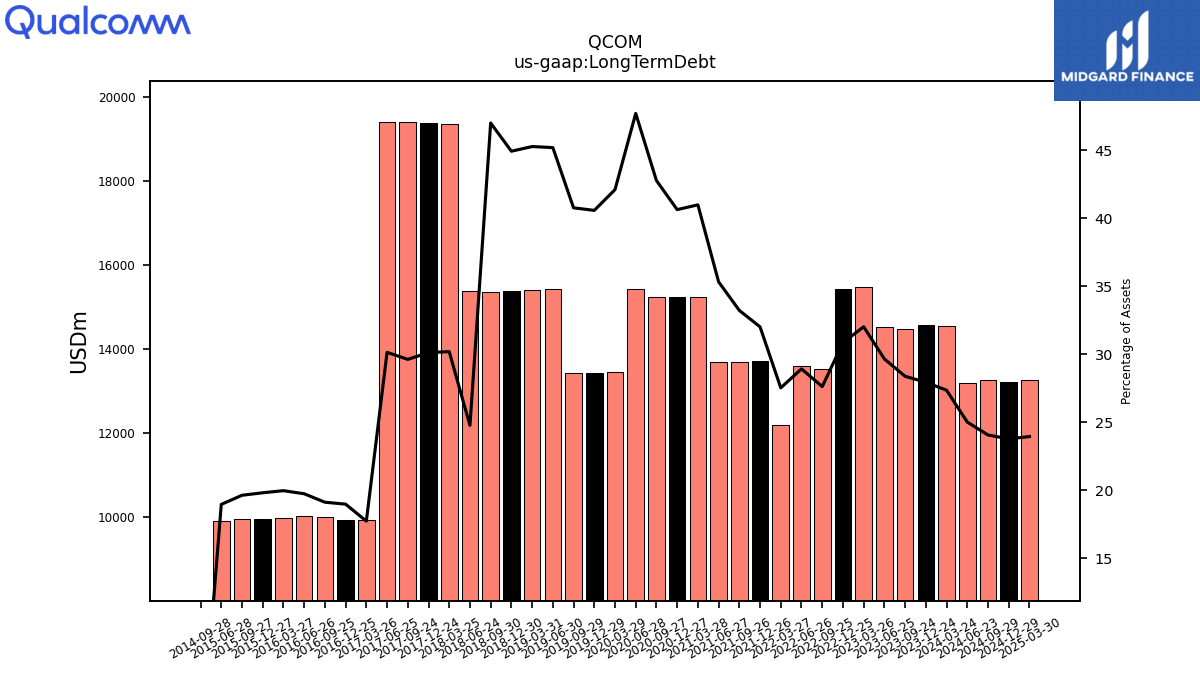 |
QCOM | 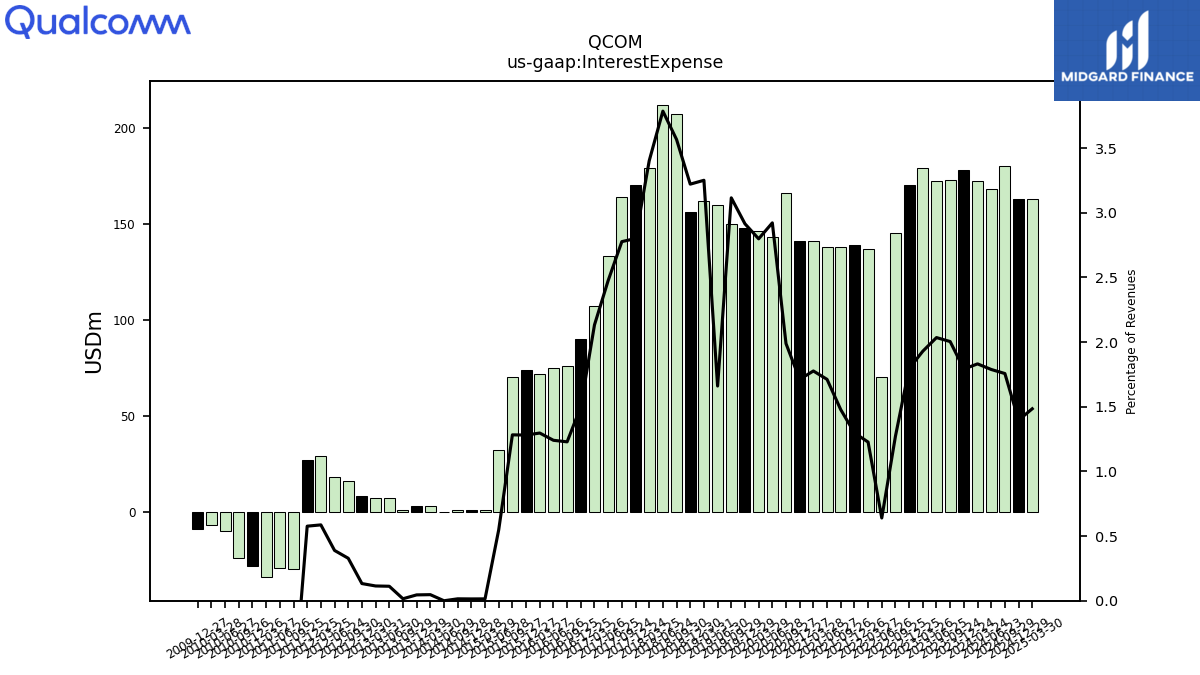 |
 |
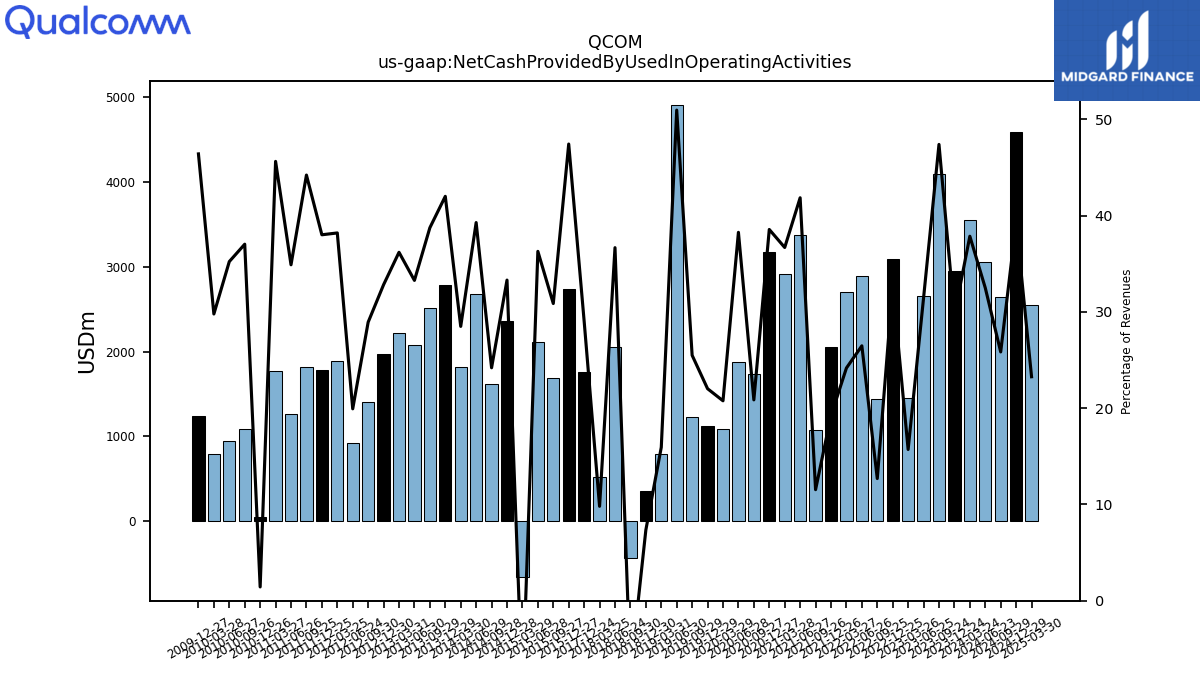 |
QCOM | 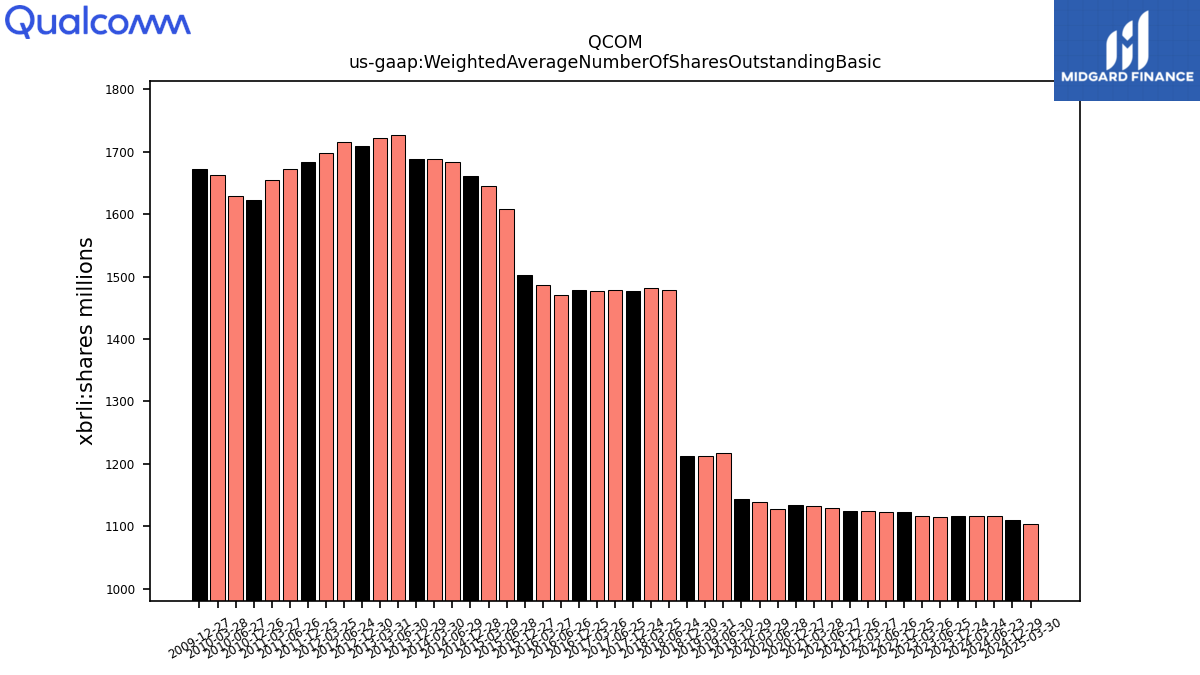 |
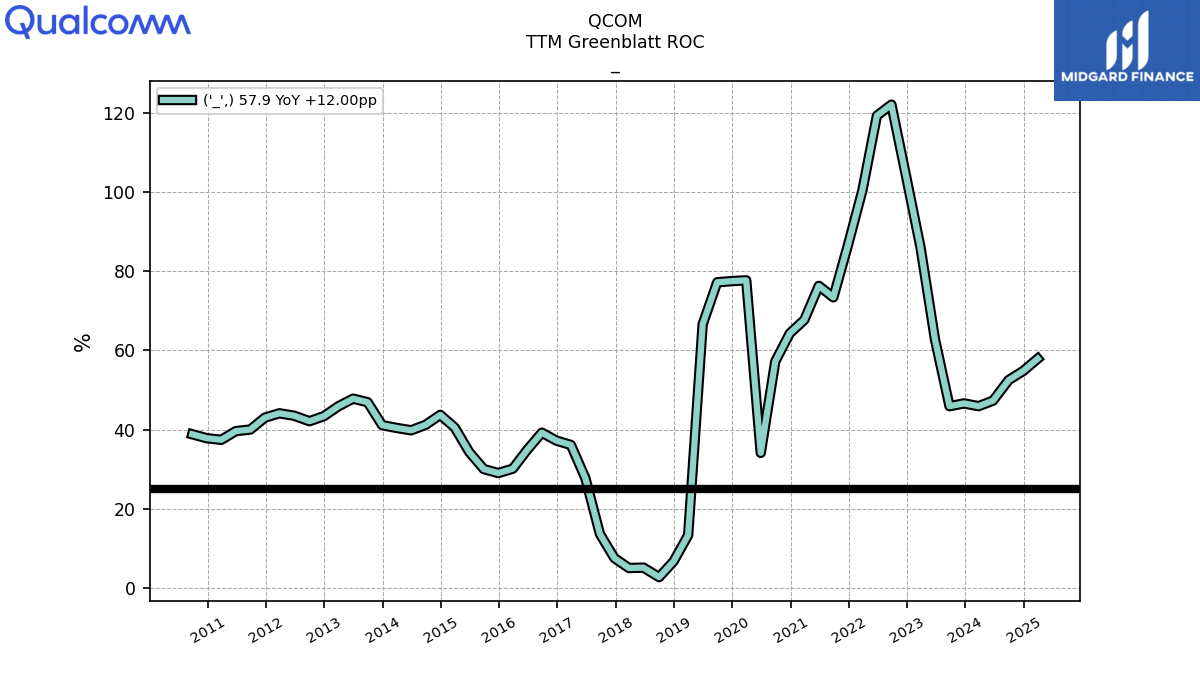 |
QCOM | |||||
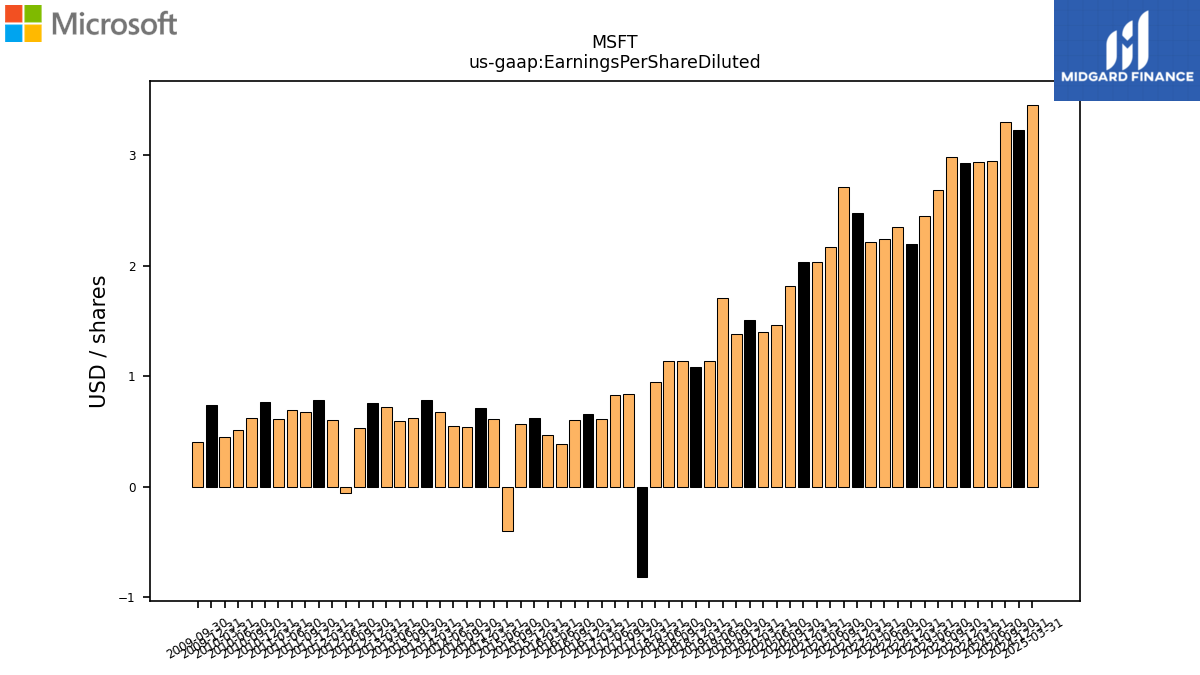
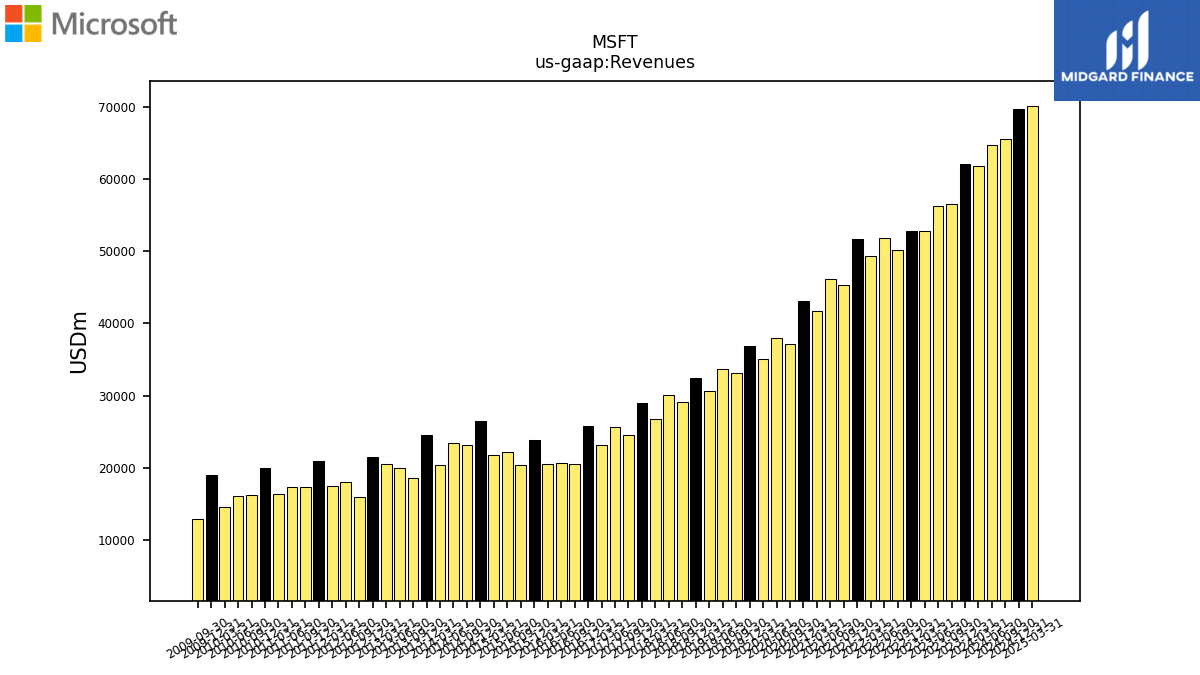
| $MSFT$ | 2024-07-30 | 2025-04-30 | 2025-04-30 | NA | NA | MSFT | 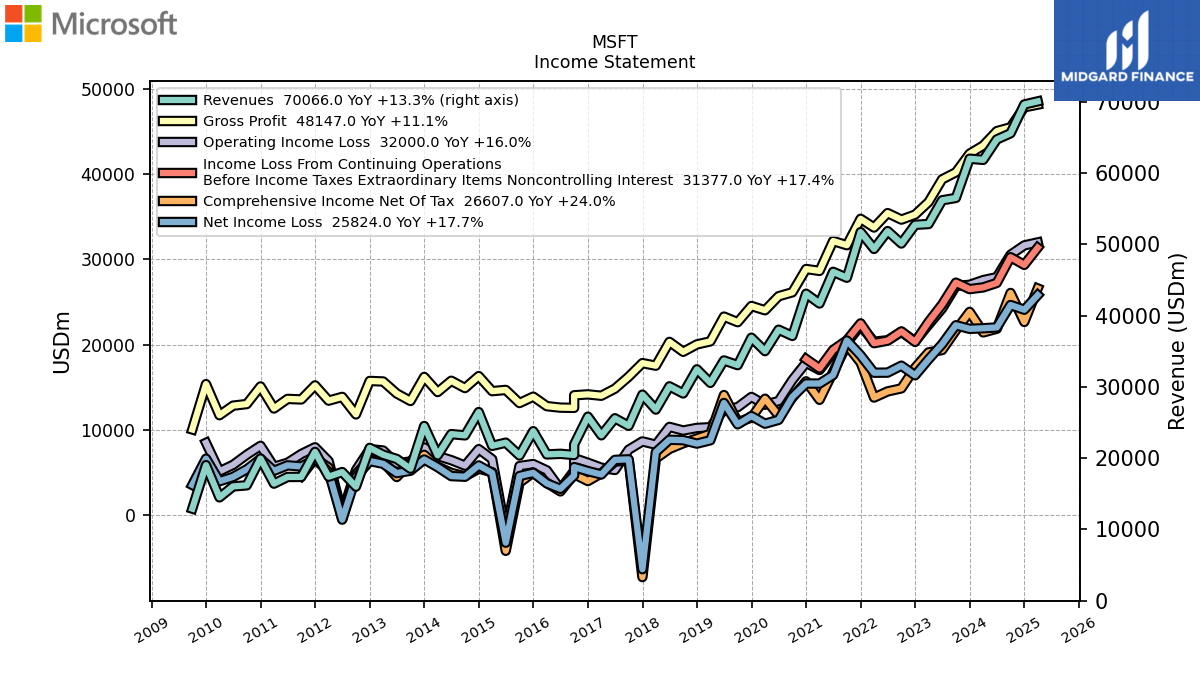 |
 |
 |
MSFT | 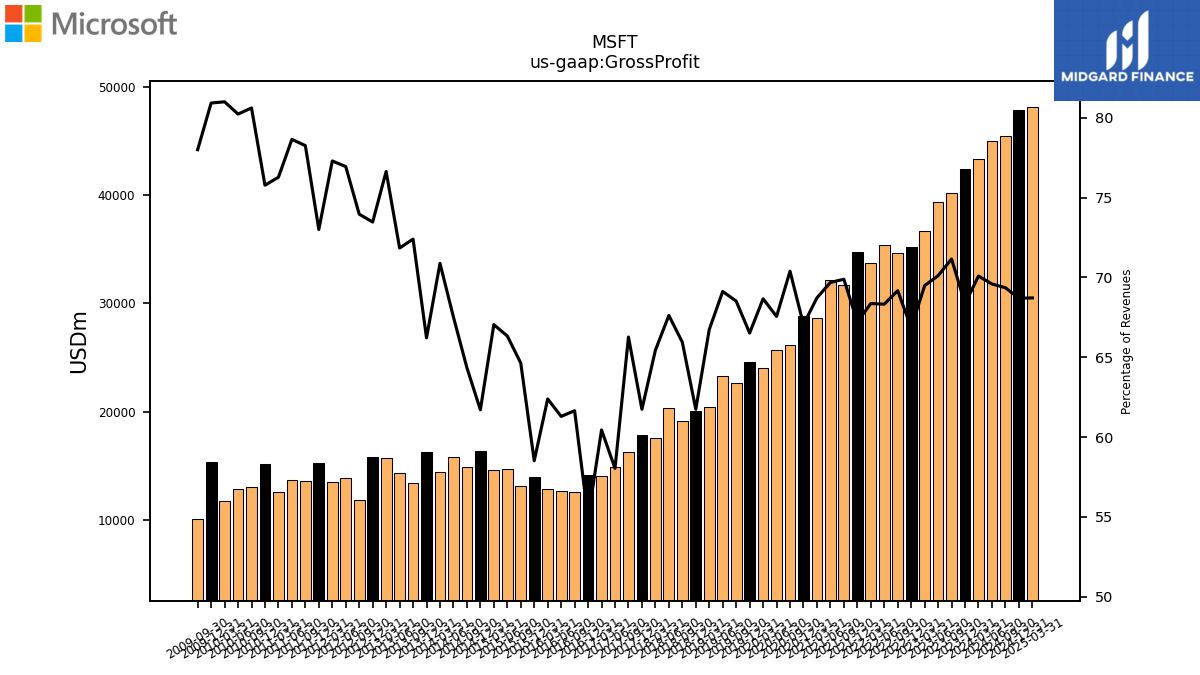 |
 |
 |
MSFT |  |
 |
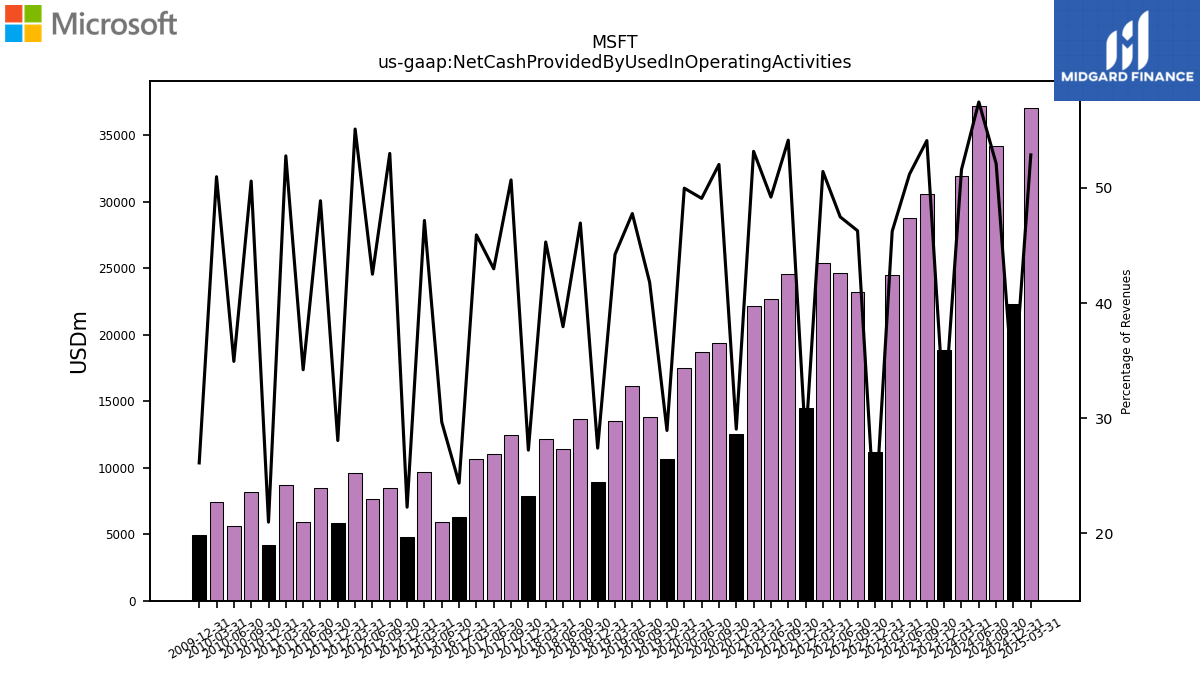 |
MSFT | 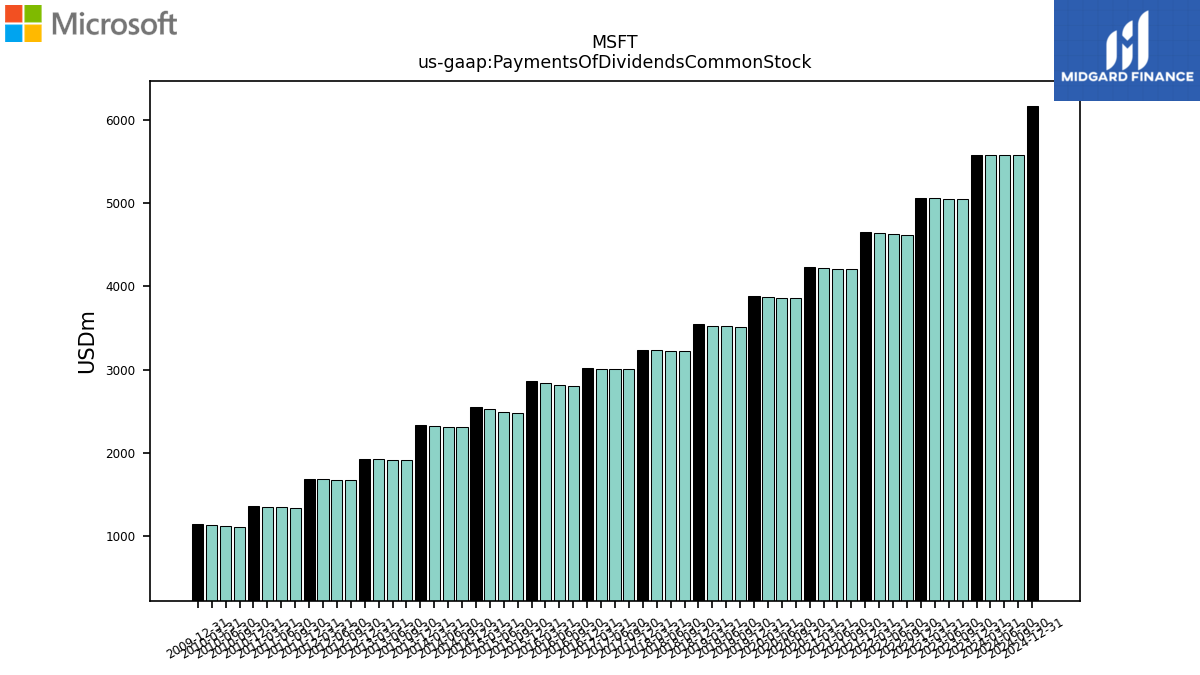 |
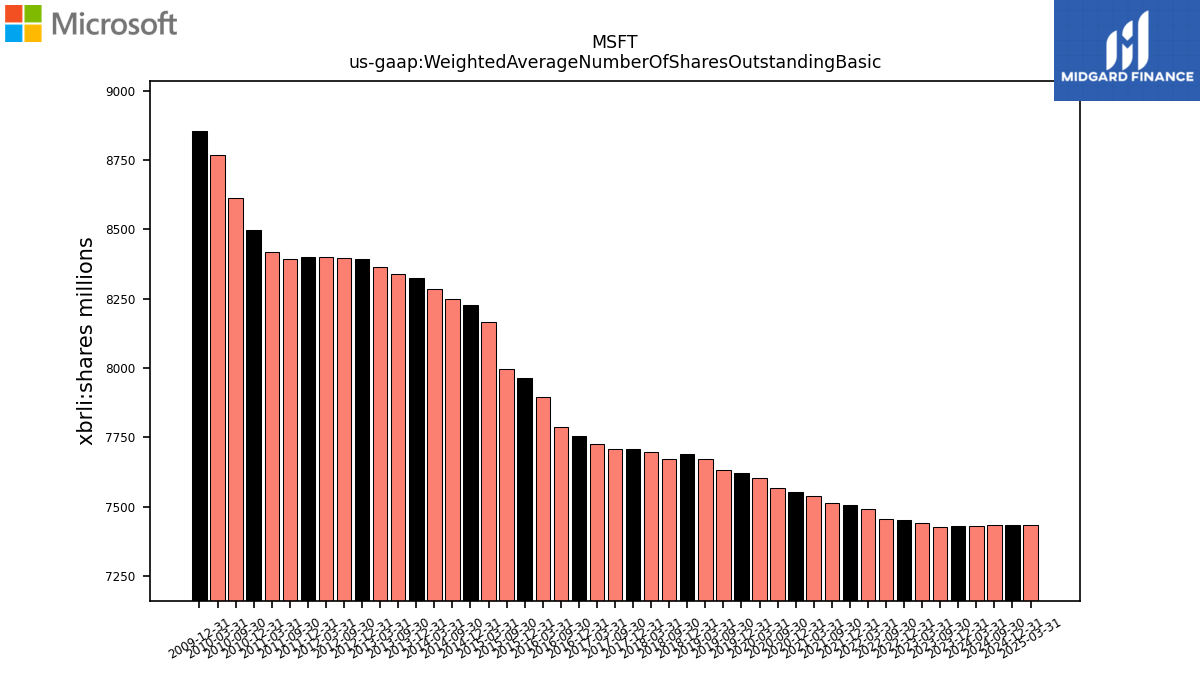 |
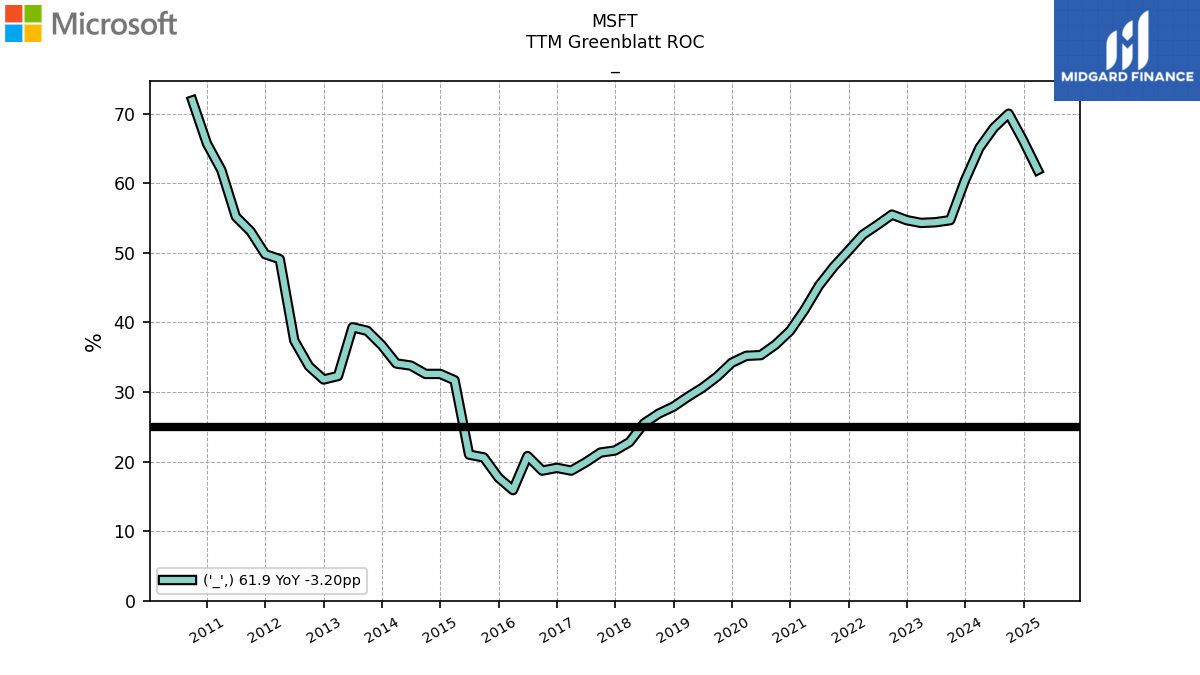 |
MSFT | |||
| Ticker | 10K | 10Q | 8K | Sector | Industry | Logo | Forward P/E | Revenue Growth | Ticker | Income | EPS | Revenues | Ticker | GrossProfit | OperatingIncome | LongTermDebt | Ticker | InterestExpense | RetainedEarnnings | CashFlowOperating | Ticker | Dividends | SharesOutstanding | TTMGreenblattROC | |
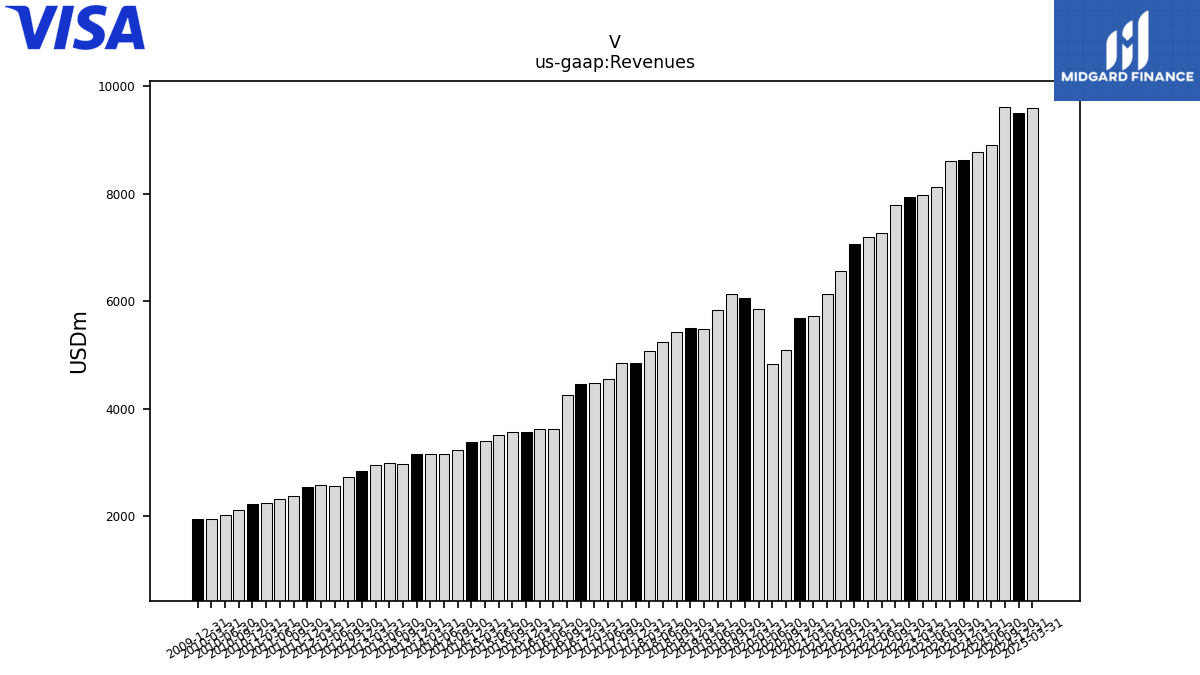
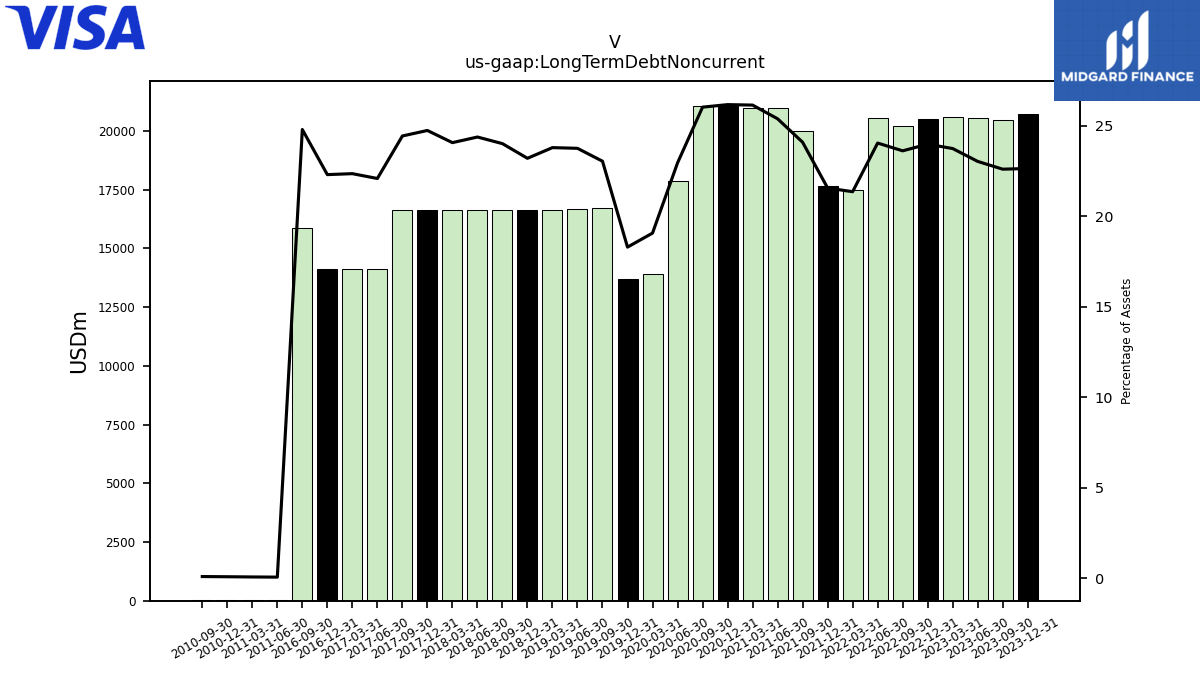
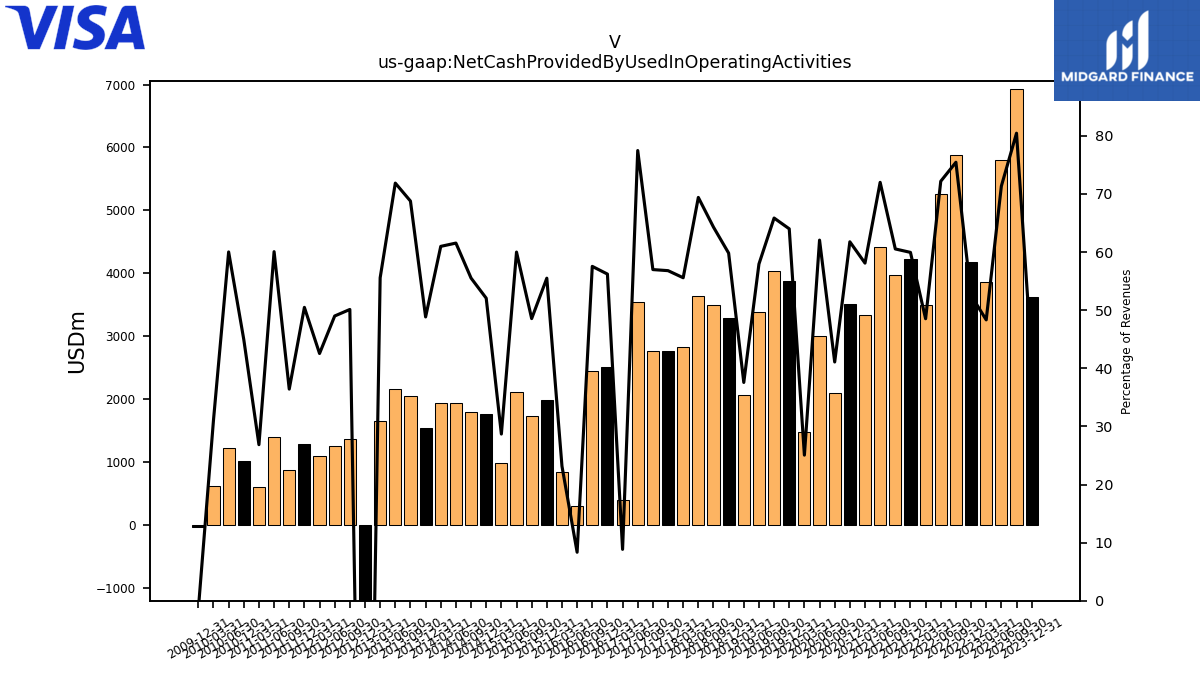
| $V$ | 2024-11-13 | 2025-04-30 | 2025-04-29 |  |
NA | NA | V | 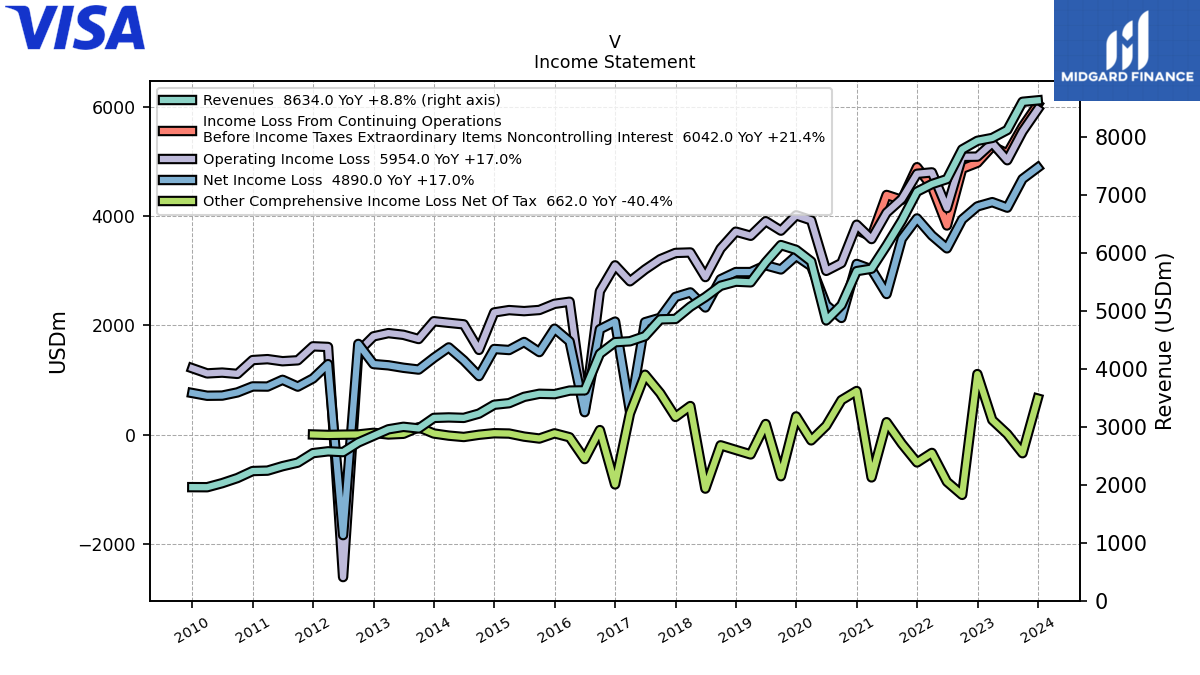 |
 |
V | 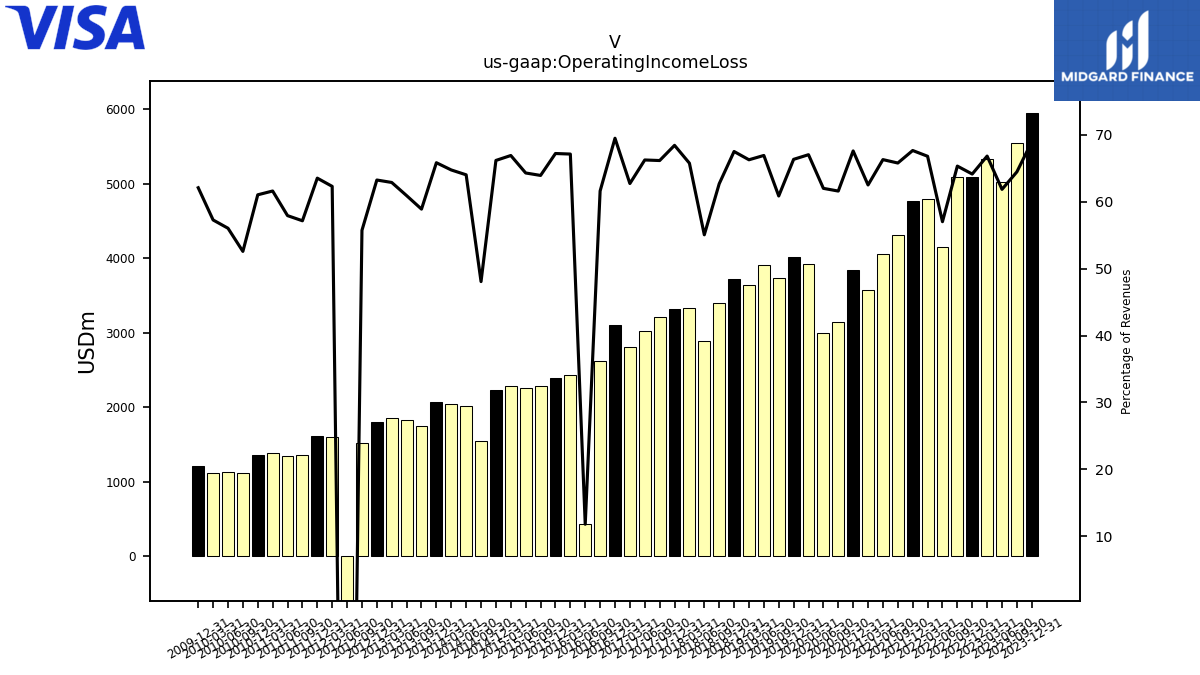 |
 |
V | 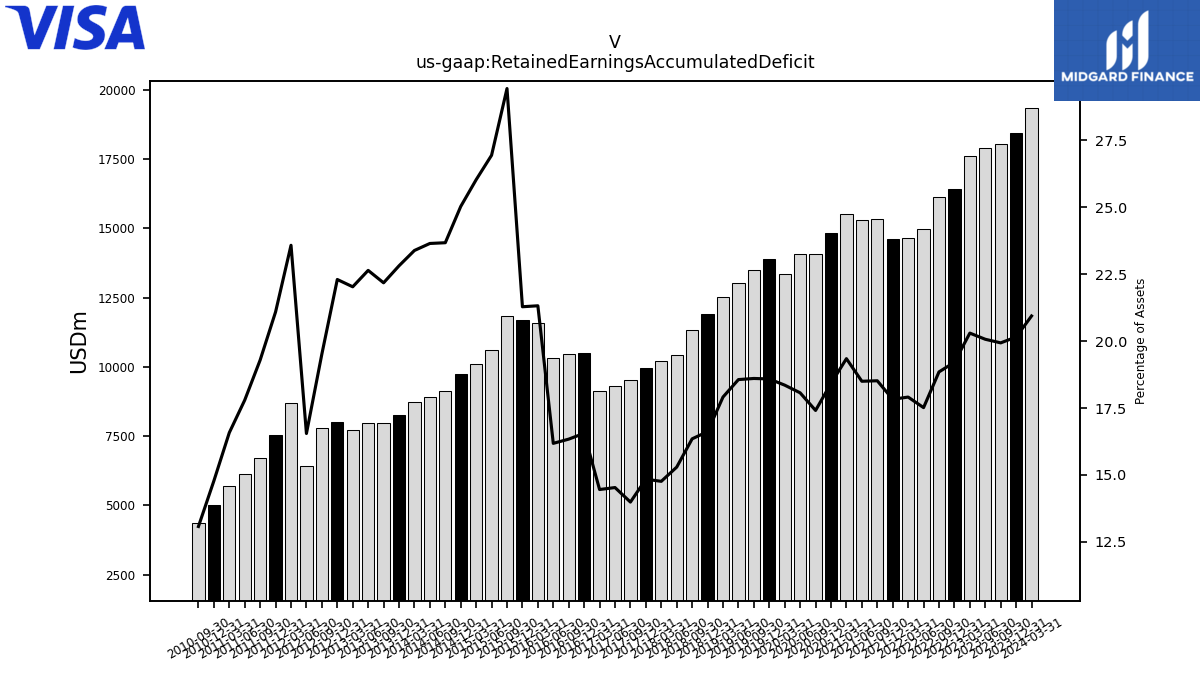 |
 |
V |  |
V | |||||||
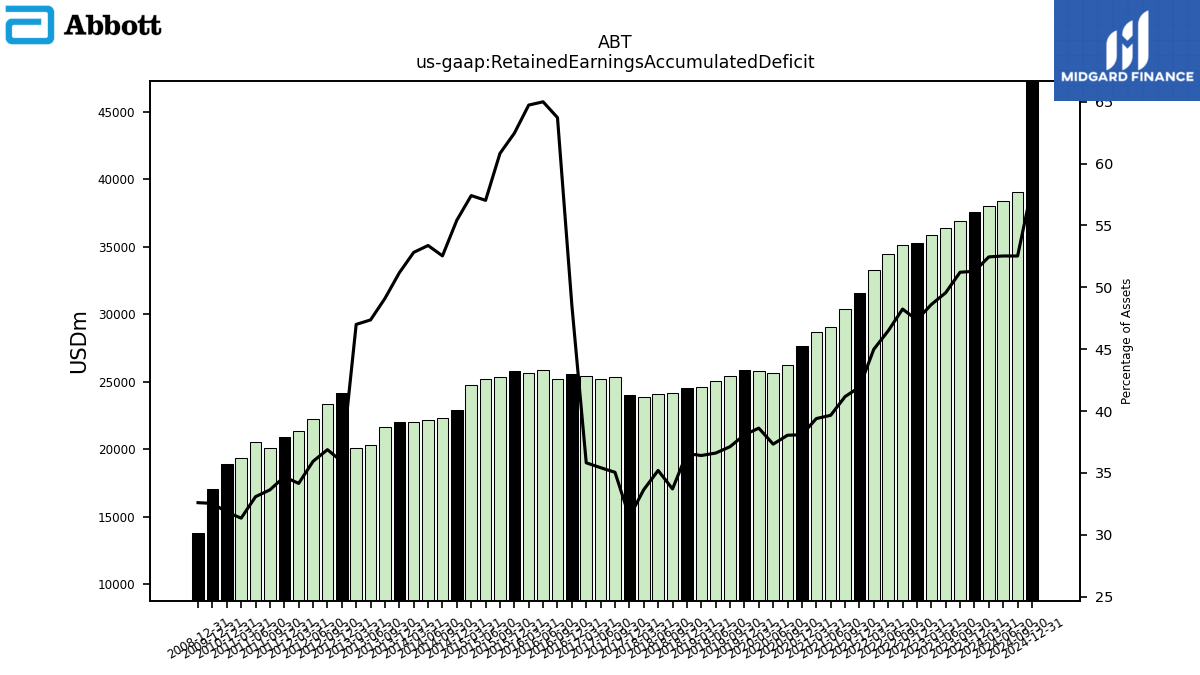
| $ABT$ | 2025-02-21 | 2025-04-30 | 2025-04-16 | NA | NA | ABT | 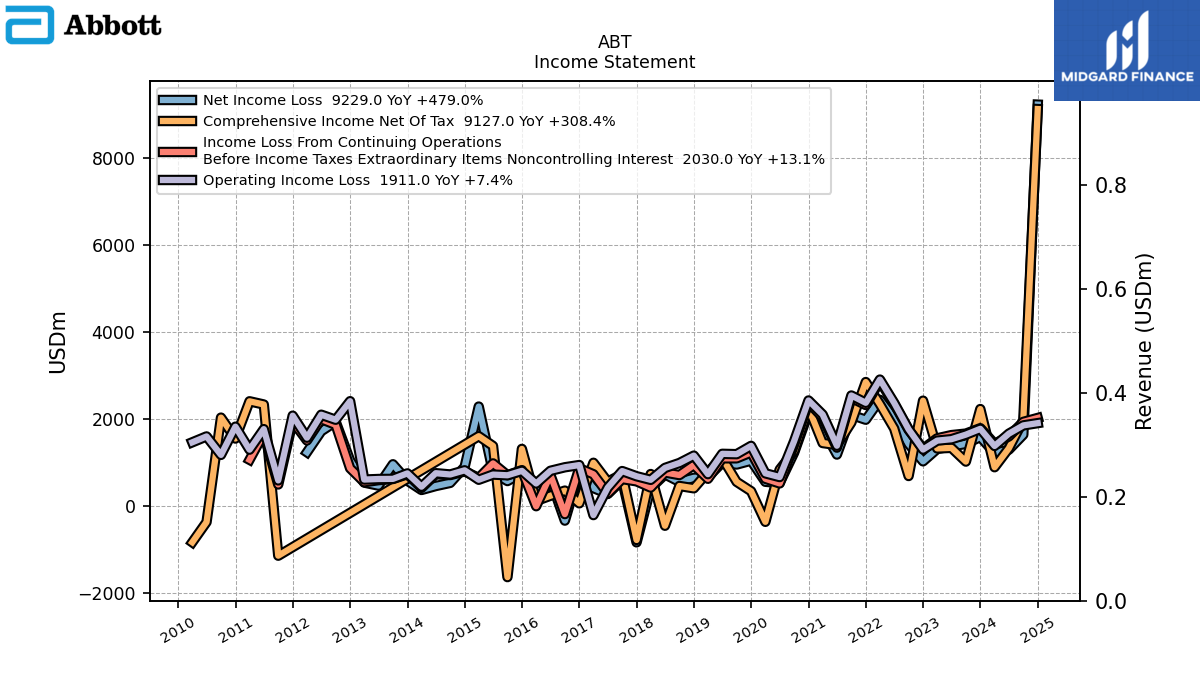 |
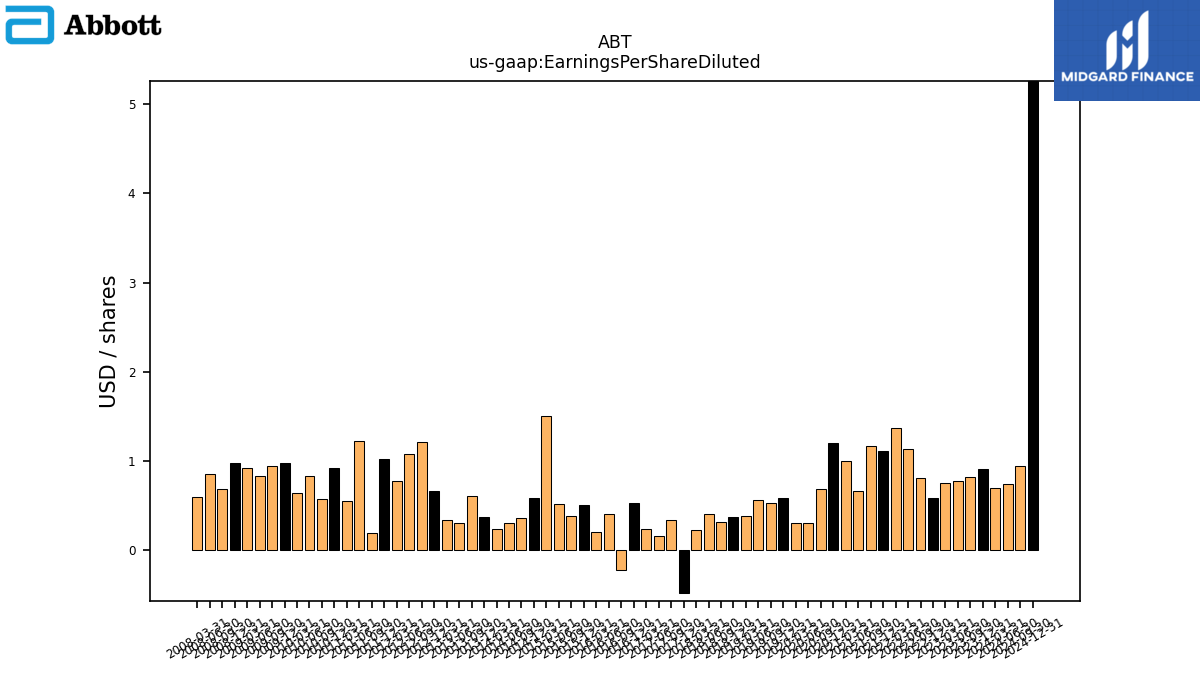 |
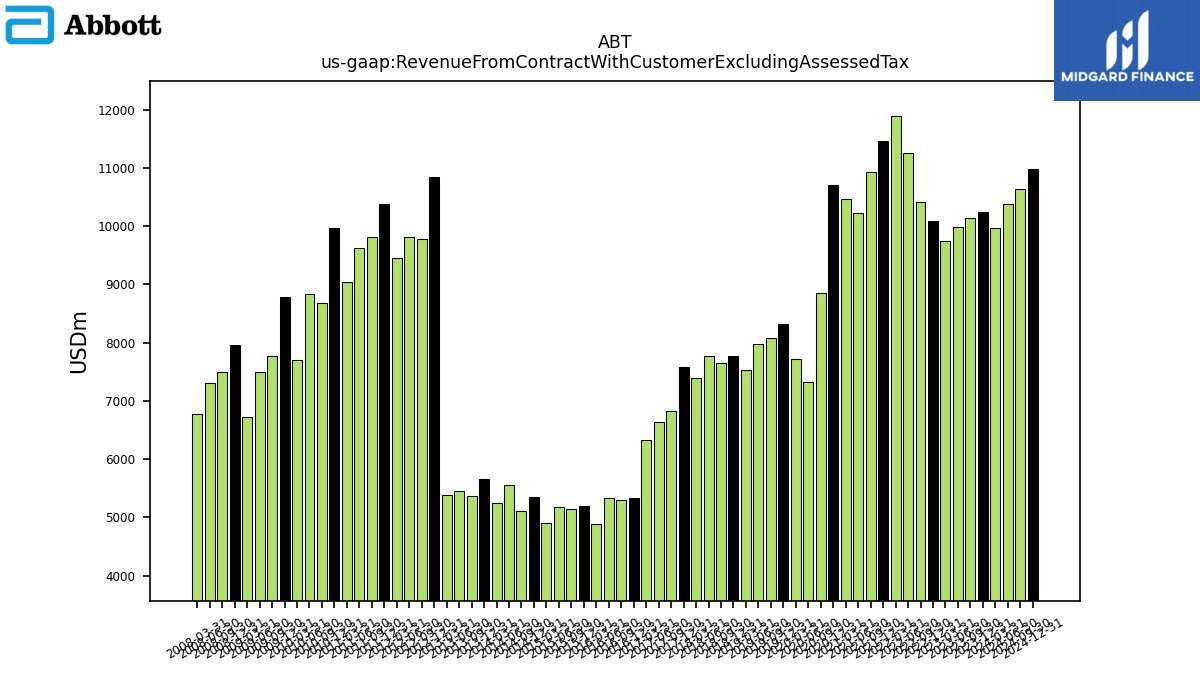 |
ABT | 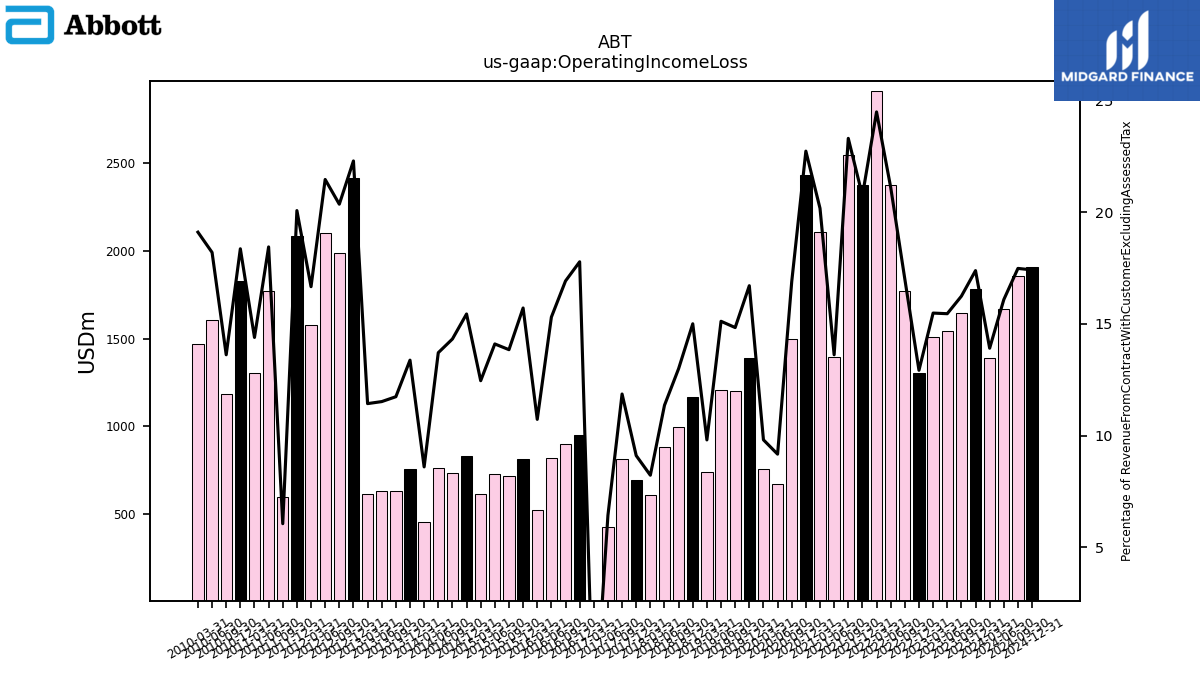 |
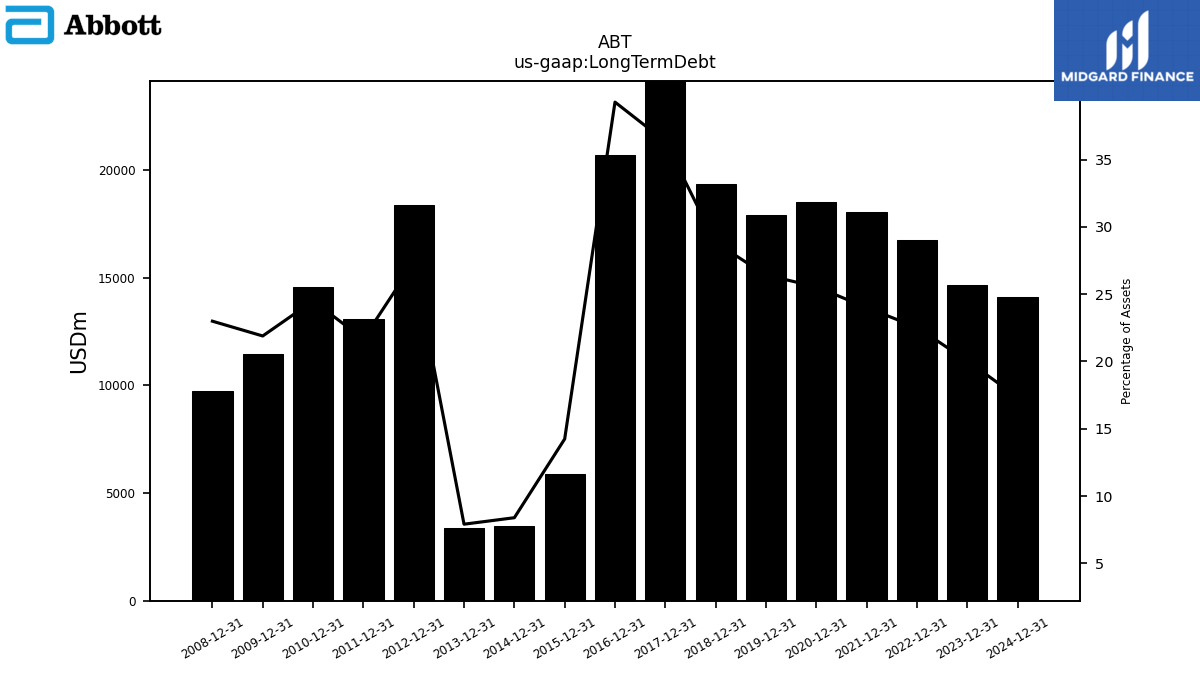 |
ABT | 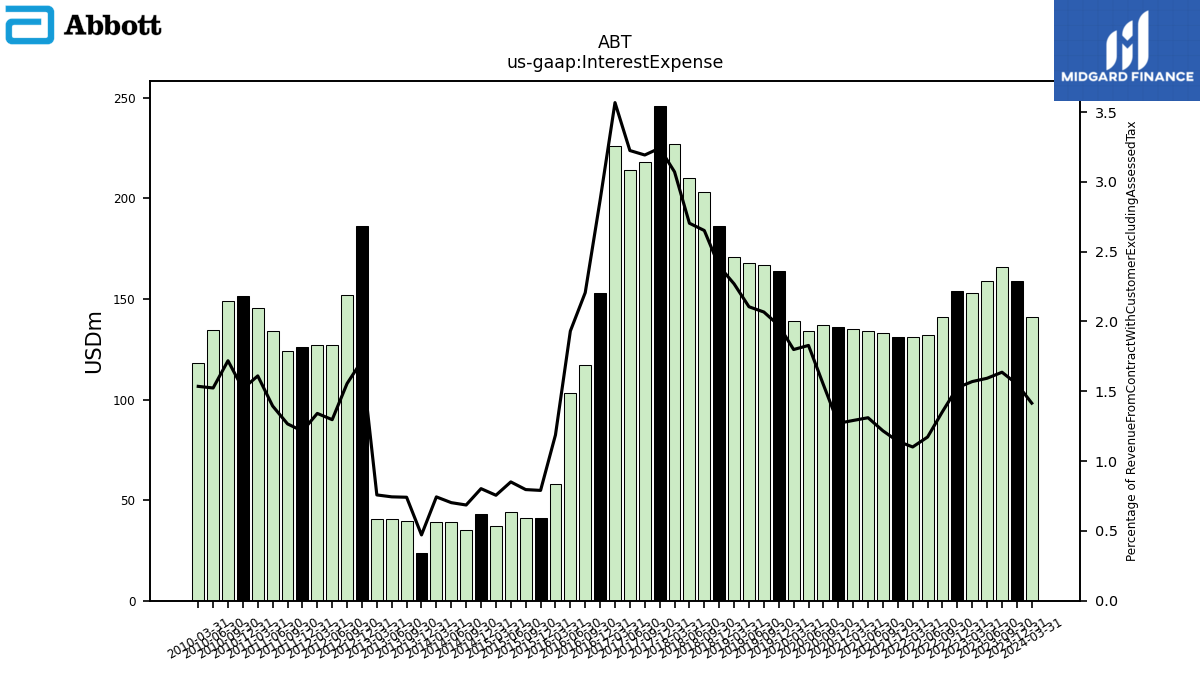 |
 |
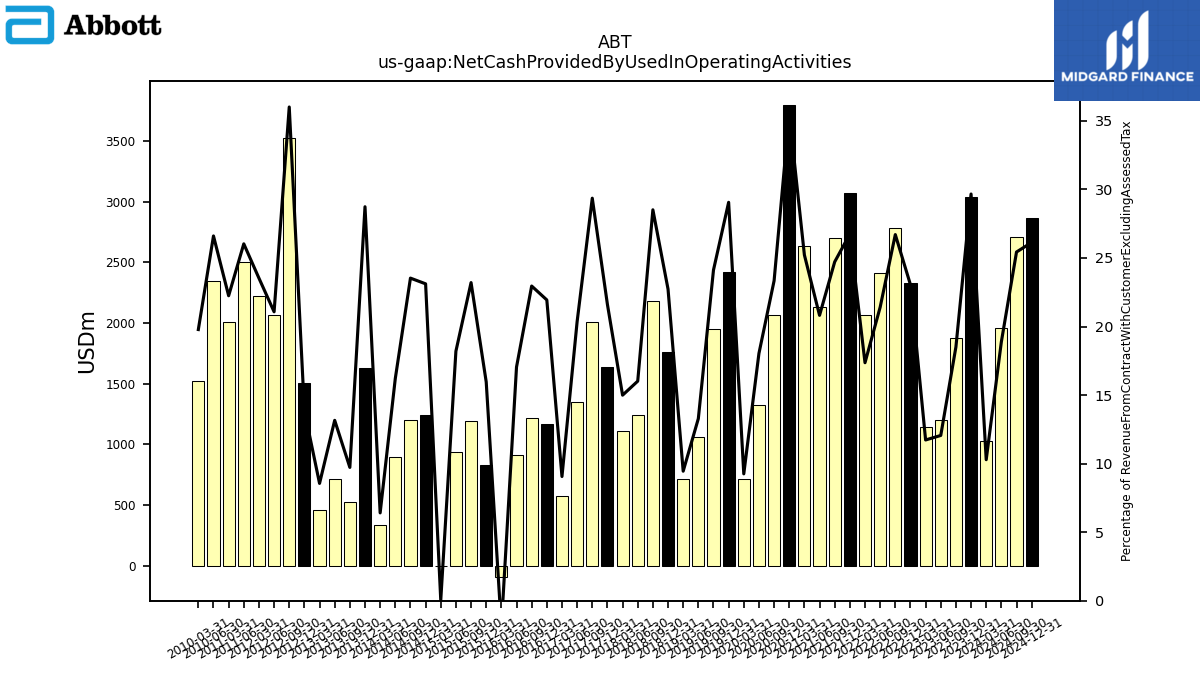 |
ABT | 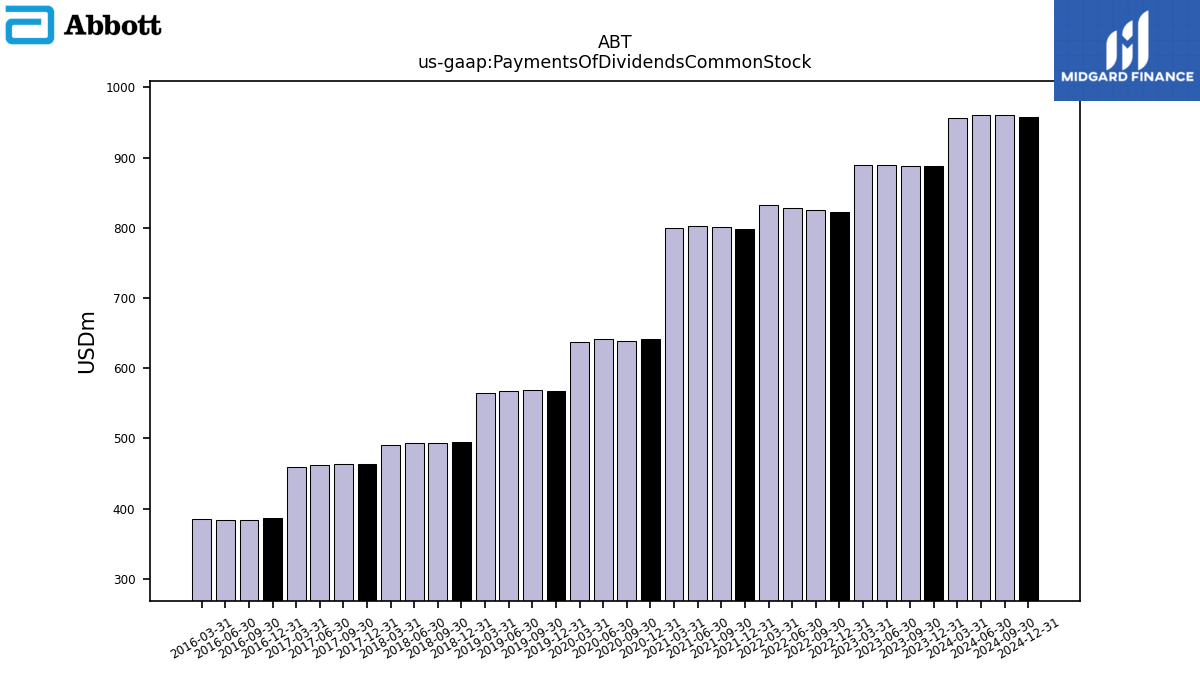 |
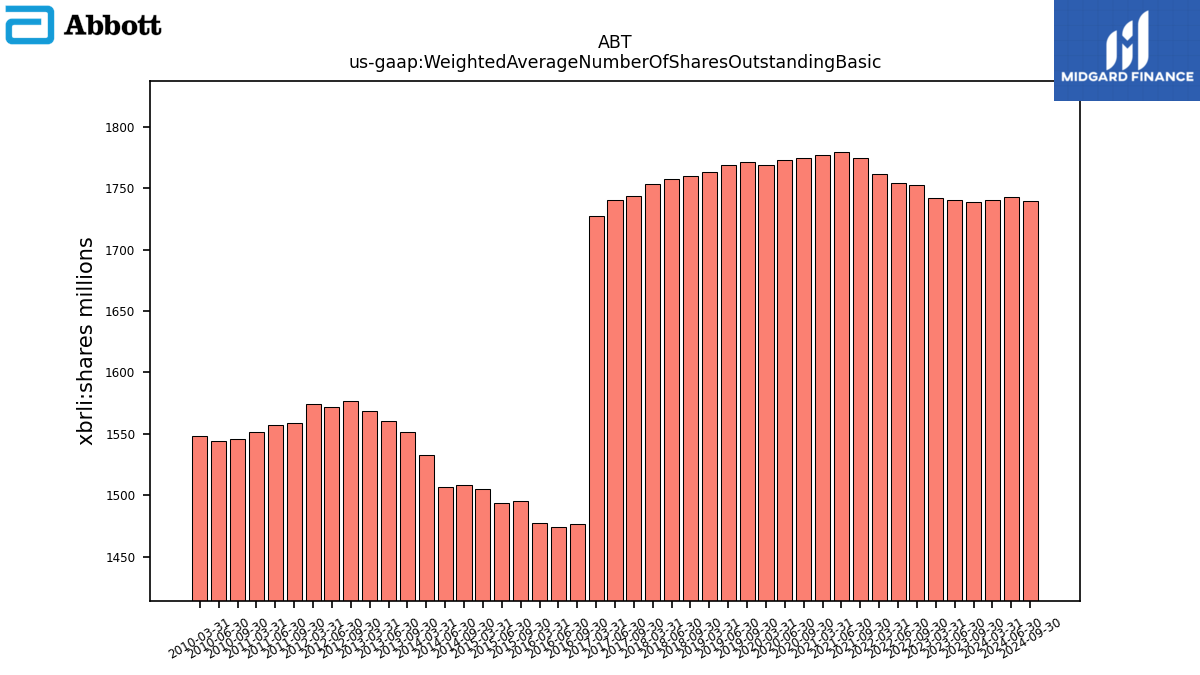 |
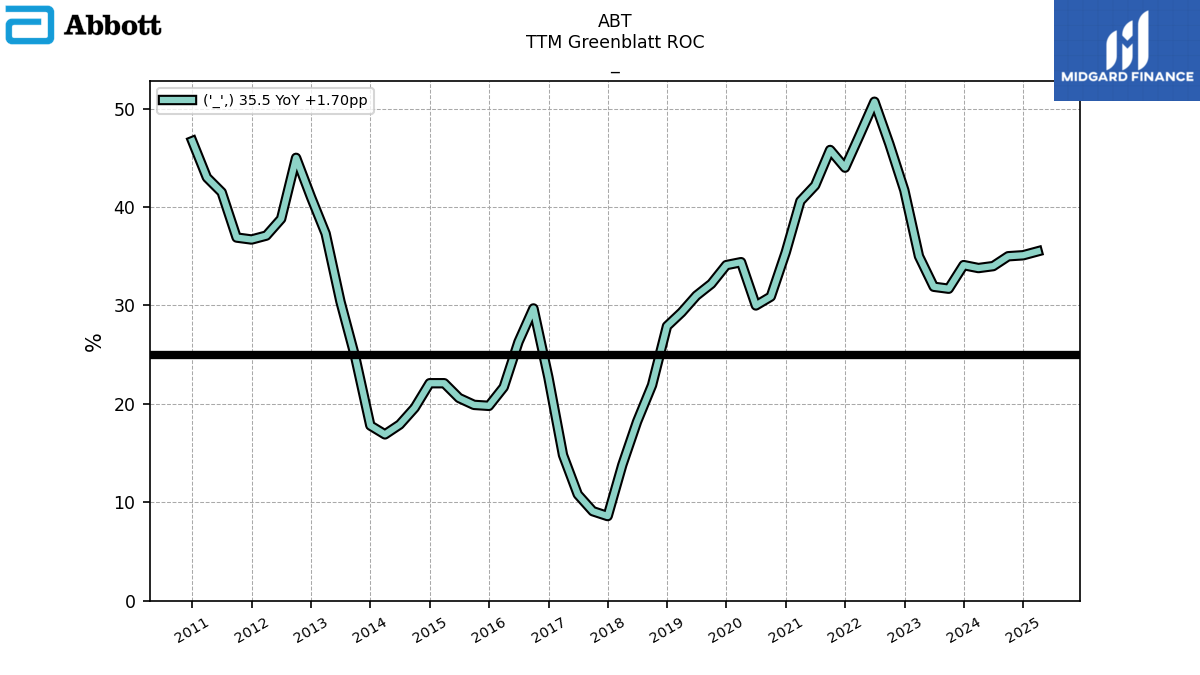 |
ABT | ||||
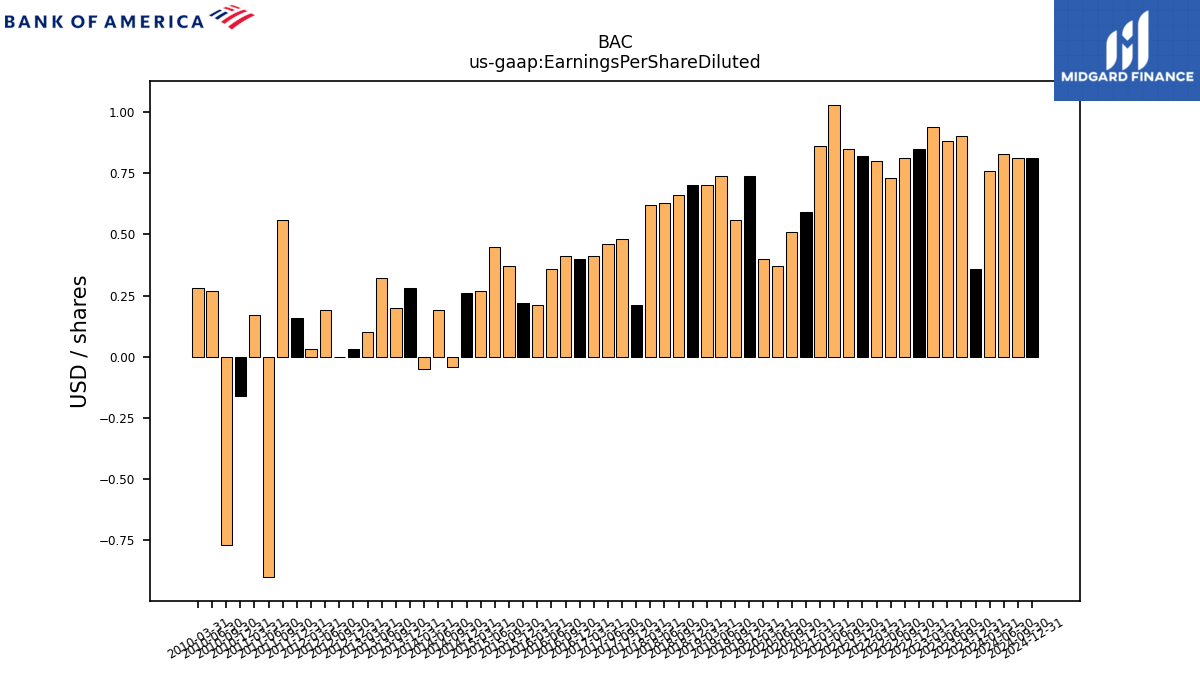
| $BAC$ | 2025-02-25 | 2025-04-30 | 2025-04-15 | NA | NA | BAC | 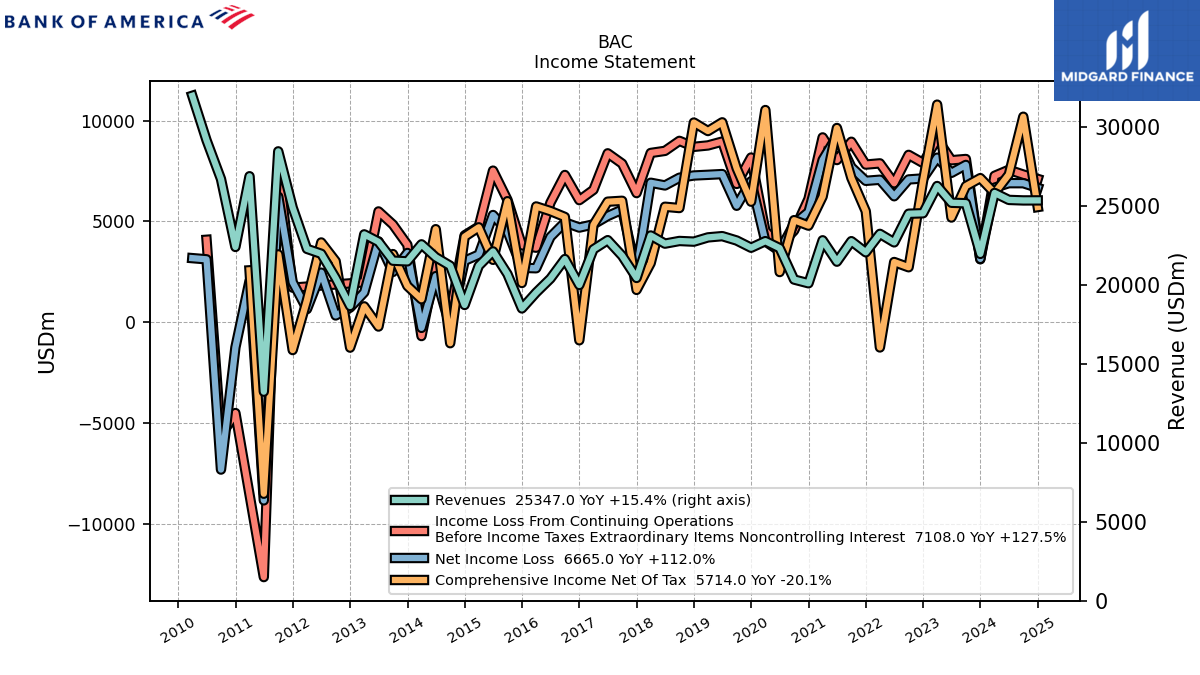 |
 |
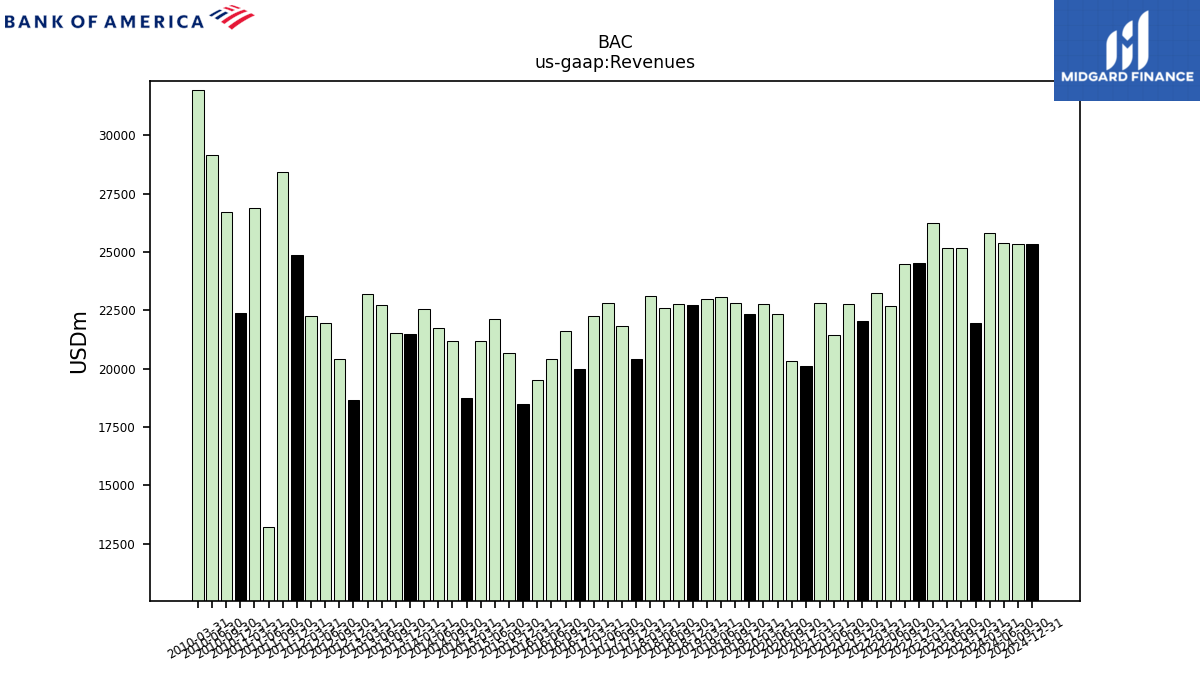 |
BAC |  |
BAC |  |
 |
 |
BAC | 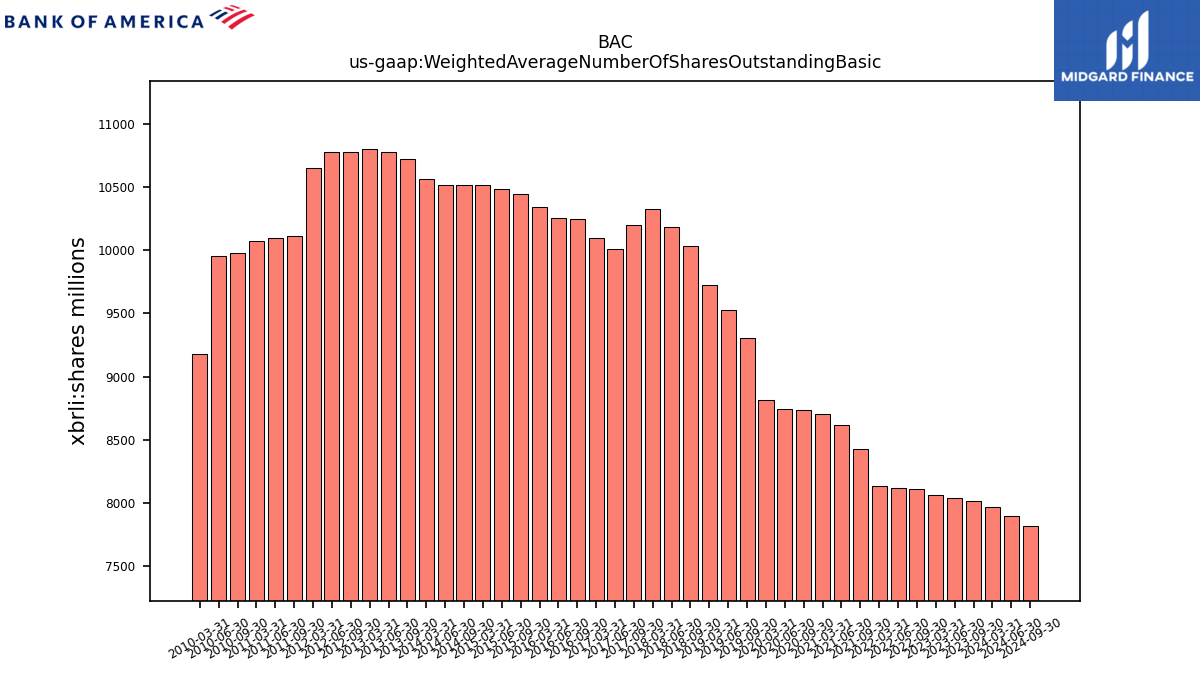 |
BAC | |||||||
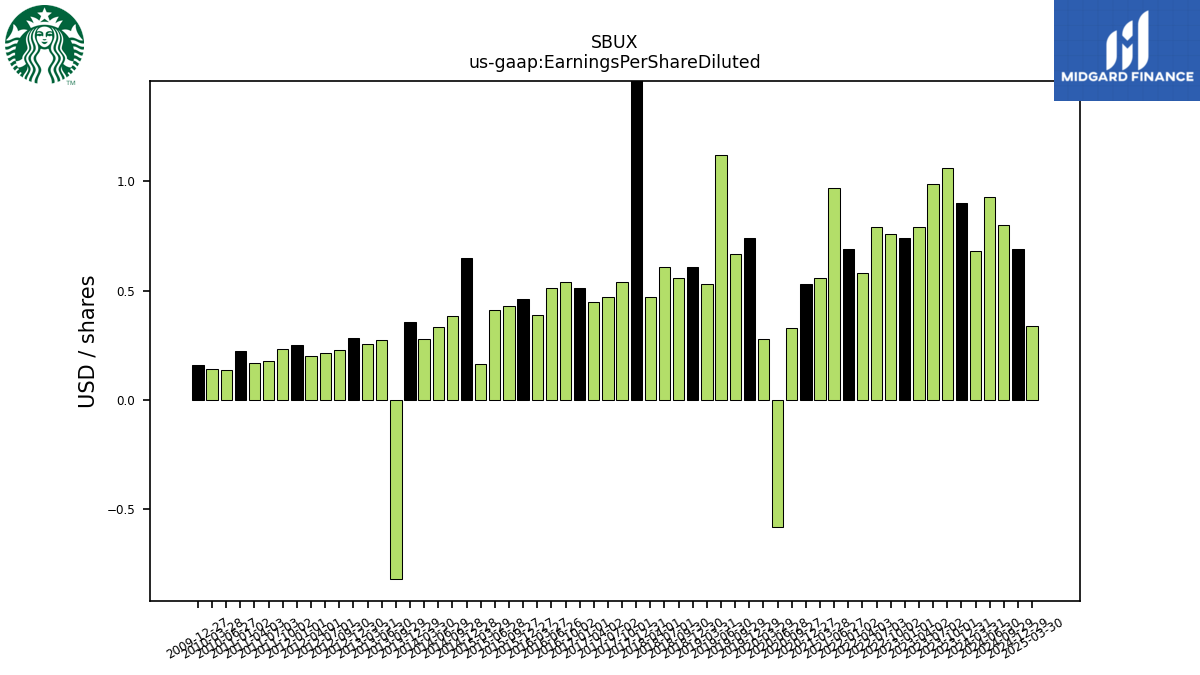
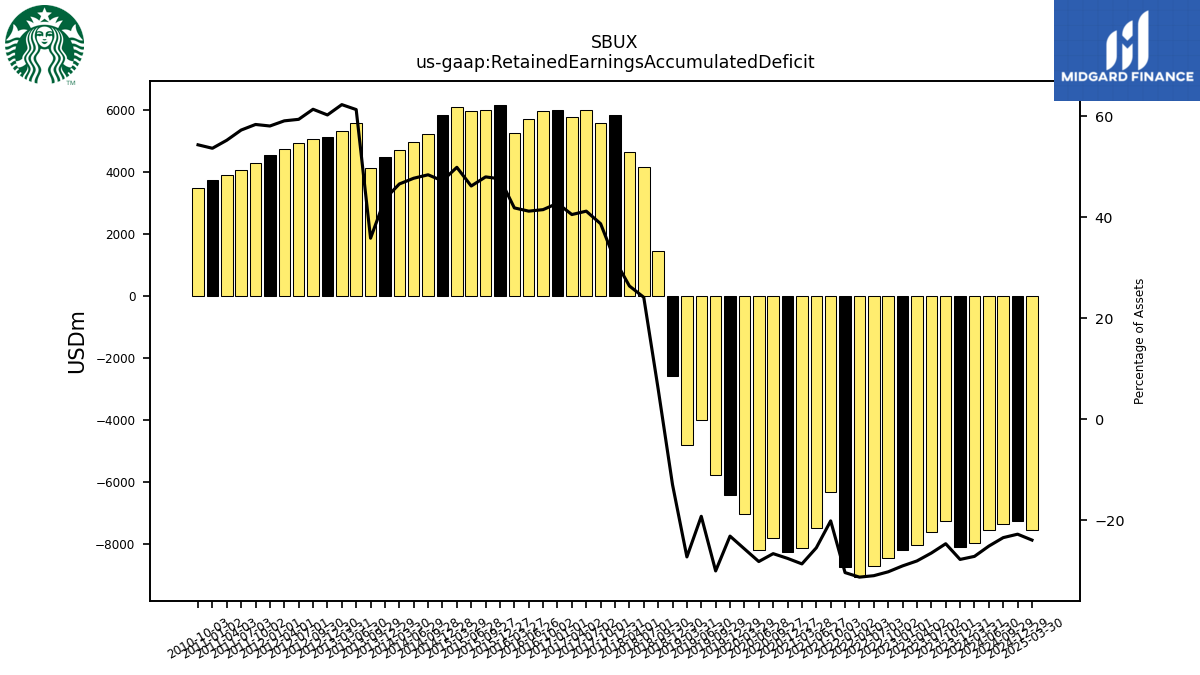
| $SBUX$ | 2024-11-20 | 2025-04-29 | 2025-04-29 | NA | NA | SBUX | 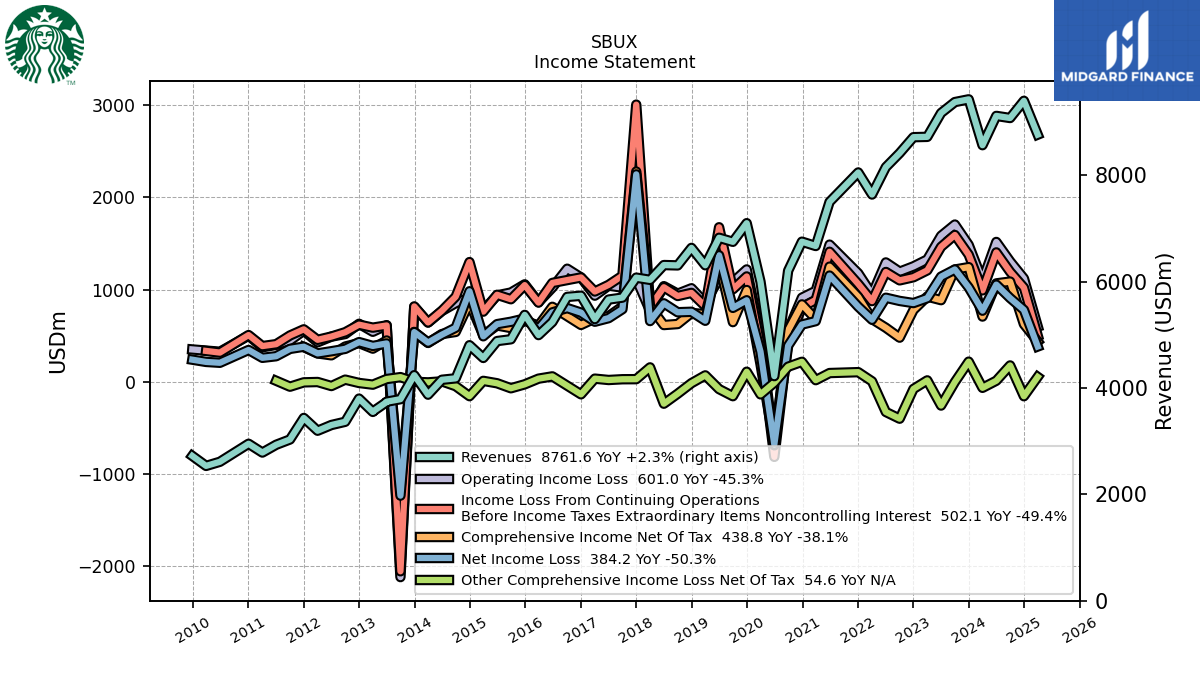 |
 |
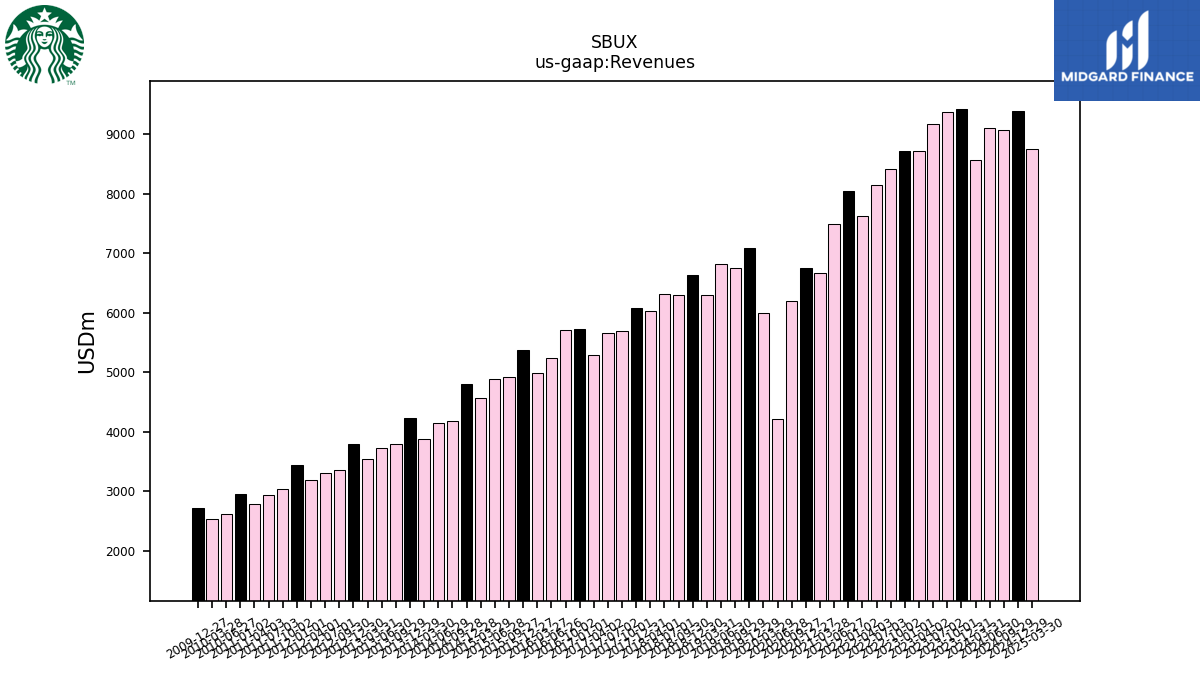 |
SBUX | 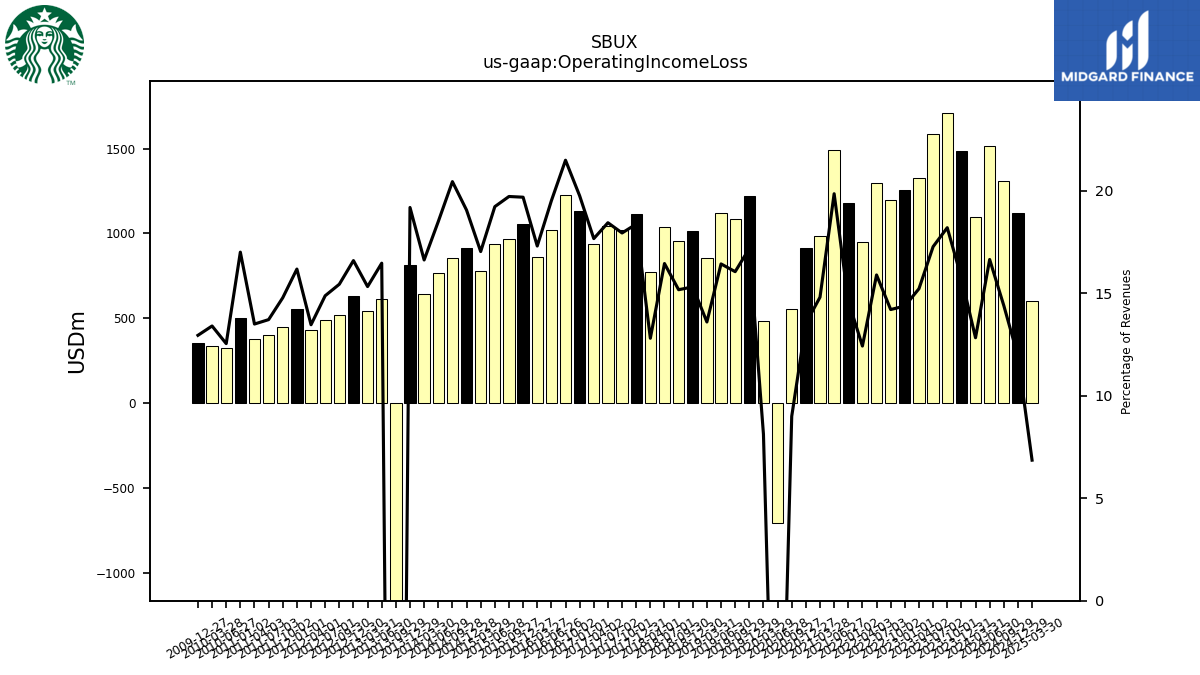 |
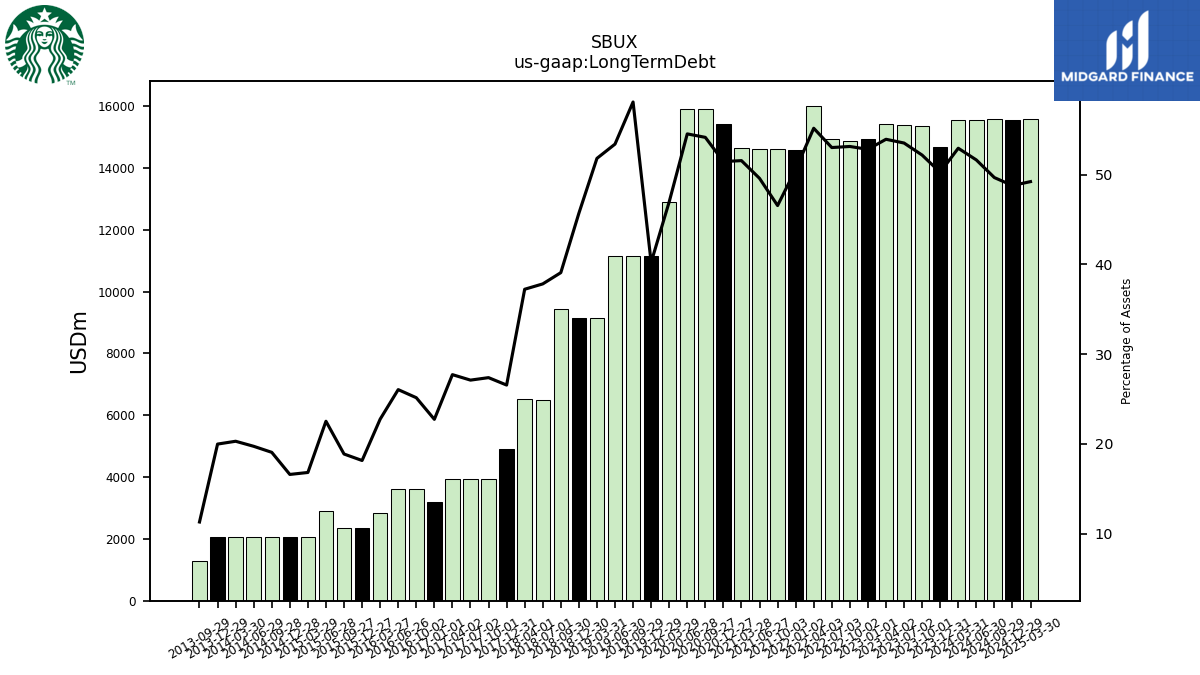 |
SBUX | 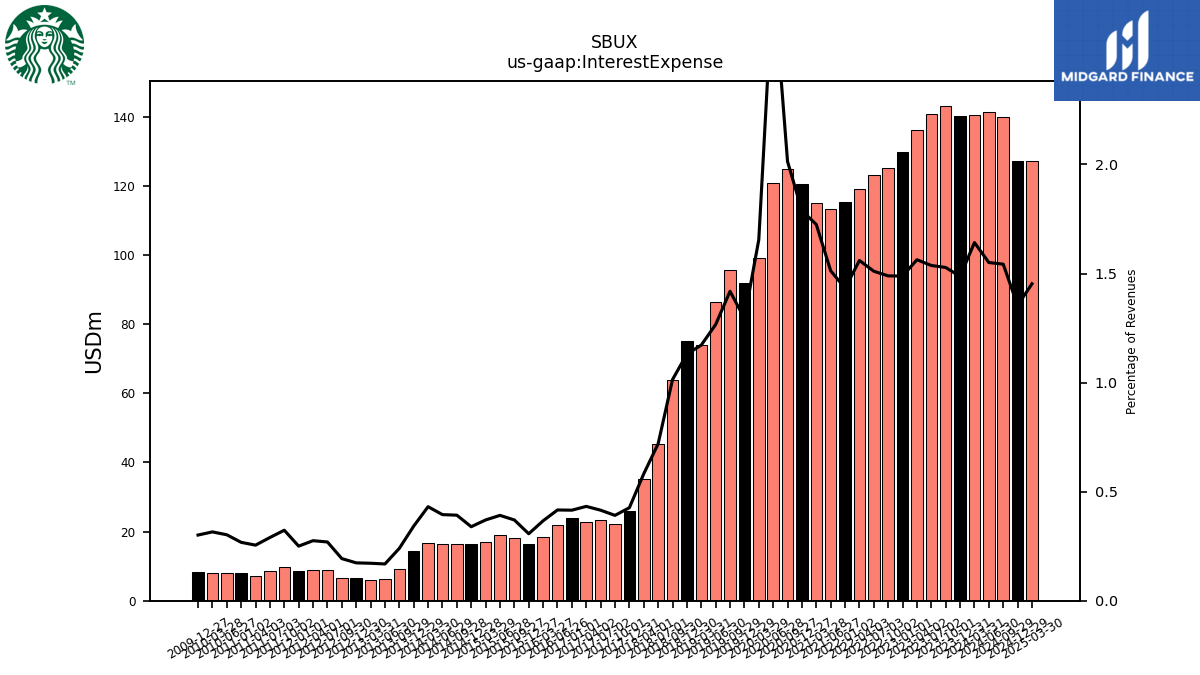 |
 |
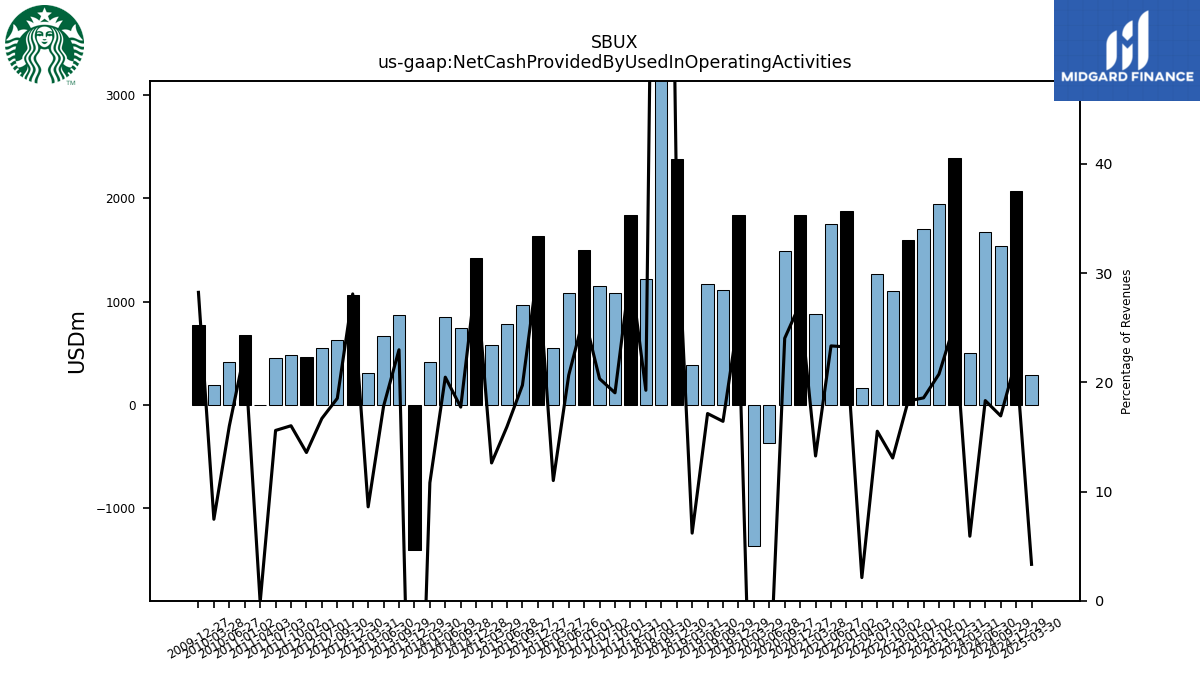 |
SBUX | 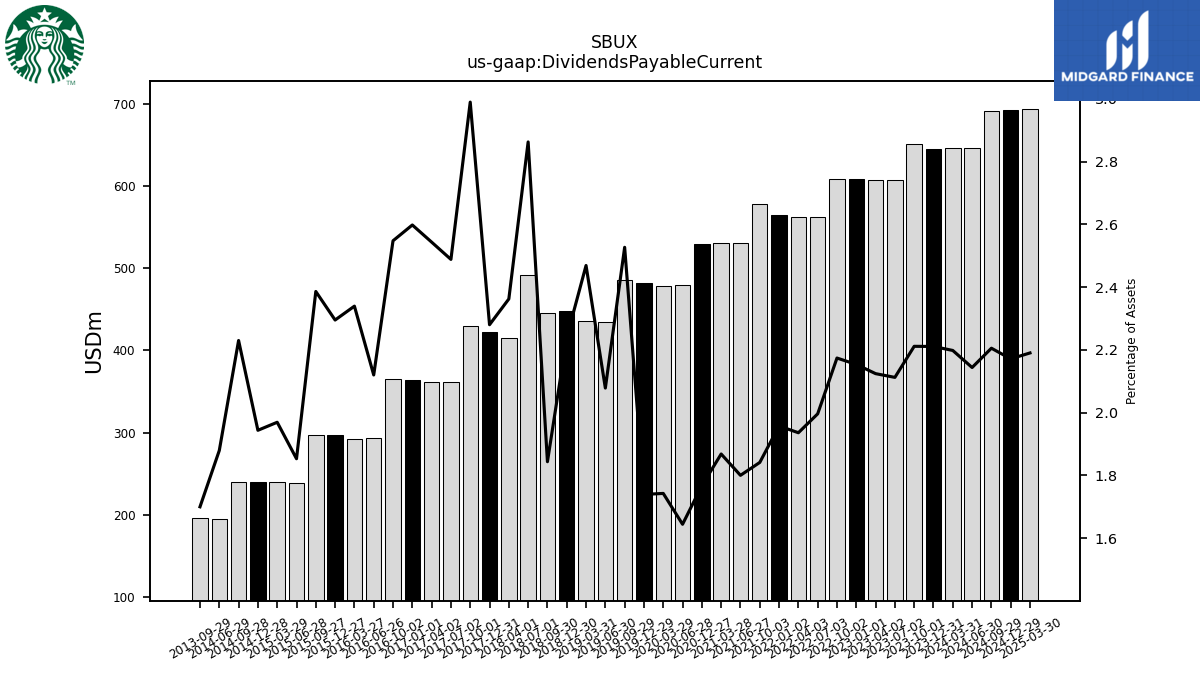 |
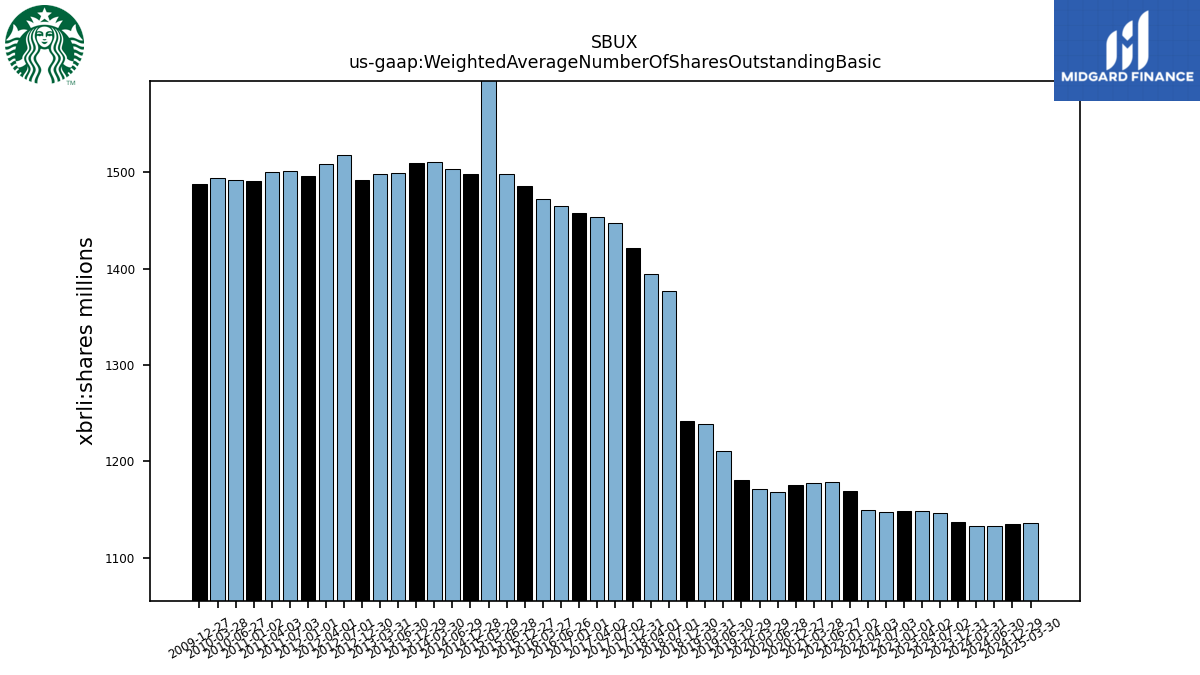 |
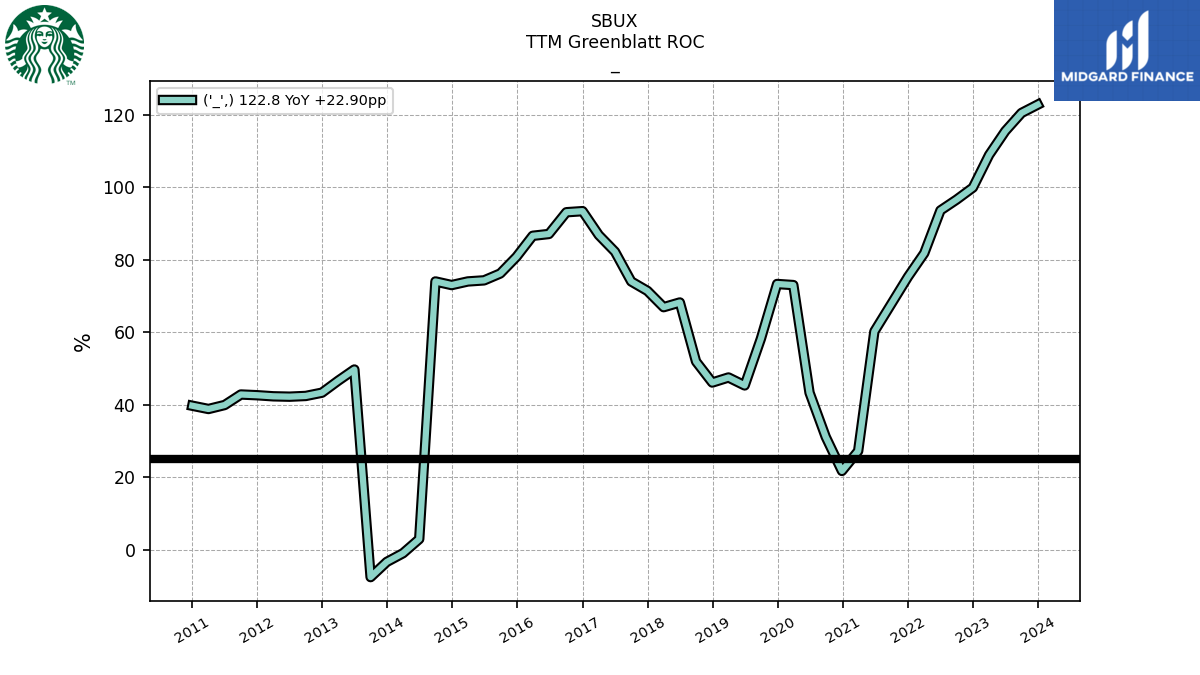 |
SBUX | ||||
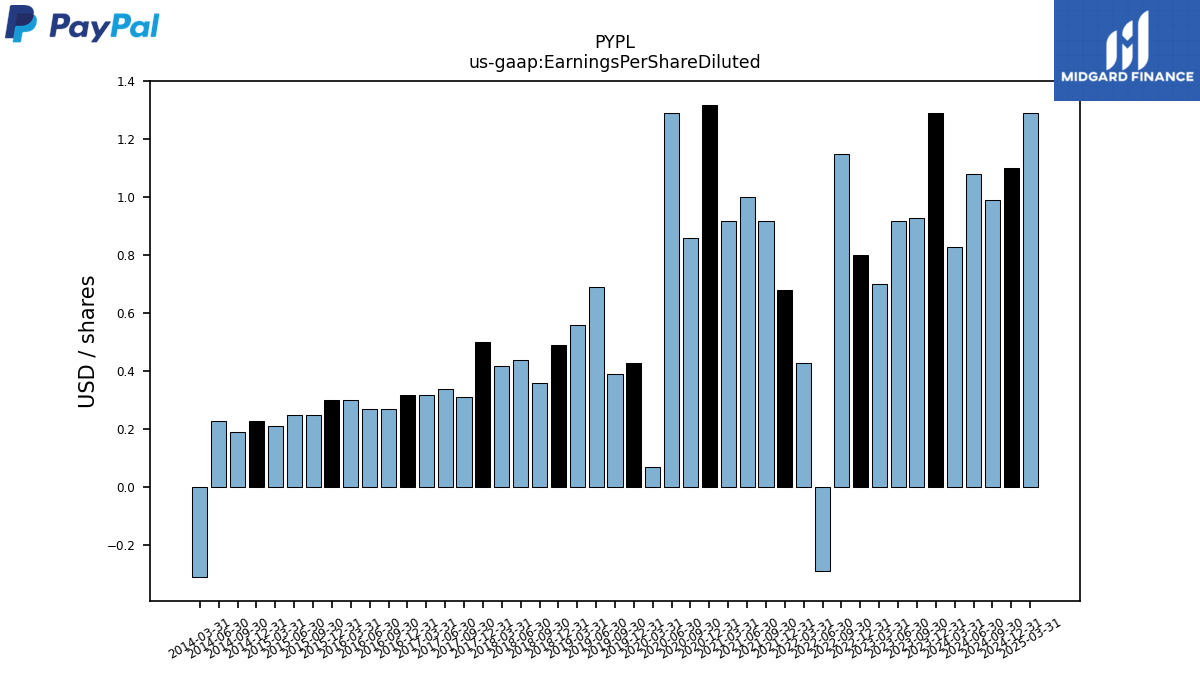
| $PYPL$ | 2025-02-04 | 2025-04-29 | 2025-04-29 |  |
NA | NA | PYPL | 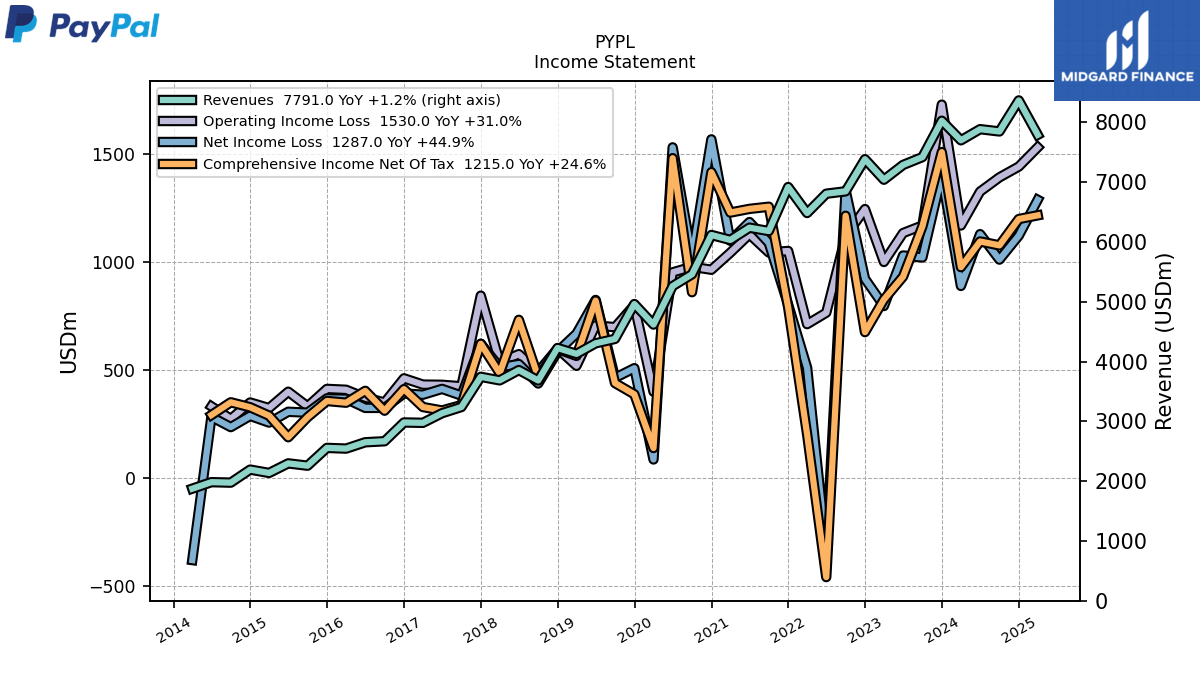 |
 |
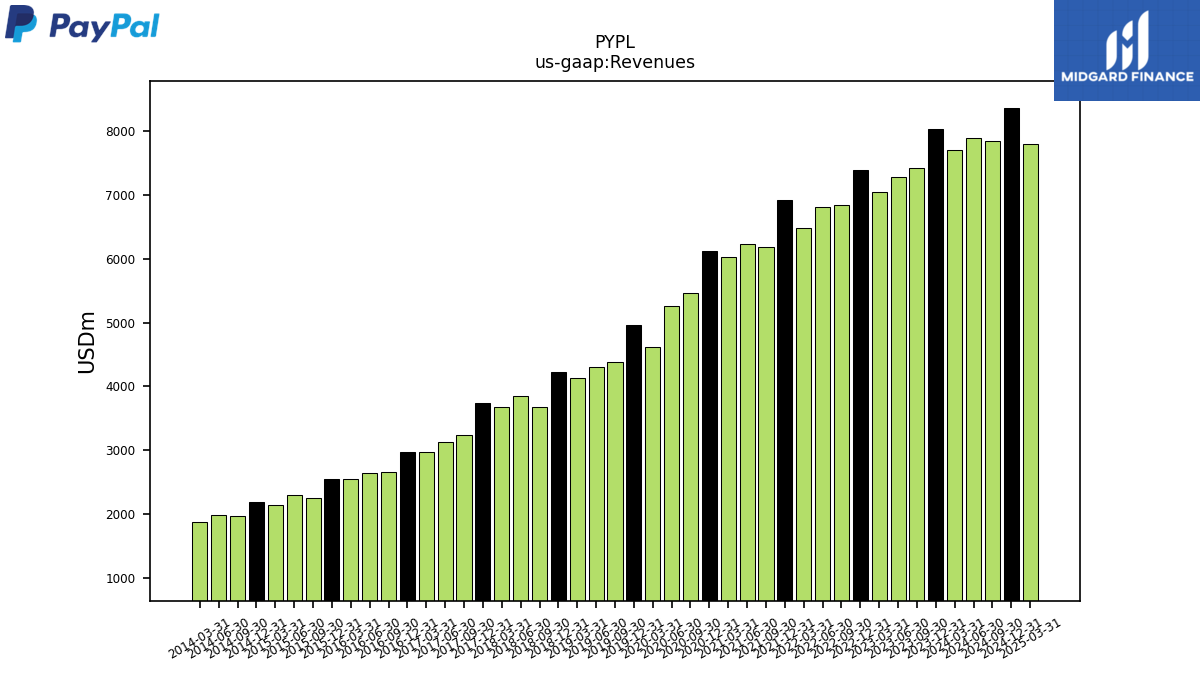 |
PYPL | 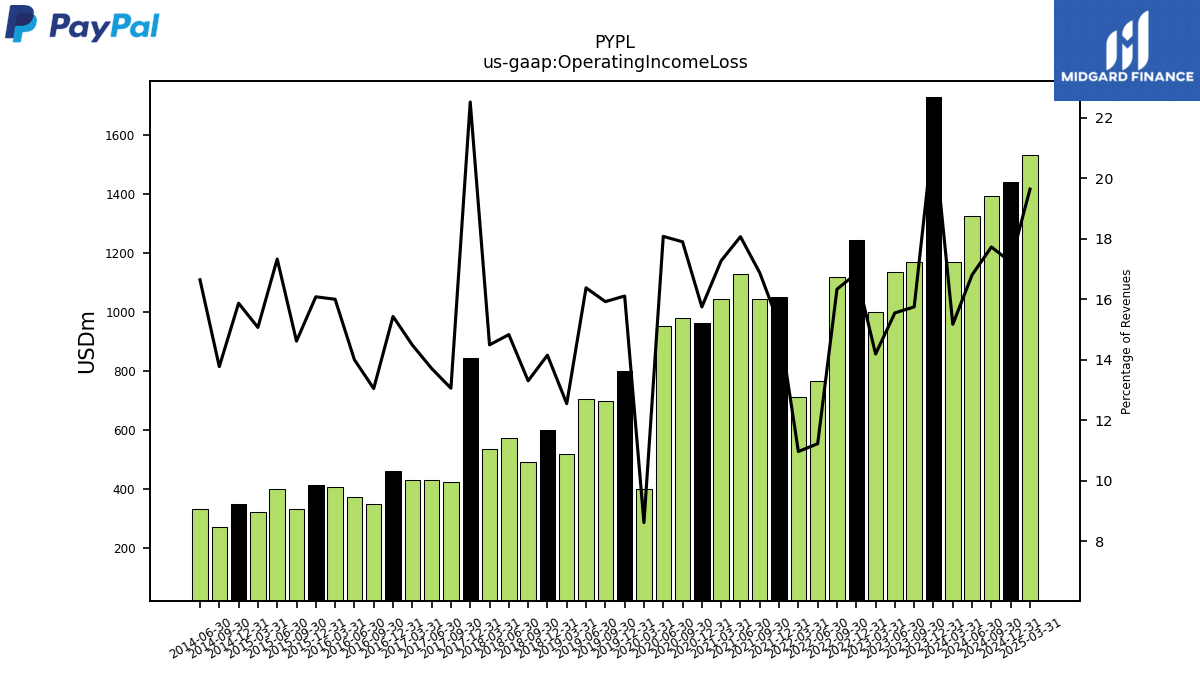 |
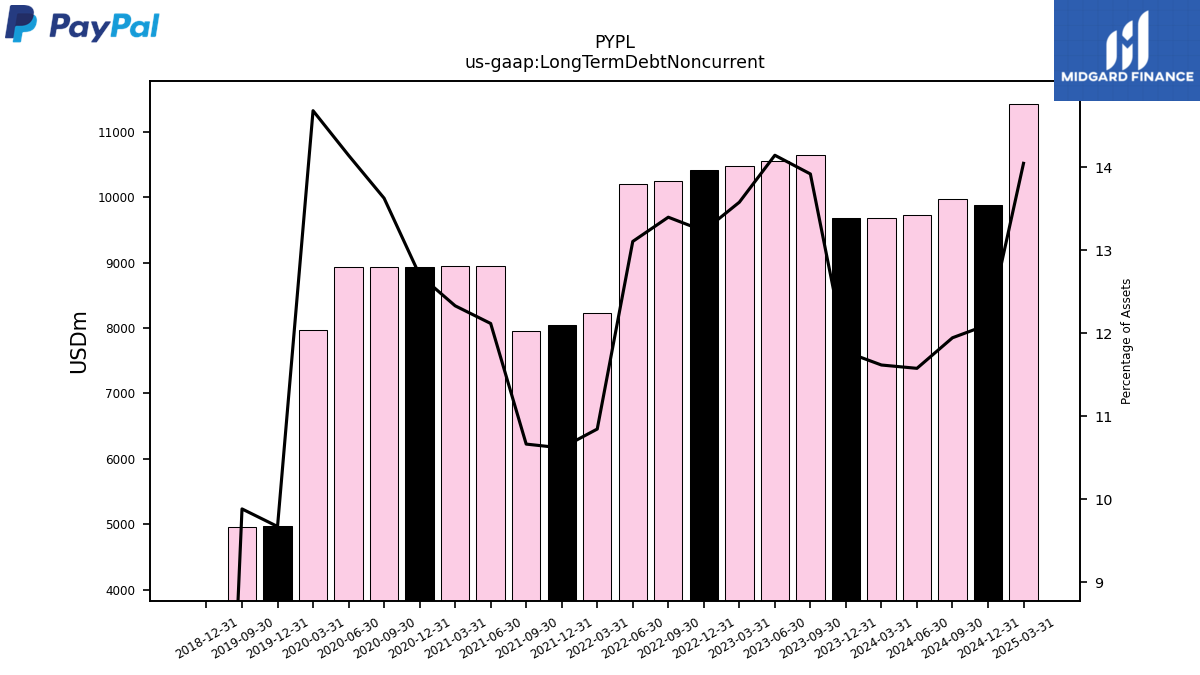 |
PYPL | 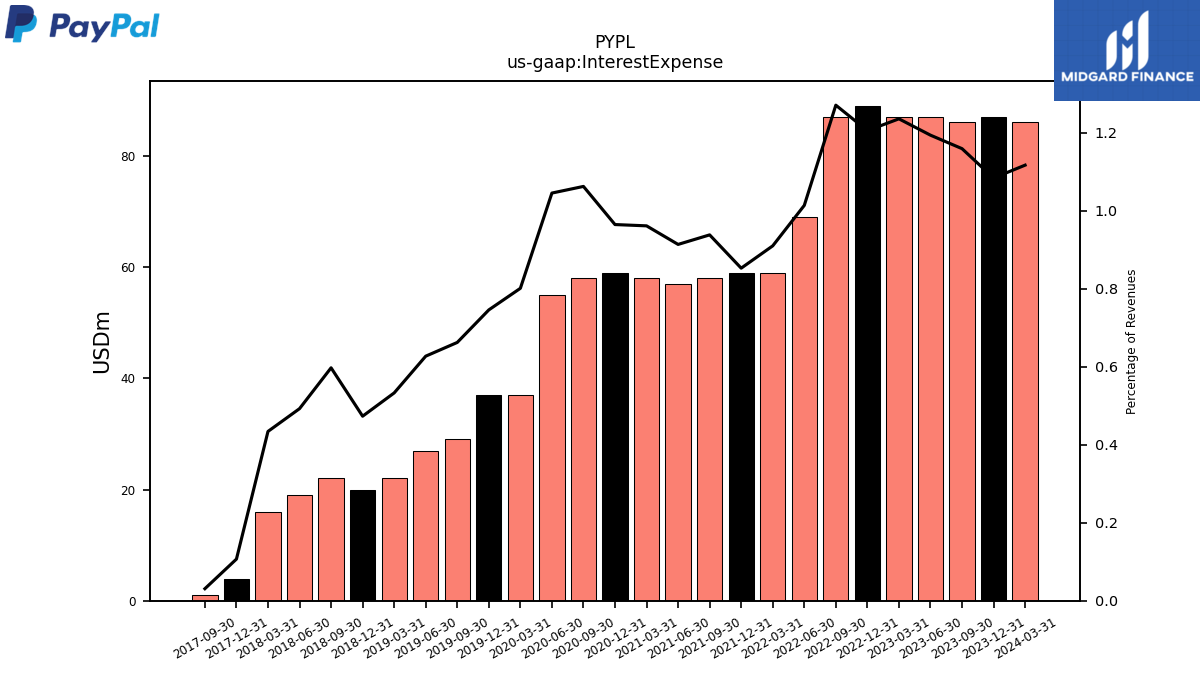 |
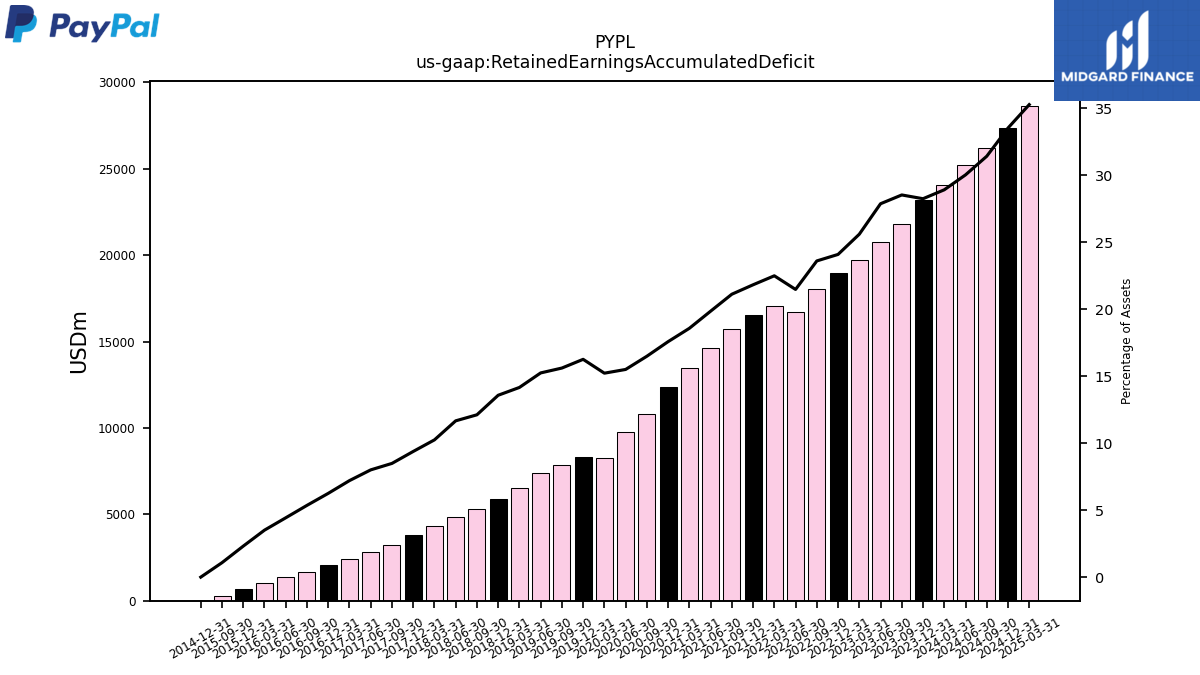 |
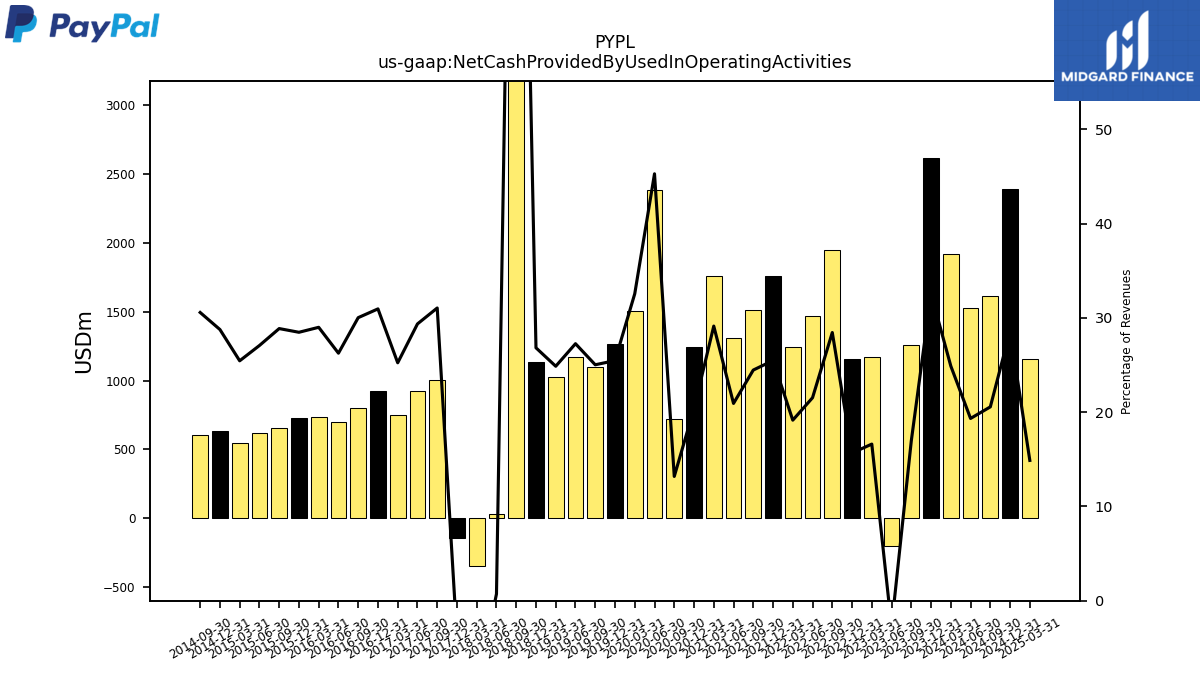 |
PYPL | 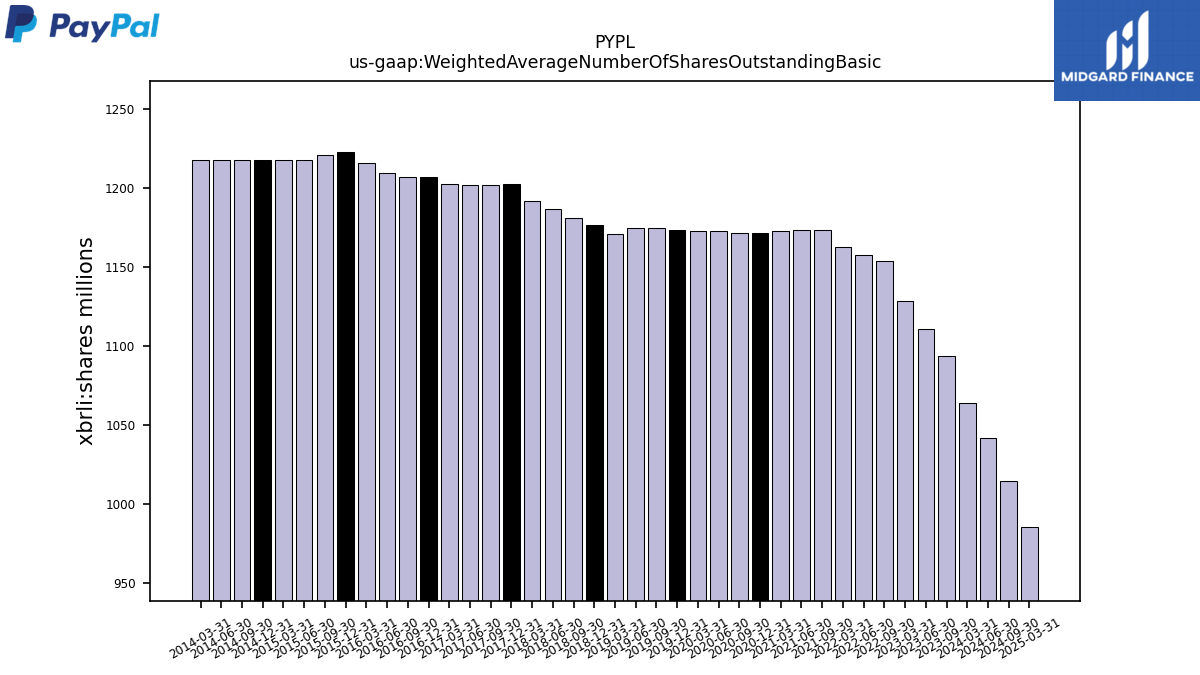 |
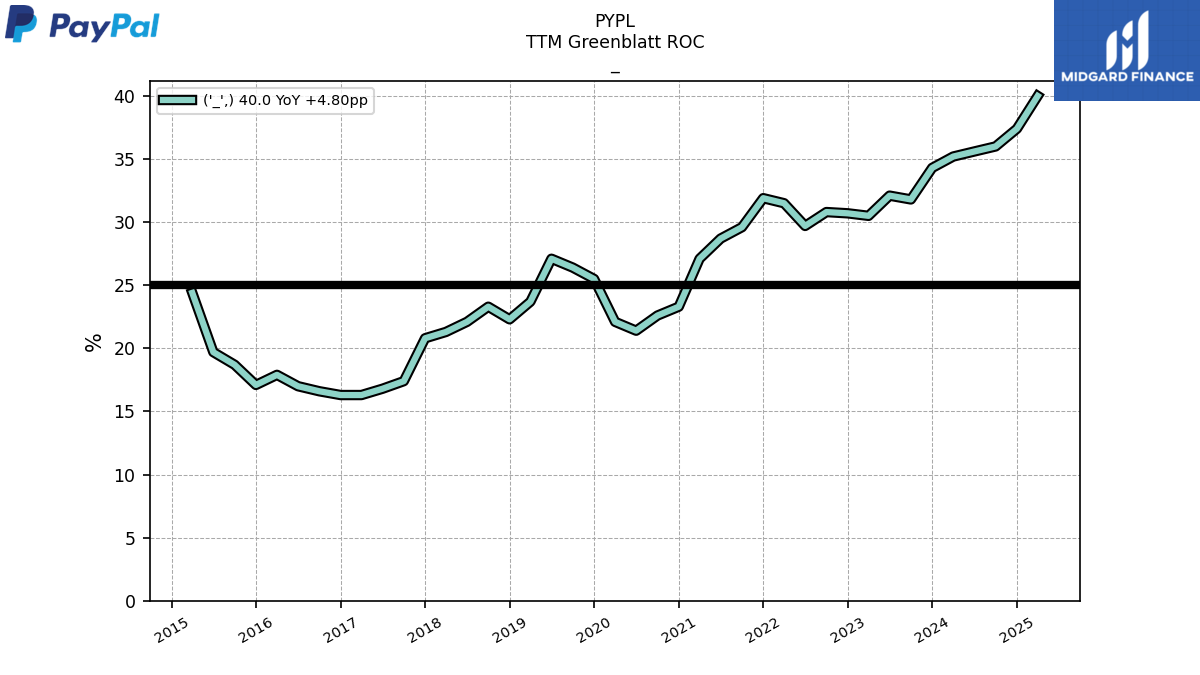 |
PYPL | ||||
| Ticker | 10K | 10Q | 8K | Sector | Industry | Logo | Forward P/E | Revenue Growth | Ticker | Income | EPS | Revenues | Ticker | GrossProfit | OperatingIncome | LongTermDebt | Ticker | InterestExpense | RetainedEarnnings | CashFlowOperating | Ticker | Dividends | SharesOutstanding | TTMGreenblattROC | |
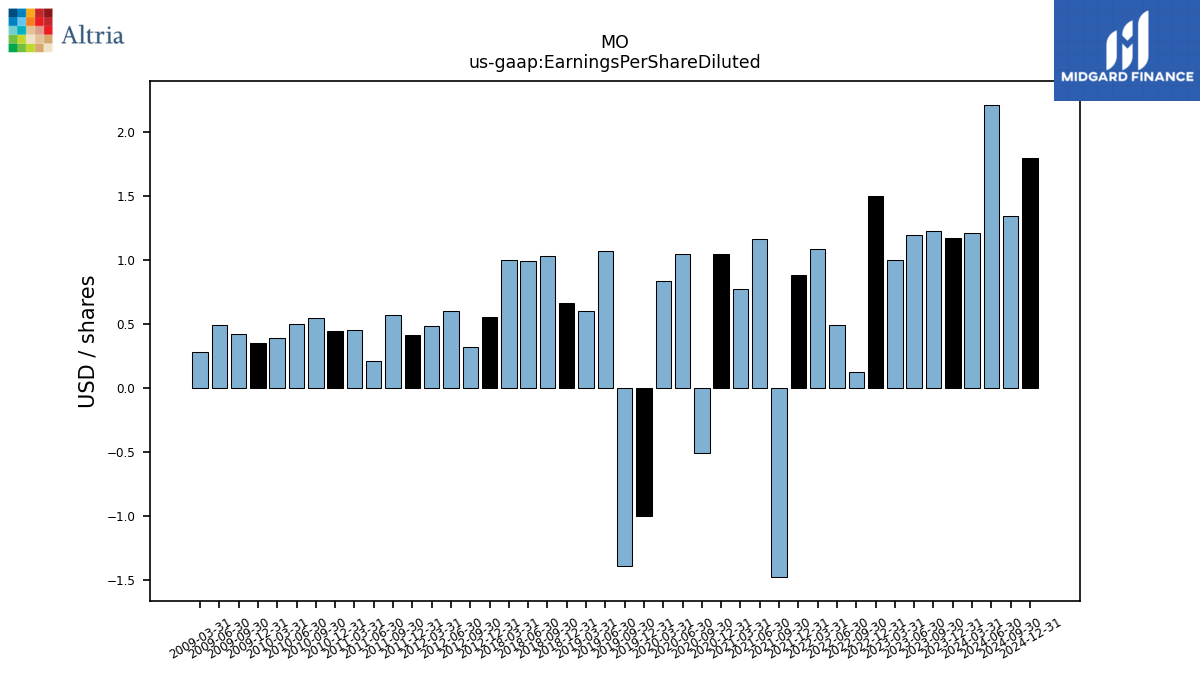
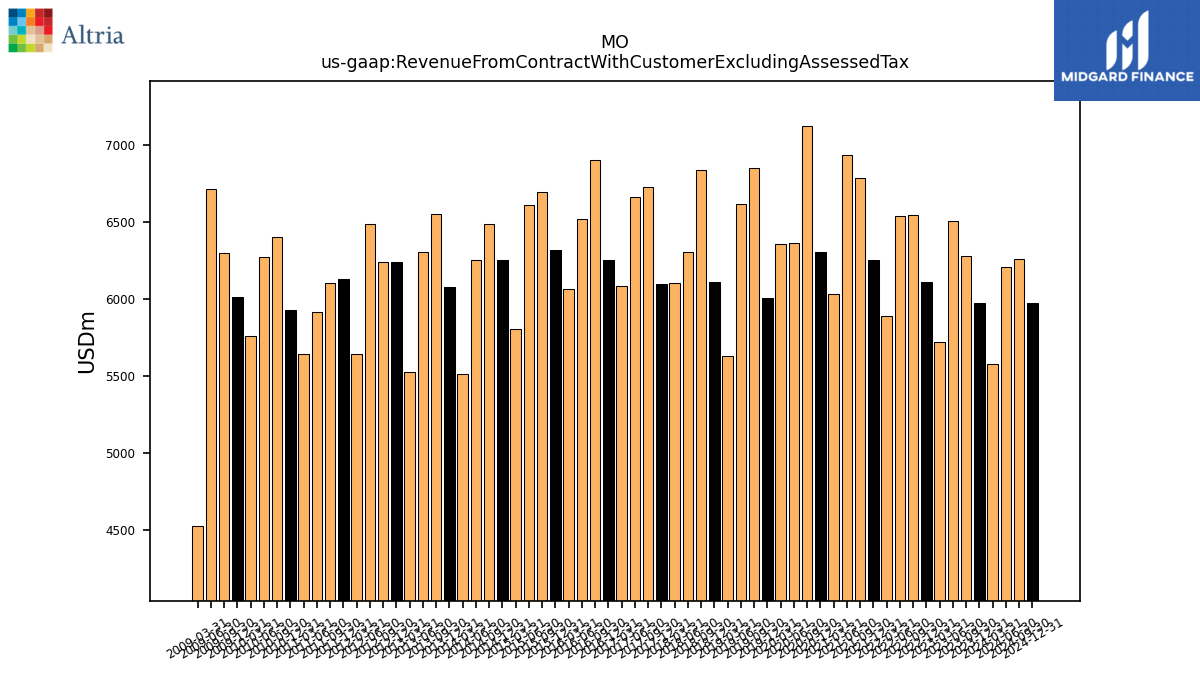
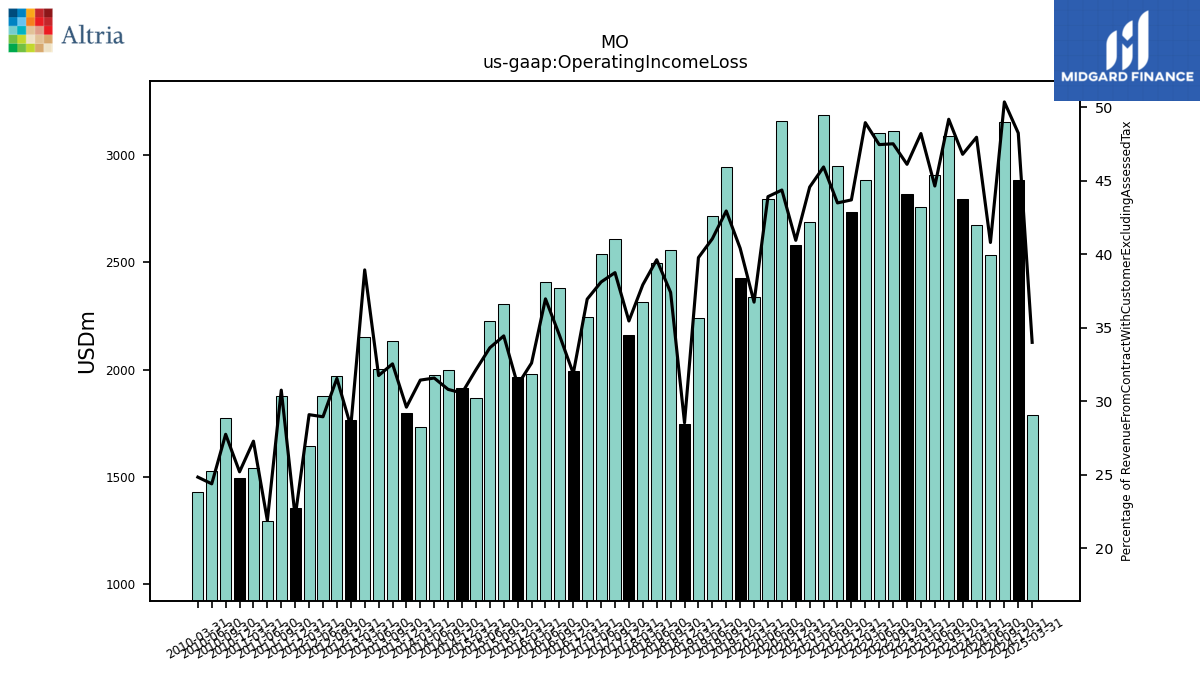
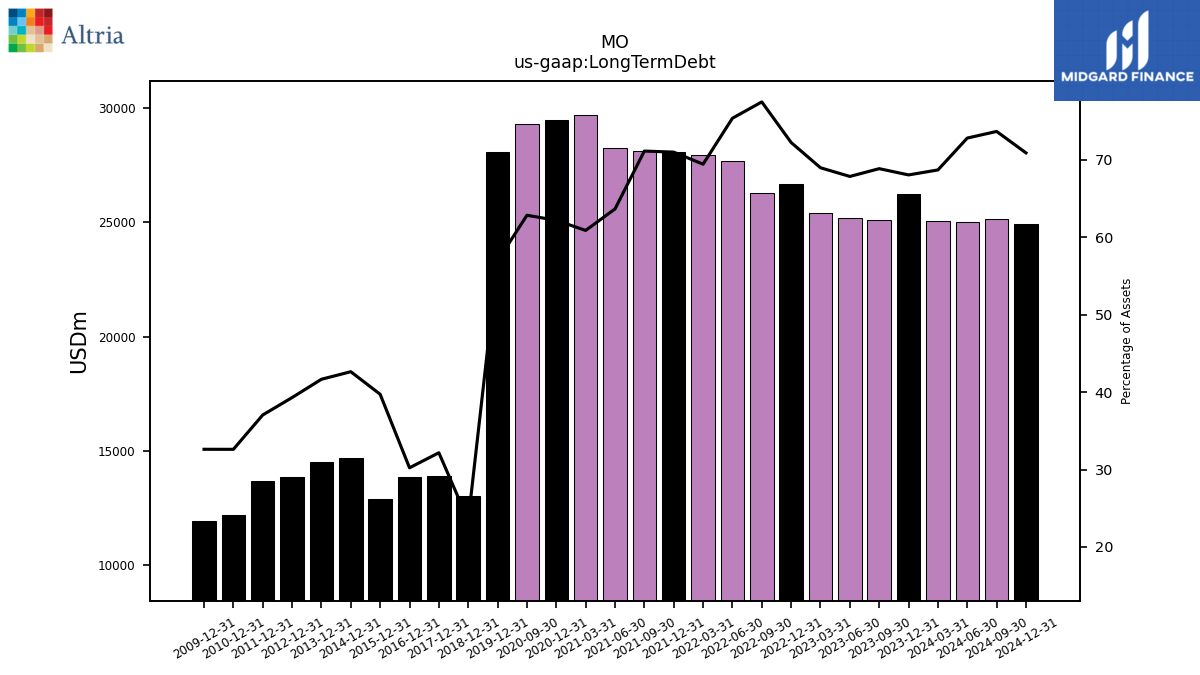
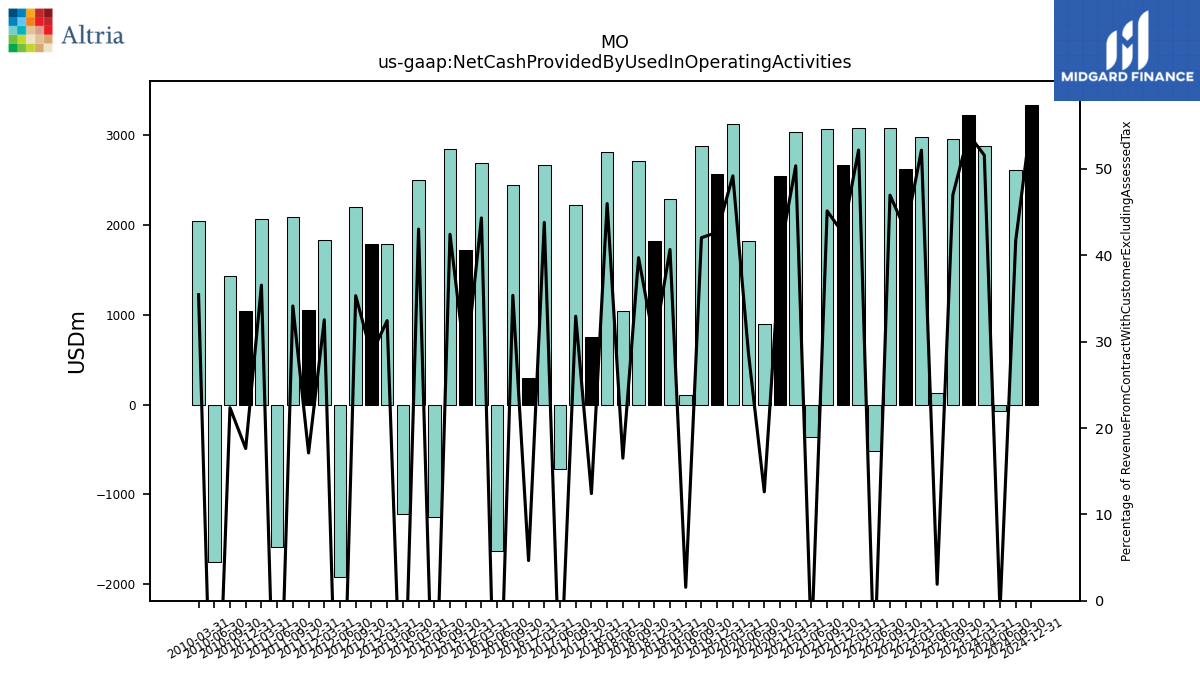
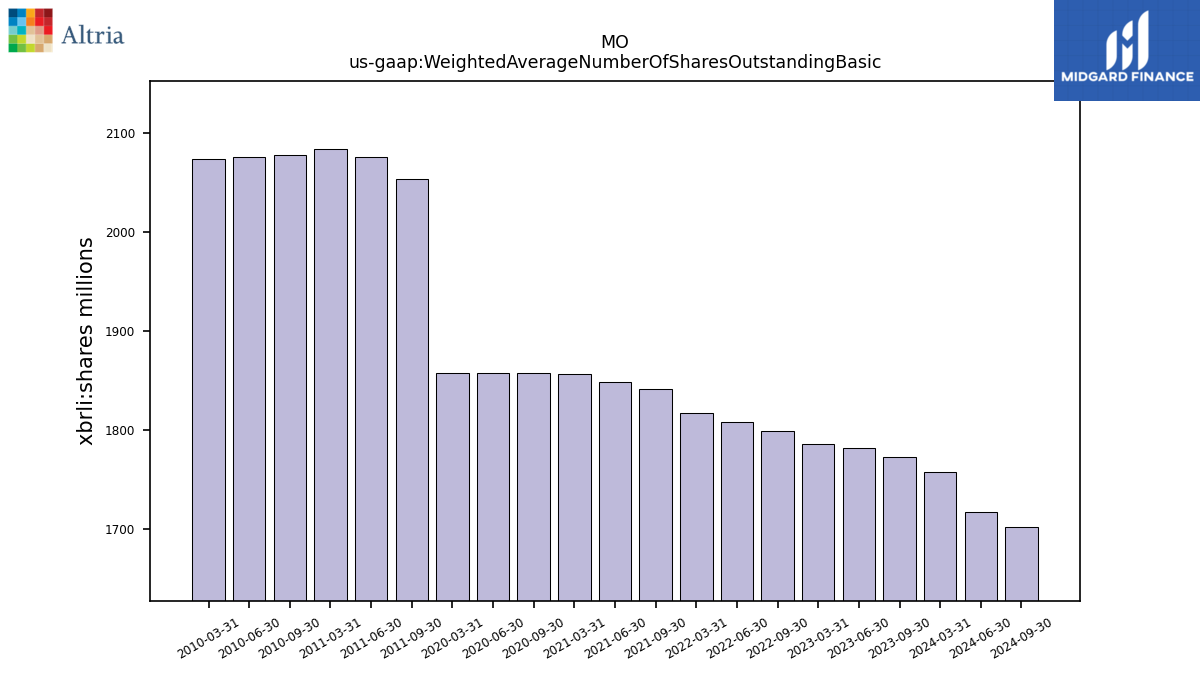
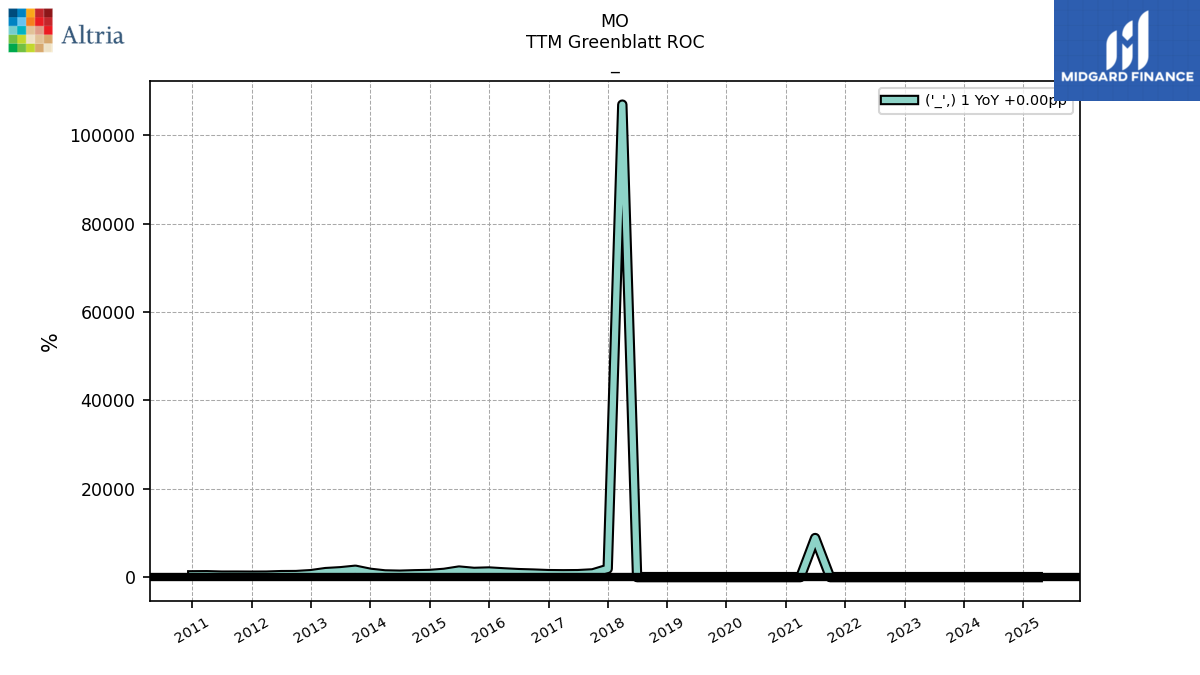
| $MO$ | 2025-02-26 | 2025-04-29 | 2025-04-29 | NA | NA | MO | 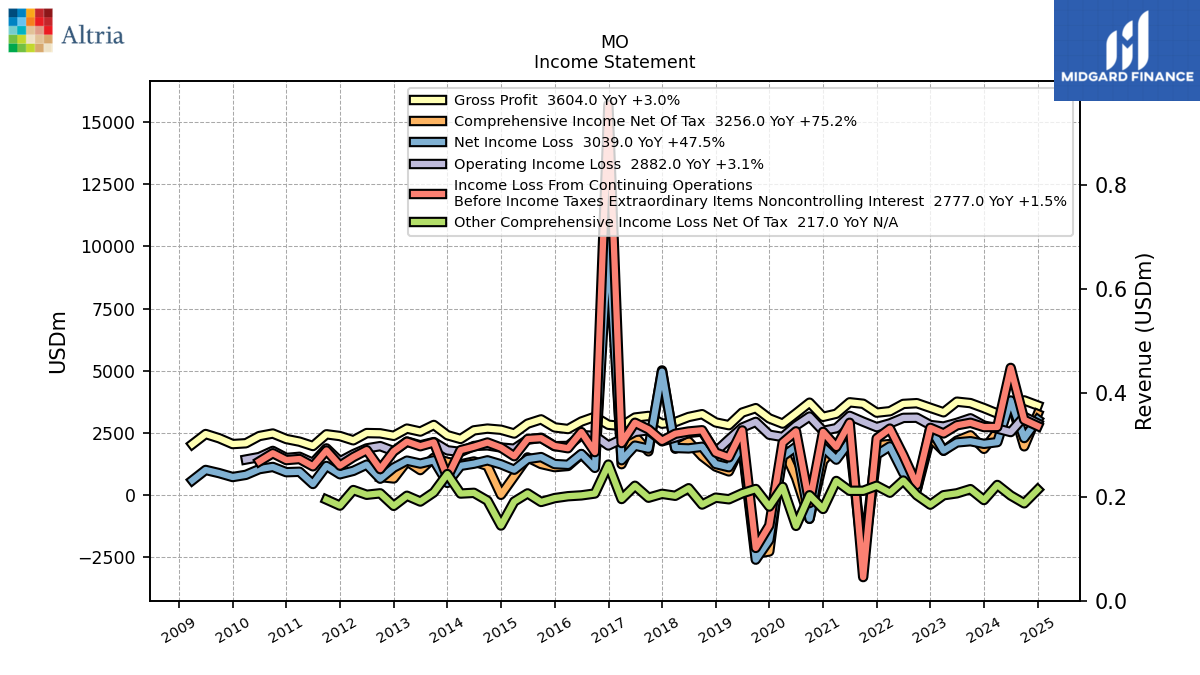 |
 |
 |
MO | 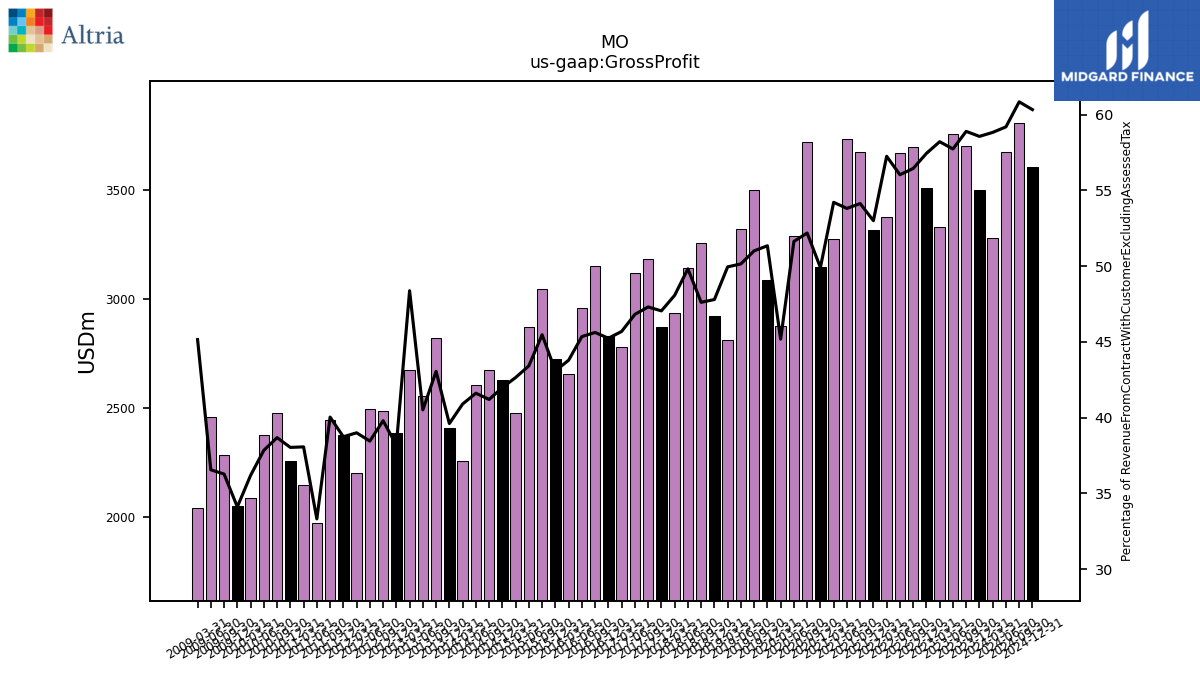 |
 |
 |
MO | 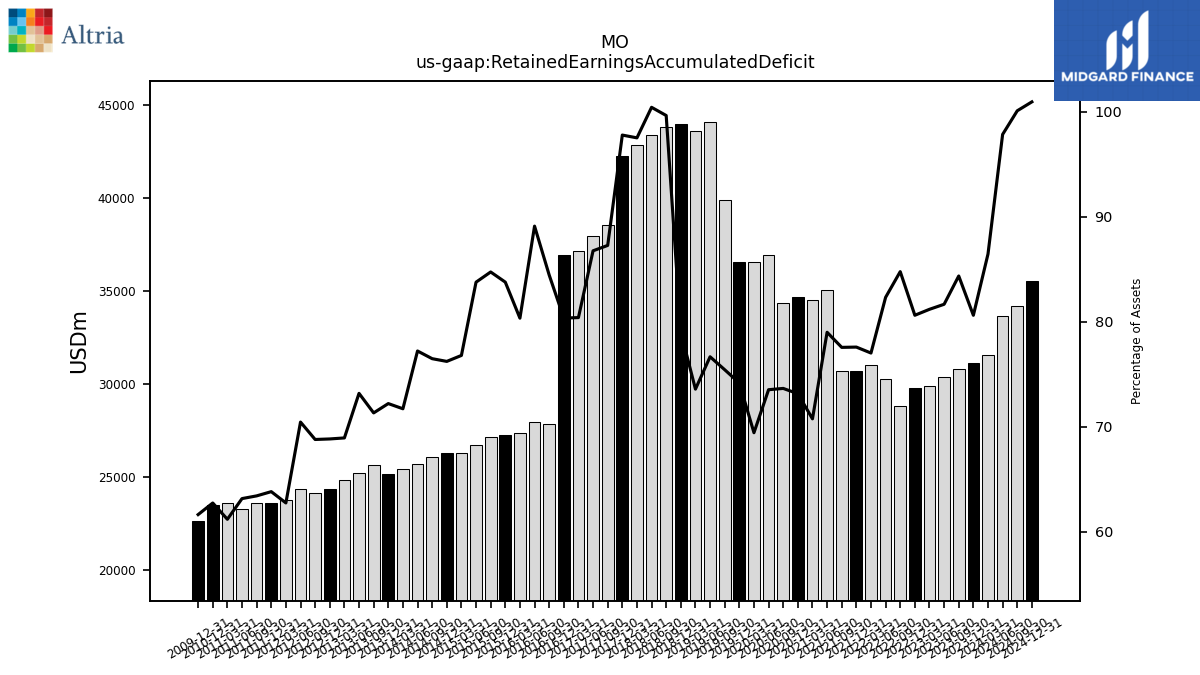 |
 |
MO | 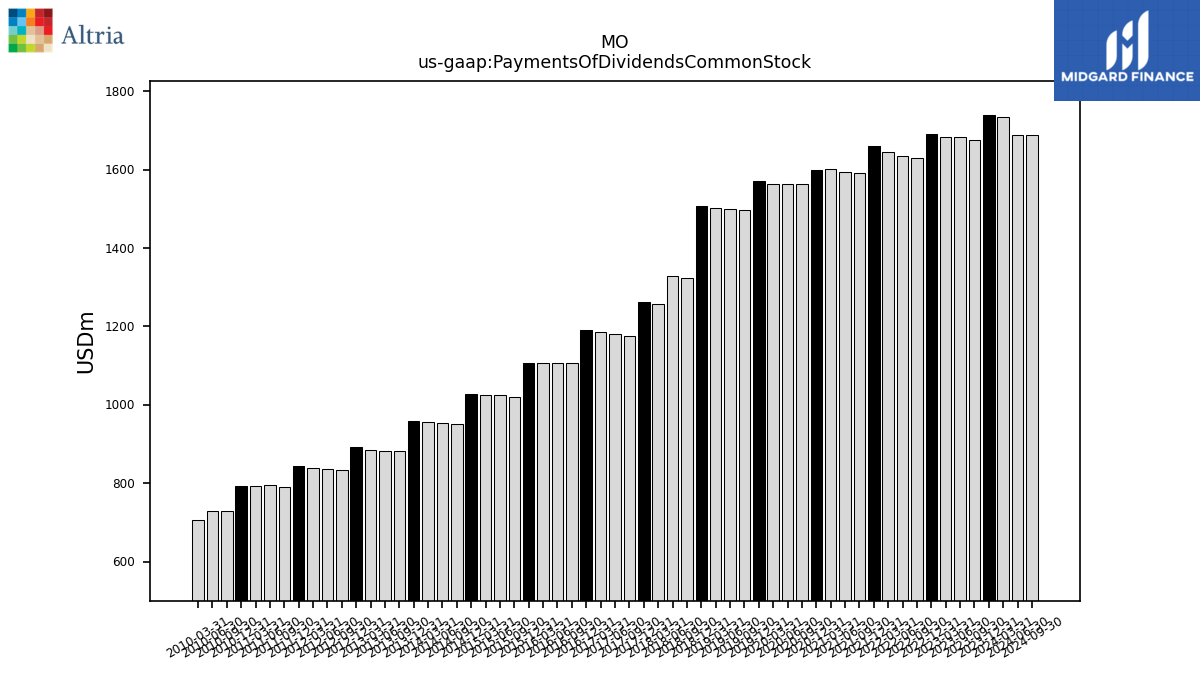 |
 |
 |
MO | ||||
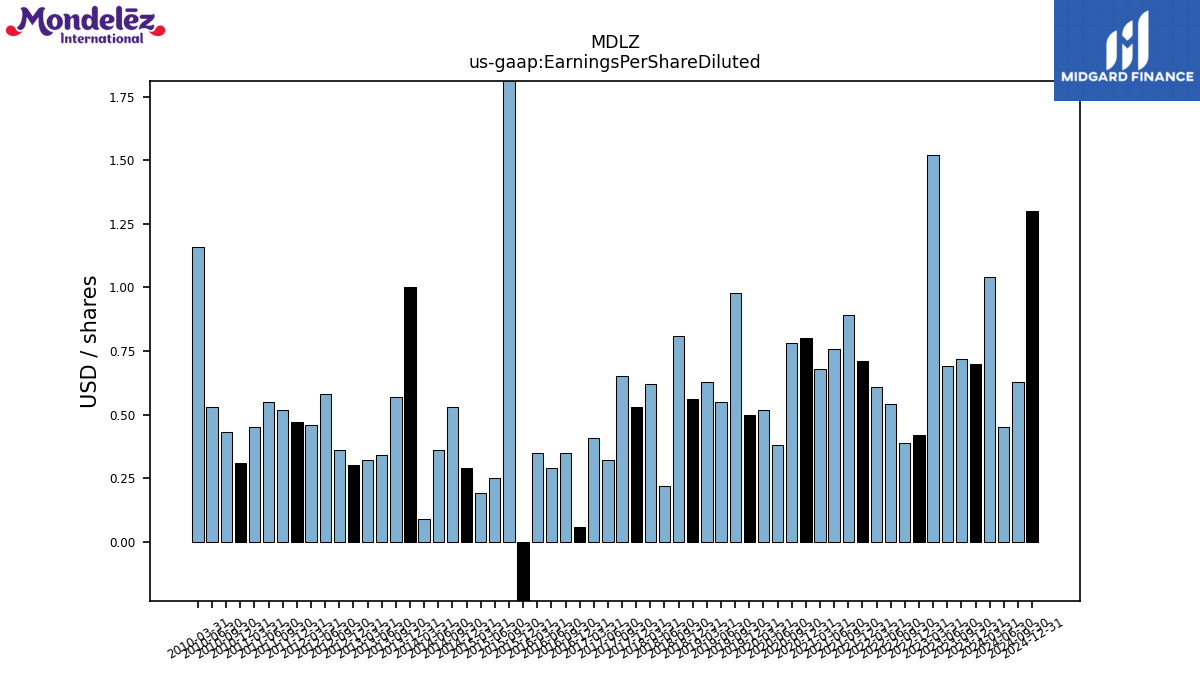
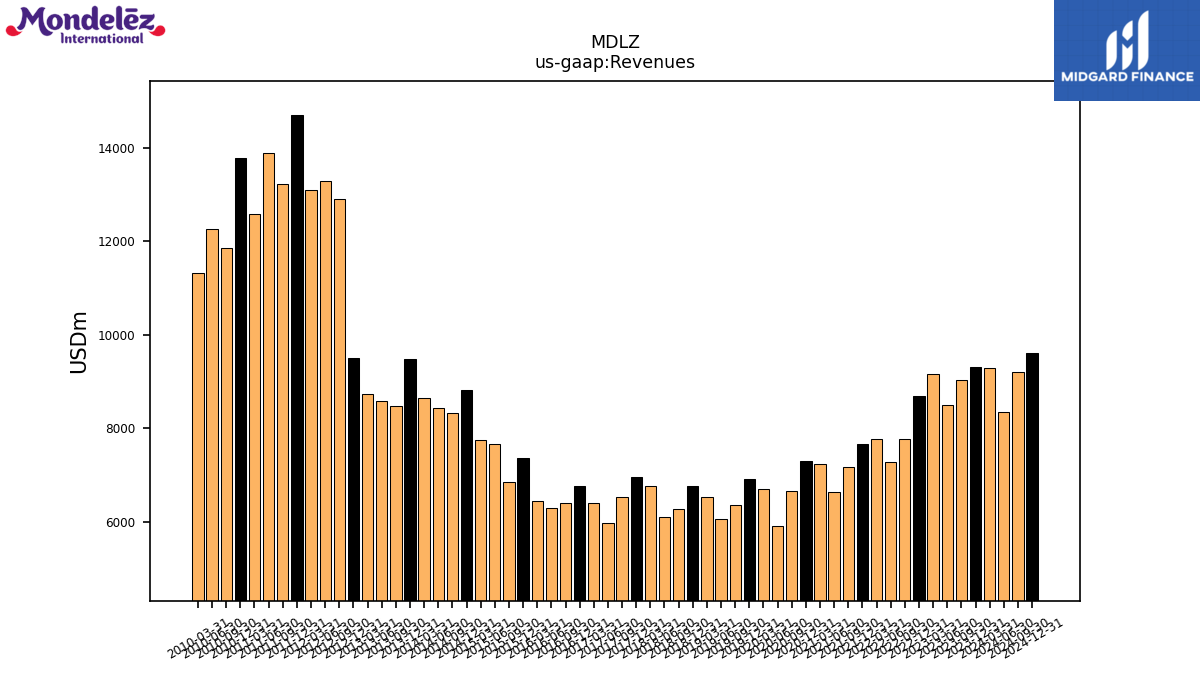
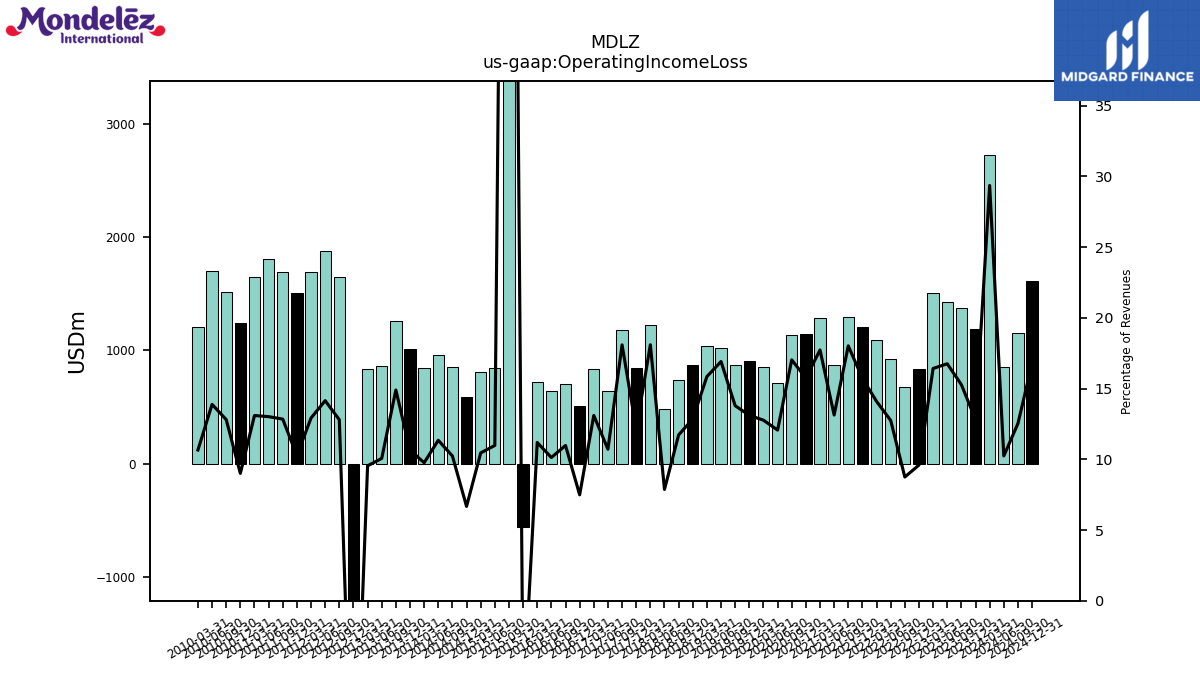
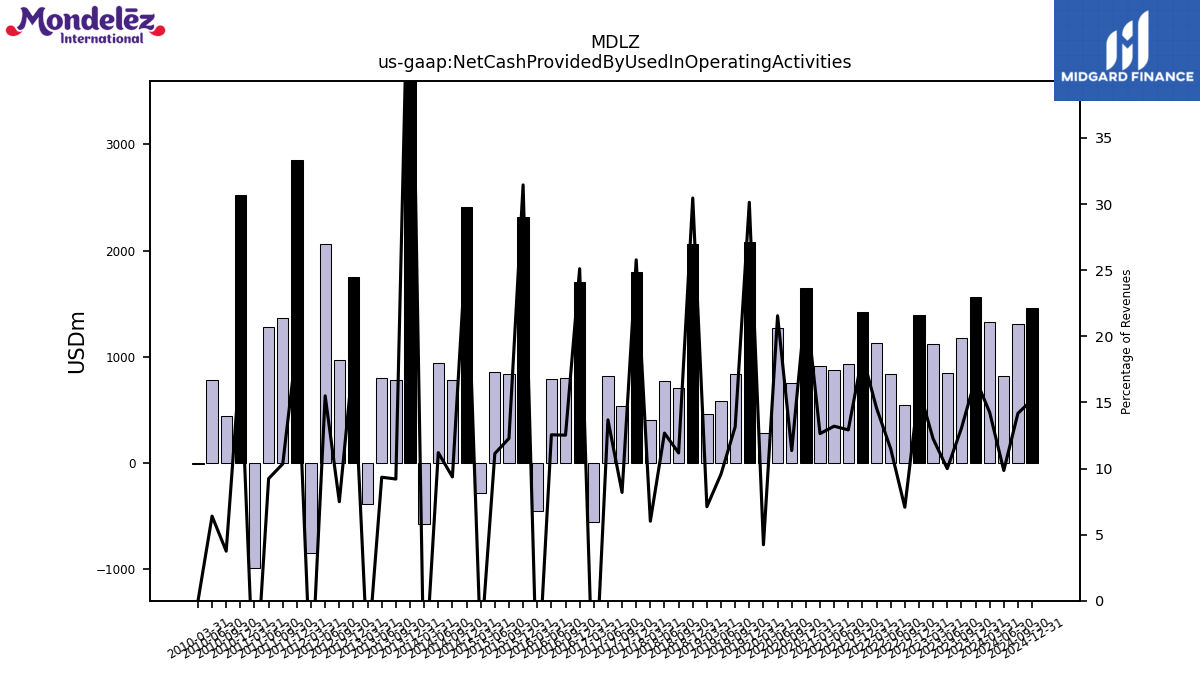
| $MDLZ$ | 2025-02-05 | 2025-04-29 | 2025-04-29 | NA | NA | MDLZ | 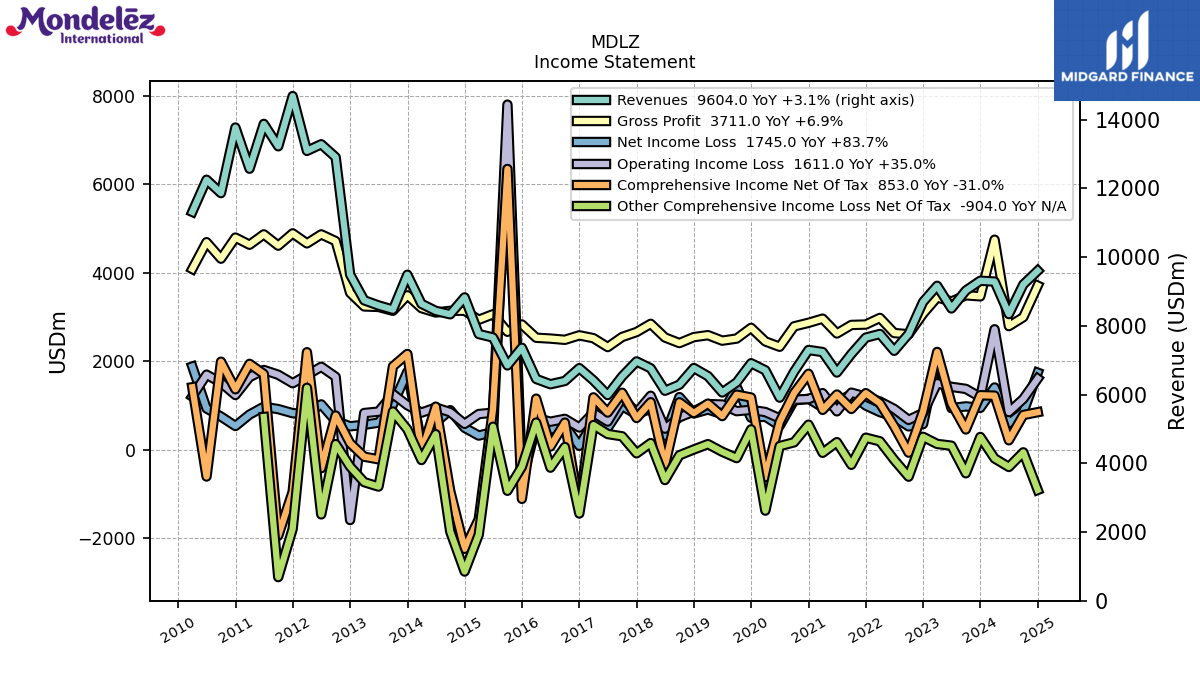 |
 |
 |
MDLZ | 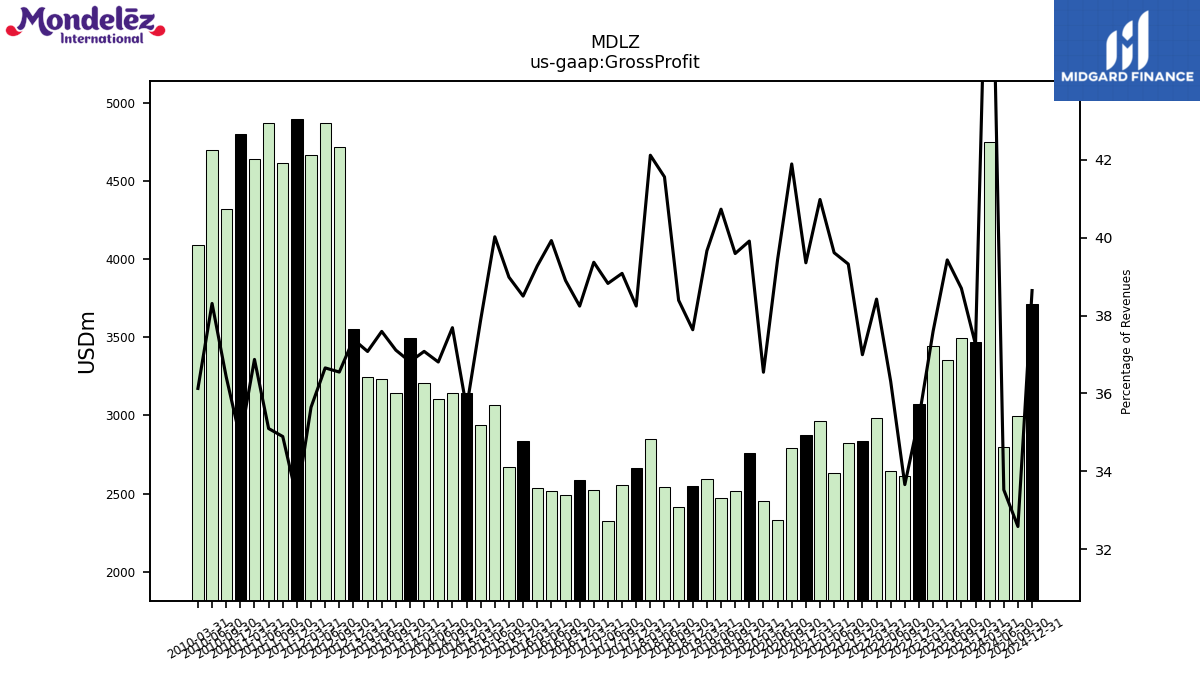 |
 |
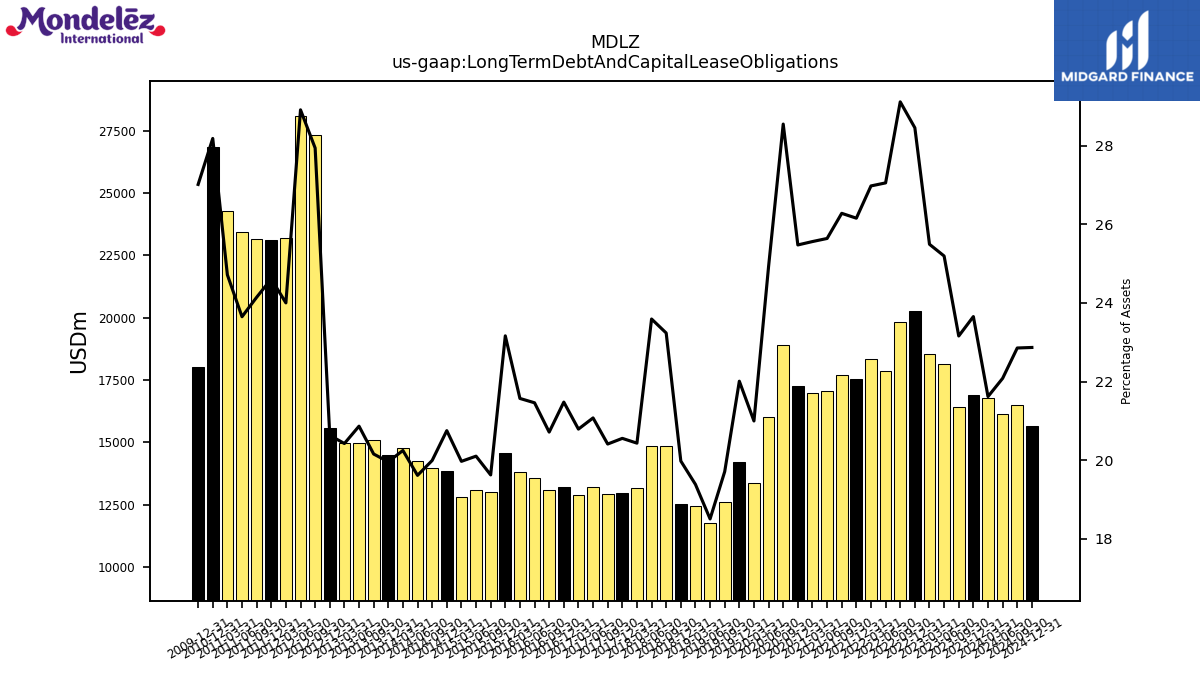 |
MDLZ | 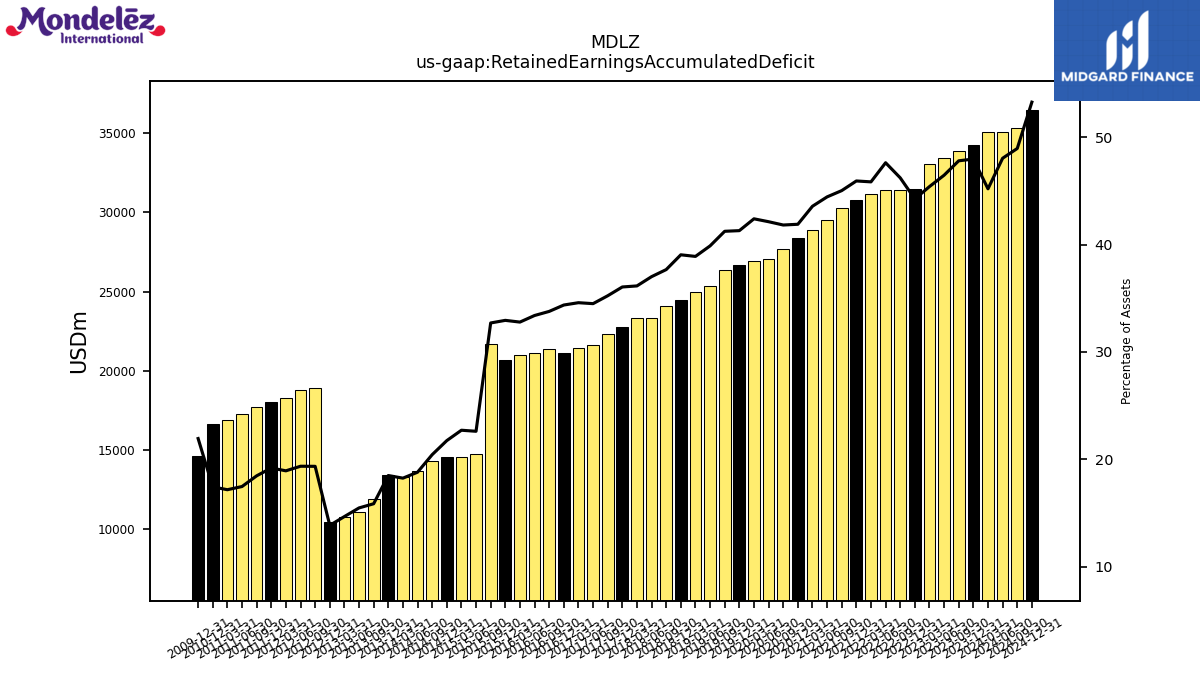 |
 |
MDLZ | 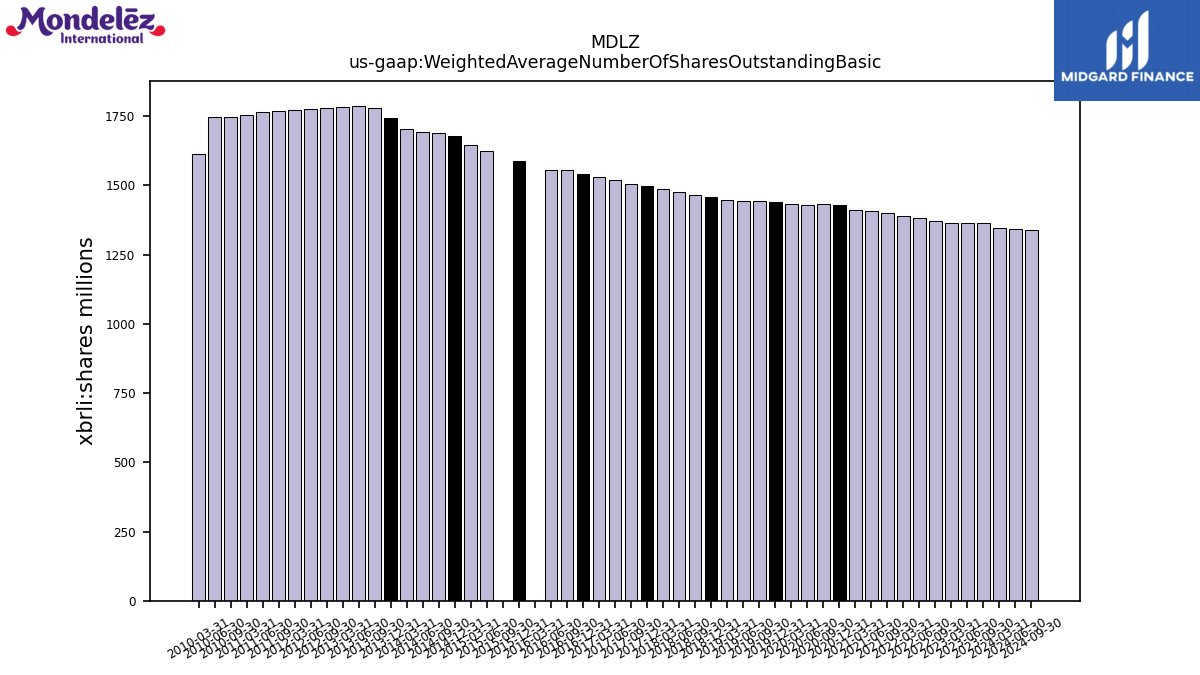 |
MDLZ | ||||||
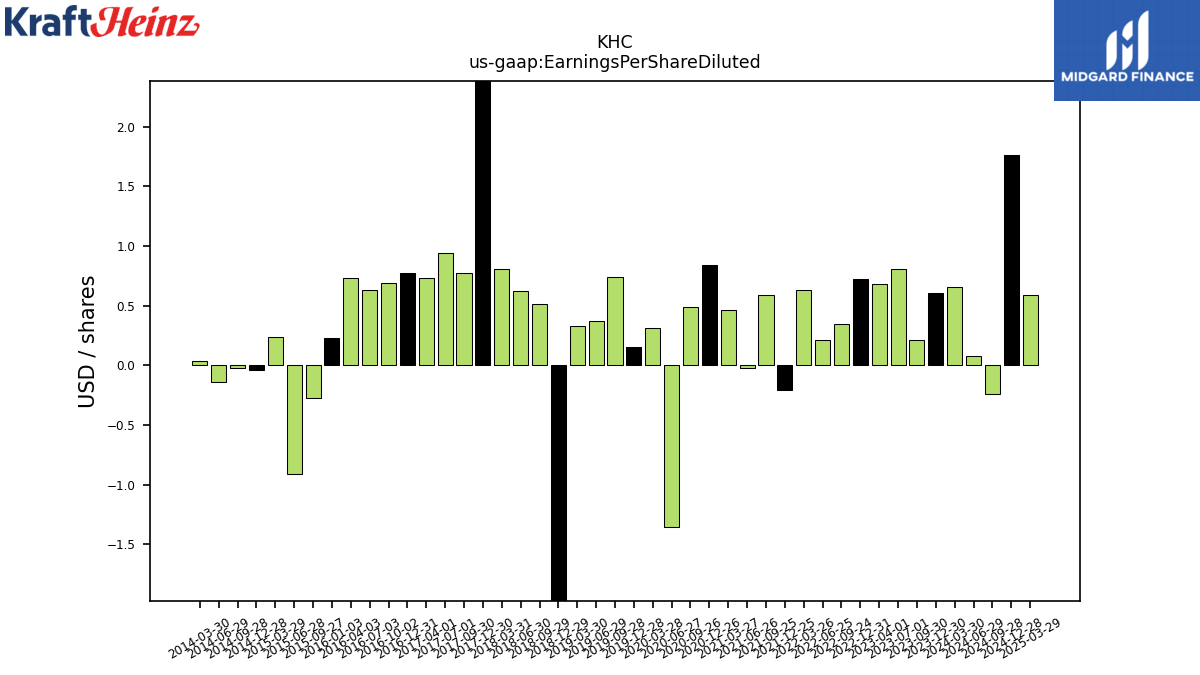
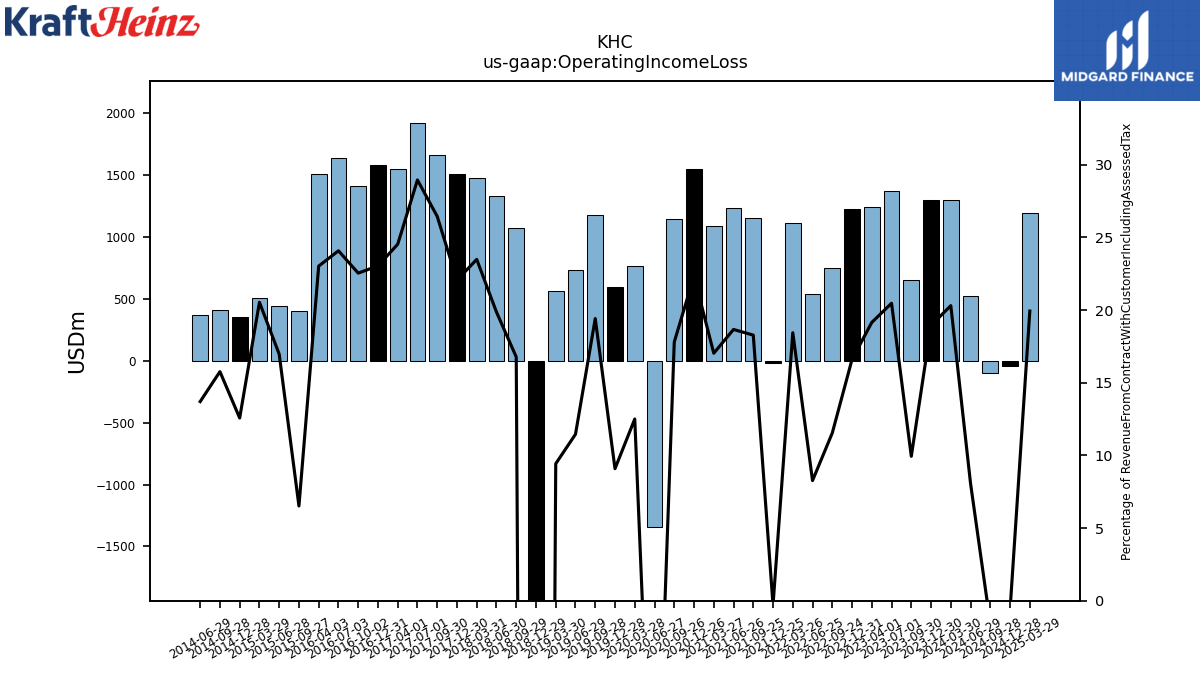
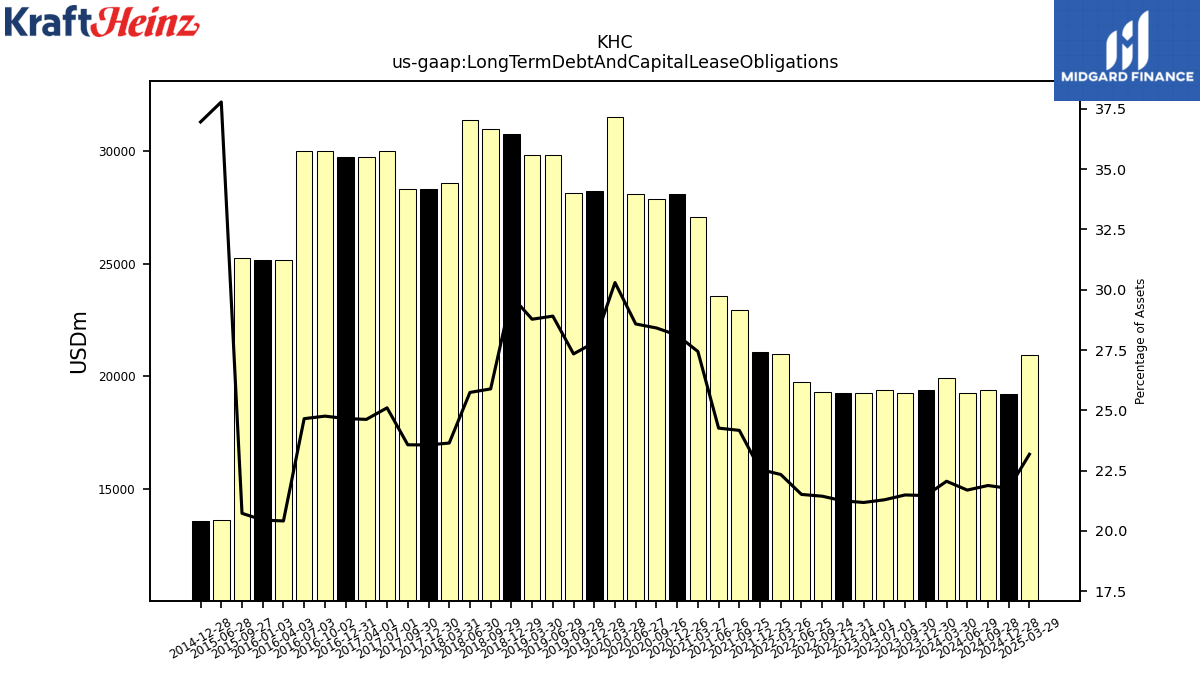
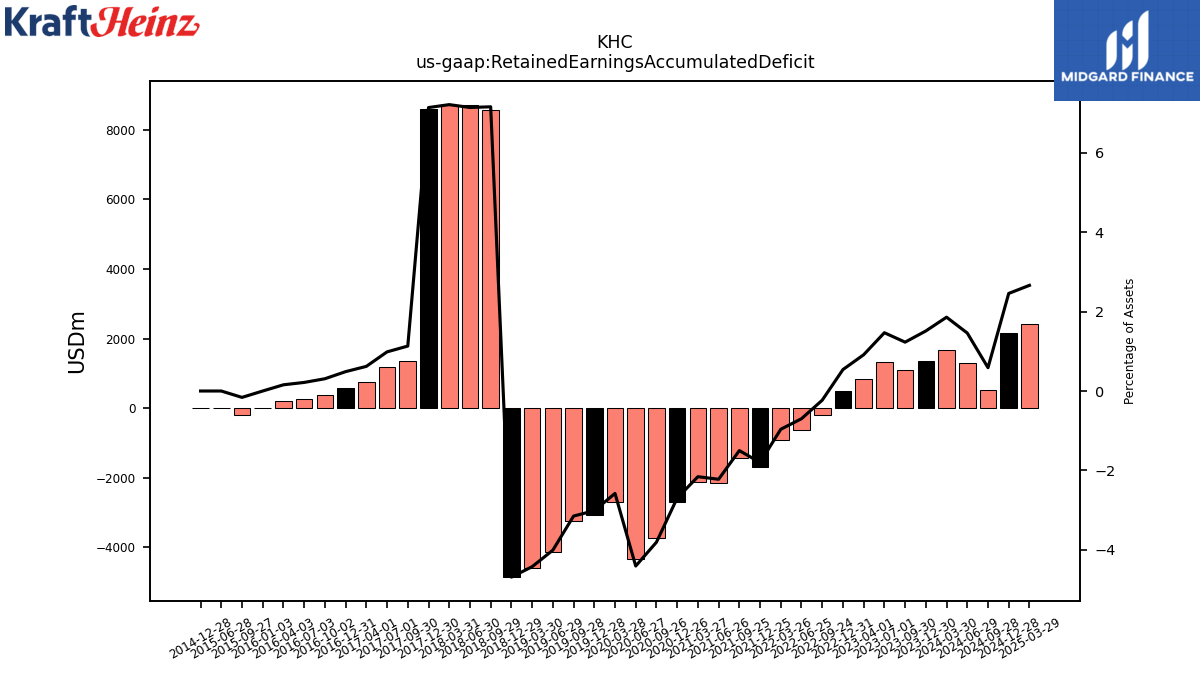
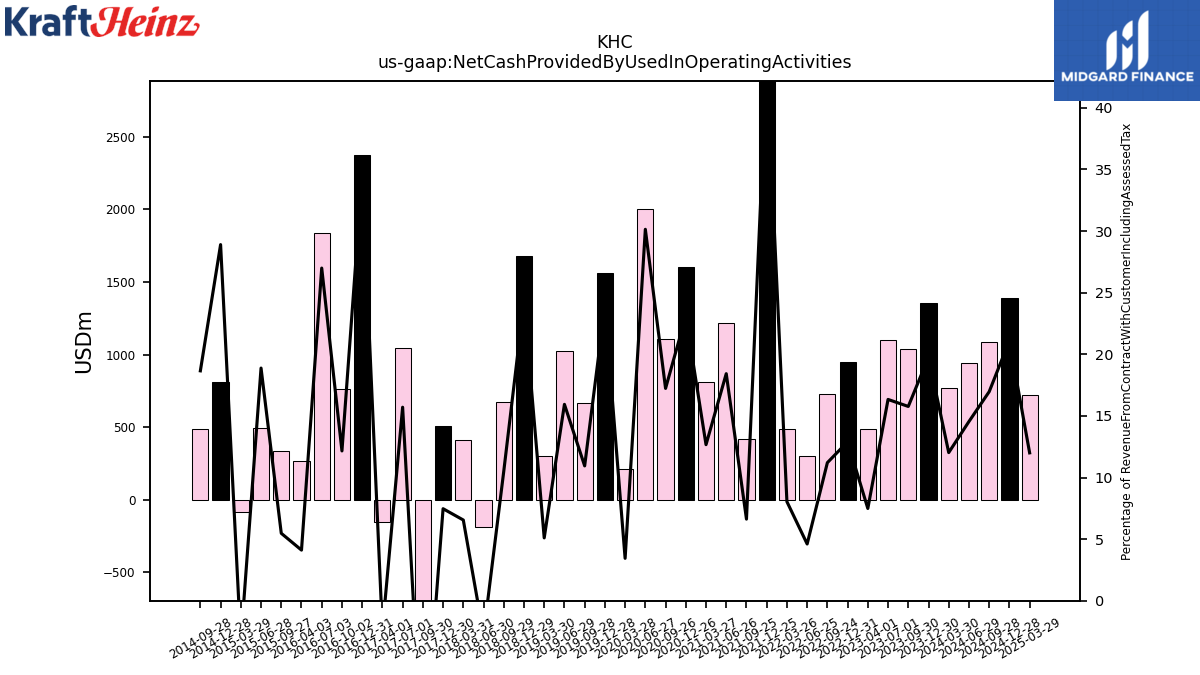
| $KHC$ | 2025-02-13 | 2025-04-29 | 2025-04-29 |  |
NA | NA | KHC | 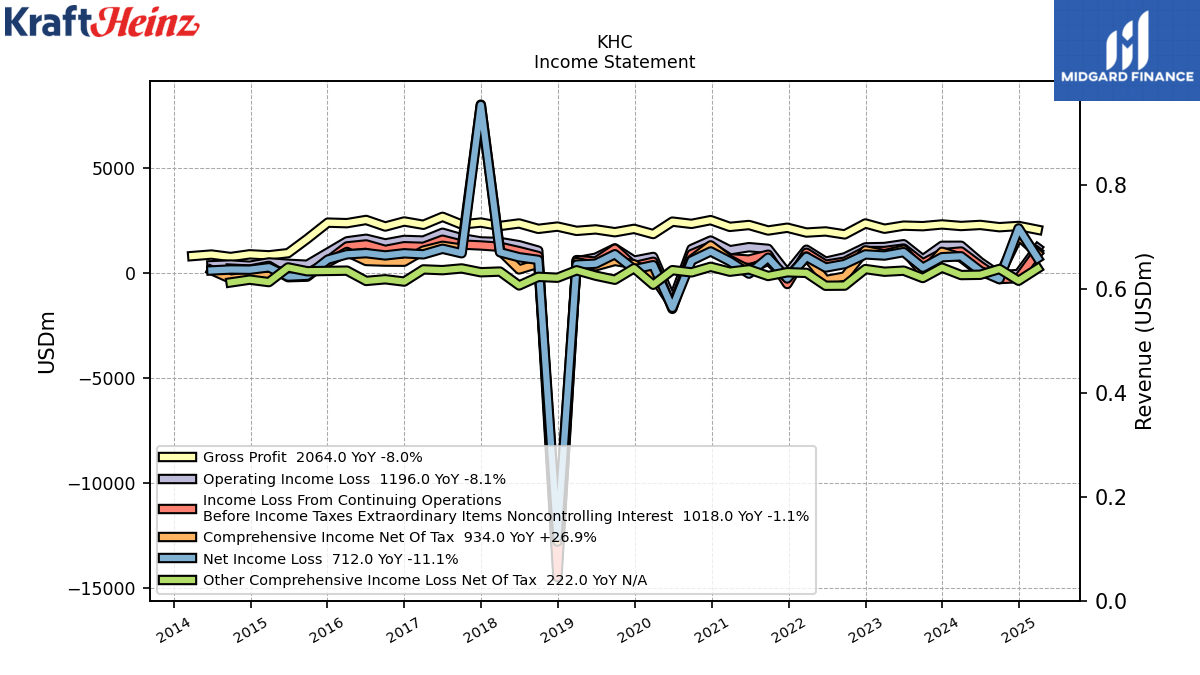 |
 |
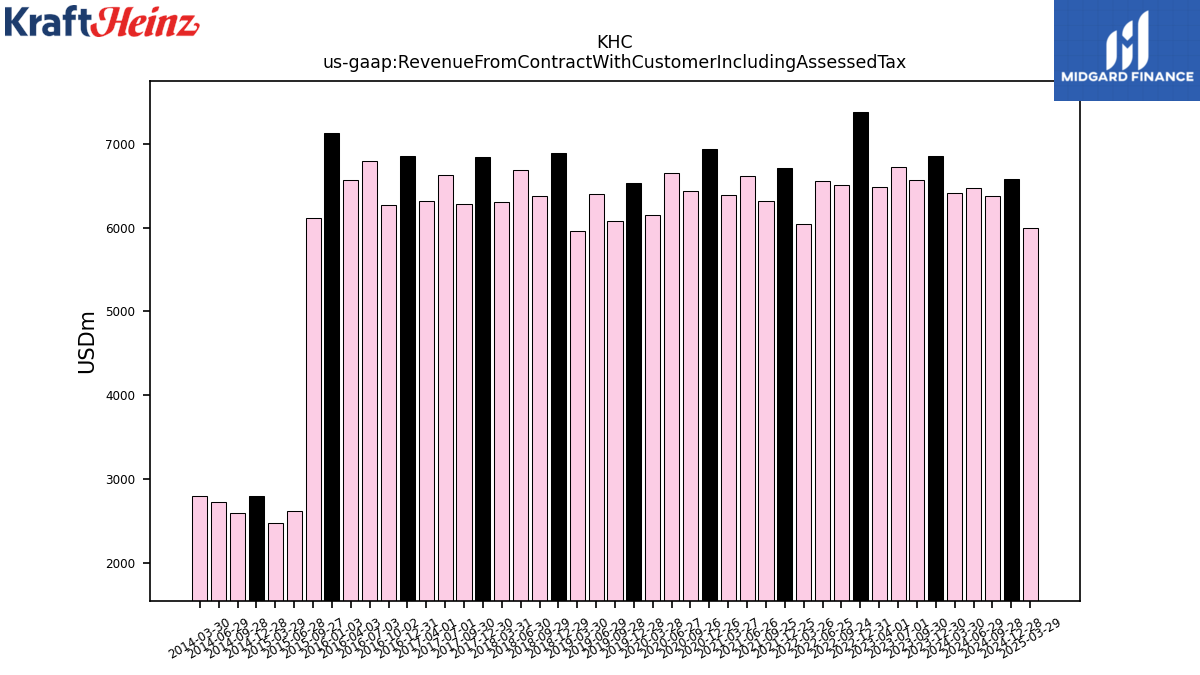 |
KHC | 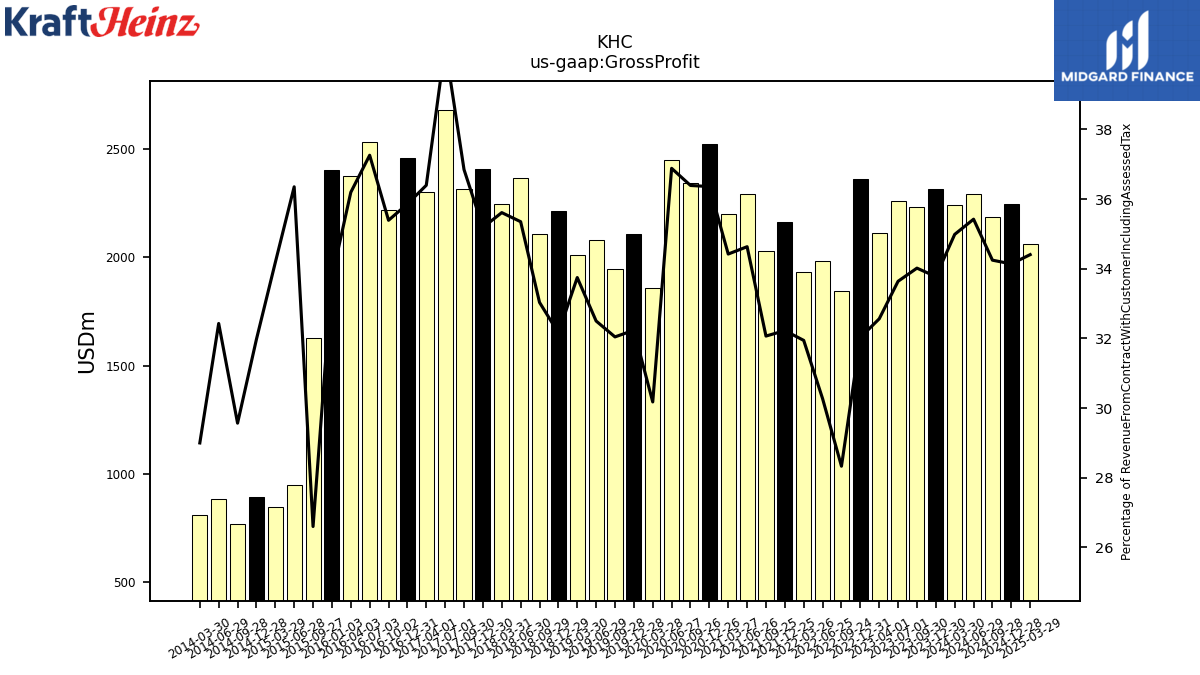 |
 |
 |
KHC | 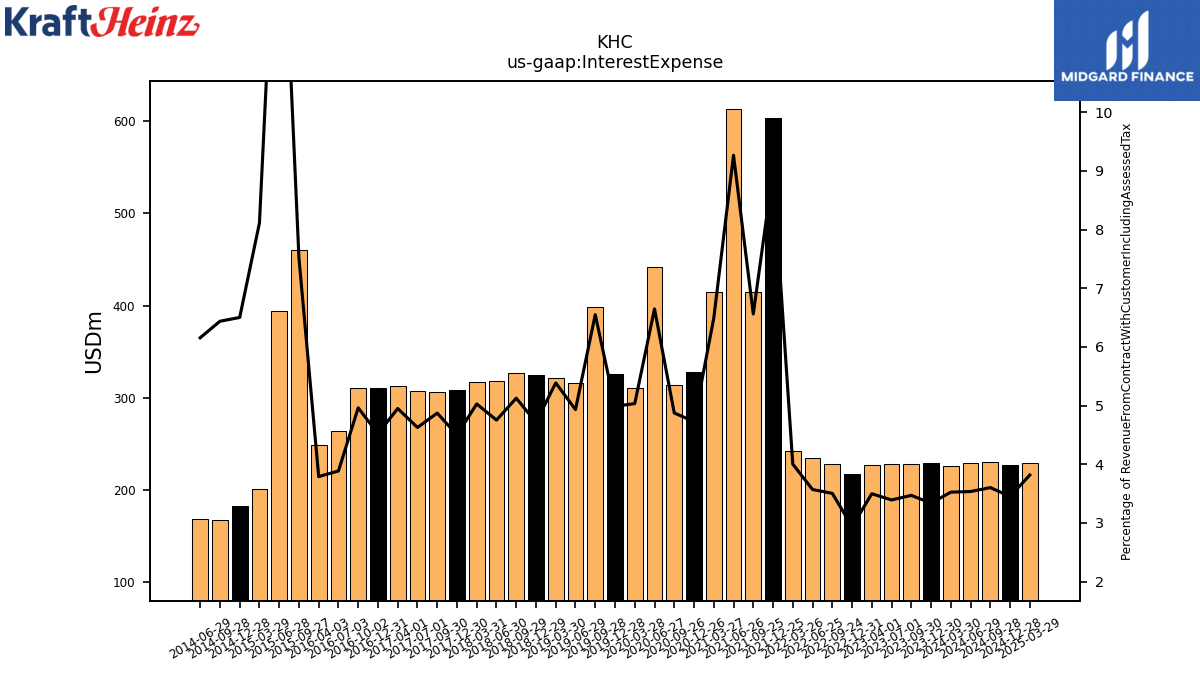 |
 |
 |
KHC | 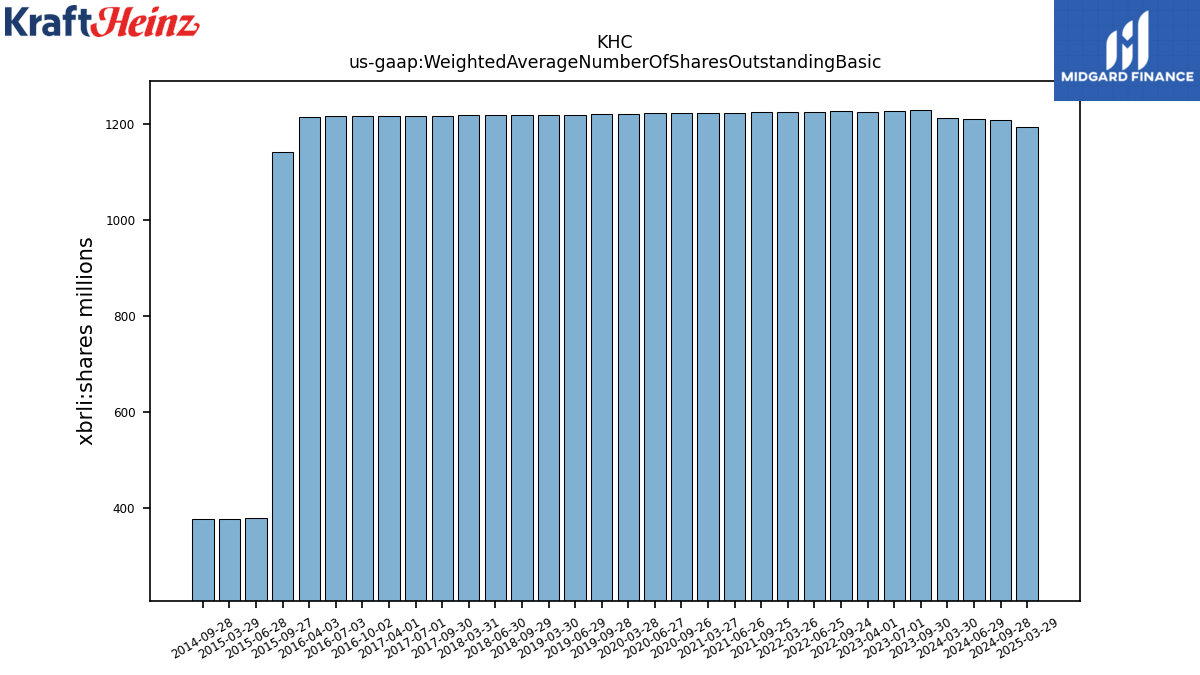 |
KHC | ||||
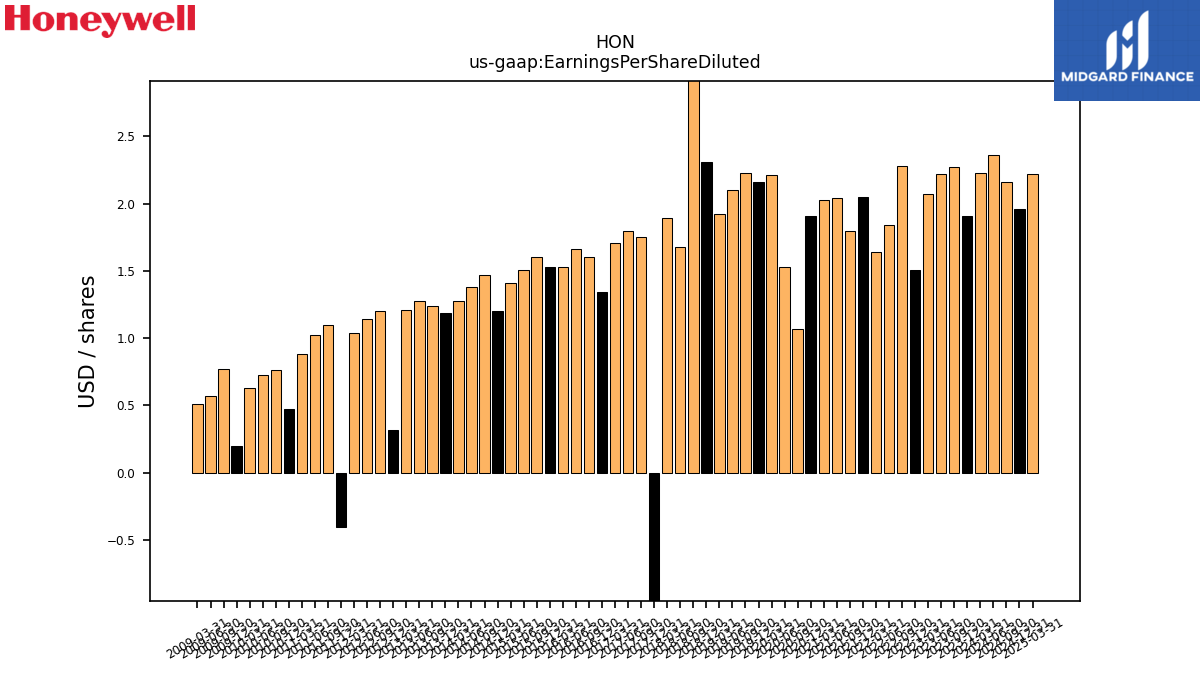
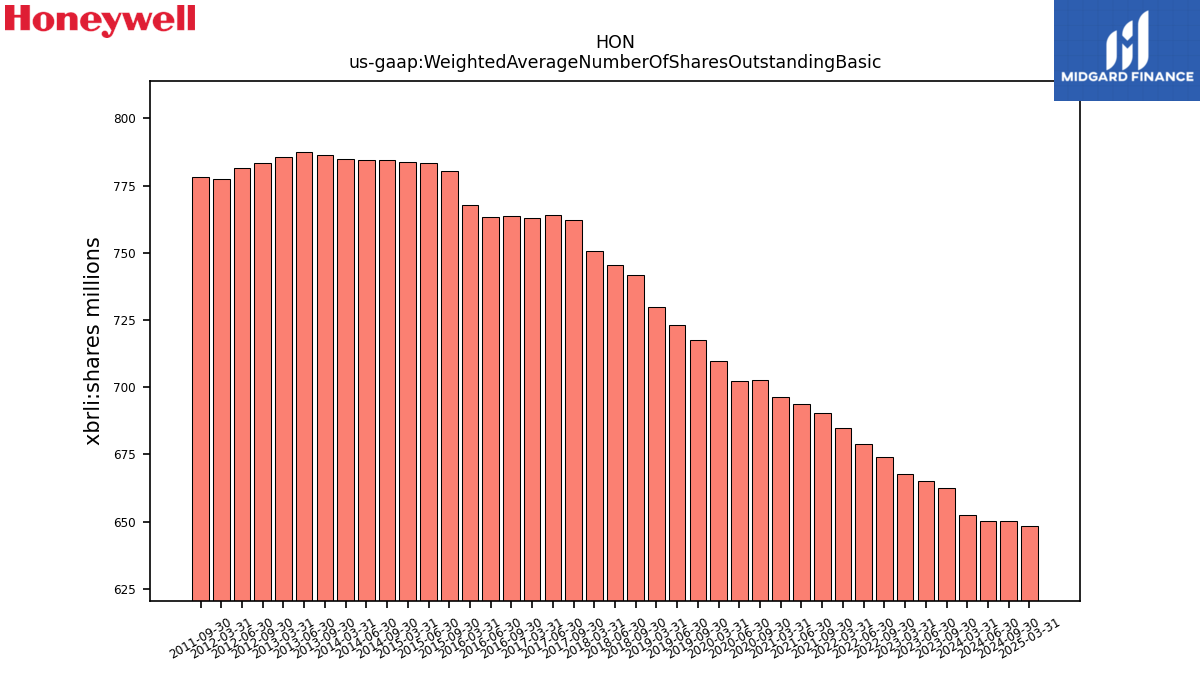
| $HON$ | 2025-02-14 | 2025-04-29 | 2025-04-29 | NA | NA | HON | 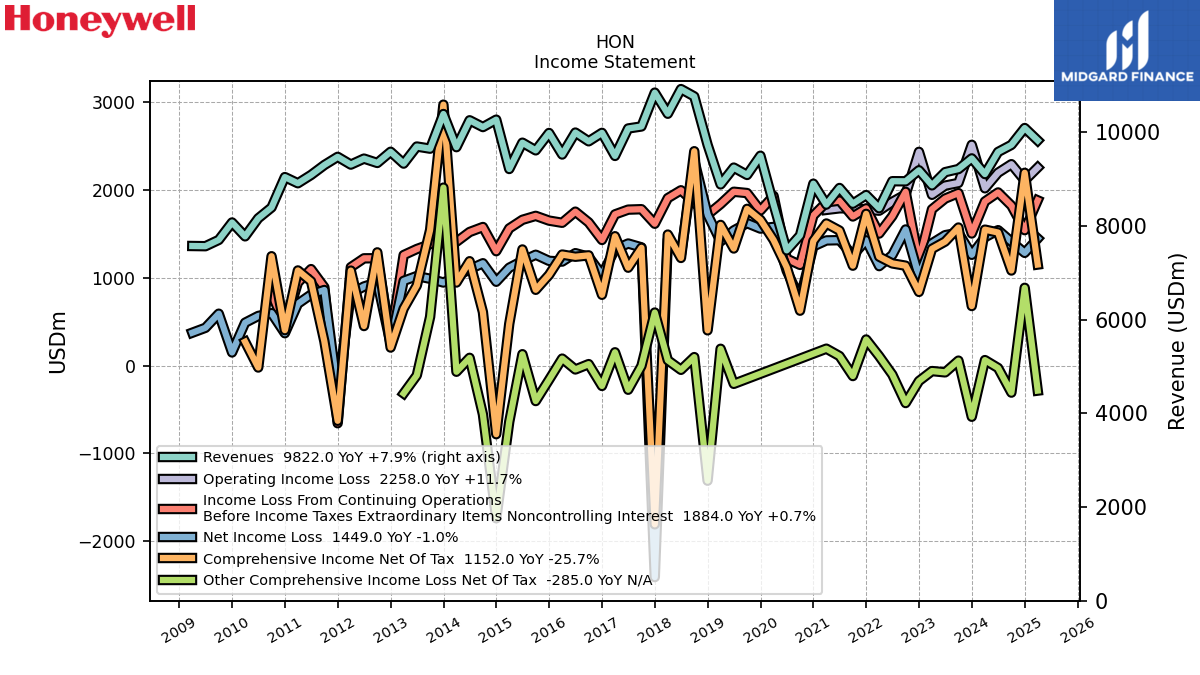 |
 |
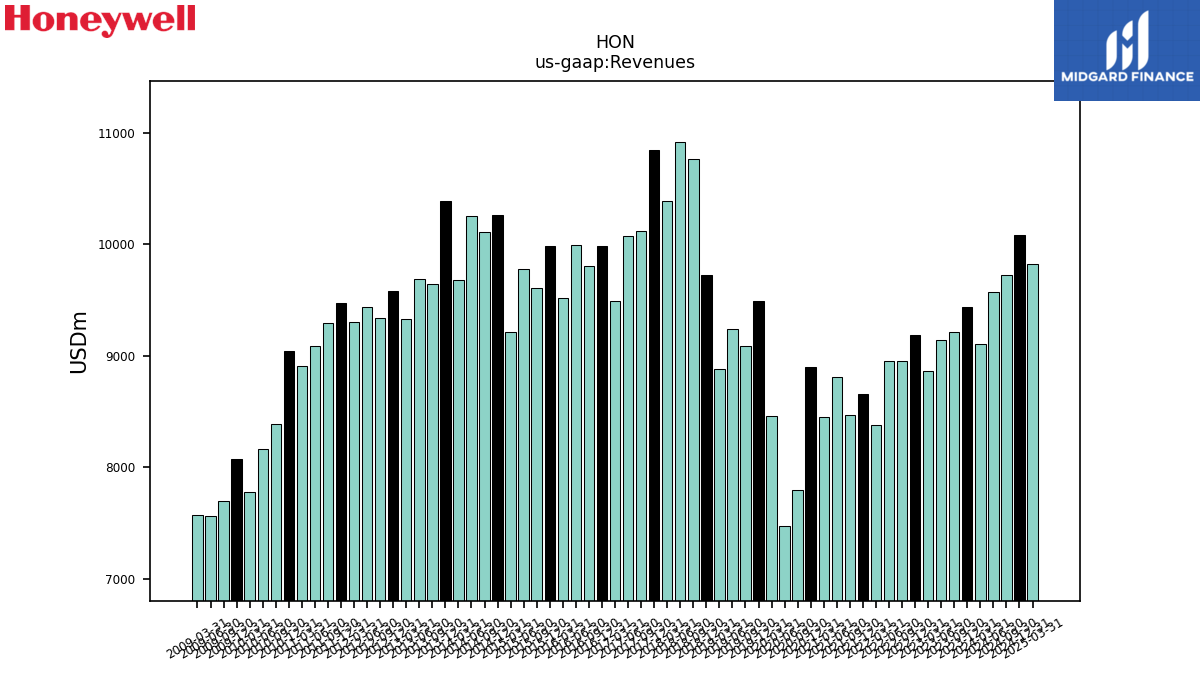 |
HON | 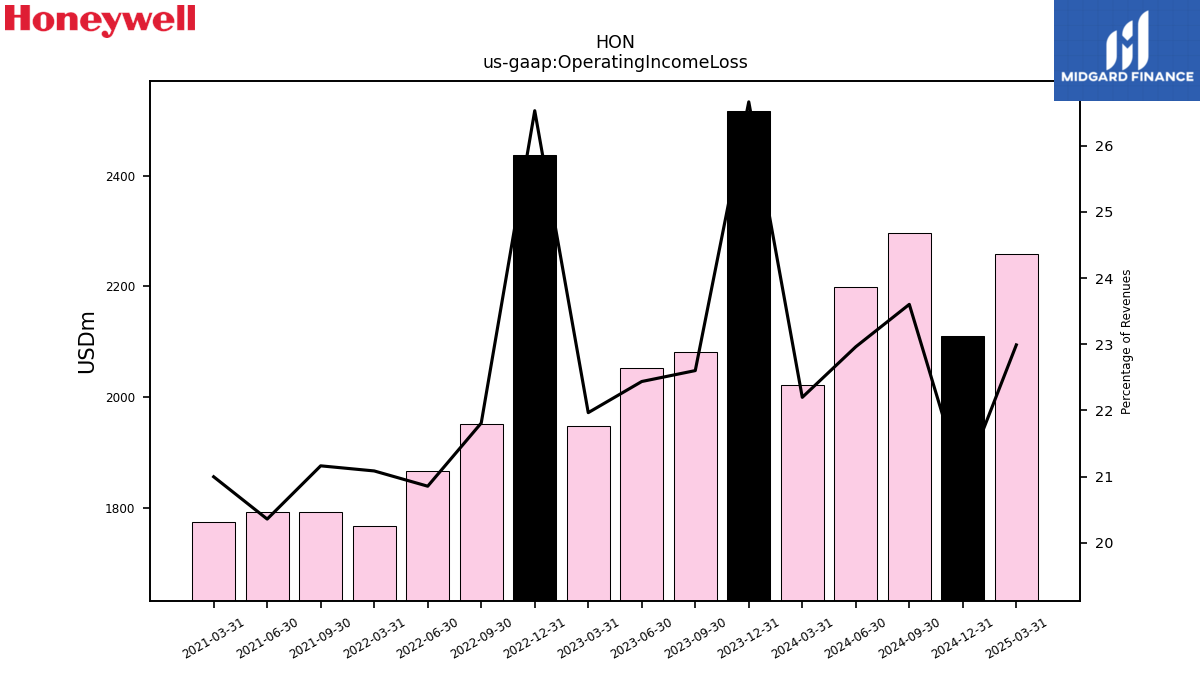 |
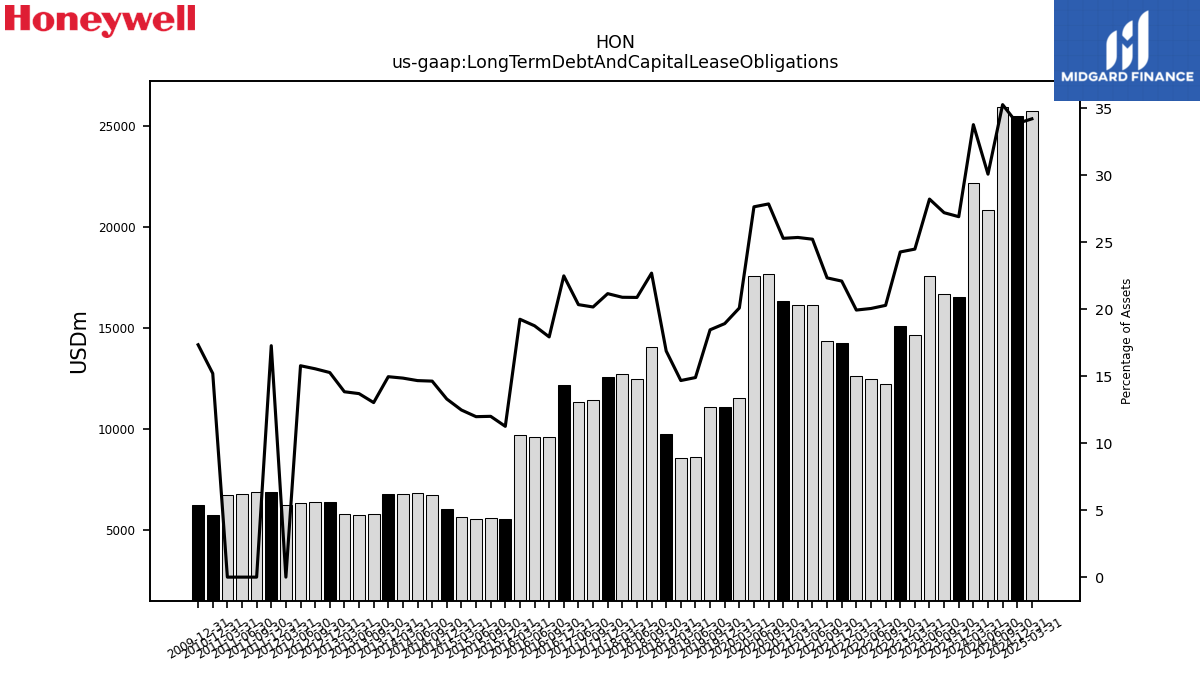 |
HON | 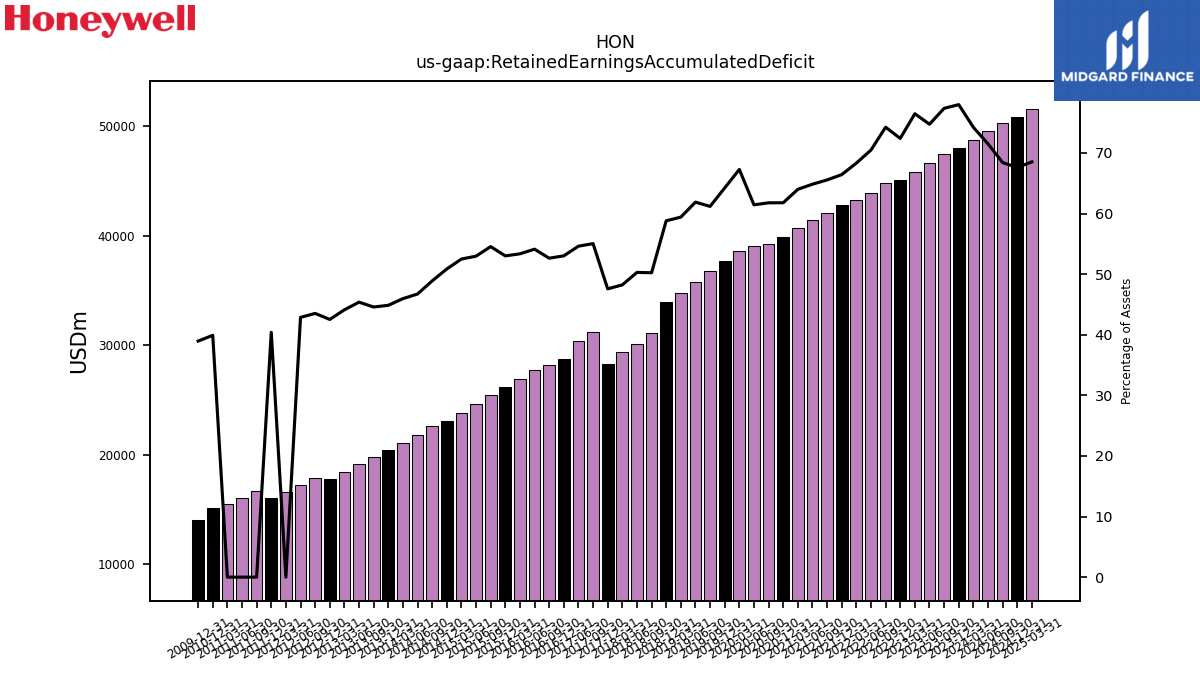 |
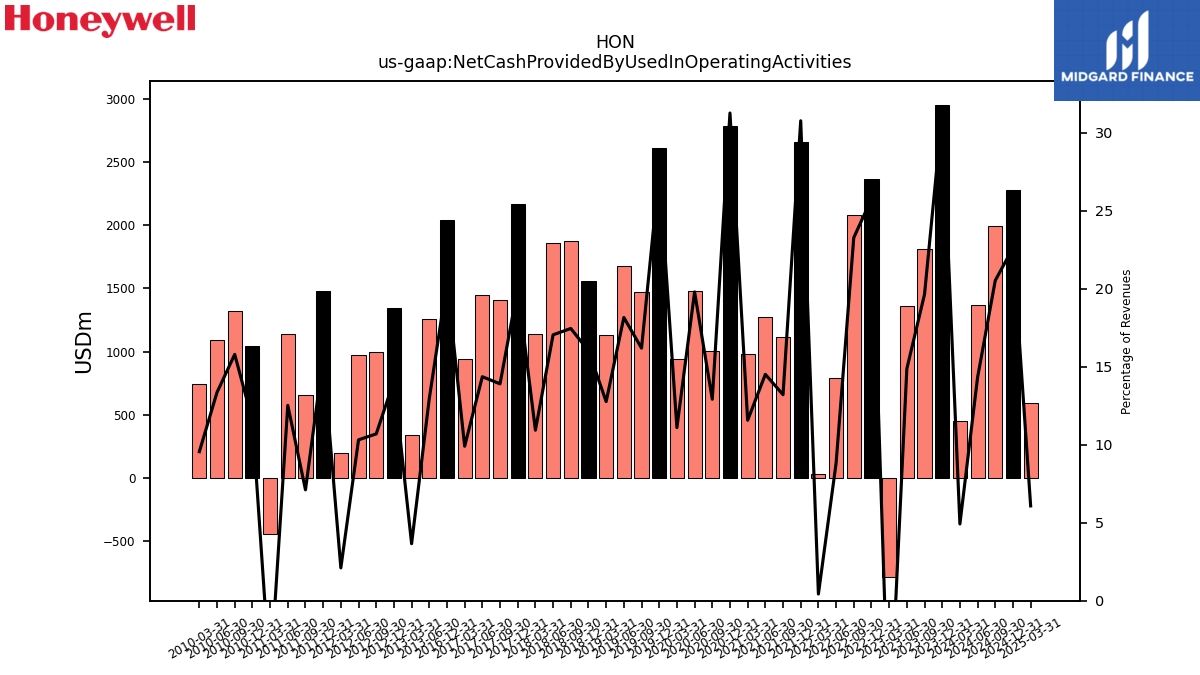 |
HON | 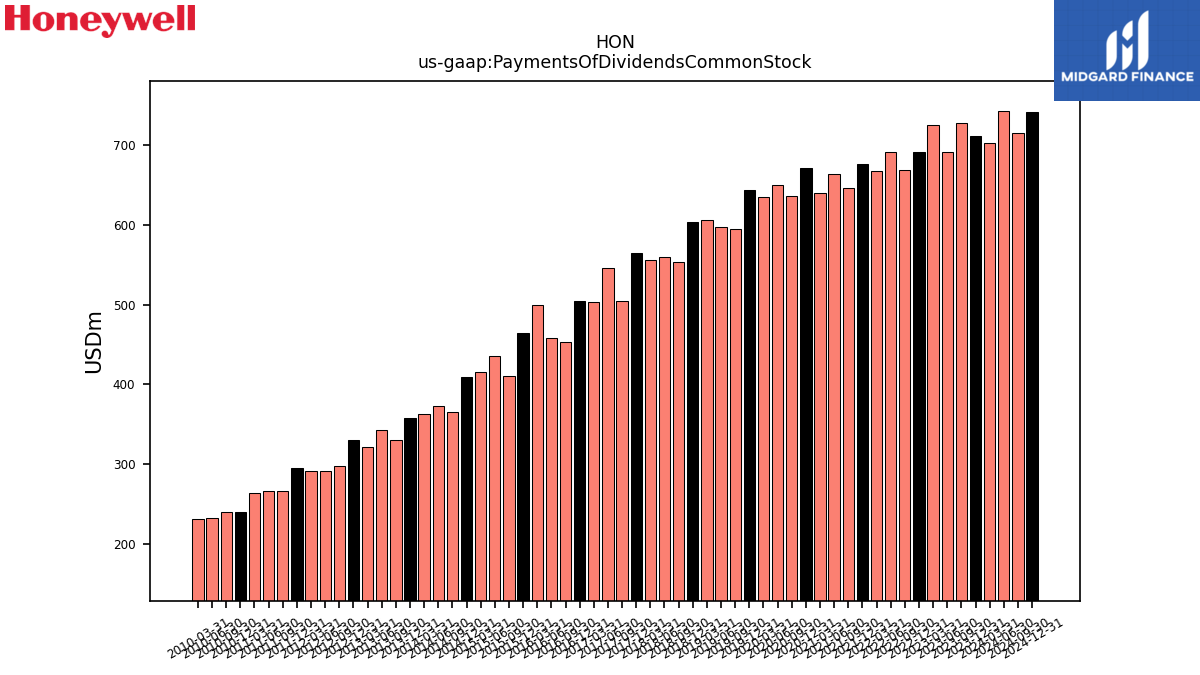 |
 |
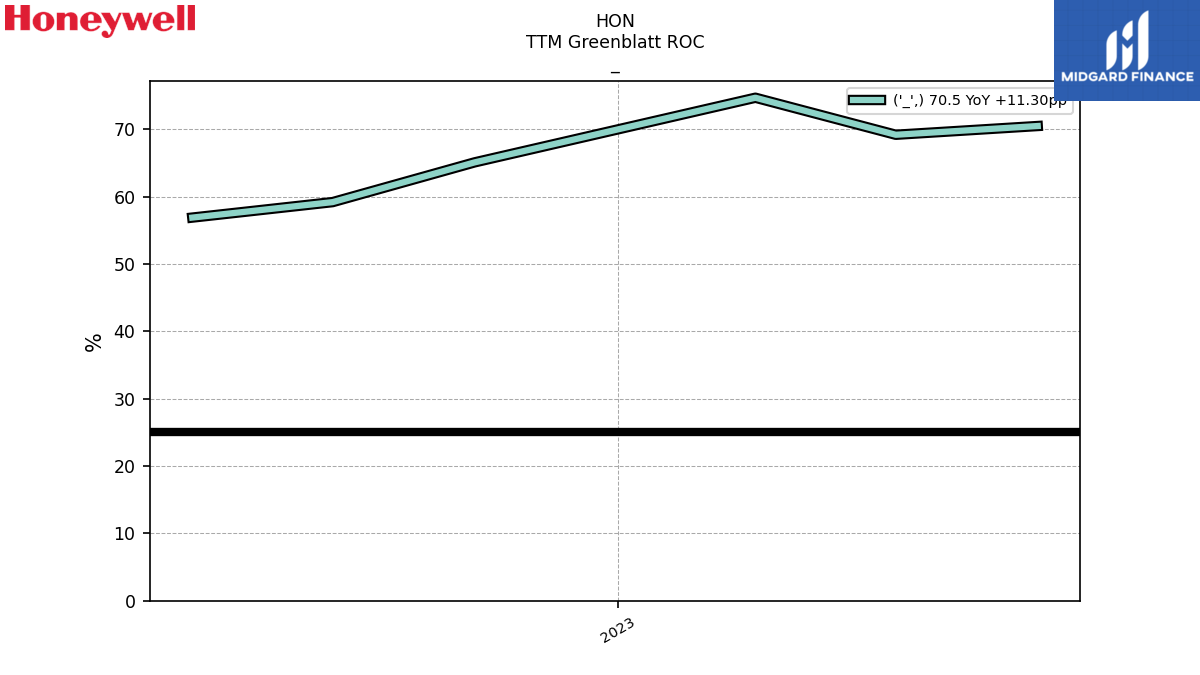 |
HON | |||||
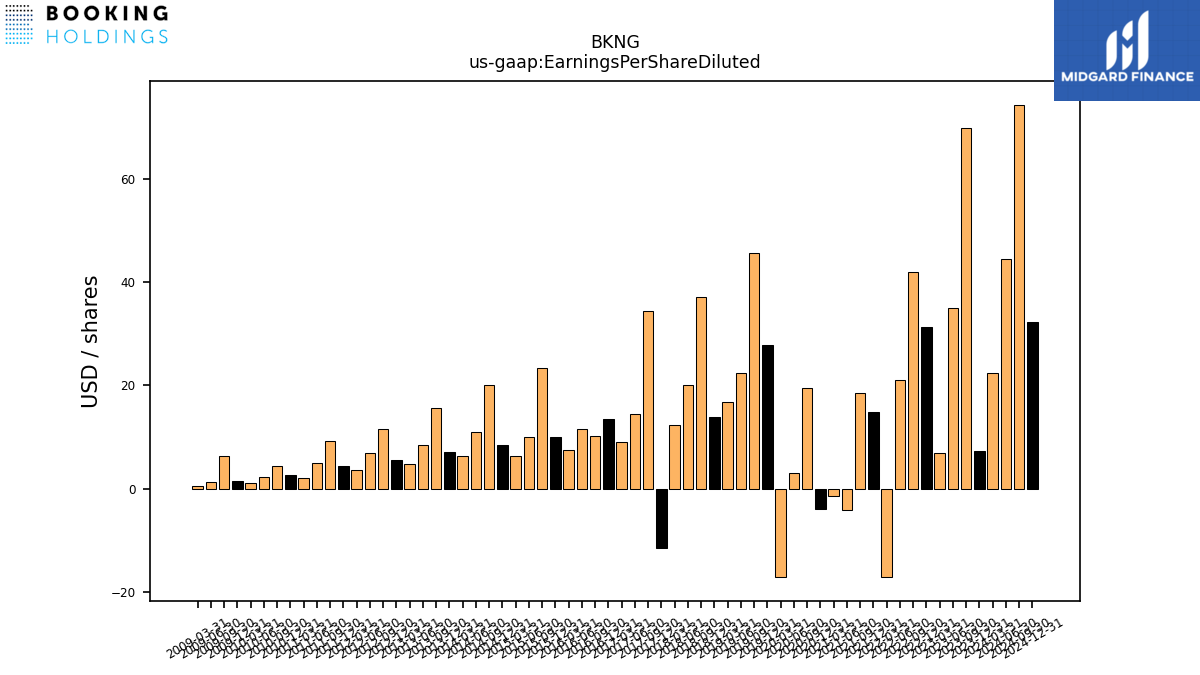
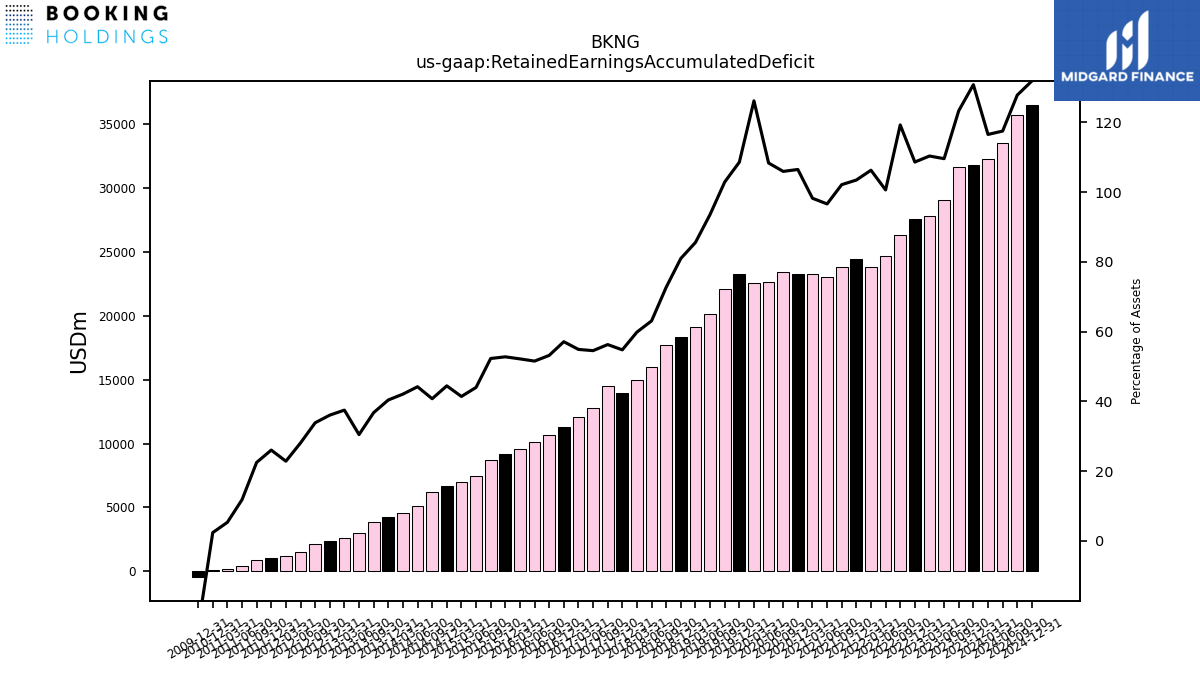
| $BKNG$ | 2025-02-20 | 2025-04-29 | 2025-04-29 | NA | NA | BKNG | 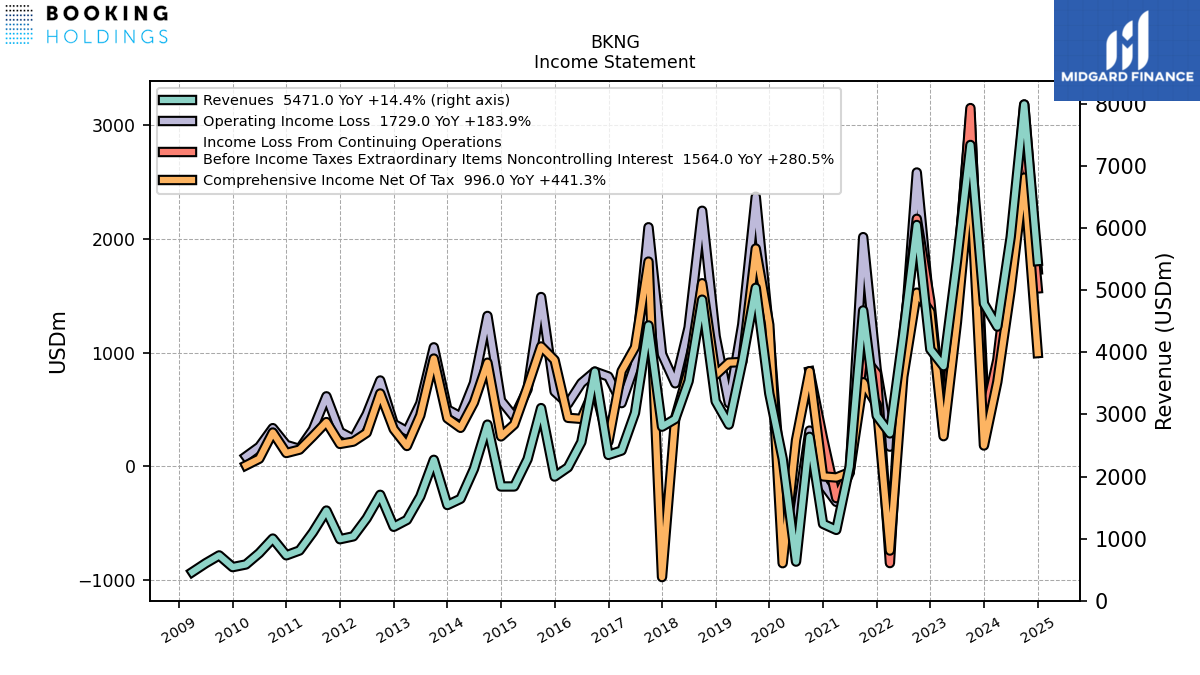 |
 |
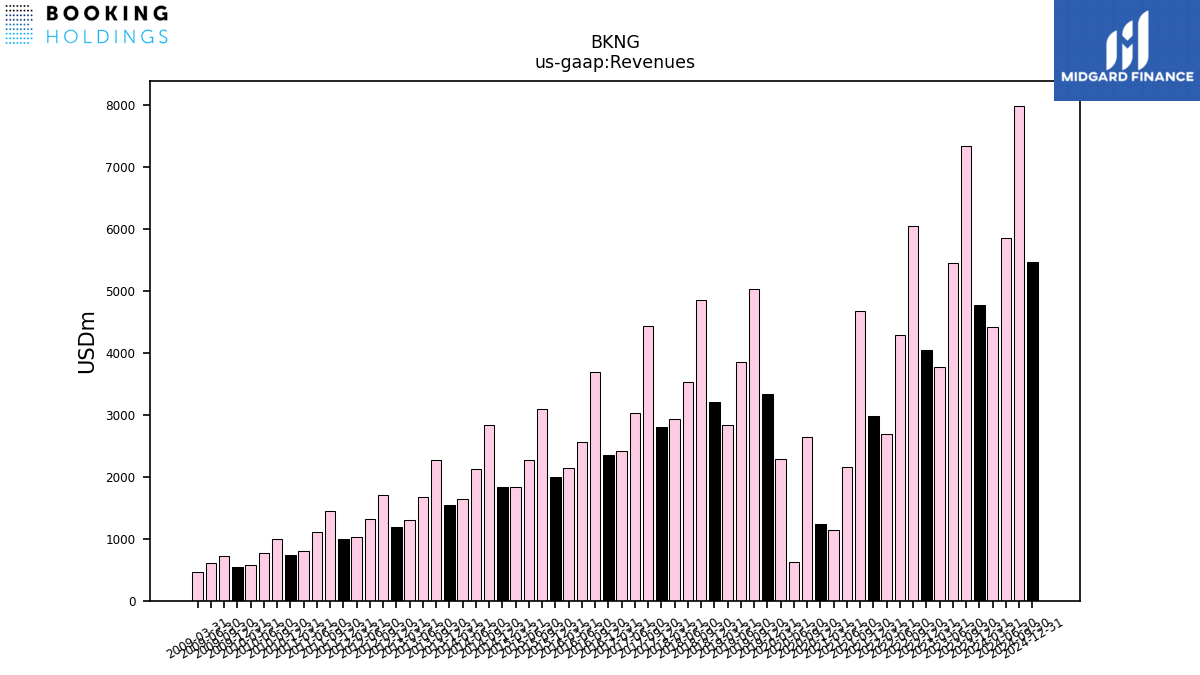 |
BKNG | 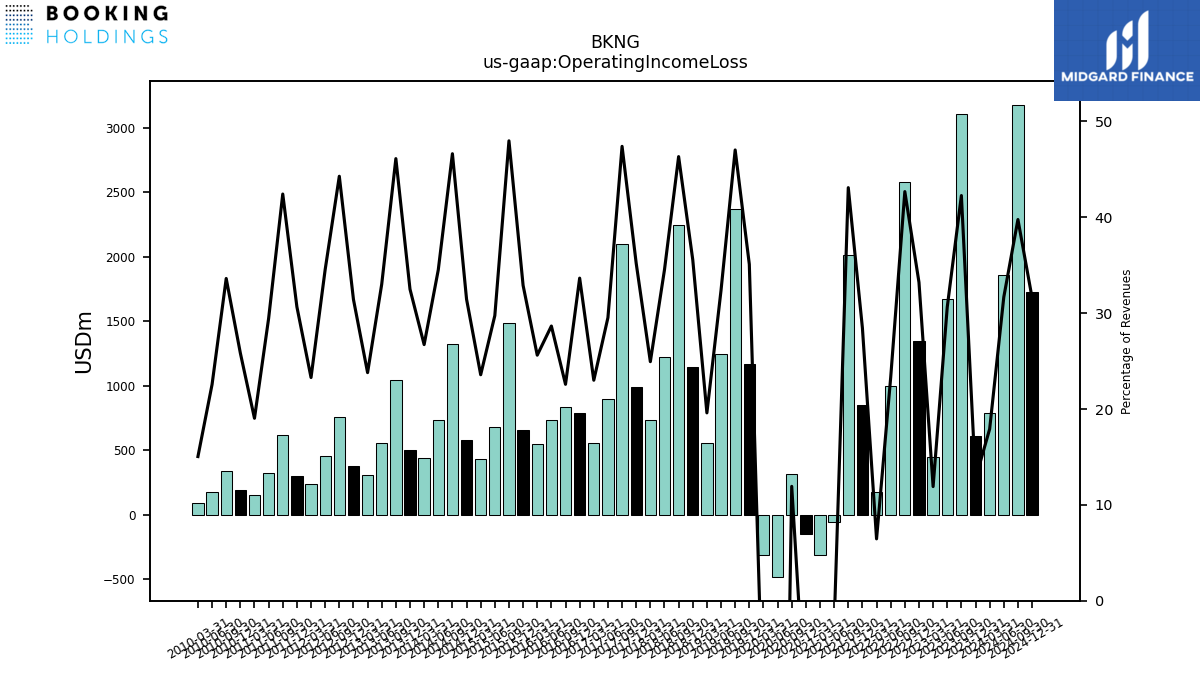 |
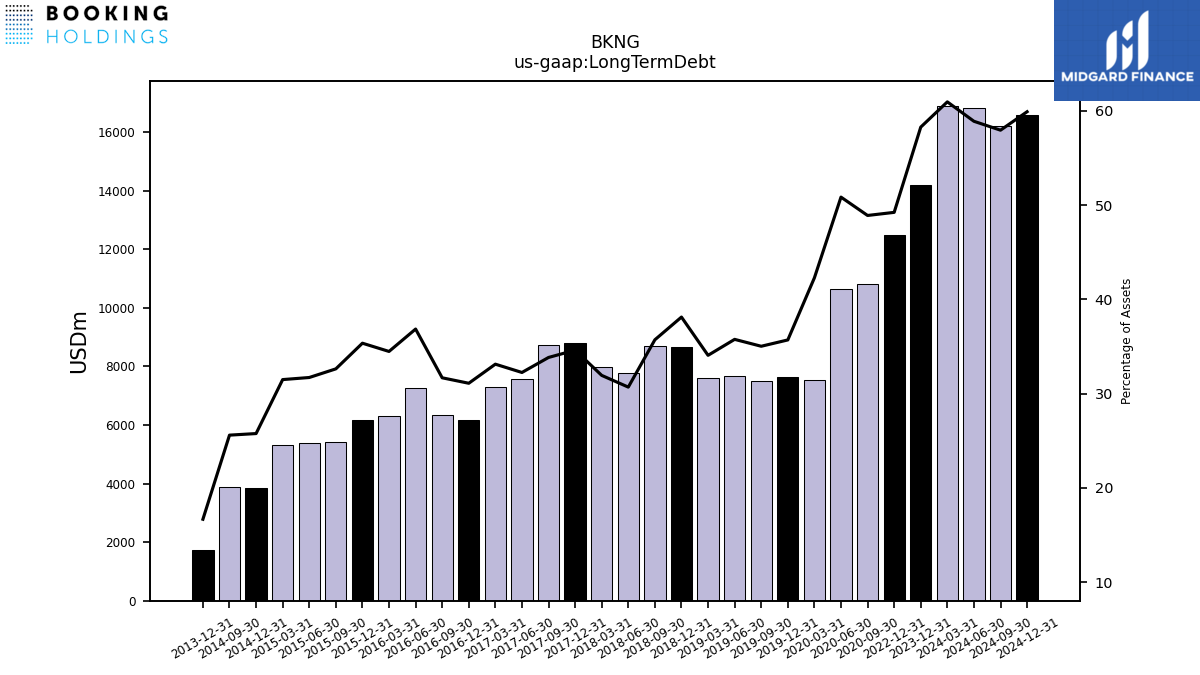 |
BKNG | 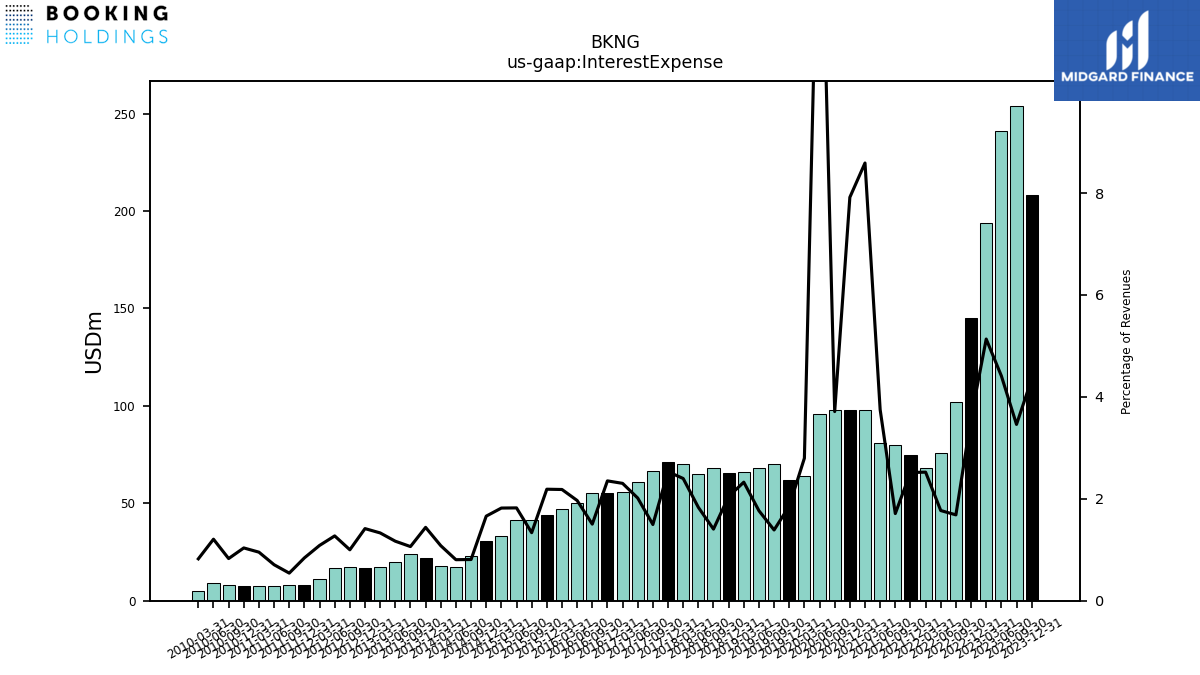 |
 |
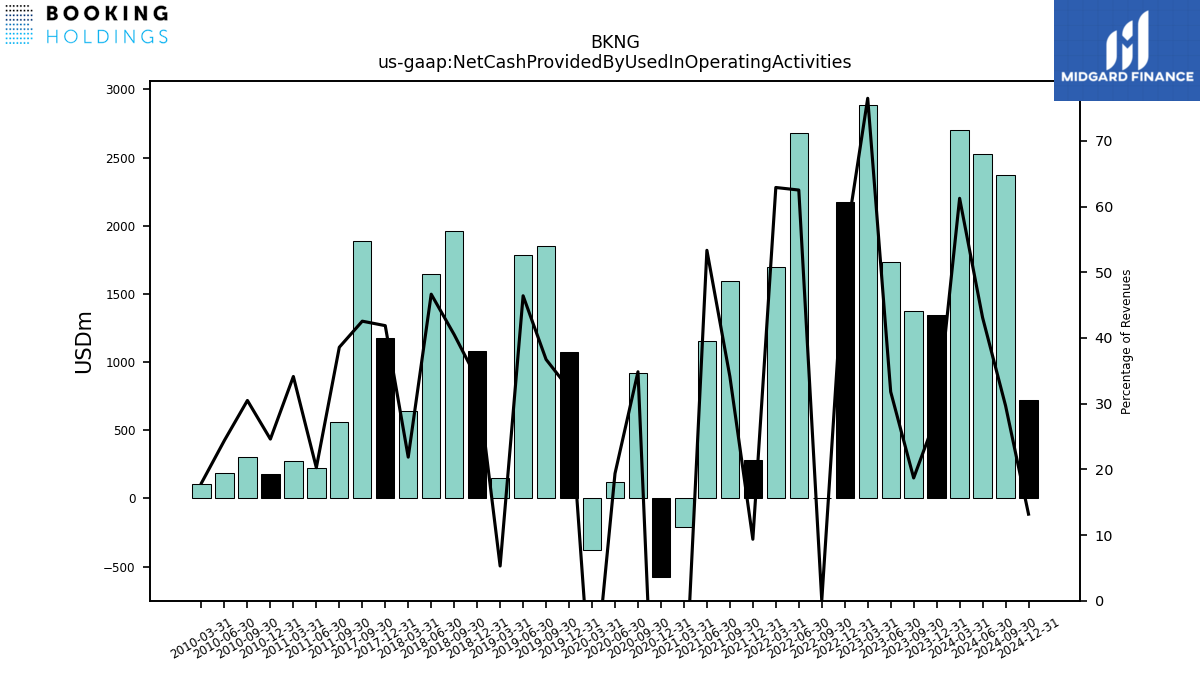 |
BKNG | 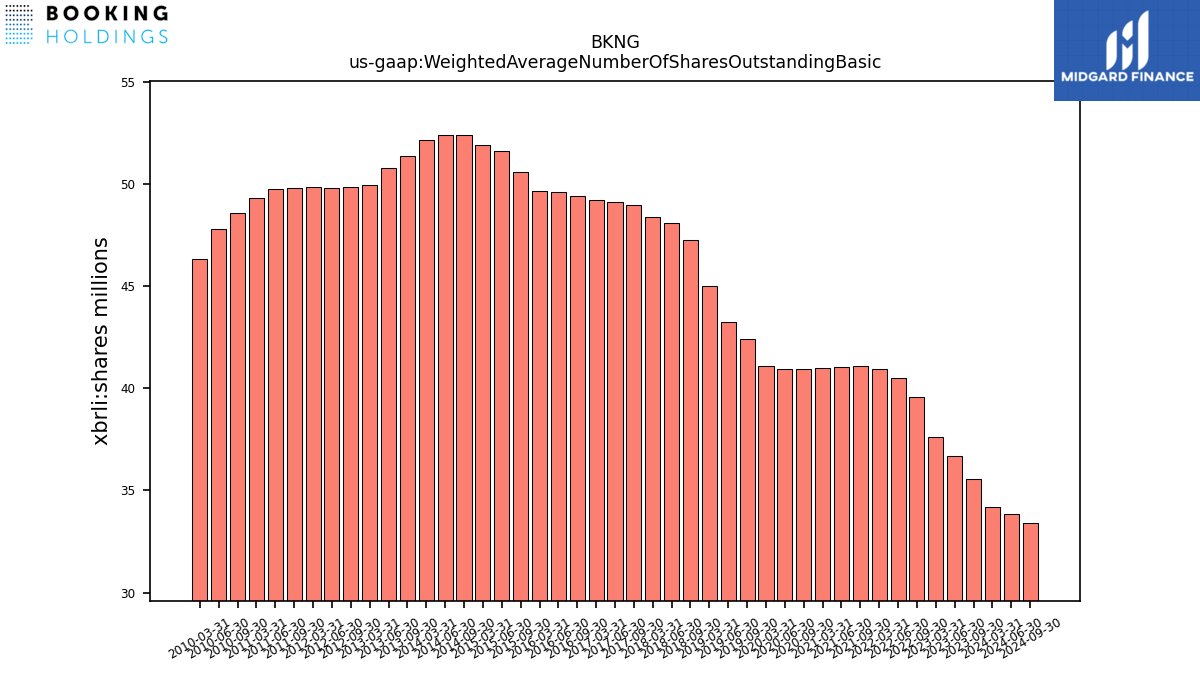 |
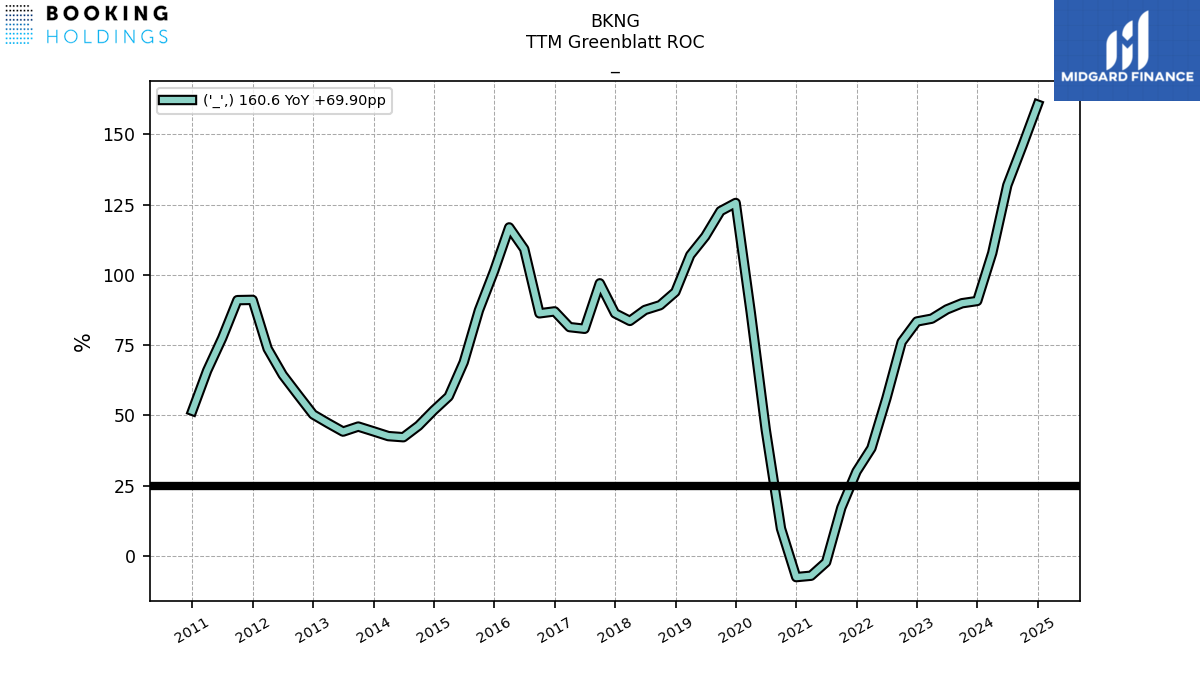 |
BKNG | |||||
| Ticker | 10K | 10Q | 8K | Sector | Industry | Logo | Forward P/E | Revenue Growth | Ticker | Income | EPS | Revenues | Ticker | GrossProfit | OperatingIncome | LongTermDebt | Ticker | InterestExpense | RetainedEarnnings | CashFlowOperating | Ticker | Dividends | SharesOutstanding | TTMGreenblattROC | |
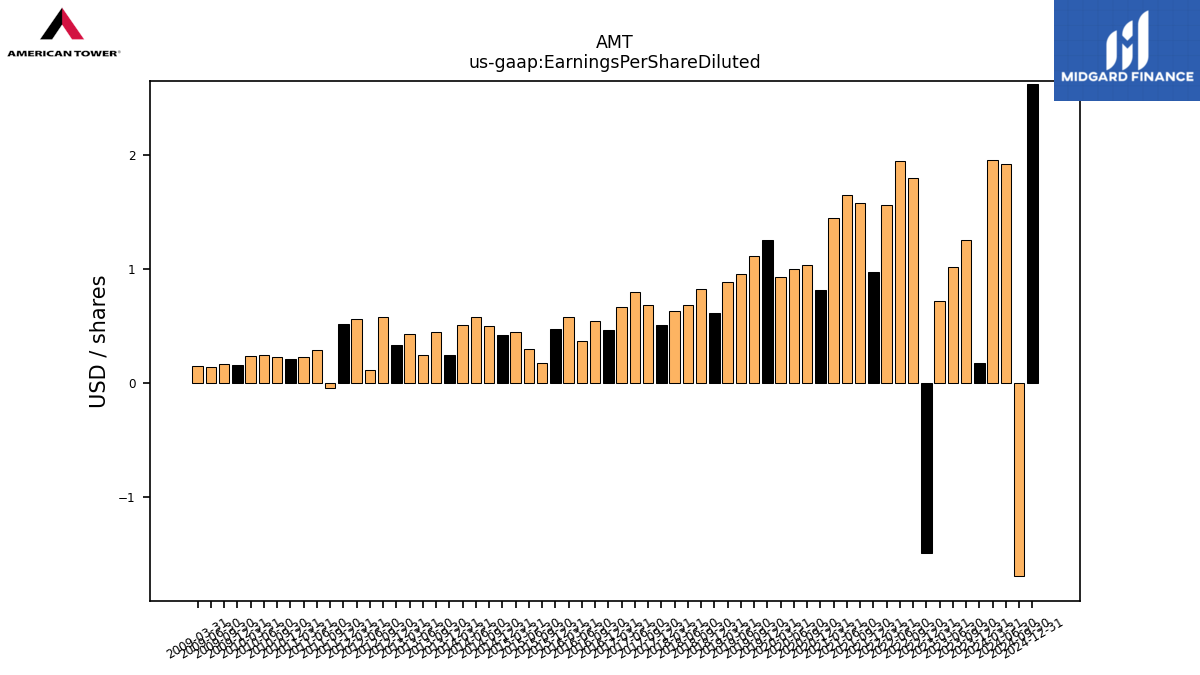
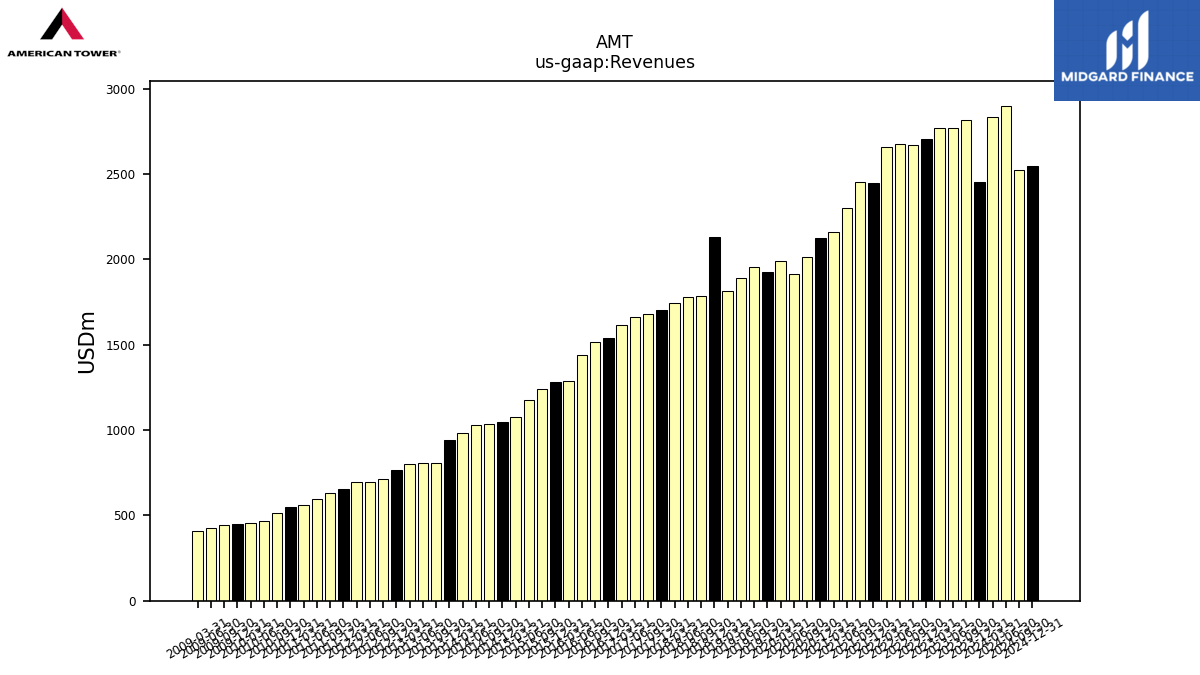
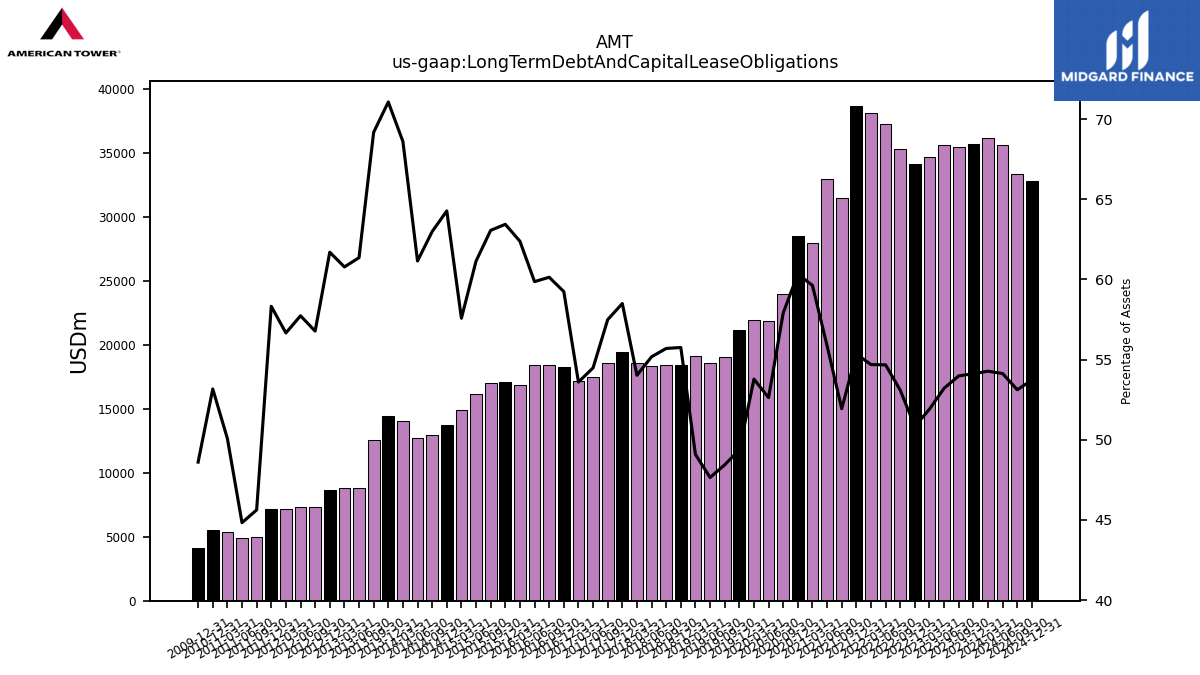
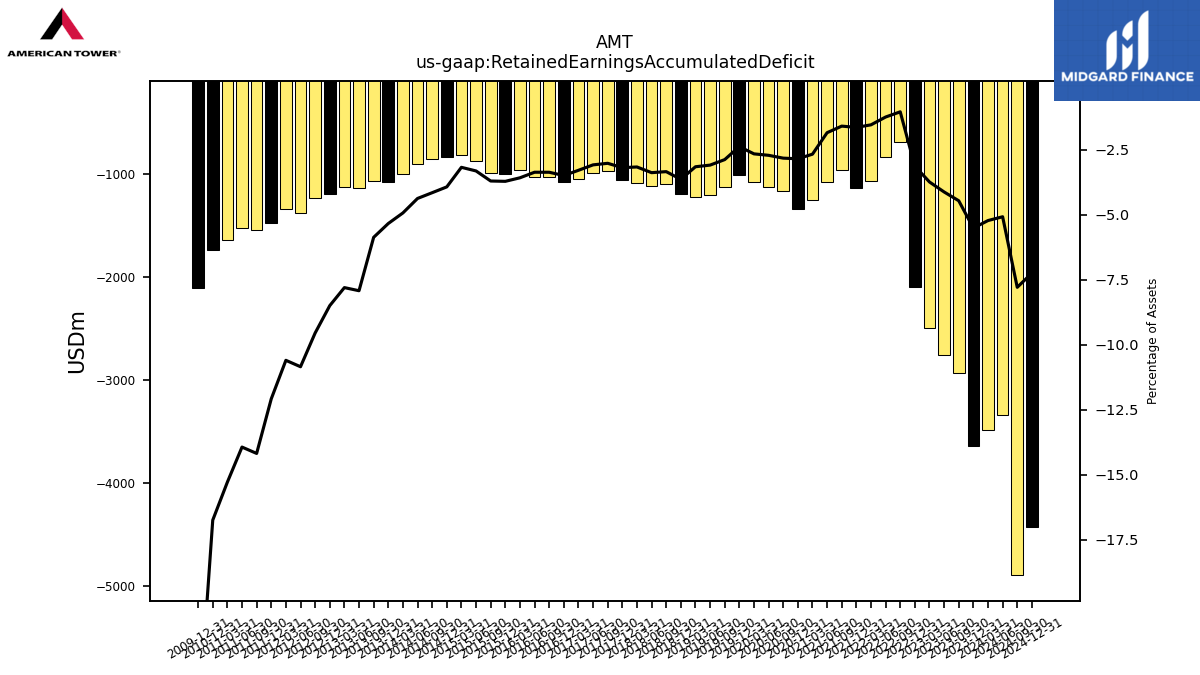
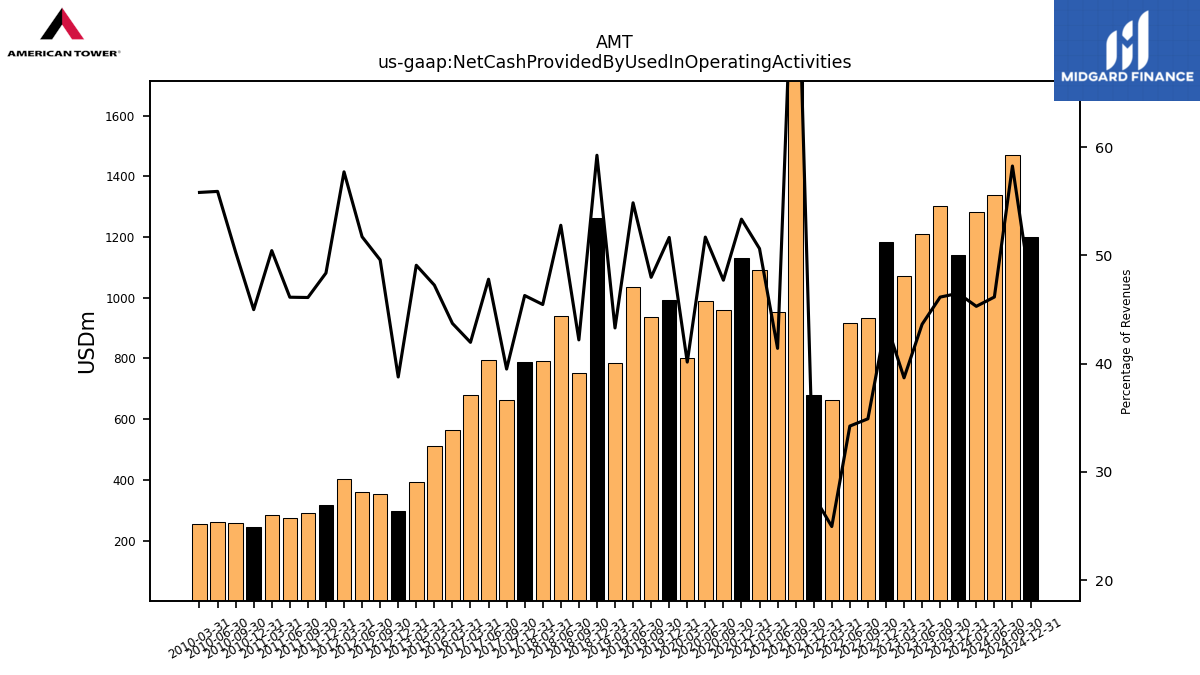
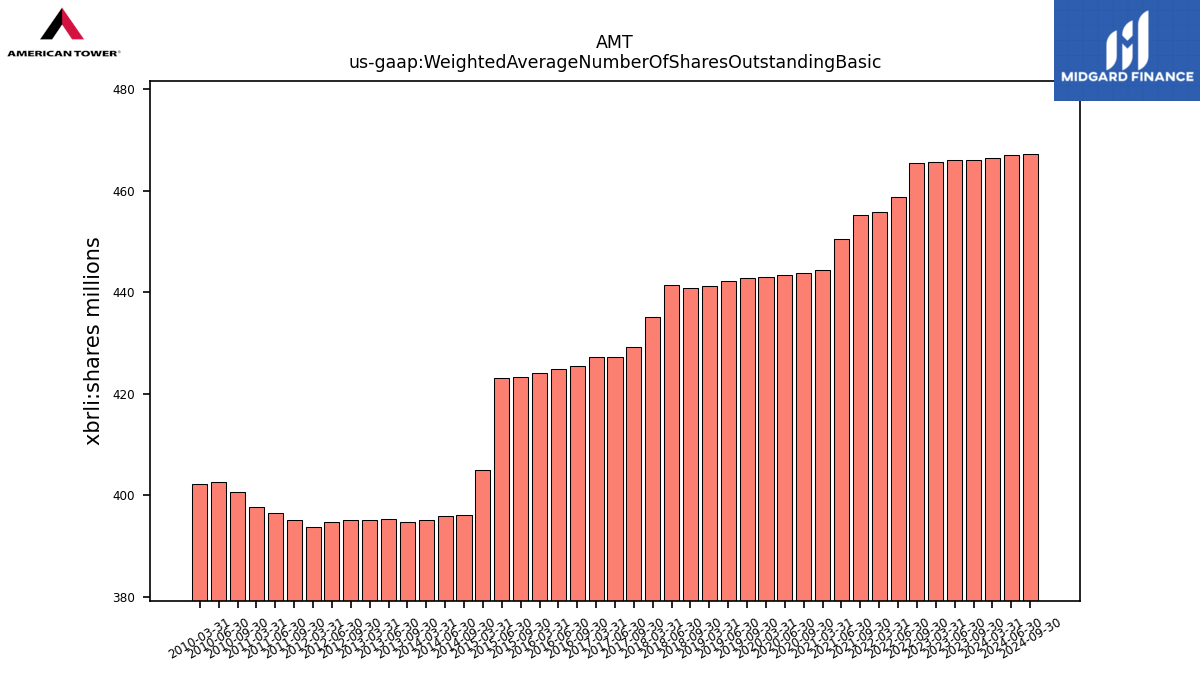
| $AMT$ | 2025-02-25 | 2025-04-29 | 2025-04-29 | NA | NA | AMT | 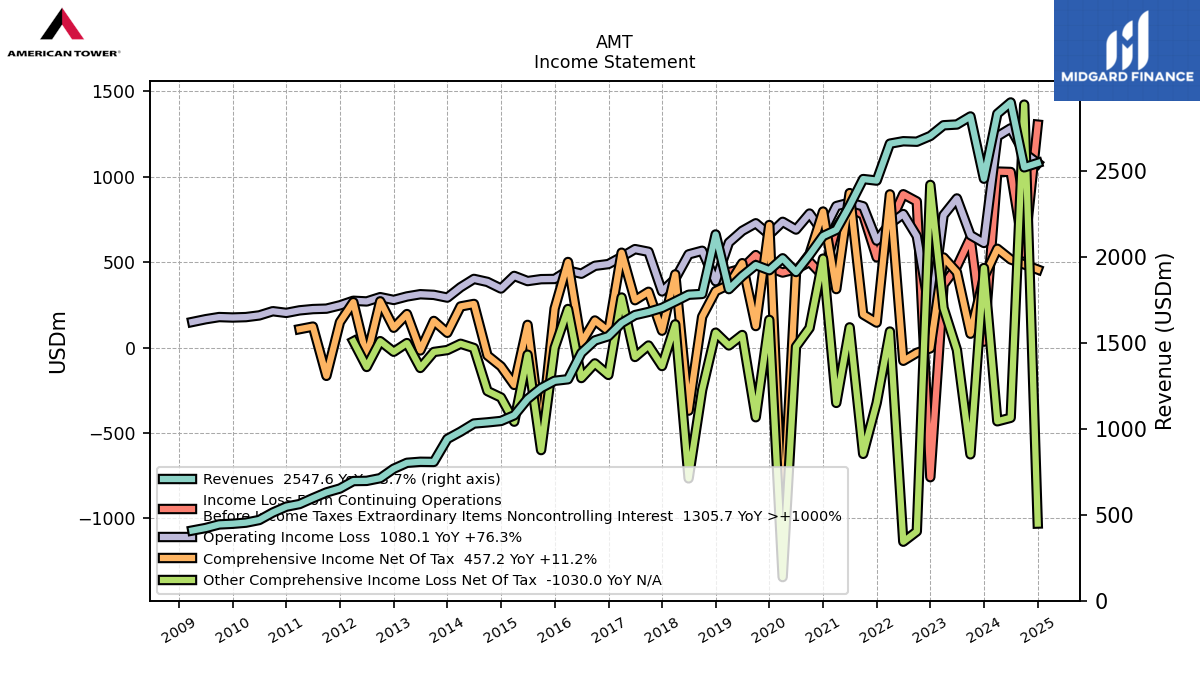 |
 |
 |
AMT | 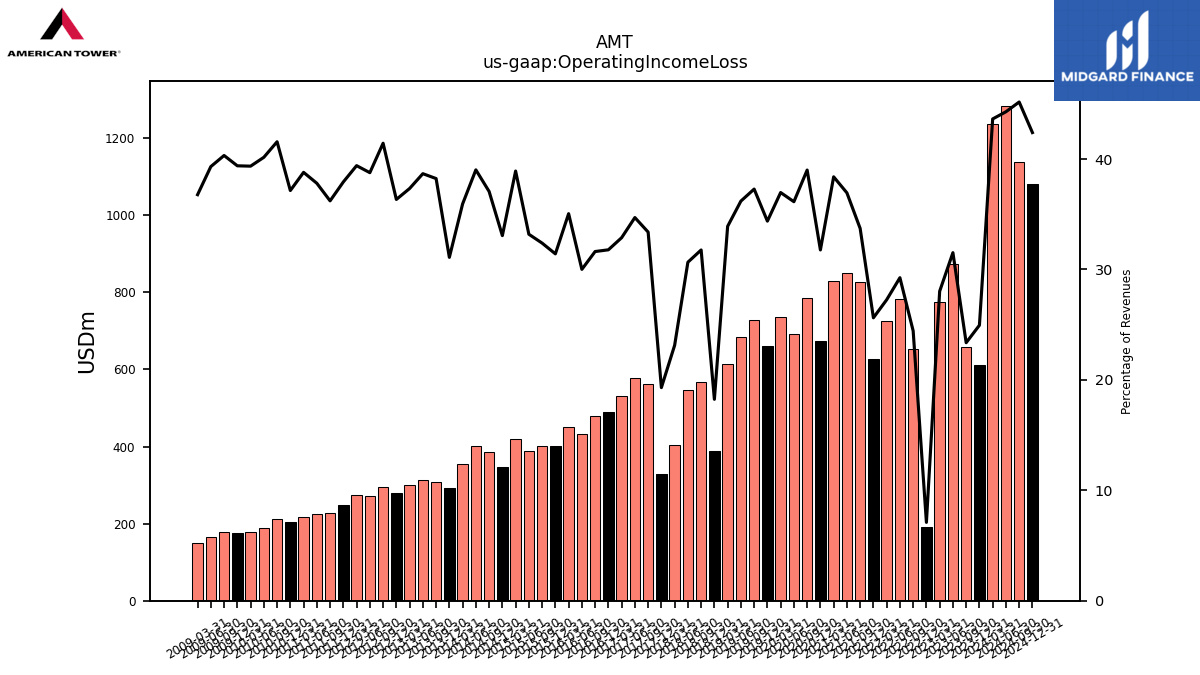 |
 |
AMT | 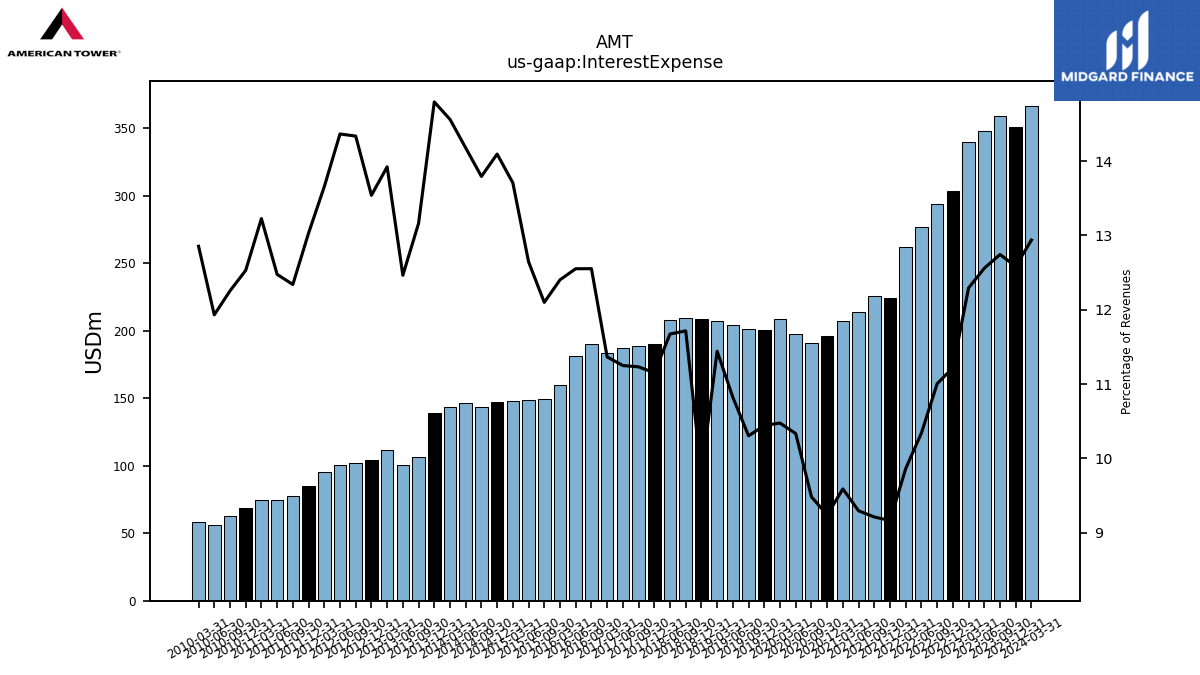 |
 |
 |
AMT | 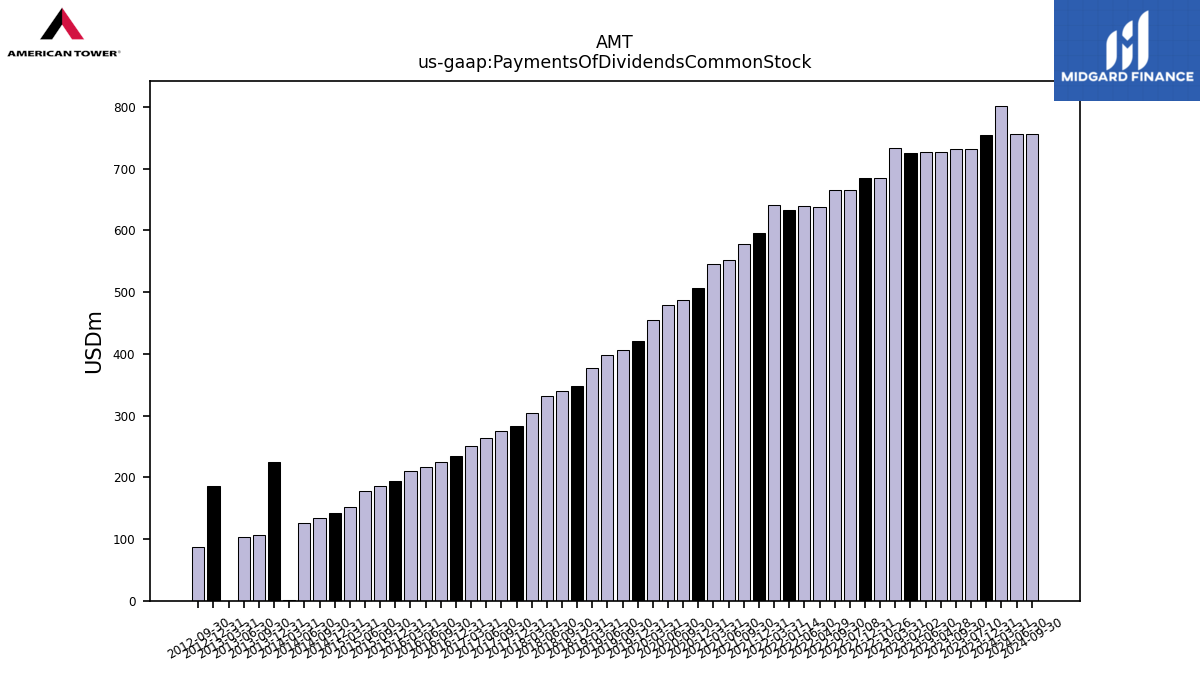 |
 |
AMT | |||||
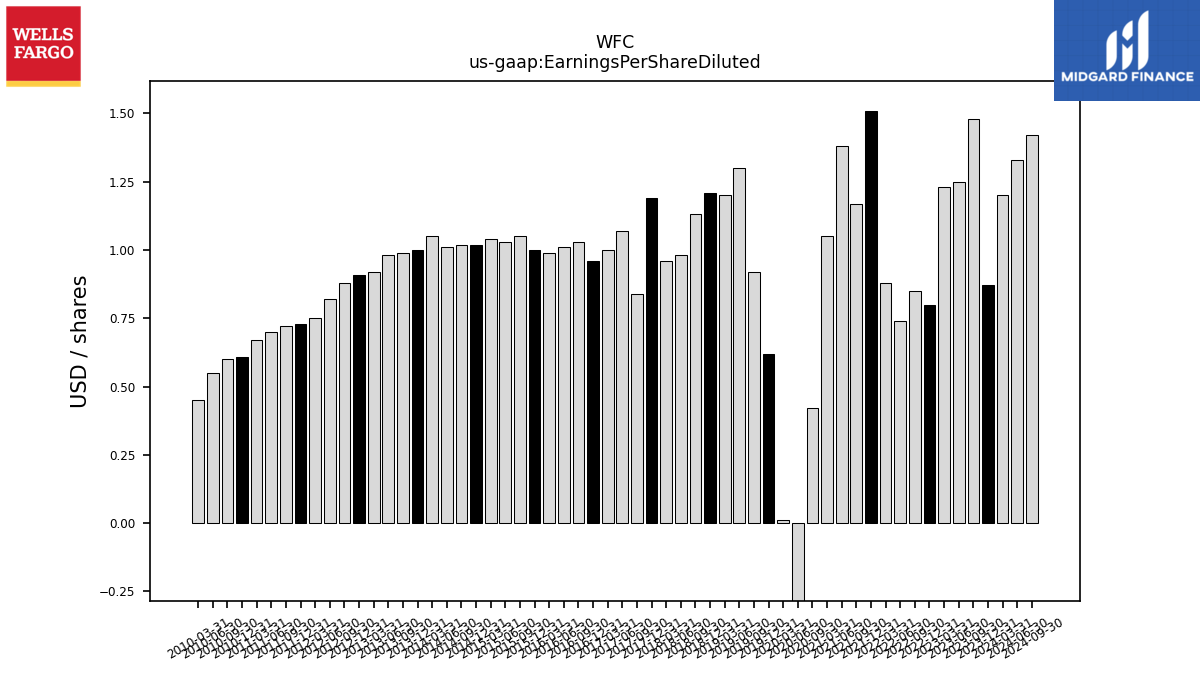
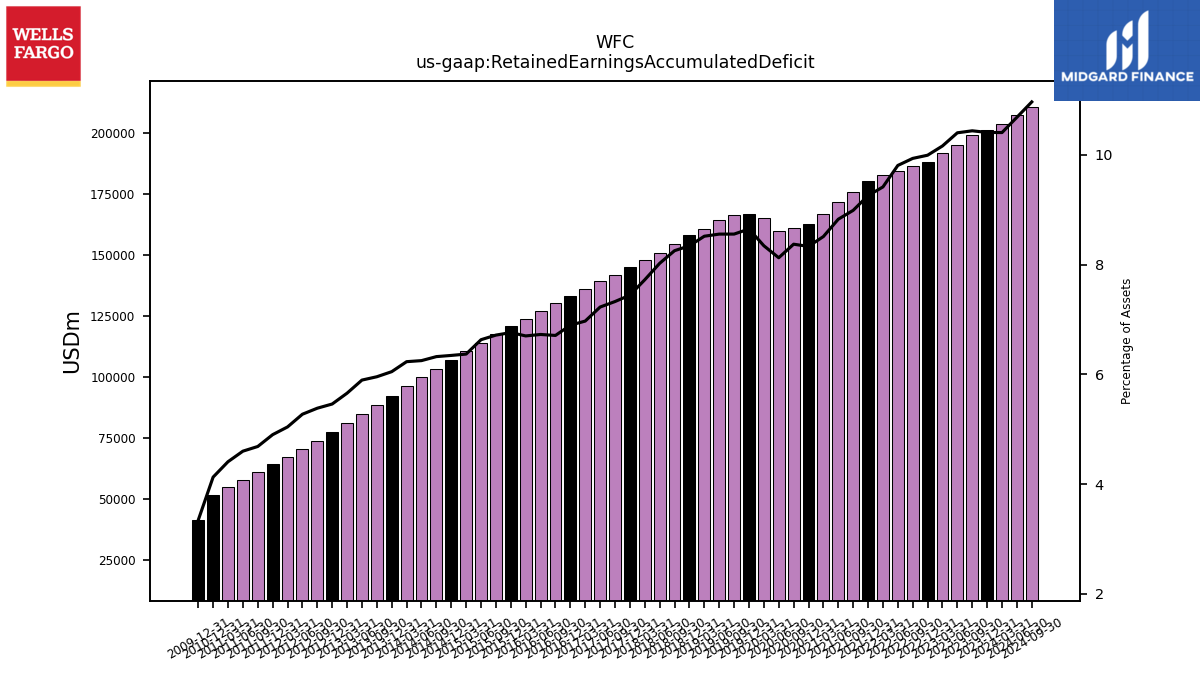
| $WFC$ | 2025-02-25 | 2025-04-29 | 2025-04-23 | NA | NA | WFC | 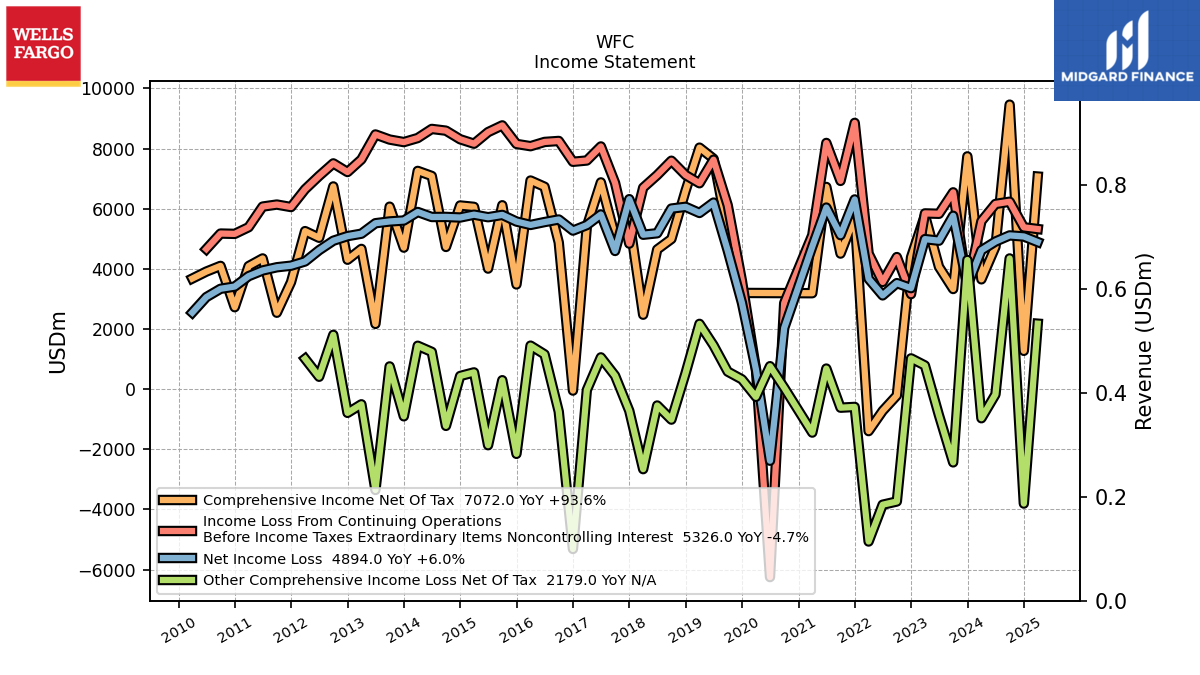 |
 |
WFC | 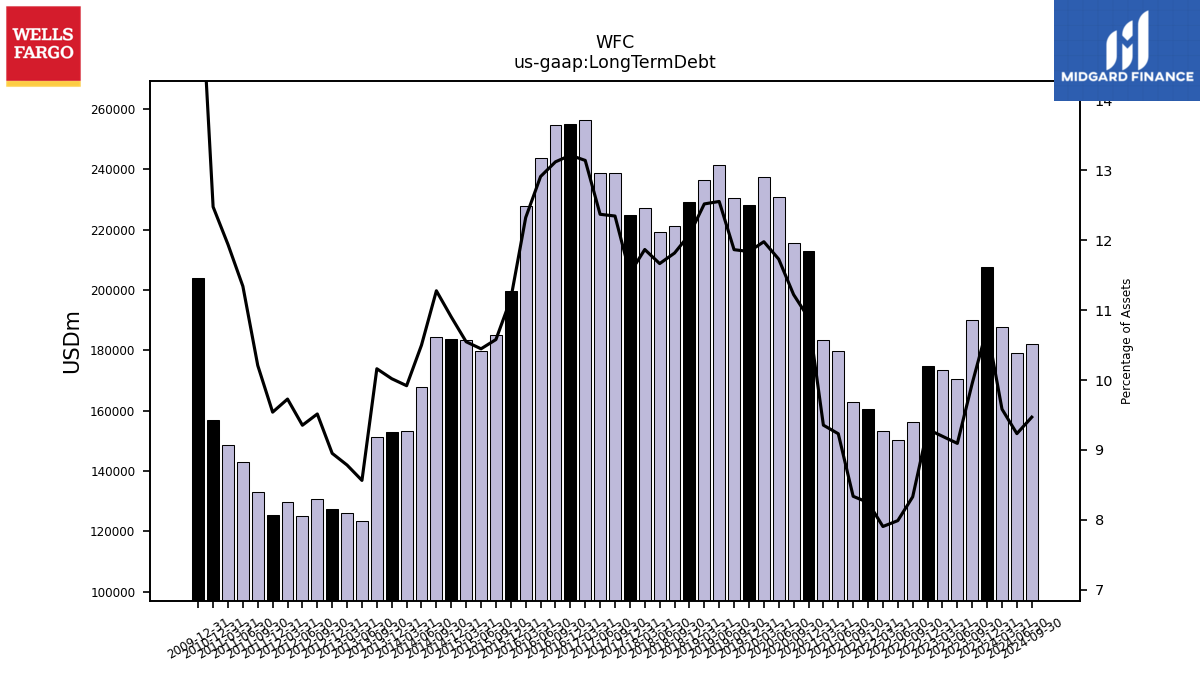 |
WFC | 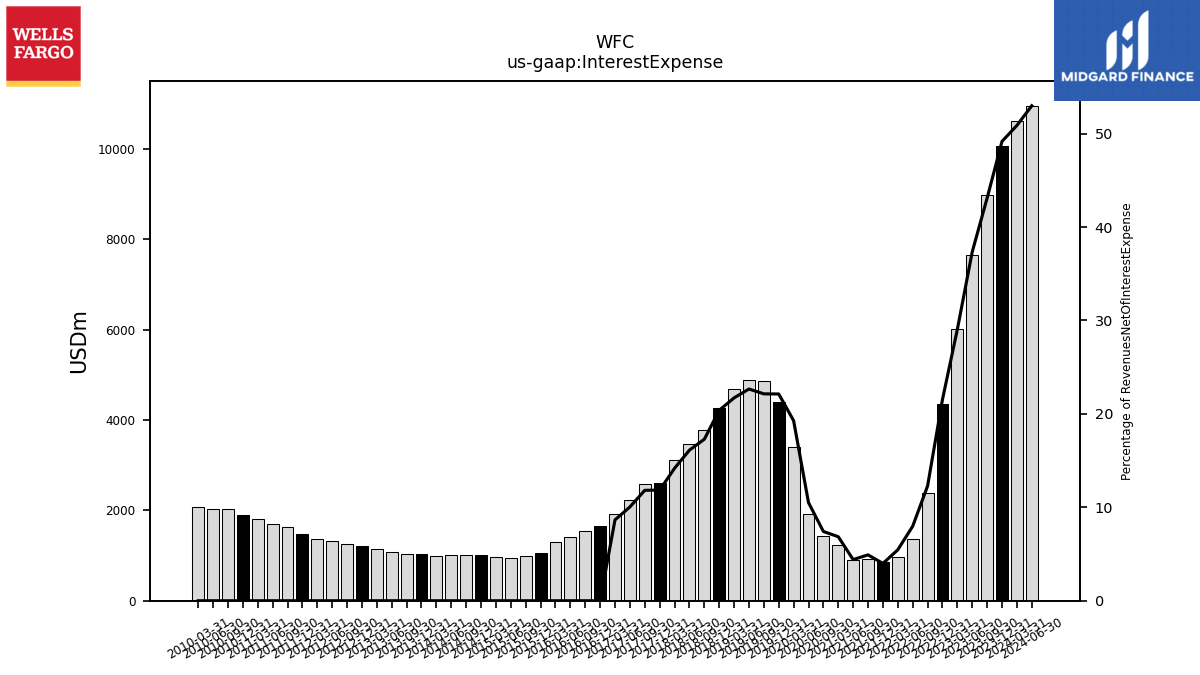 |
 |
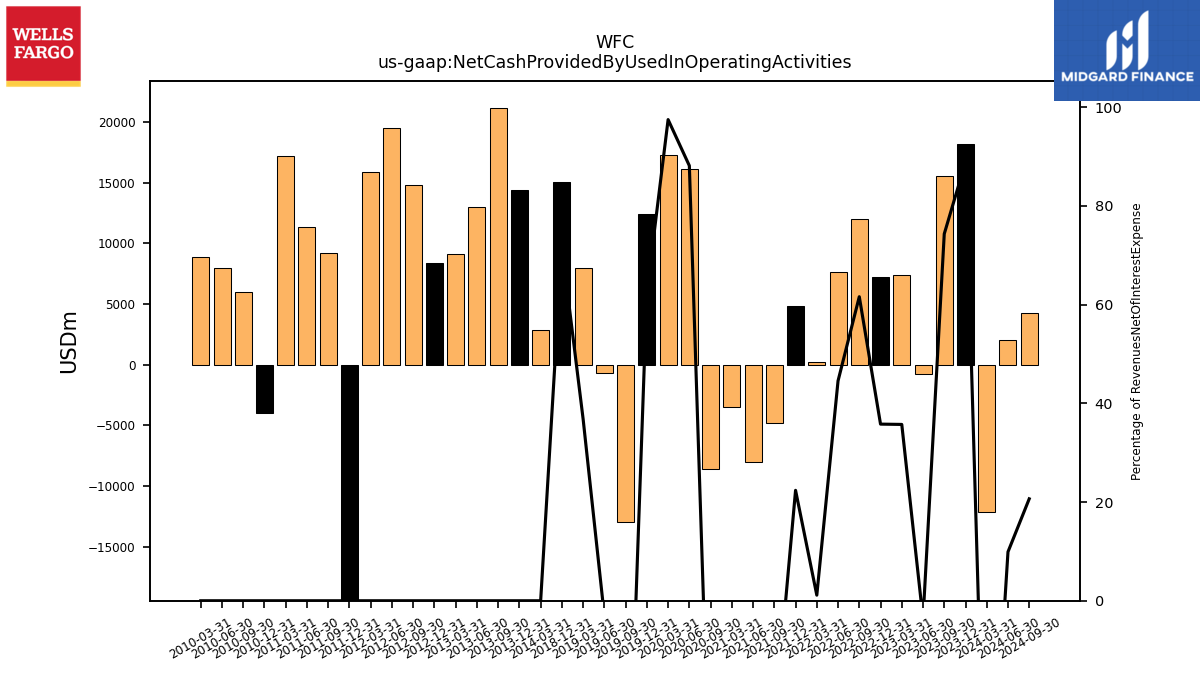 |
WFC | 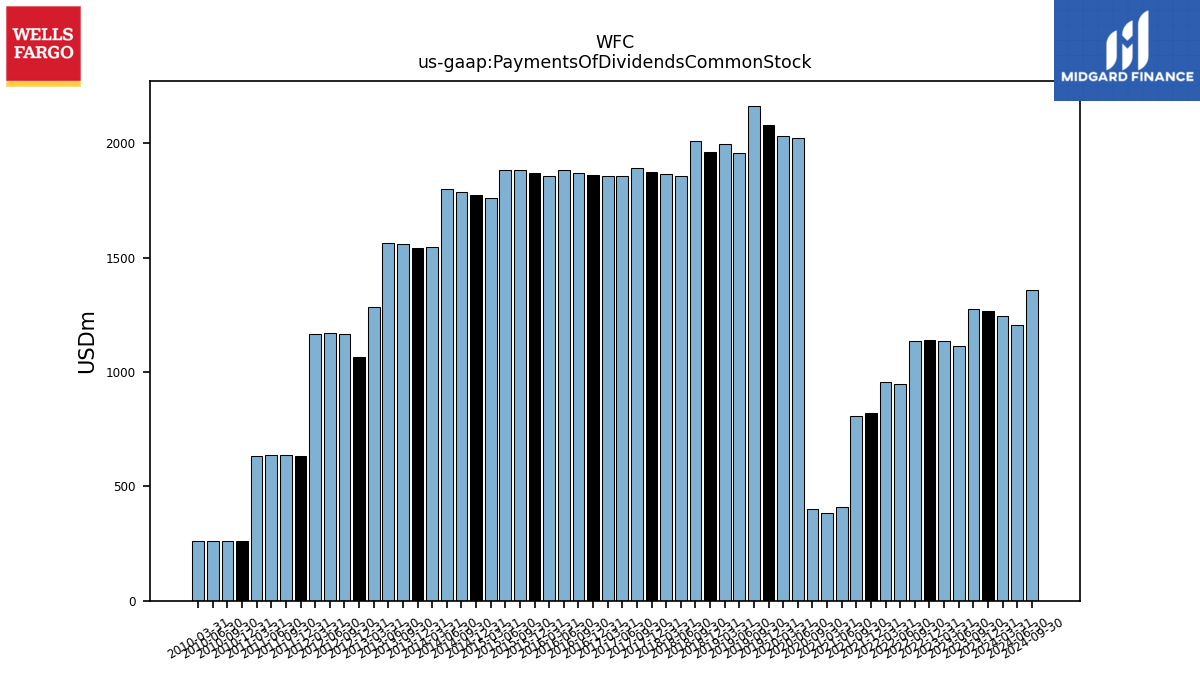 |
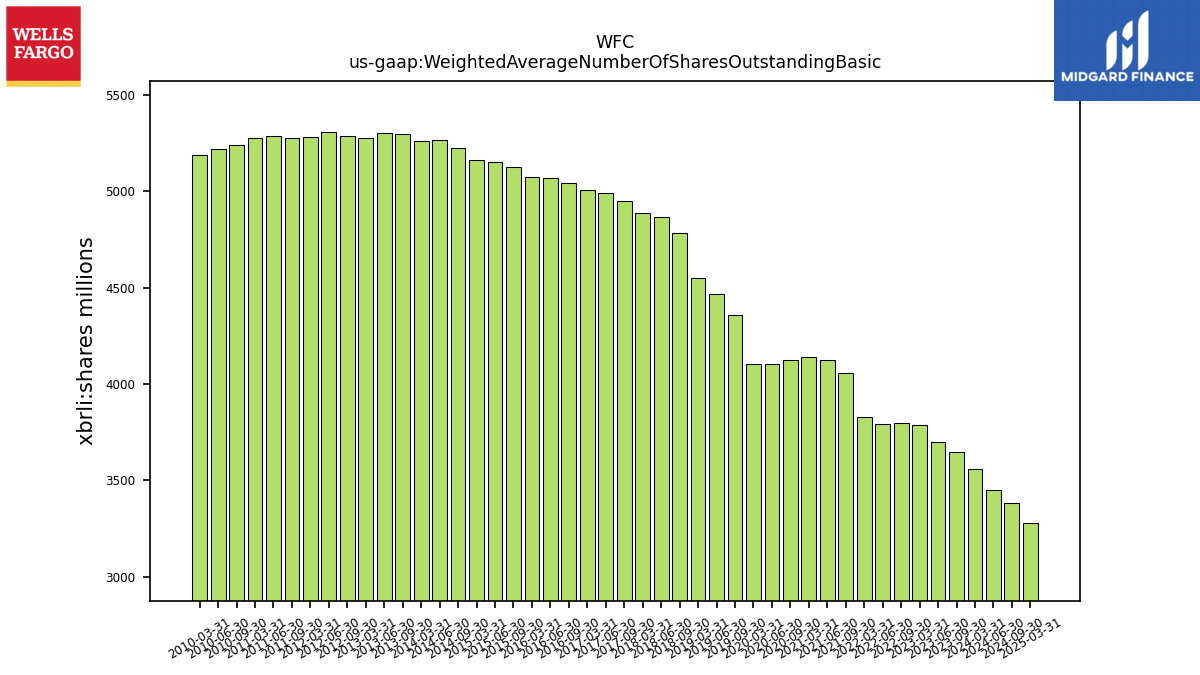 |
WFC | |||||||
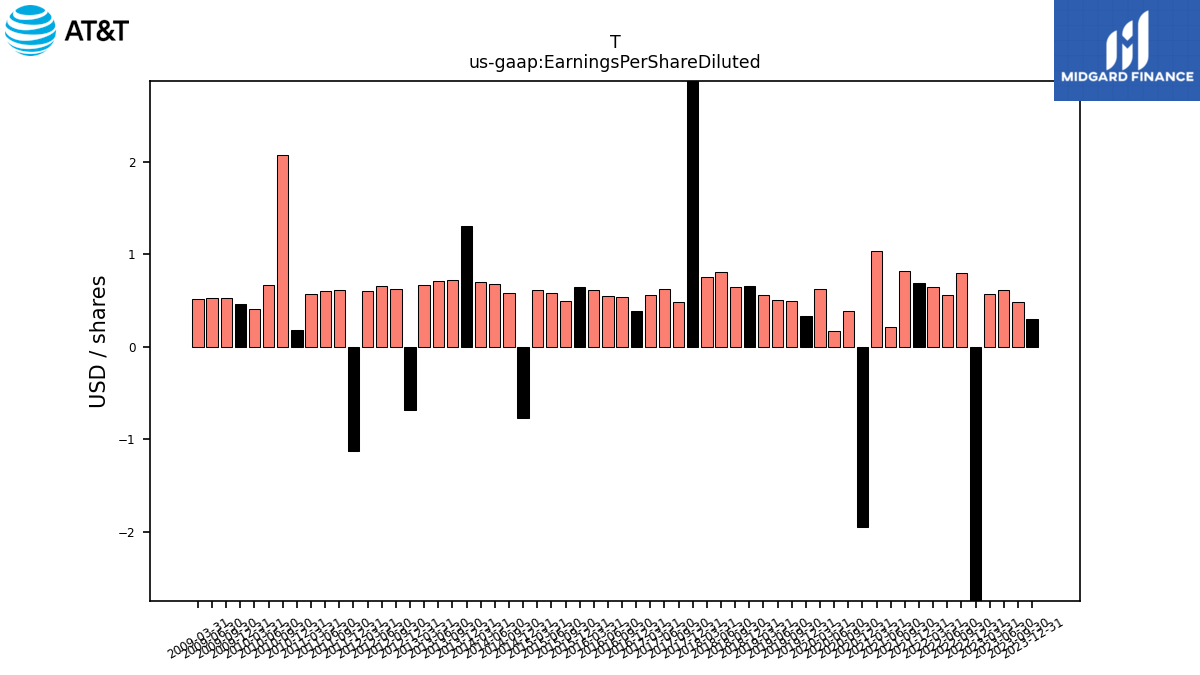
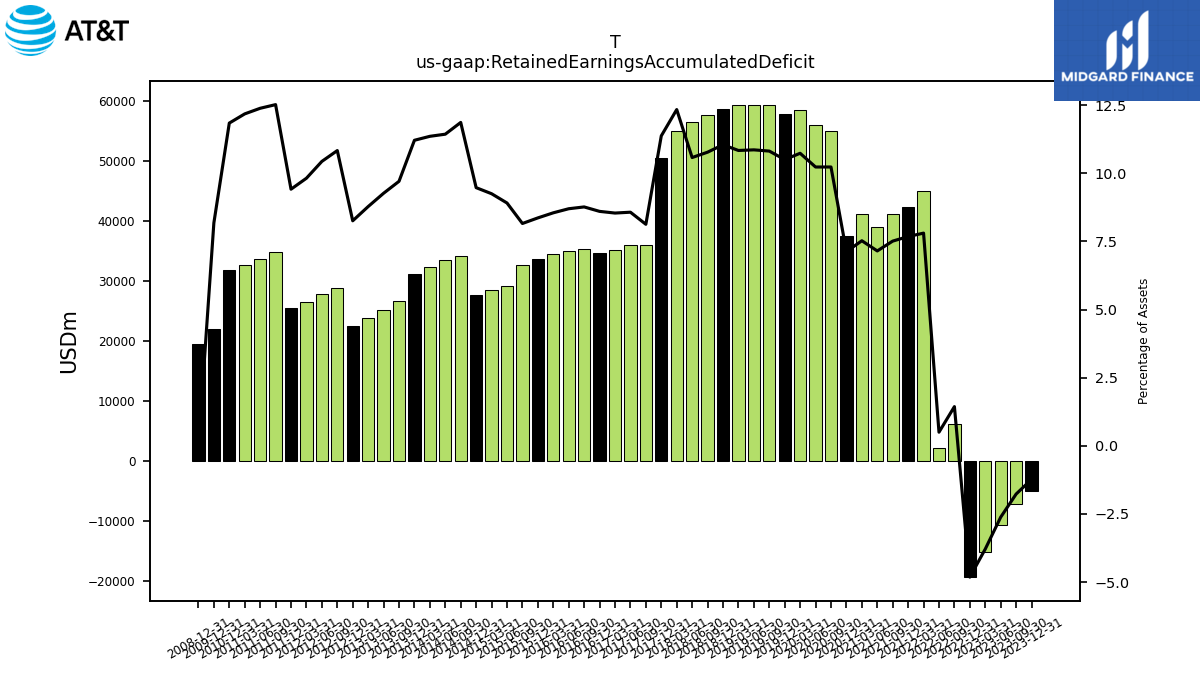
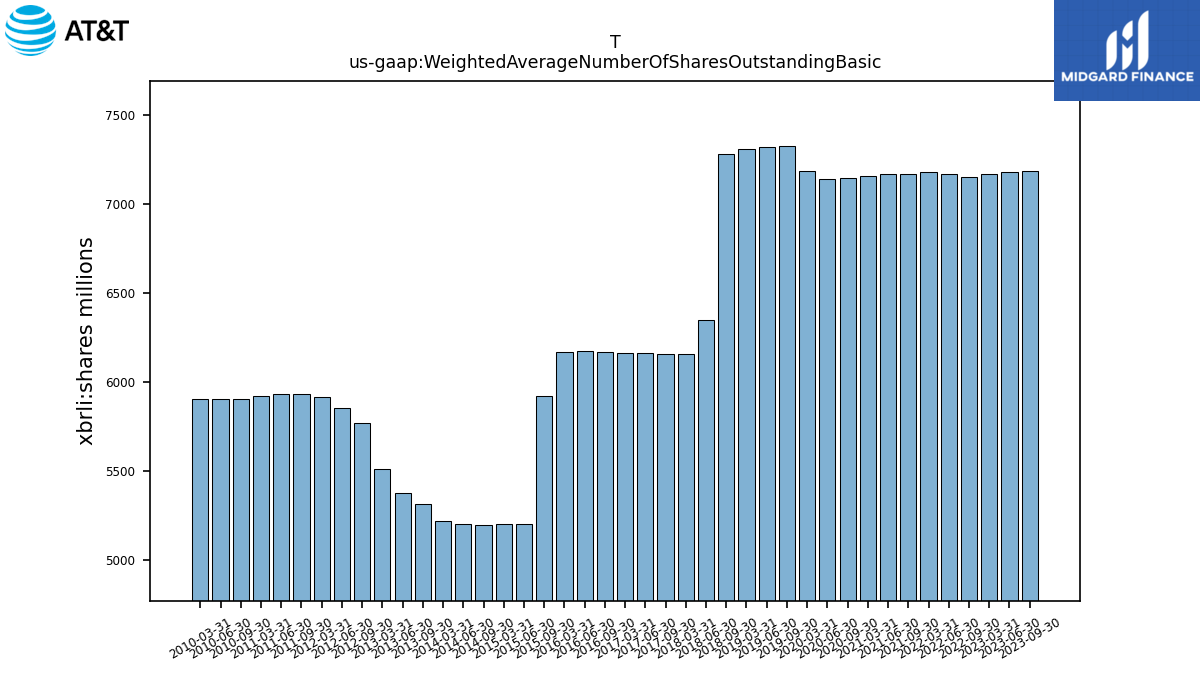
| $T$ | 2025-02-12 | 2025-04-29 | 2025-04-23 | NA | NA | T | 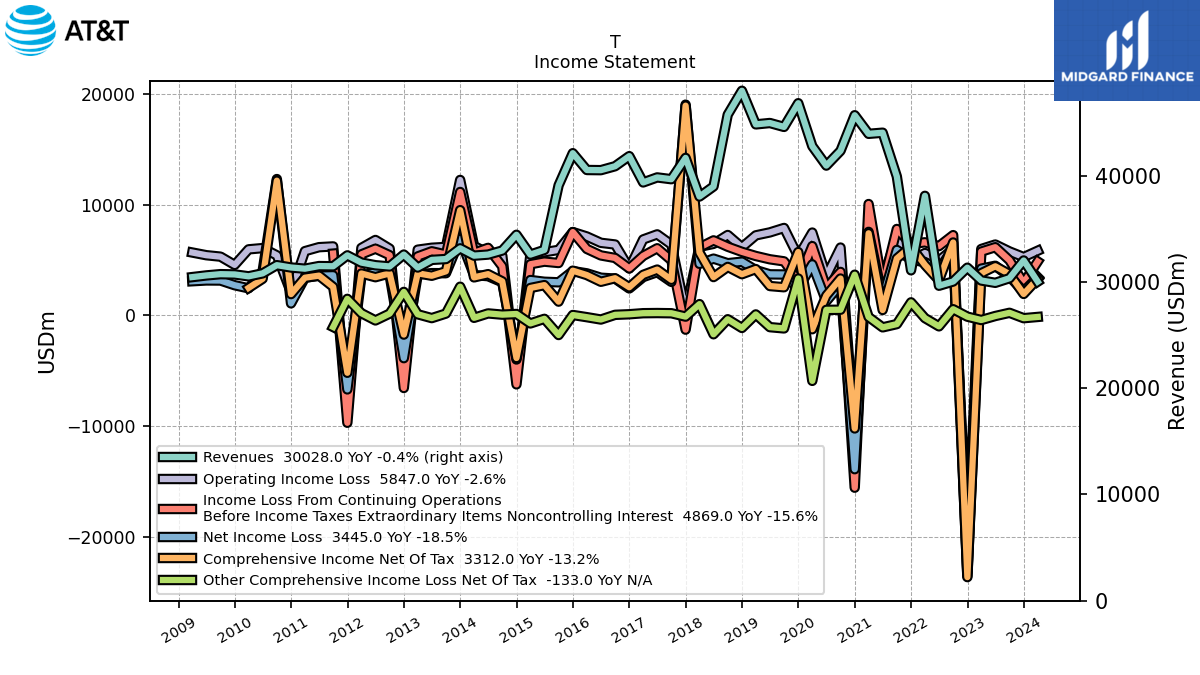 |
 |
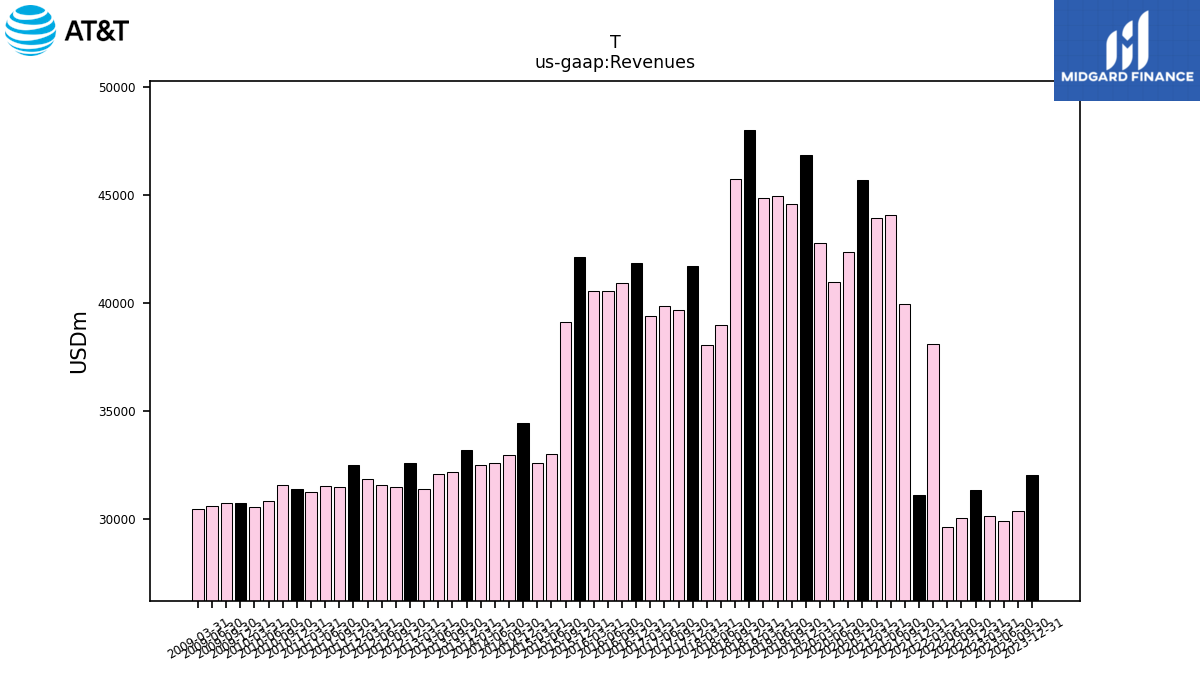 |
T | 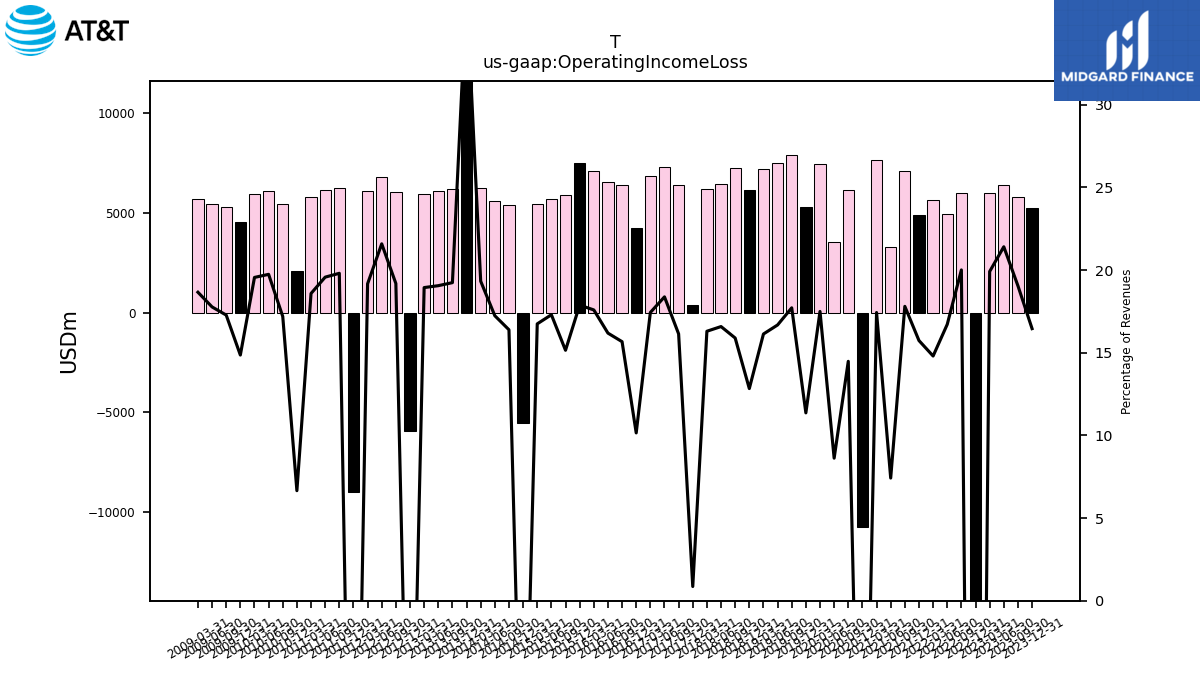 |
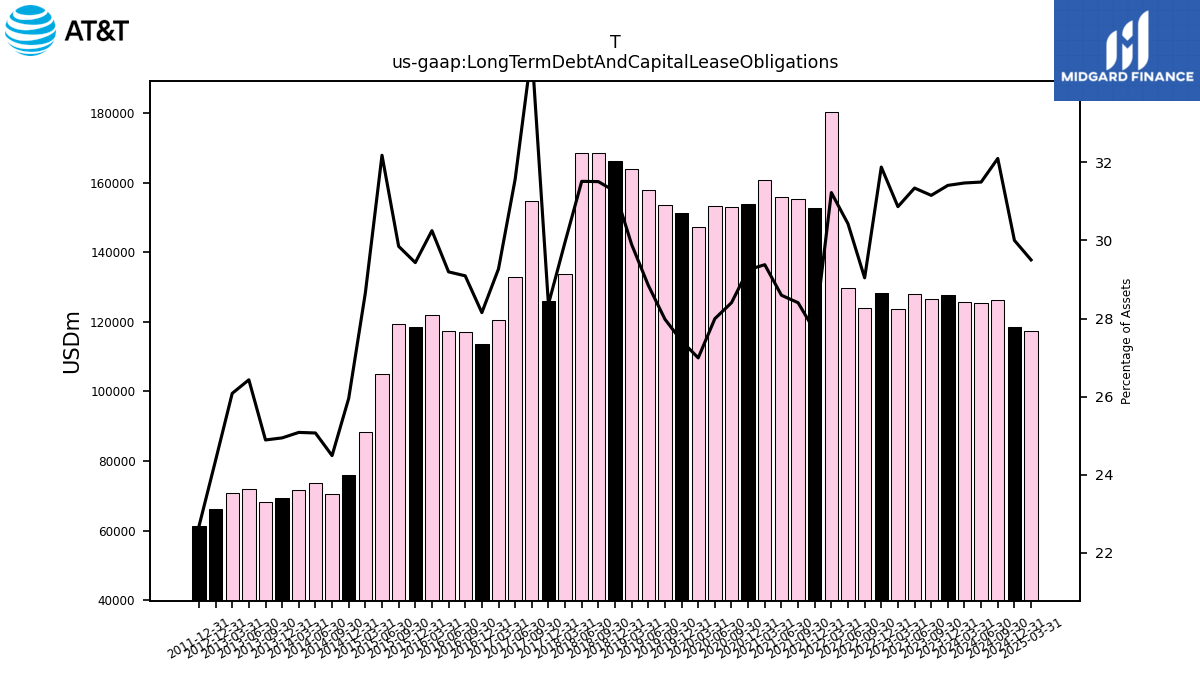 |
T | 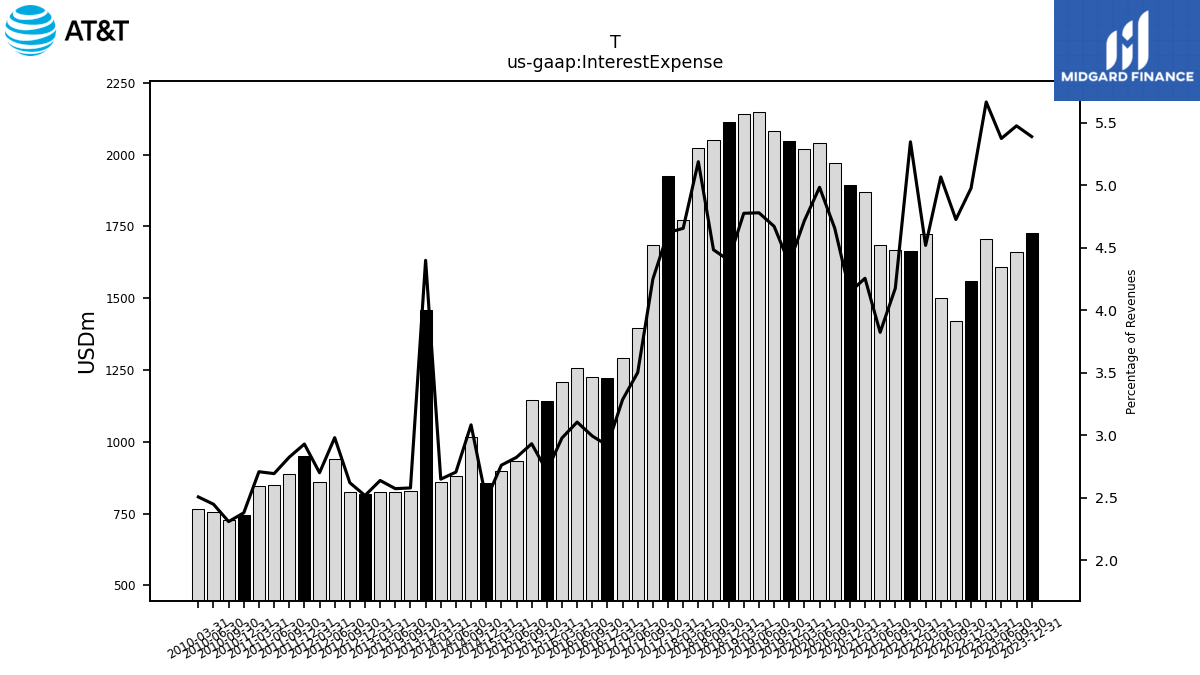 |
 |
 |
T | 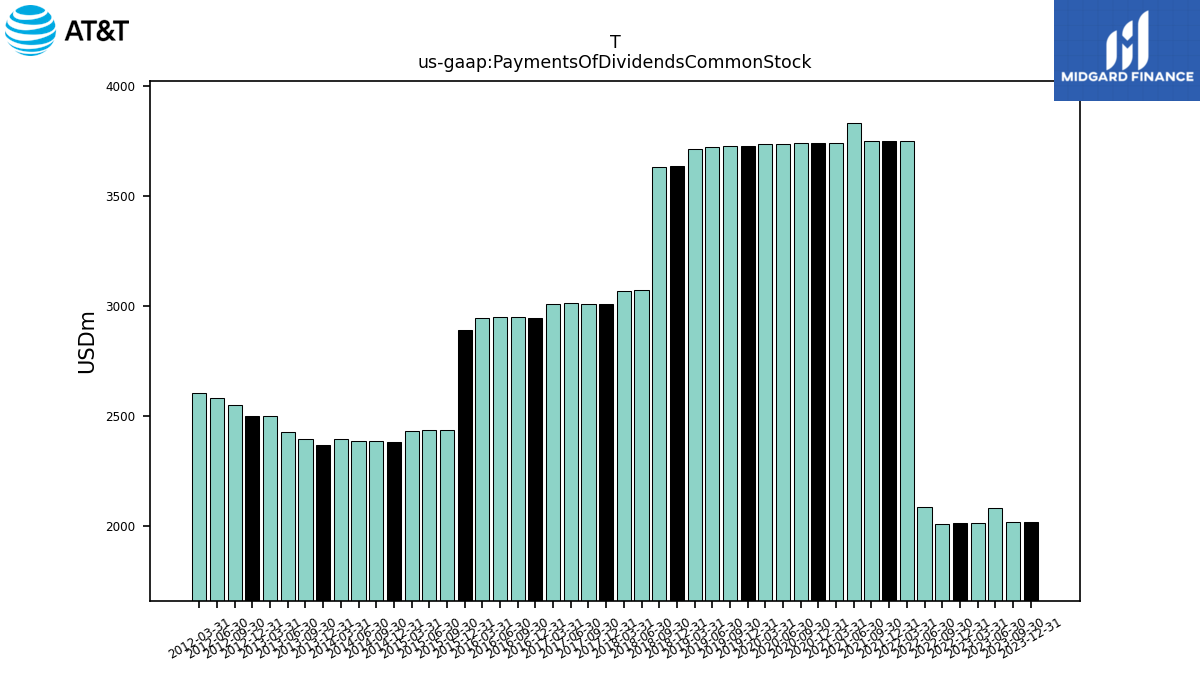 |
 |
T | |||||
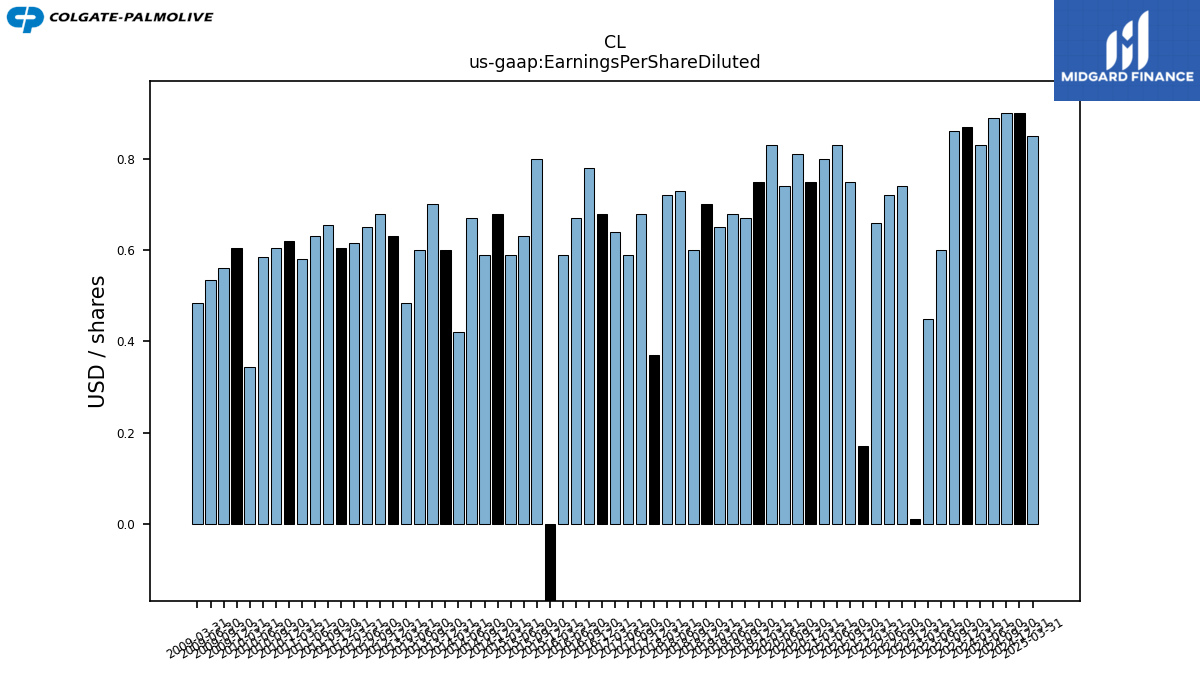
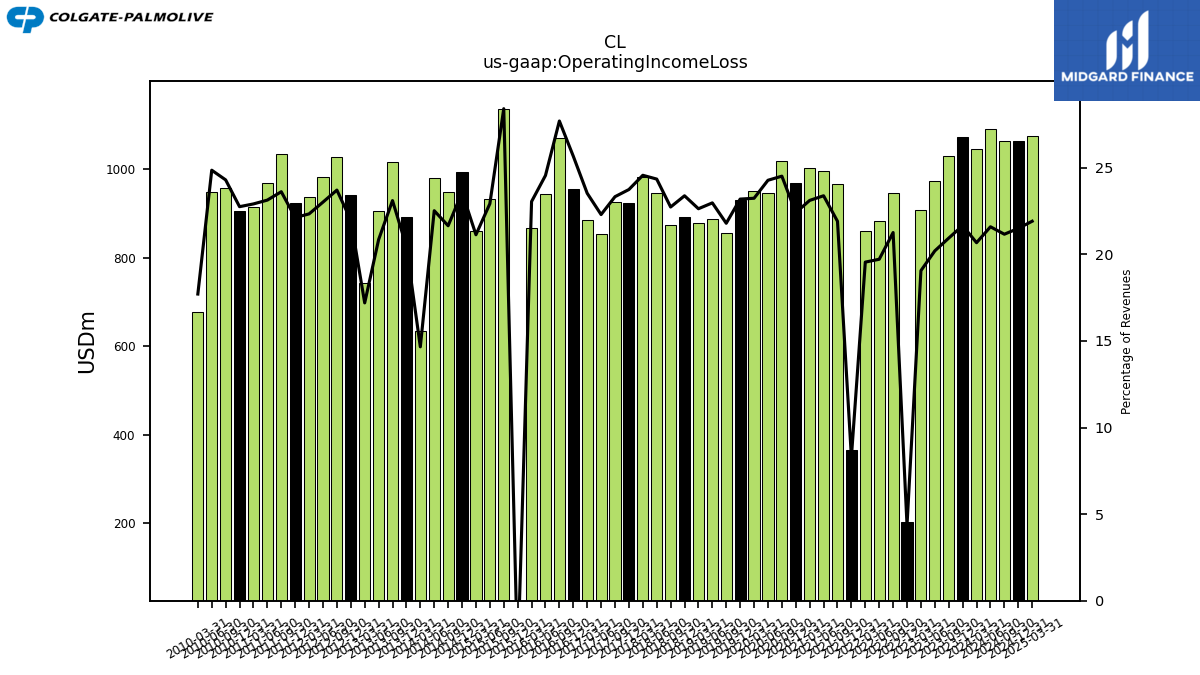
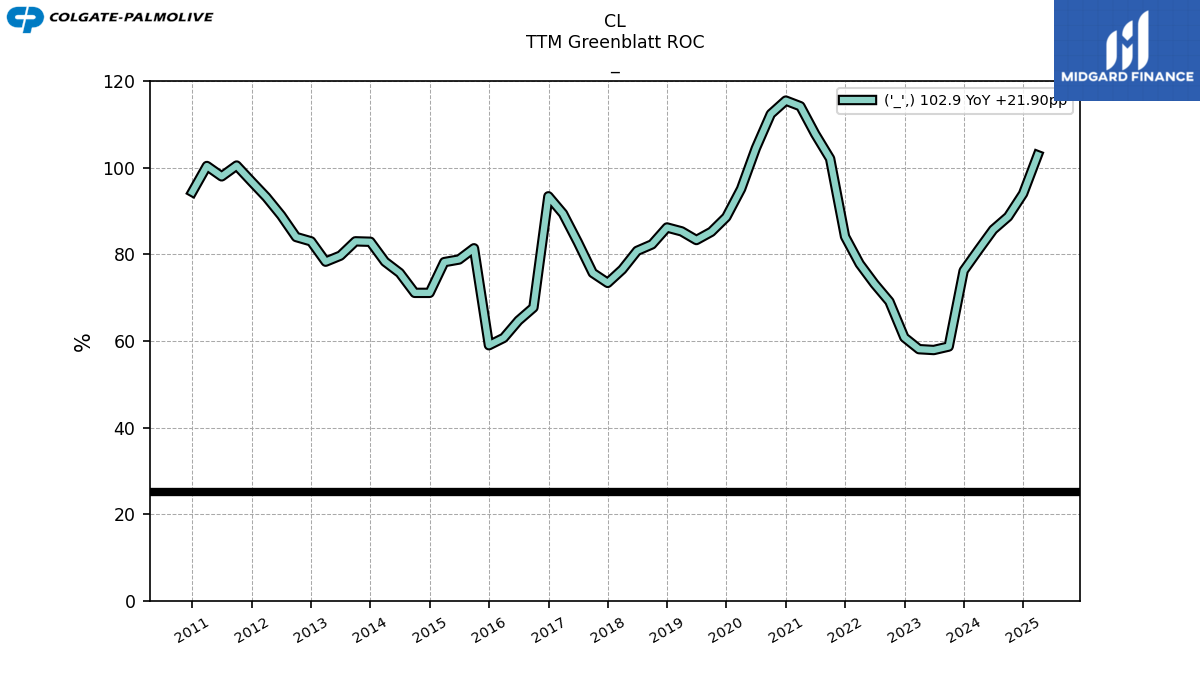
| $CL$ | 2025-02-13 | 2025-04-25 | 2025-04-25 | NA | NA | CL | 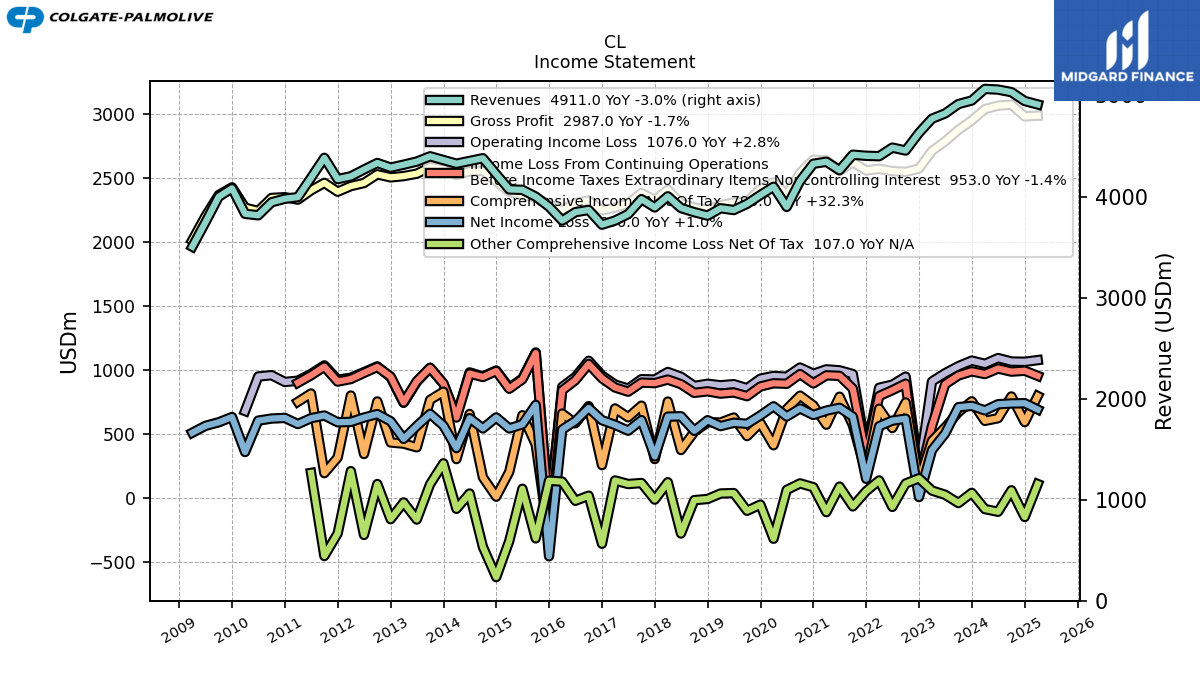 |
 |
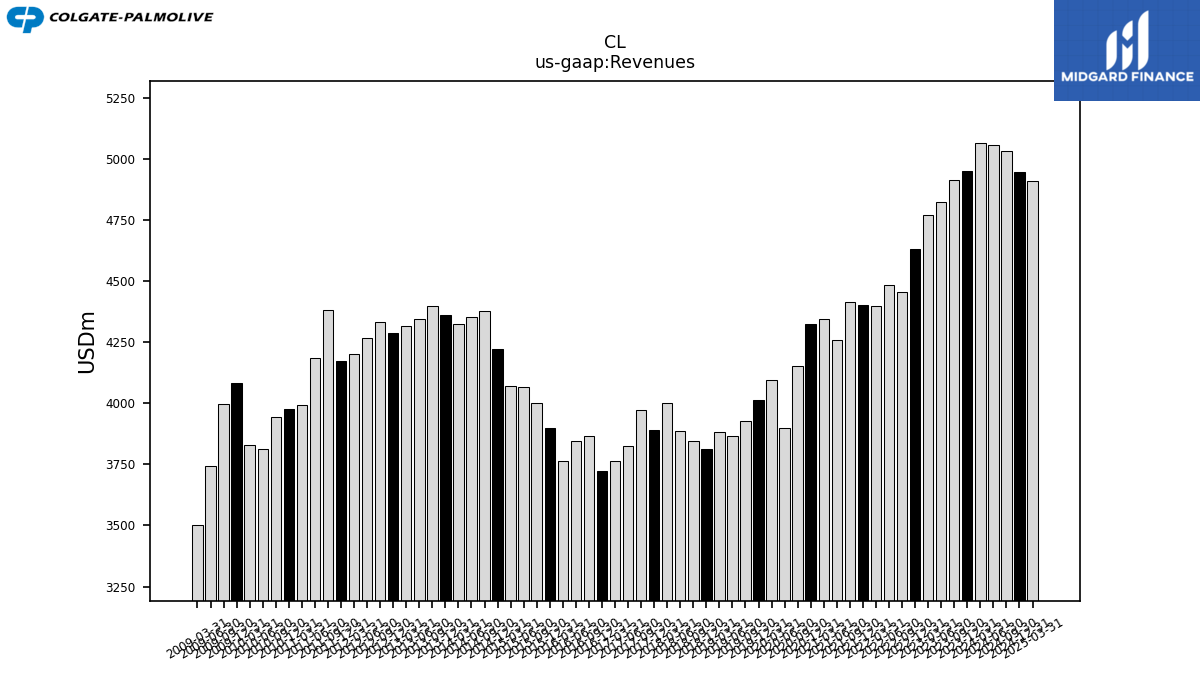 |
CL | 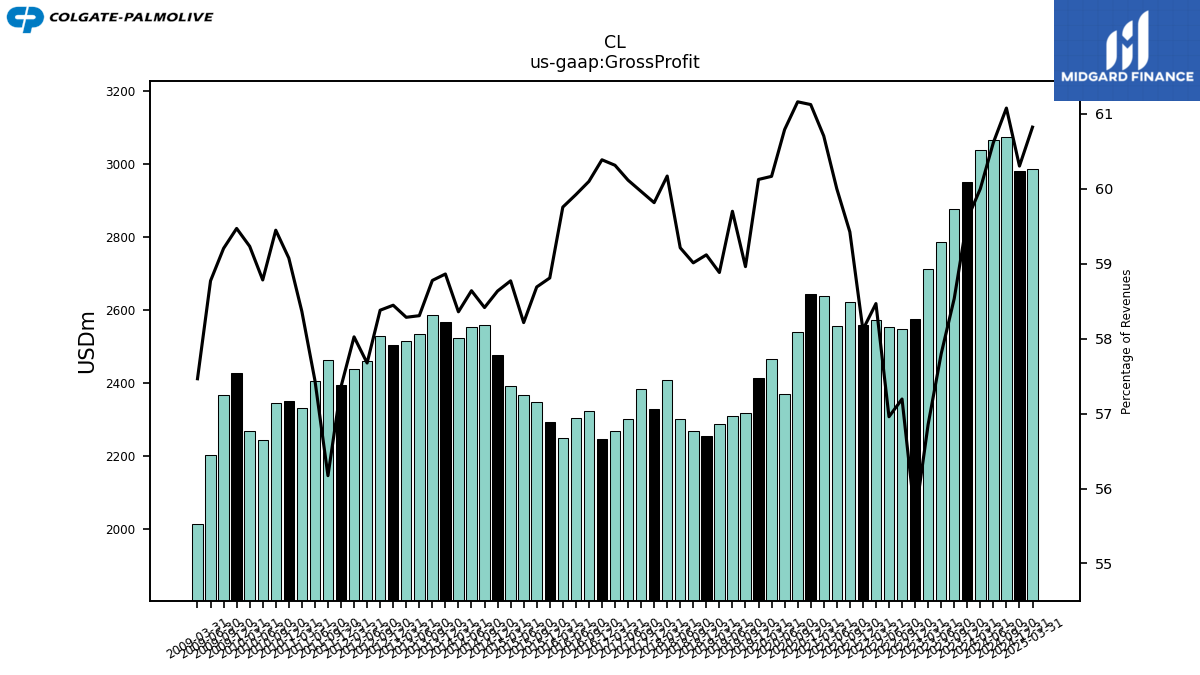 |
 |
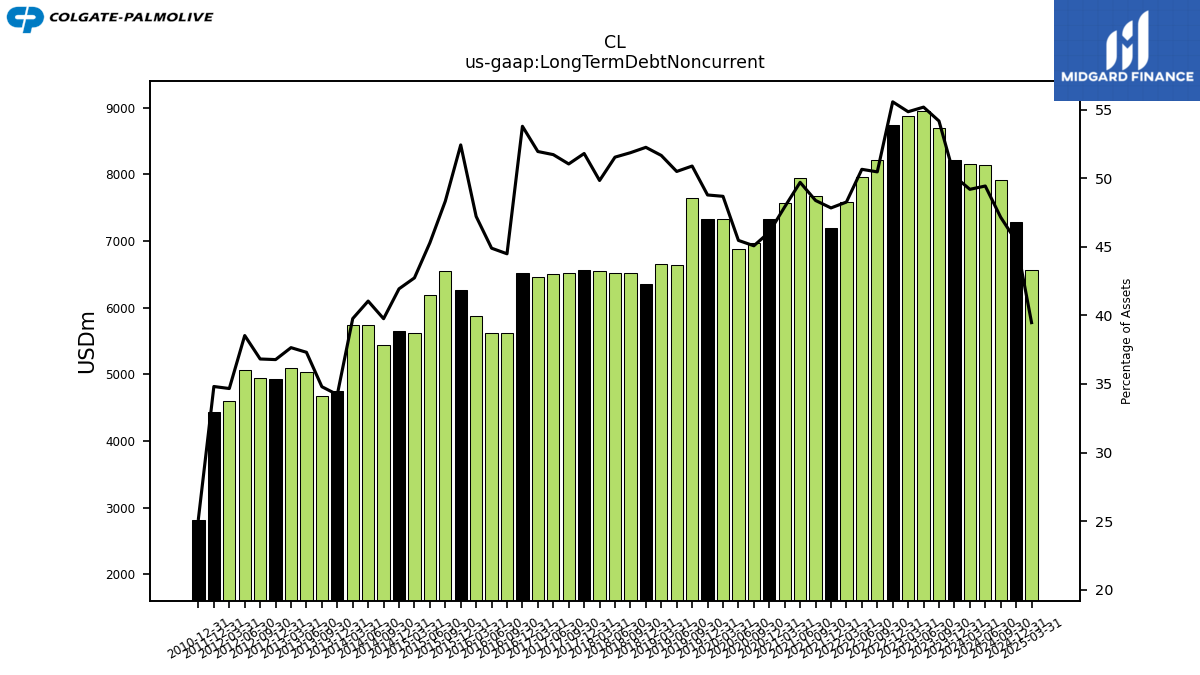 |
CL | 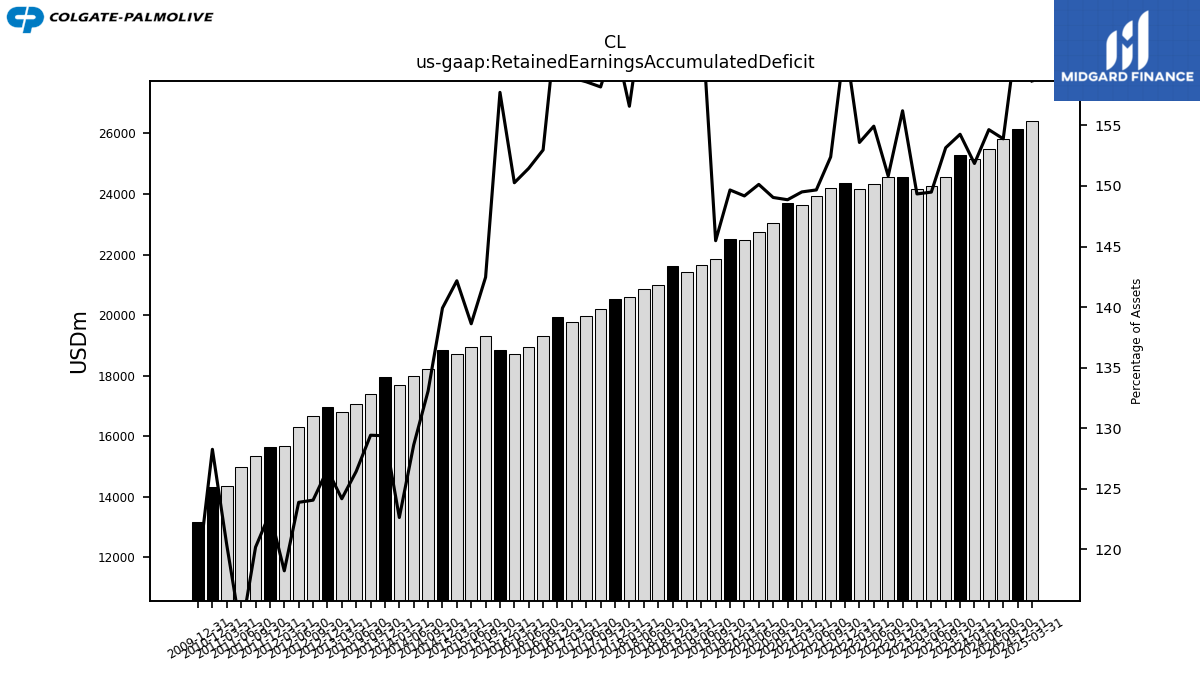 |
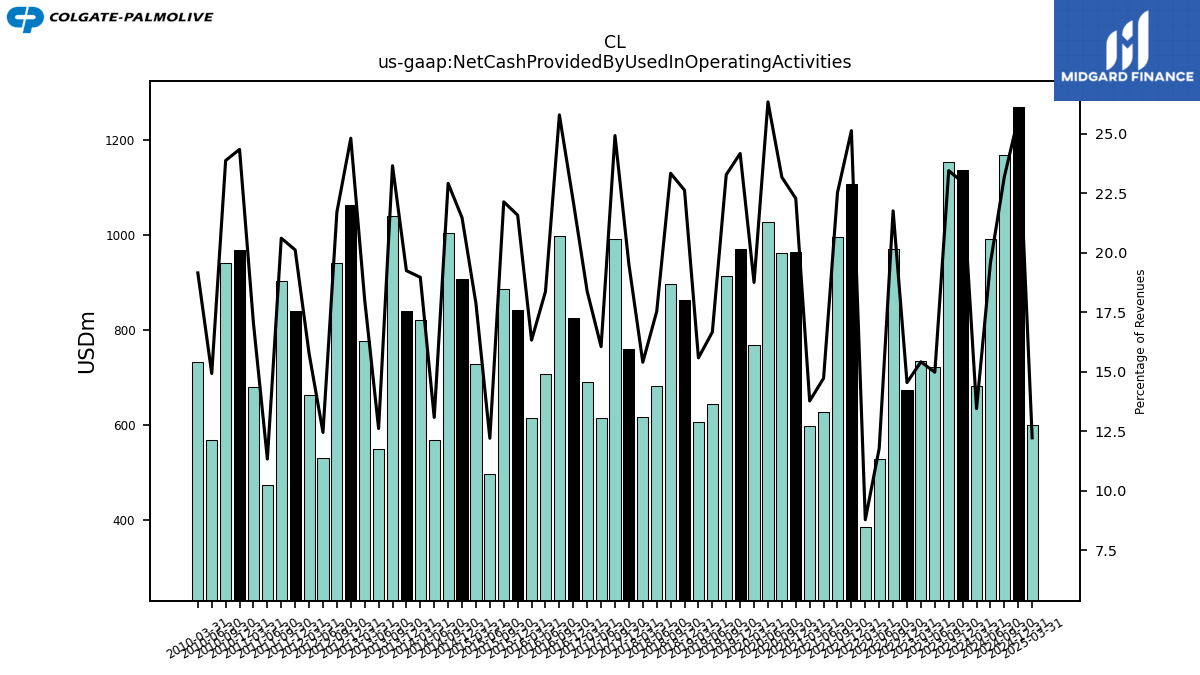 |
CL | 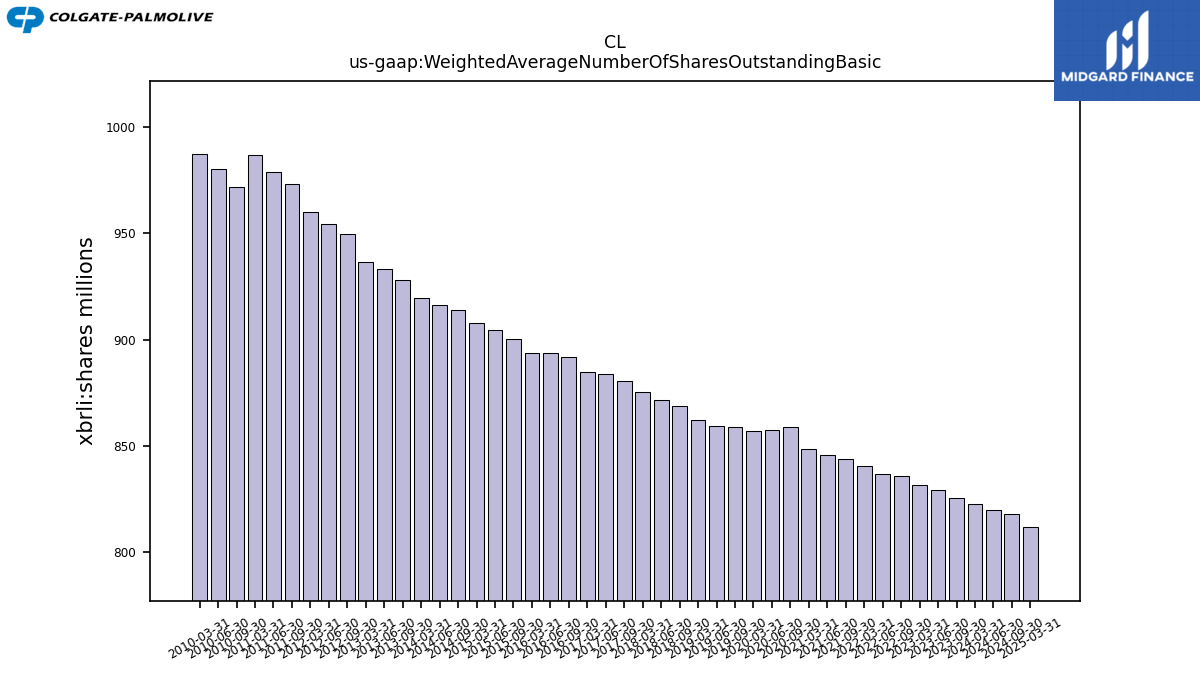 |
 |
CL | |||||
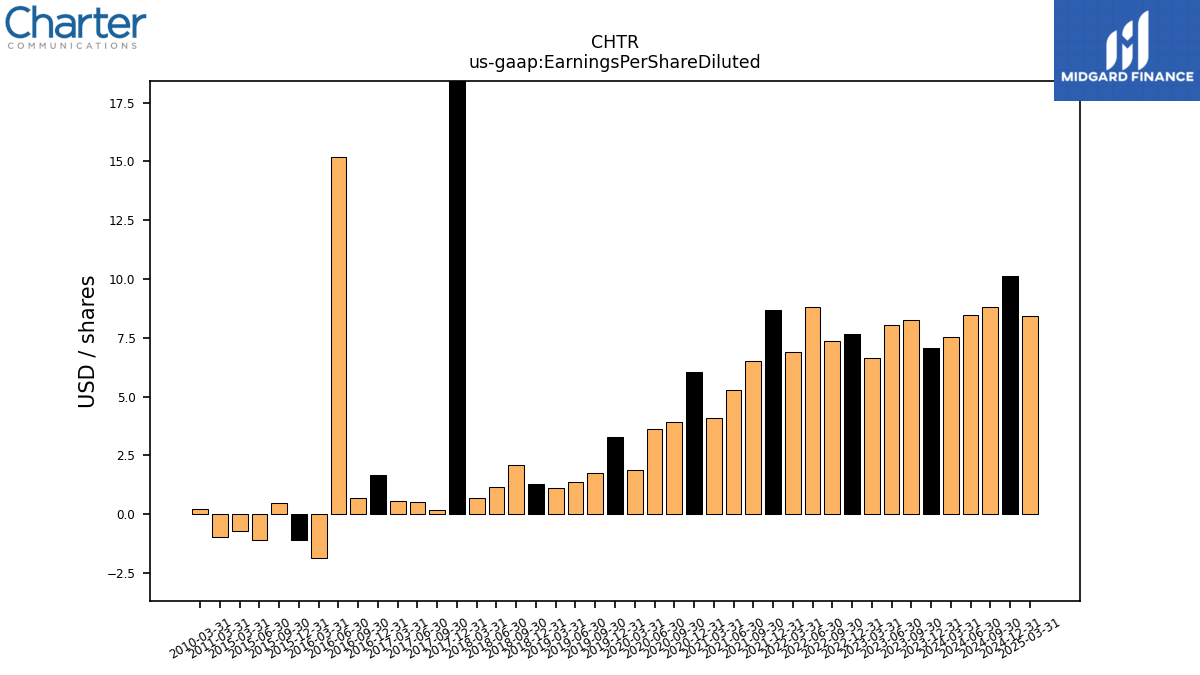
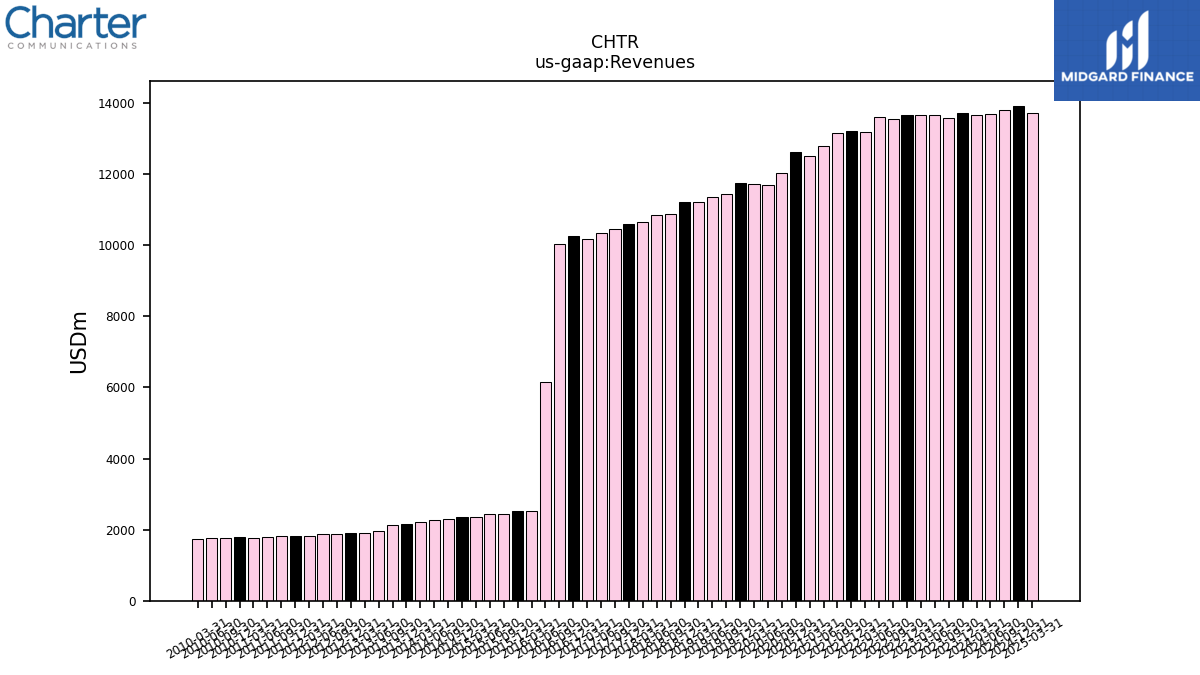
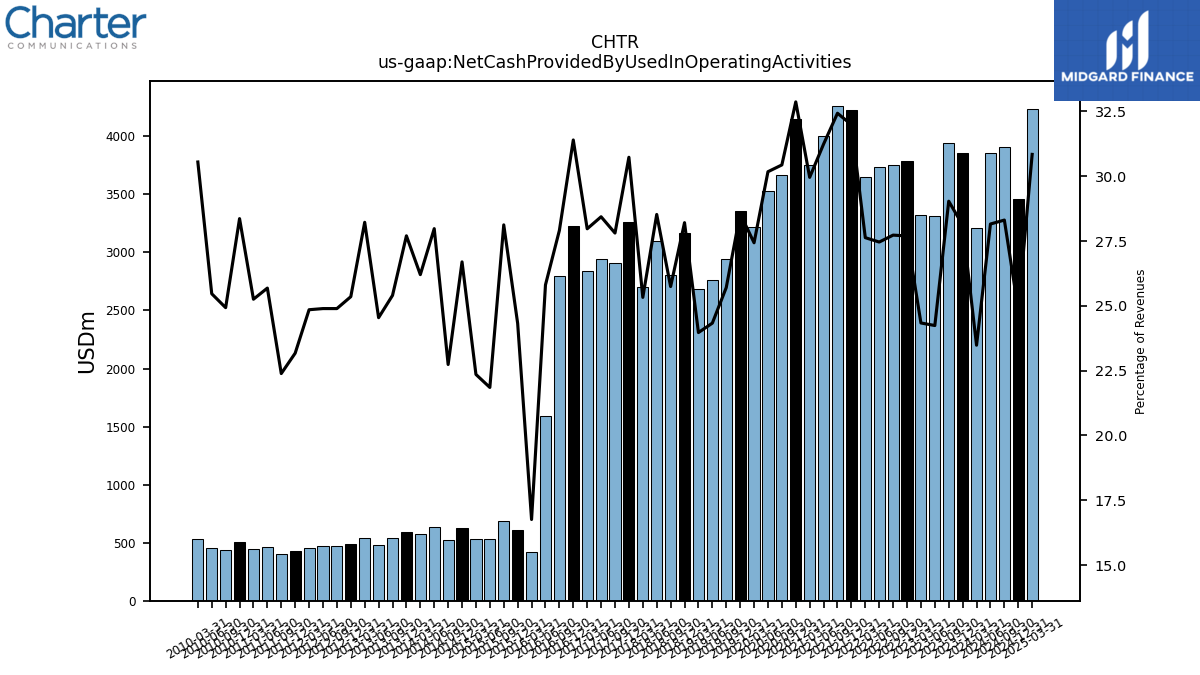
| $CHTR$ | 2025-01-31 | 2025-04-25 | 2025-04-25 | NA | NA | CHTR | 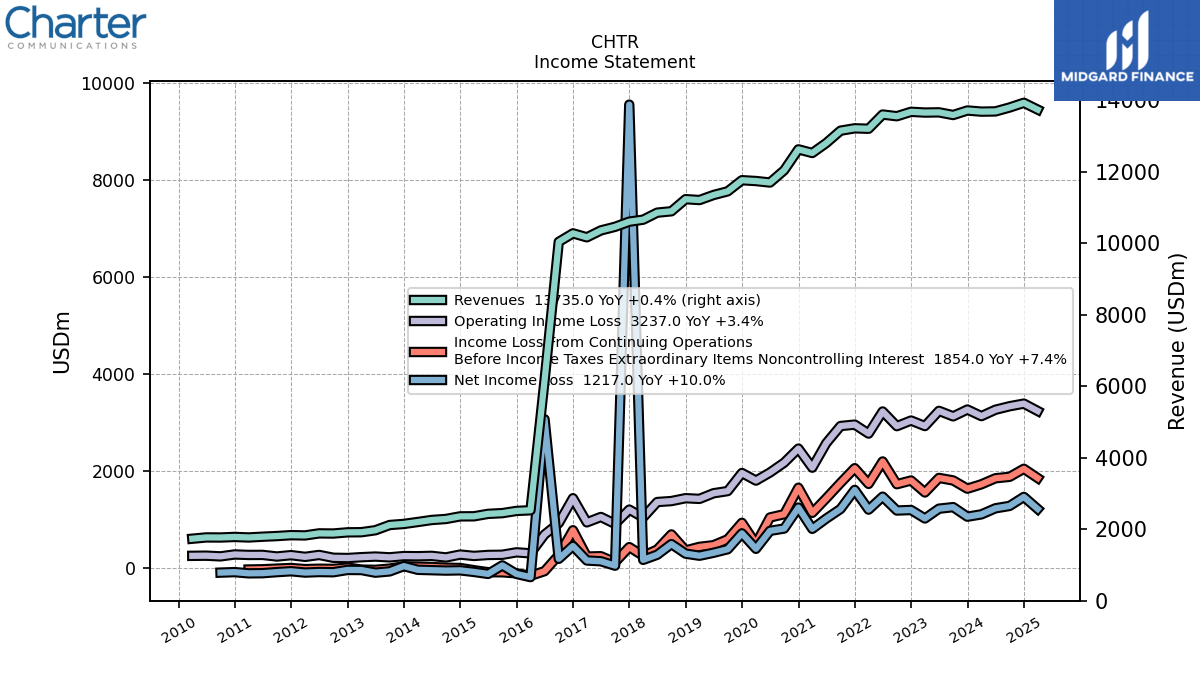 |
 |
 |
CHTR | 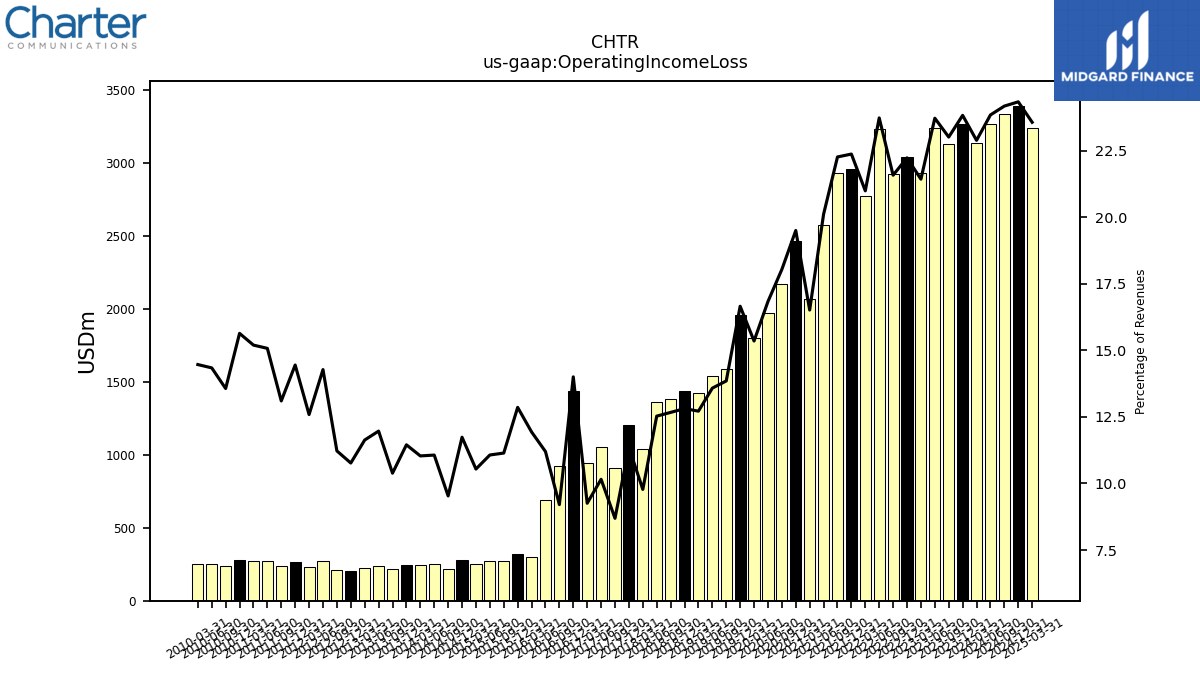 |
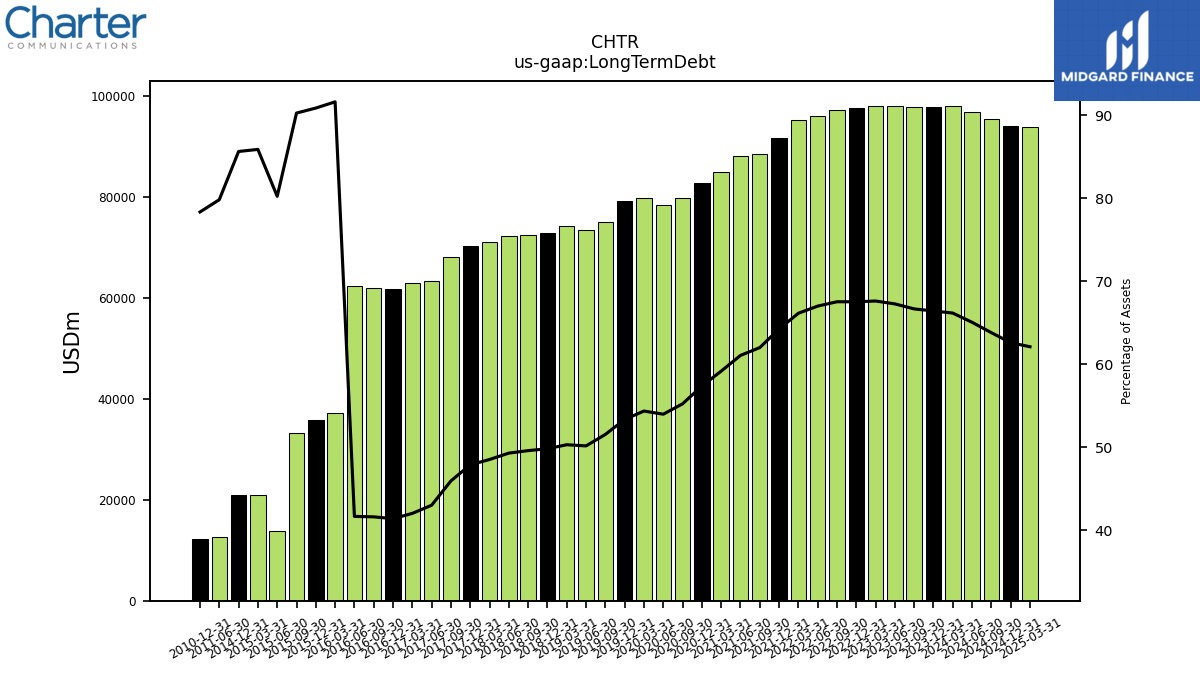 |
CHTR | 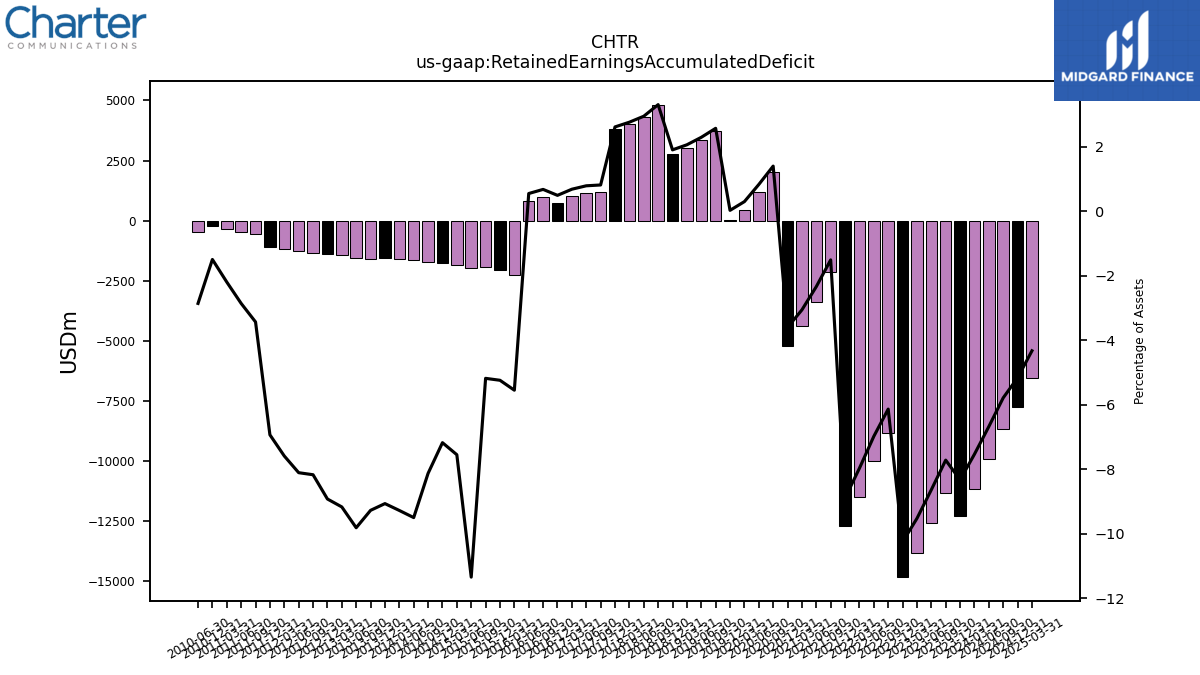 |
 |
CHTR | 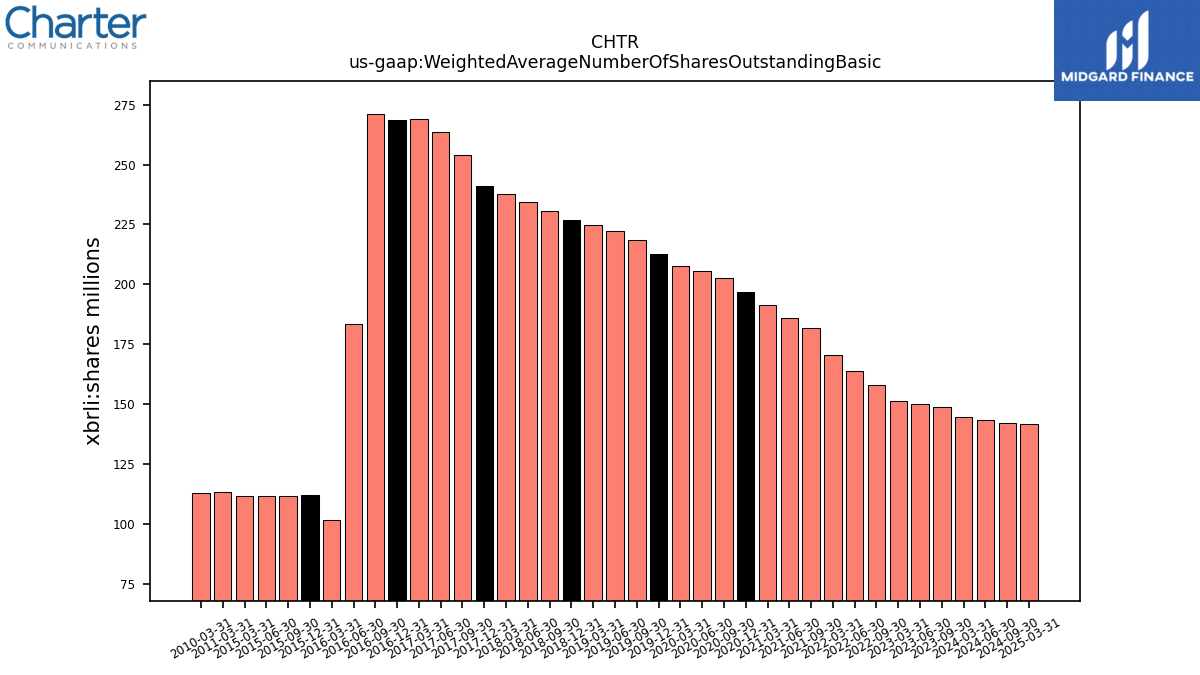 |
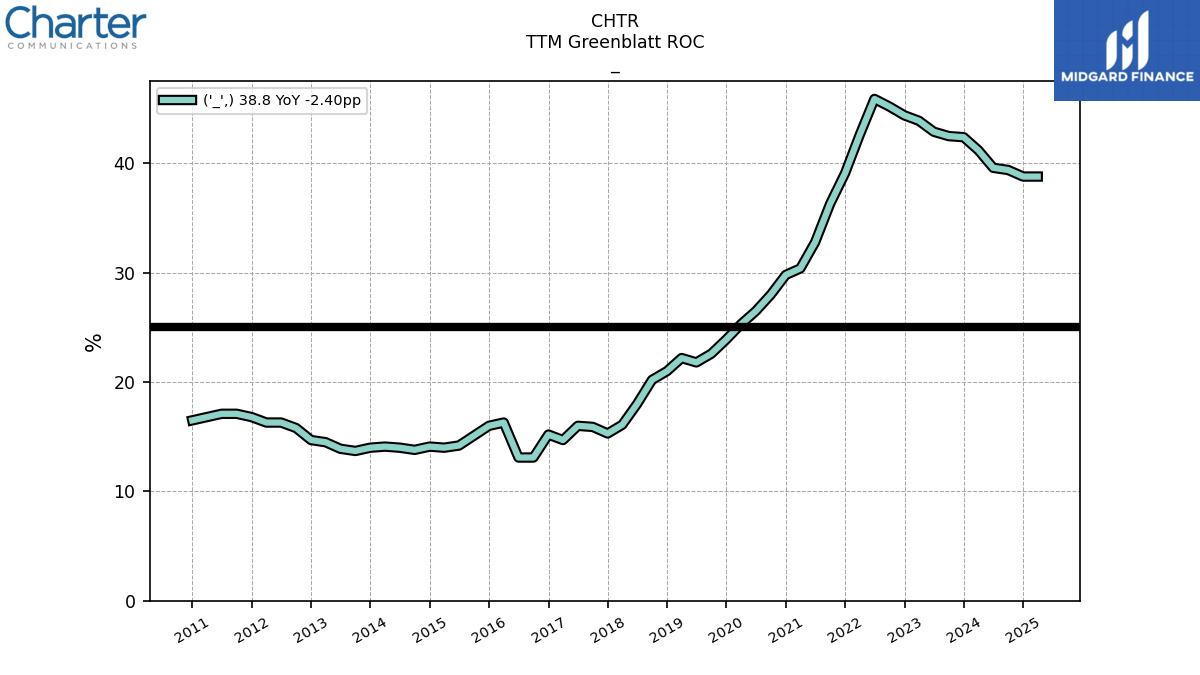 |
CHTR | ||||||
| Ticker | 10K | 10Q | 8K | Sector | Industry | Logo | Forward P/E | Revenue Growth | Ticker | Income | EPS | Revenues | Ticker | GrossProfit | OperatingIncome | LongTermDebt | Ticker | InterestExpense | RetainedEarnnings | CashFlowOperating | Ticker | Dividends | SharesOutstanding | TTMGreenblattROC | |
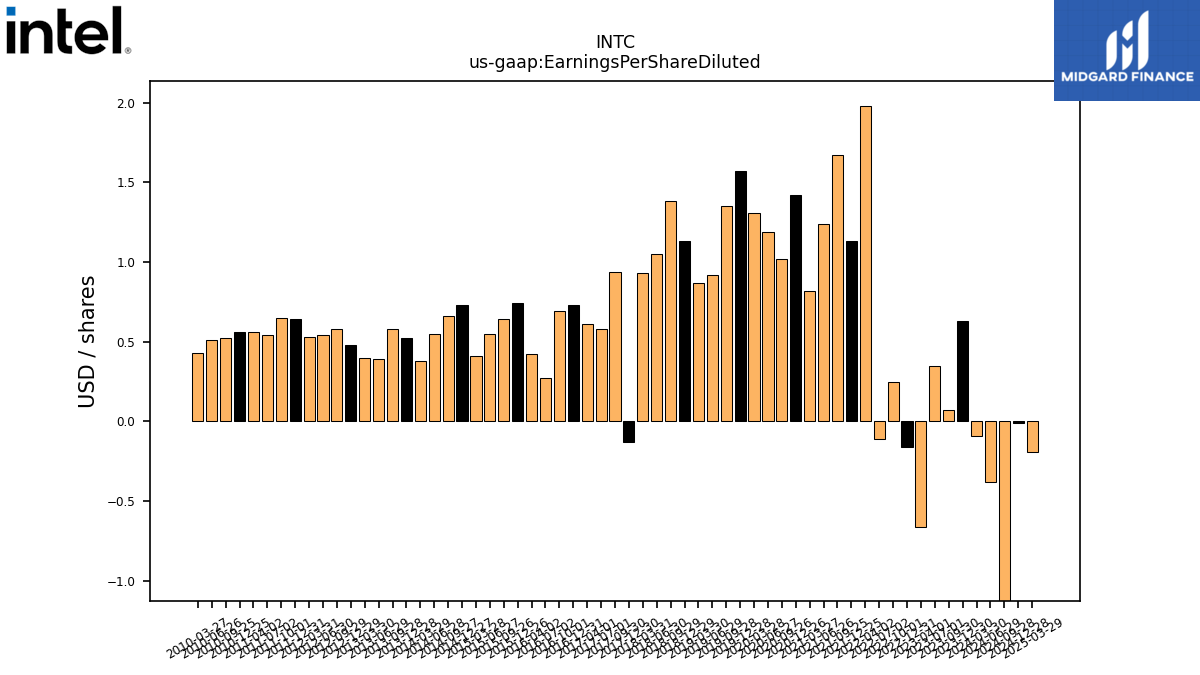
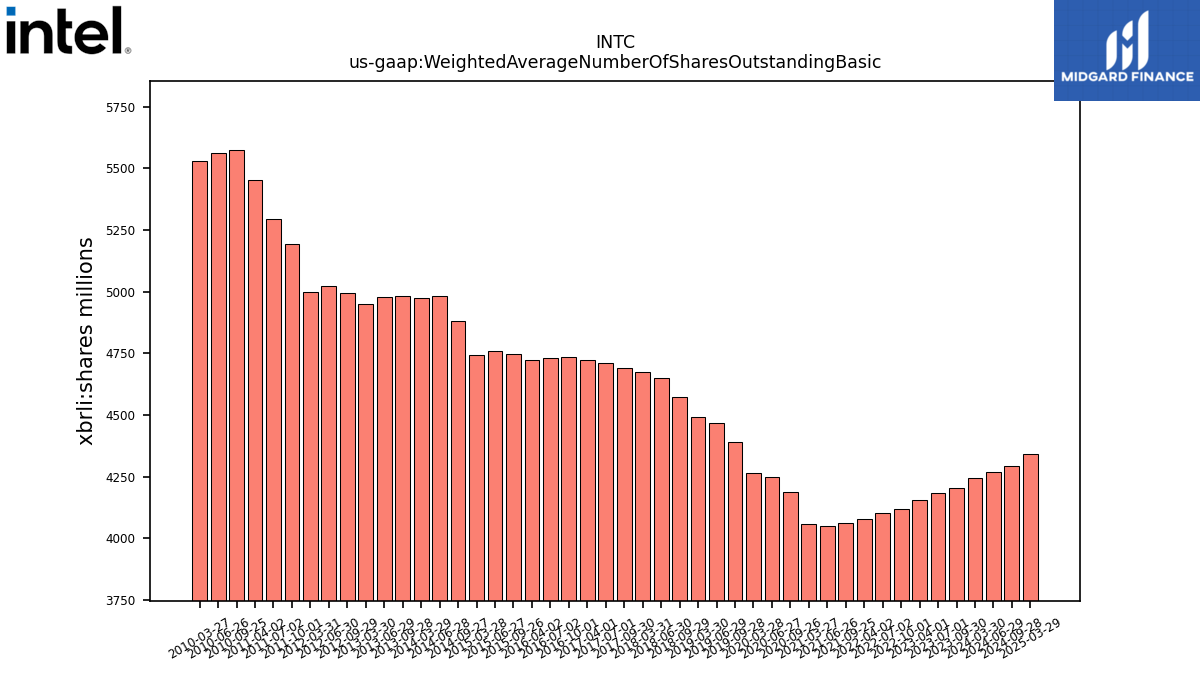
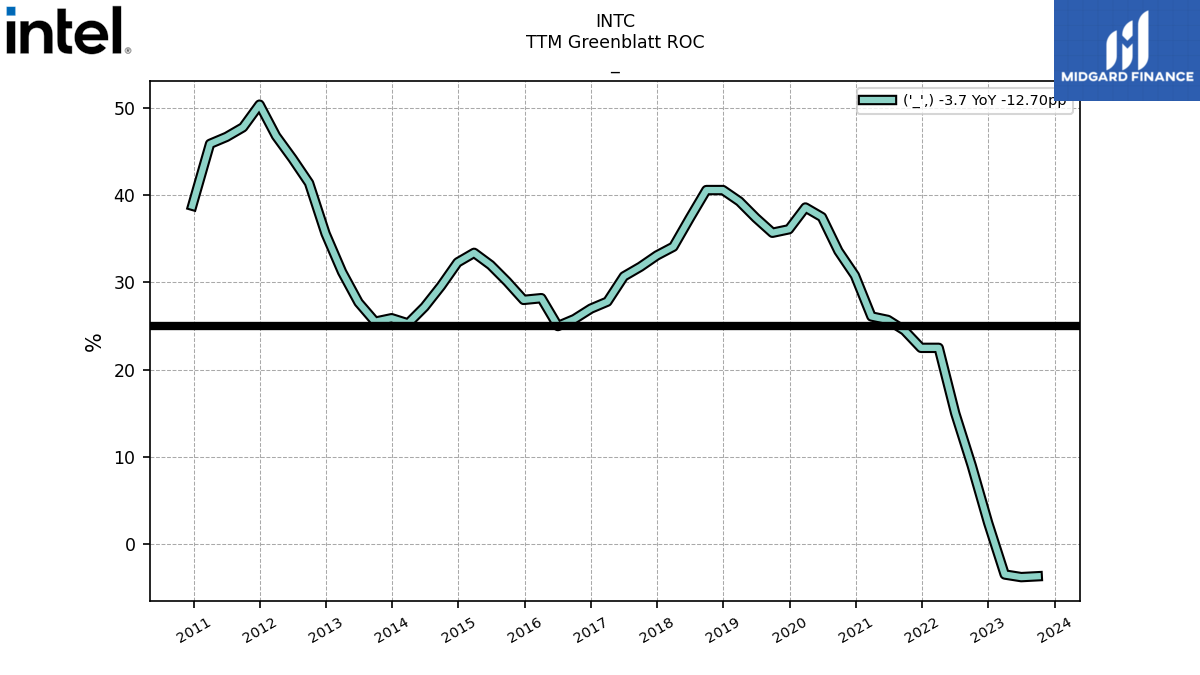
| $INTC$ | 2025-01-31 | 2025-04-25 | 2025-04-24 | NA | NA | INTC | 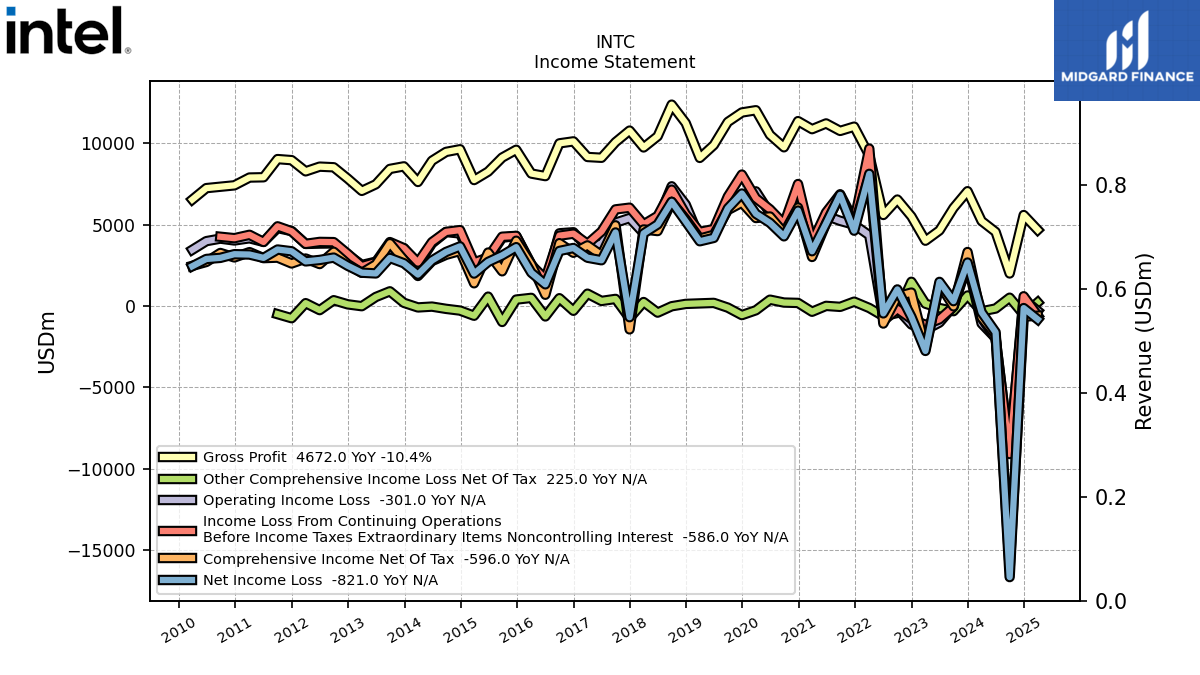 |
 |
 |
INTC |  |
 |
 |
INTC |  |
 |
 |
INTC |  |
 |
 |
INTC | |||
| $GOOGL$ | 2025-02-05 | 2025-04-25 | 2025-04-24 | NA | NA | GOOGL | GOOGL | GOOGL | GOOGL | 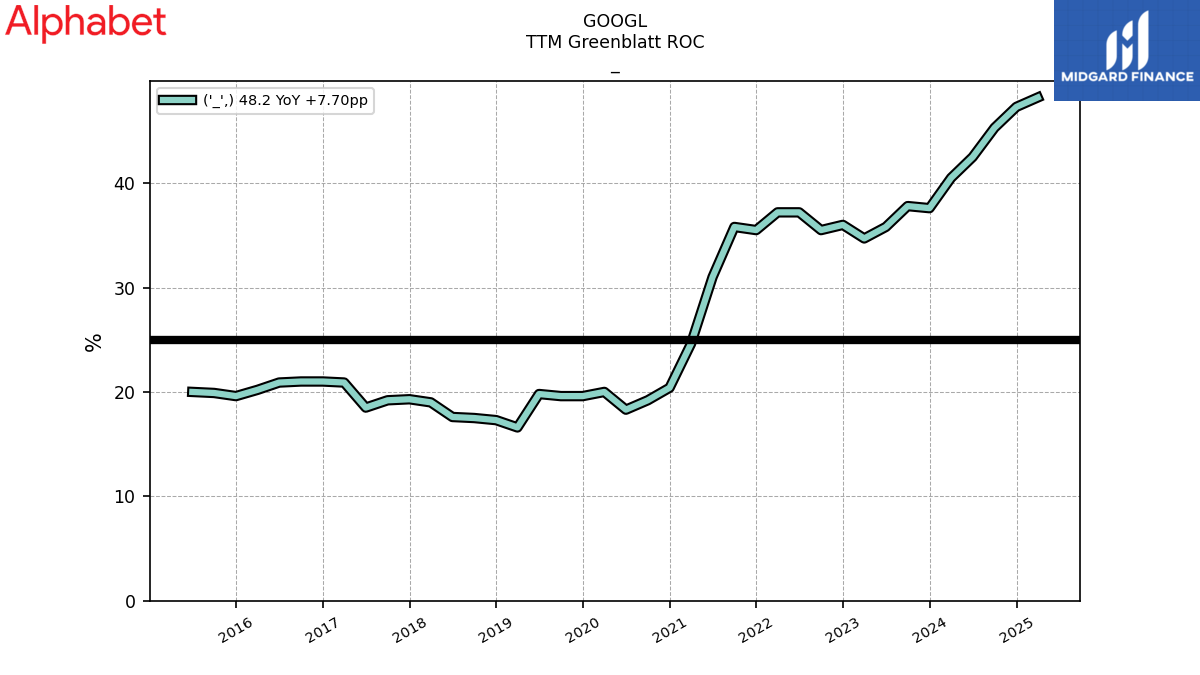 |
GOOGL | ||||||||||||||
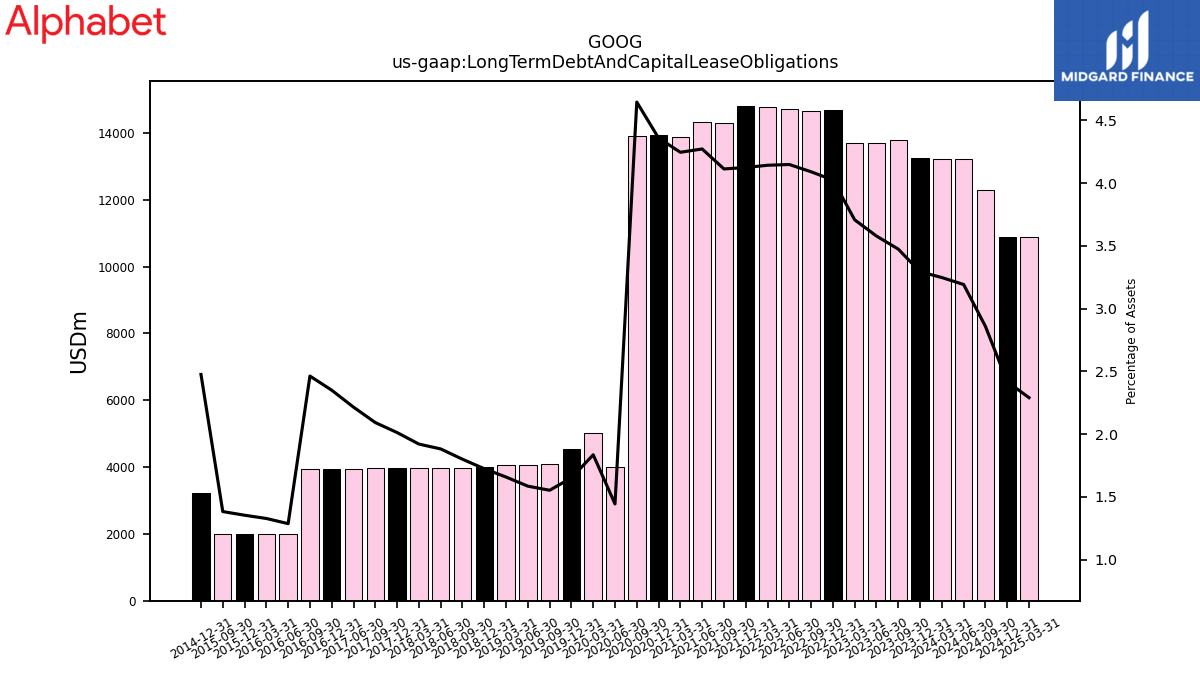
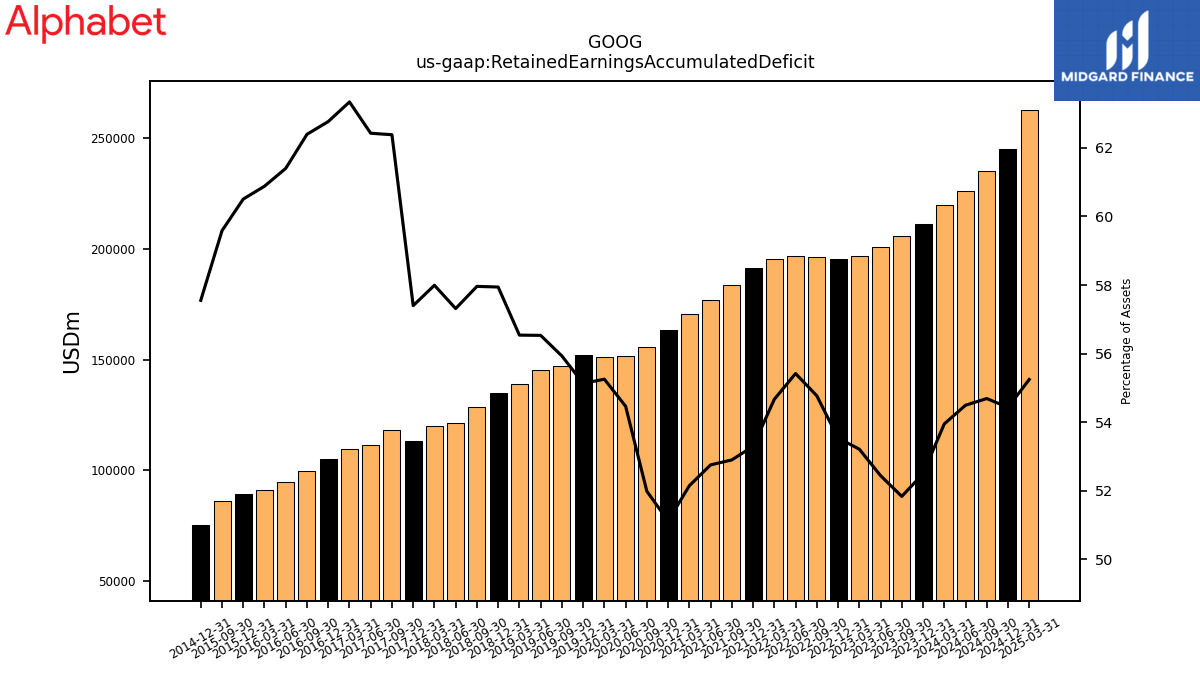
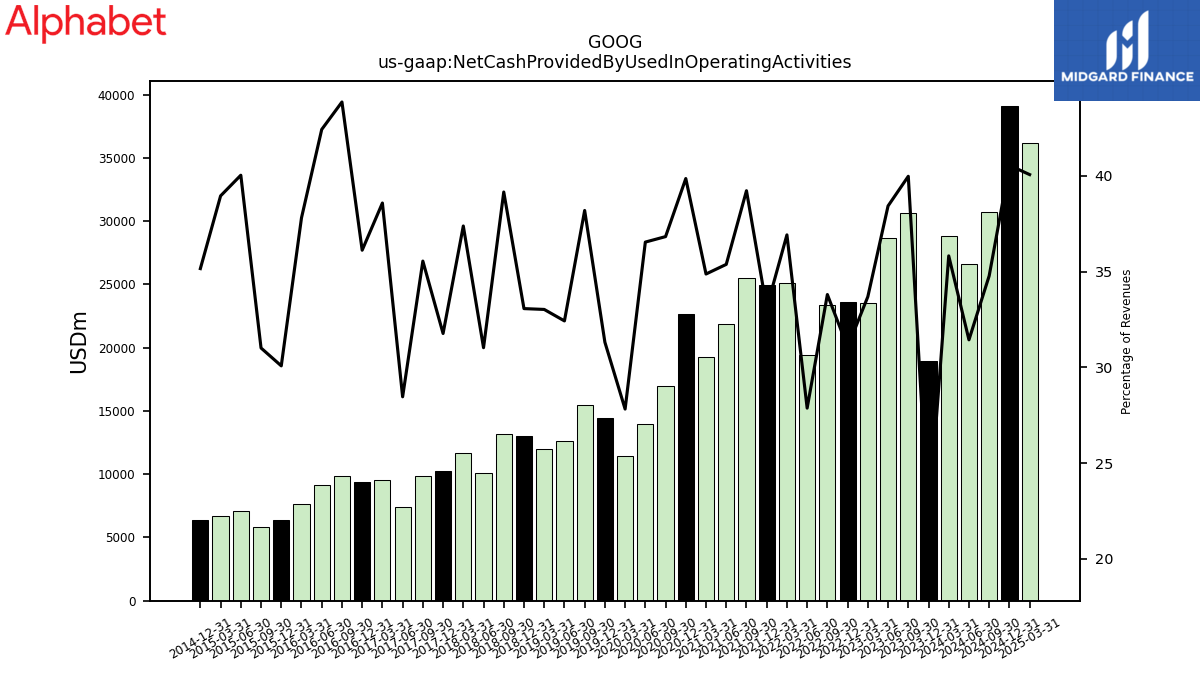
| $GOOG$ | 2025-02-05 | 2025-04-25 | 2025-04-24 | NA | NA | GOOG | 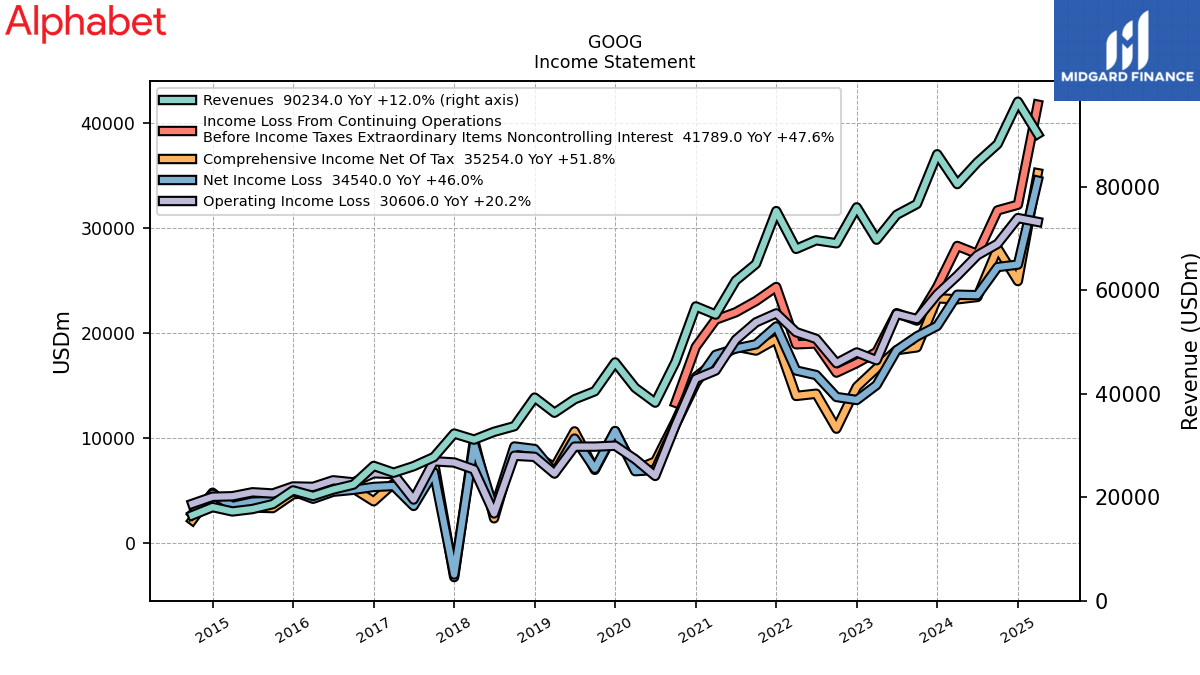 |
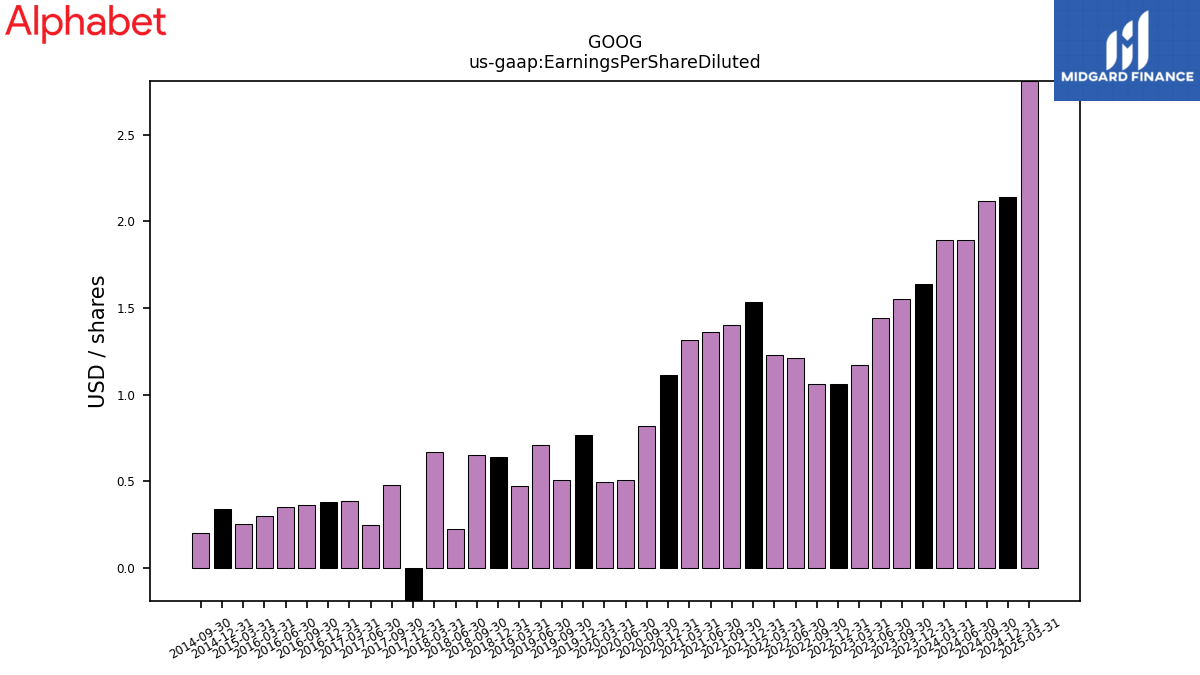 |
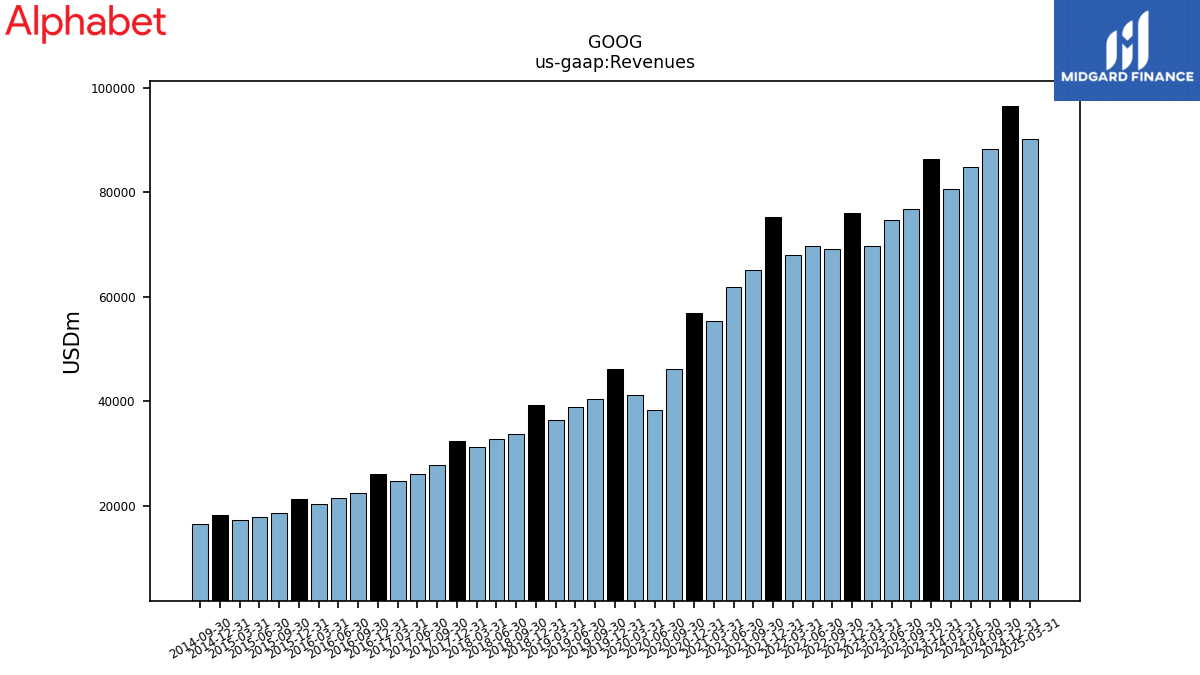 |
GOOG | 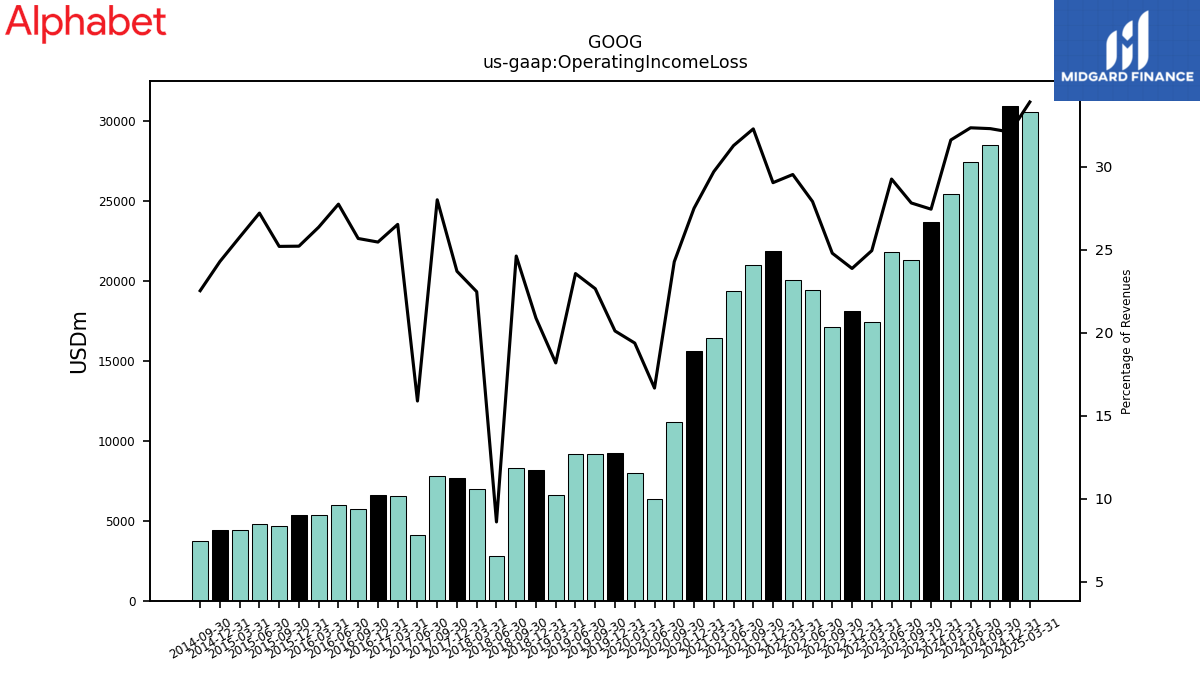 |
 |
GOOG | 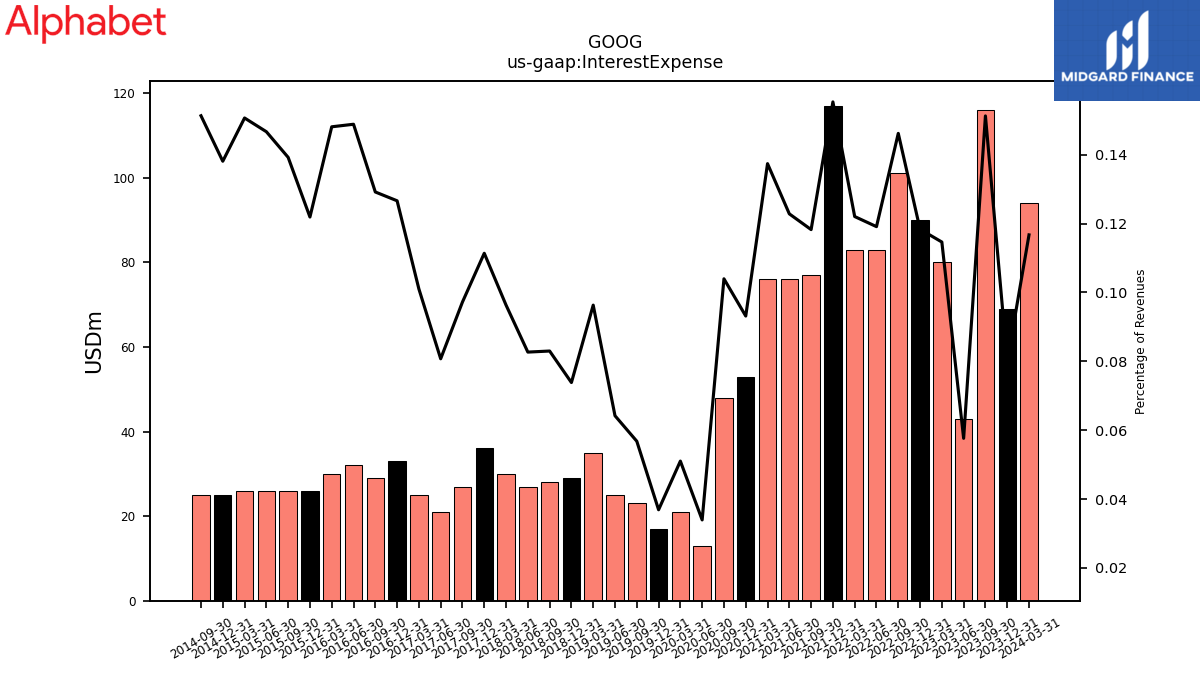 |
 |
 |
GOOG |  |
GOOG | ||||||
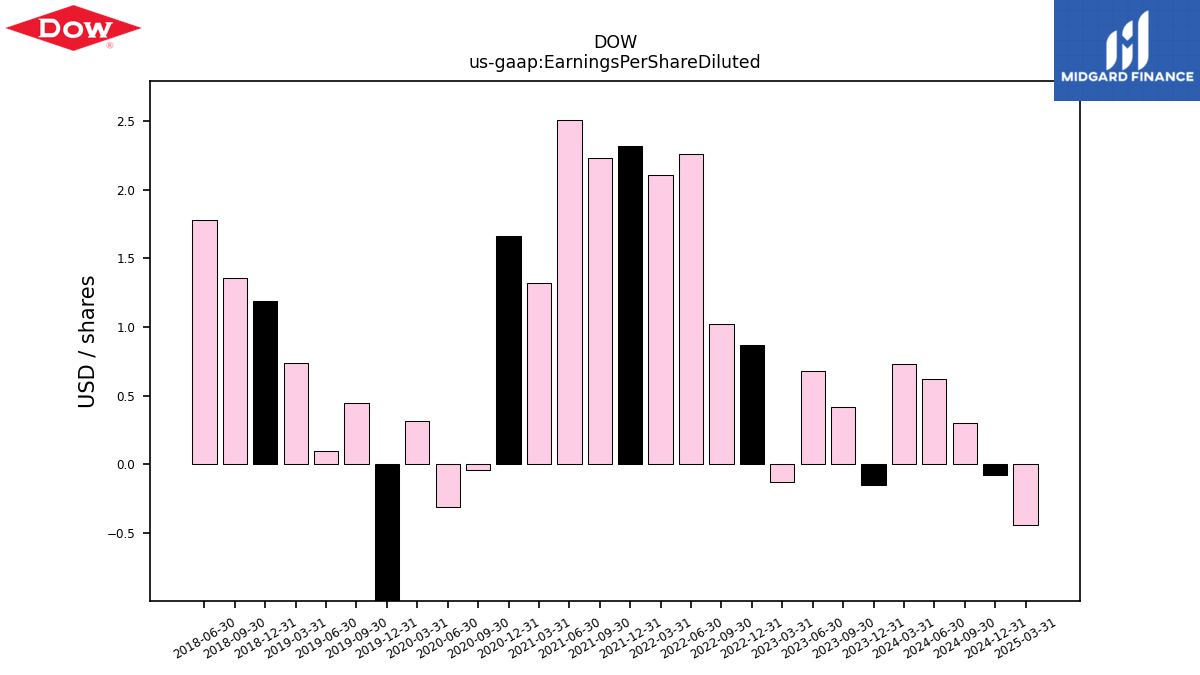
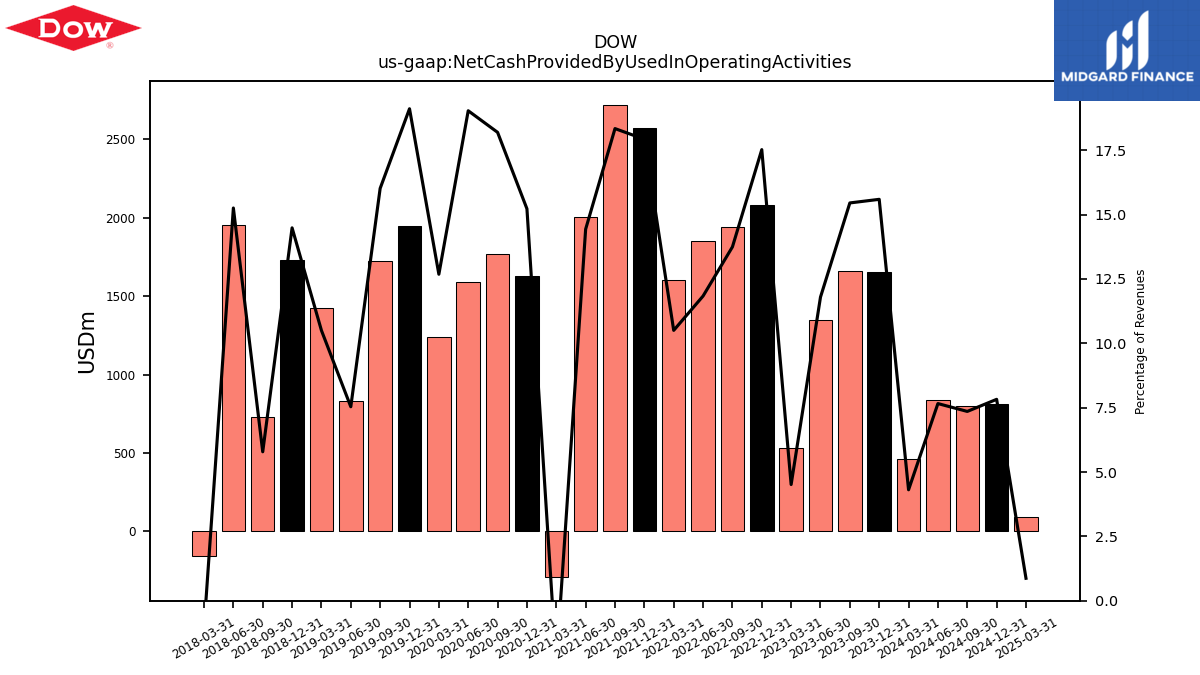
| $DOW$ | 2025-02-04 | 2025-04-25 | 2025-04-24 | NA | NA | DOW | 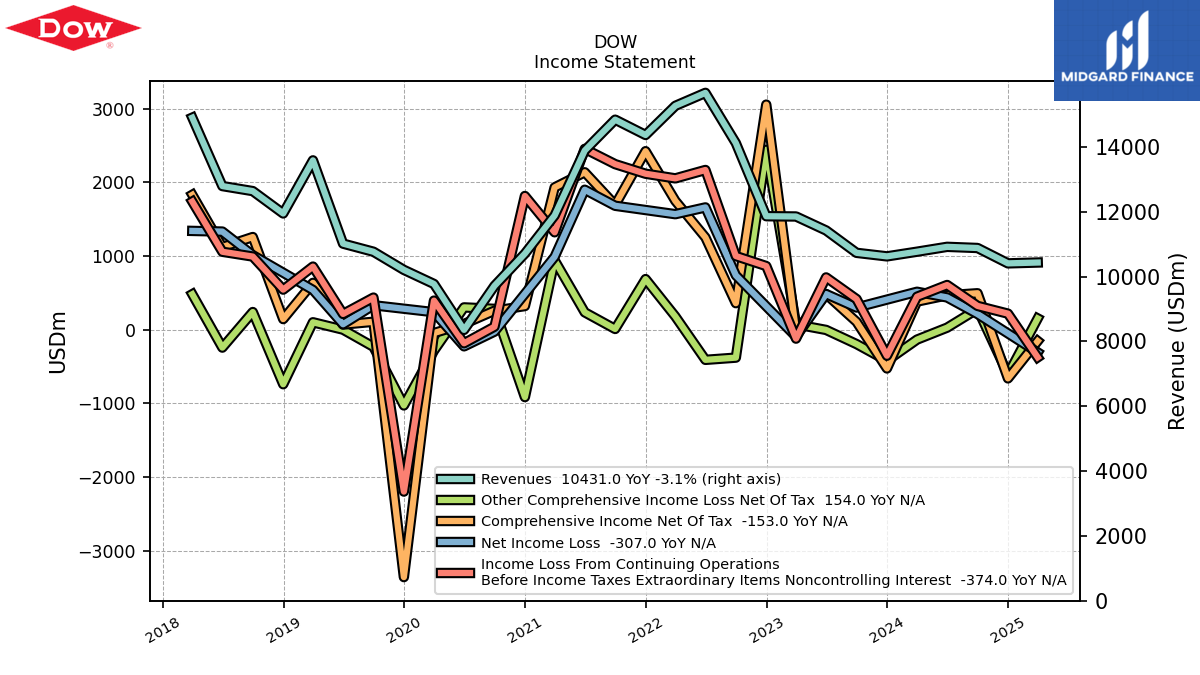 |
 |
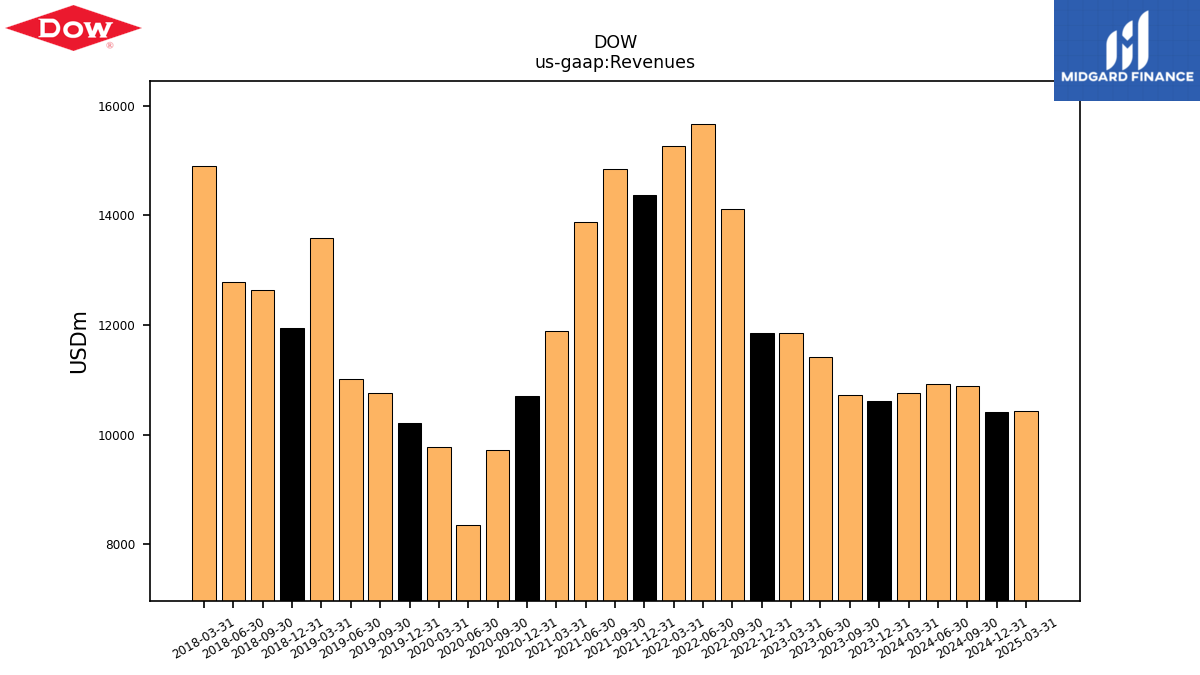 |
DOW | 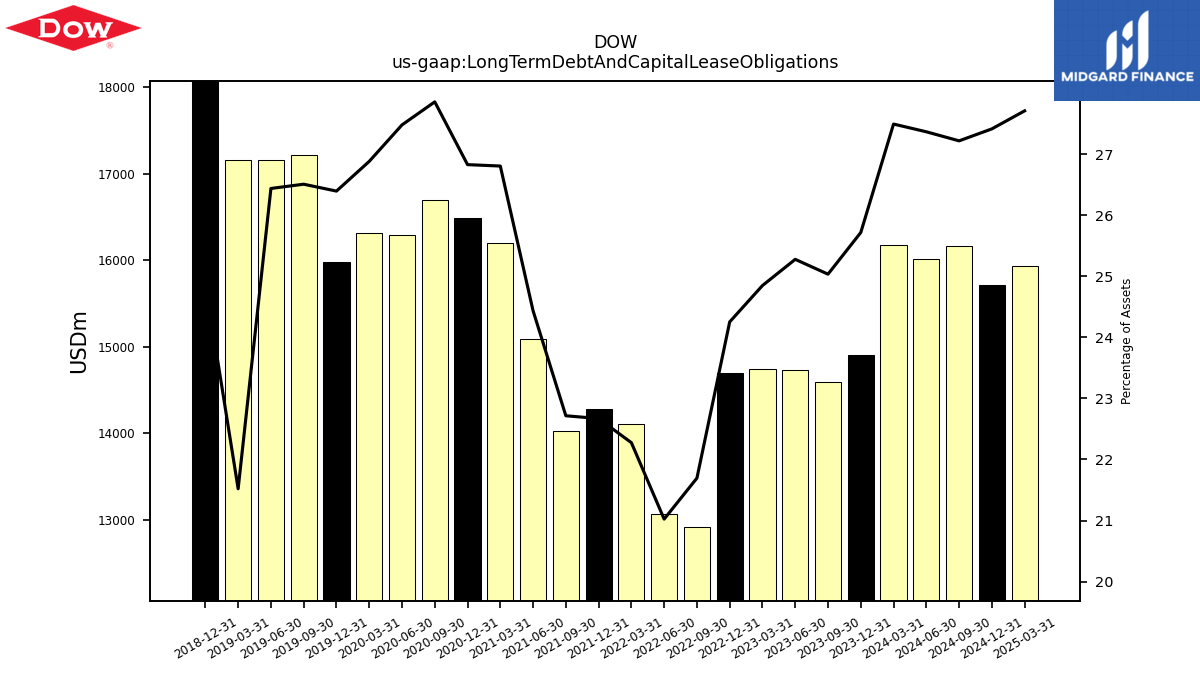 |
DOW | 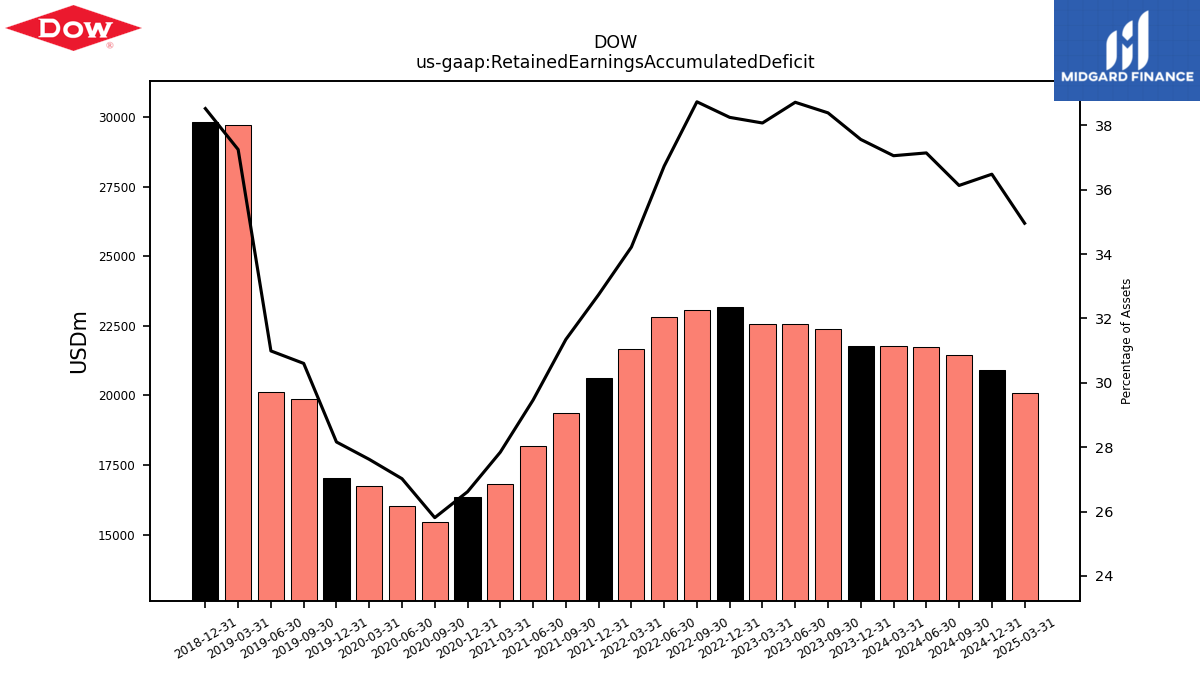 |
 |
DOW | 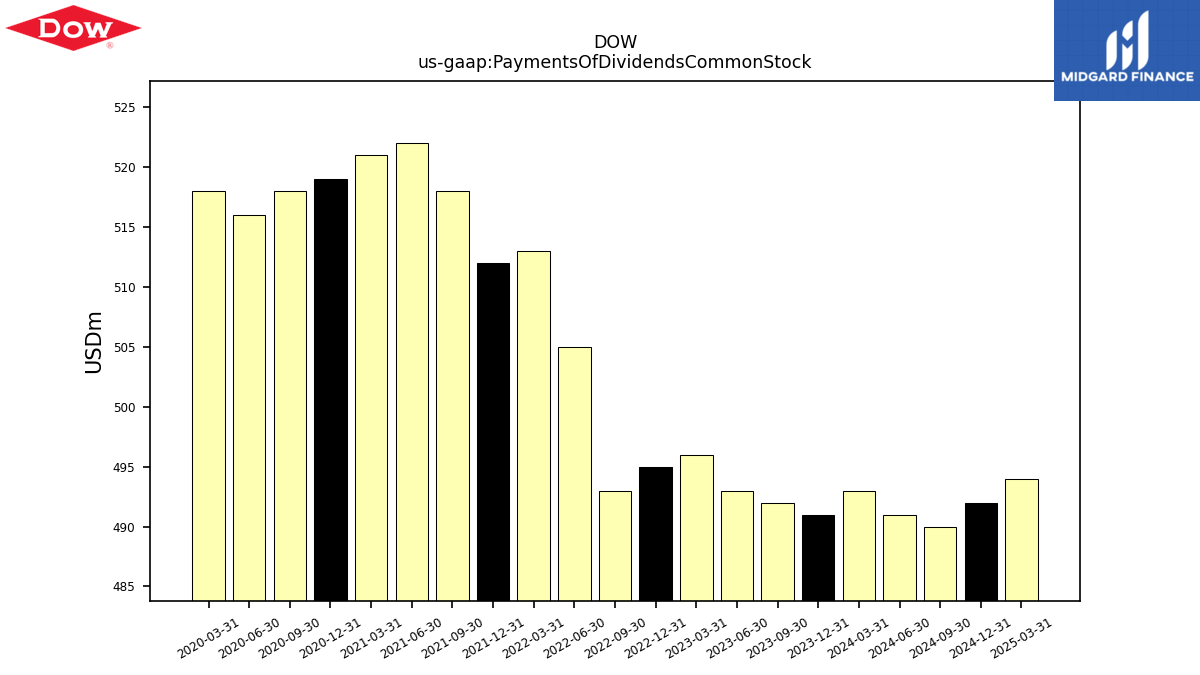 |
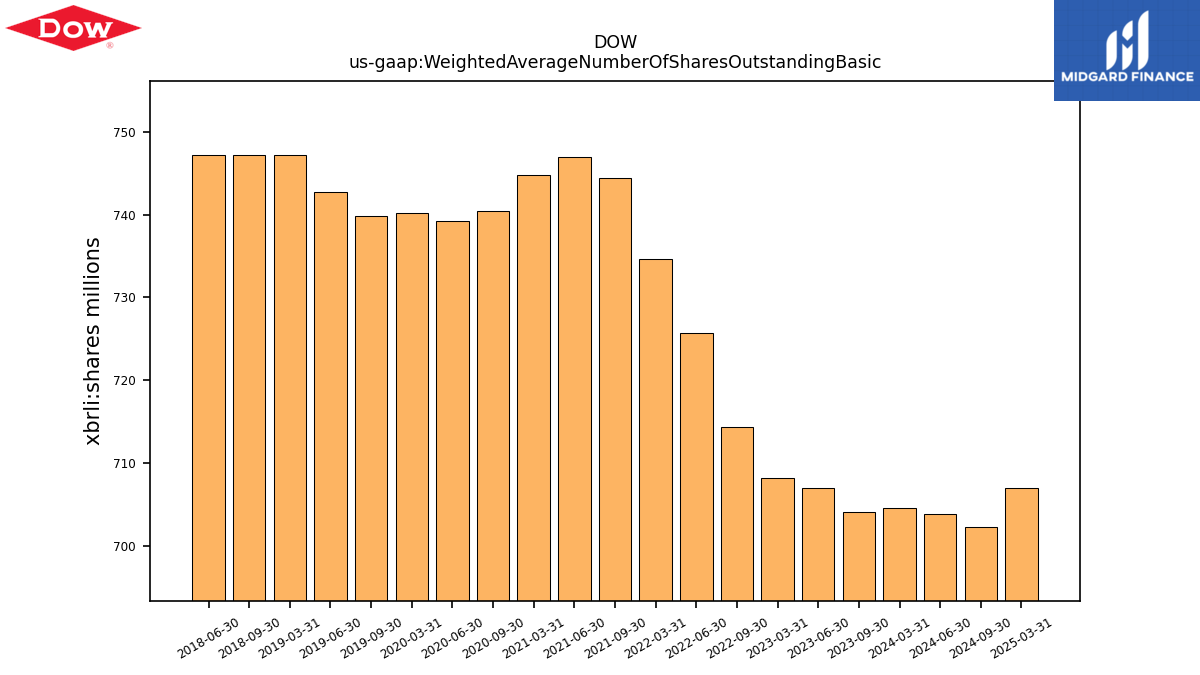 |
DOW | |||||||
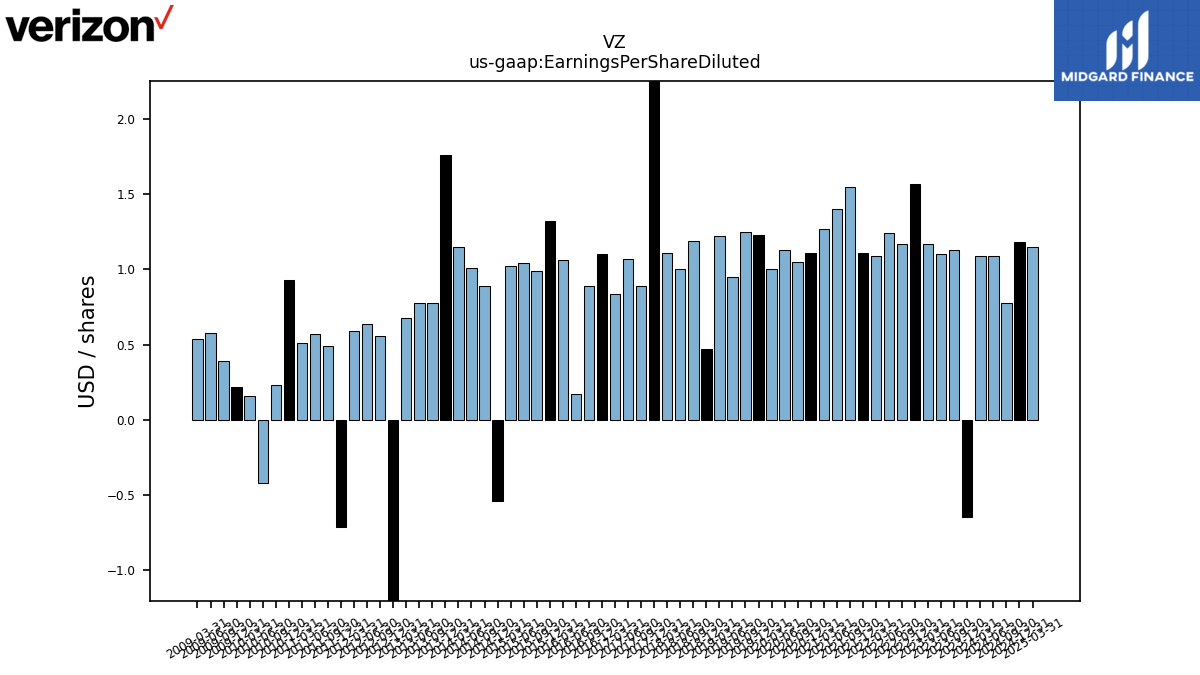
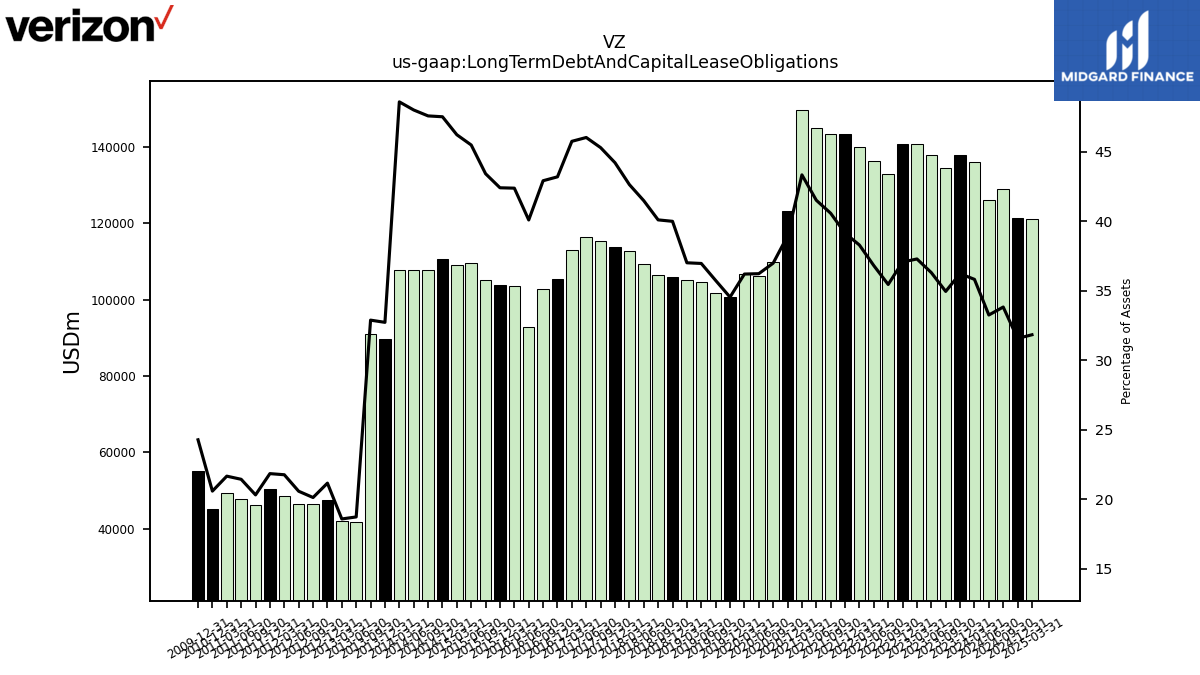
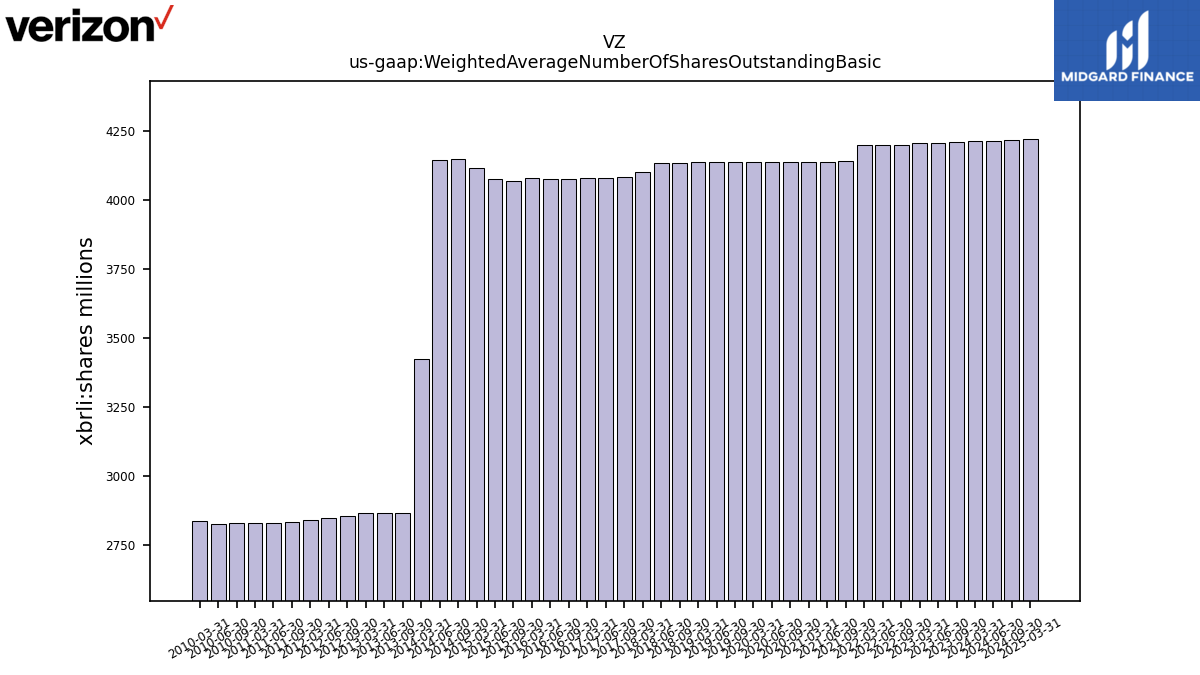
| $VZ$ | 2025-02-12 | 2025-04-25 | 2025-04-22 | NA | NA | VZ | 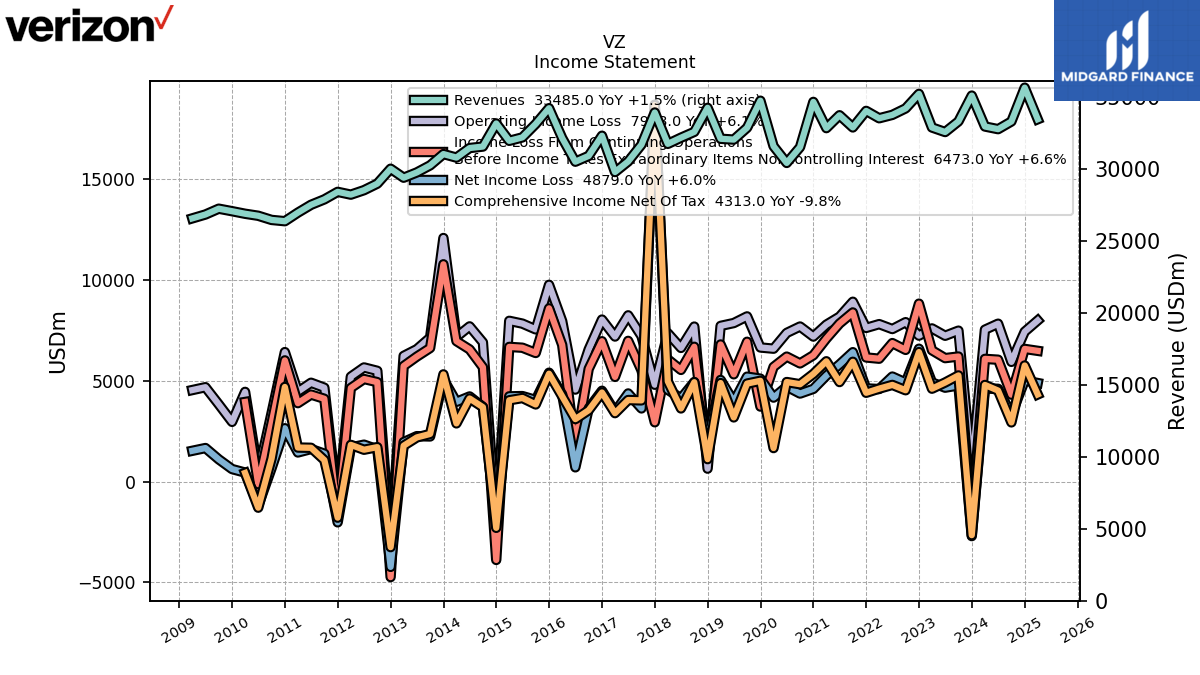 |
 |
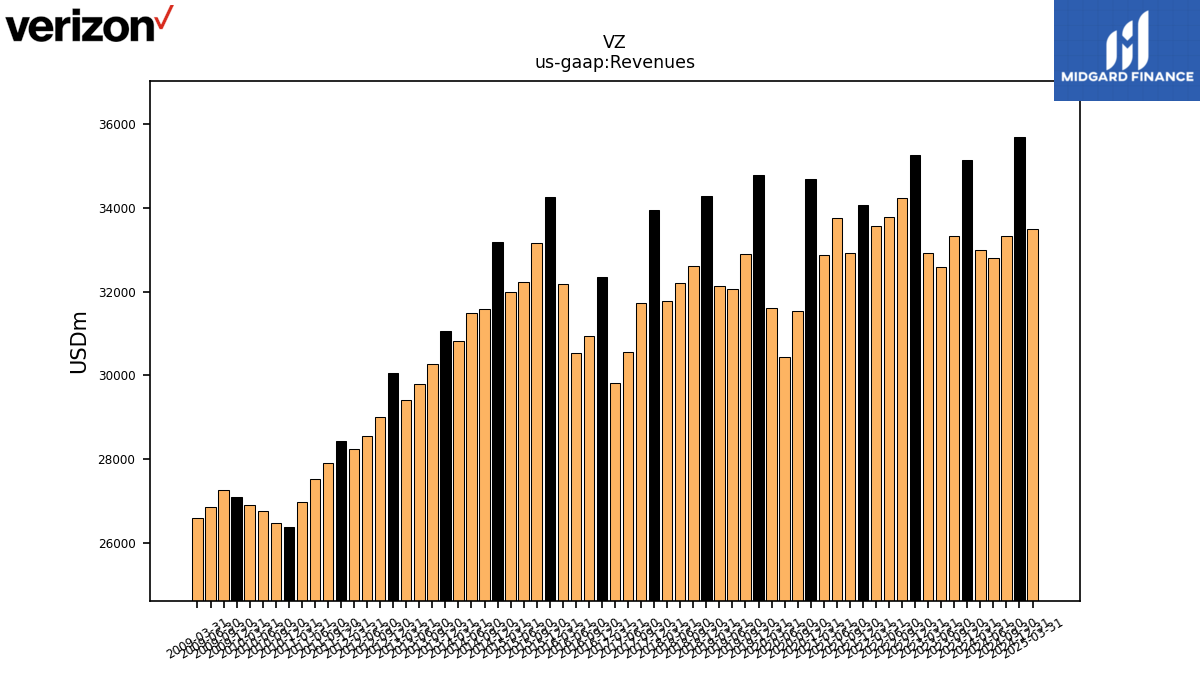 |
VZ | 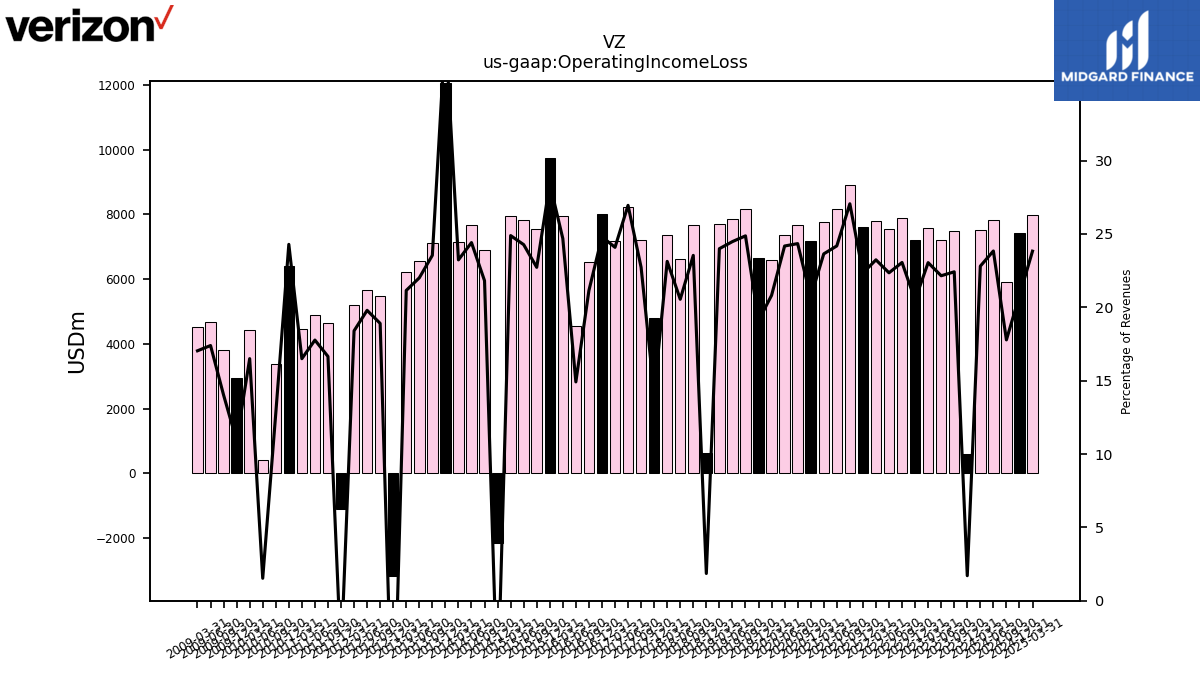 |
 |
VZ |  |
 |
 |
VZ |  |
 |
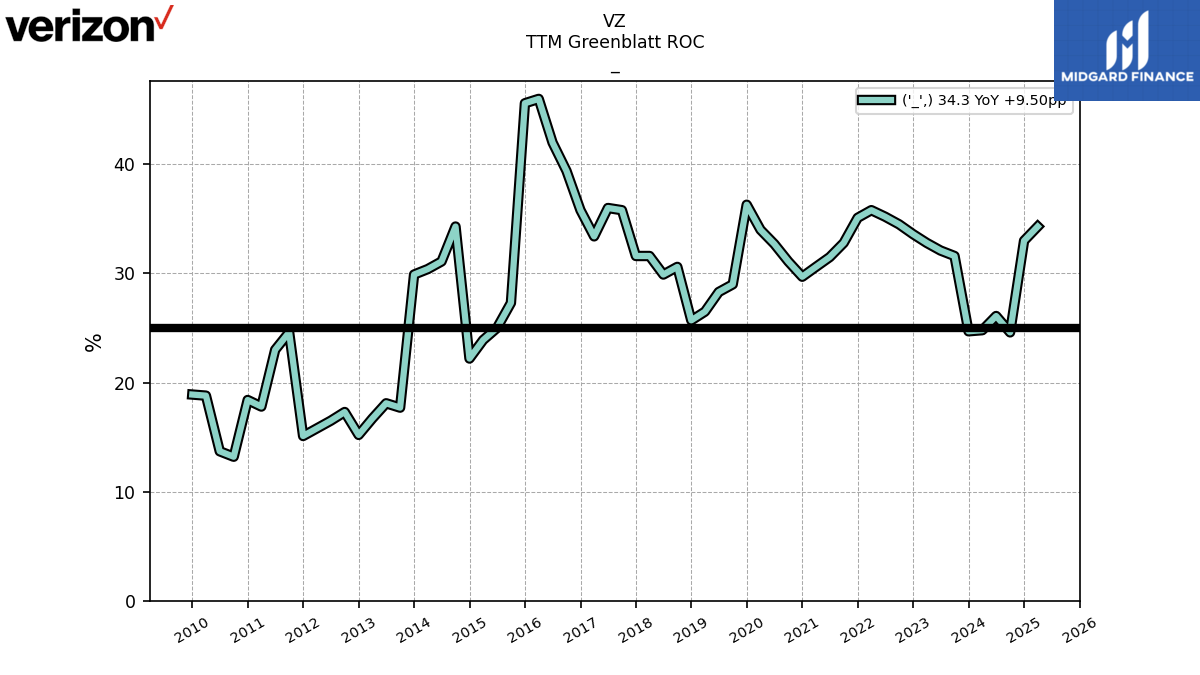 |
VZ | ||||
| Ticker | 10K | 10Q | 8K | Sector | Industry | Logo | Forward P/E | Revenue Growth | Ticker | Income | EPS | Revenues | Ticker | GrossProfit | OperatingIncome | LongTermDebt | Ticker | InterestExpense | RetainedEarnnings | CashFlowOperating | Ticker | Dividends | SharesOutstanding | TTMGreenblattROC | |
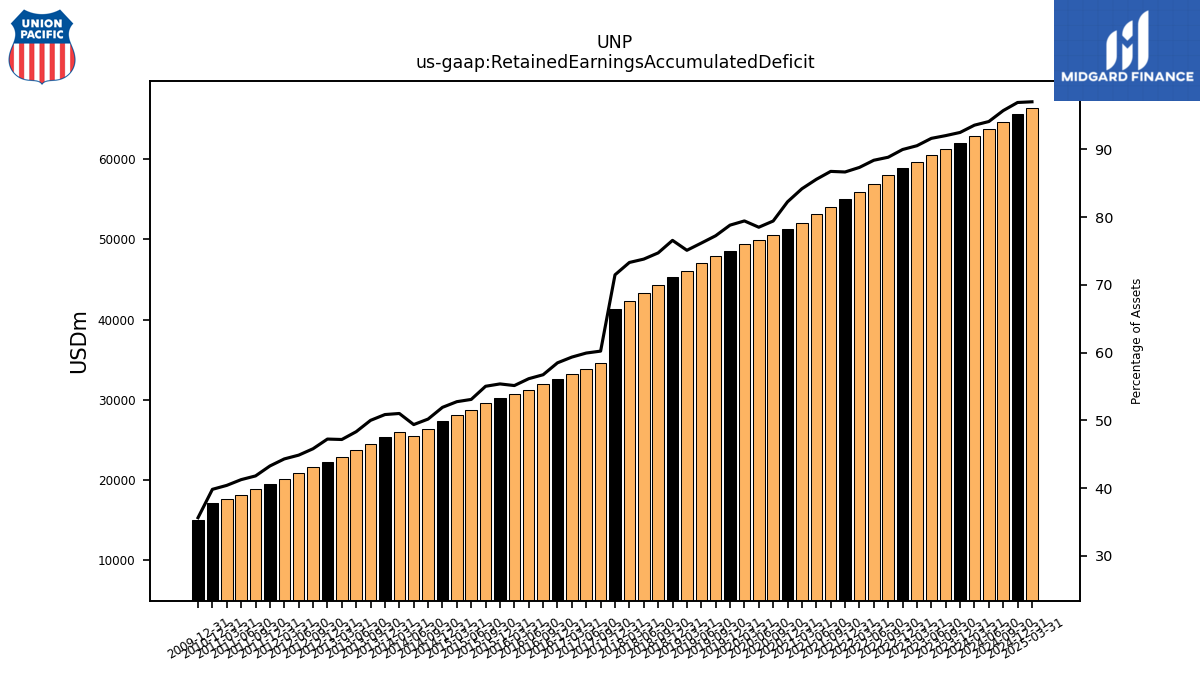
| $UNP$ | 2025-02-07 | 2025-04-24 | 2025-04-24 | NA | NA | UNP | 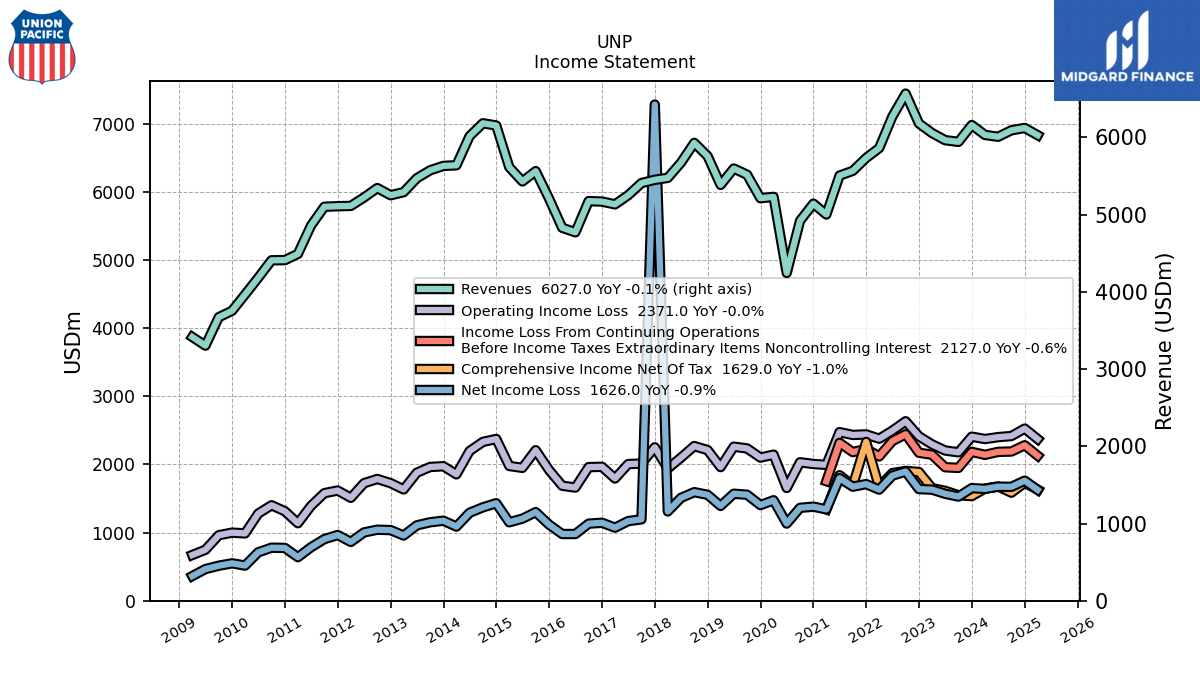 |
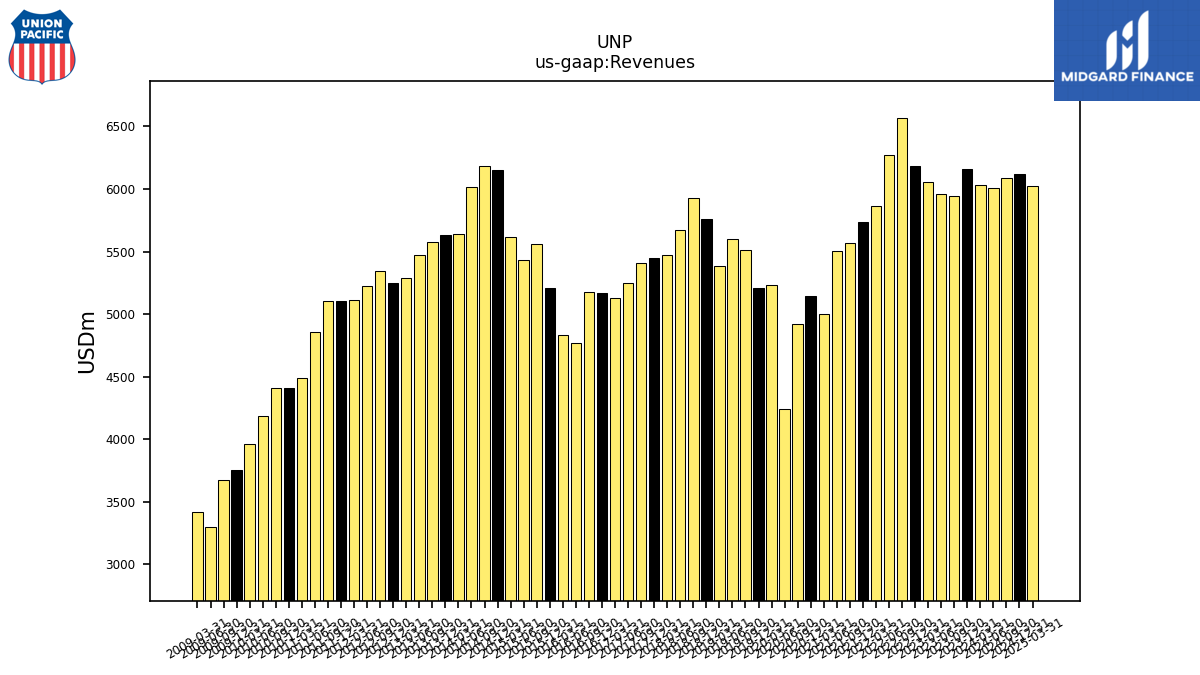 |
UNP | 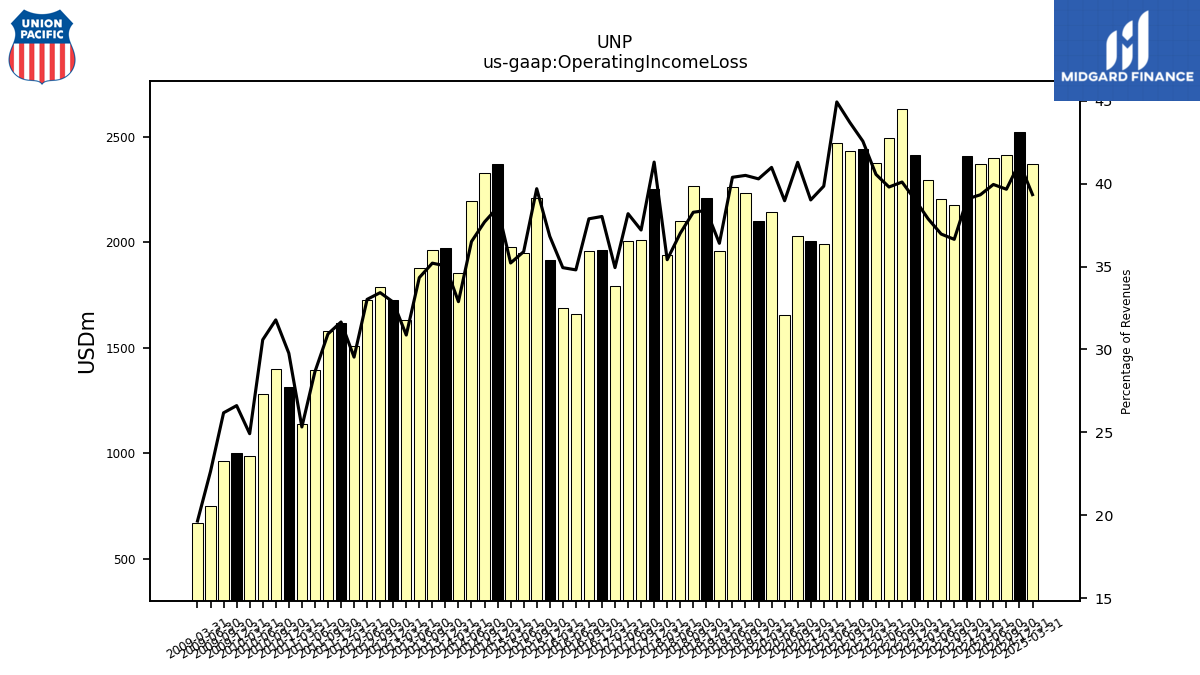 |
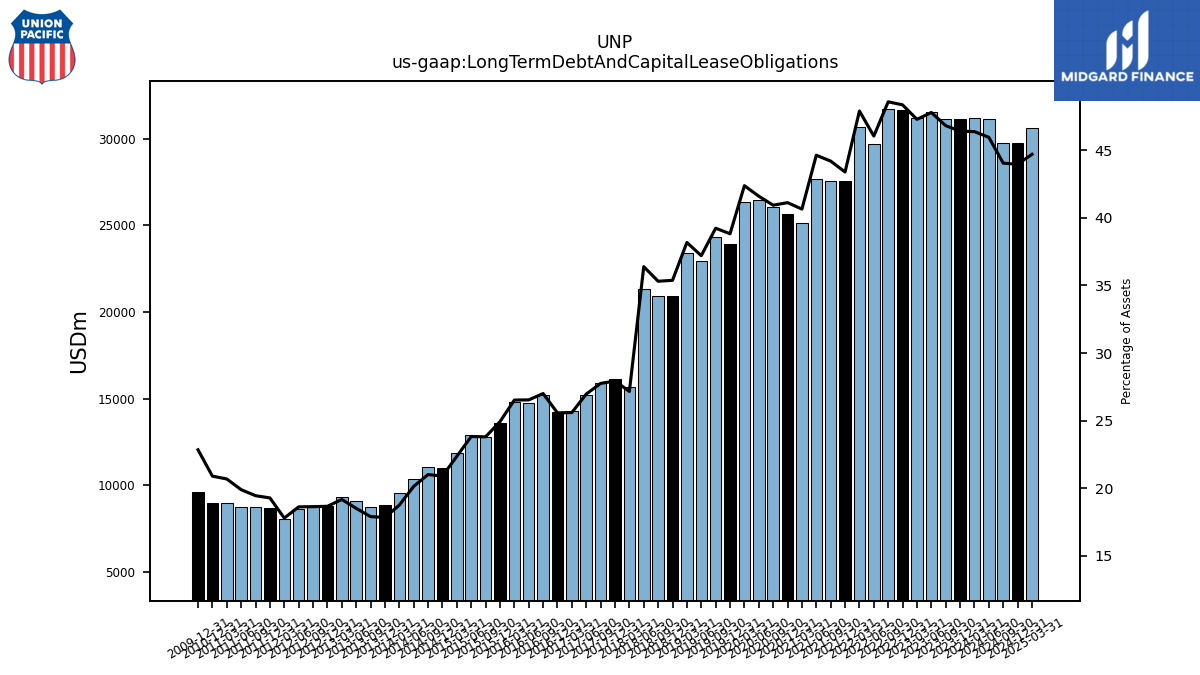 |
UNP | 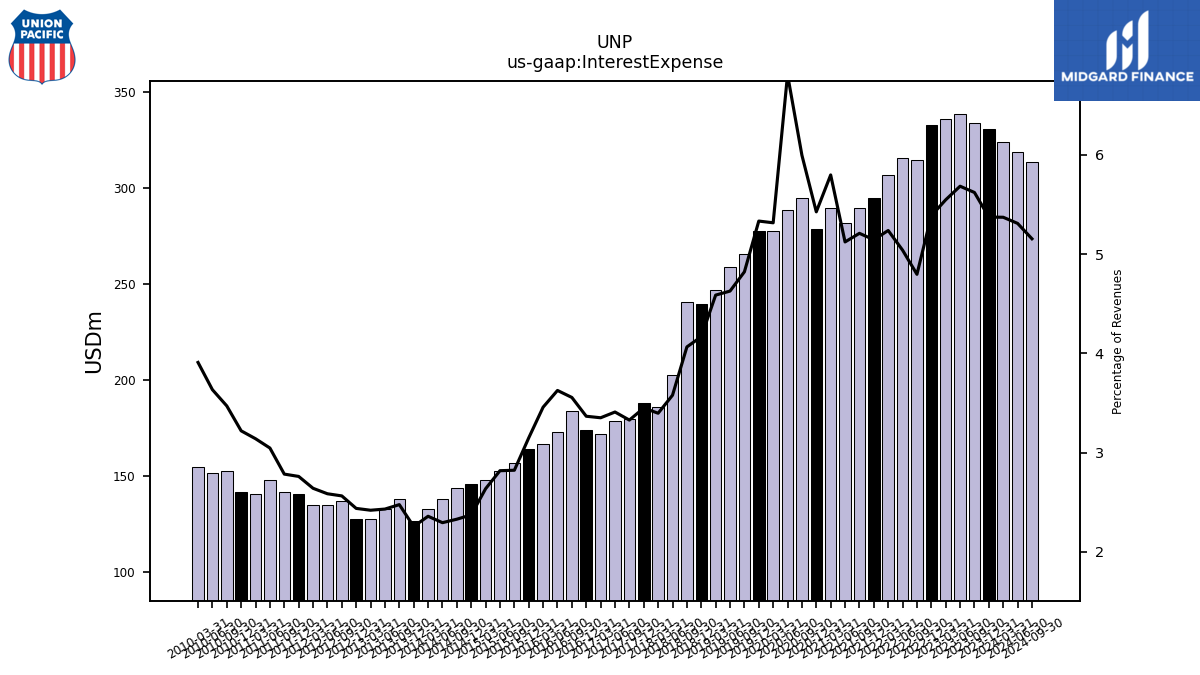 |
 |
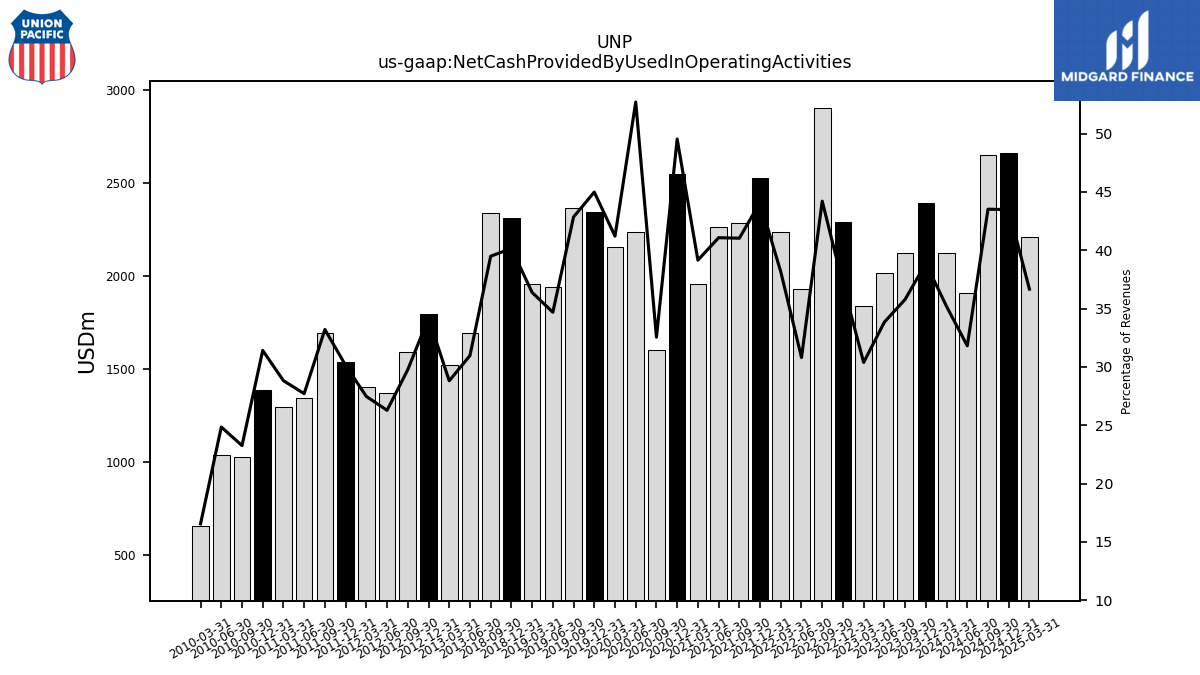 |
UNP | 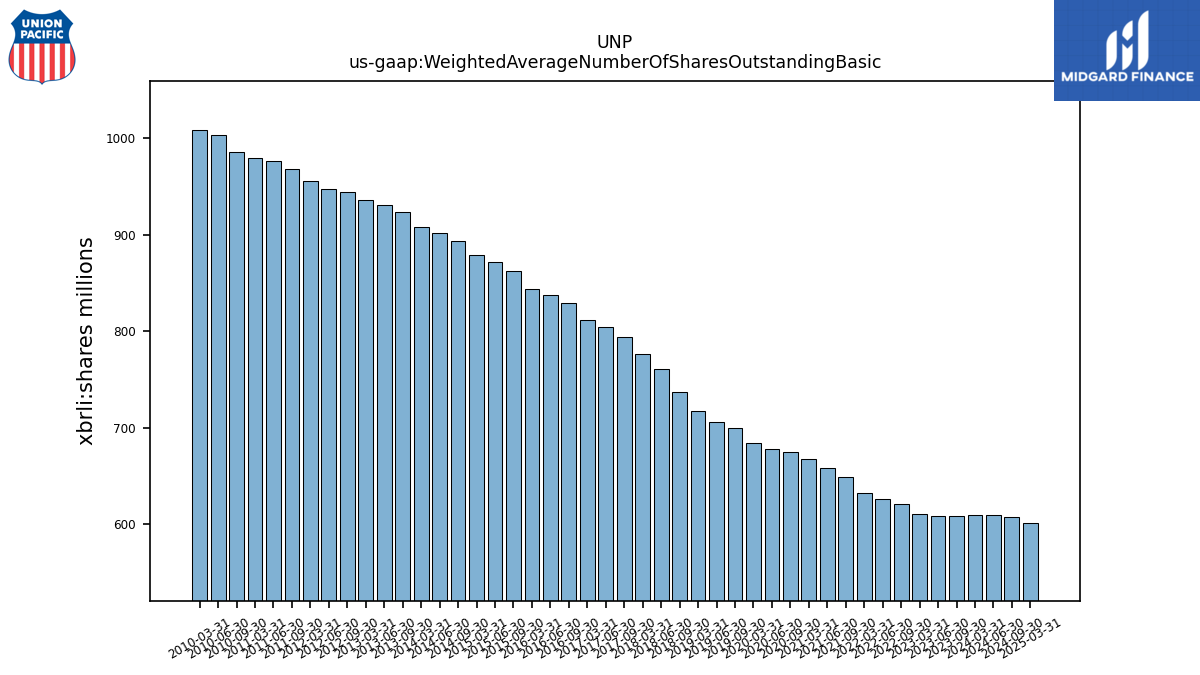 |
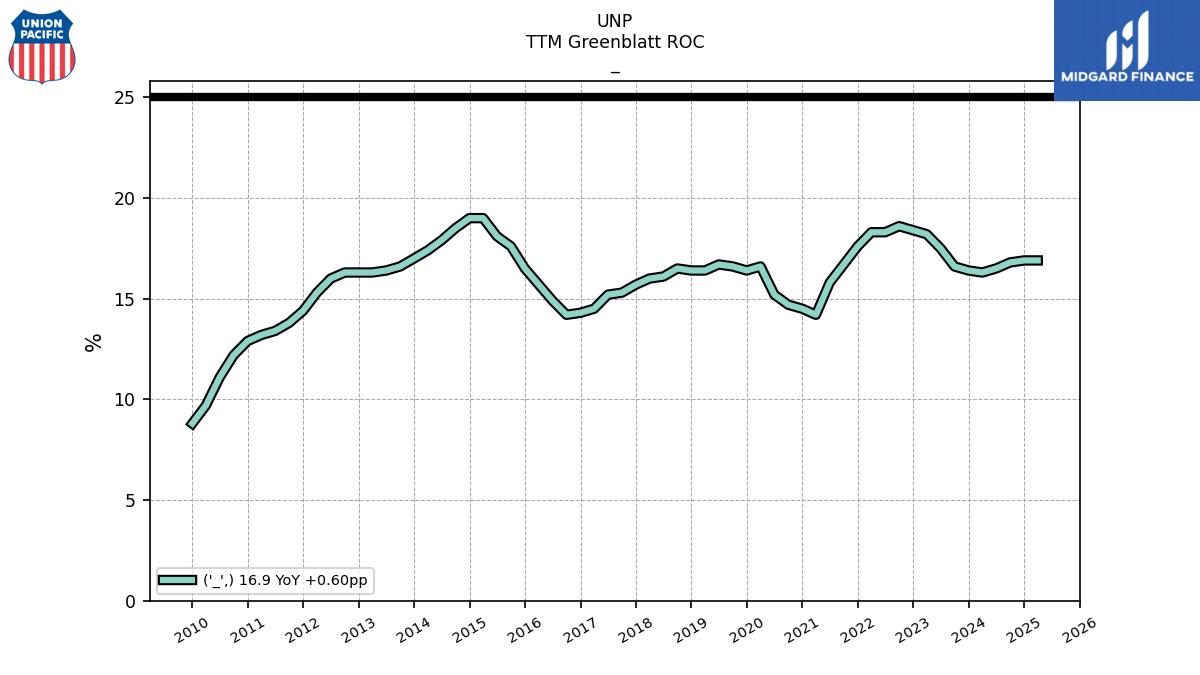 |
UNP | ||||||
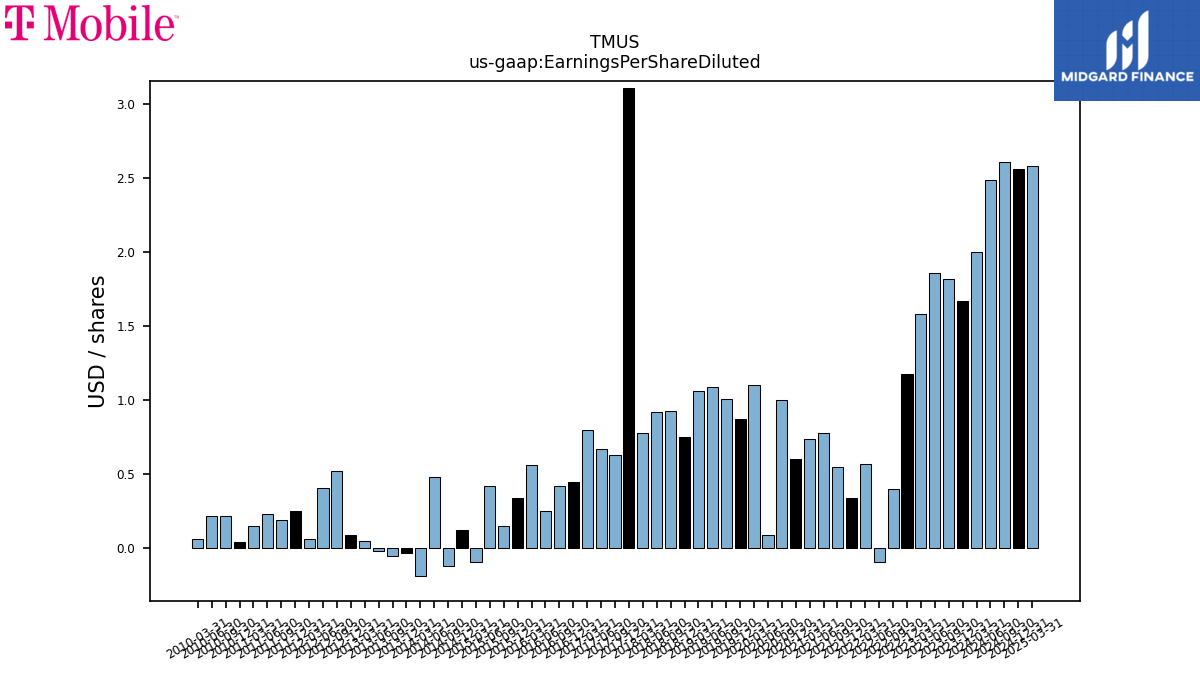
| $TMUS$ | 2025-01-31 | 2025-04-24 | 2025-04-24 | NA | NA | TMUS | 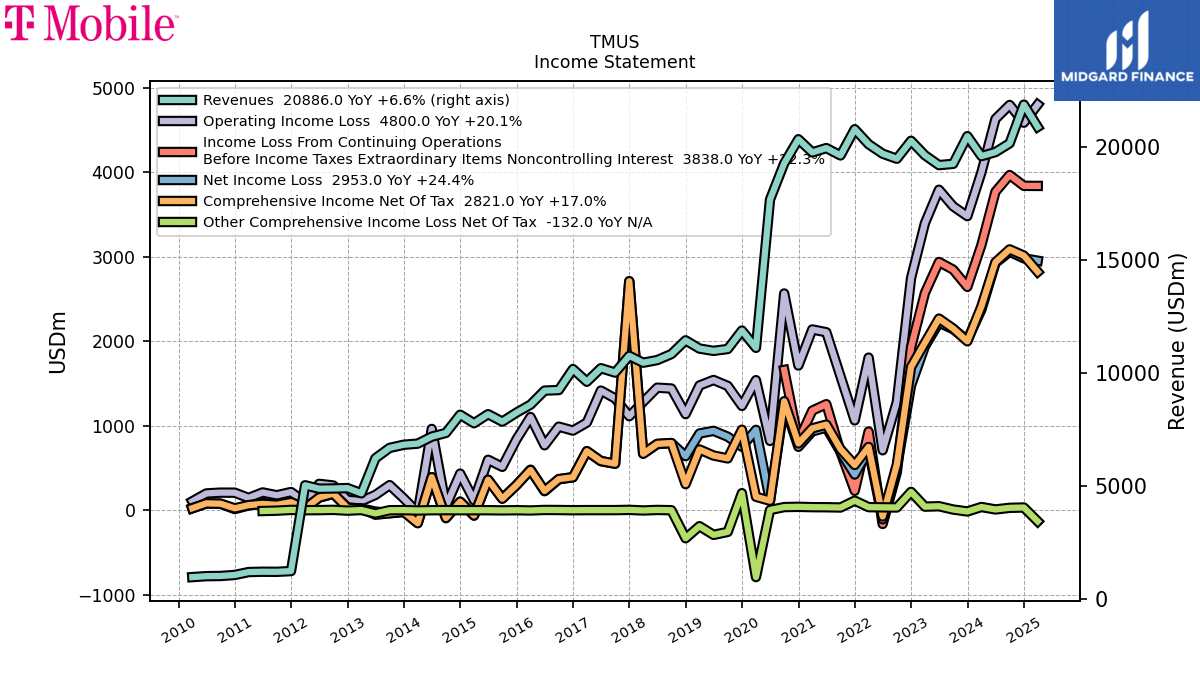 |
 |
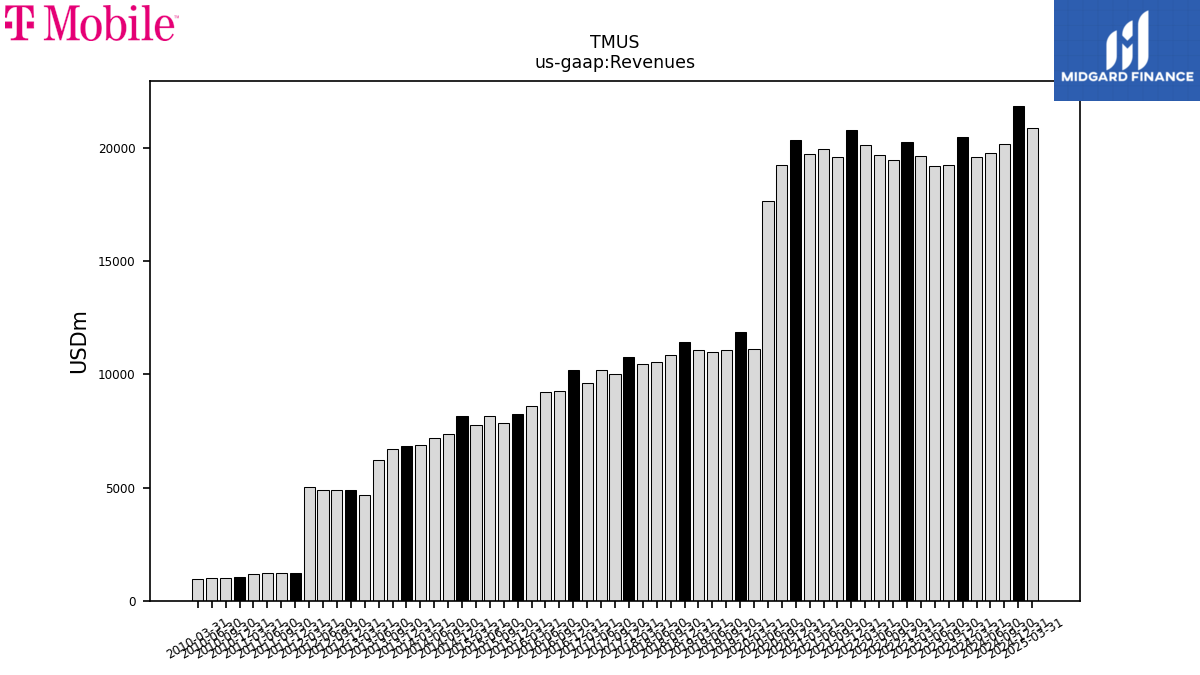 |
TMUS | 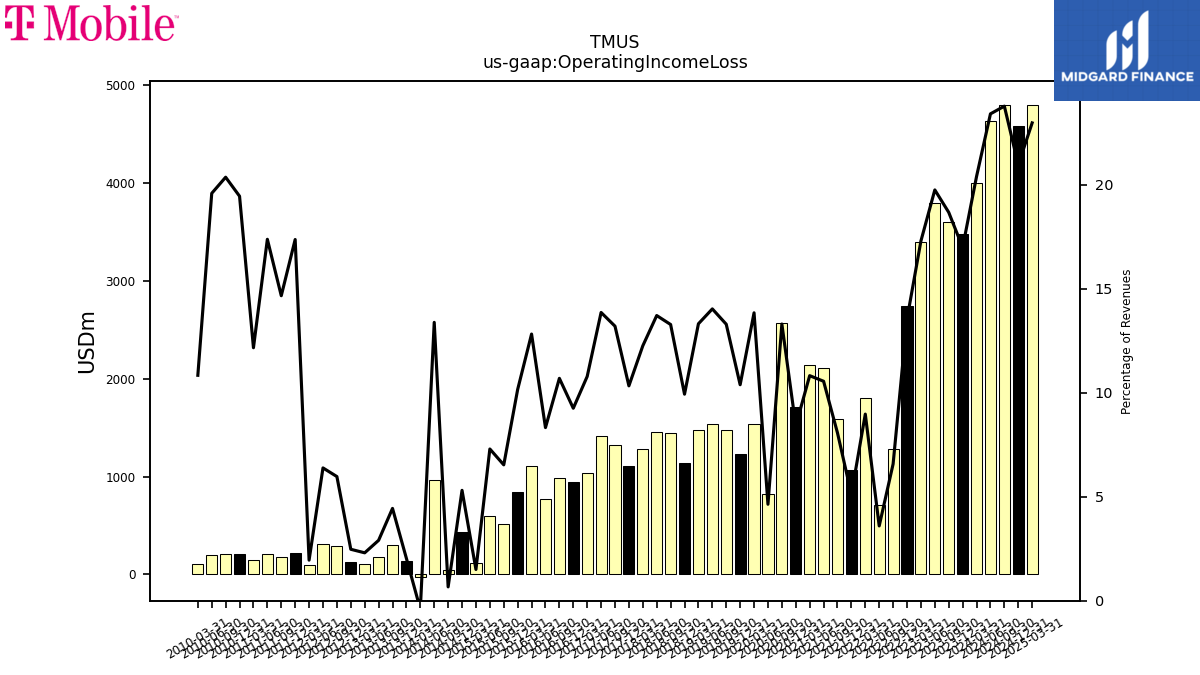 |
 |
TMUS | 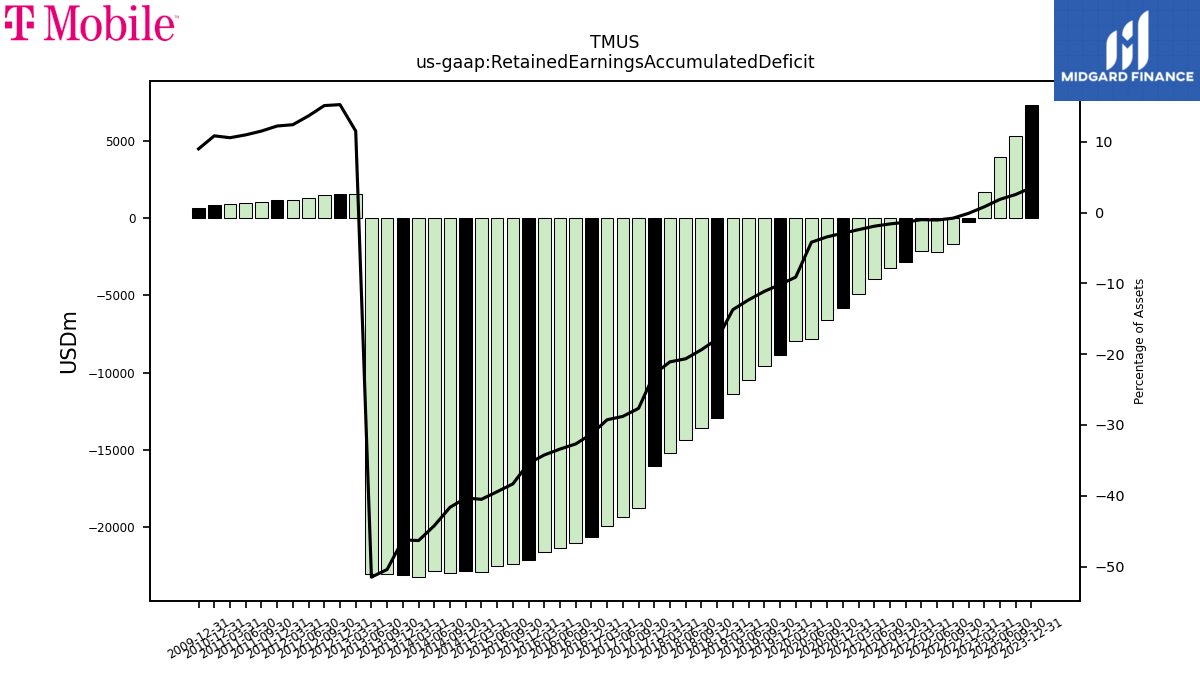 |
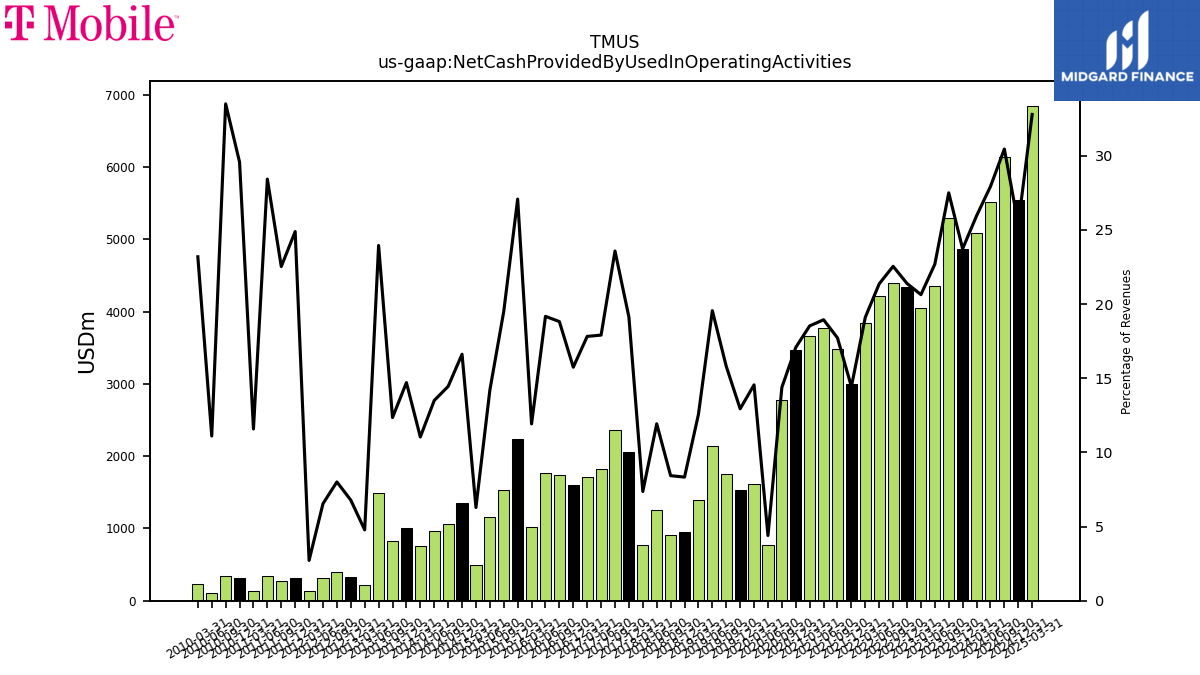 |
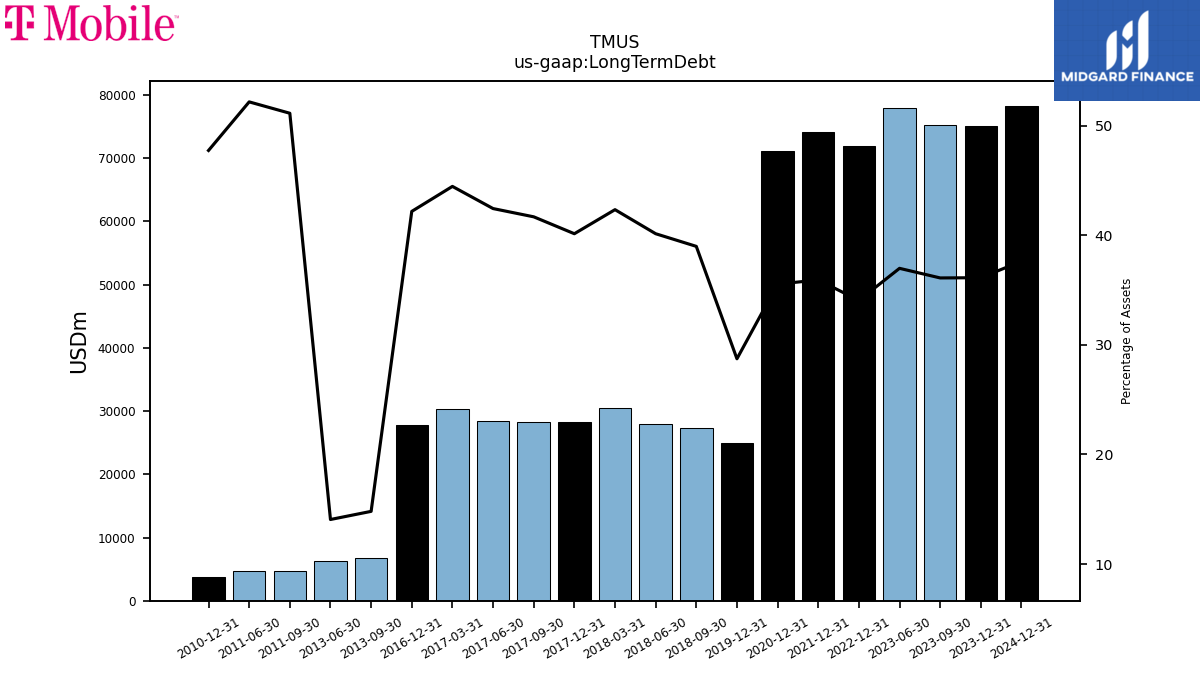
TMUS | 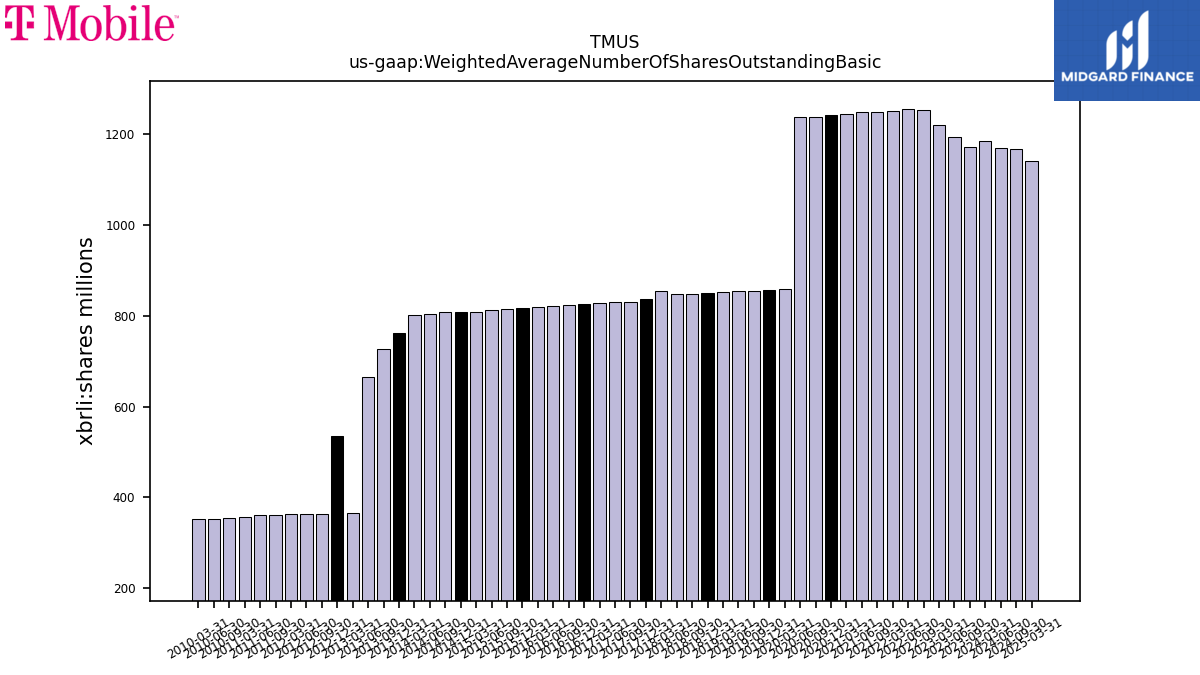 |
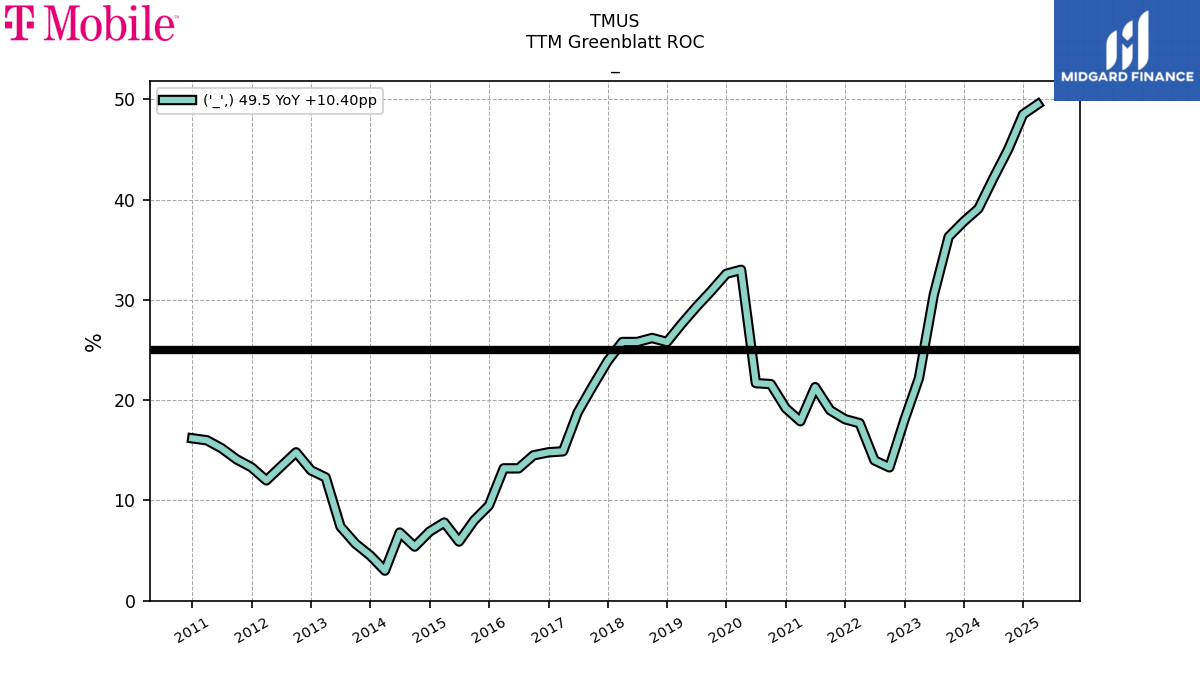 |
TMUS | ||||||
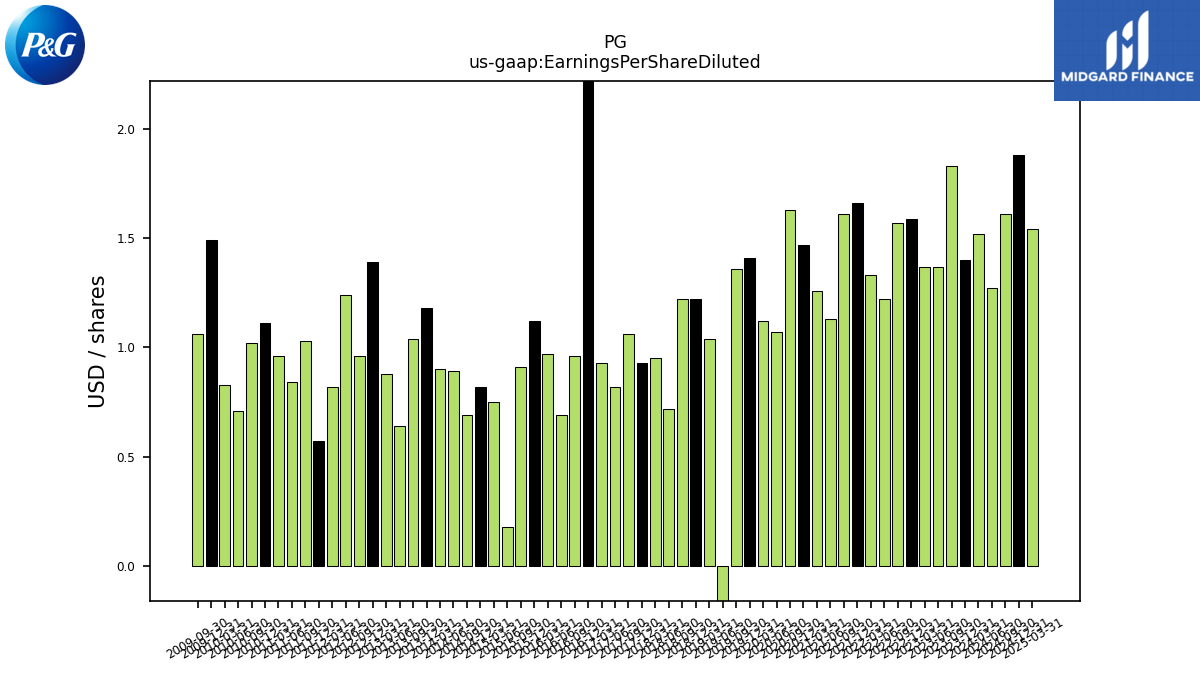
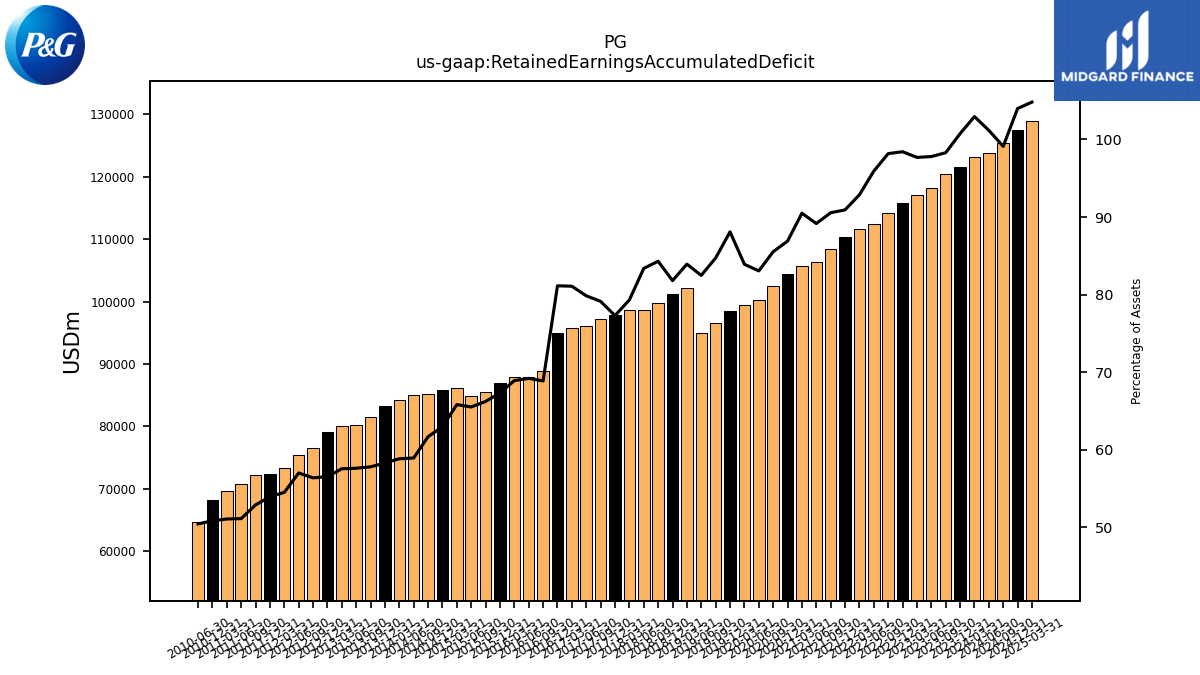
| $PG$ | 2024-08-05 | 2025-04-24 | 2025-04-24 | NA | NA | PG | 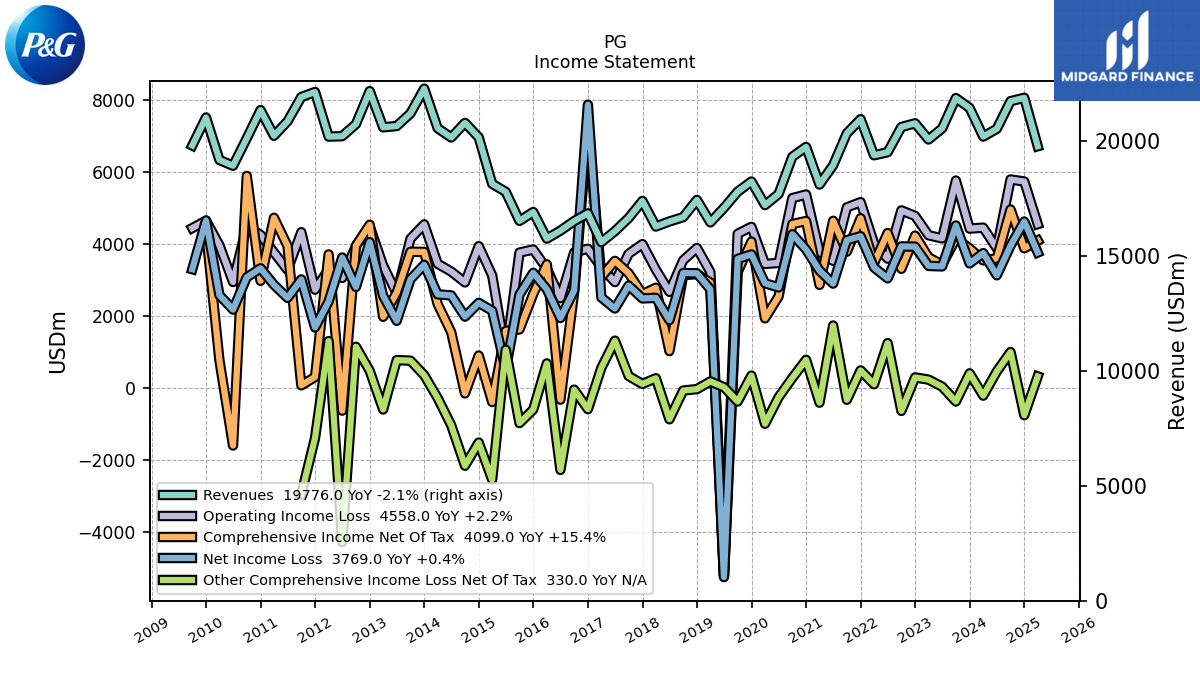 |
 |
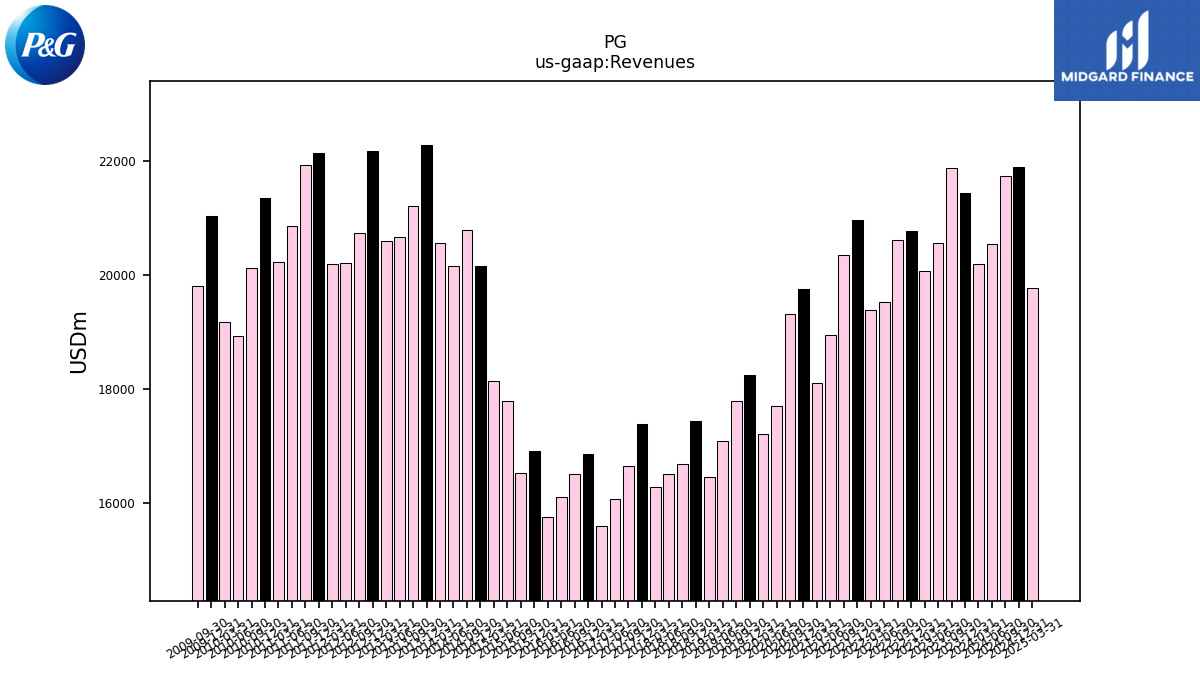 |
PG | 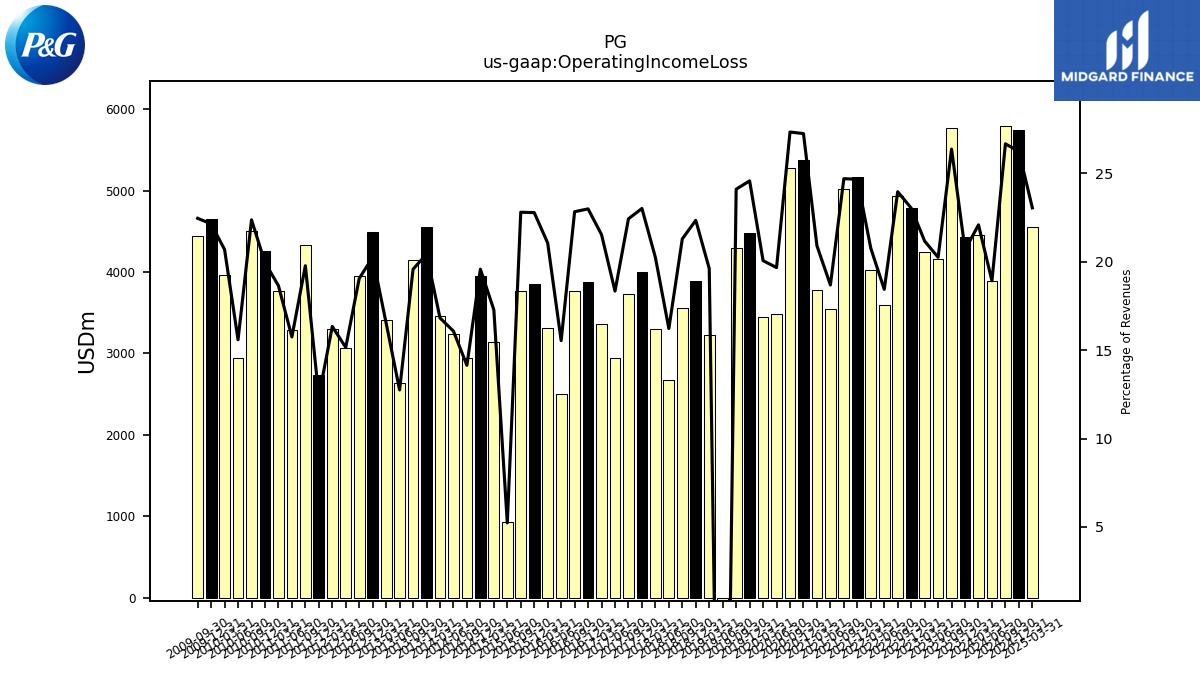 |
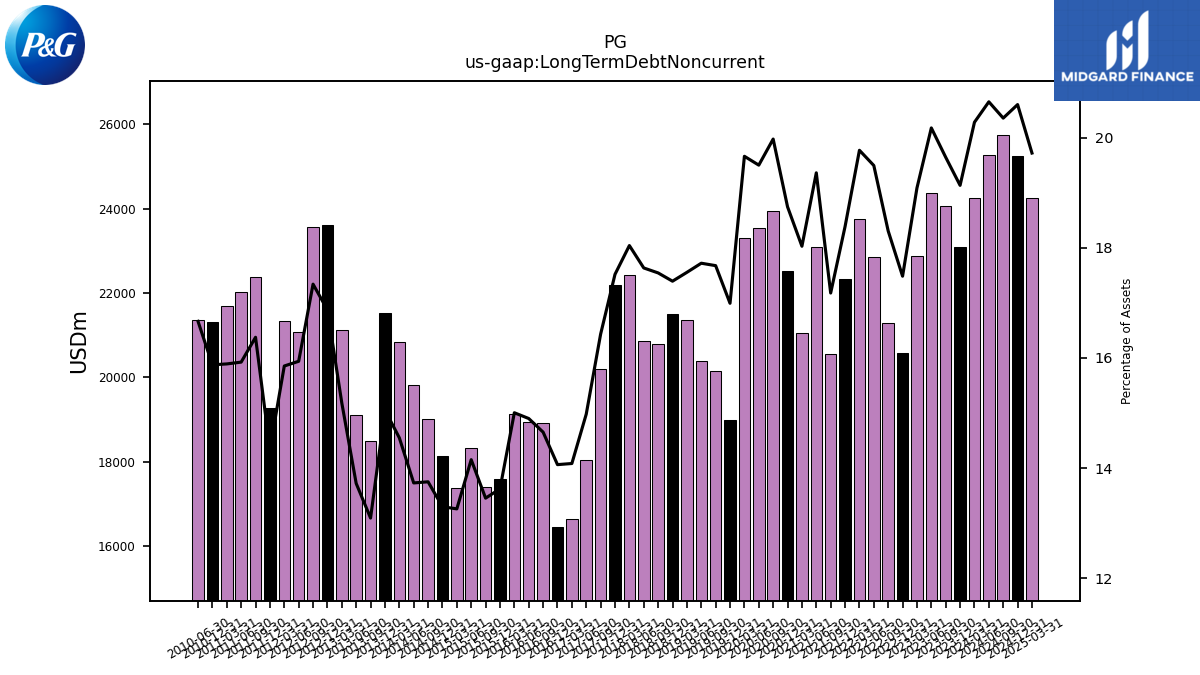 |
PG | 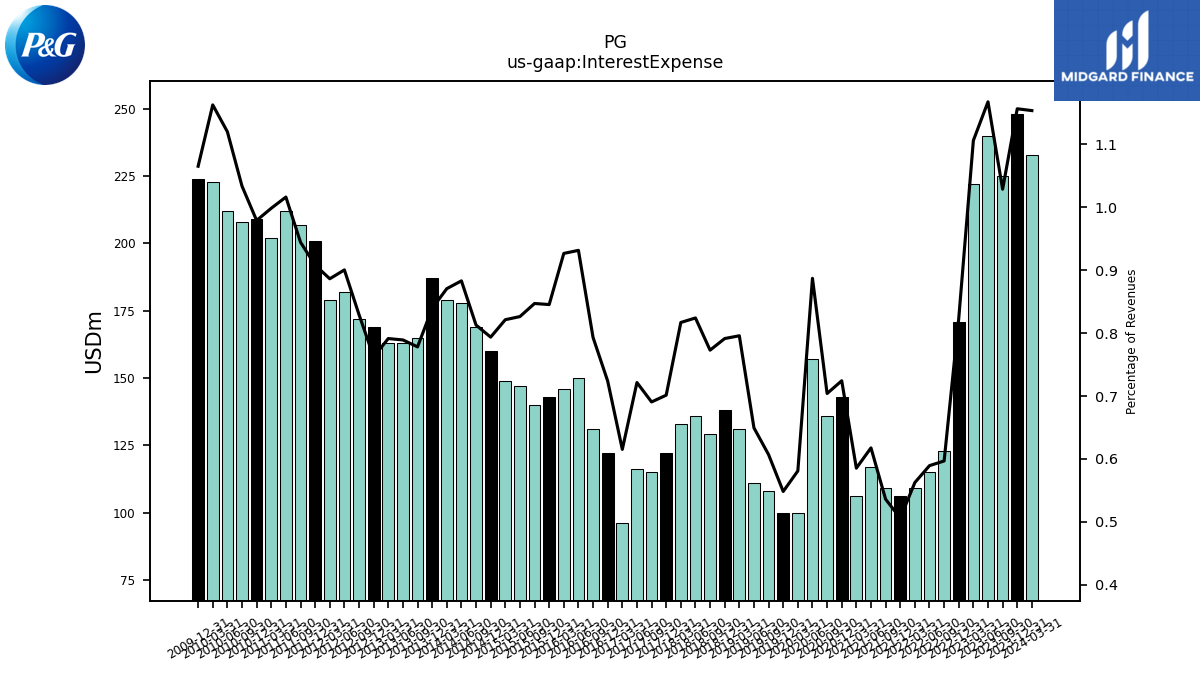 |
 |
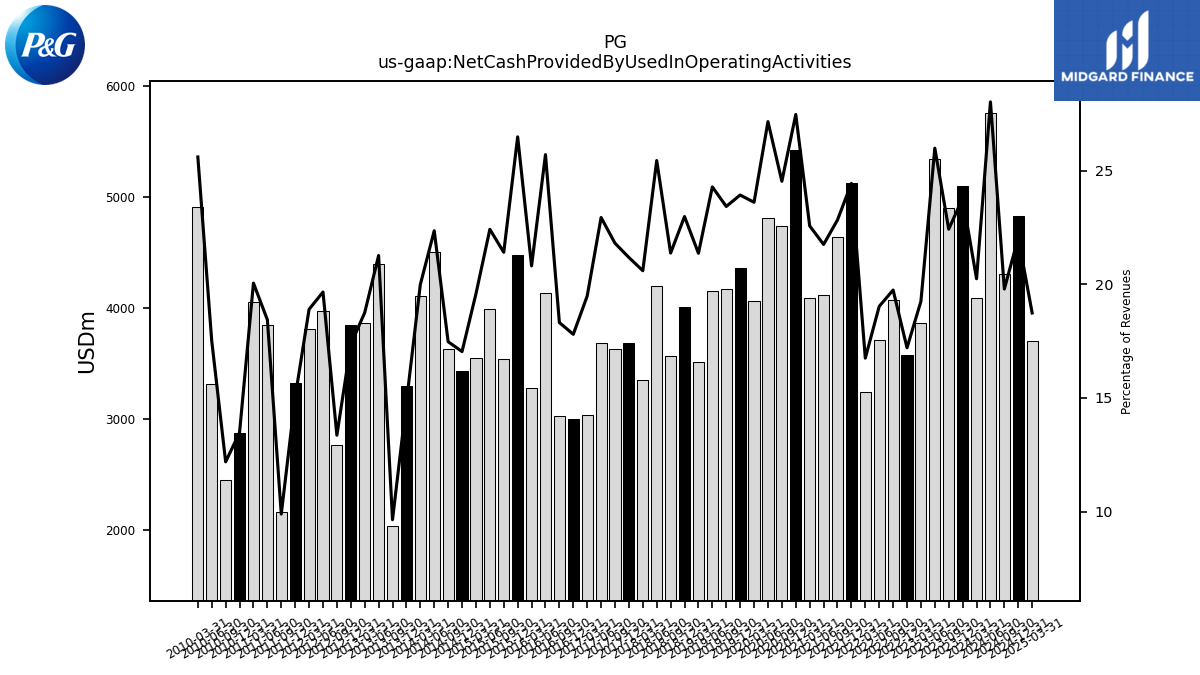 |
PG | 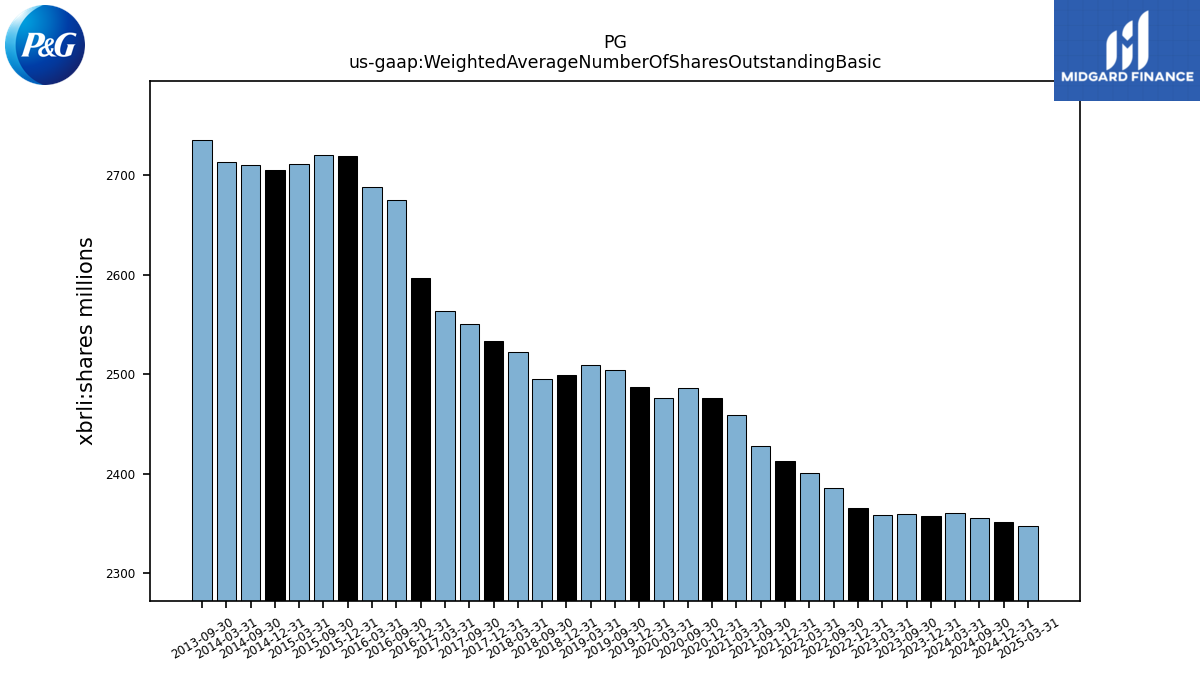 |
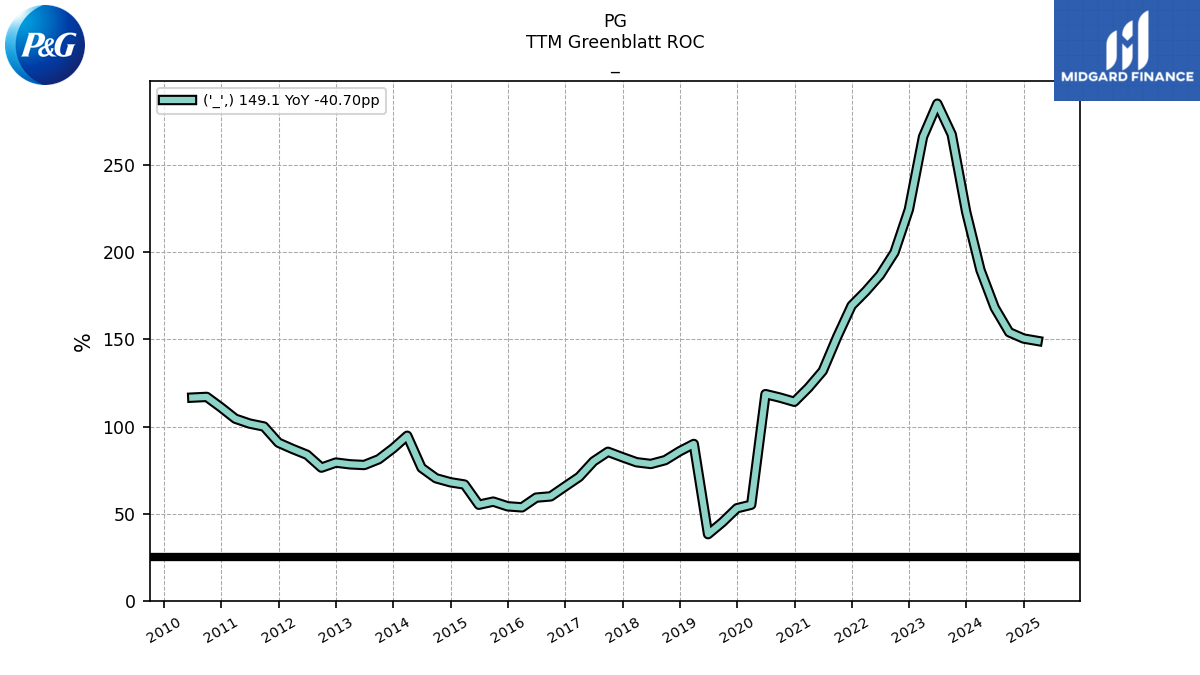 |
PG | |||||
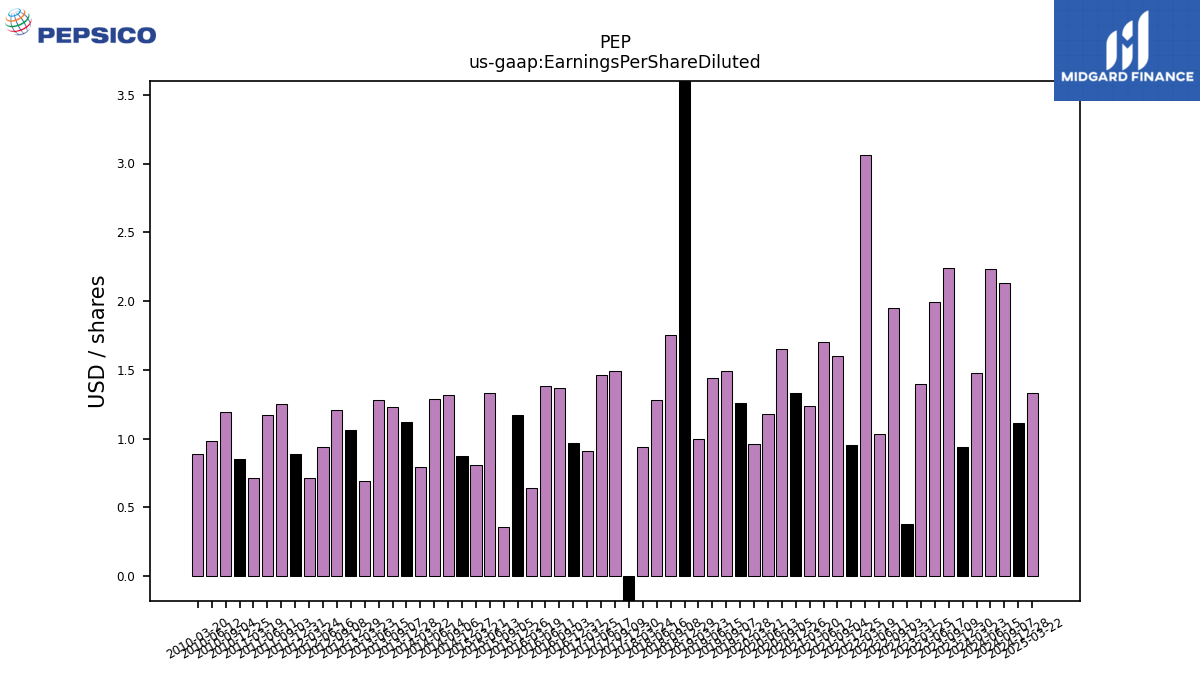
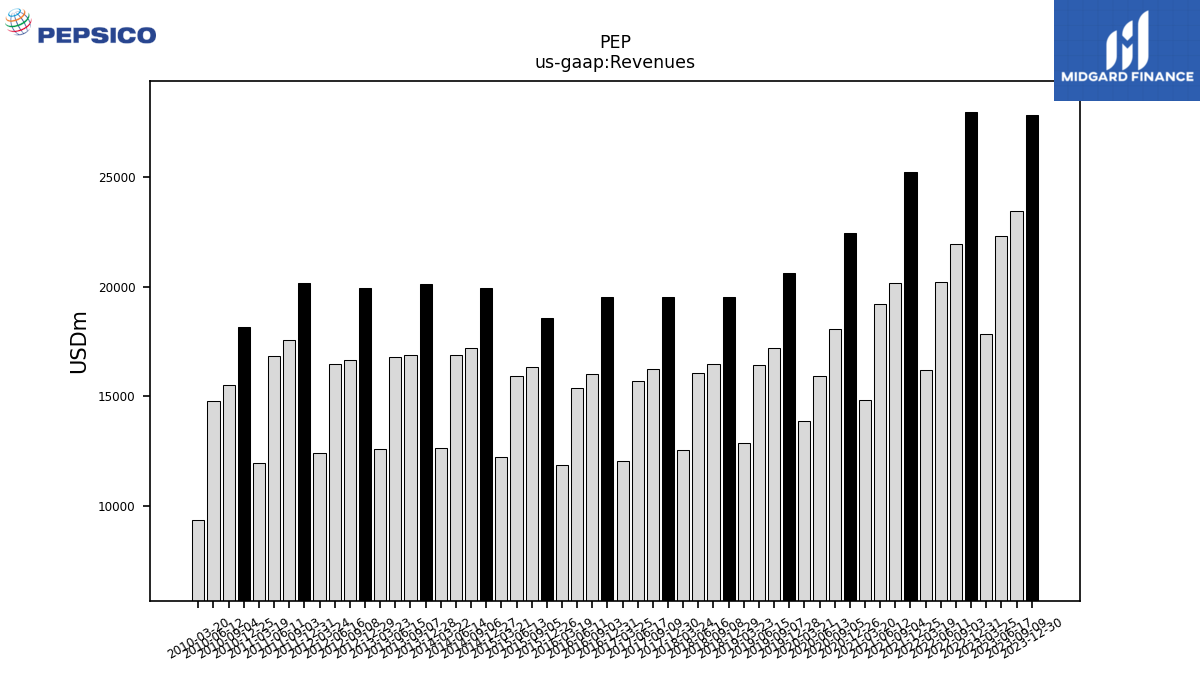
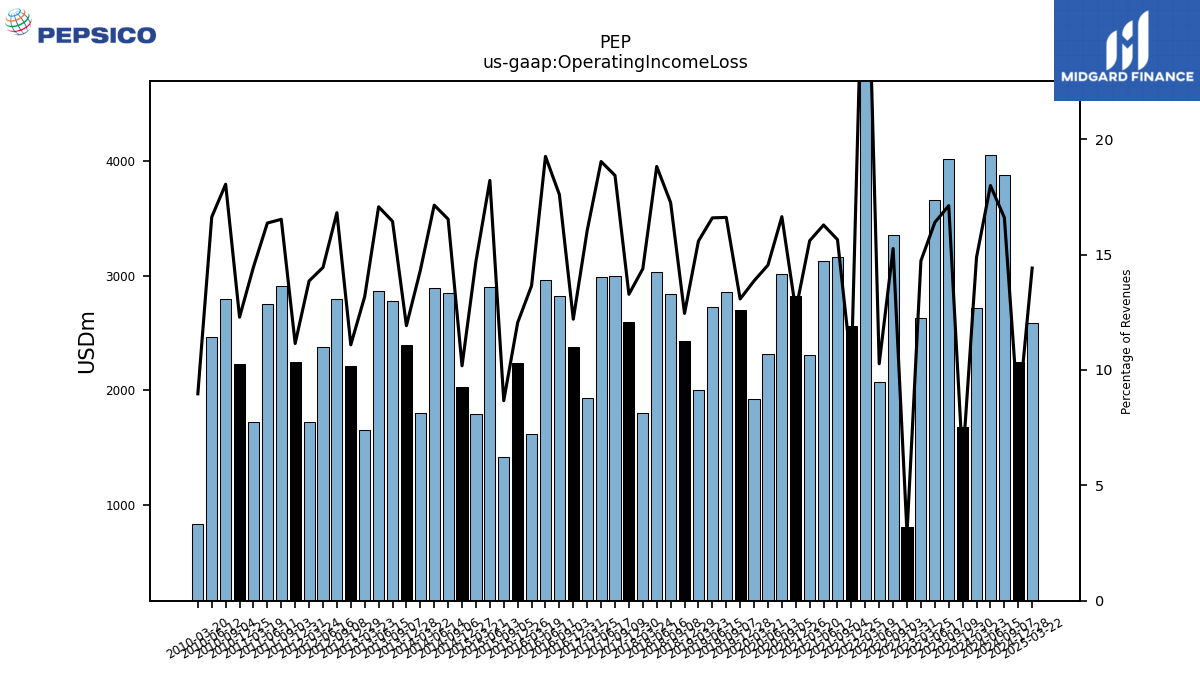
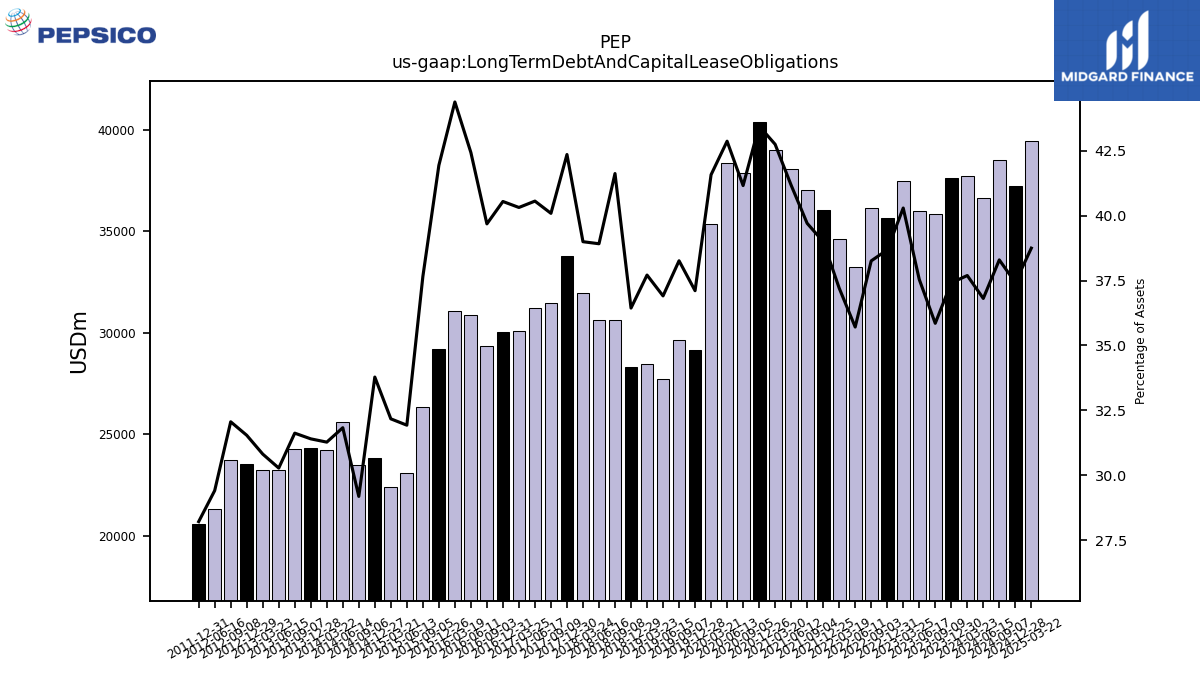
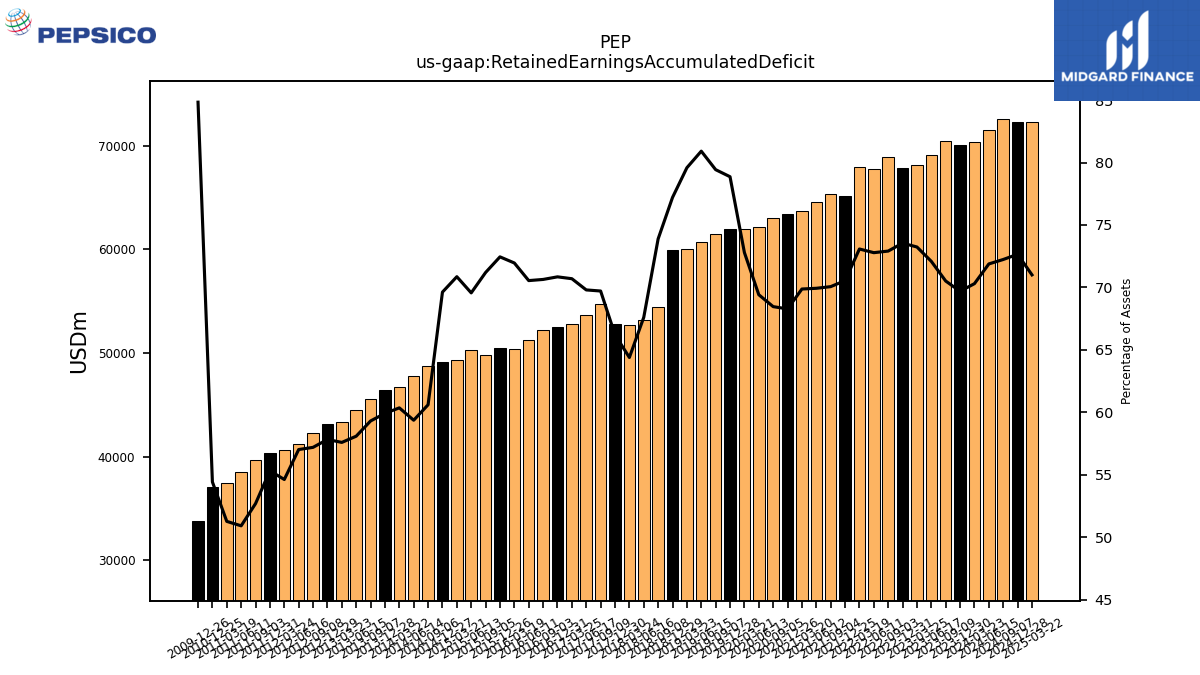
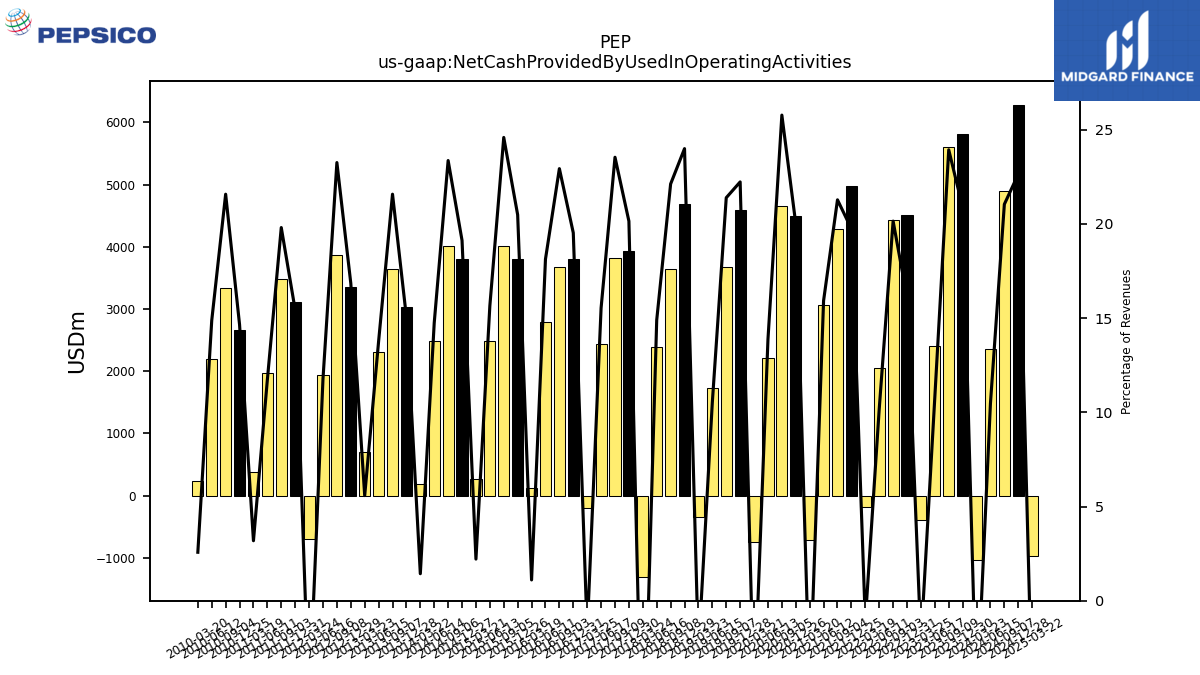
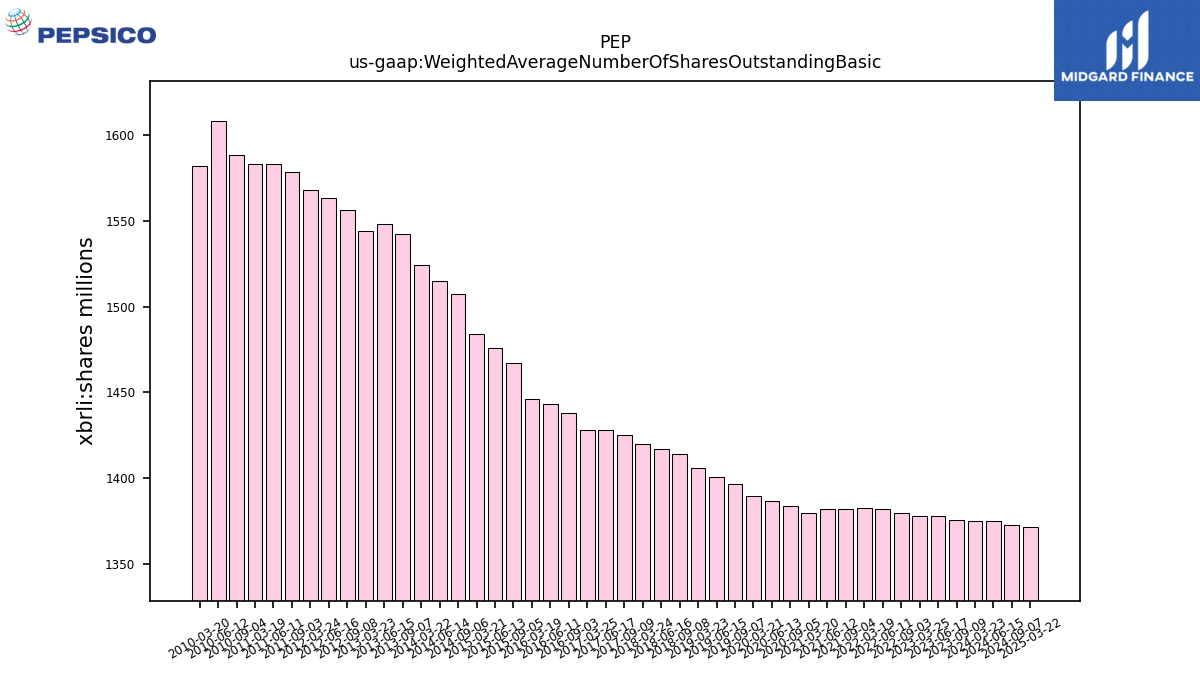
| $PEP$ | 2025-02-04 | 2025-04-24 | 2025-04-24 | NA | NA | PEP | 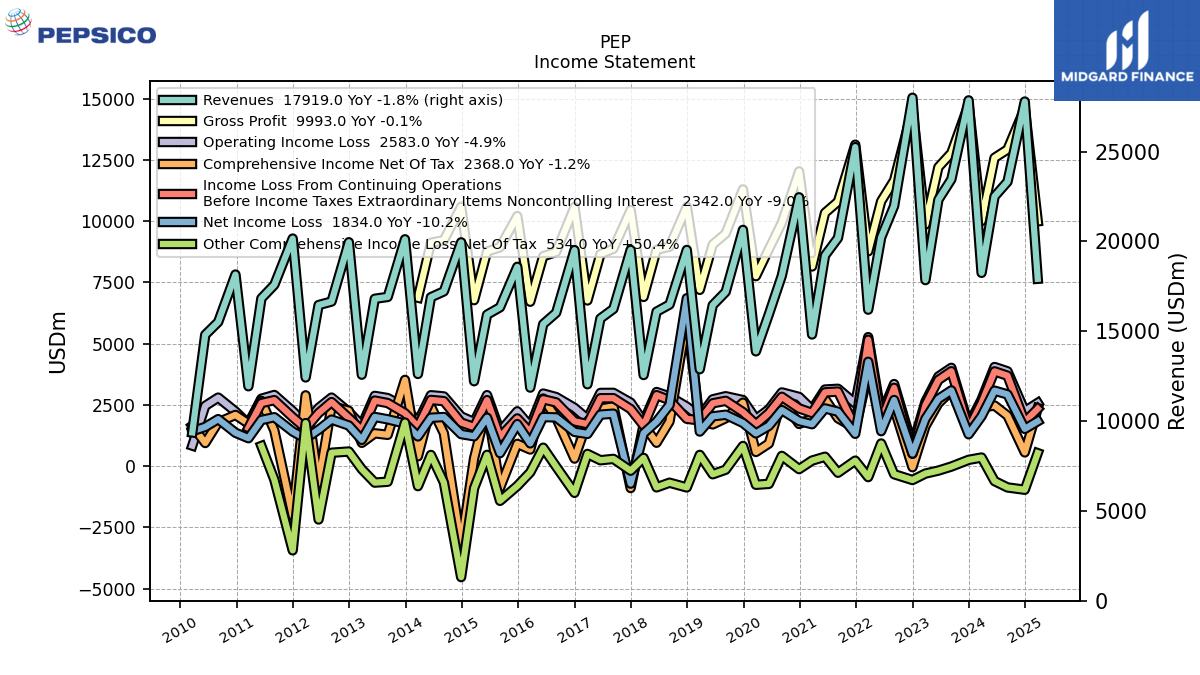 |
 |
 |
PEP | 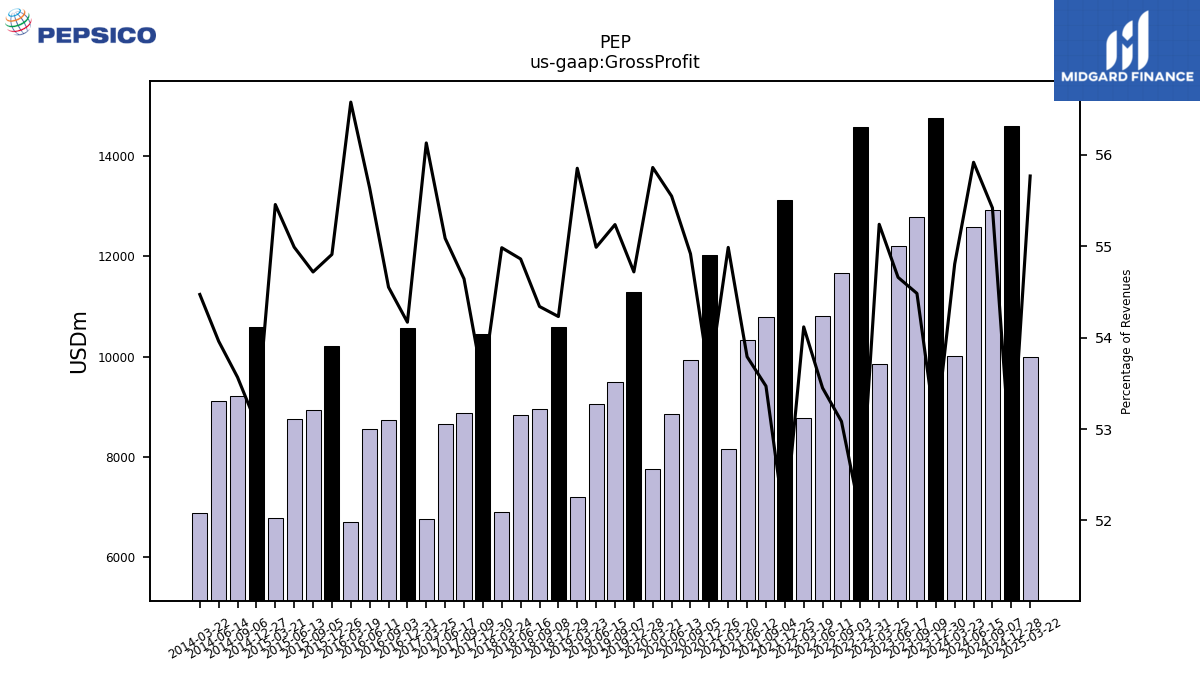 |
 |
 |
PEP | 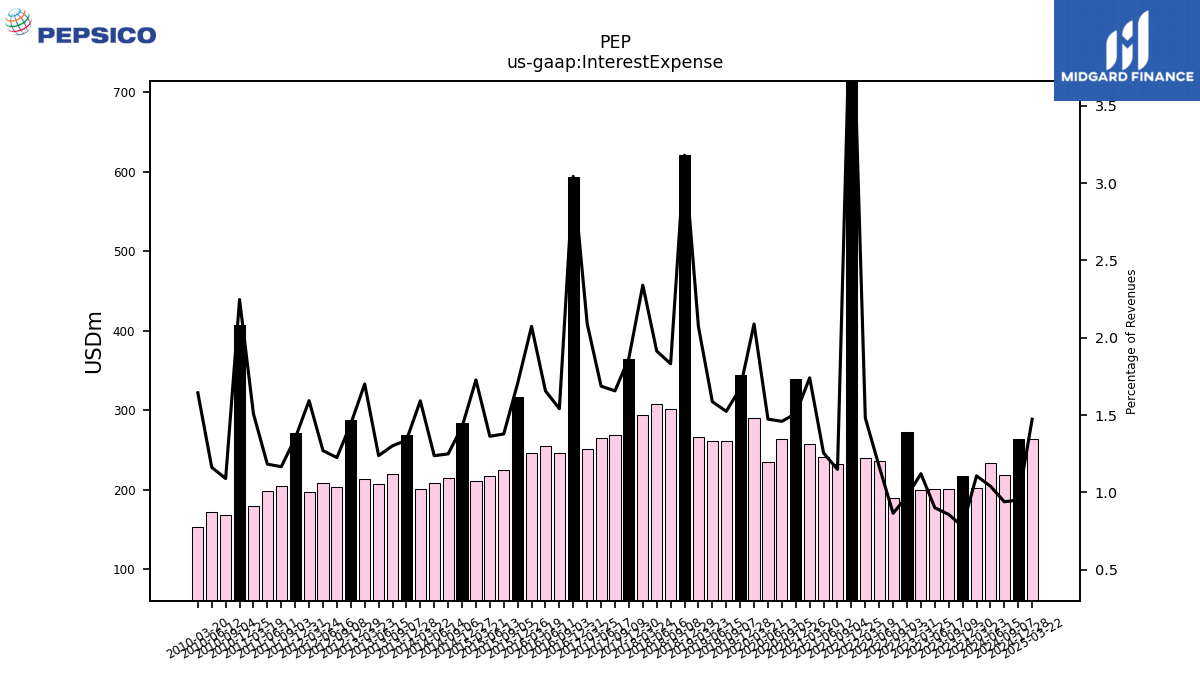 |
 |
 |
PEP | 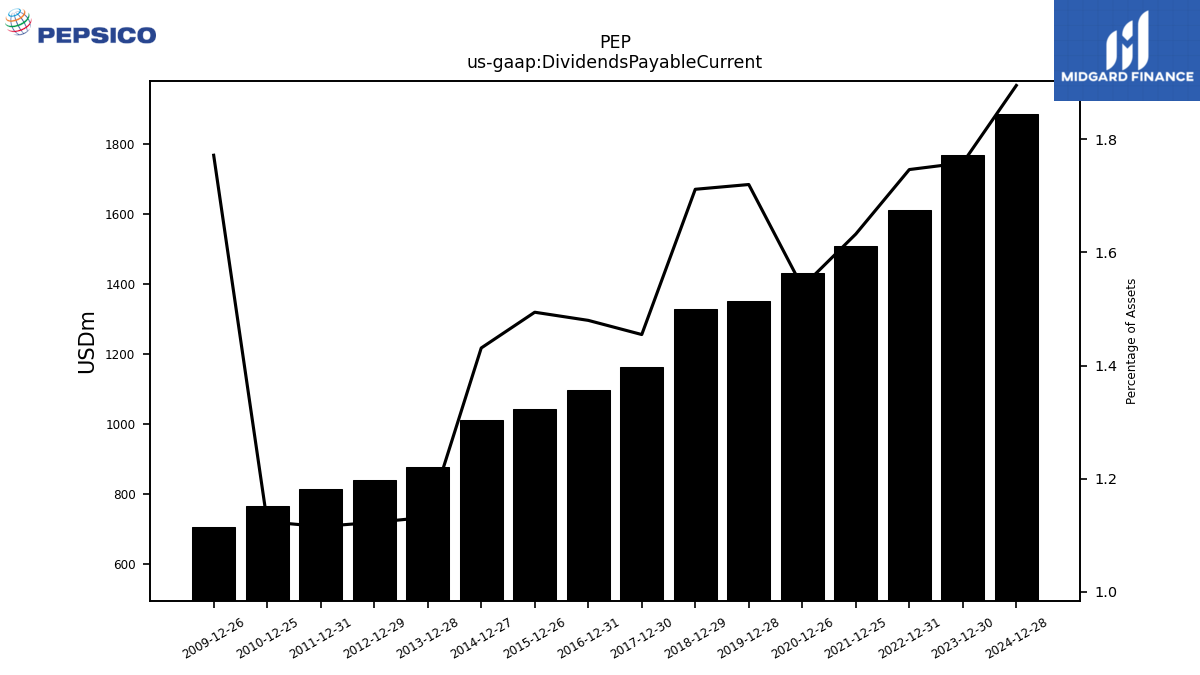 |
 |
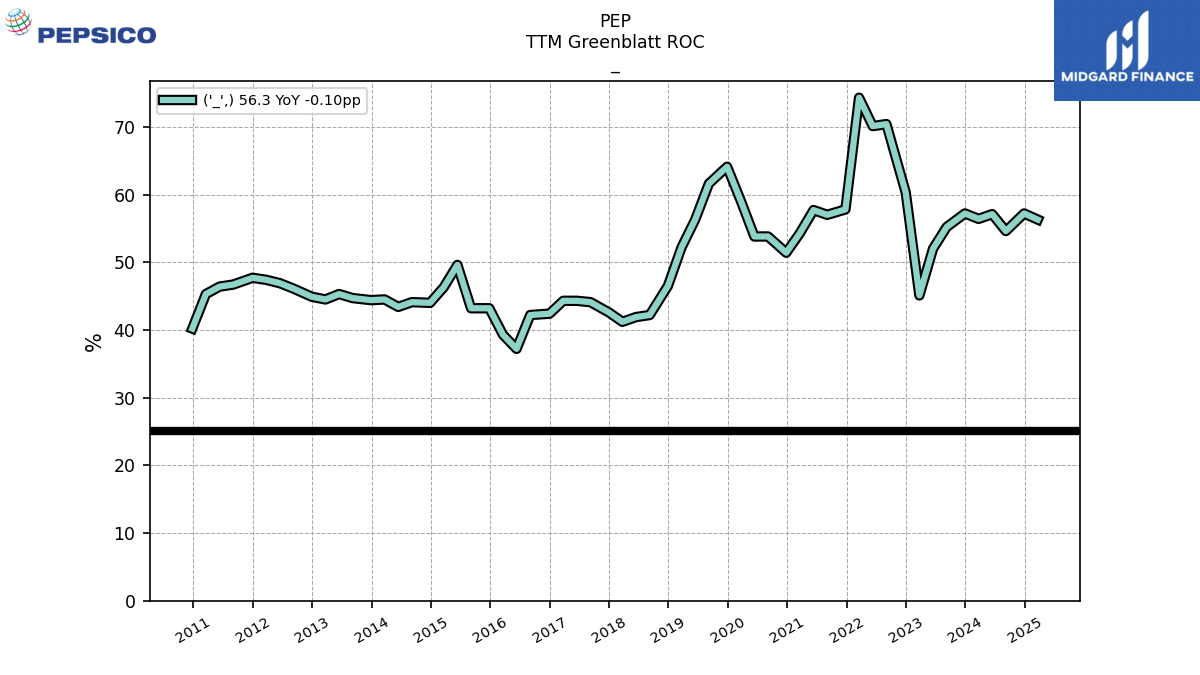 |
PEP | |||
| $CMCSA$ | 2025-01-31 | 2025-04-24 | 2025-04-24 |  |
NA | NA | CMCSA | CMCSA | CMCSA | CMCSA | 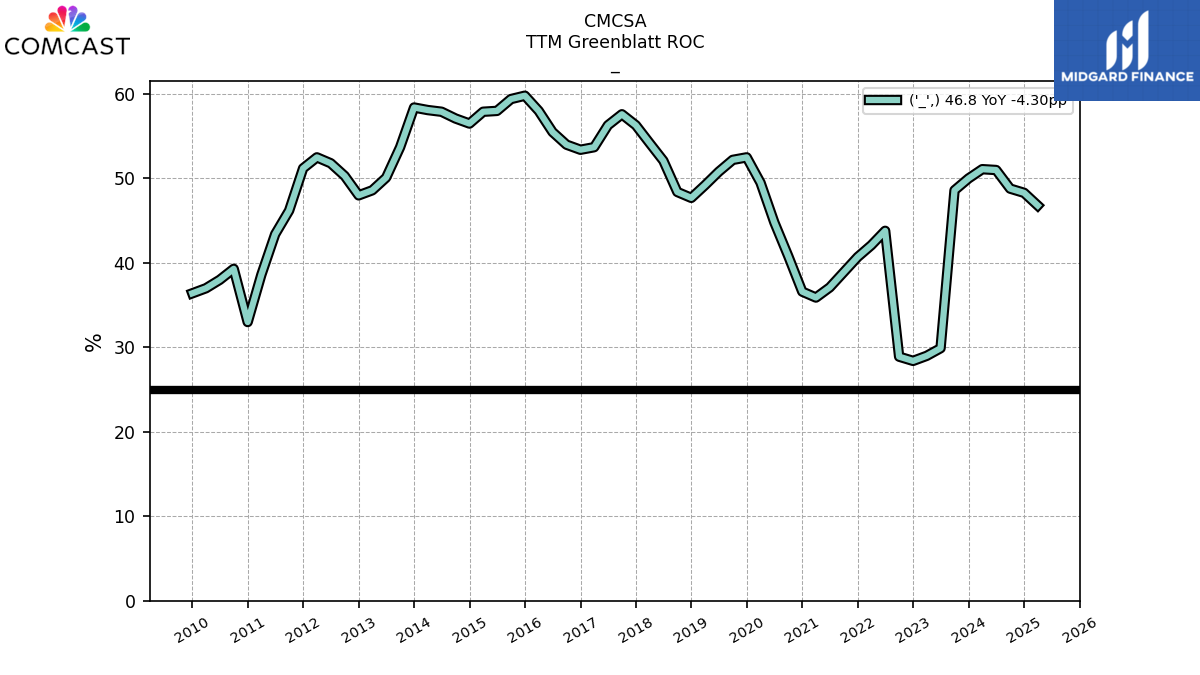 |
CMCSA | |||||||||||||
| Ticker | 10K | 10Q | 8K | Sector | Industry | Logo | Forward P/E | Revenue Growth | Ticker | Income | EPS | Revenues | Ticker | GrossProfit | OperatingIncome | LongTermDebt | Ticker | InterestExpense | RetainedEarnnings | CashFlowOperating | Ticker | Dividends | SharesOutstanding | TTMGreenblattROC | |
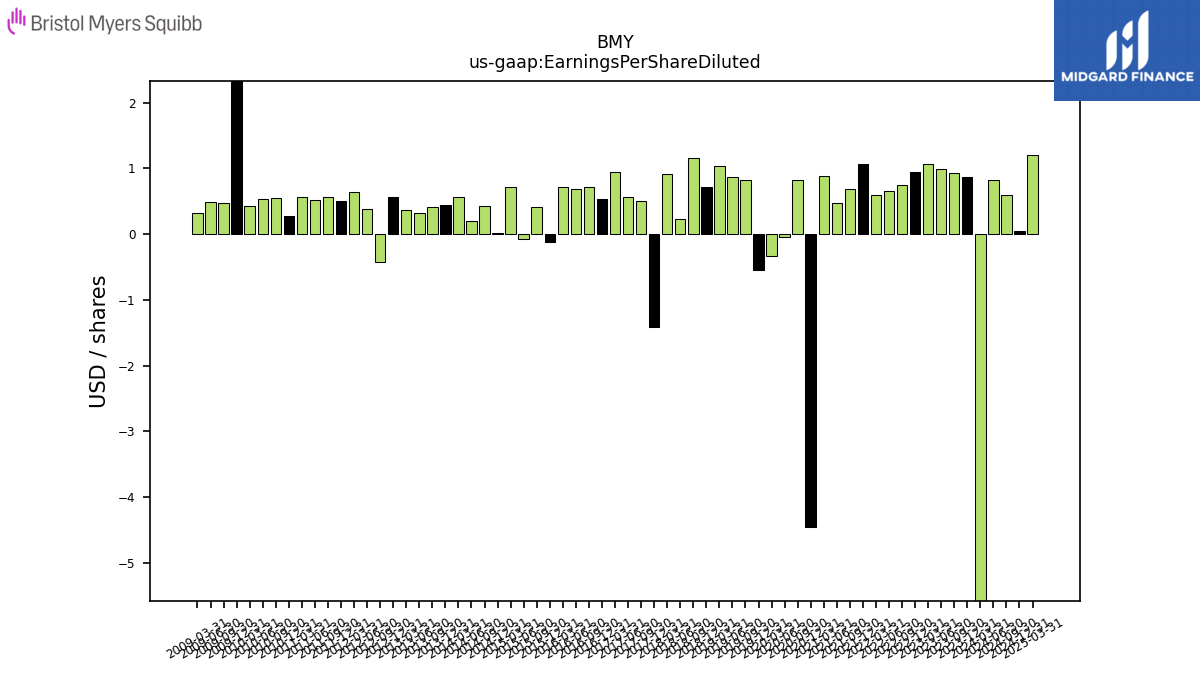
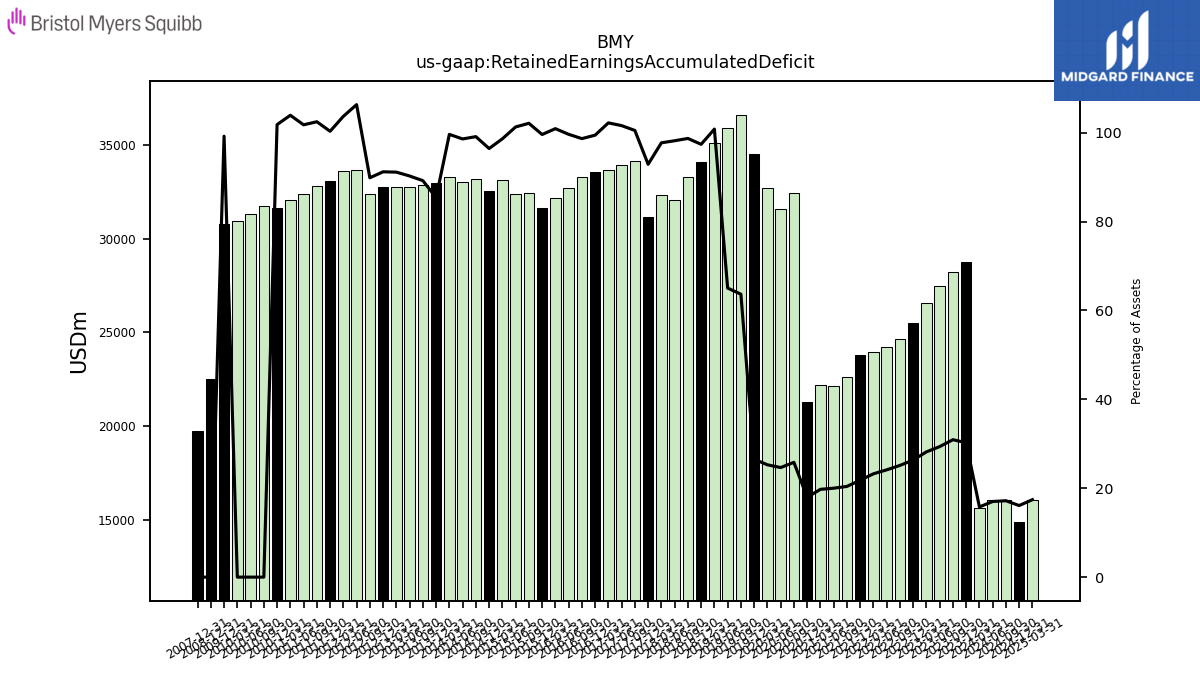
| $BMY$ | 2025-02-12 | 2025-04-24 | 2025-04-24 | NA | NA | BMY | 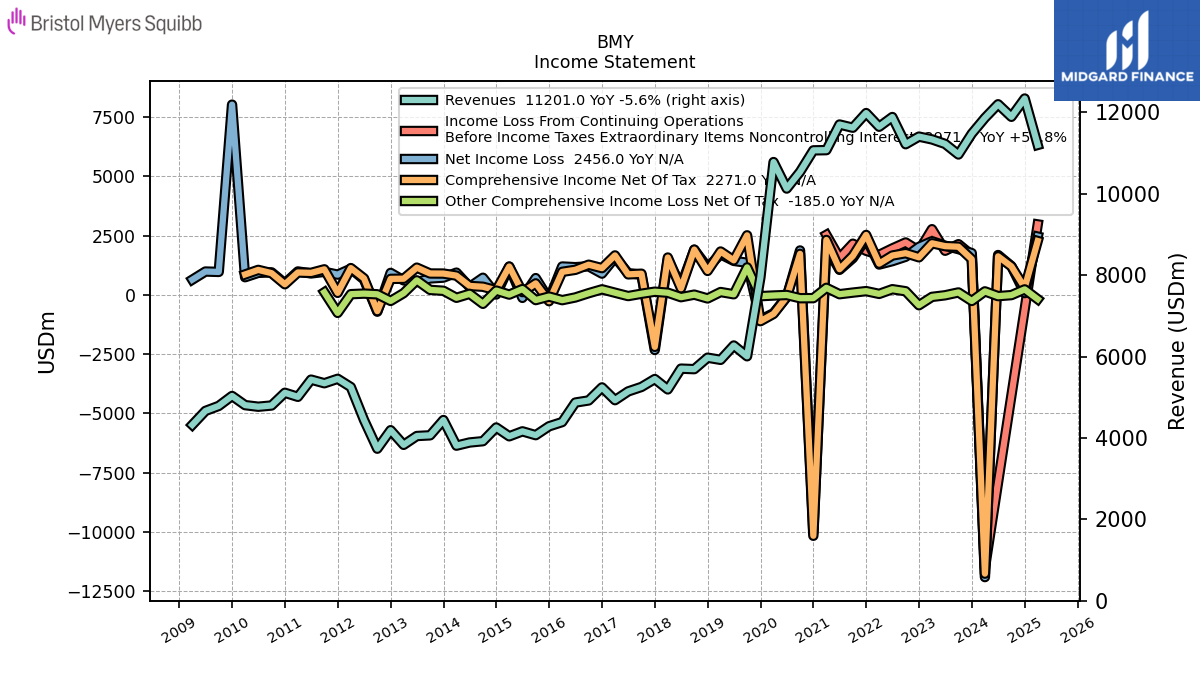 |
 |
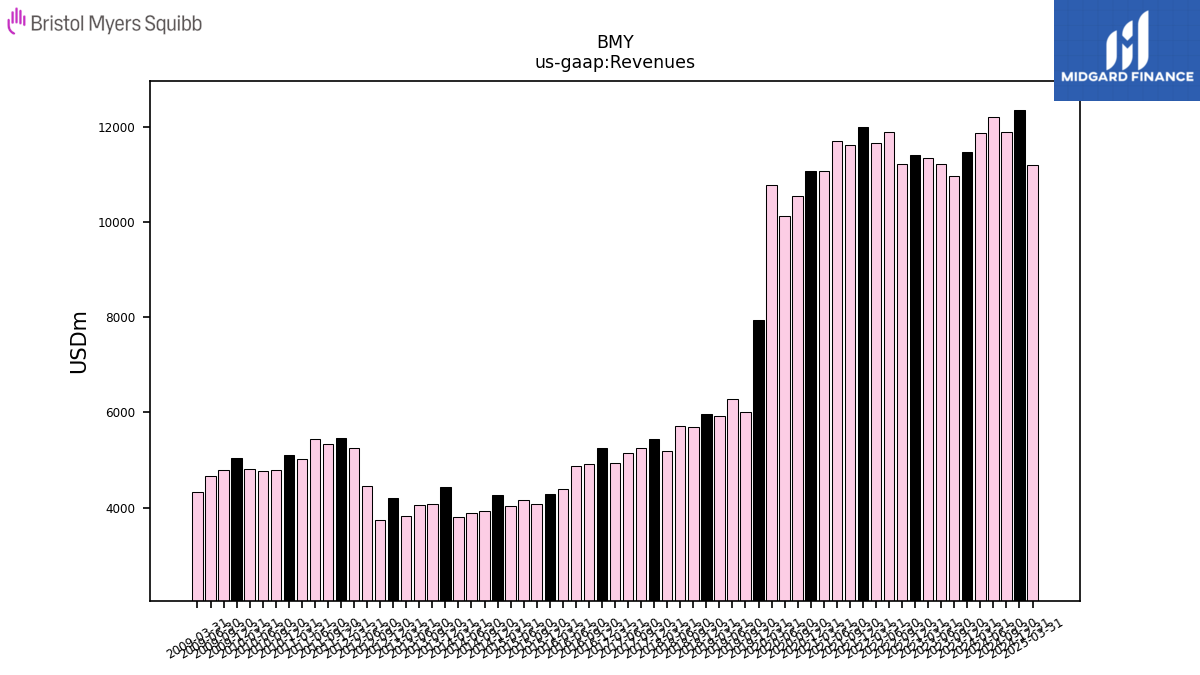 |
BMY | 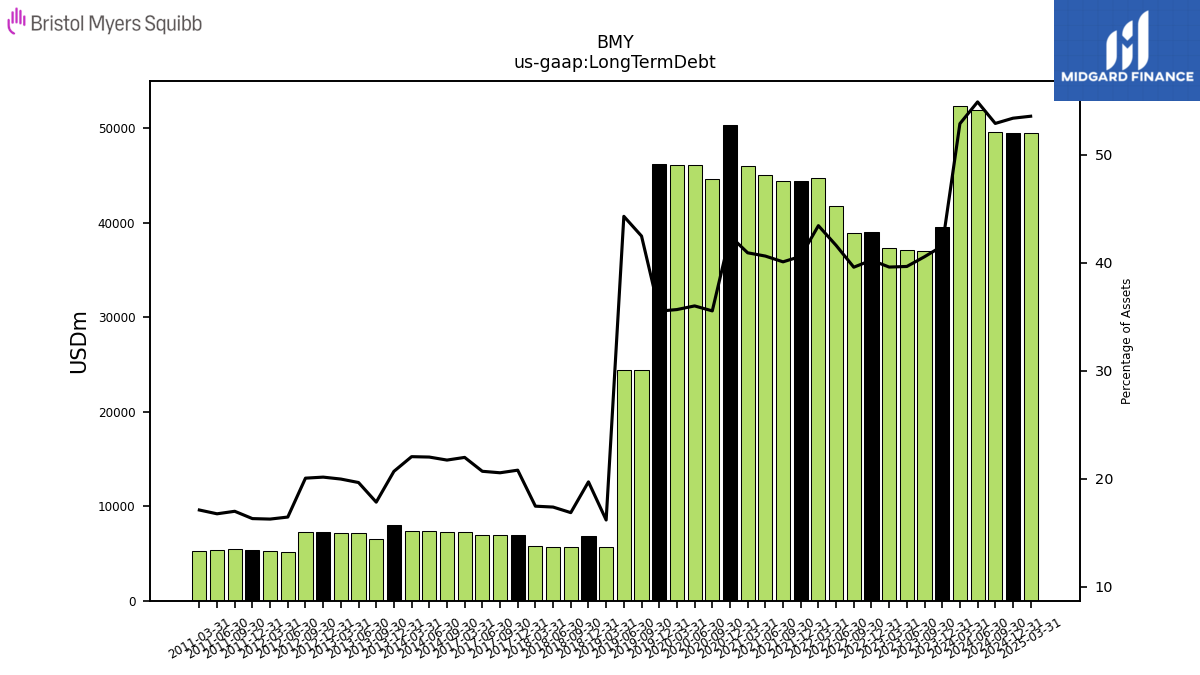 |
BMY | 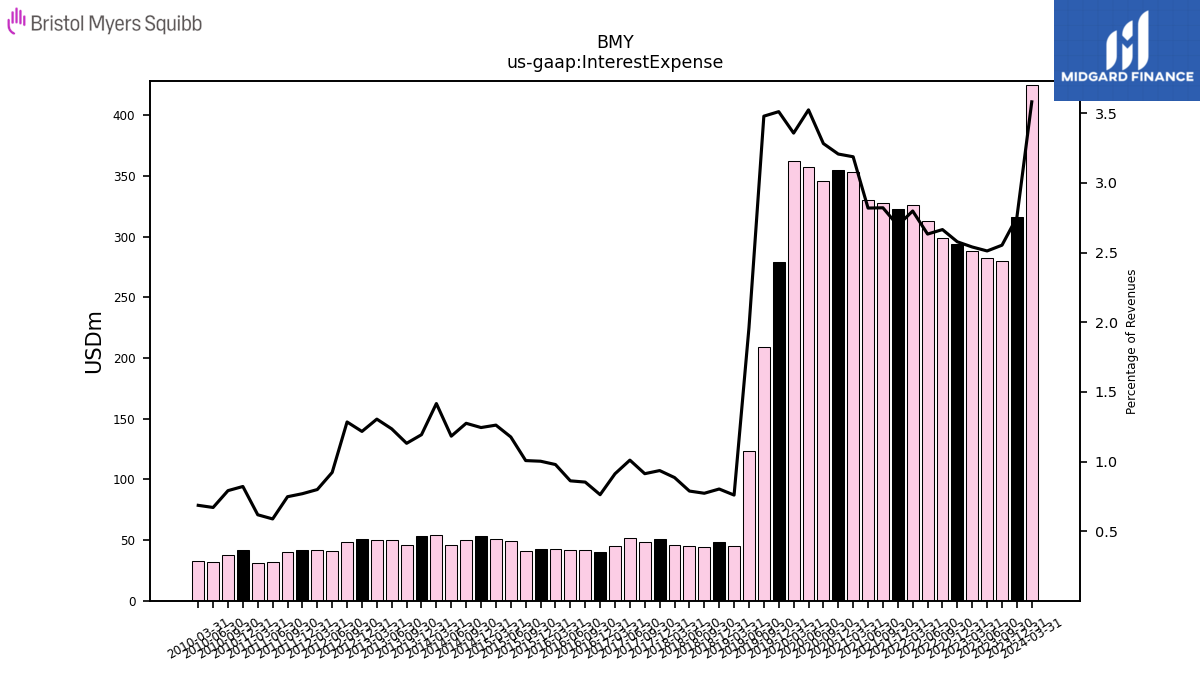 |
 |
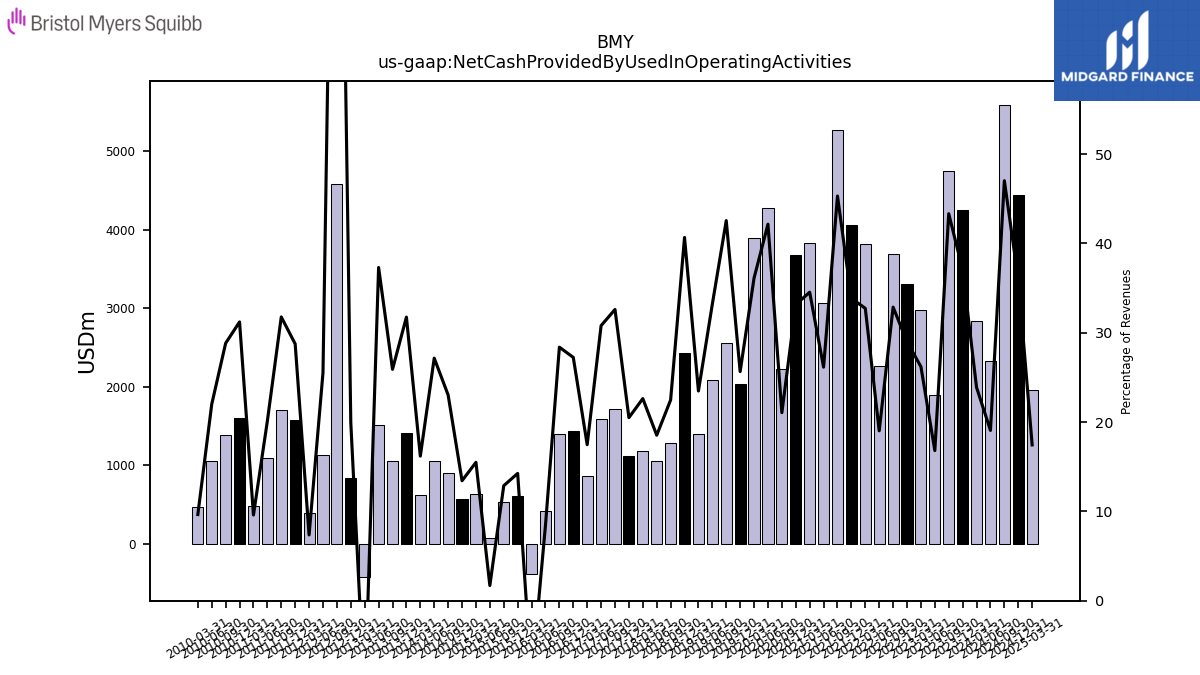 |
BMY | 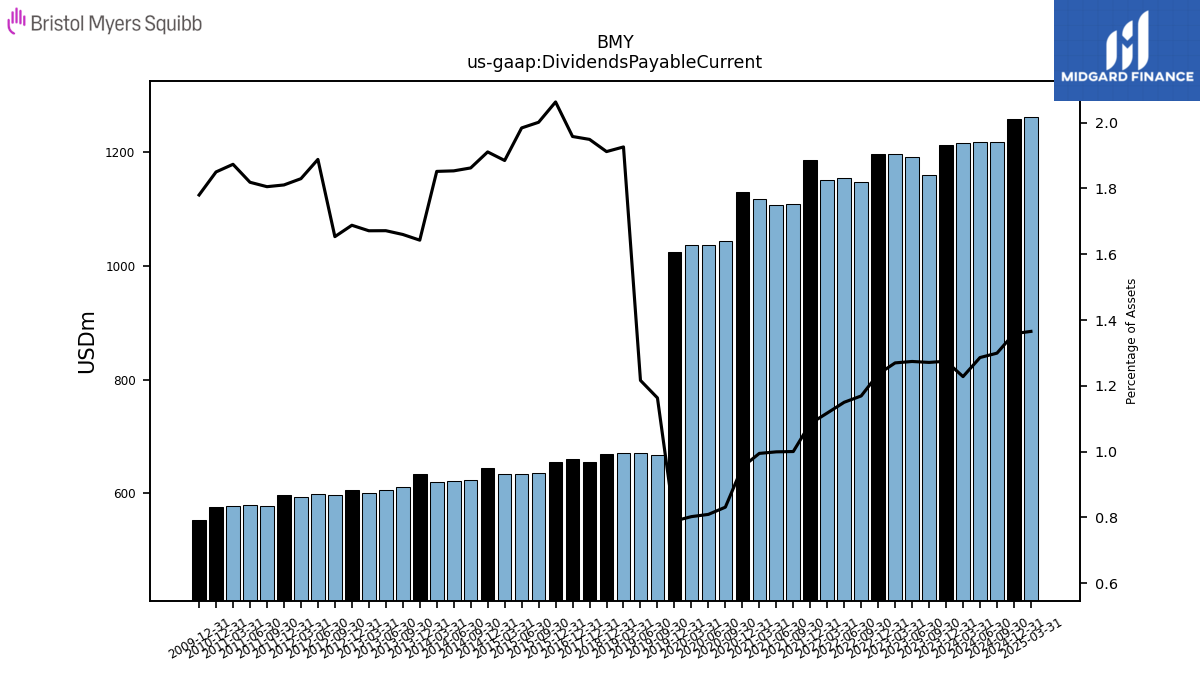 |
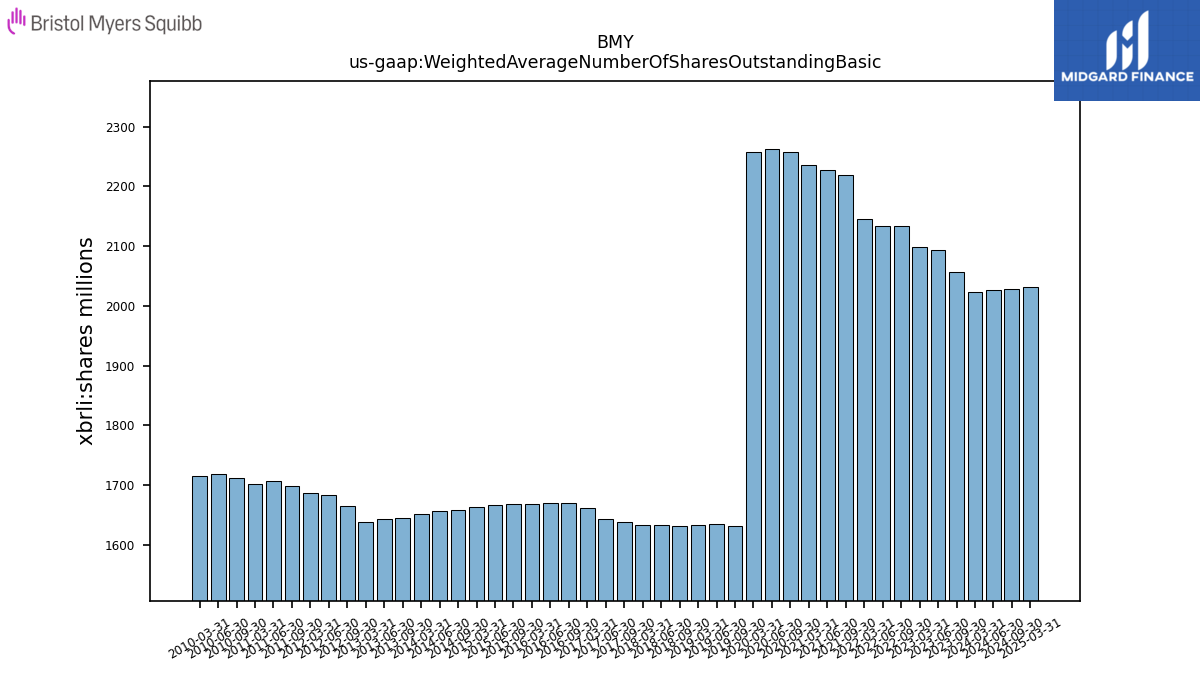 |
BMY | ||||||
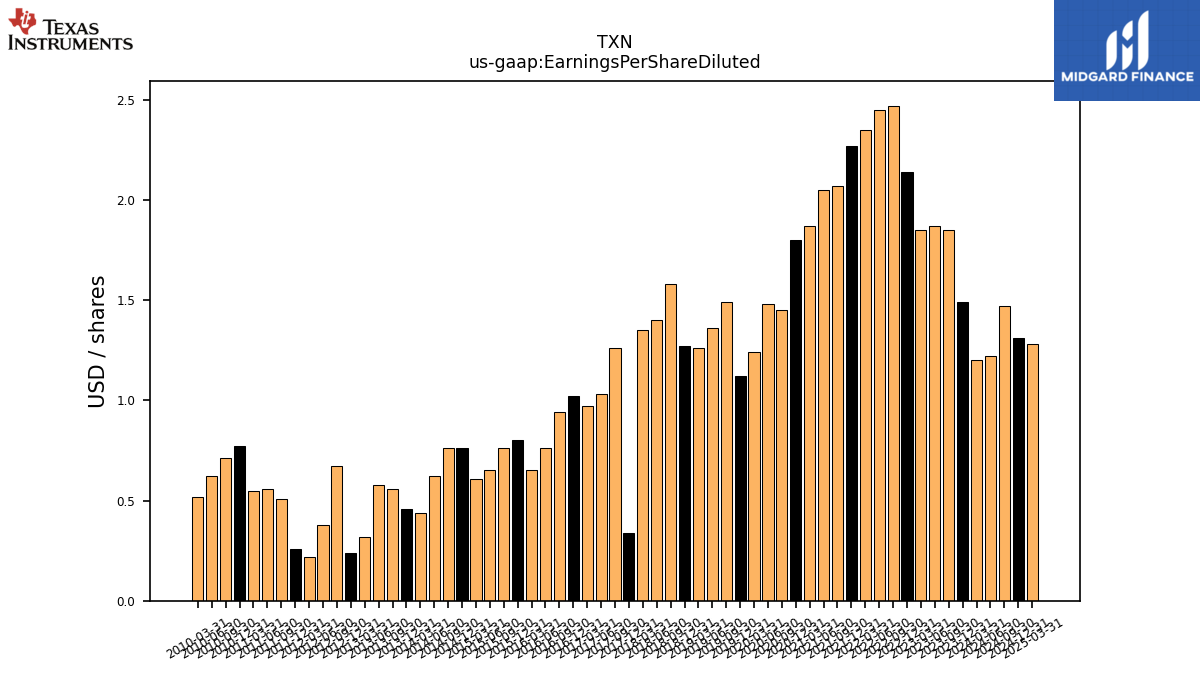
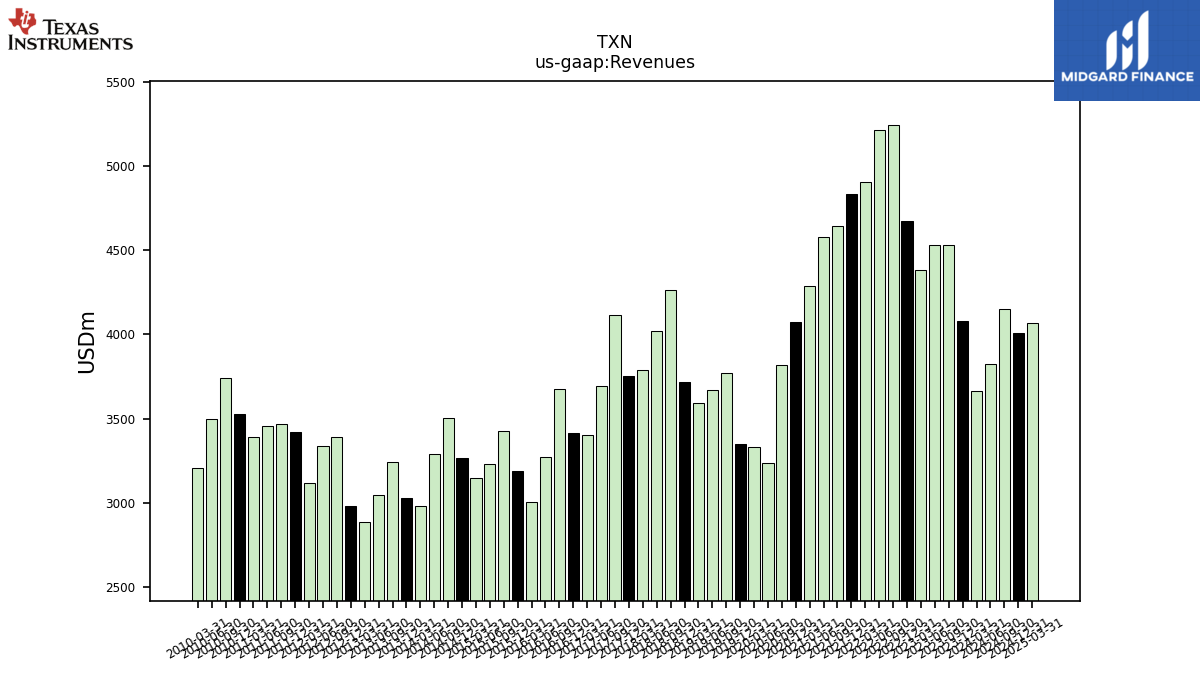
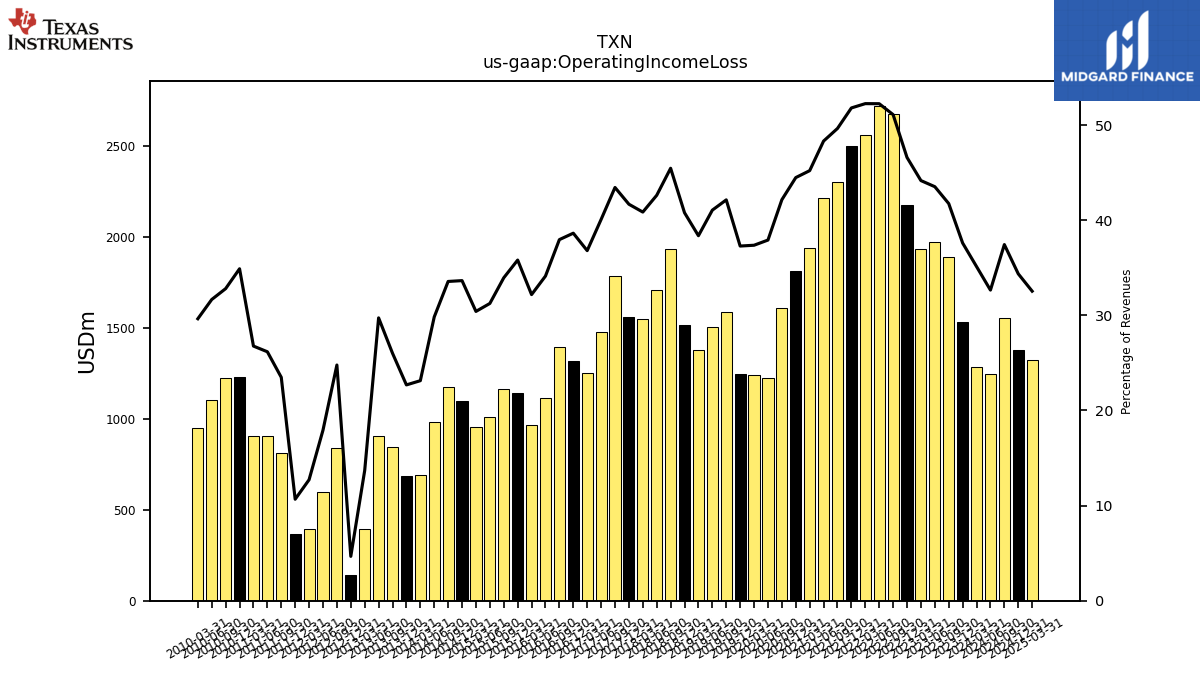
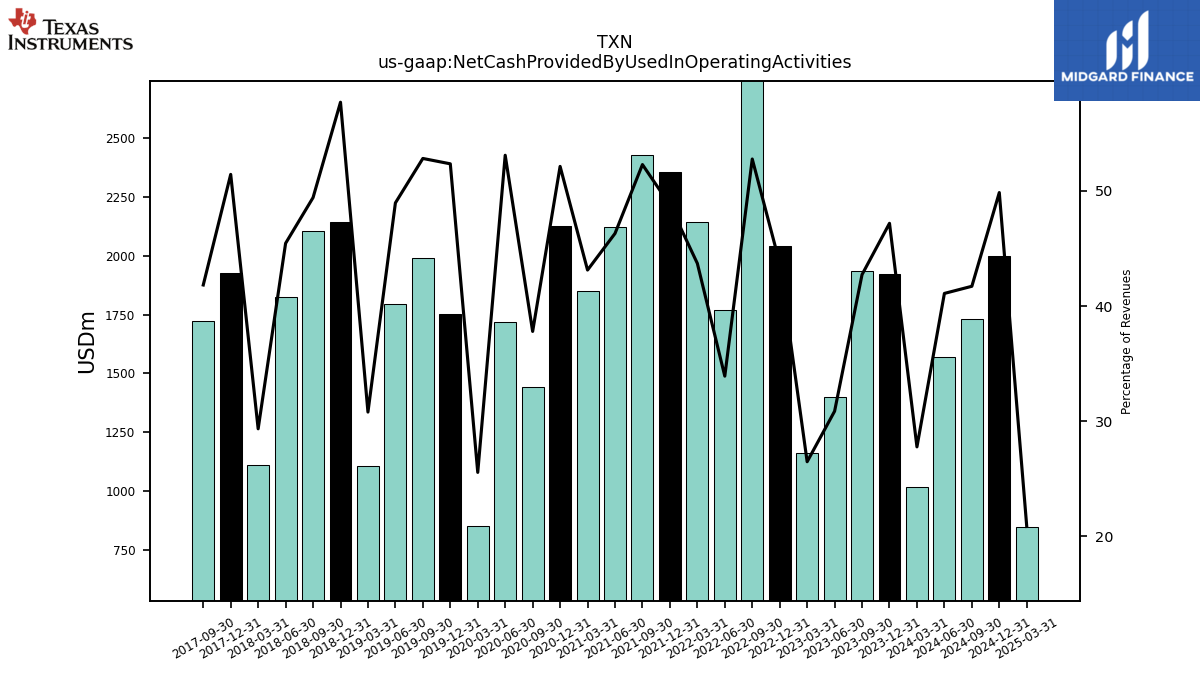
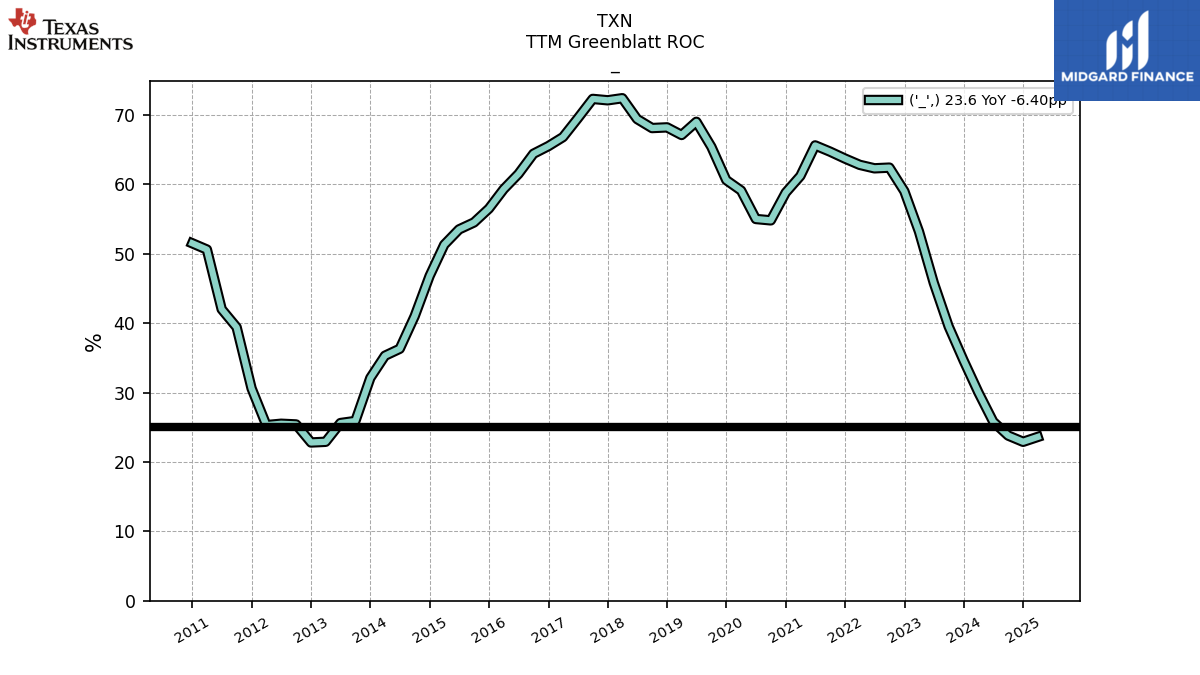
| $TXN$ | 2025-02-14 | 2025-04-24 | 2025-04-23 | NA | NA | TXN | 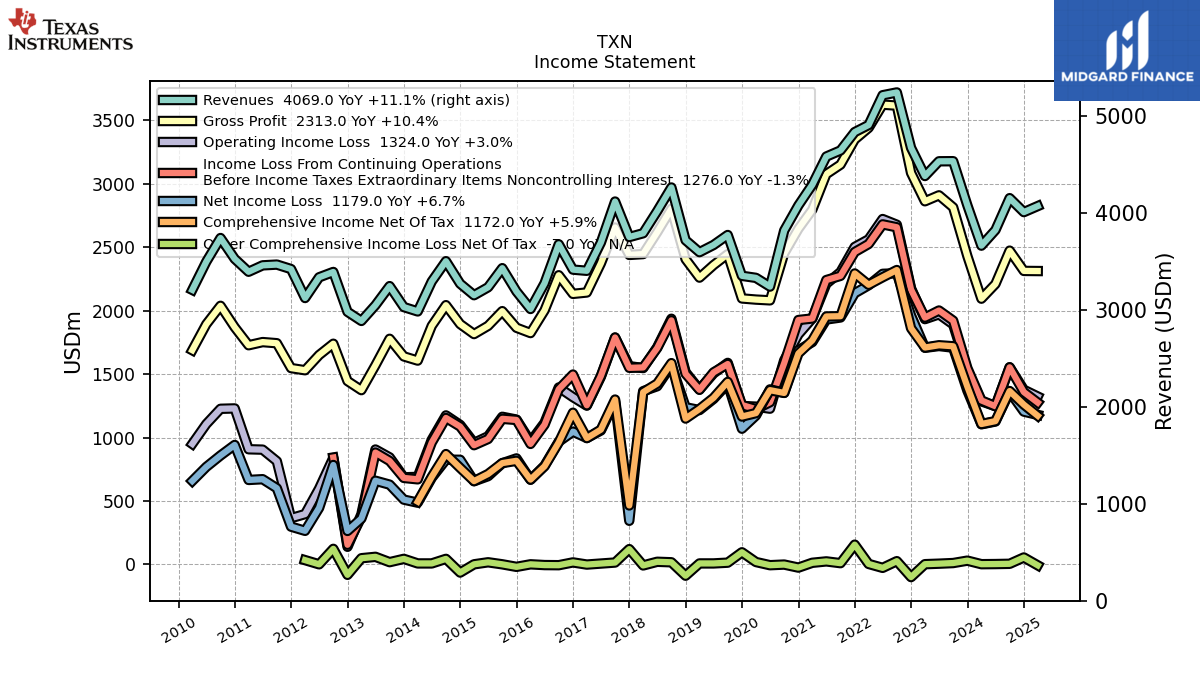 |
 |
 |
TXN | 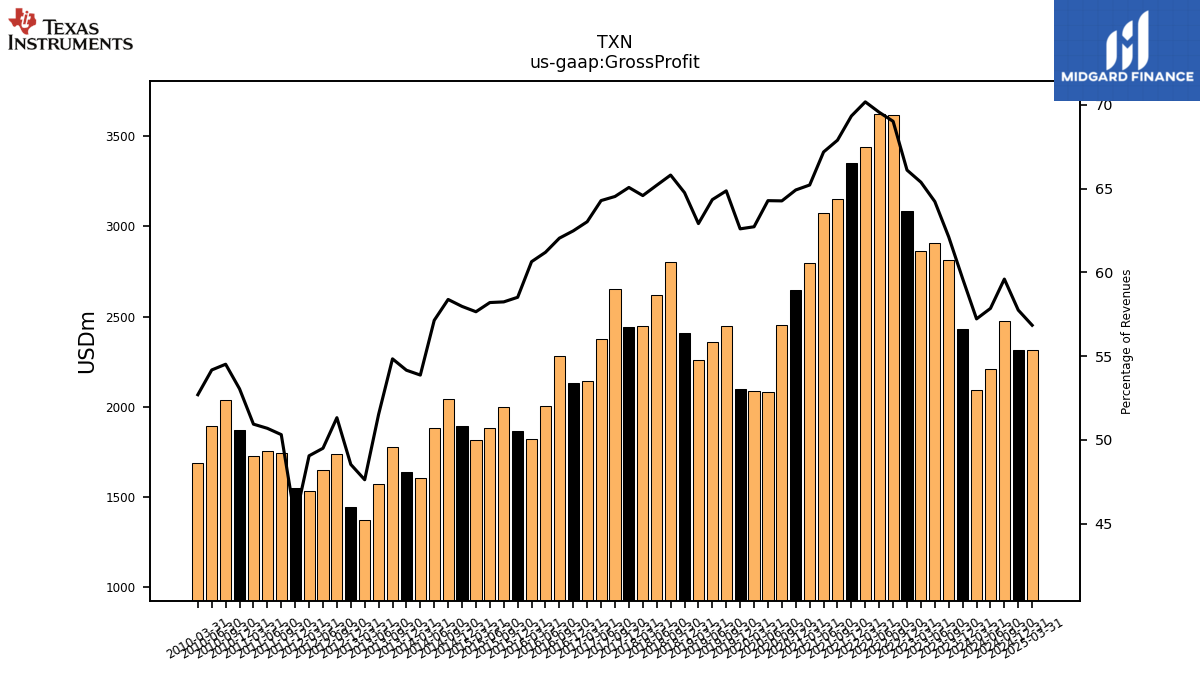 |
 |
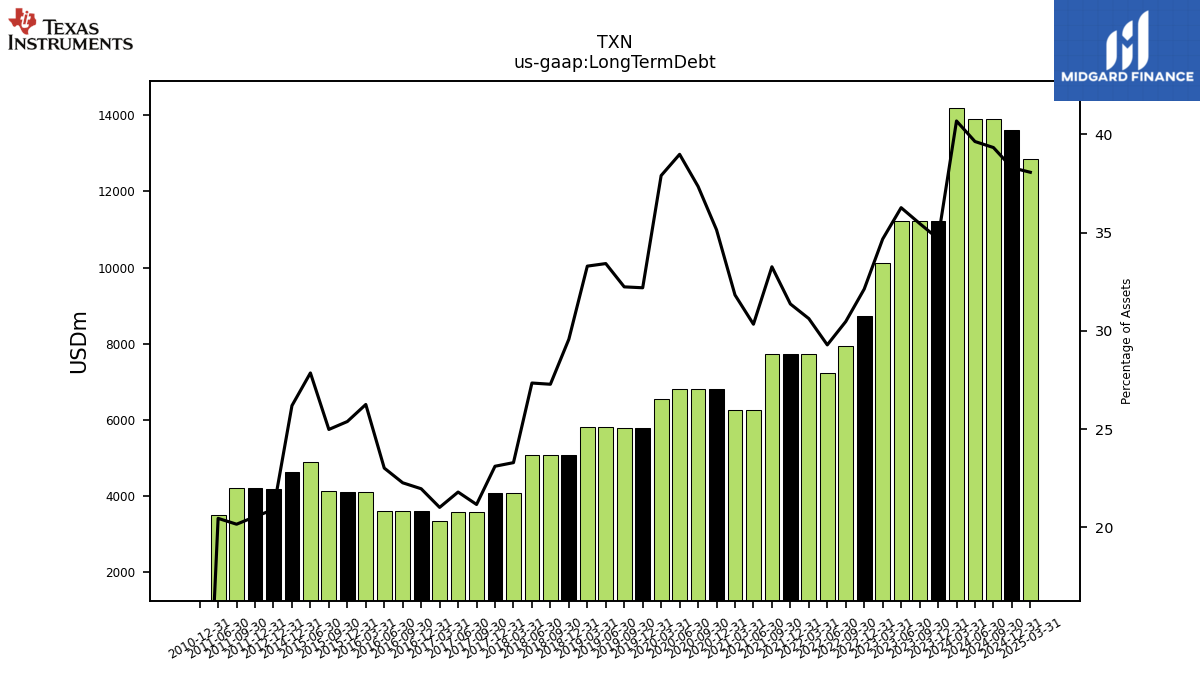 |
TXN | 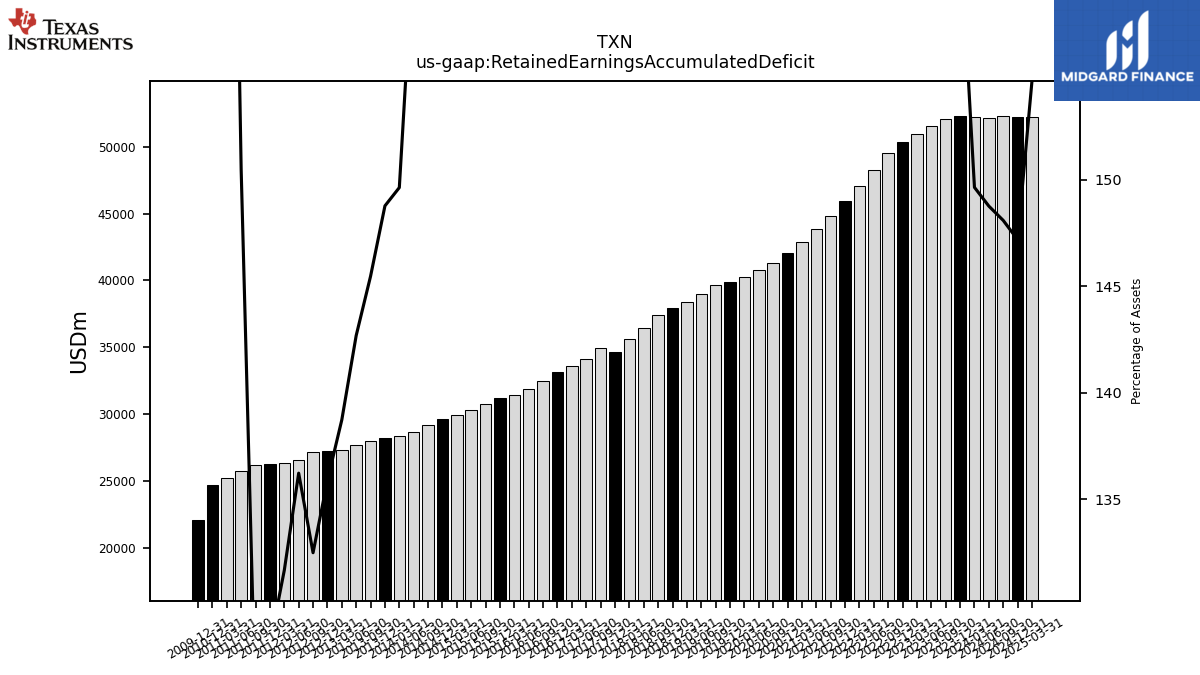 |
 |
TXN | 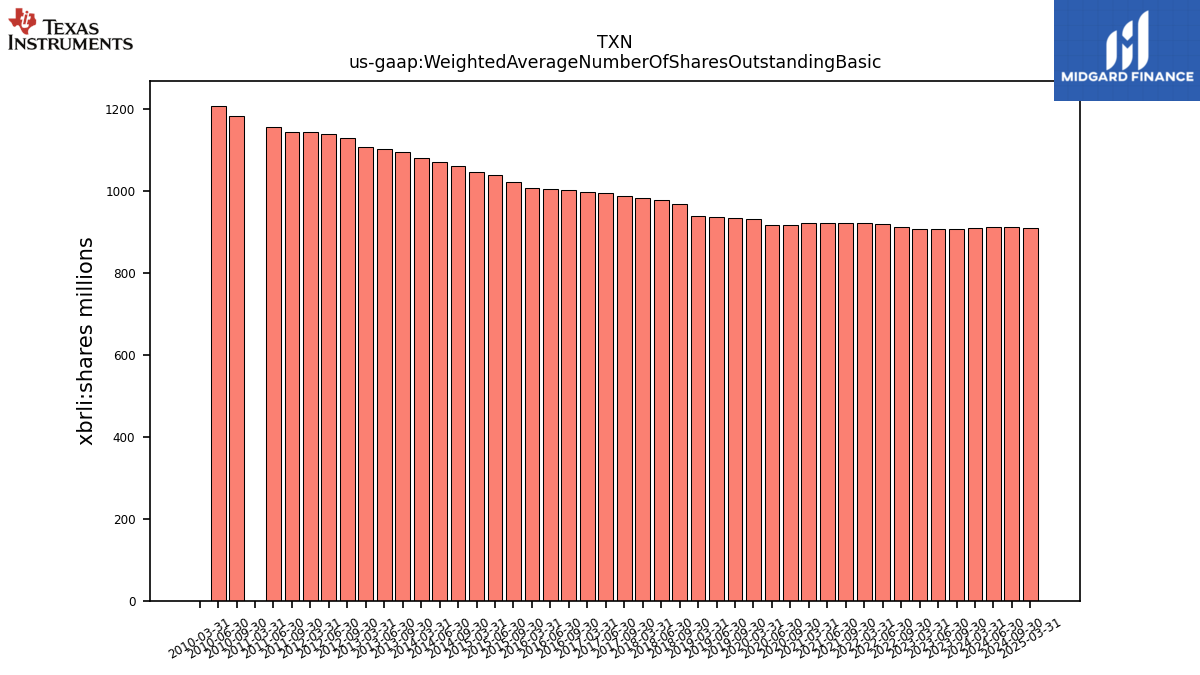 |
 |
TXN | |||||
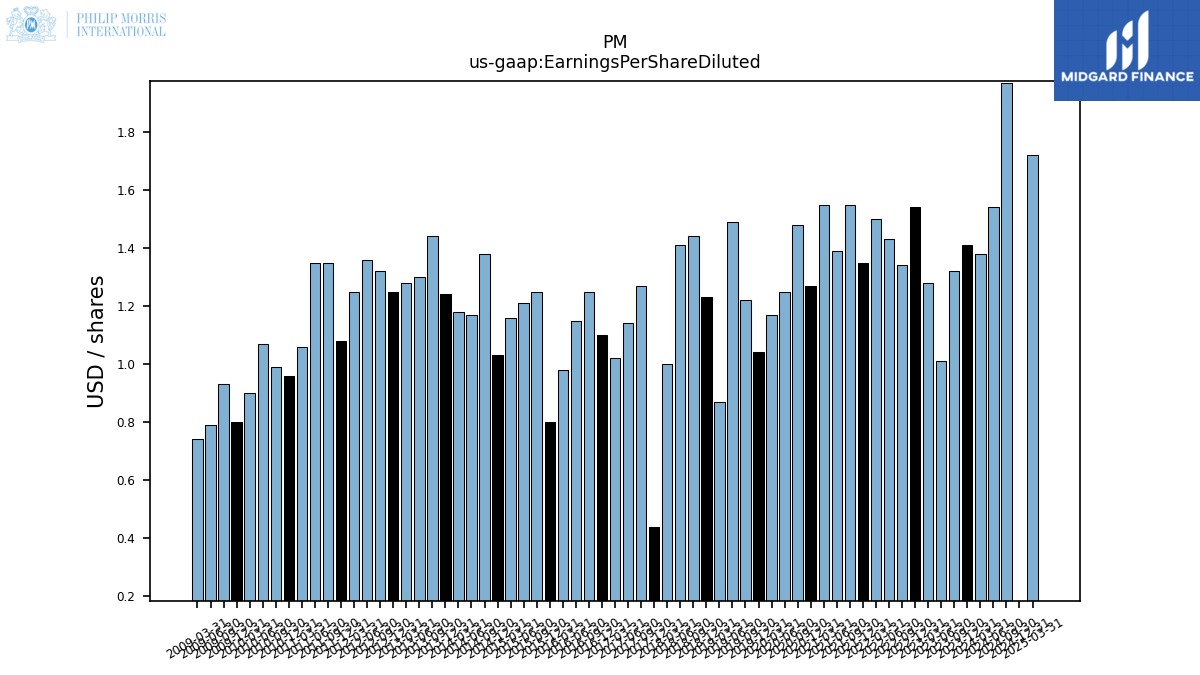
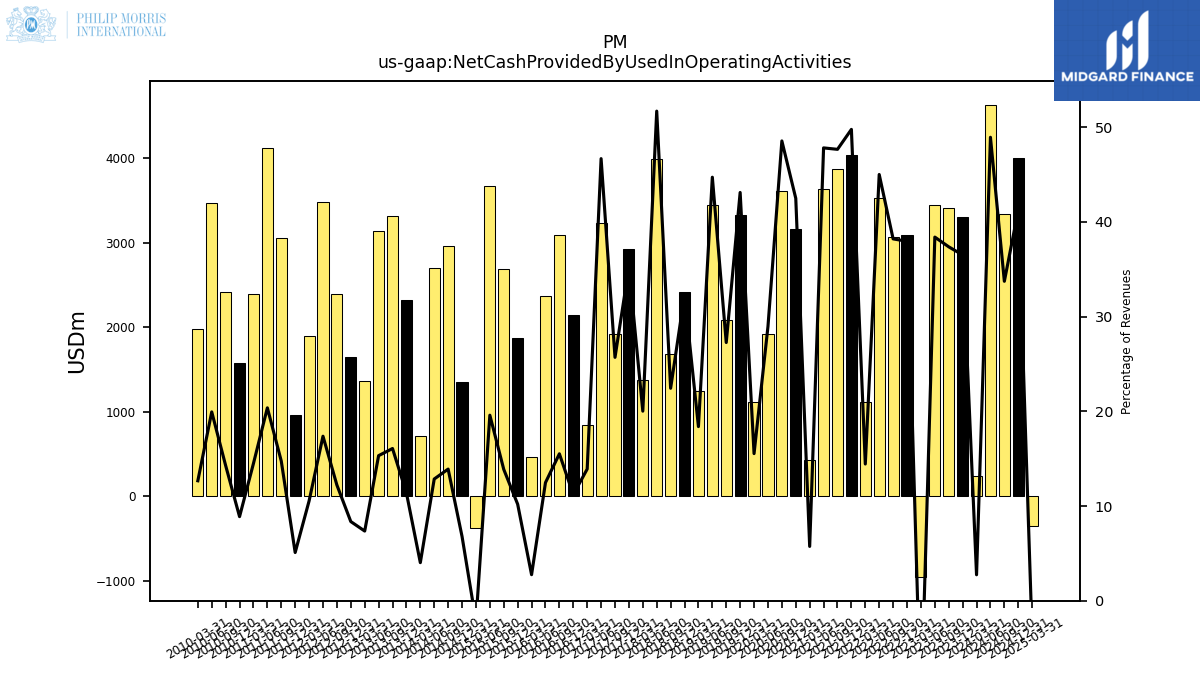
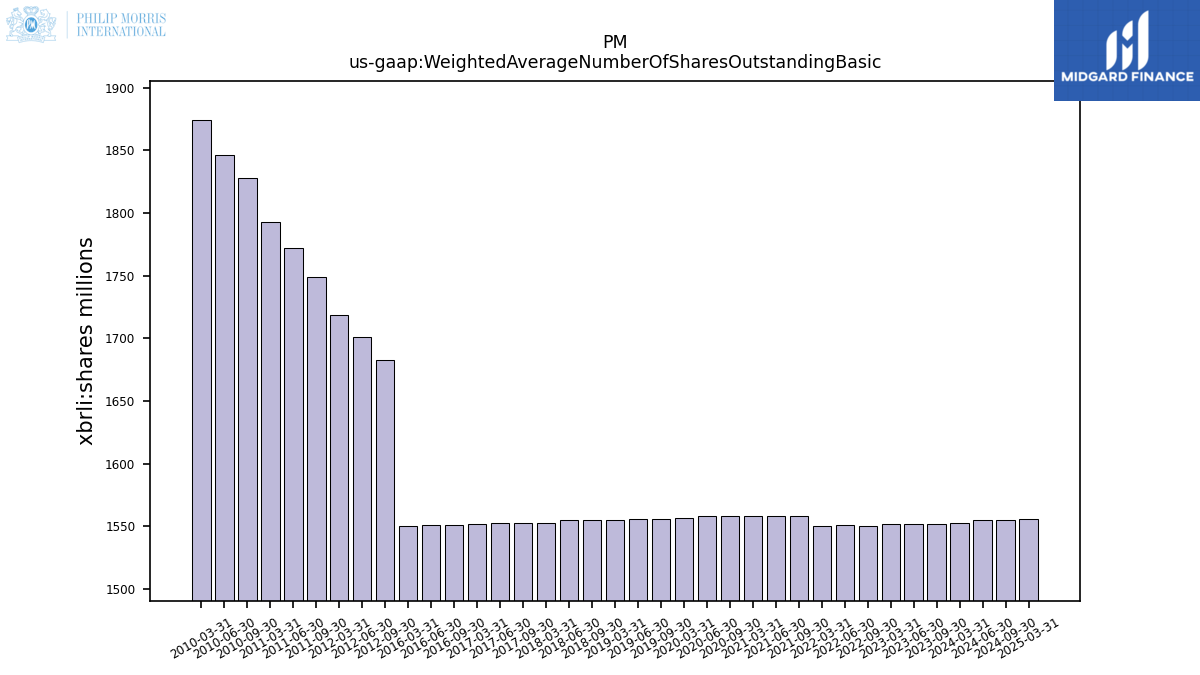
| $PM$ | 2025-02-06 | 2025-04-24 | 2025-04-23 |  |
NA | NA | PM | 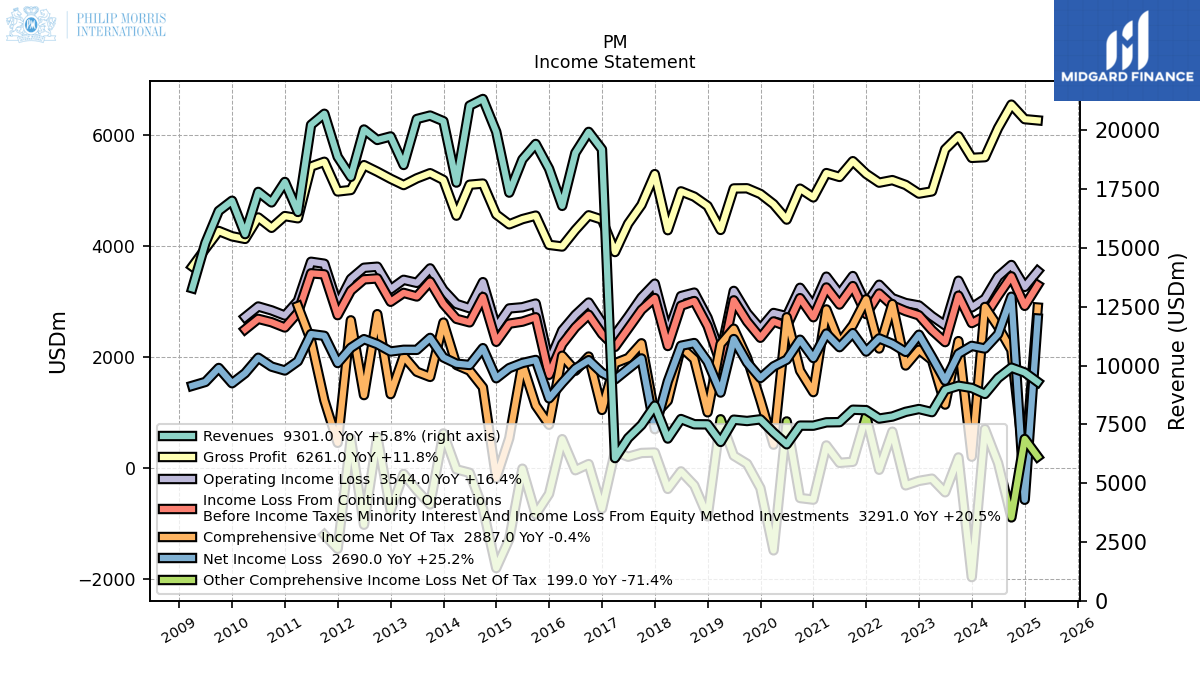 |
 |
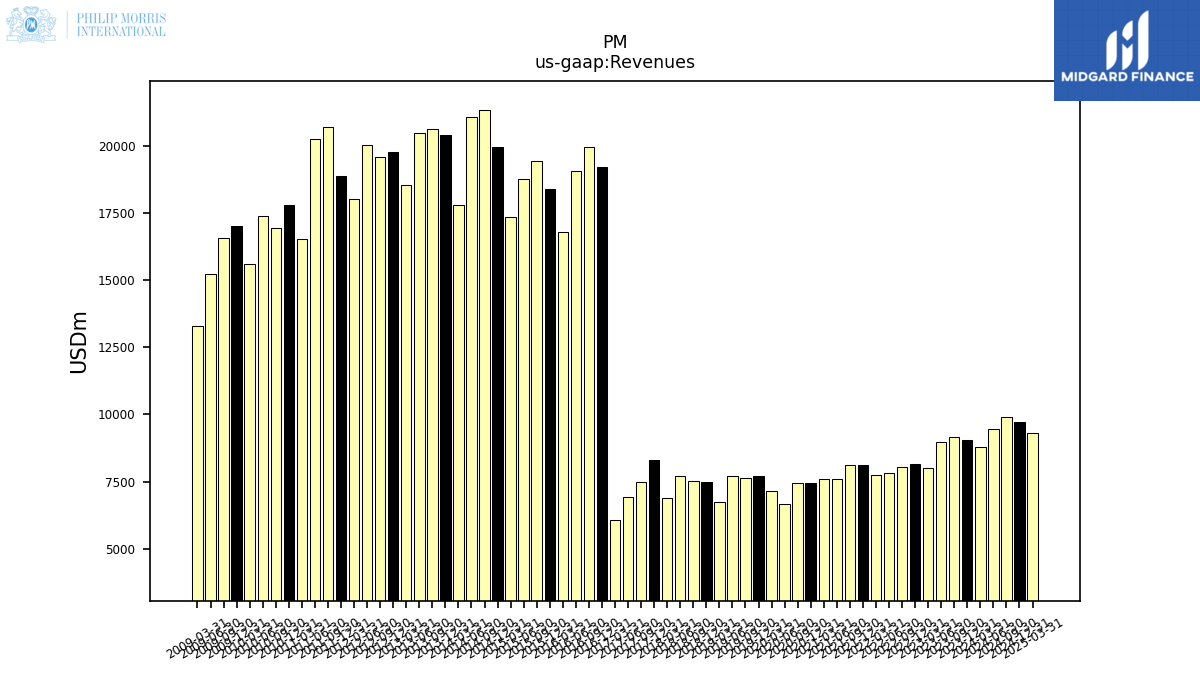 |
PM | 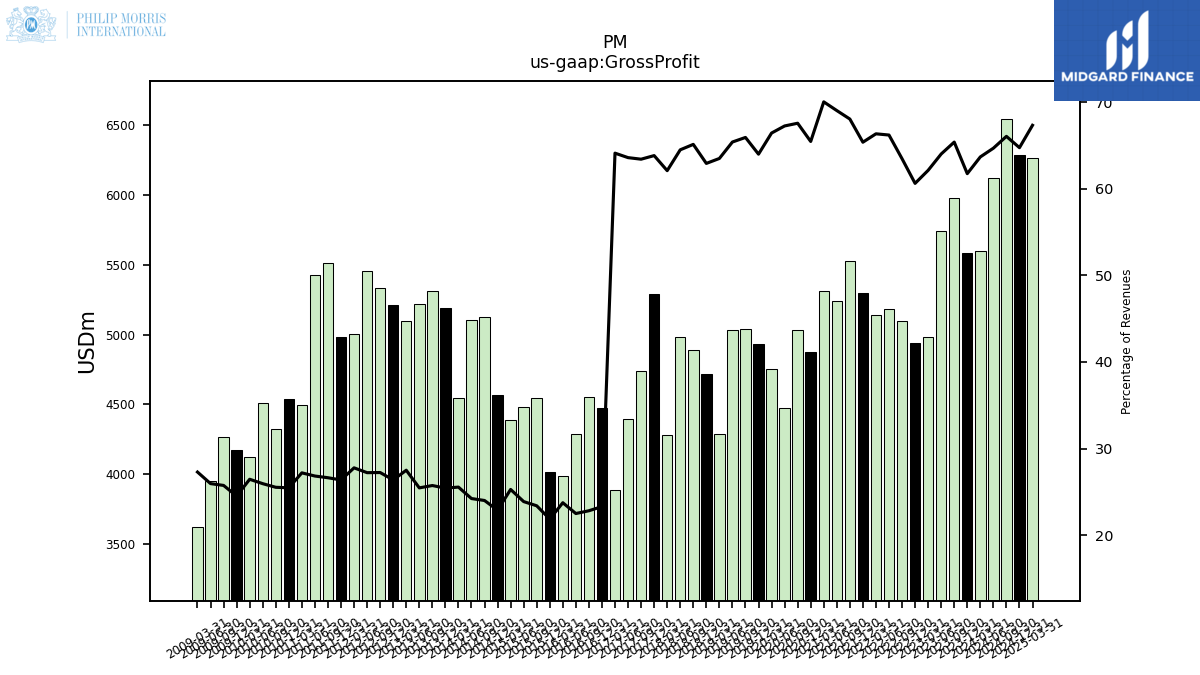 |
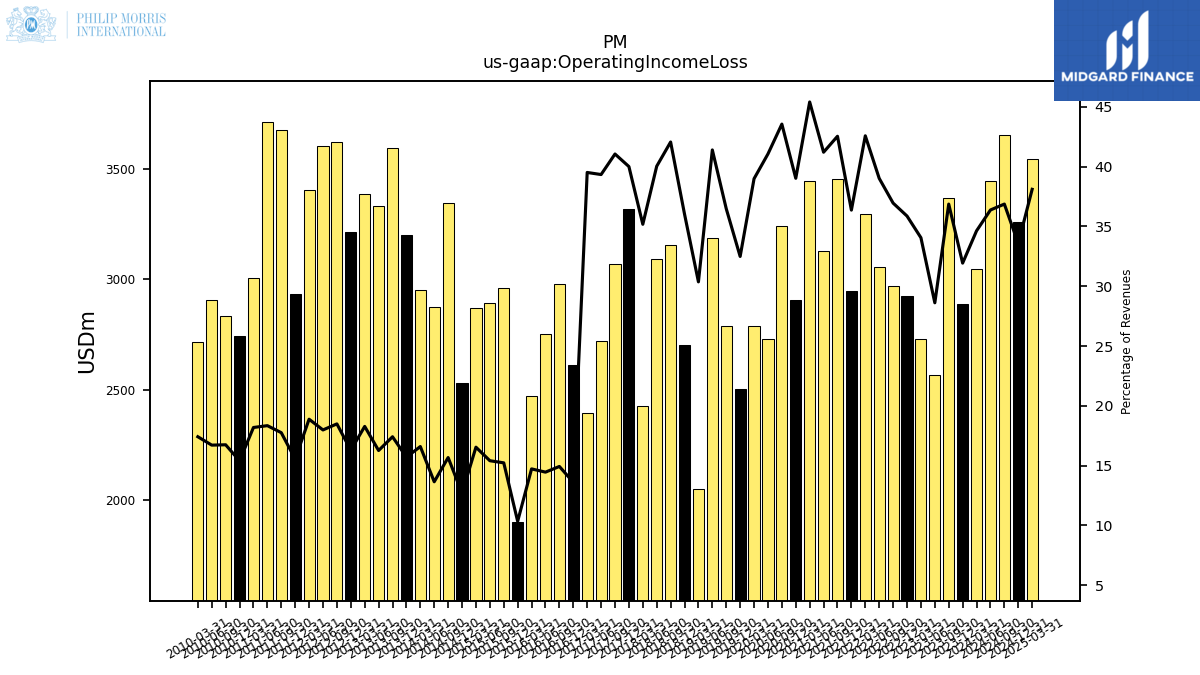 |
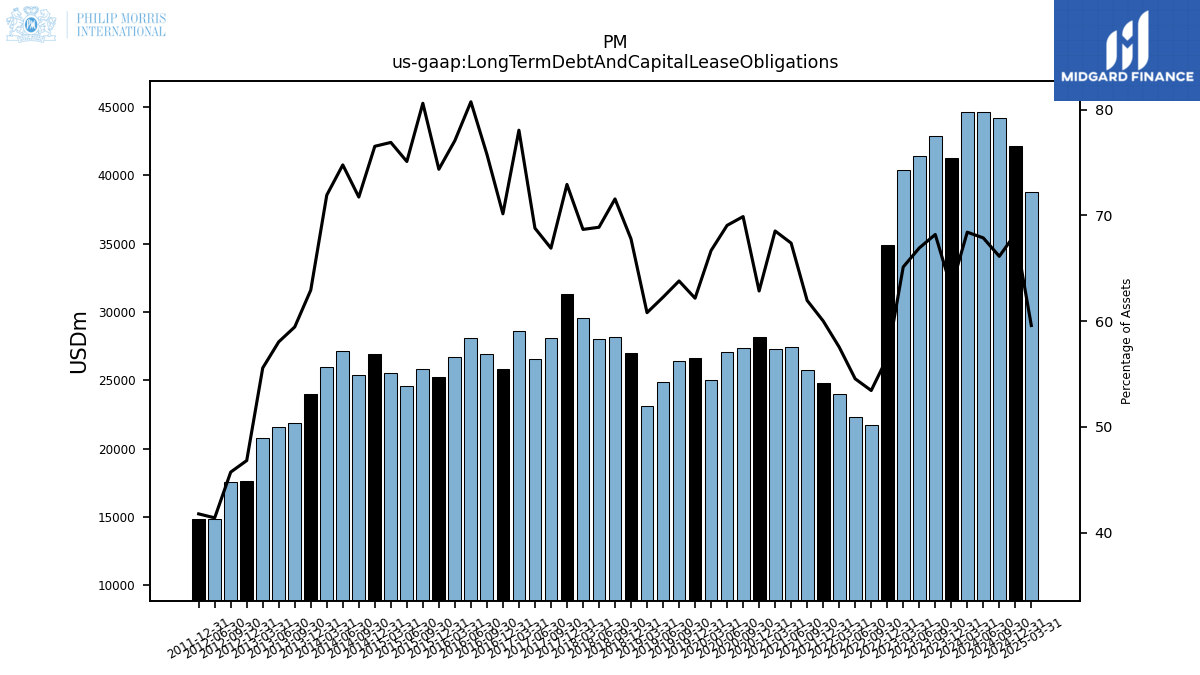 |
PM | 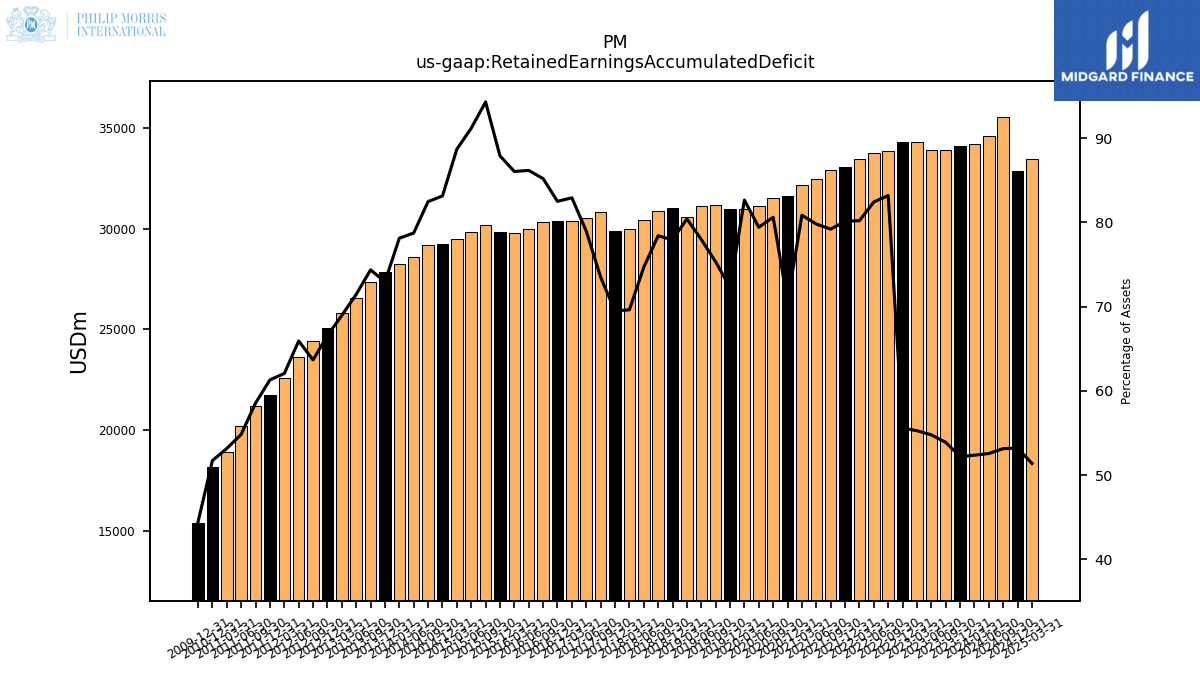 |
 |
PM | 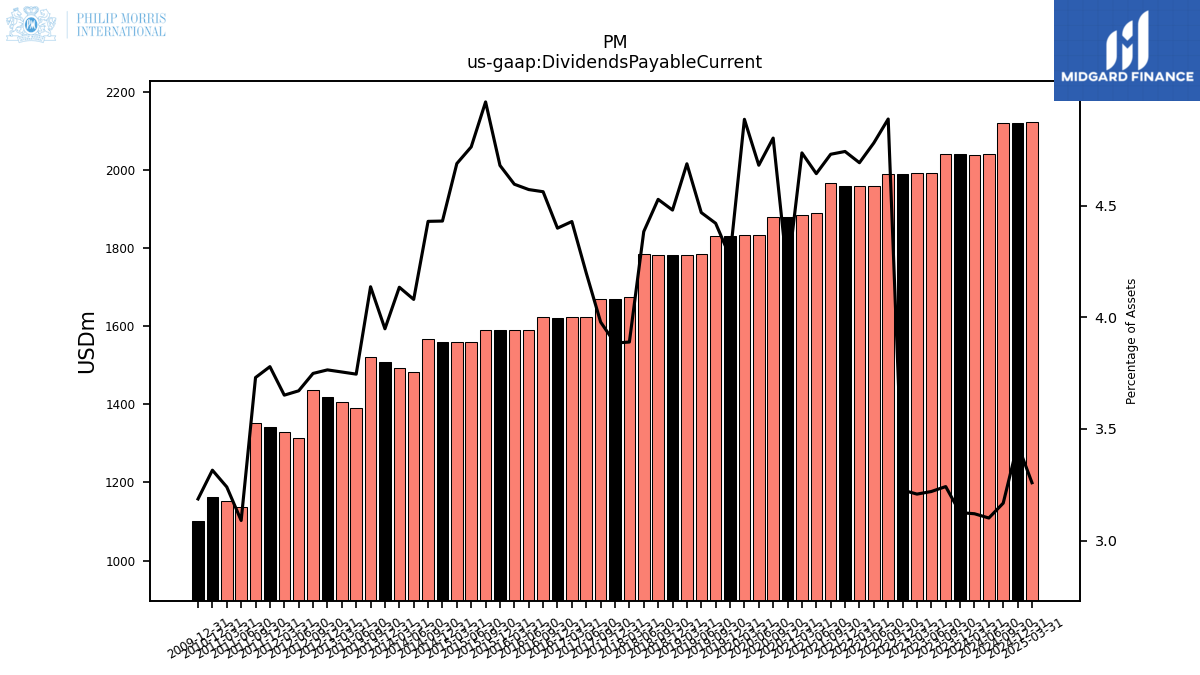 |
 |
PM | ||||
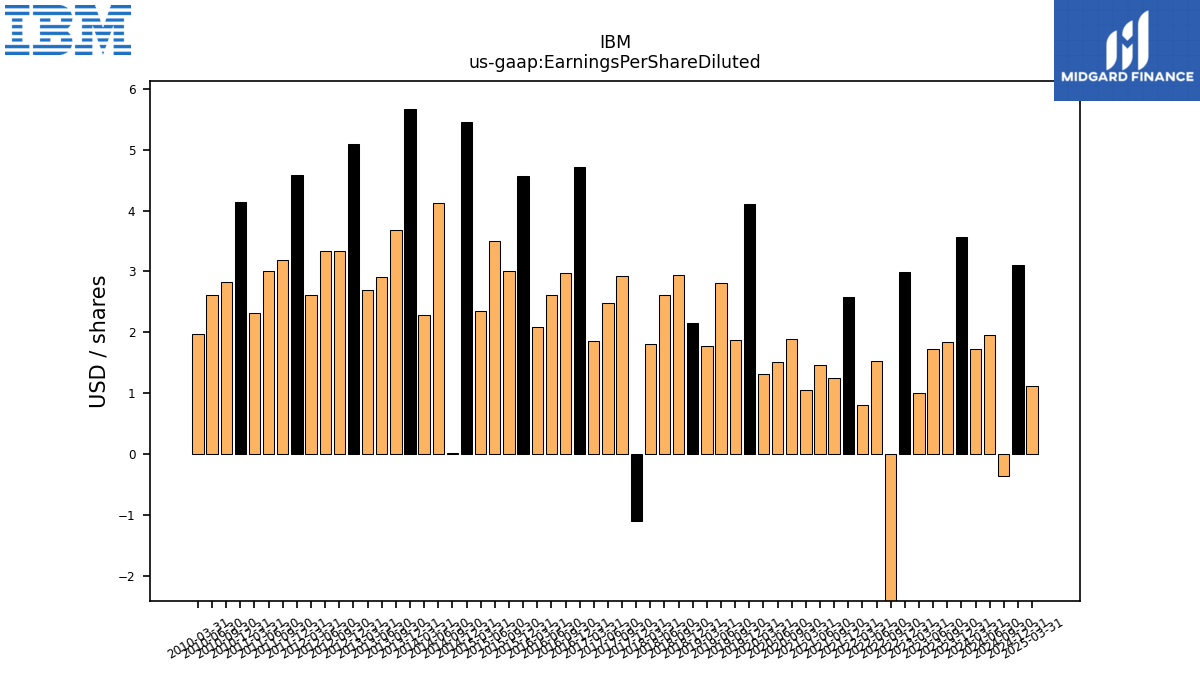
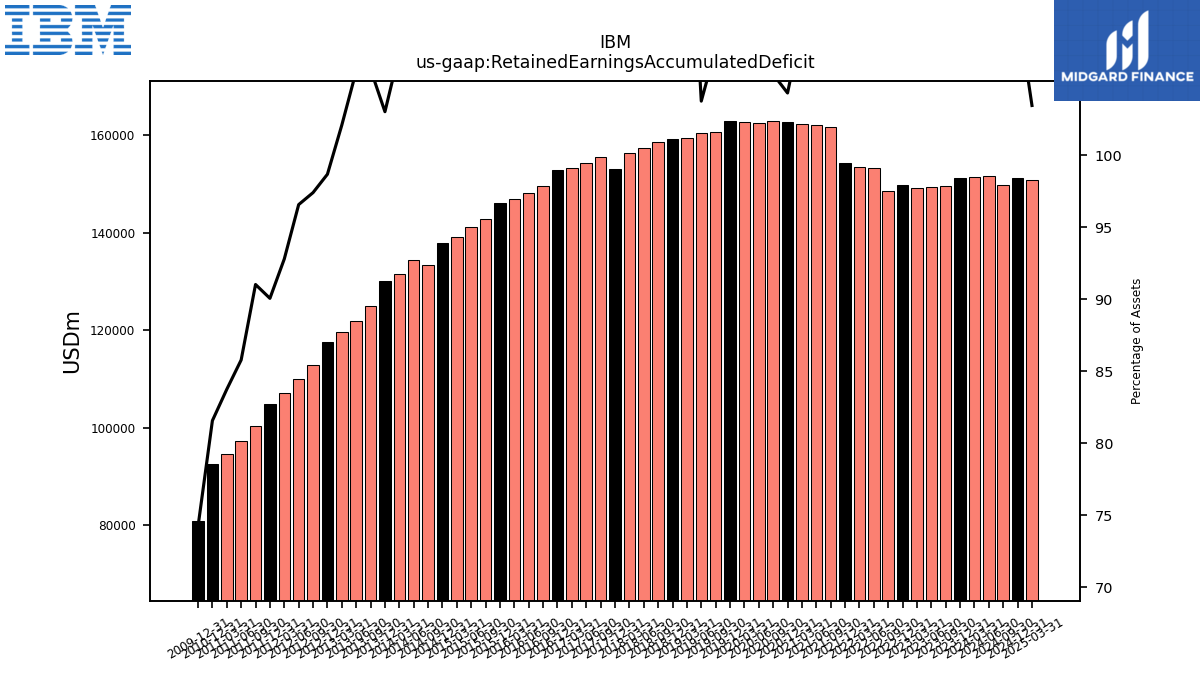
| $IBM$ | 2025-02-25 | 2025-04-24 | 2025-04-23 | NA | NA | IBM | 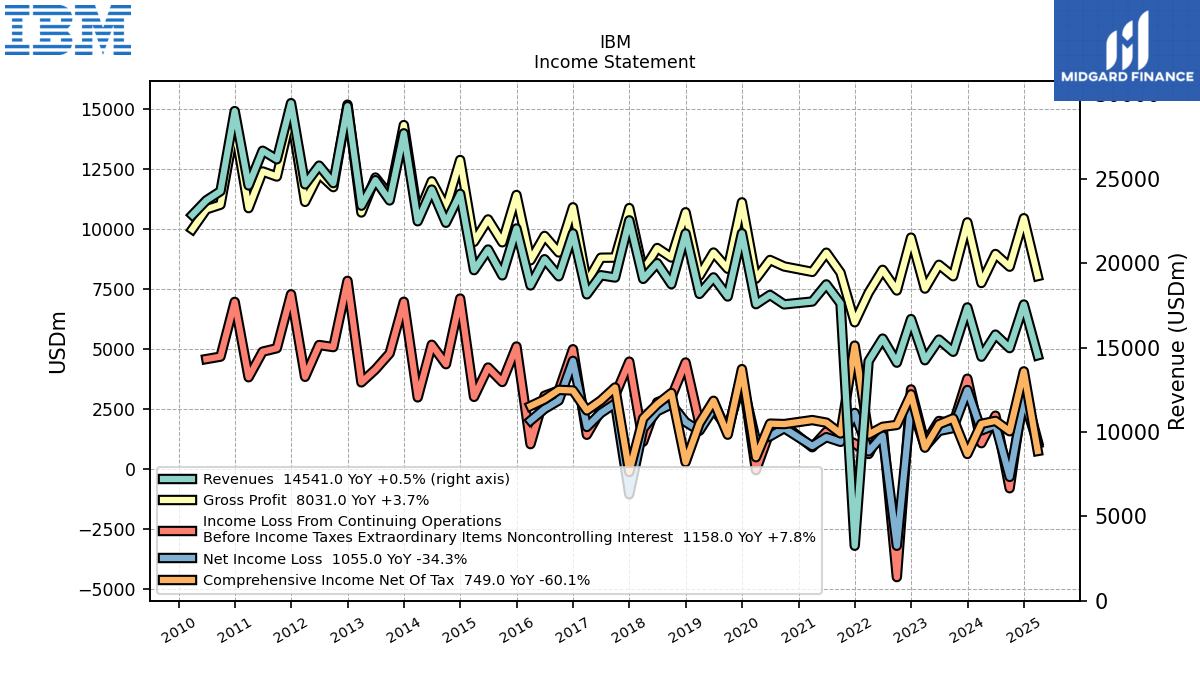 |
 |
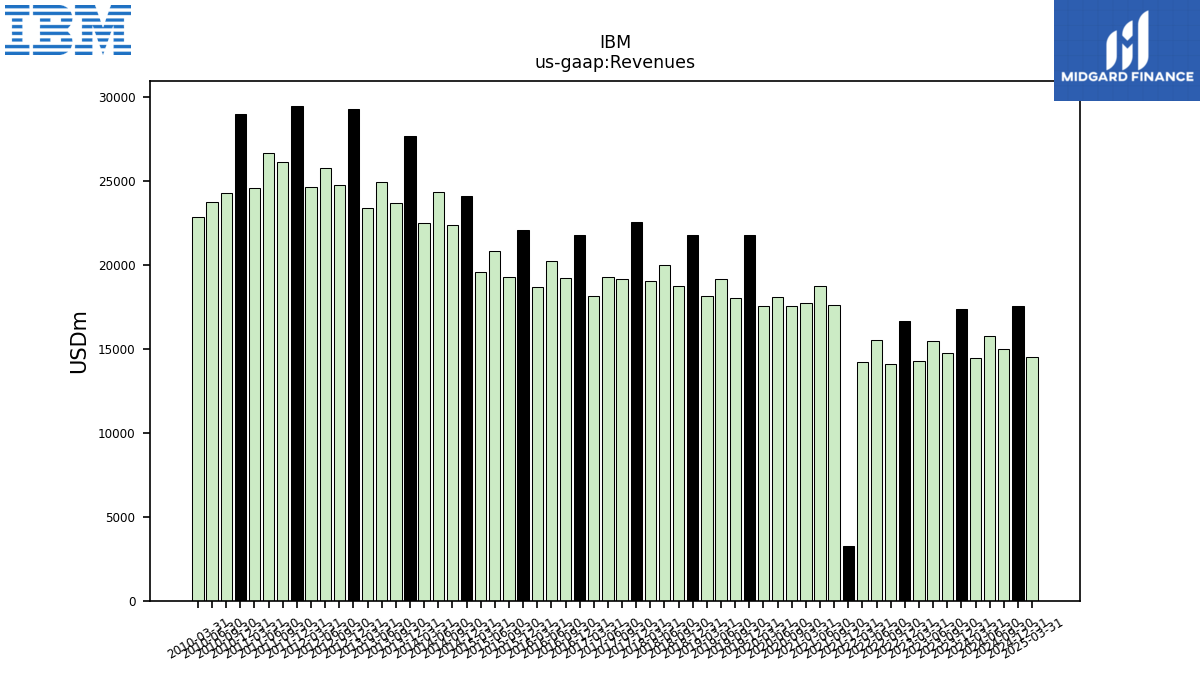 |
IBM | 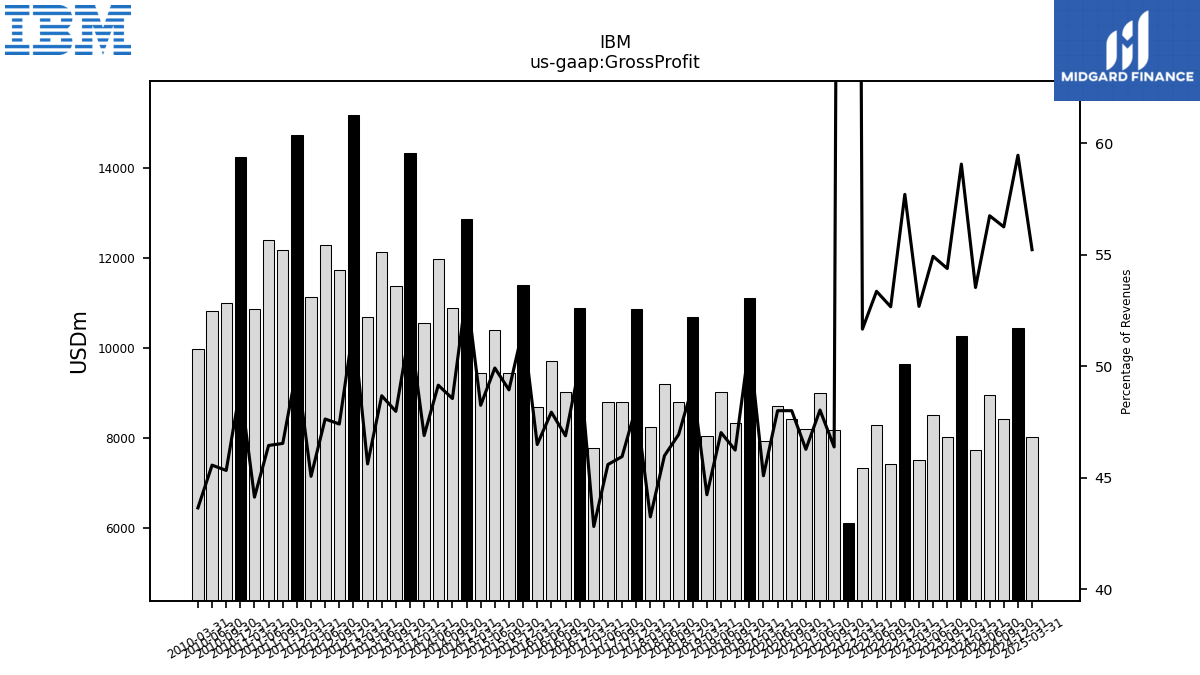 |
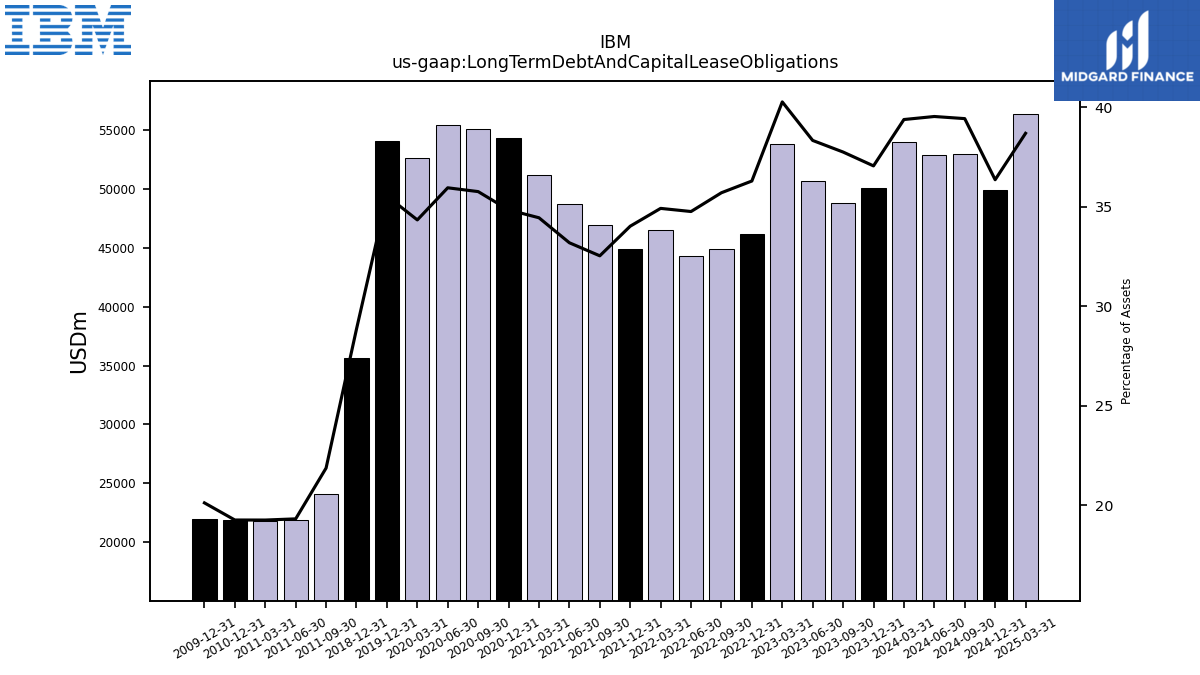 |
IBM | 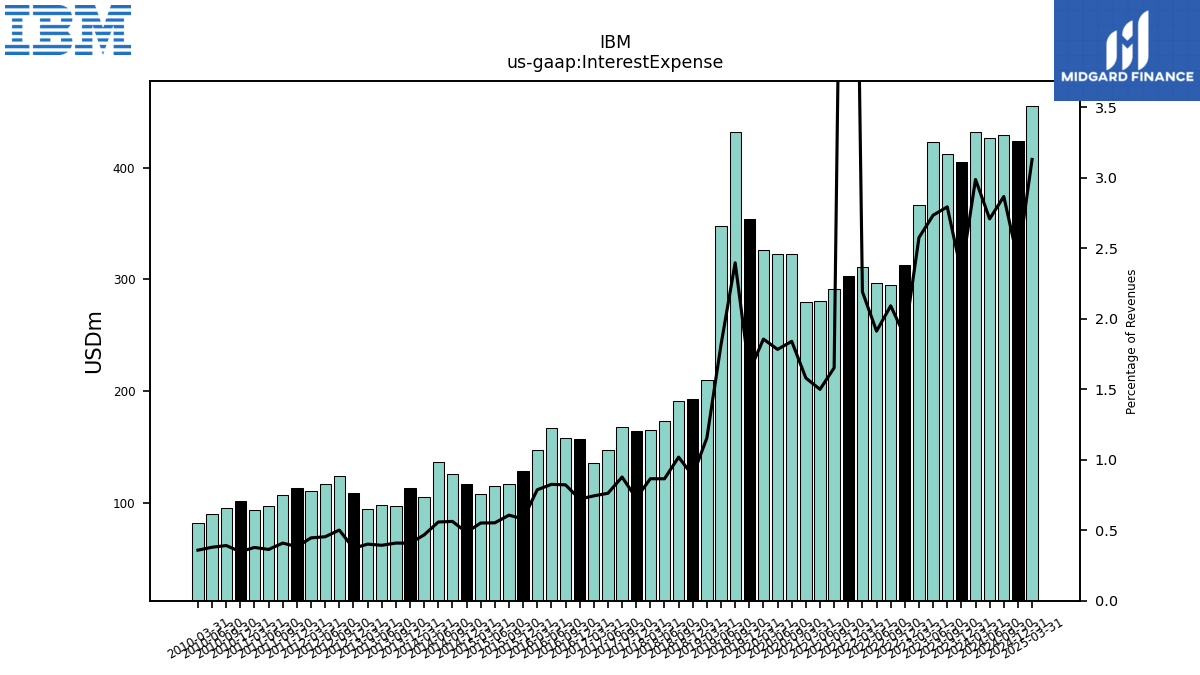 |
 |
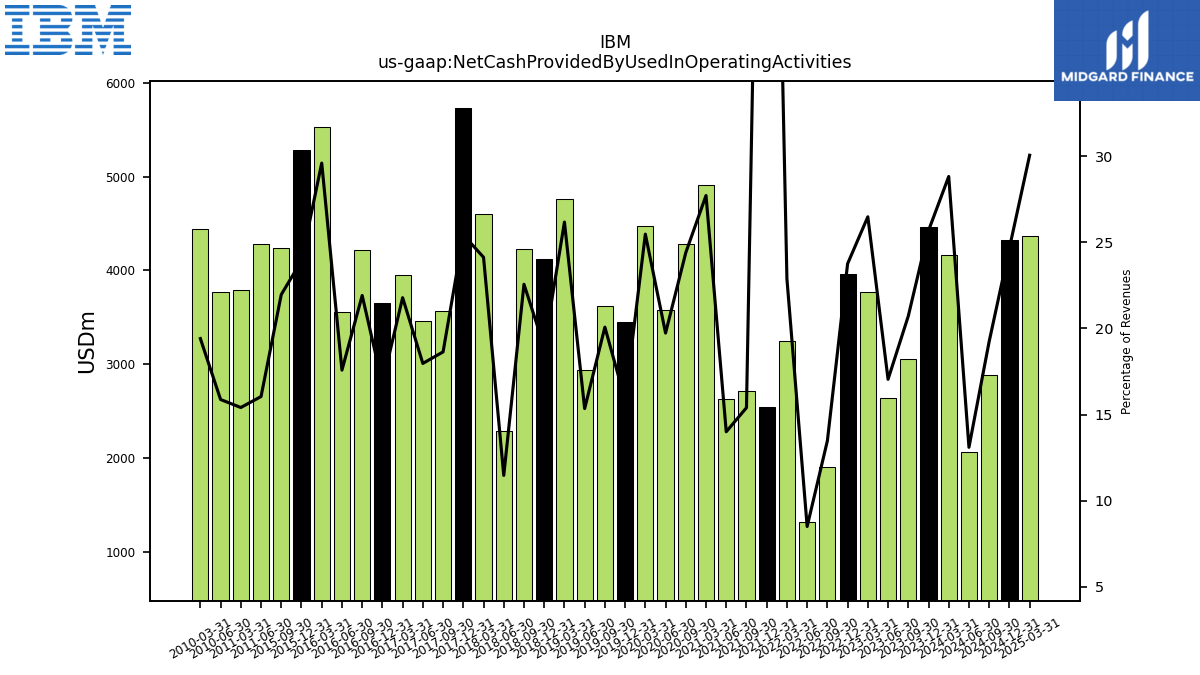 |
IBM | 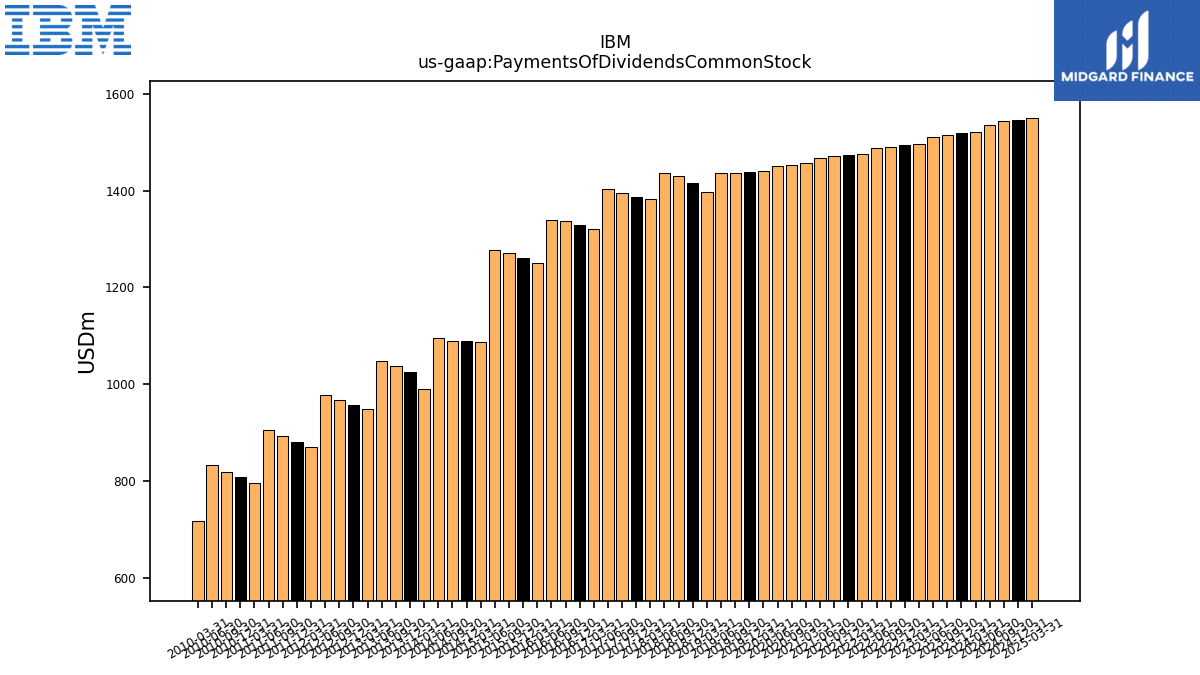 |
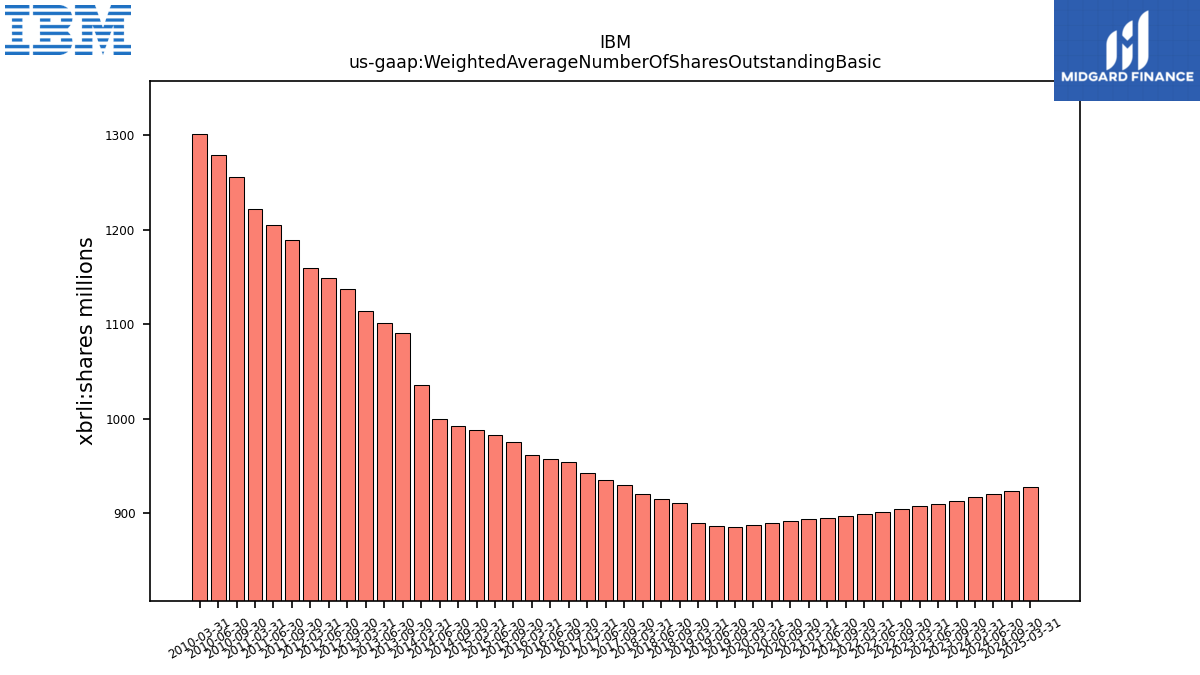 |
IBM | |||||
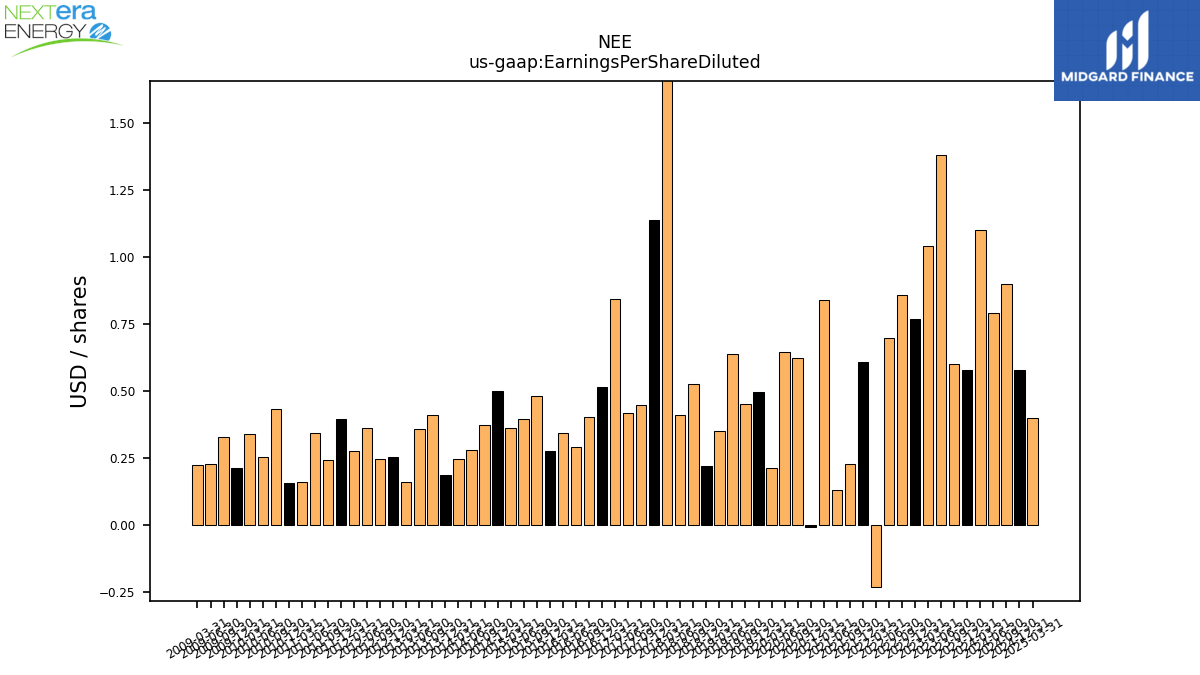
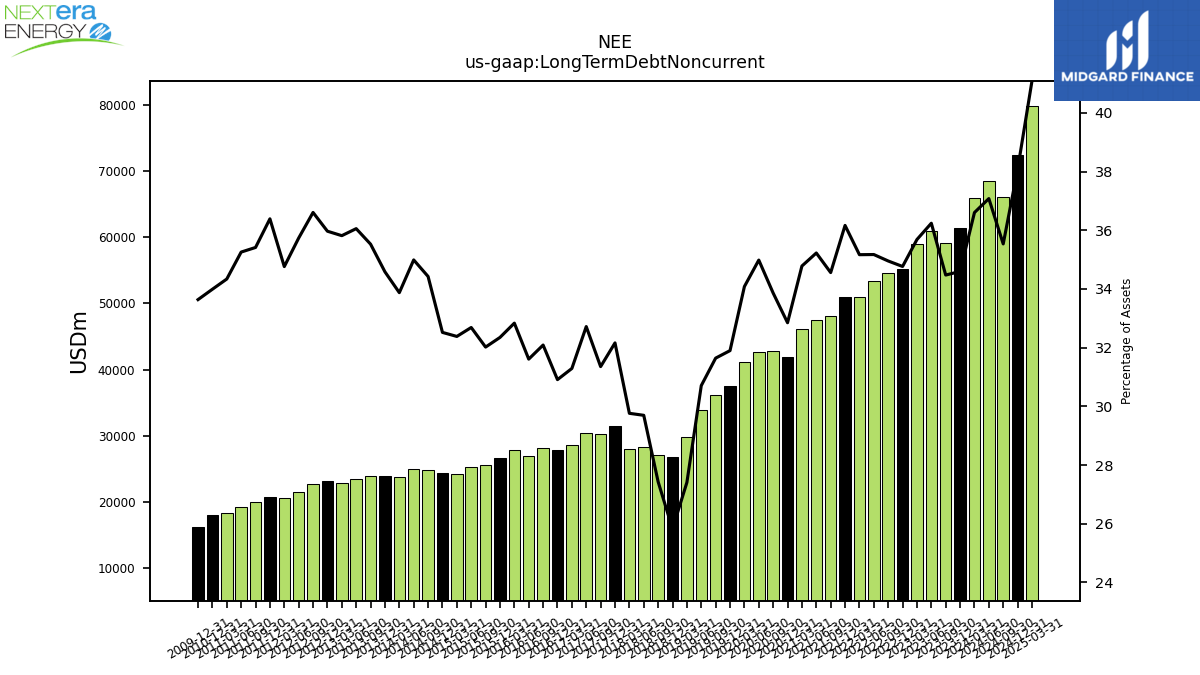
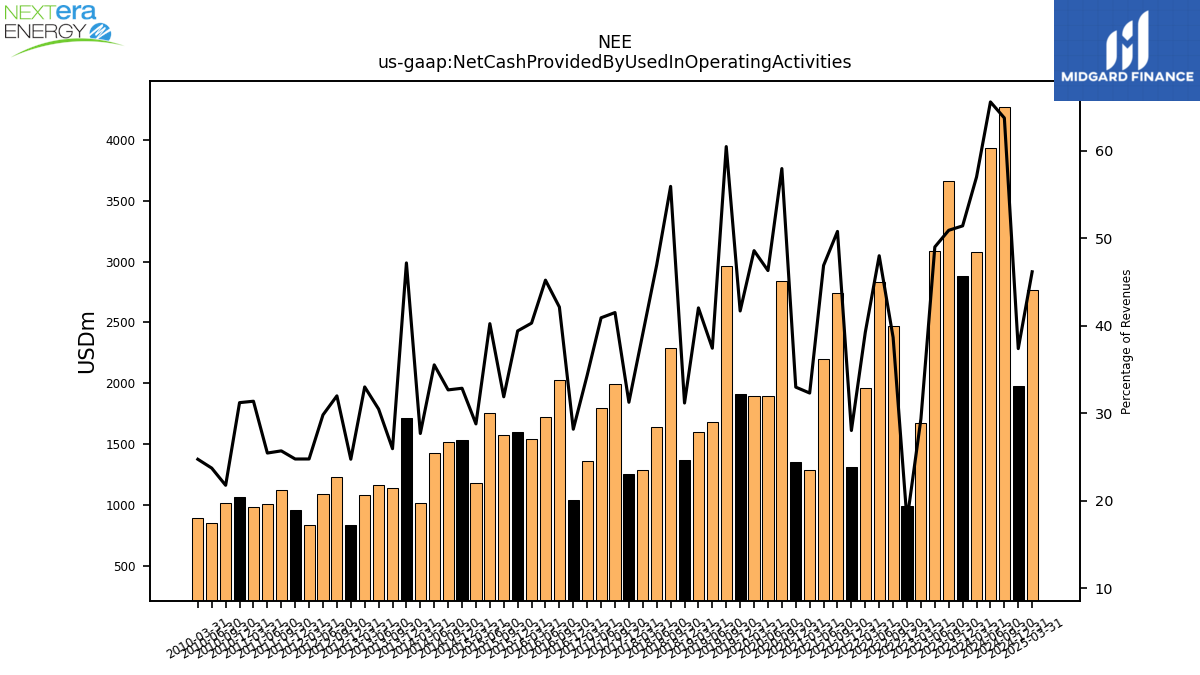
| $NEE$ | 2025-02-14 | 2025-04-23 | 2025-04-23 | NA | NA | NEE | 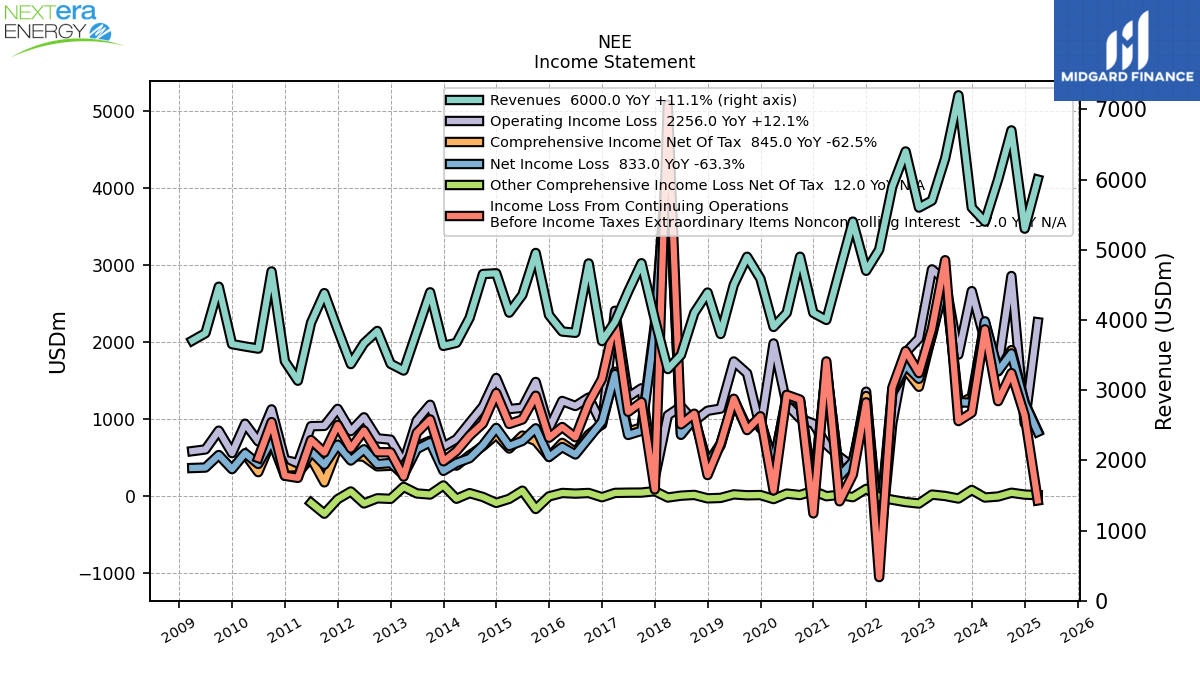 |
 |
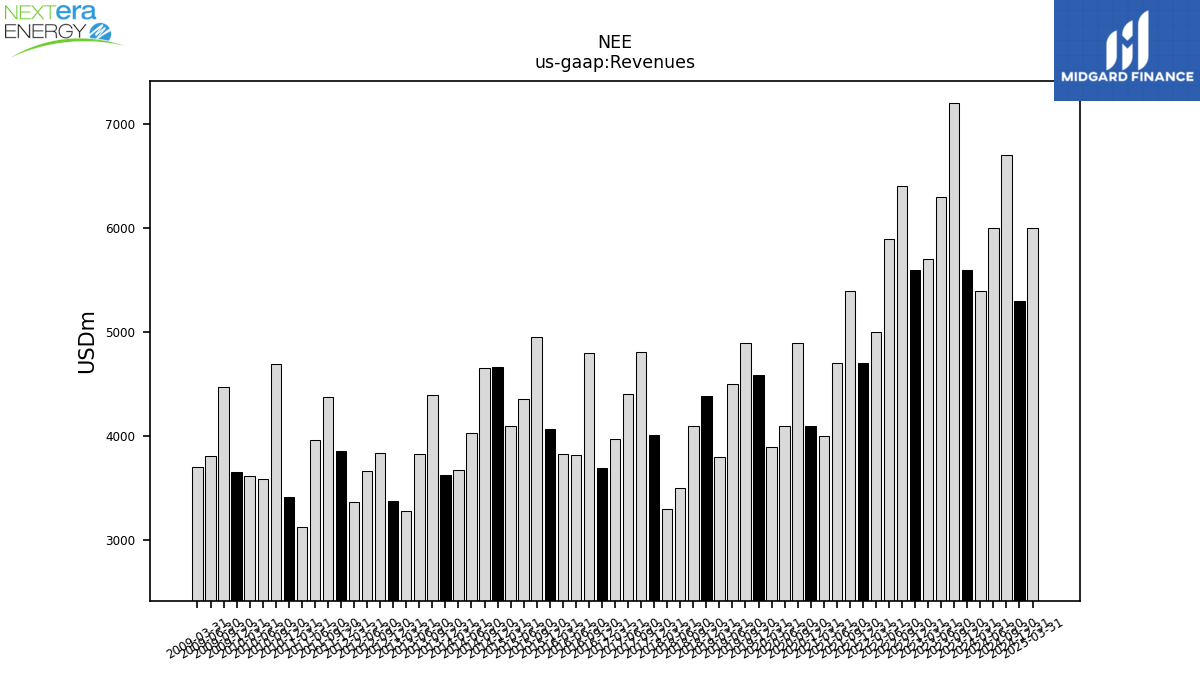 |
NEE | 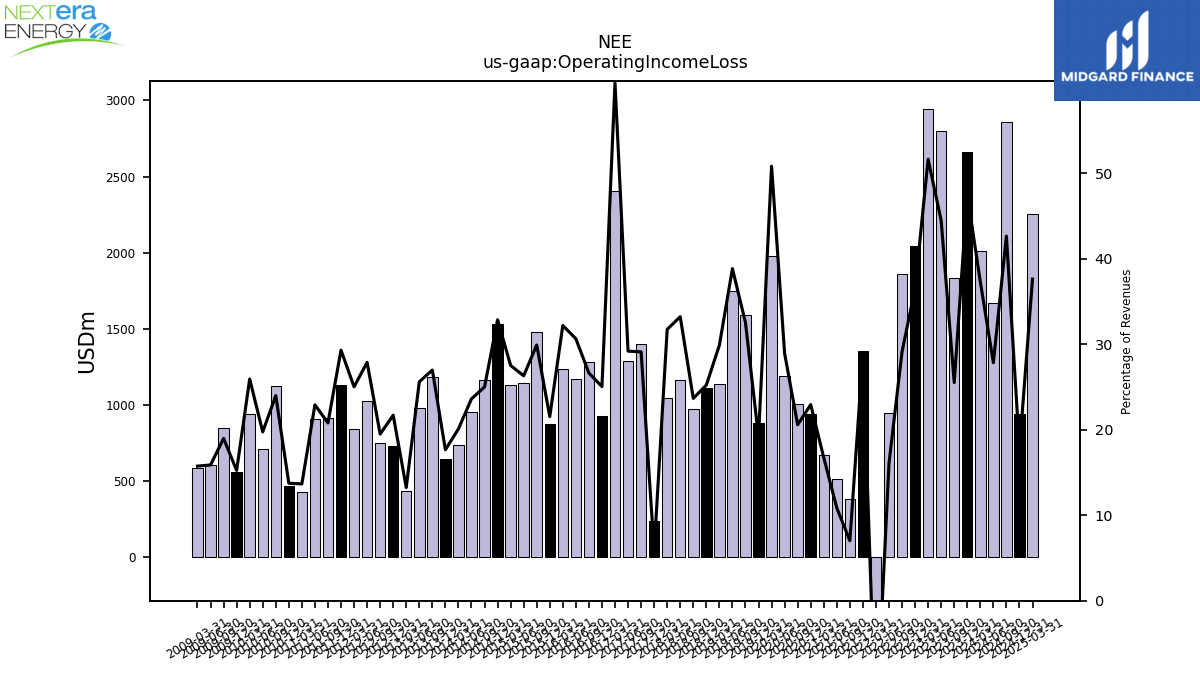 |
 |
NEE | 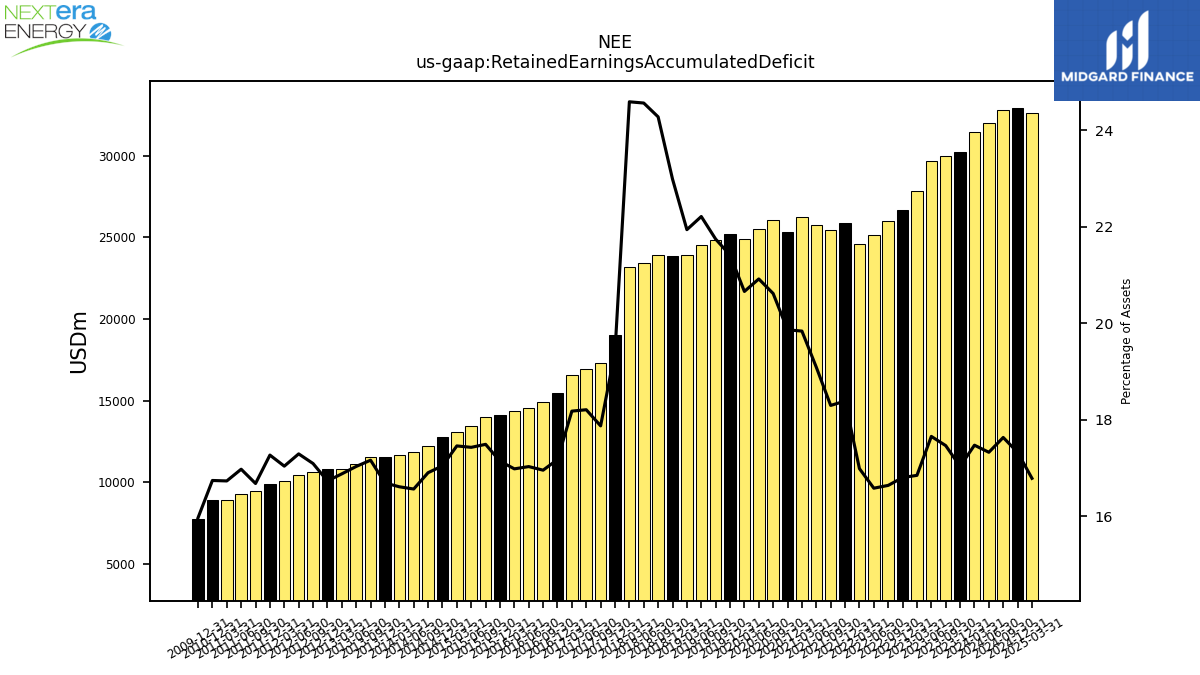 |
 |
NEE | 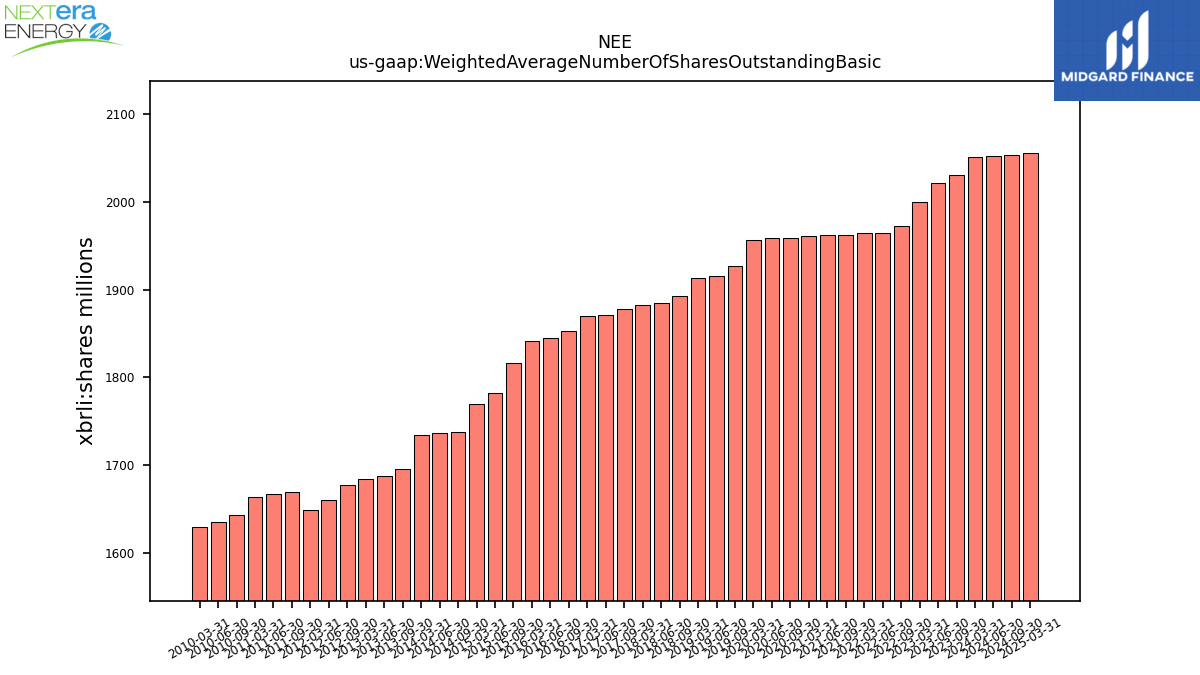 |
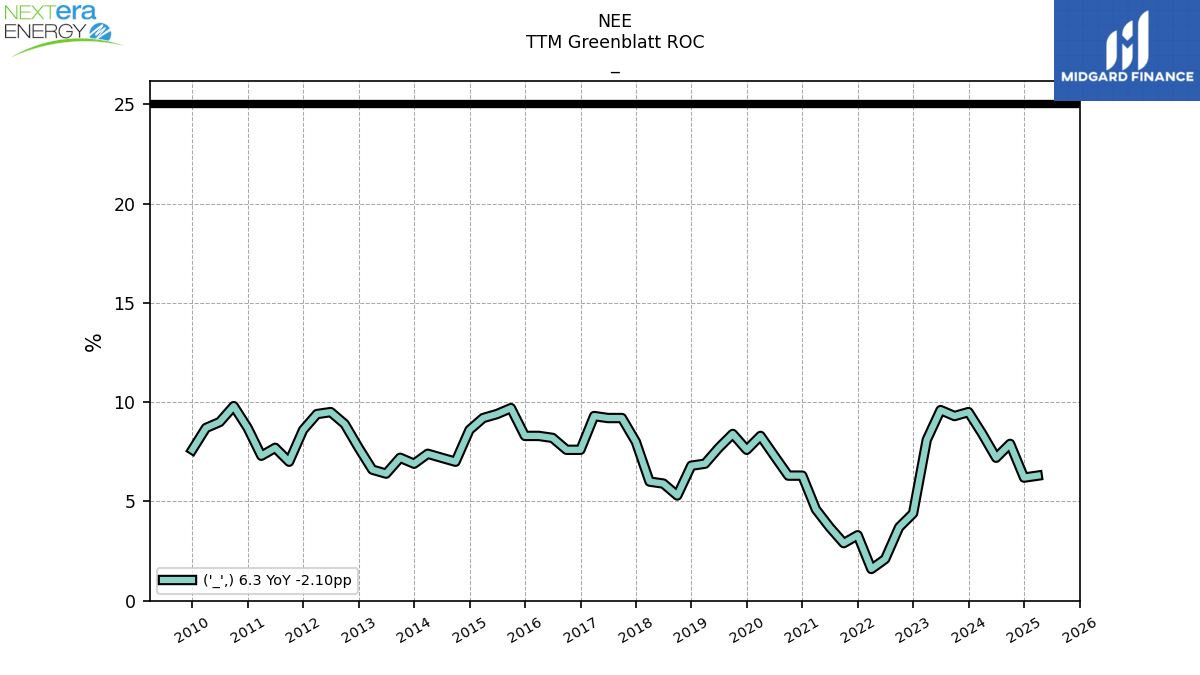 |
NEE | ||||||
| Ticker | 10K | 10Q | 8K | Sector | Industry | Logo | Forward P/E | Revenue Growth | Ticker | Income | EPS | Revenues | Ticker | GrossProfit | OperatingIncome | LongTermDebt | Ticker | InterestExpense | RetainedEarnnings | CashFlowOperating | Ticker | Dividends | SharesOutstanding | TTMGreenblattROC | |
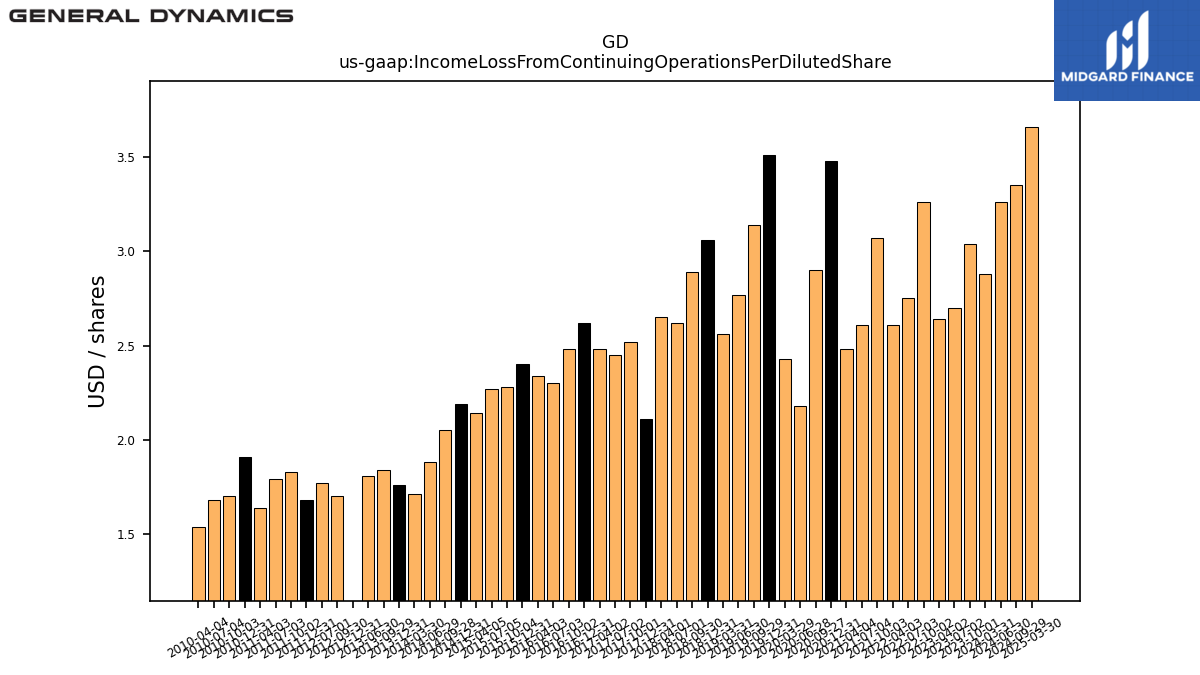
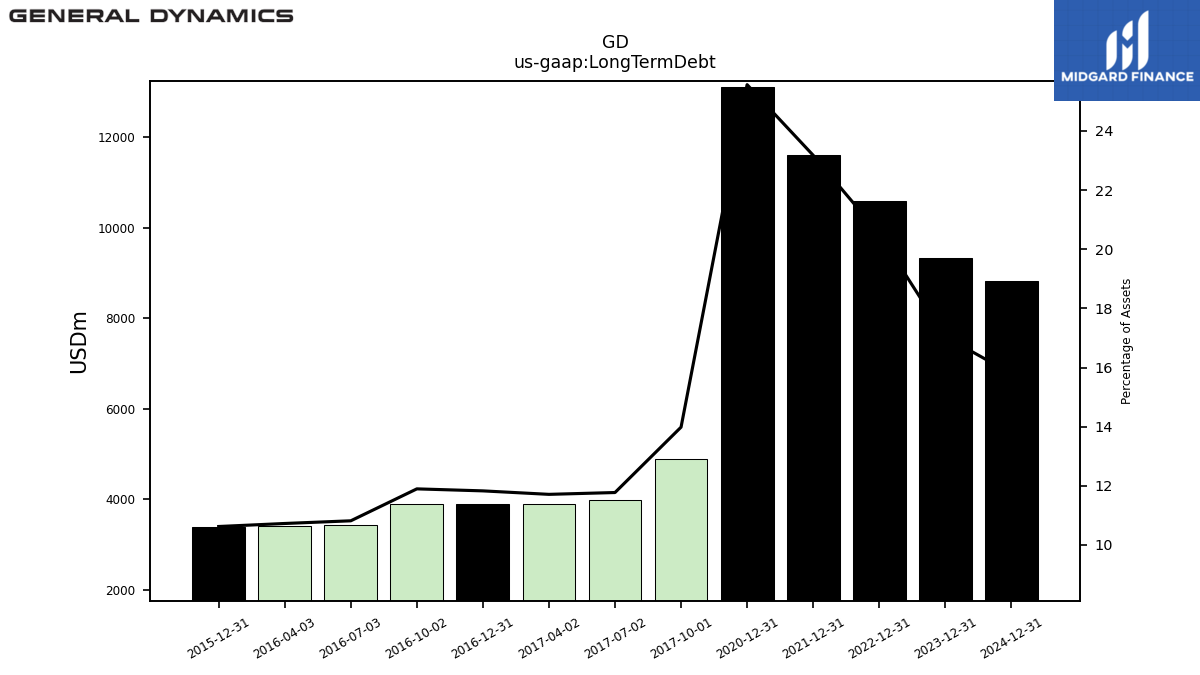
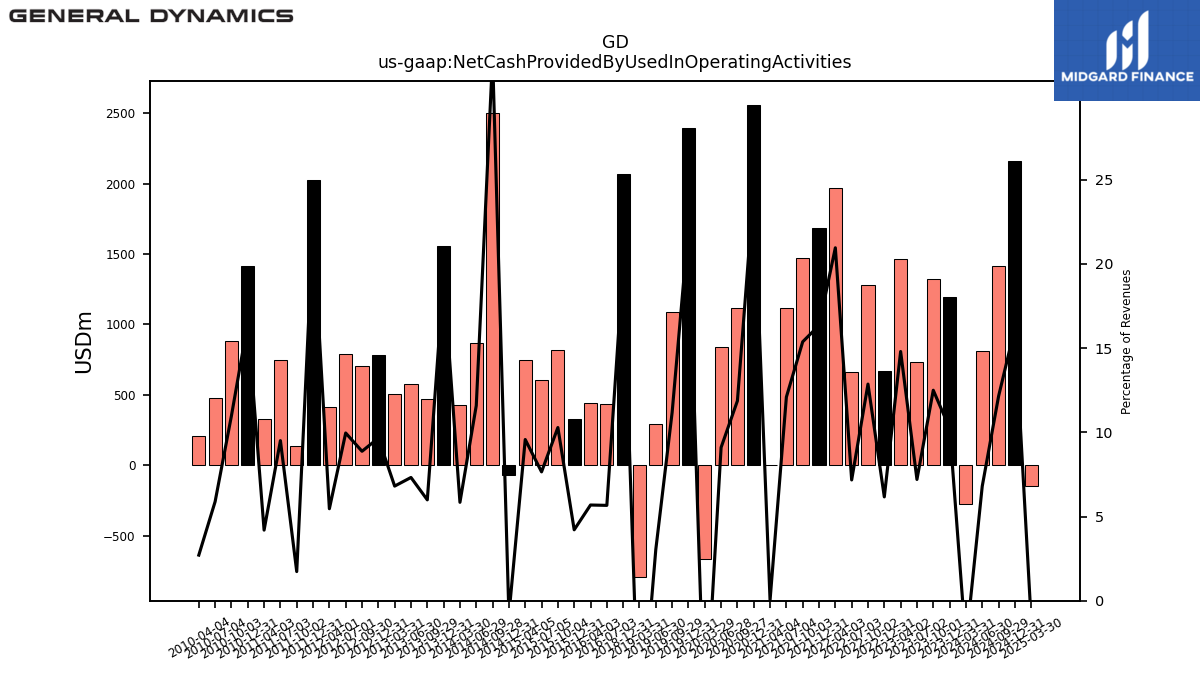
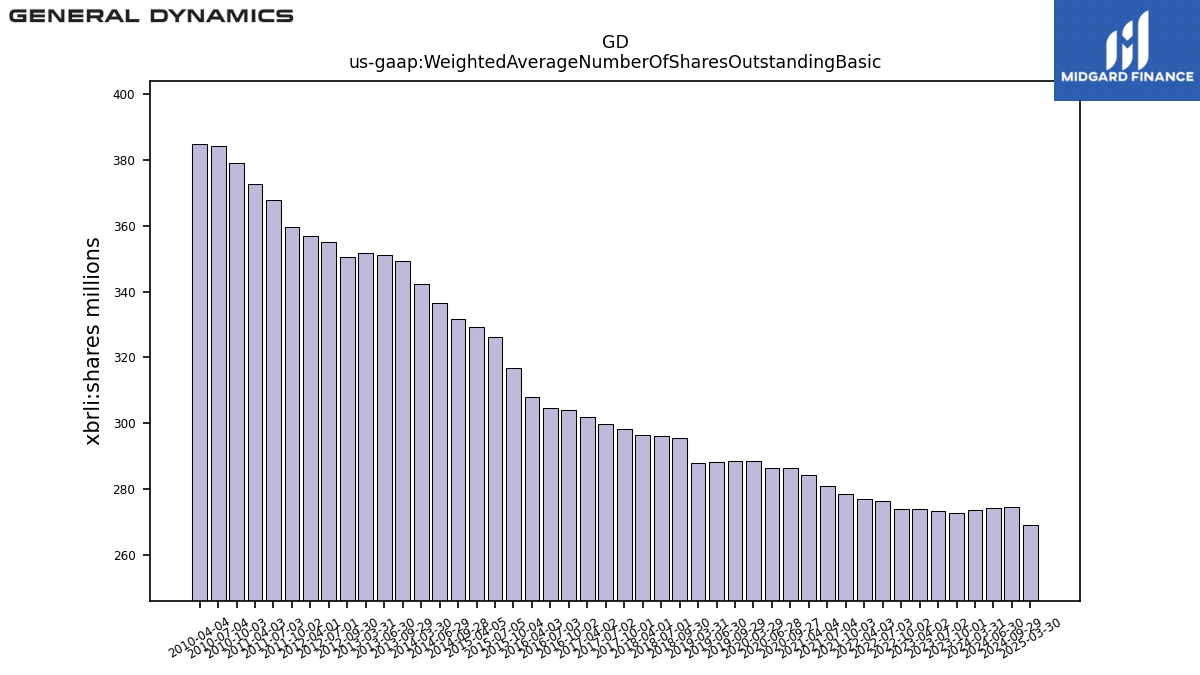
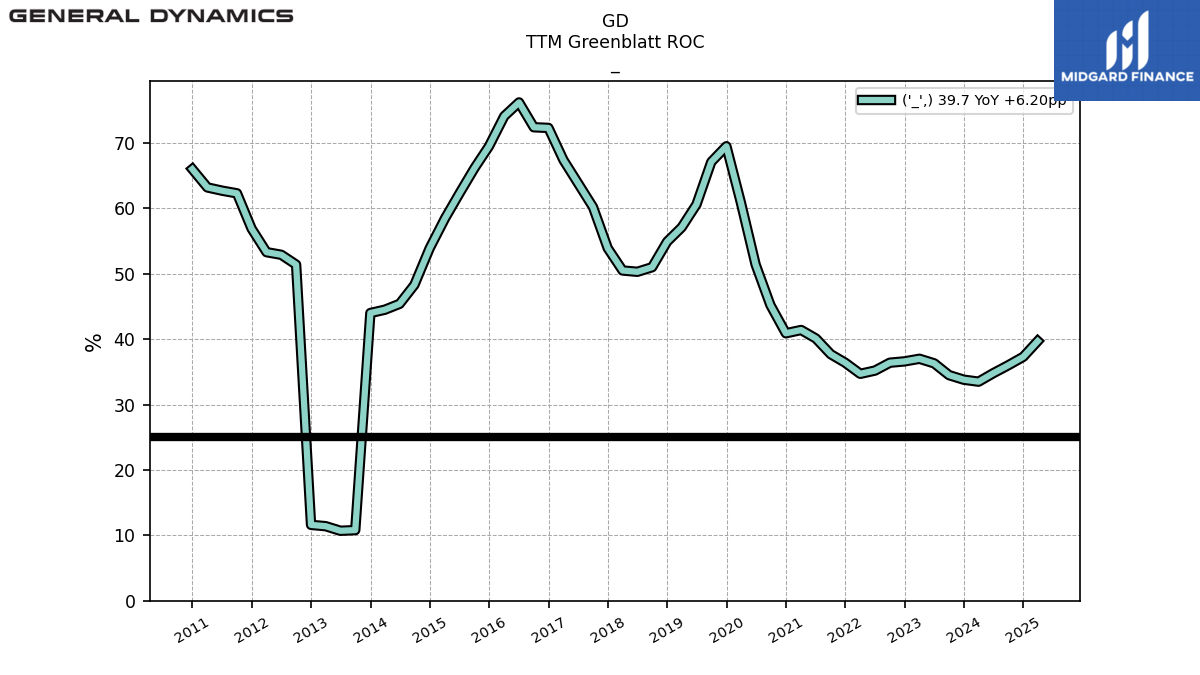
| $GD$ | 2025-02-07 | 2025-04-23 | 2025-04-23 | Industrials | Aerospace & Defense | NA | NA | GD | 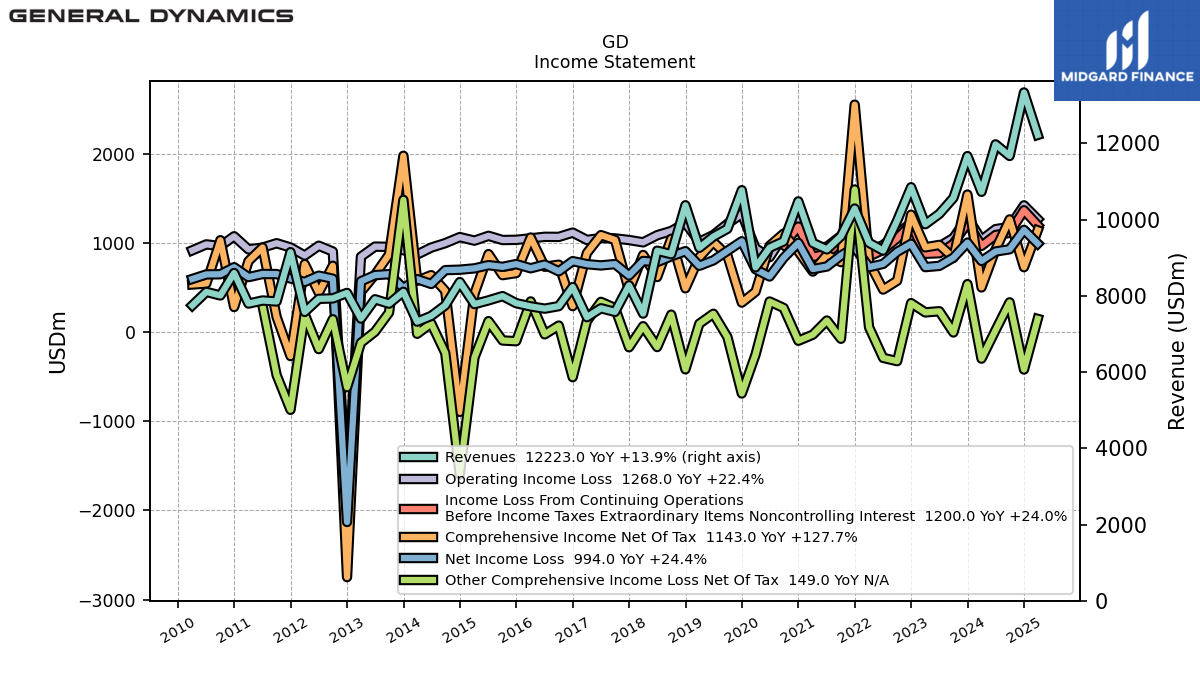 |
 |
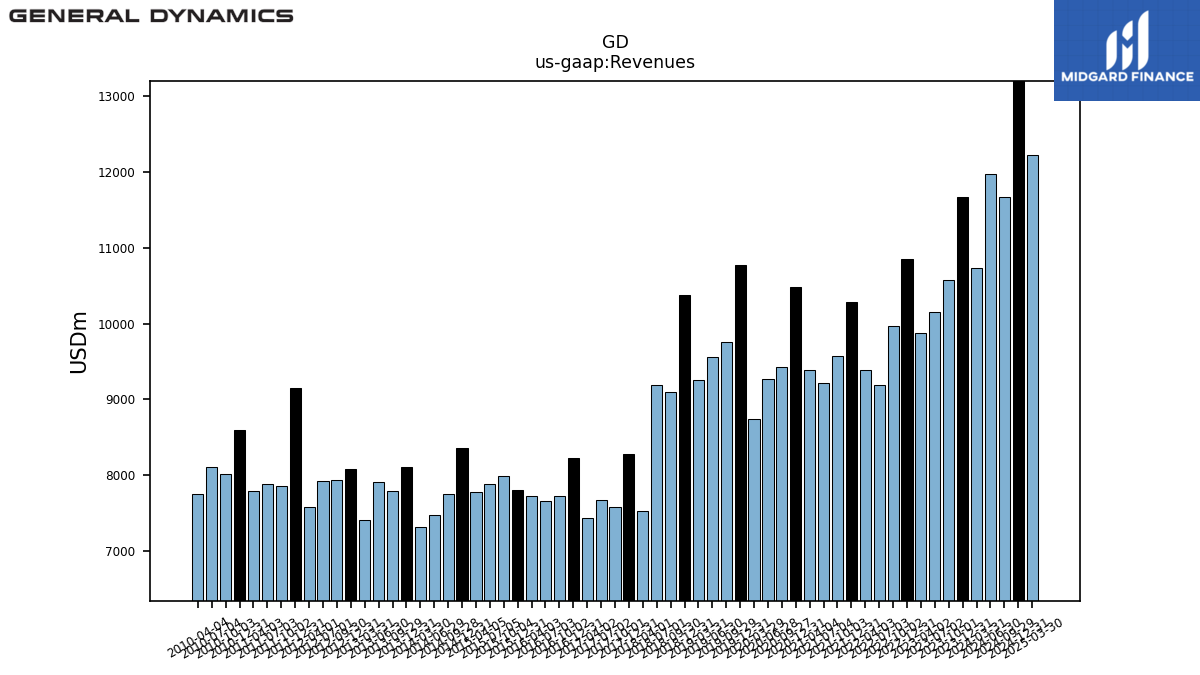 |
GD | 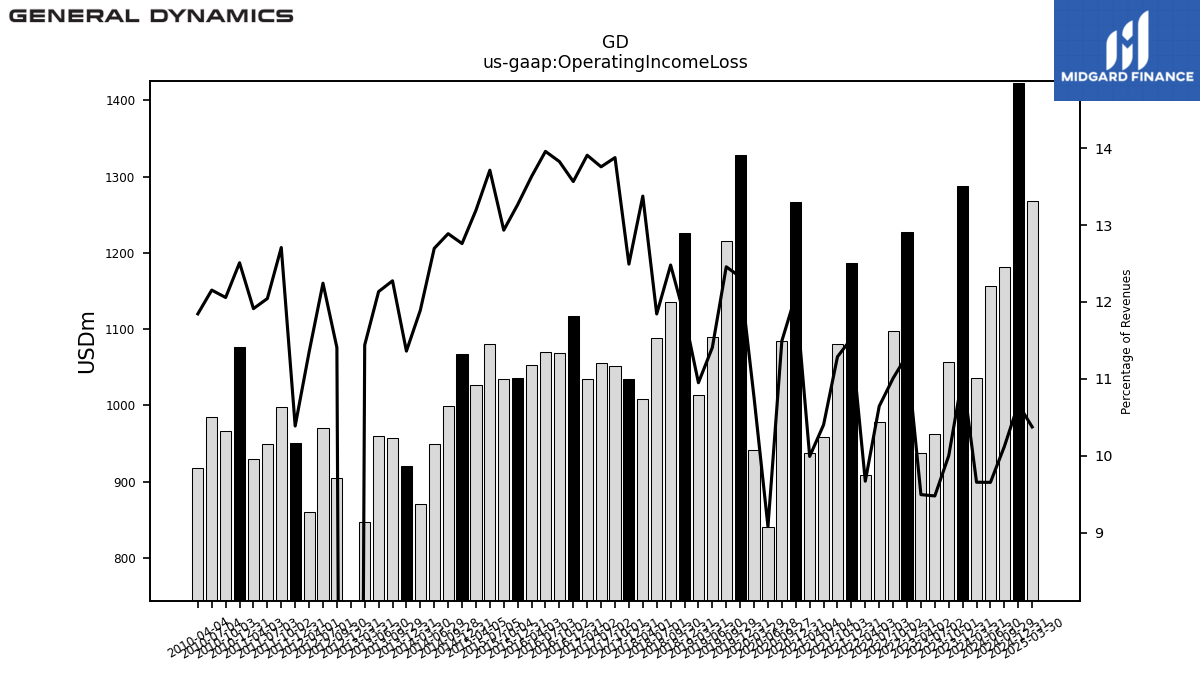 |
 |
GD | 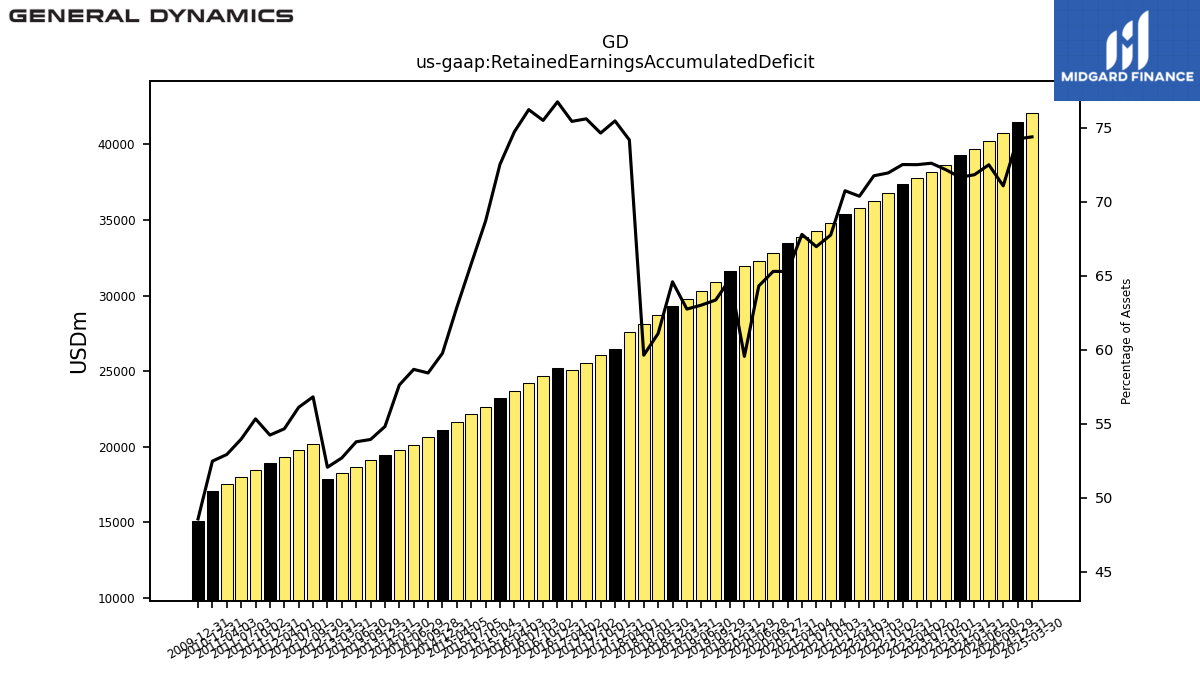 |
 |
GD | 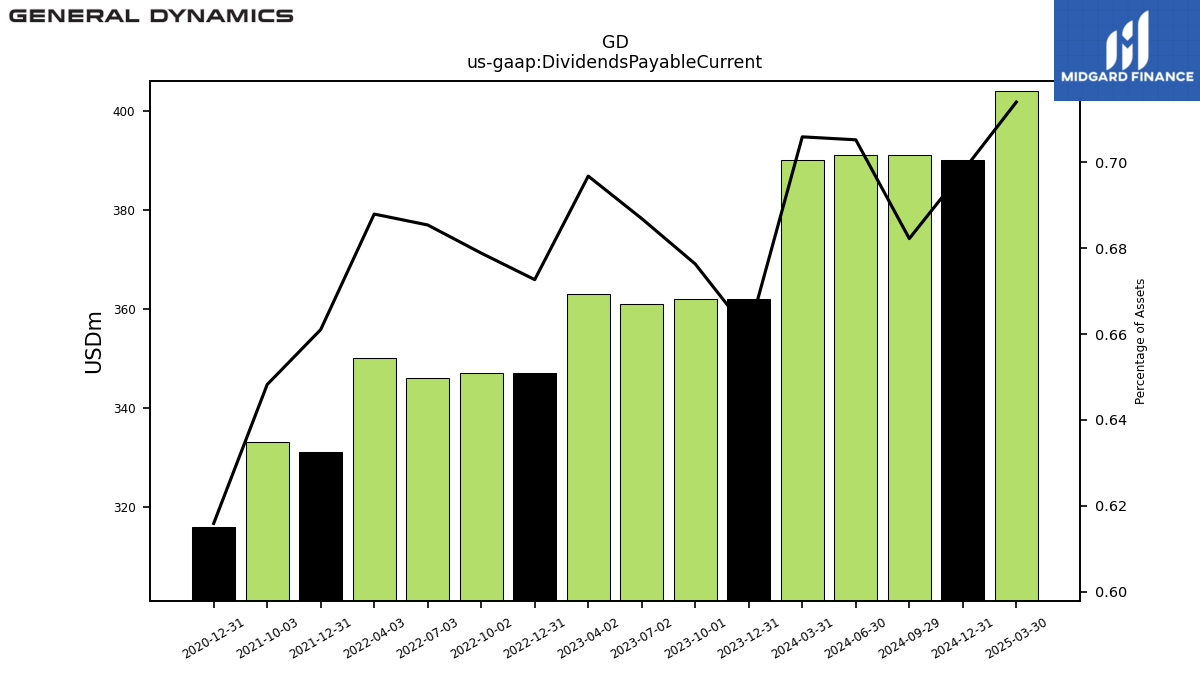 |
 |
 |
GD | |||
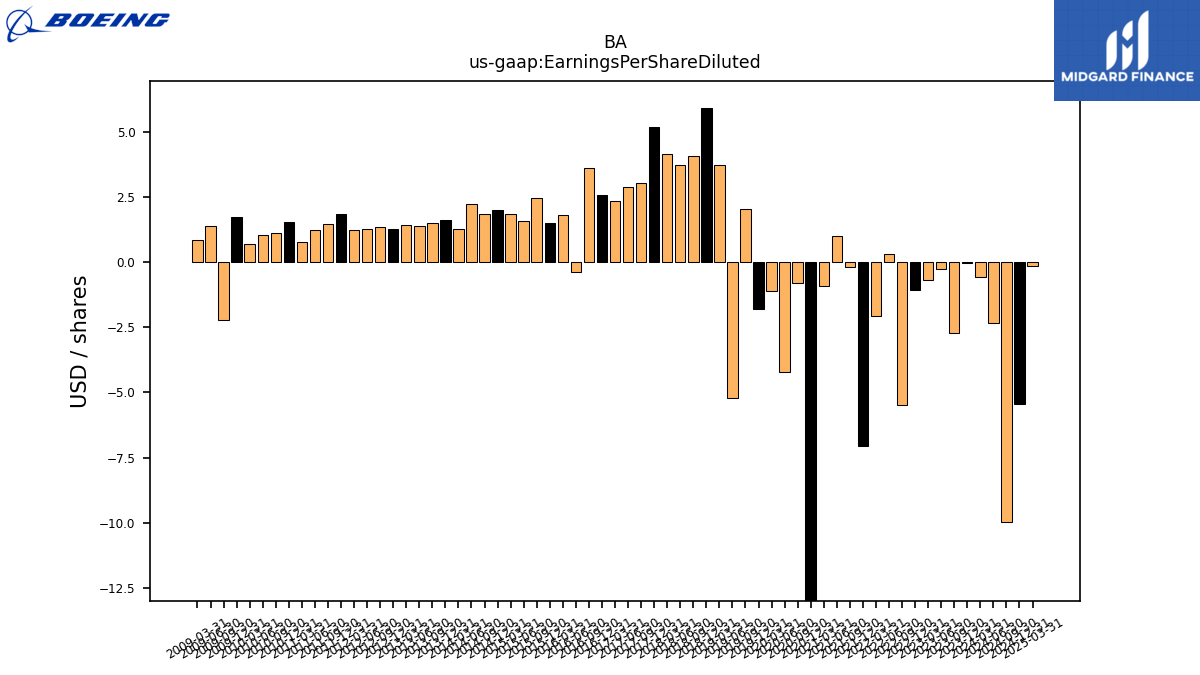
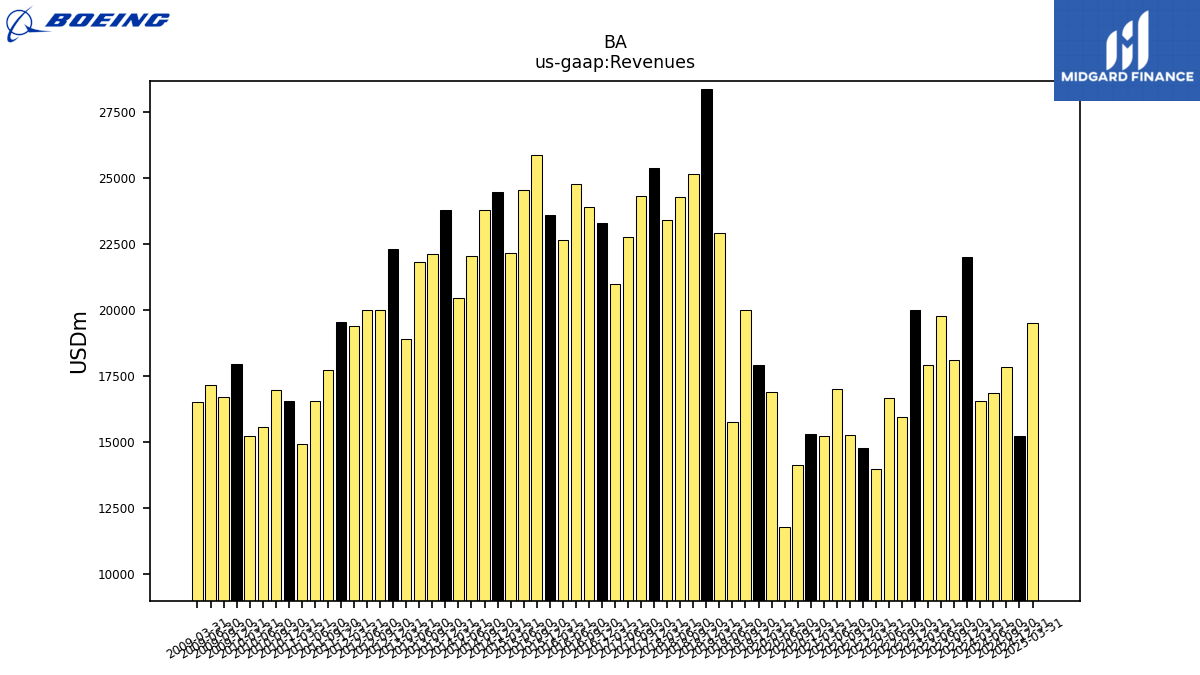
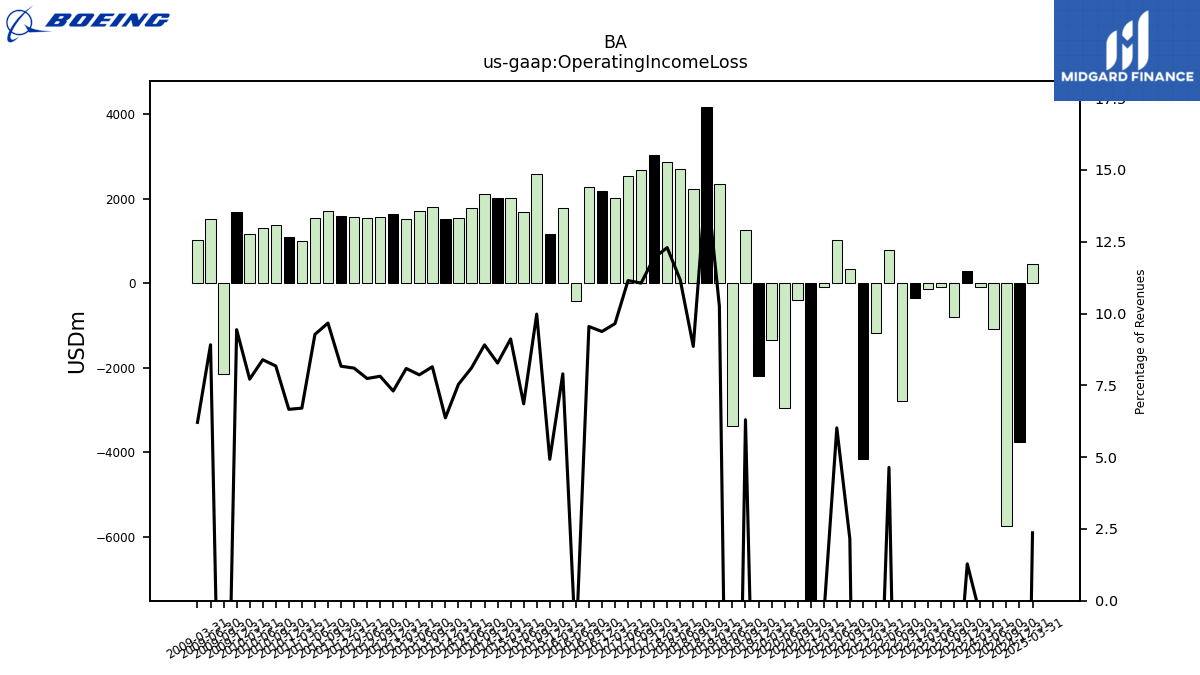
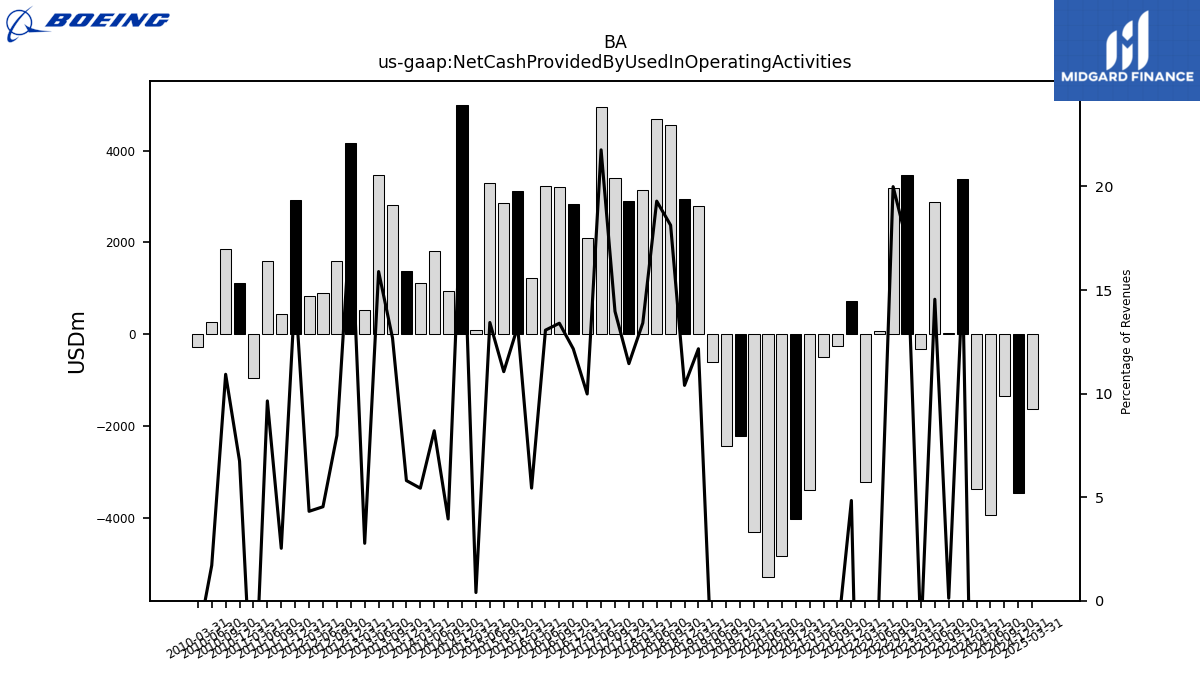
| $BA$ | 2025-02-03 | 2025-04-23 | 2025-04-23 | NA | NA | BA | 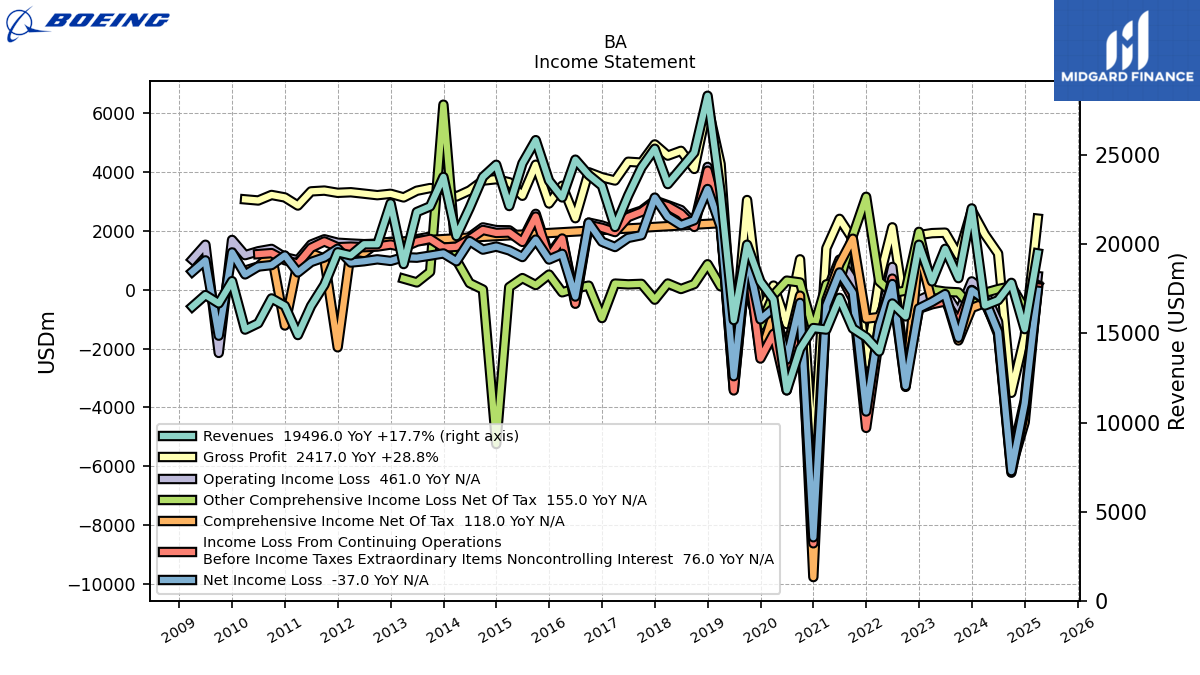 |
 |
 |
BA | 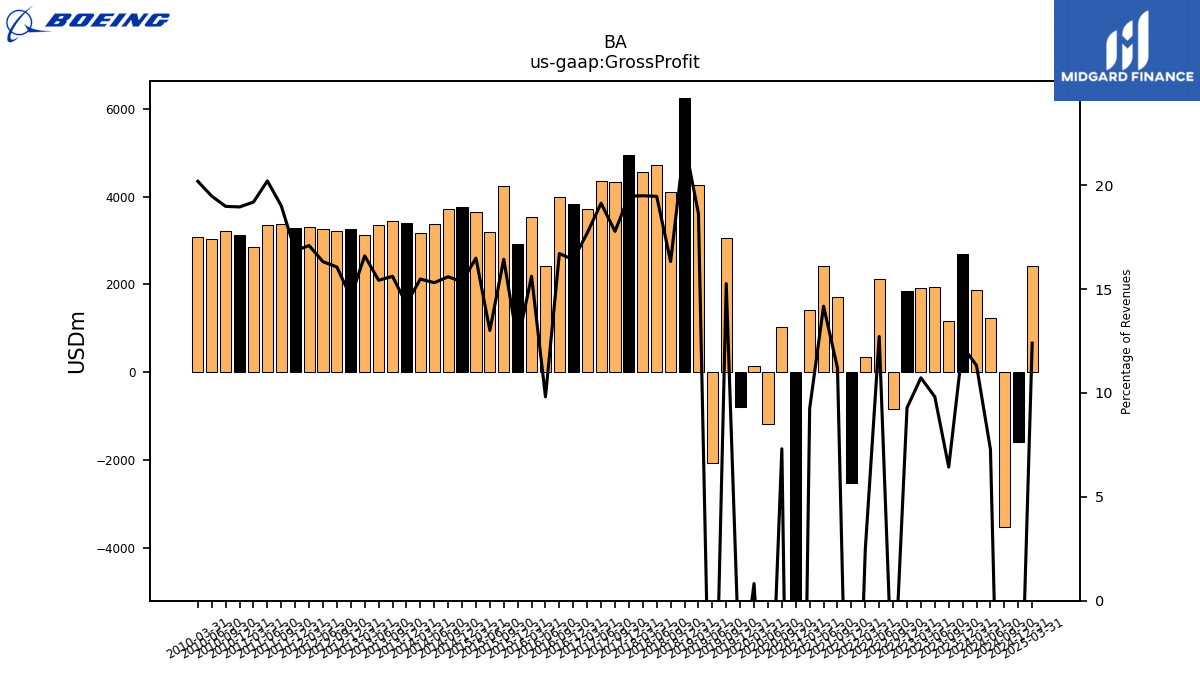 |
 |
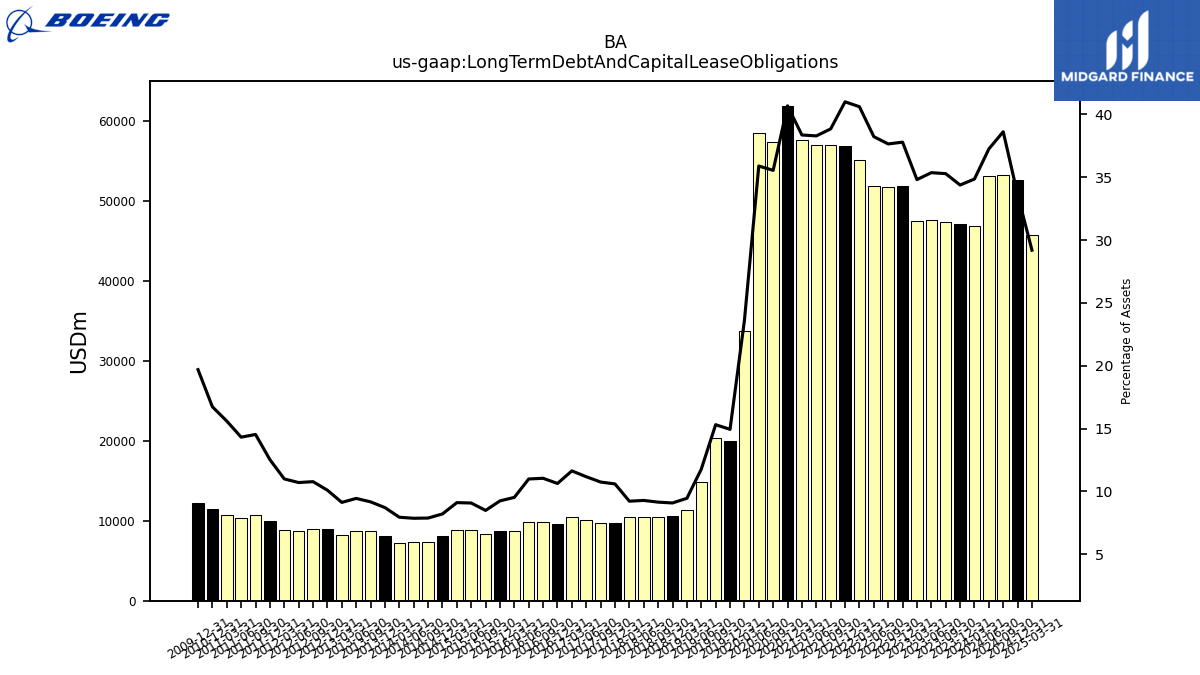 |
BA | 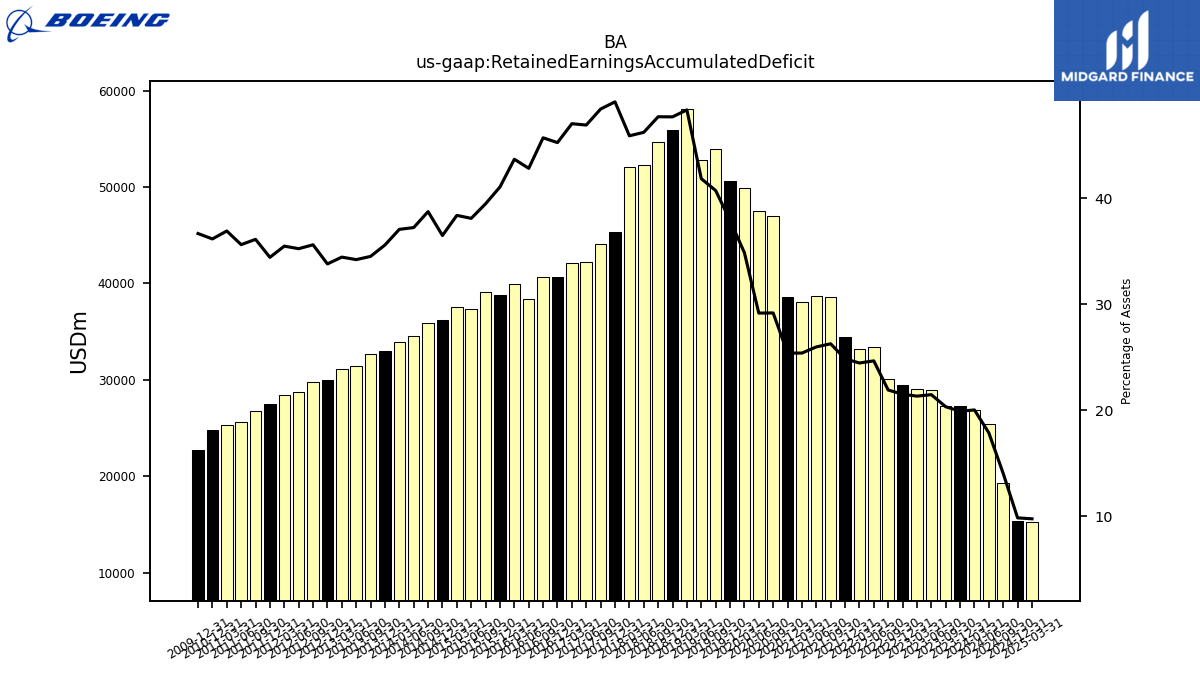 |
 |
BA | 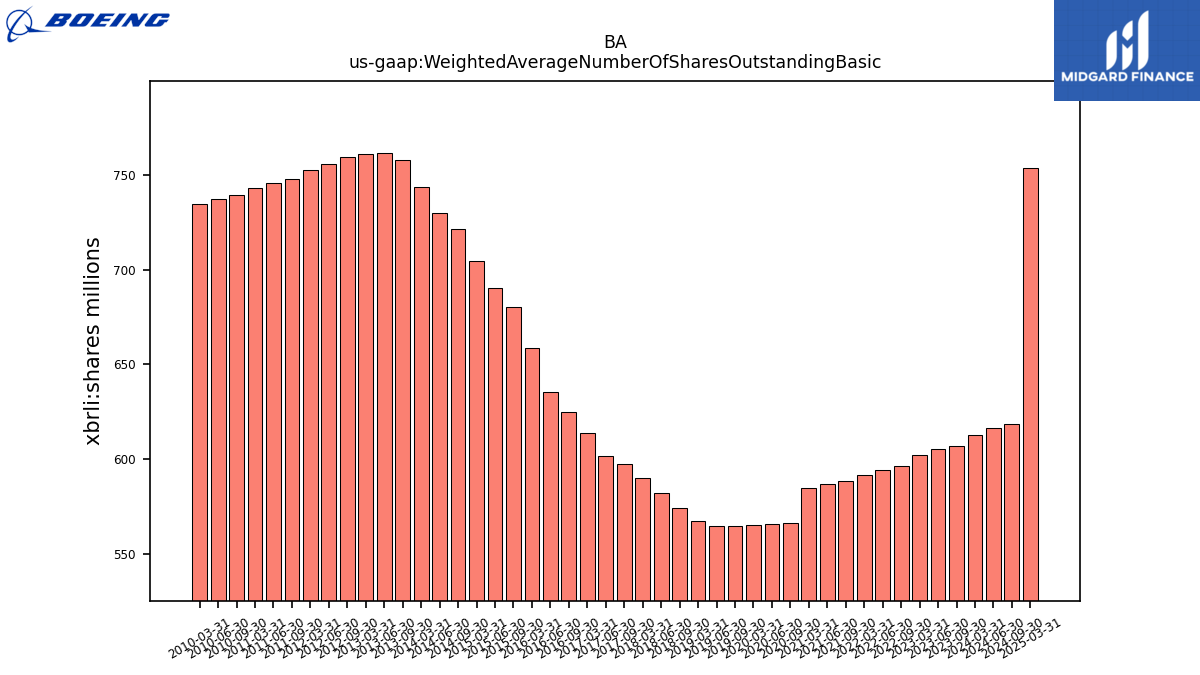 |
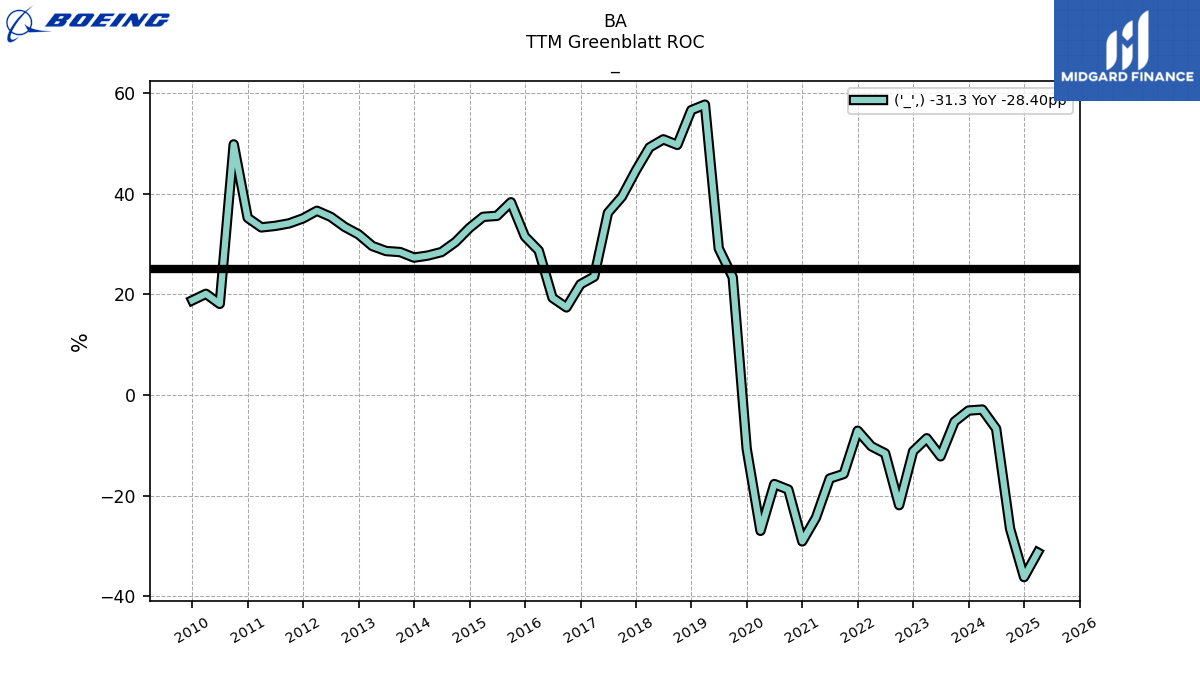 |
BA | |||||
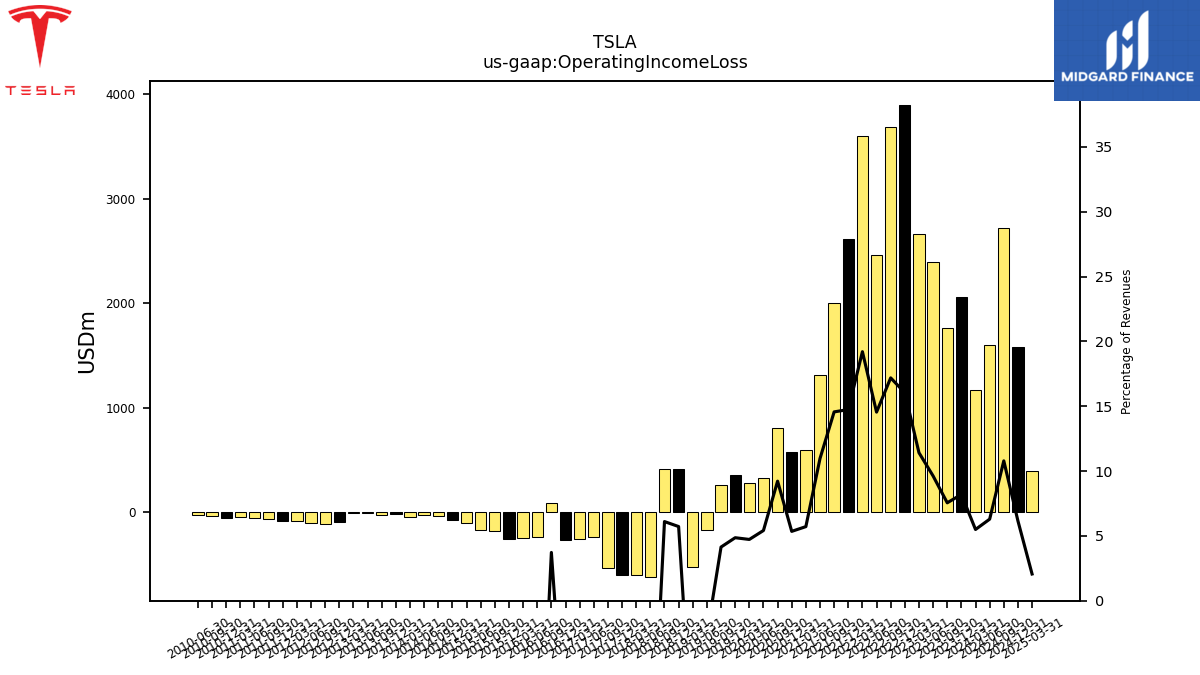
| $TSLA$ | 2025-01-30 | 2025-04-23 | 2025-04-22 |  |
NA | NA | TSLA | 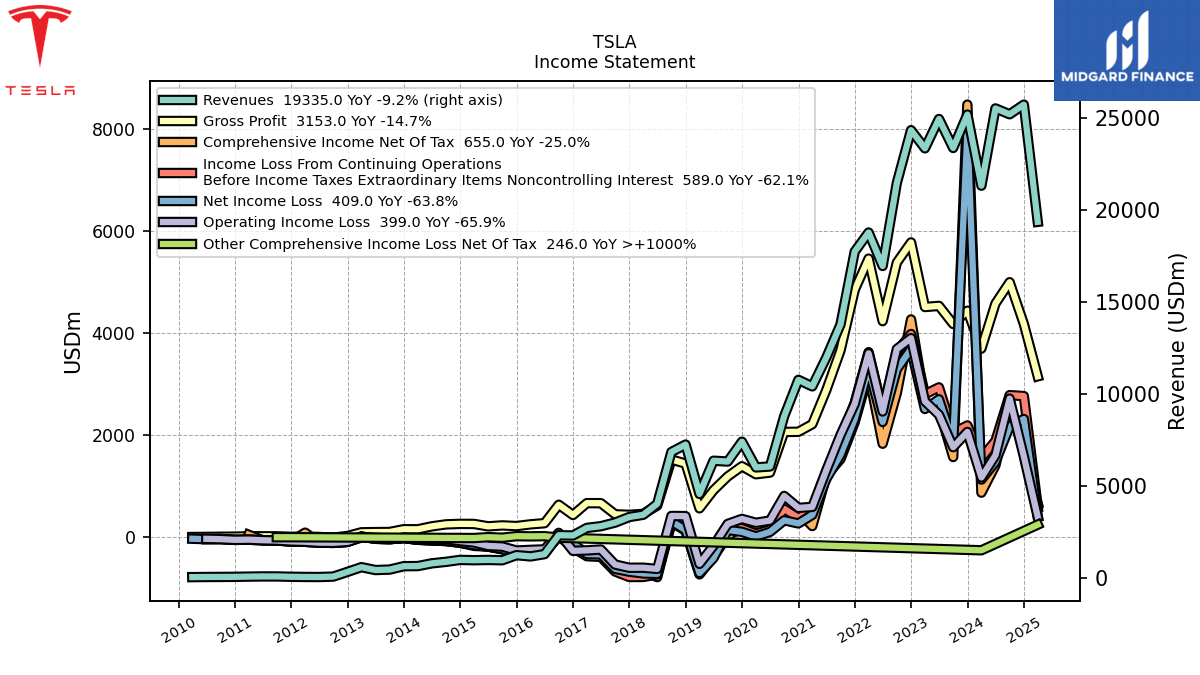 |
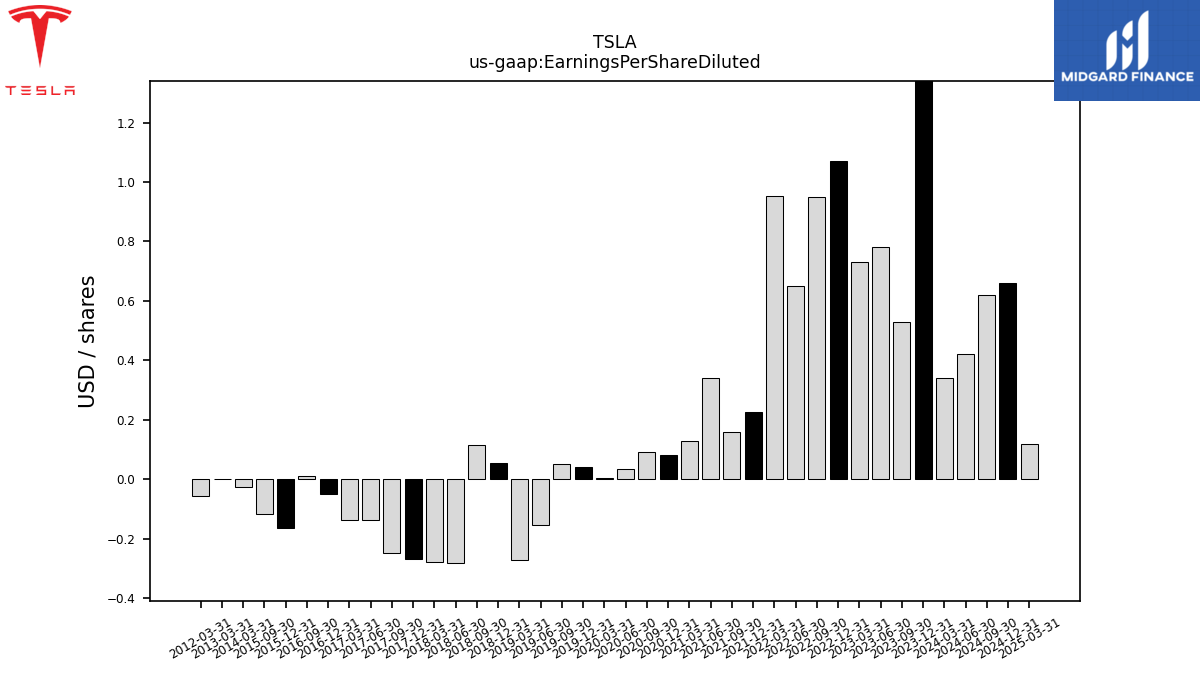 |
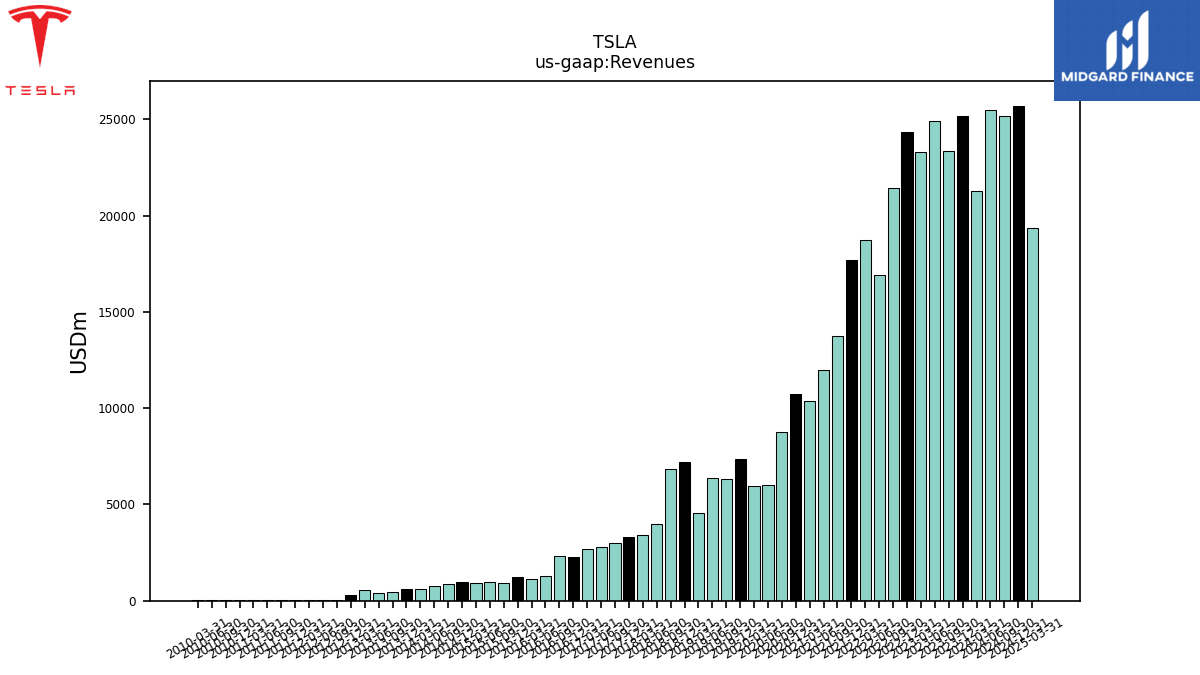 |
TSLA | 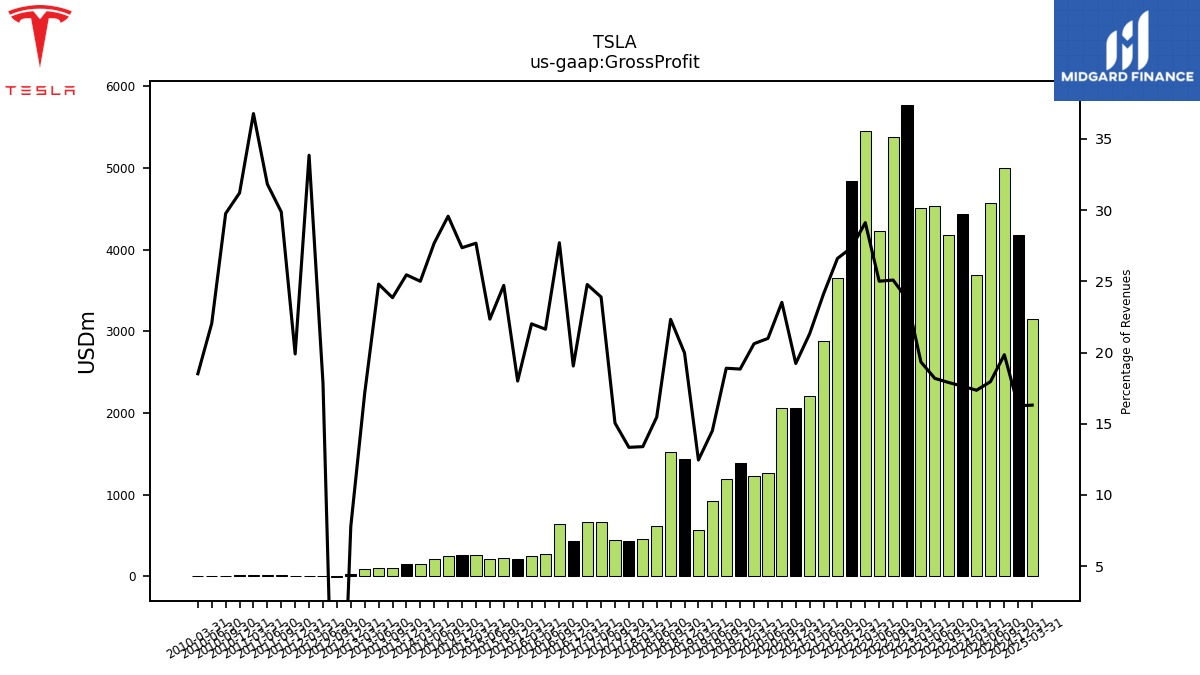 |
 |
 |
TSLA |  |
 |
 |
TSLA | 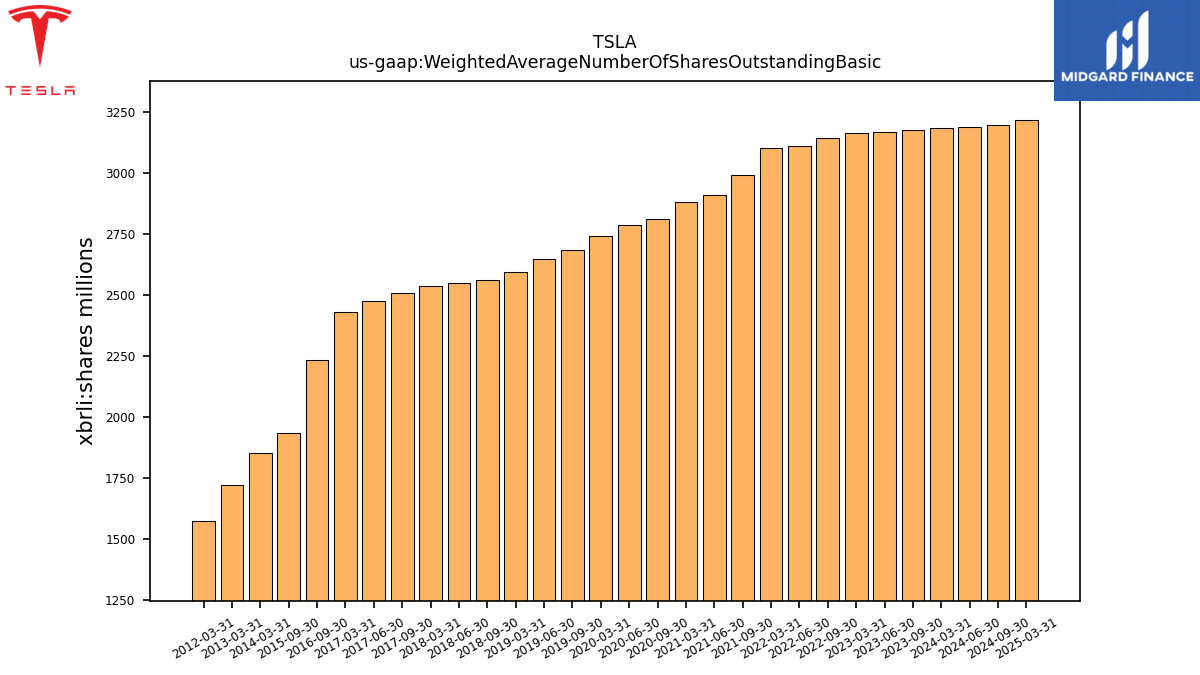 |
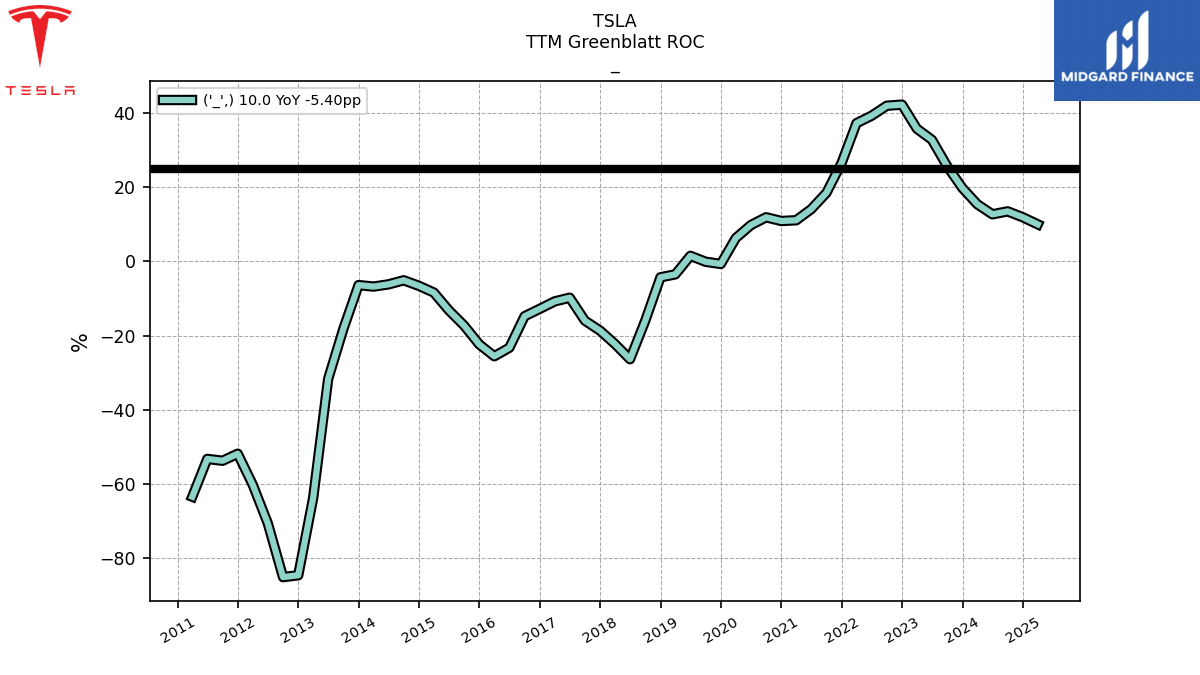 |
TSLA | |||
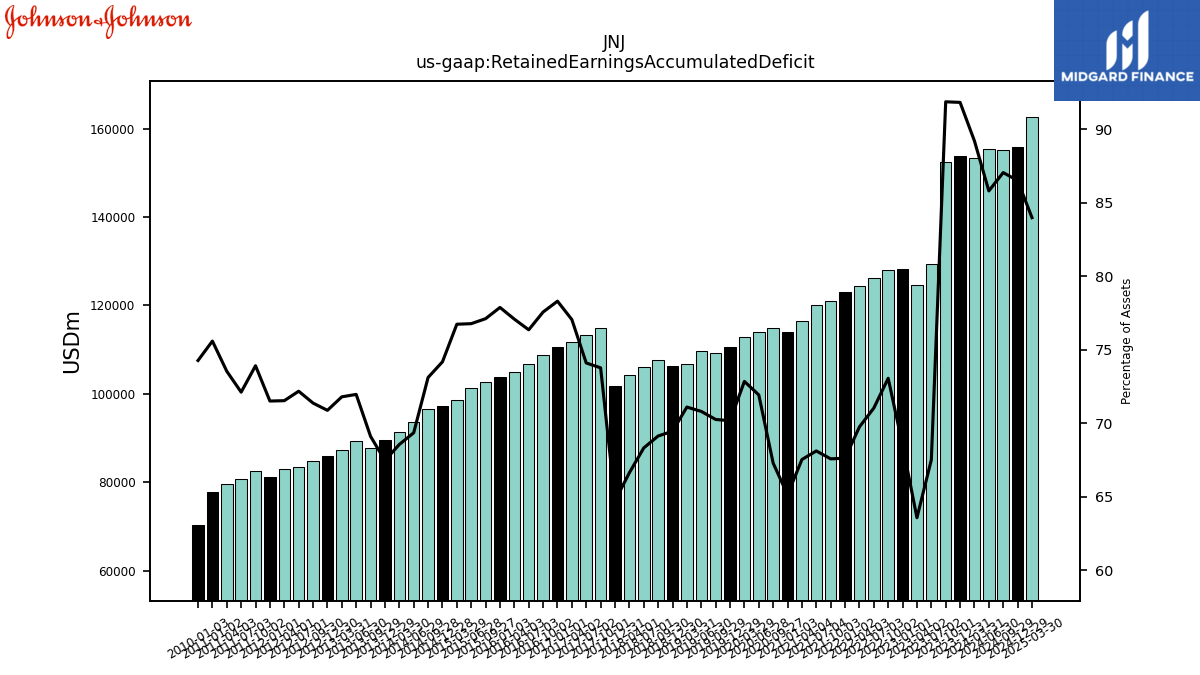
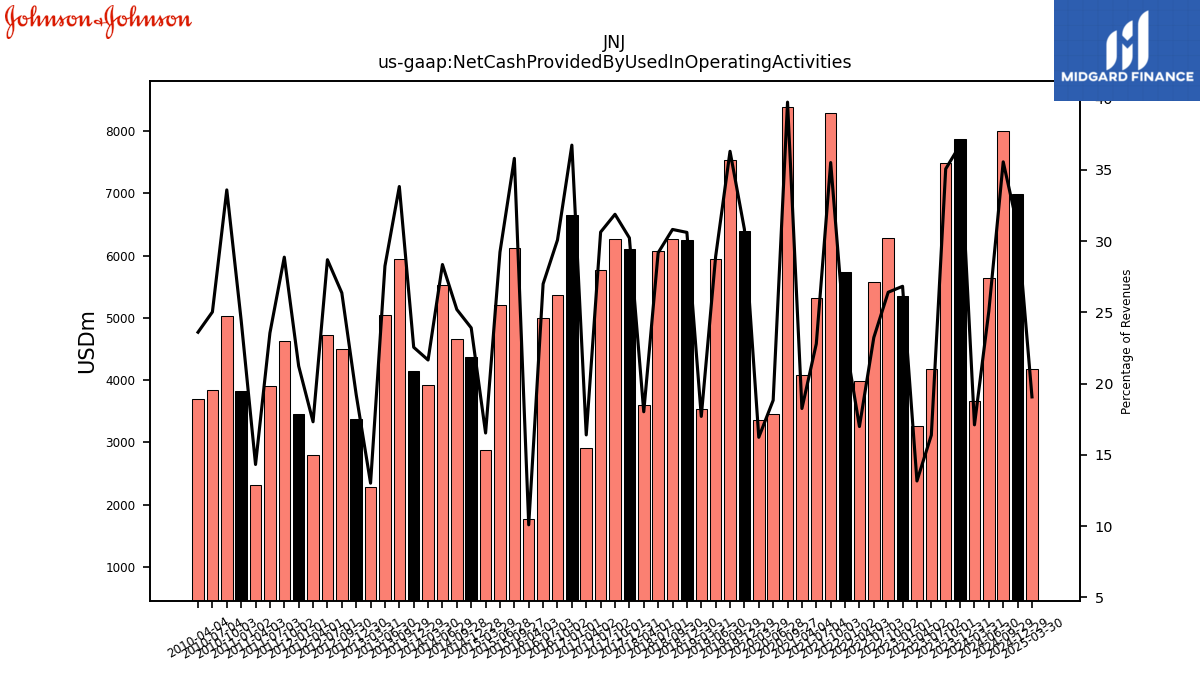
| $JNJ$ | 2025-02-13 | 2025-04-23 | 2025-04-15 | NA | NA | JNJ | 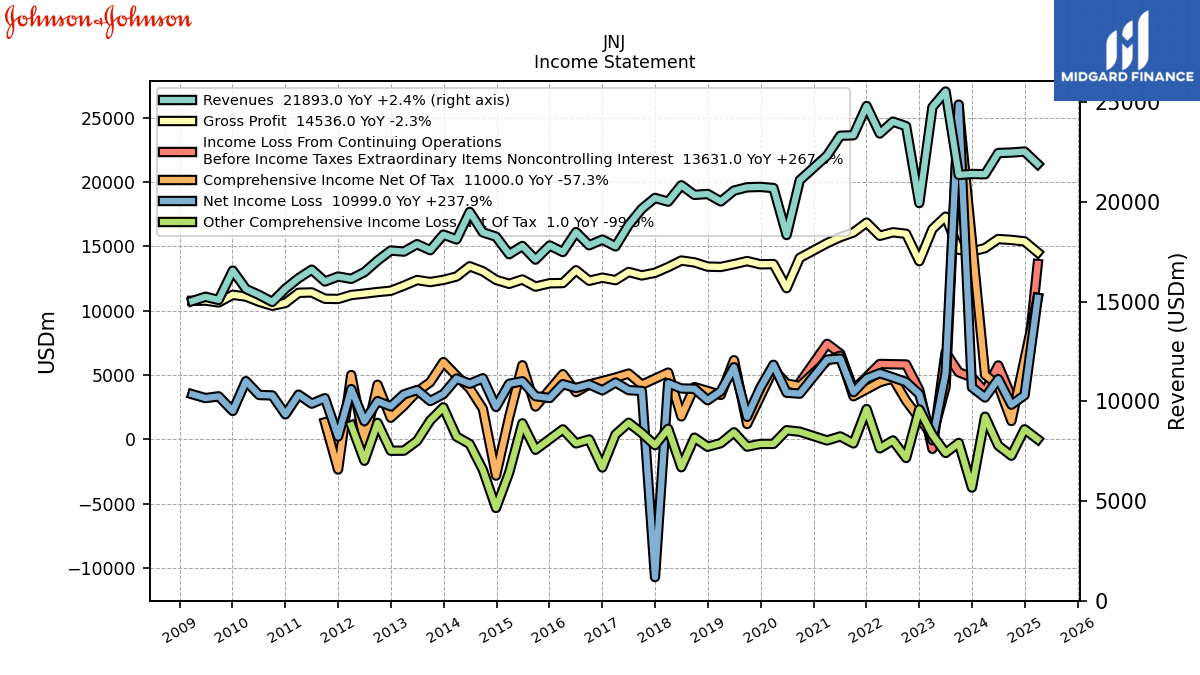 |
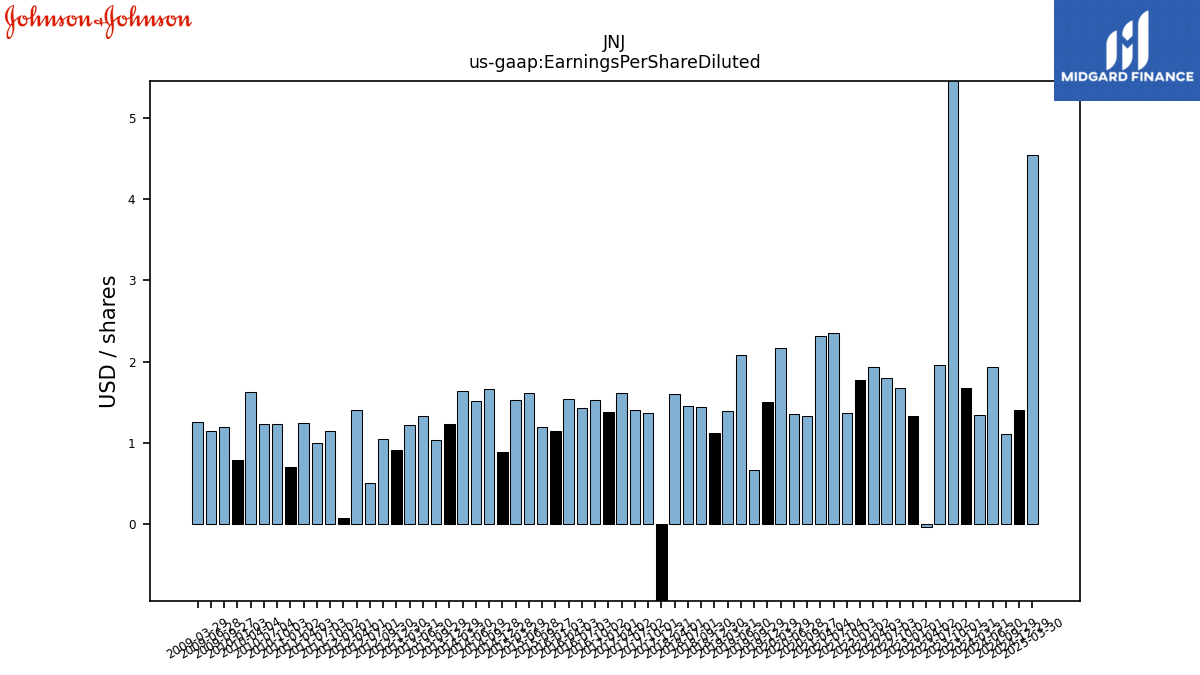 |
 |
JNJ |  |
 |
JNJ |  |
 |
 |
JNJ | 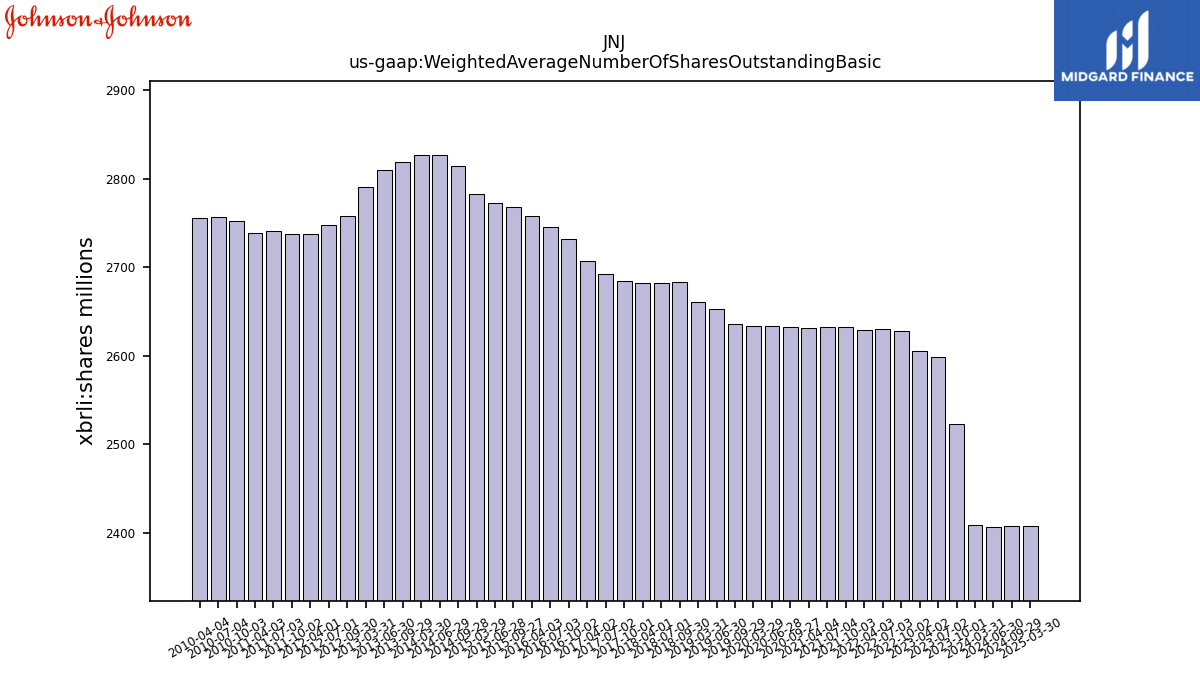 |
JNJ | ||||||
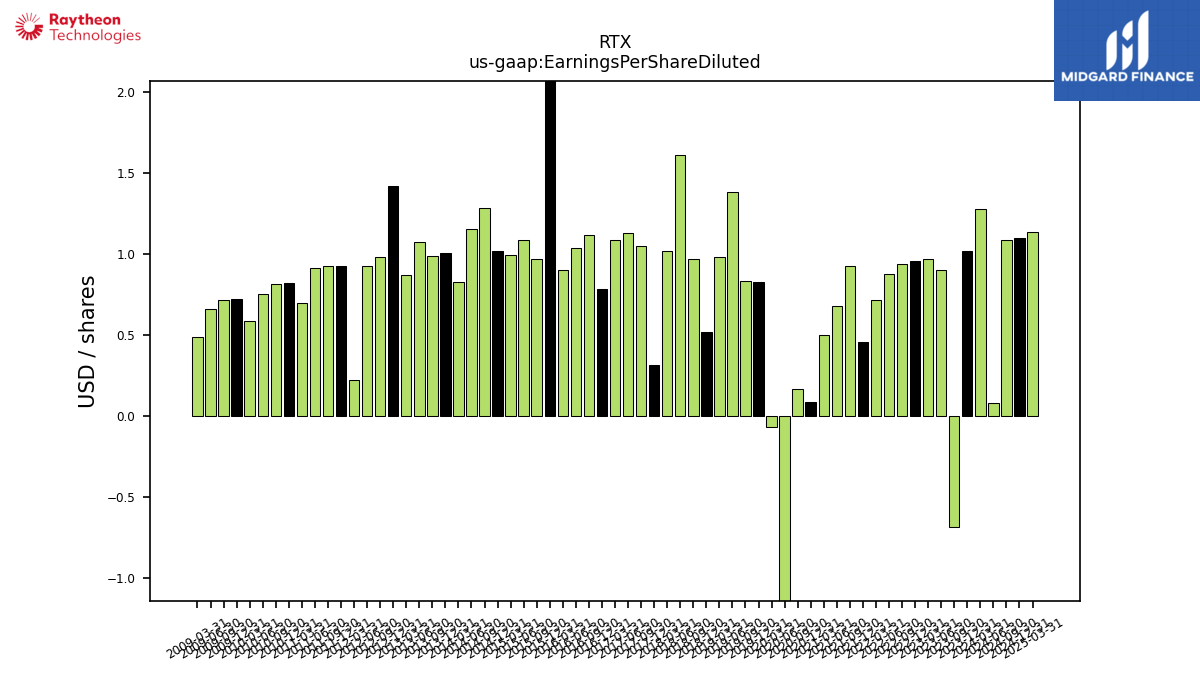
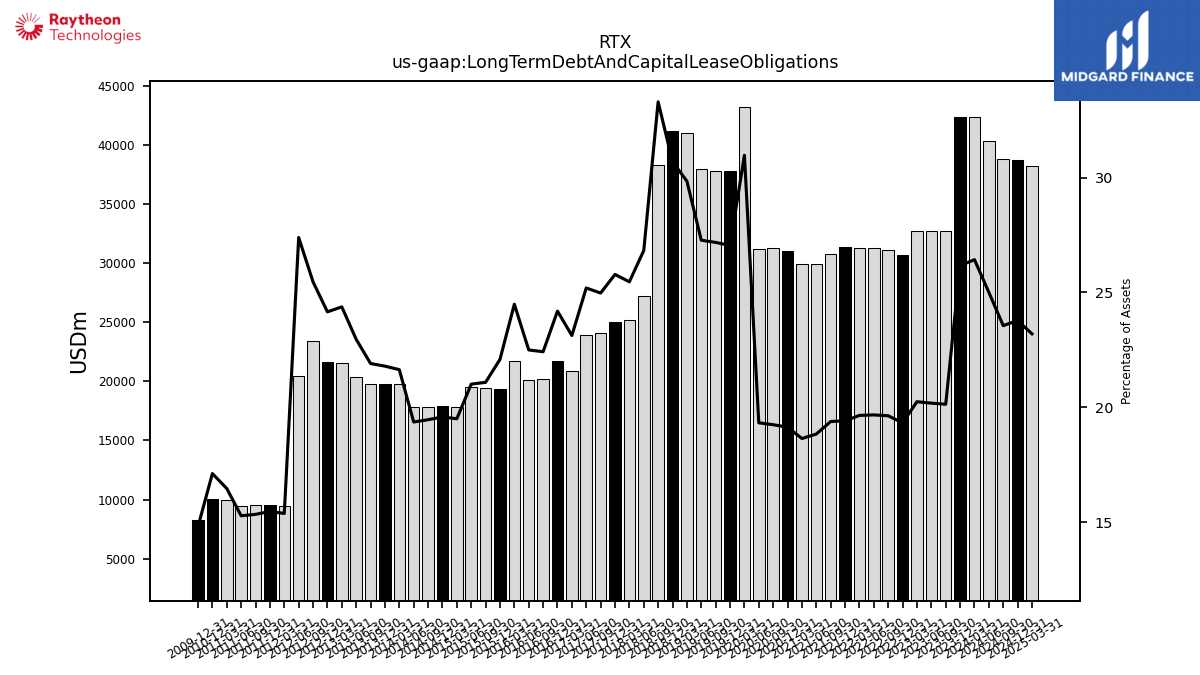
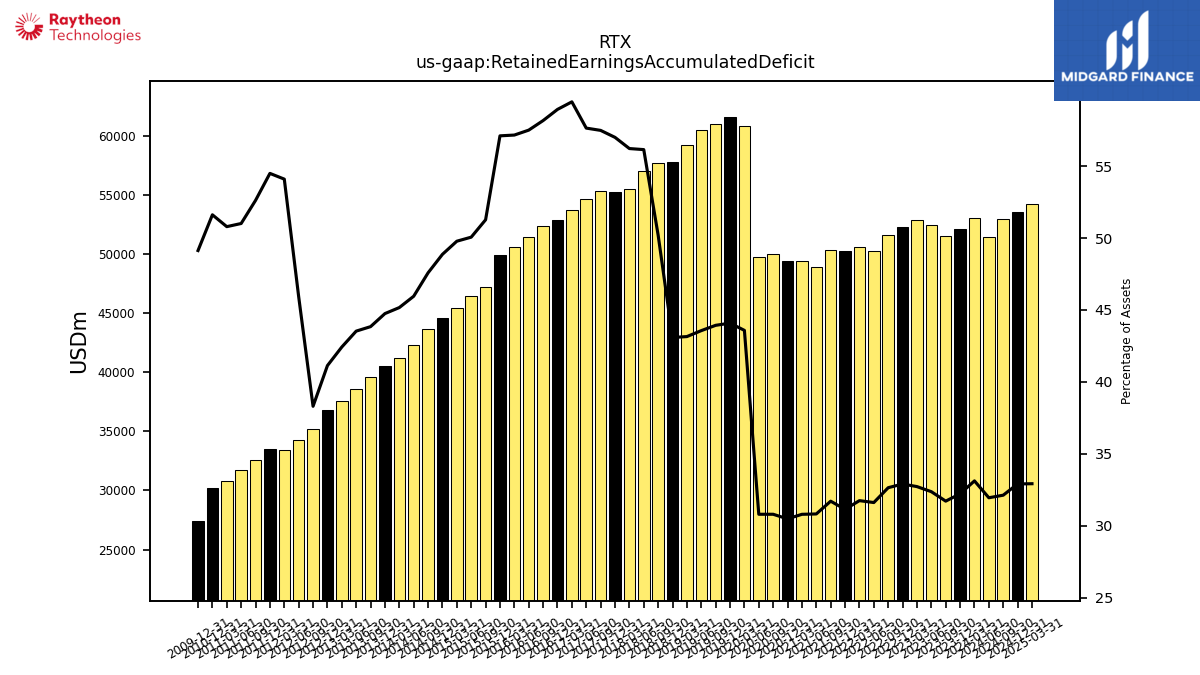
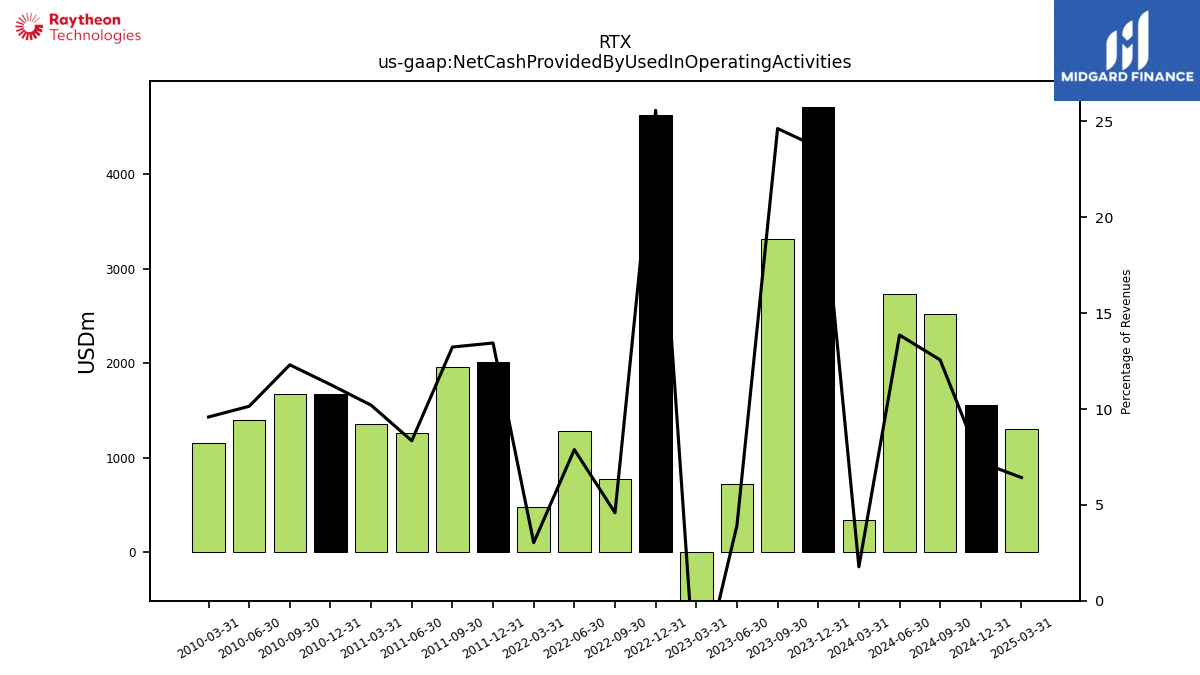
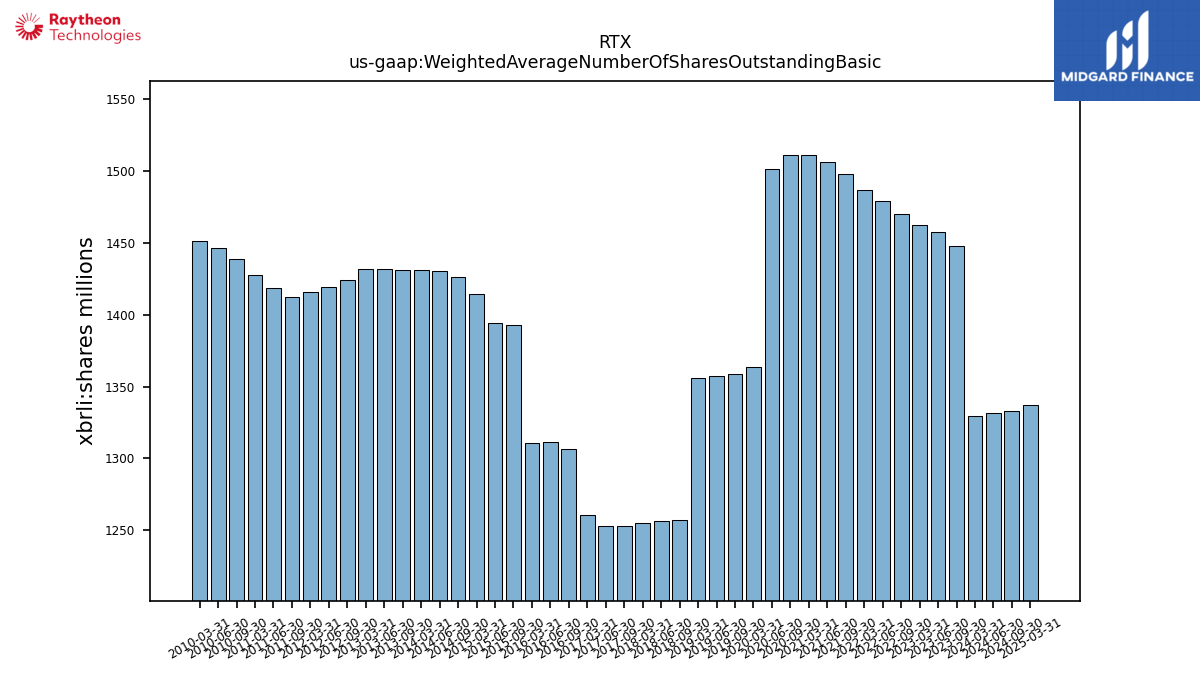
| $RTX$ | 2025-02-03 | 2025-04-22 | 2025-04-22 | NA | NA | RTX | 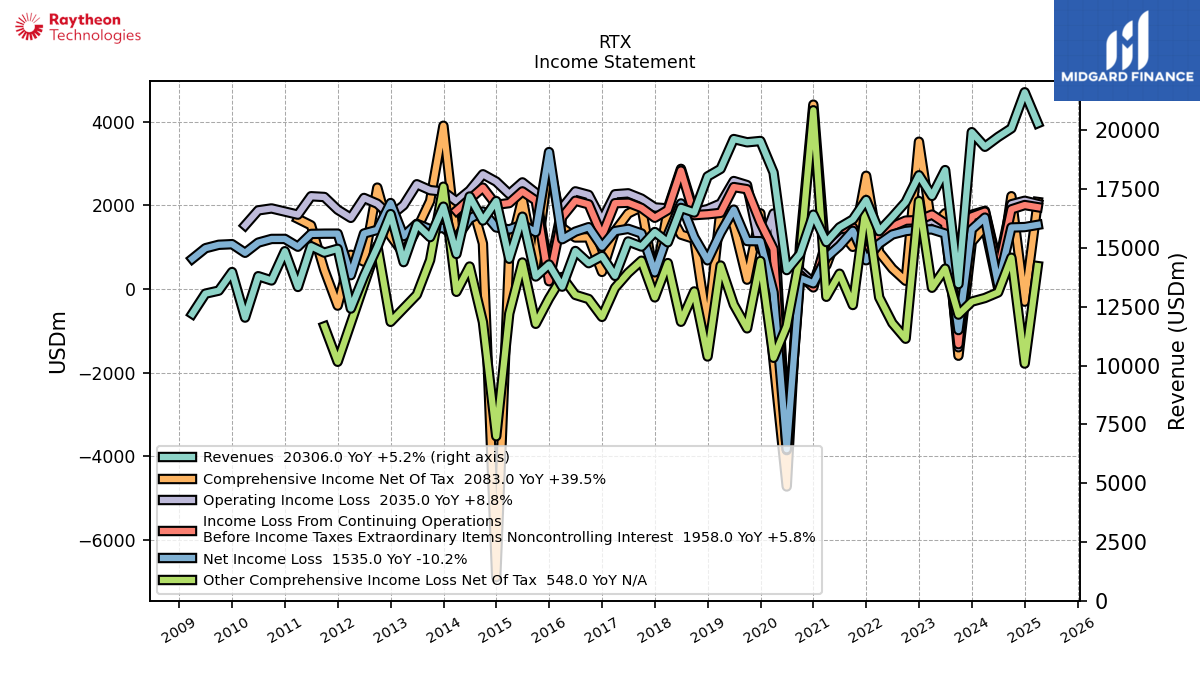 |
 |
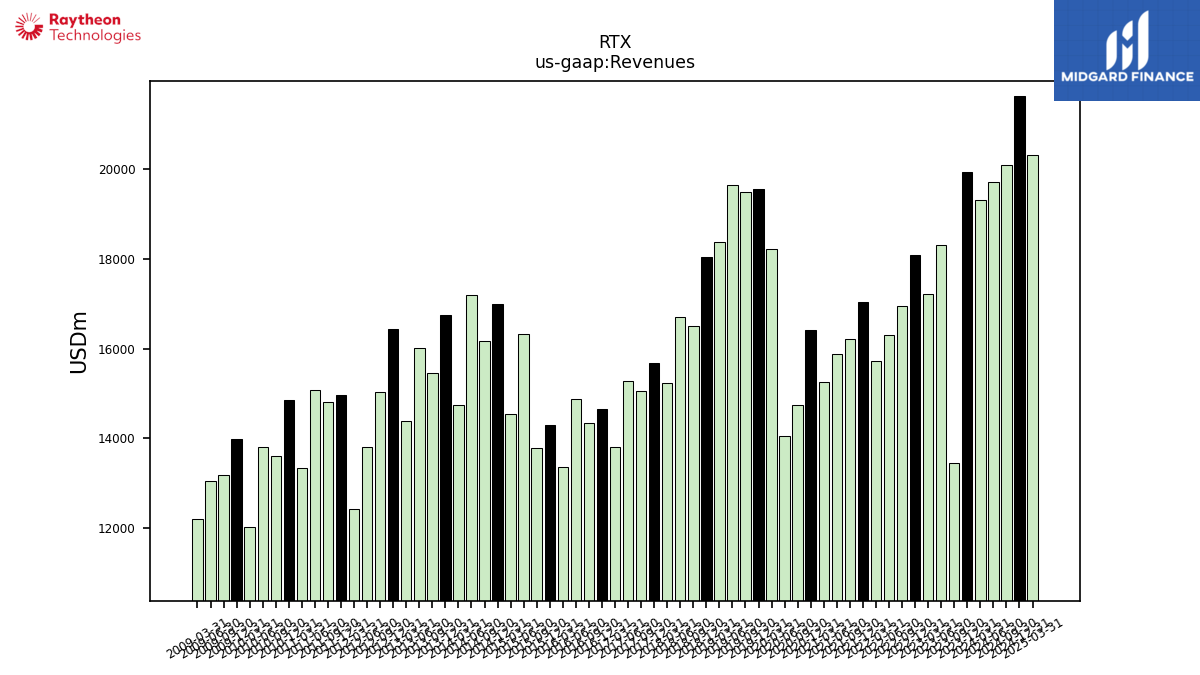 |
RTX | 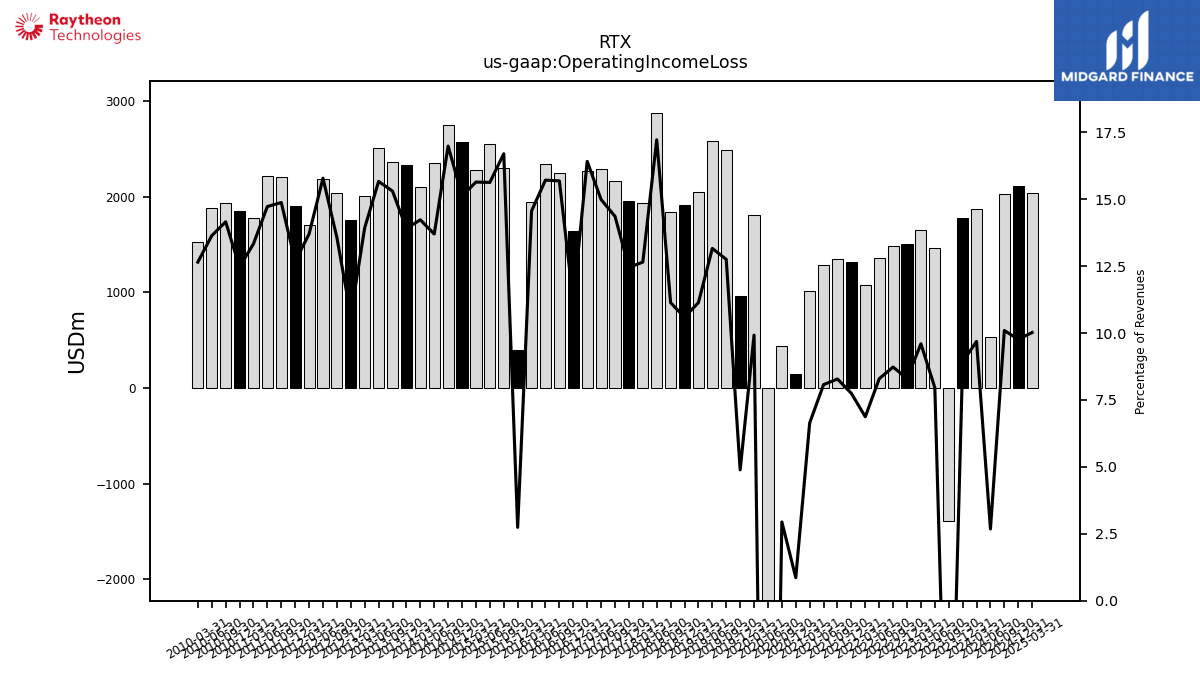 |
 |
RTX | 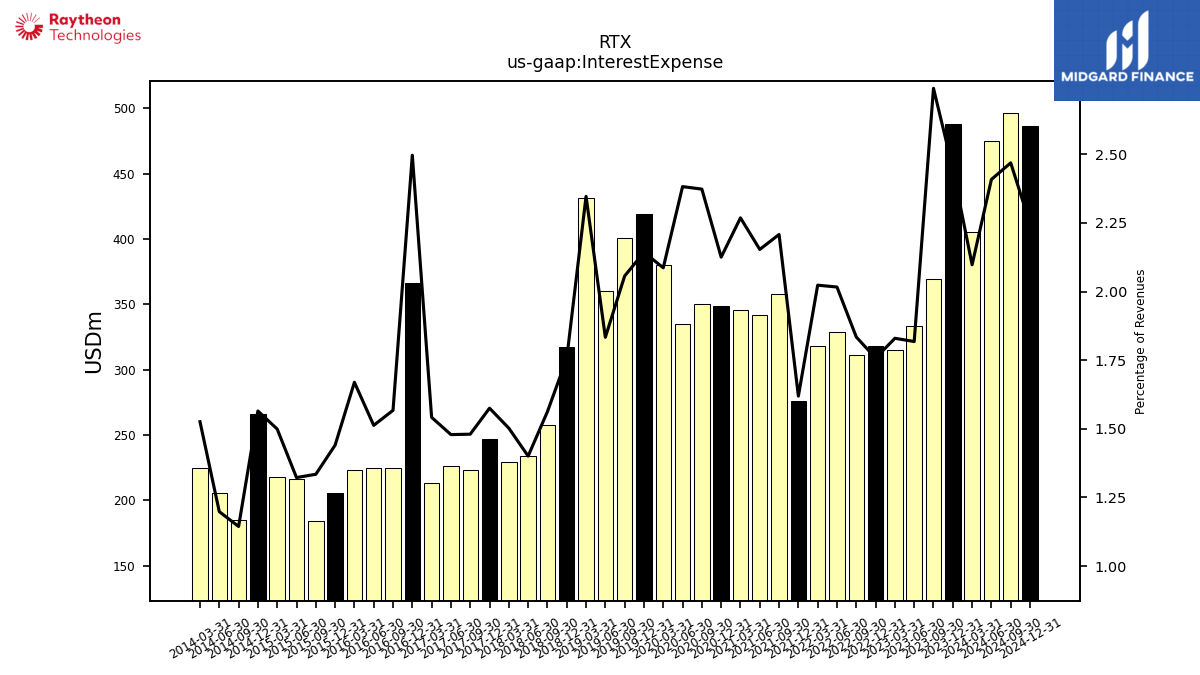 |
 |
 |
RTX | 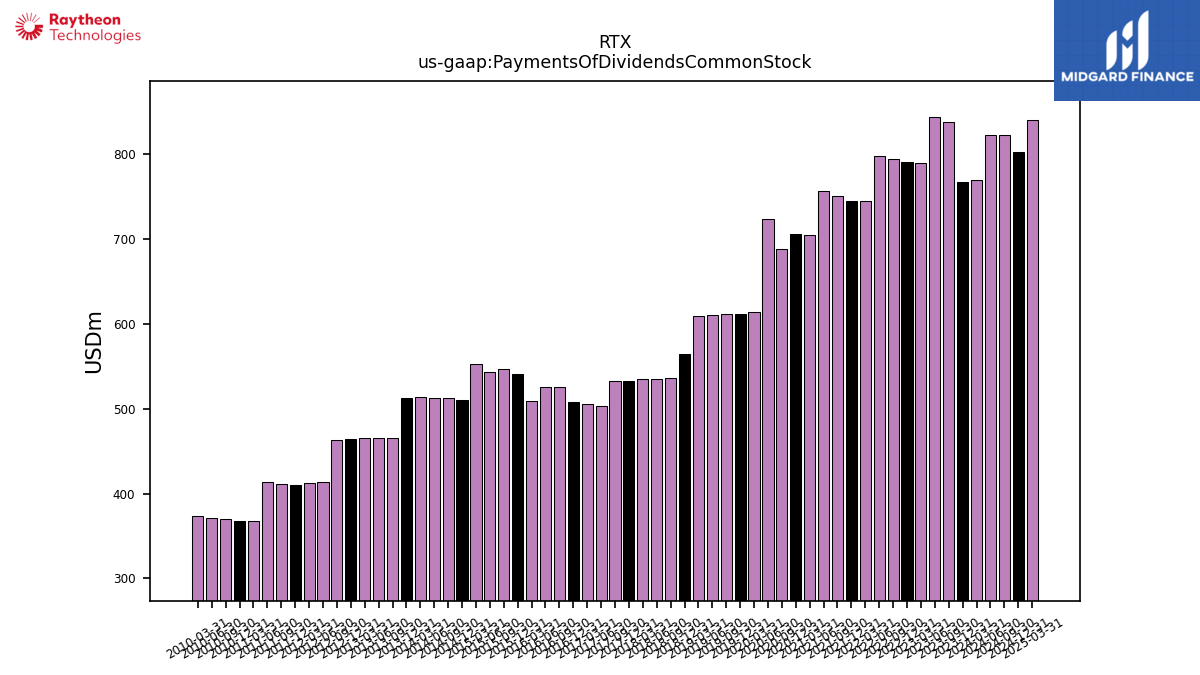 |
 |
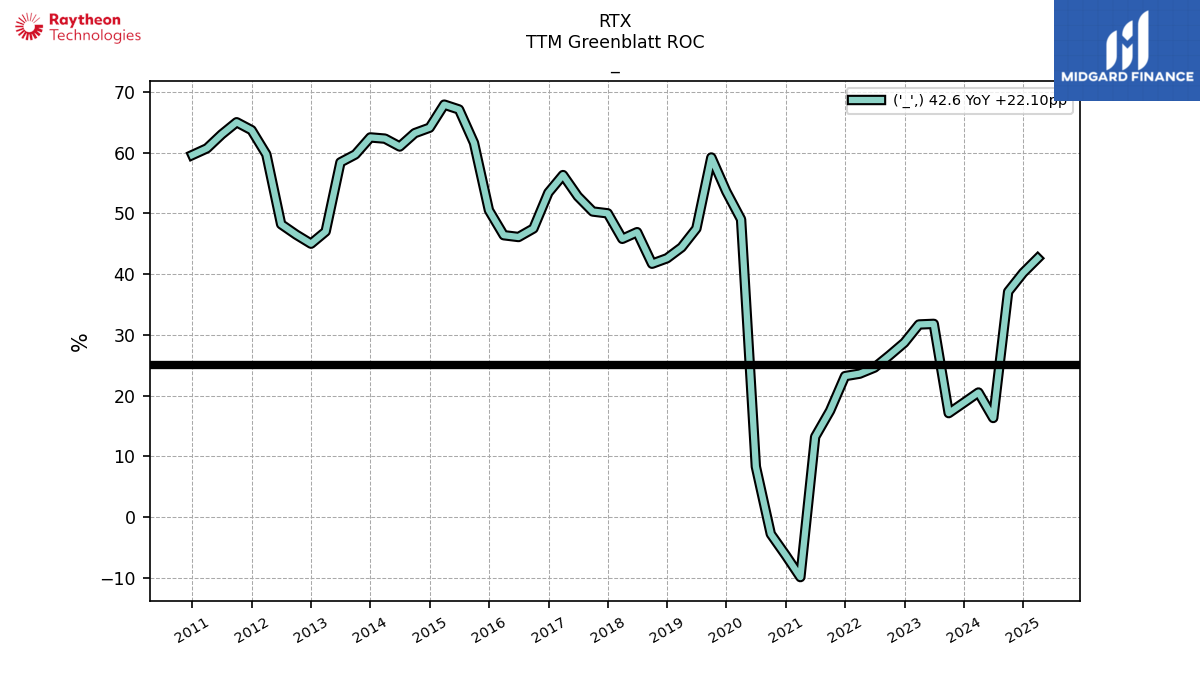 |
RTX | ||||
| Ticker | 10K | 10Q | 8K | Sector | Industry | Logo | Forward P/E | Revenue Growth | Ticker | Income | EPS | Revenues | Ticker | GrossProfit | OperatingIncome | LongTermDebt | Ticker | InterestExpense | RetainedEarnnings | CashFlowOperating | Ticker | Dividends | SharesOutstanding | TTMGreenblattROC | |
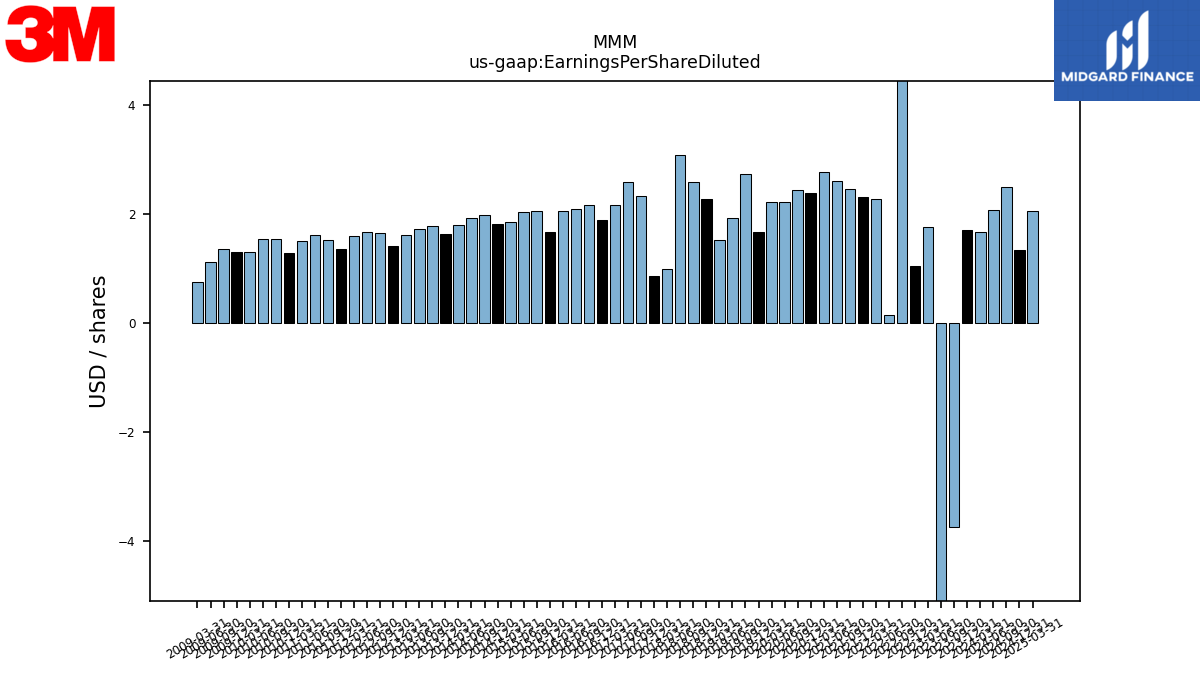
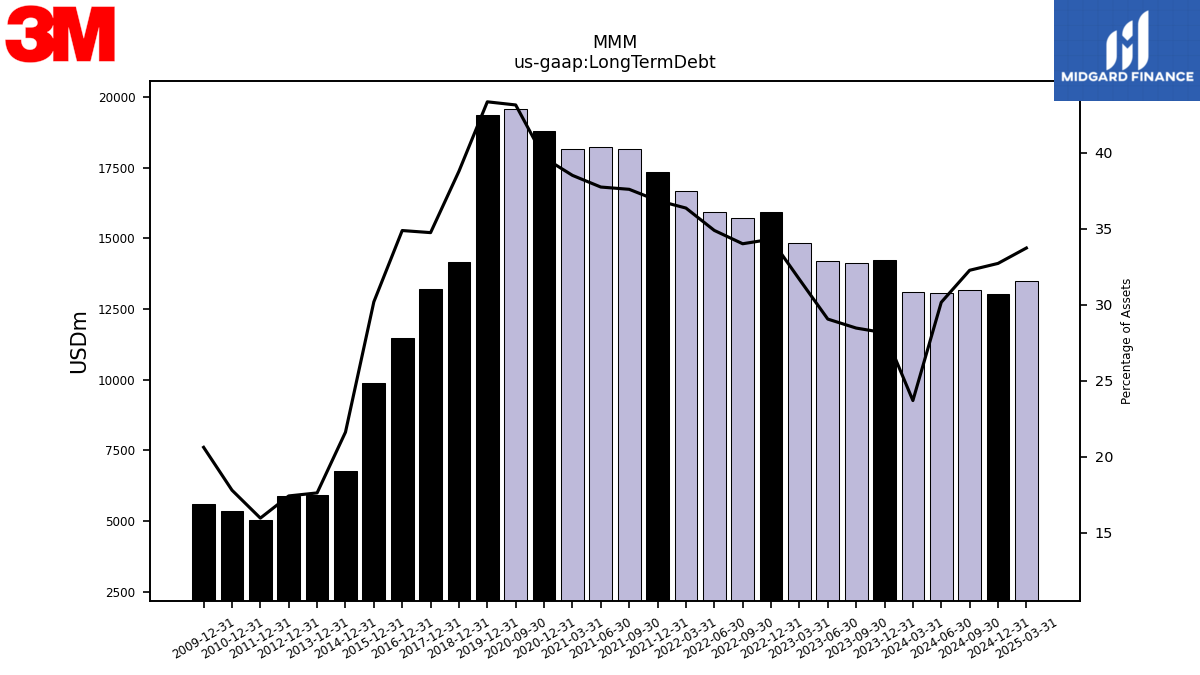
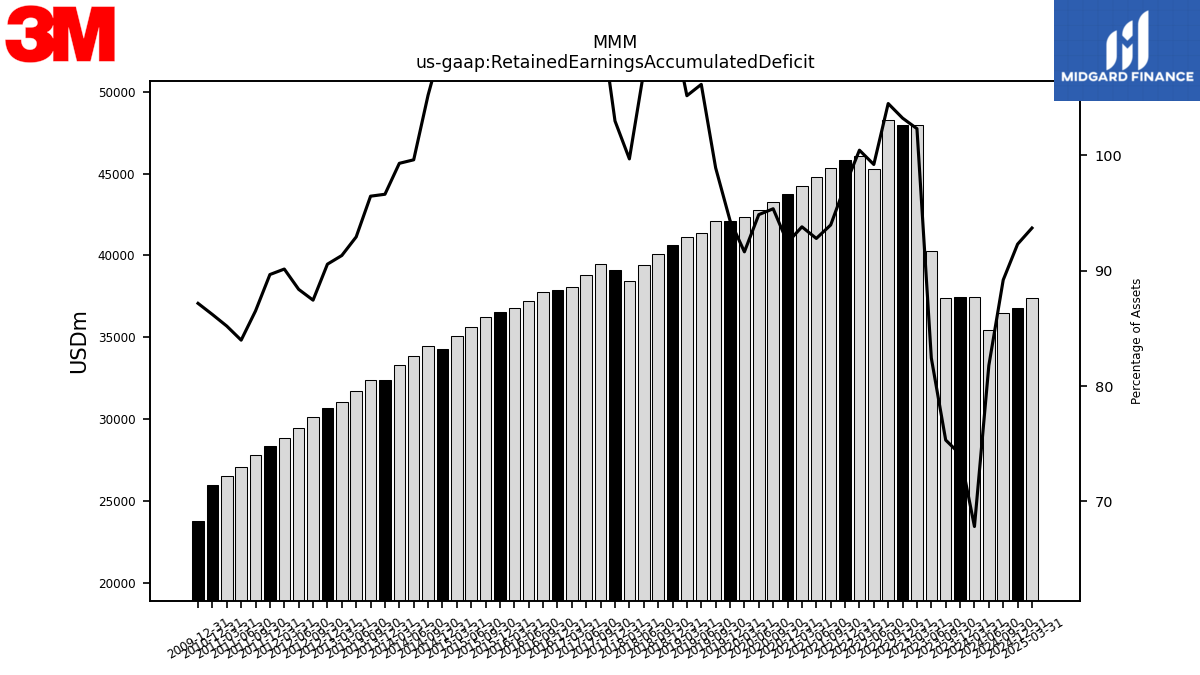
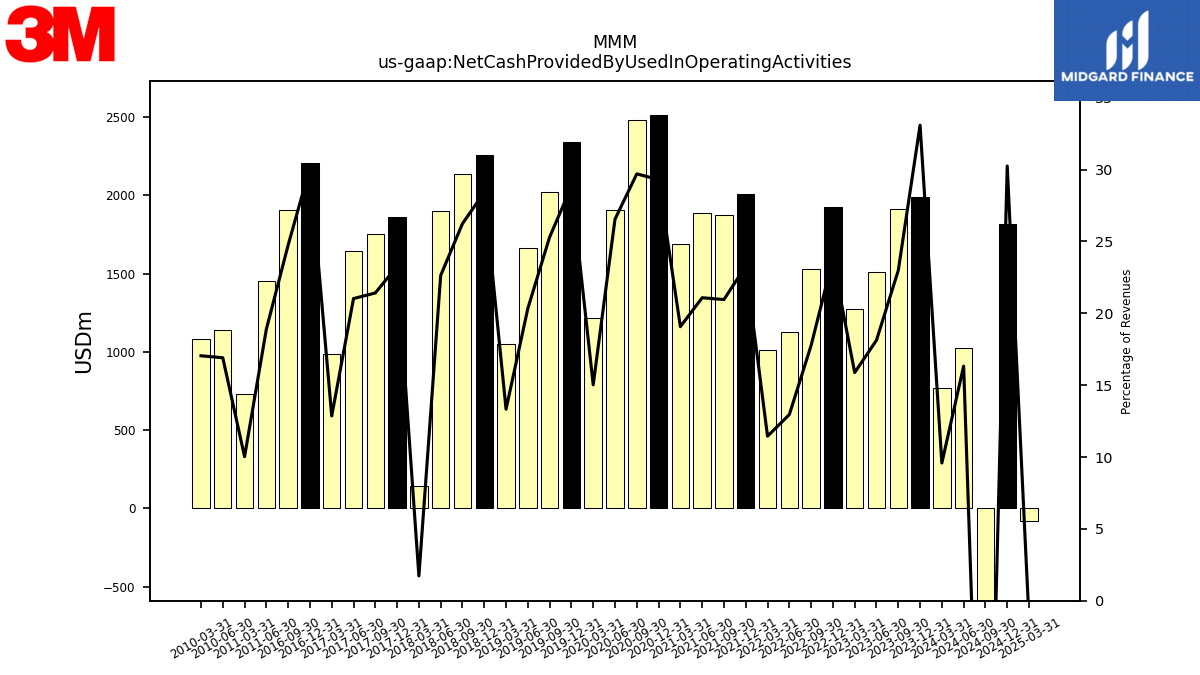
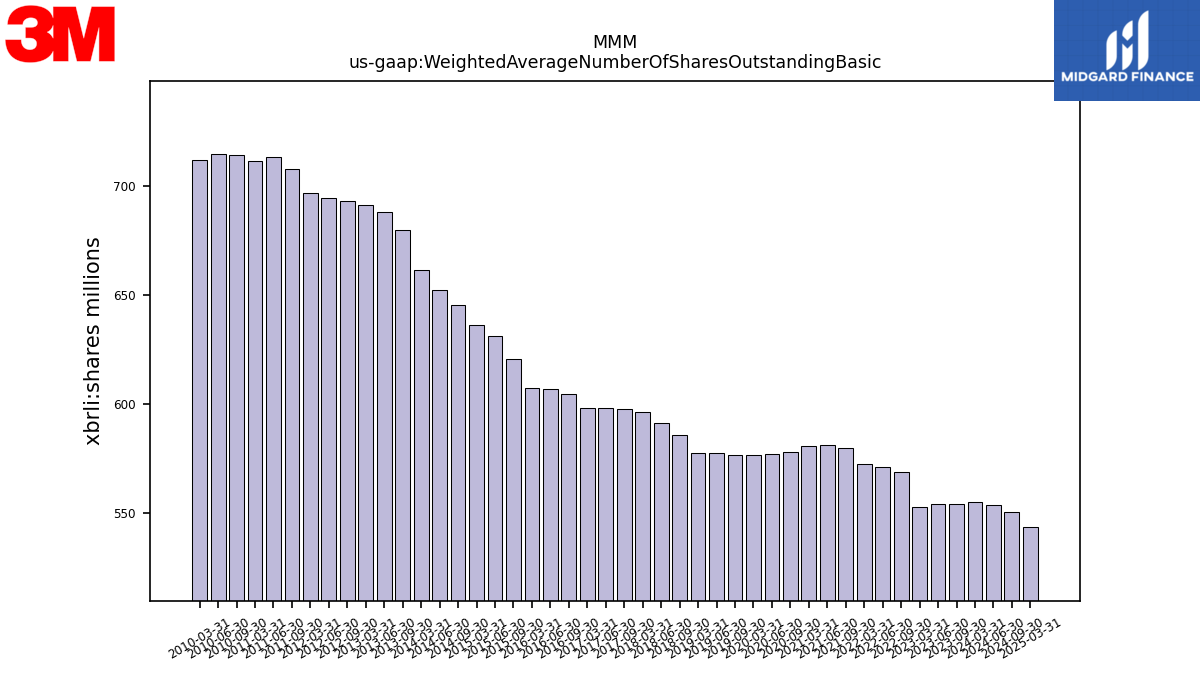
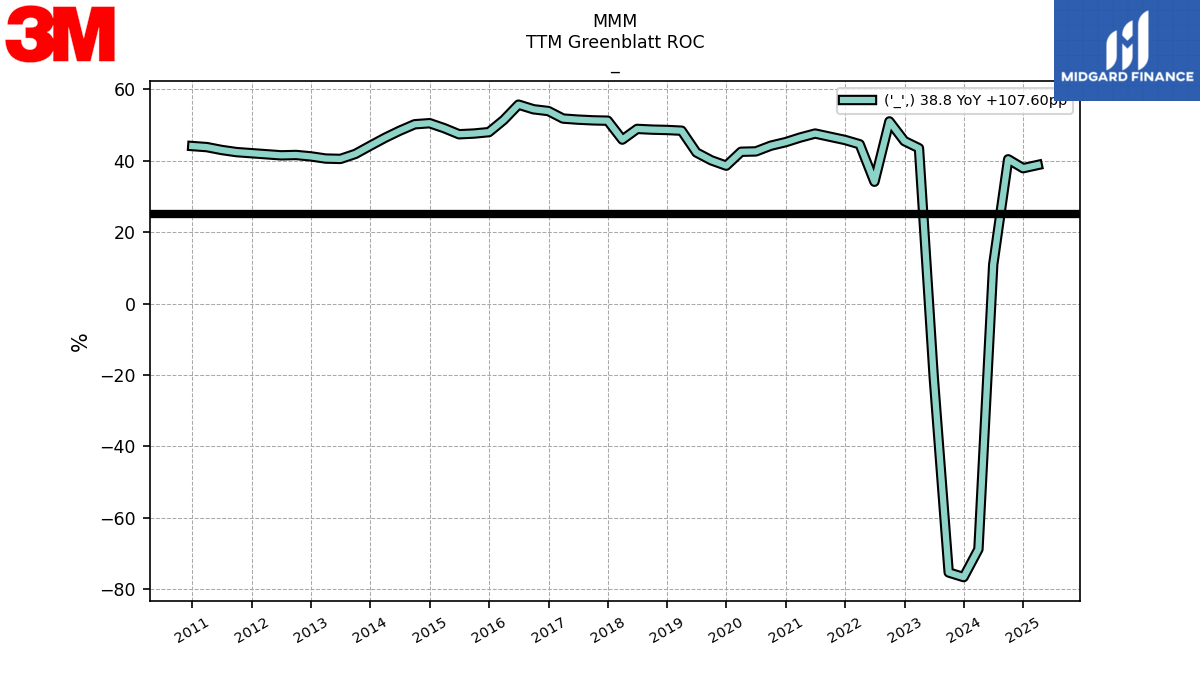
| $MMM$ | 2025-02-05 | 2025-04-22 | 2025-04-22 |  |
NA | NA | MMM | 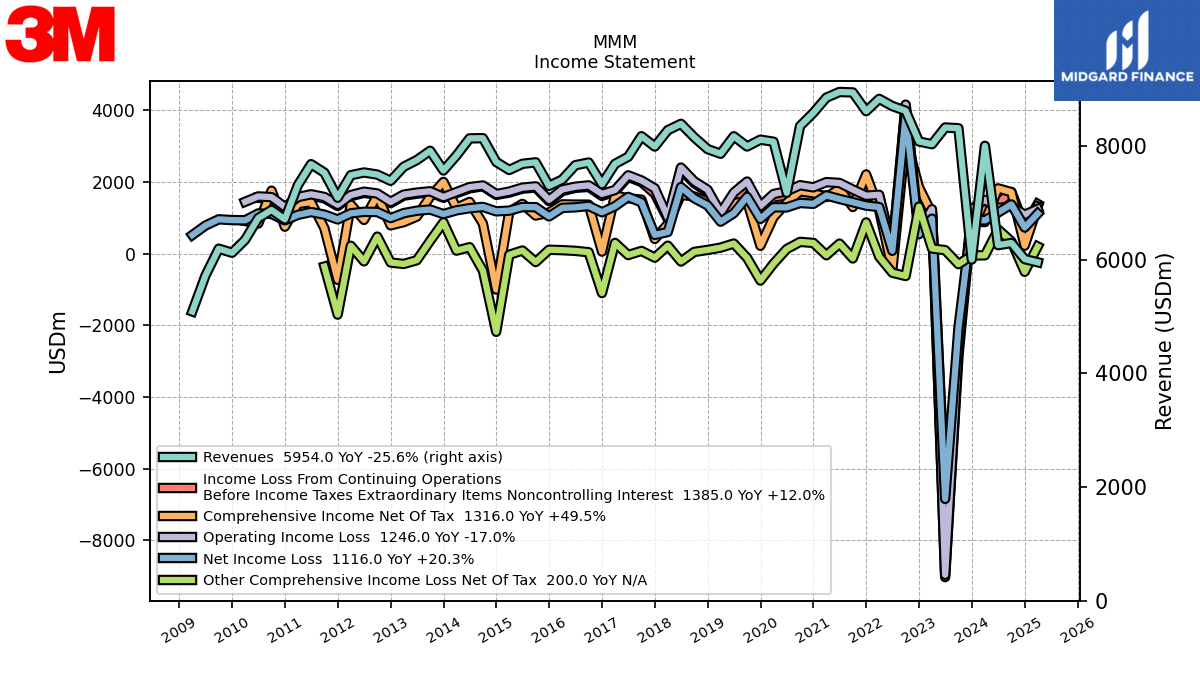 |
 |
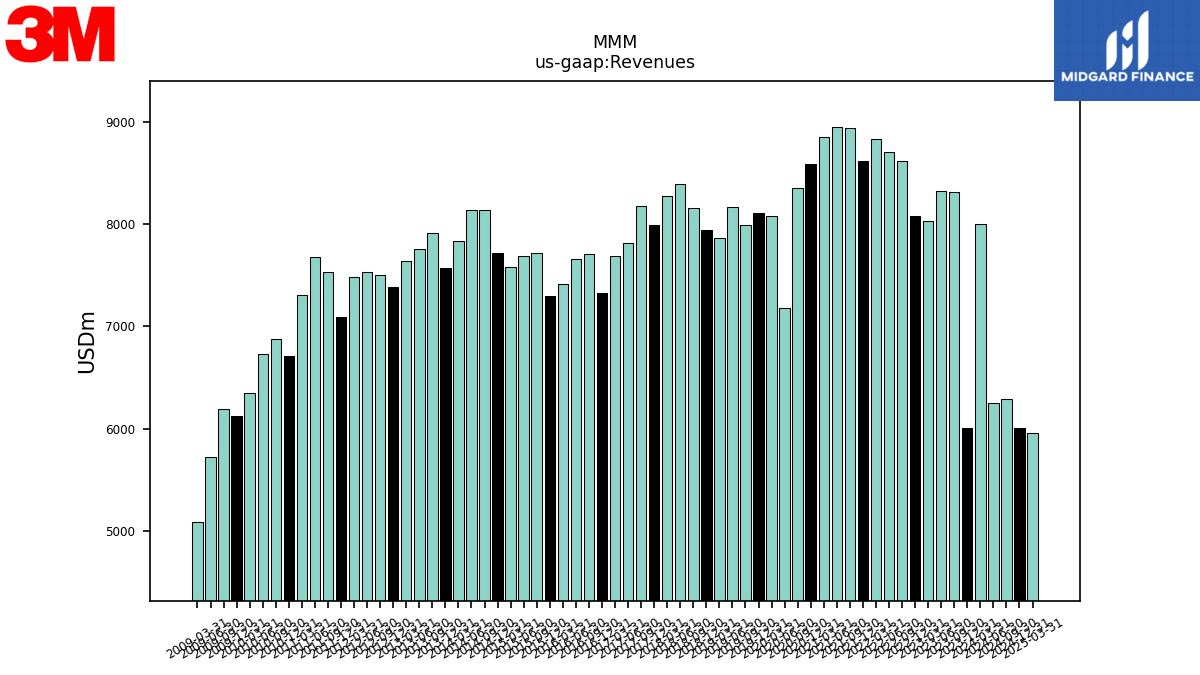 |
MMM | 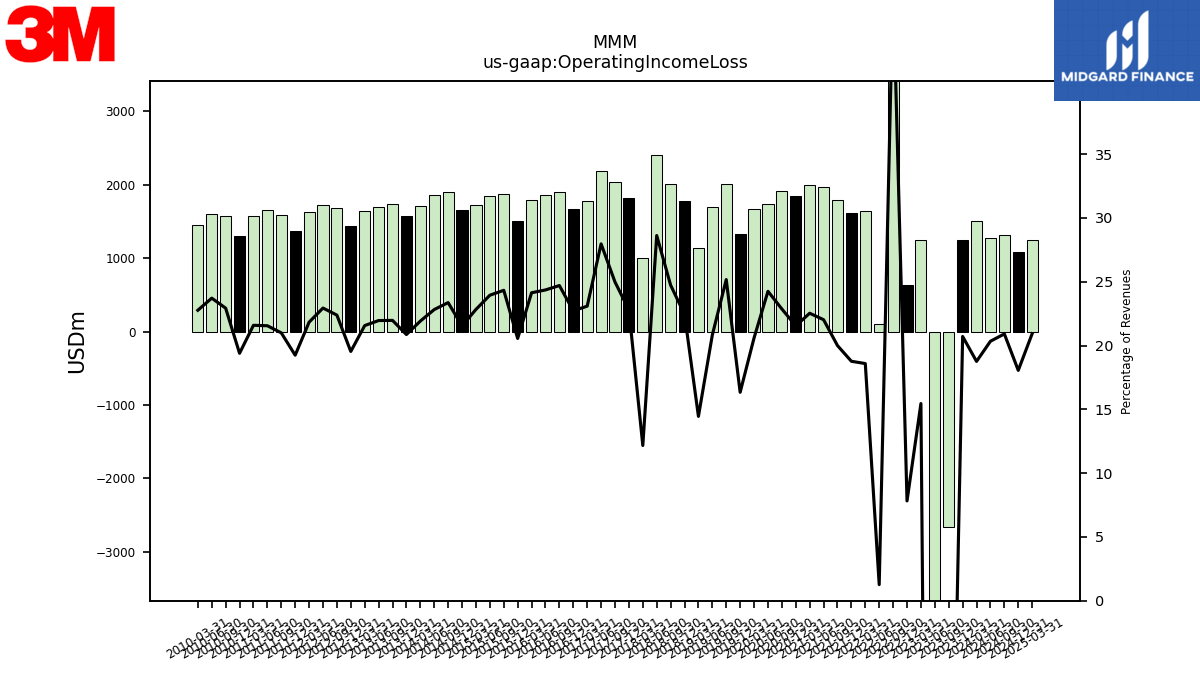 |
 |
MMM | 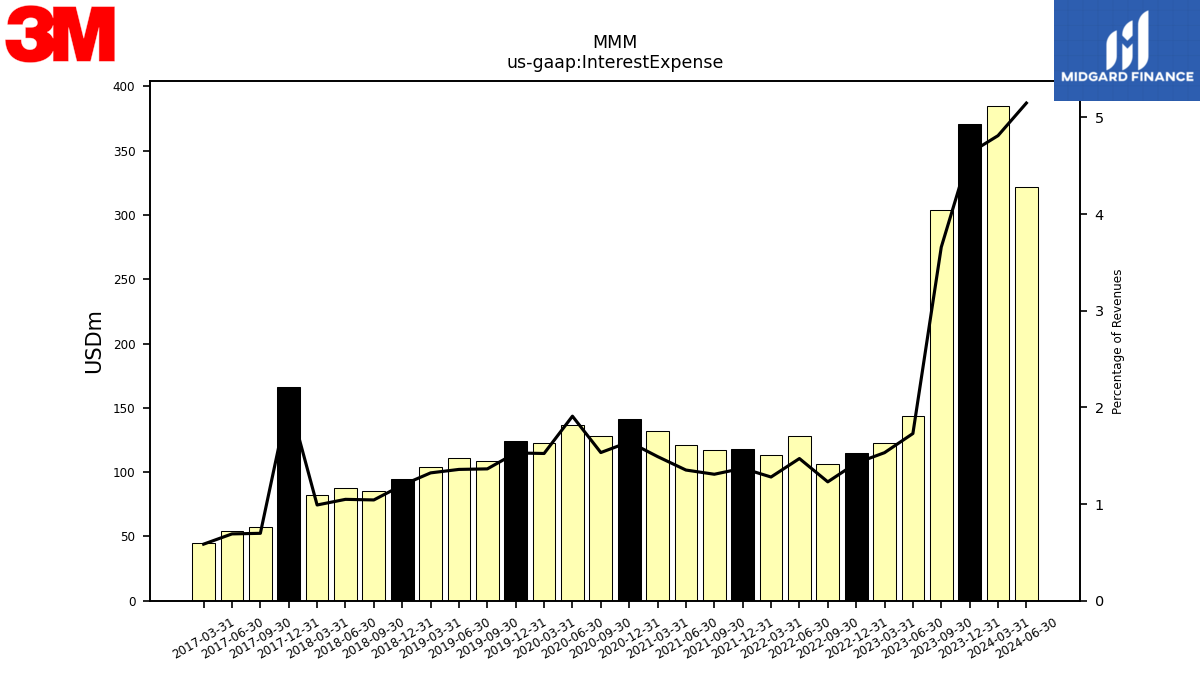 |
 |
 |
MMM | 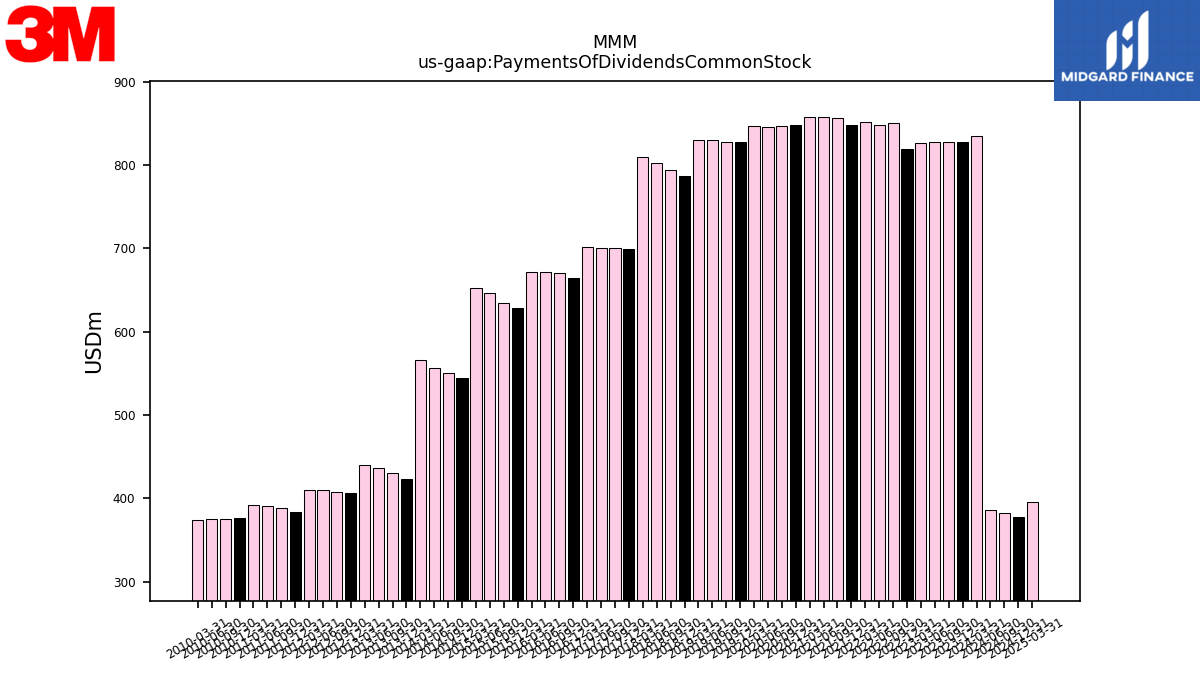 |
 |
 |
MMM | |||
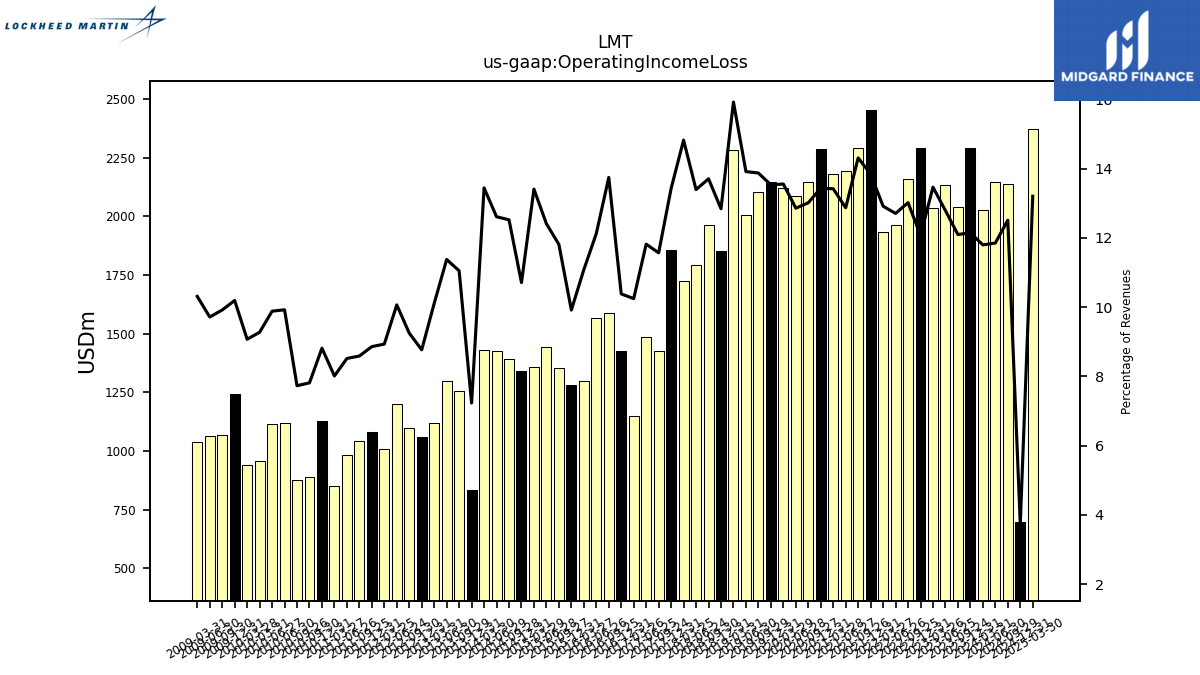
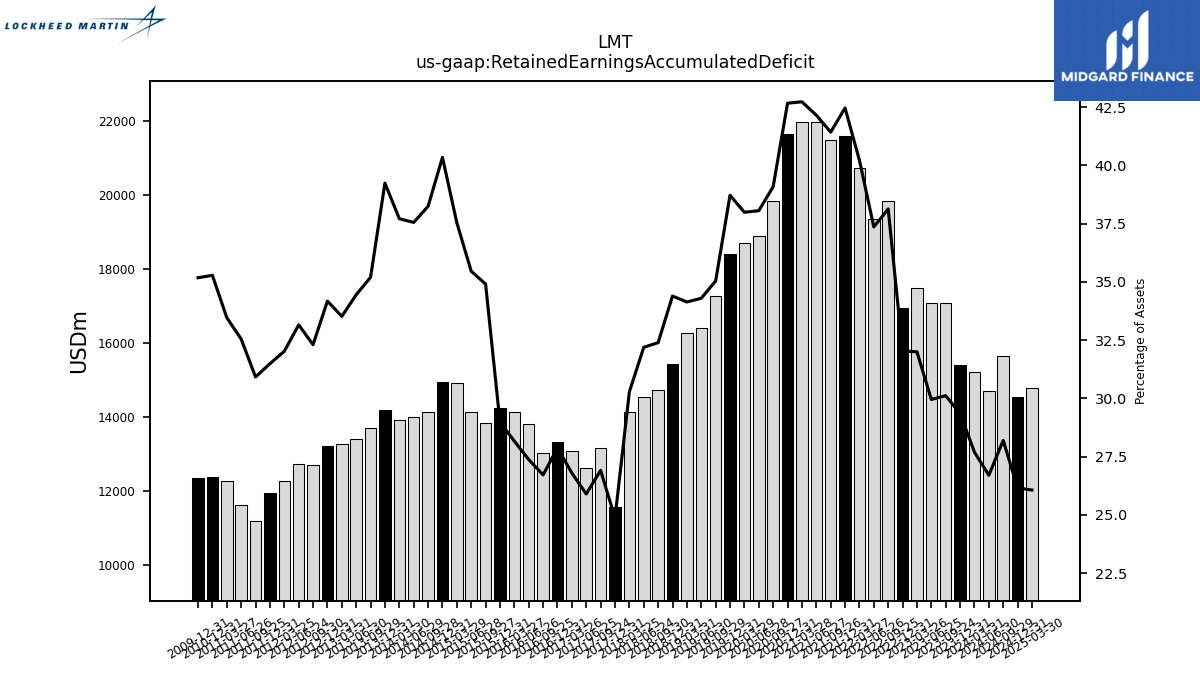
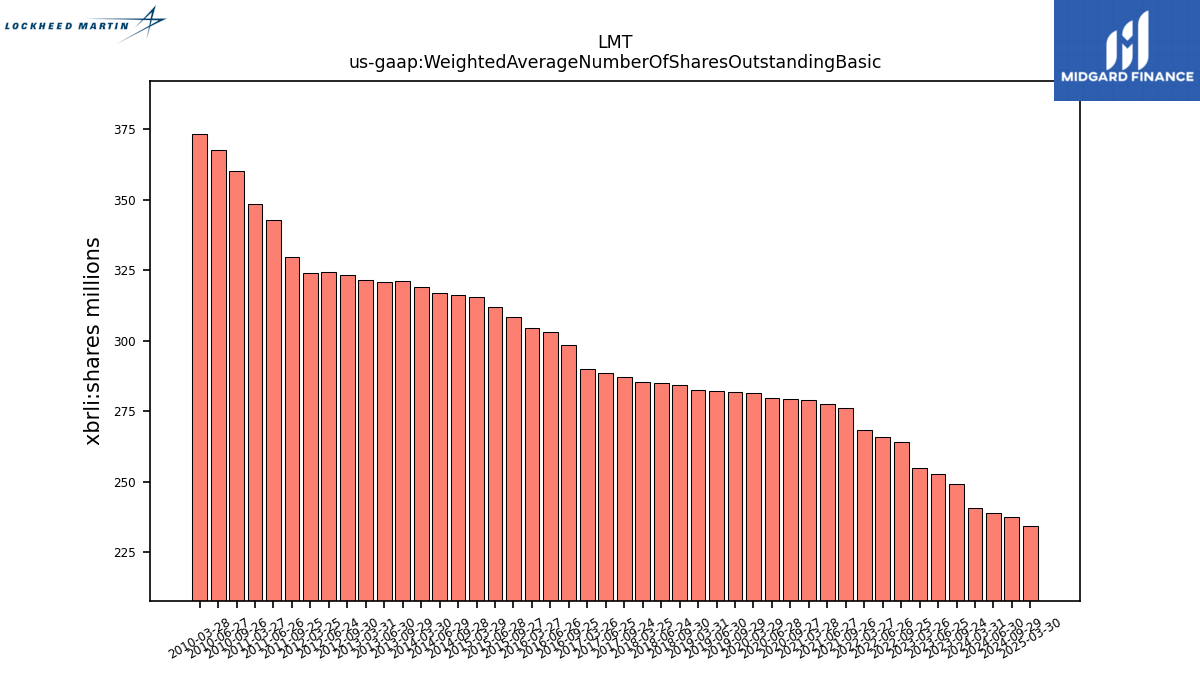
| $LMT$ | 2025-01-28 | 2025-04-22 | 2025-04-22 | NA | NA | LMT | 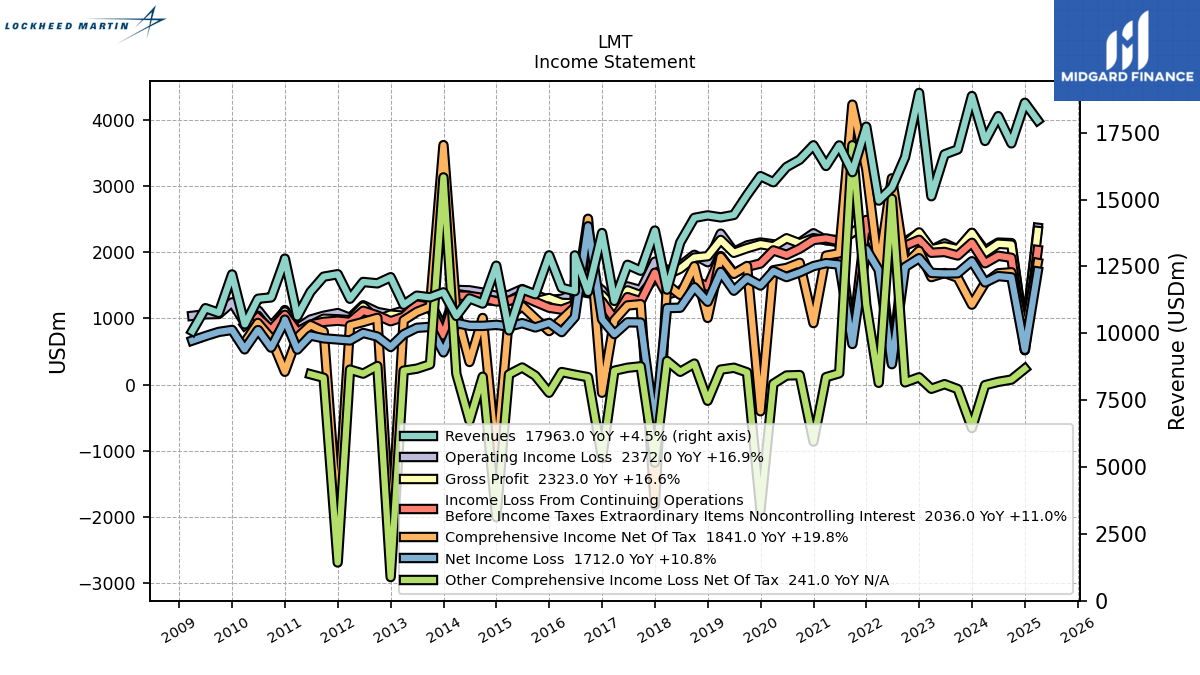 |
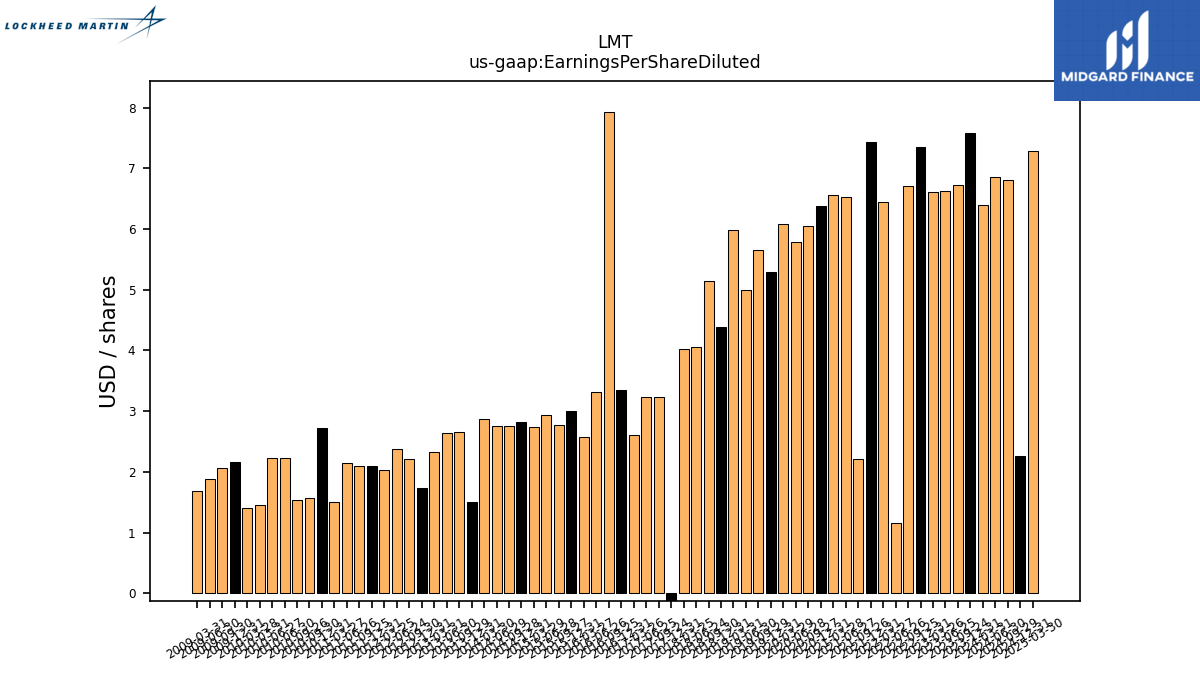 |
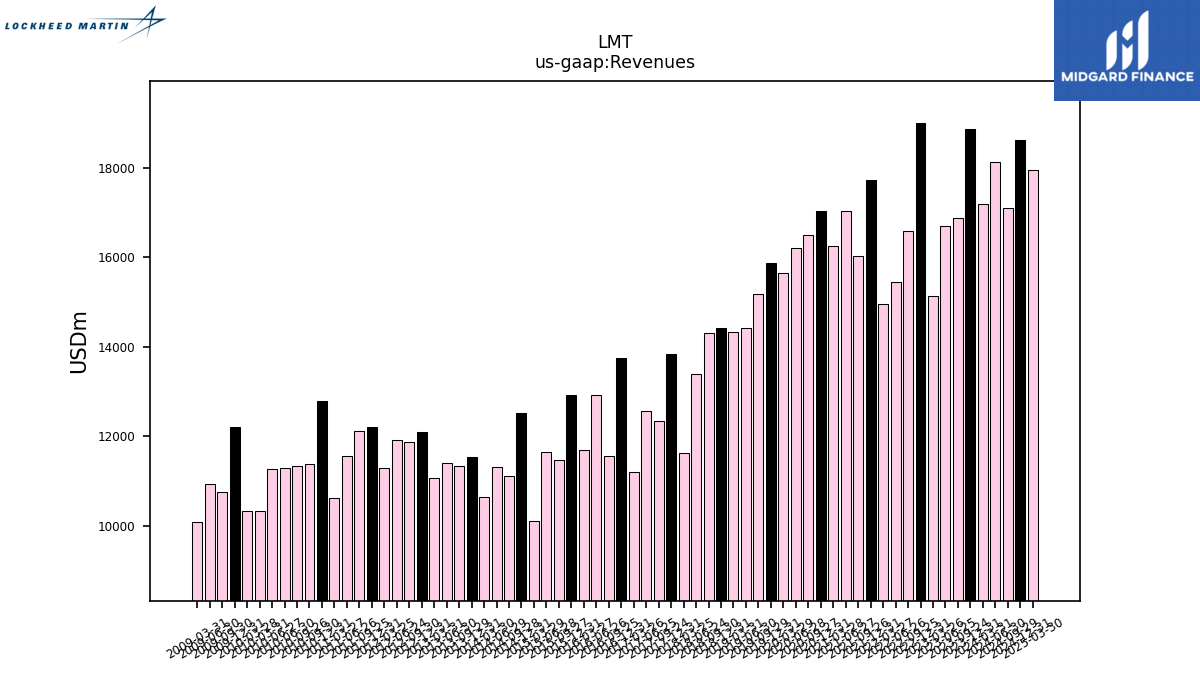 |
LMT | 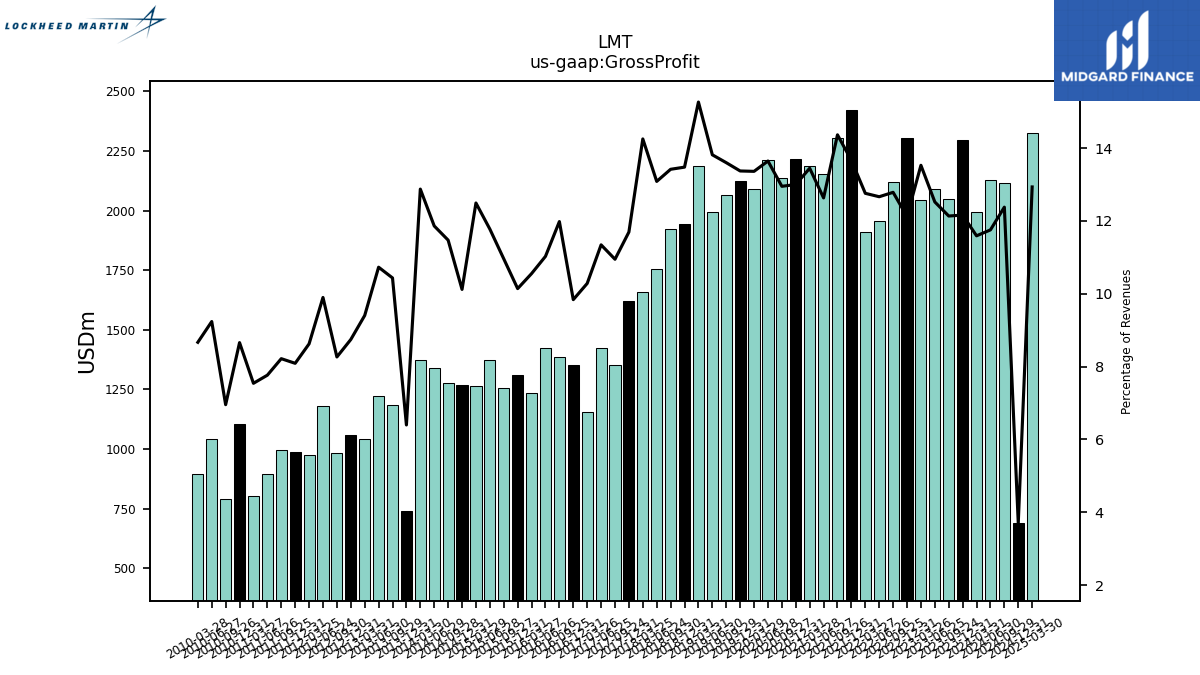 |
 |
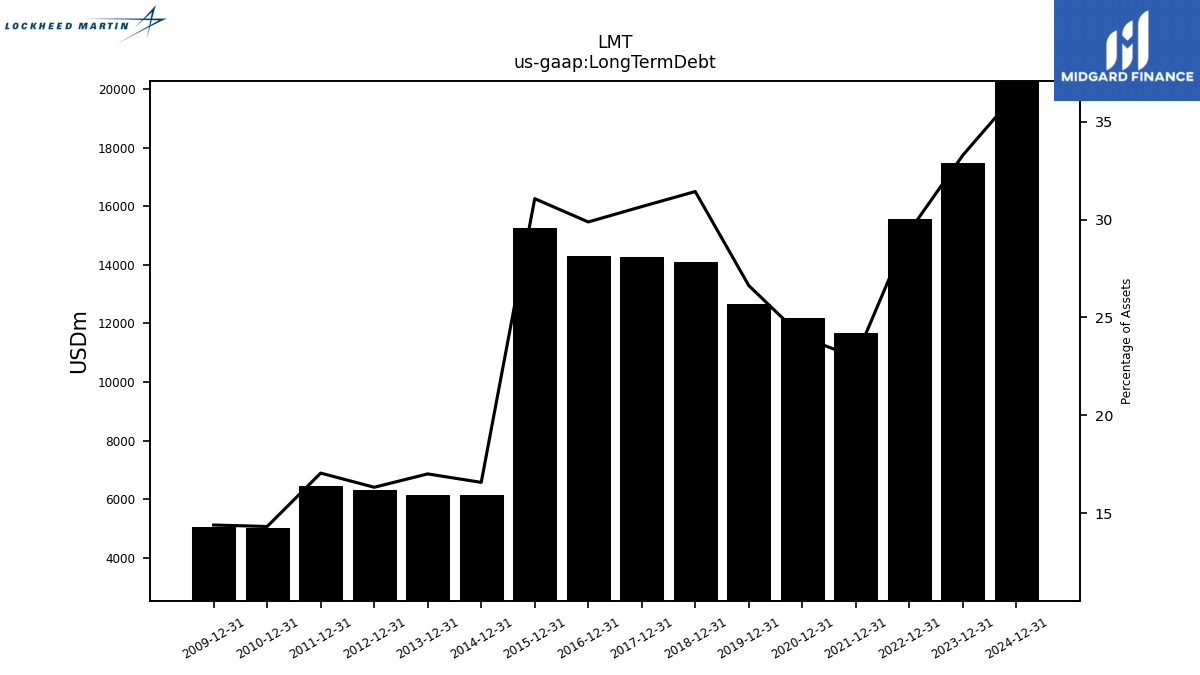 |
LMT | 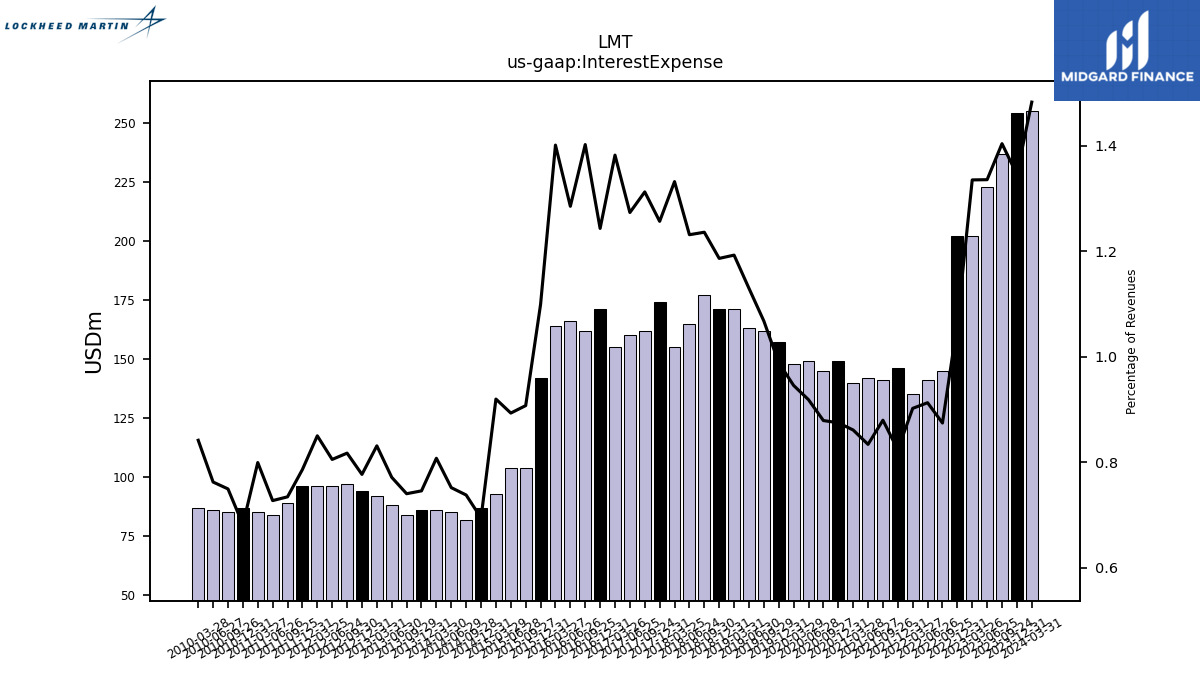 |
 |
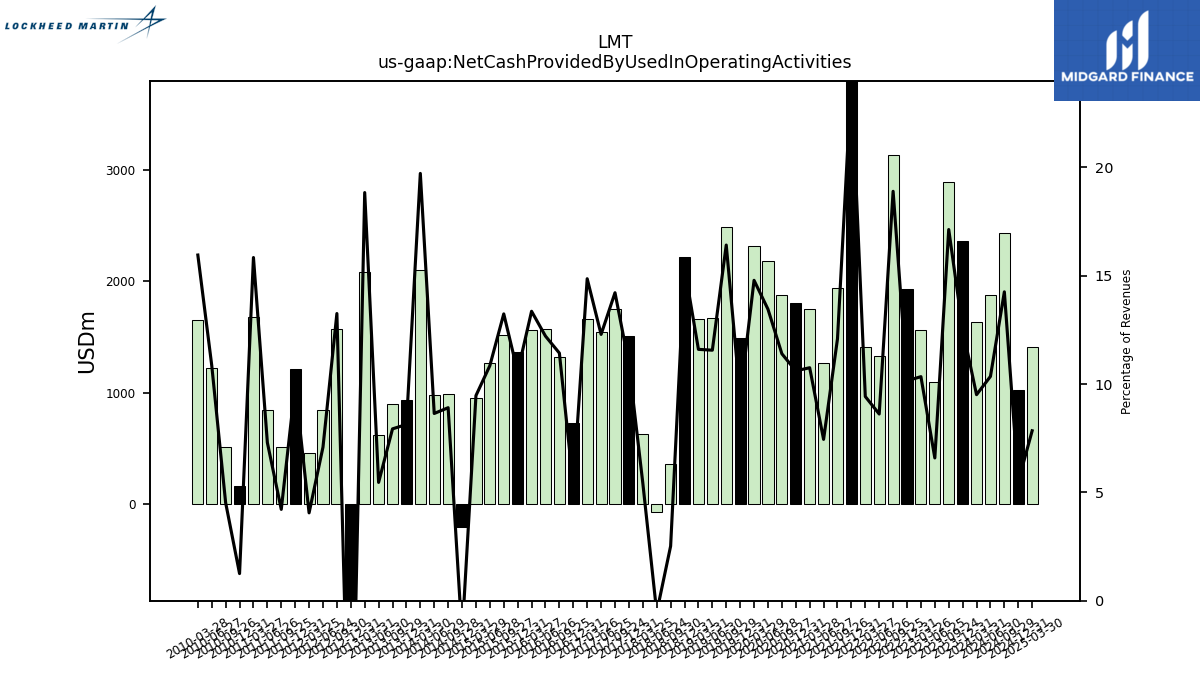 |
LMT | 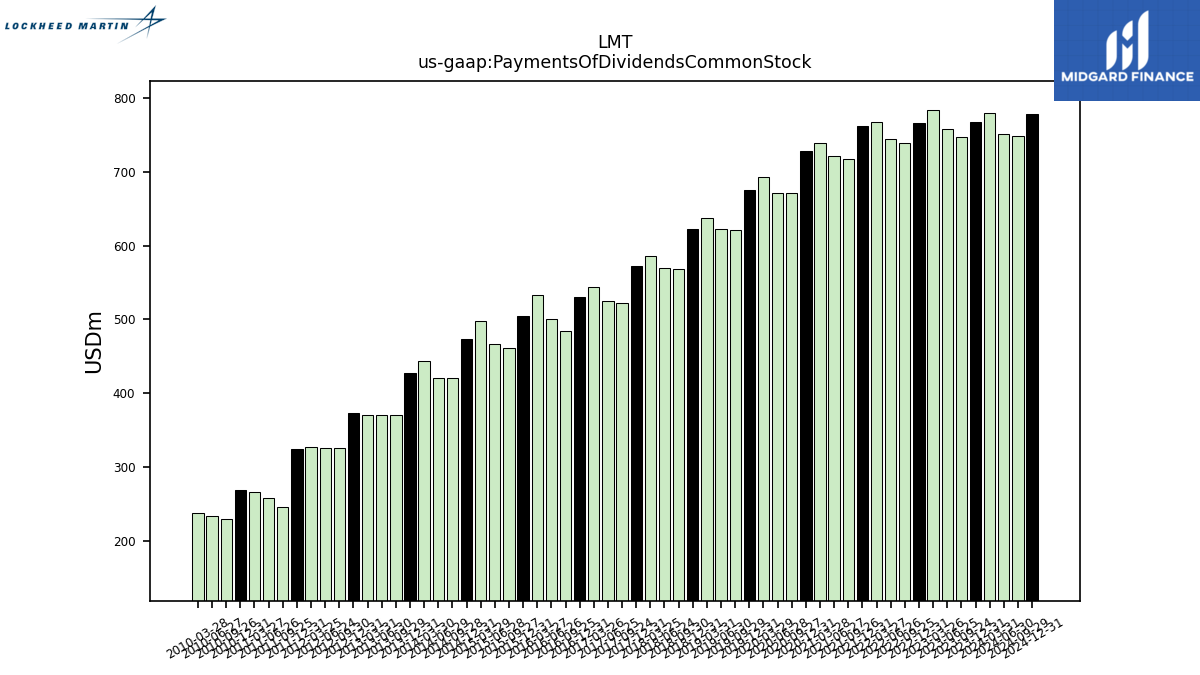 |
 |
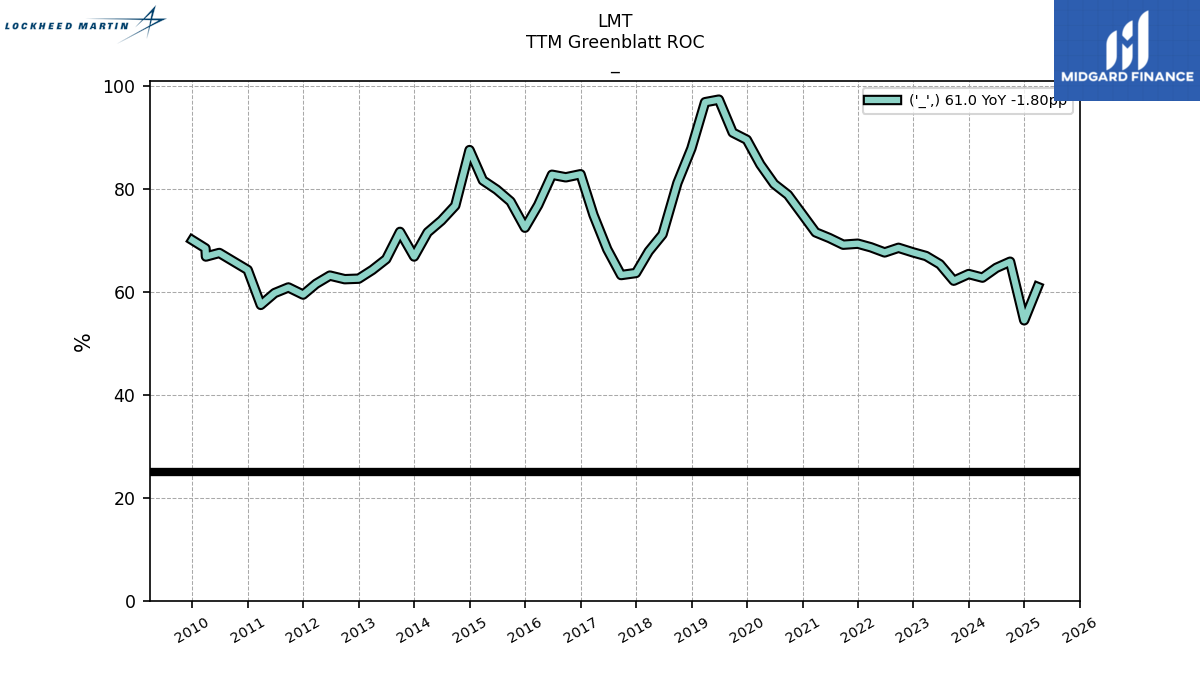 |
LMT | |||
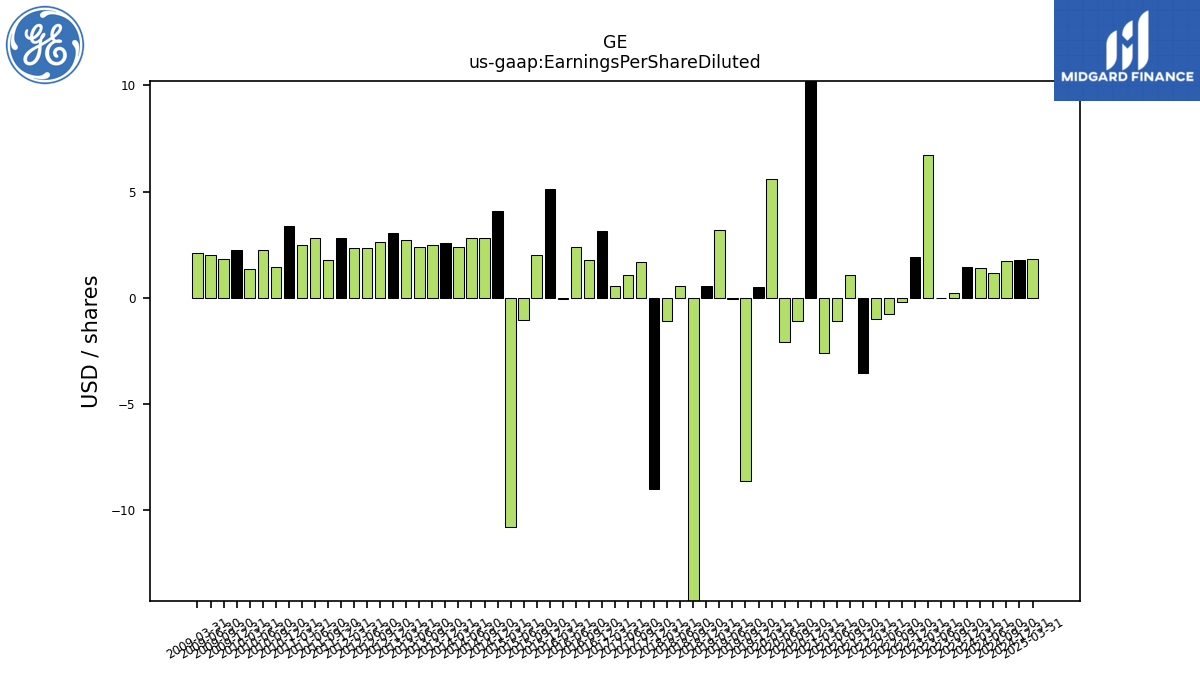
| $GE$ | 2025-02-03 | 2025-04-22 | 2025-04-22 | NA | NA | GE | 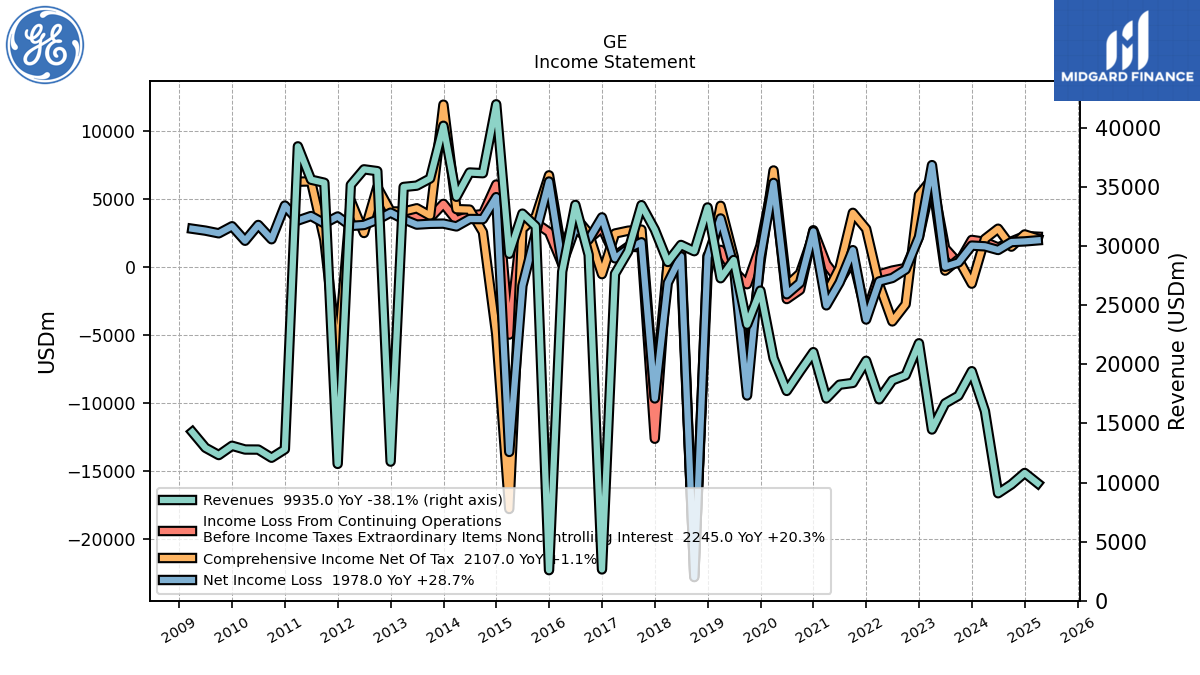 |
 |
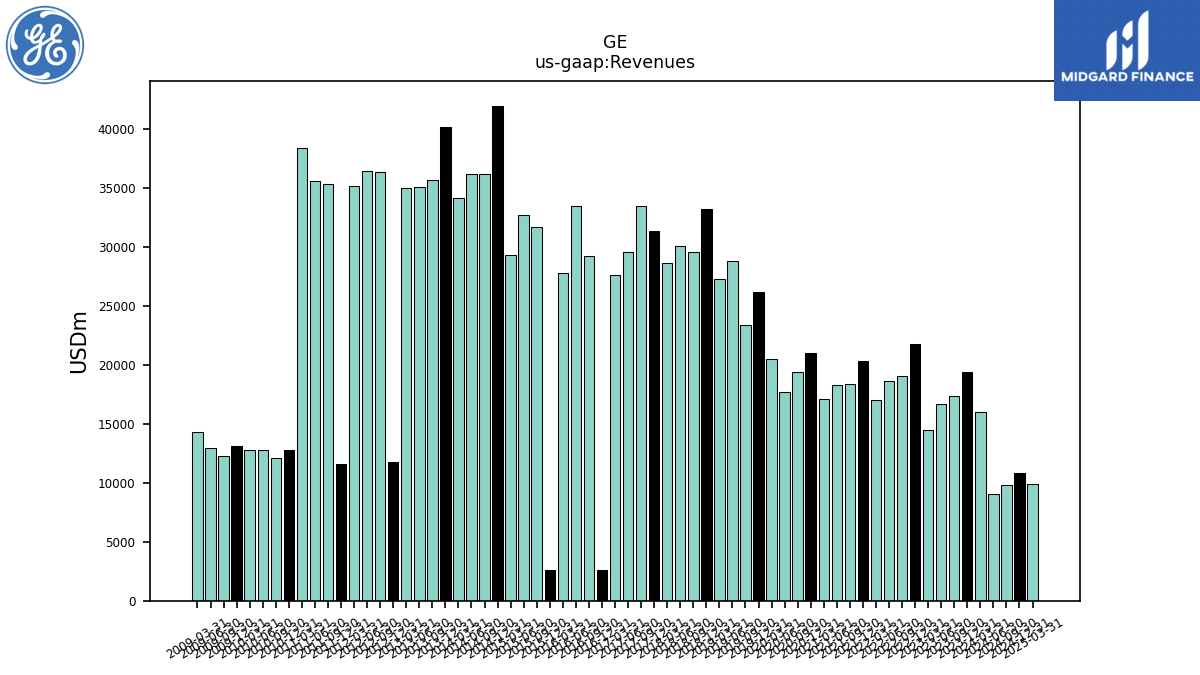 |
GE |  |
GE | 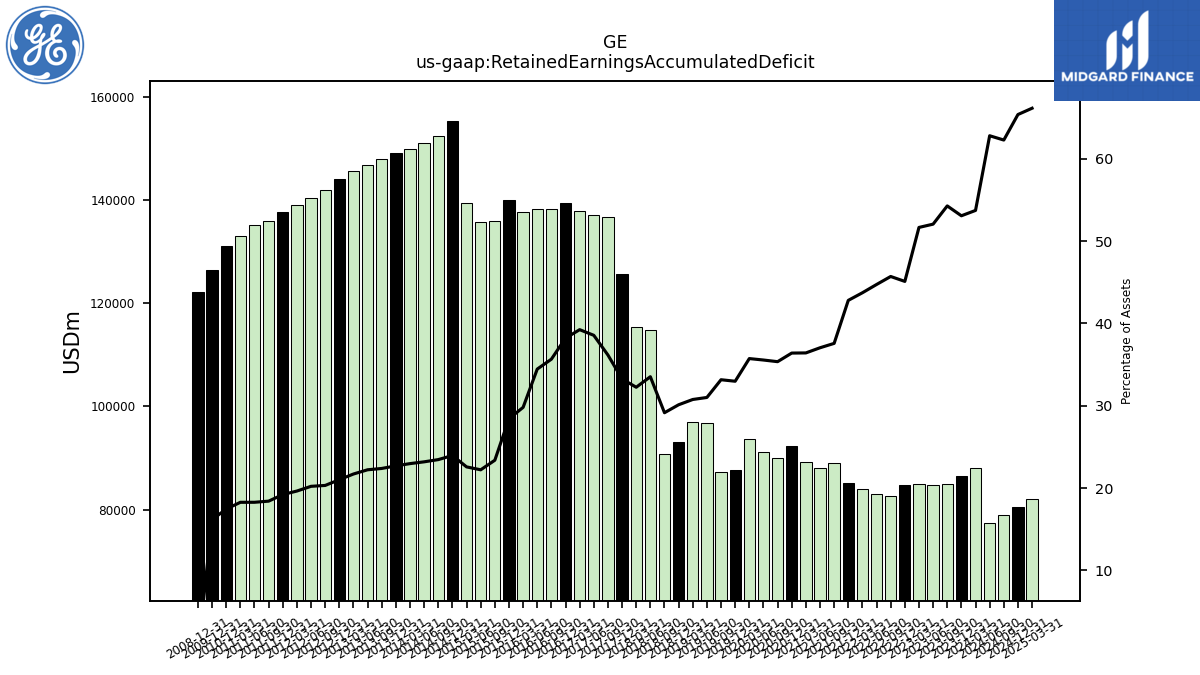 |
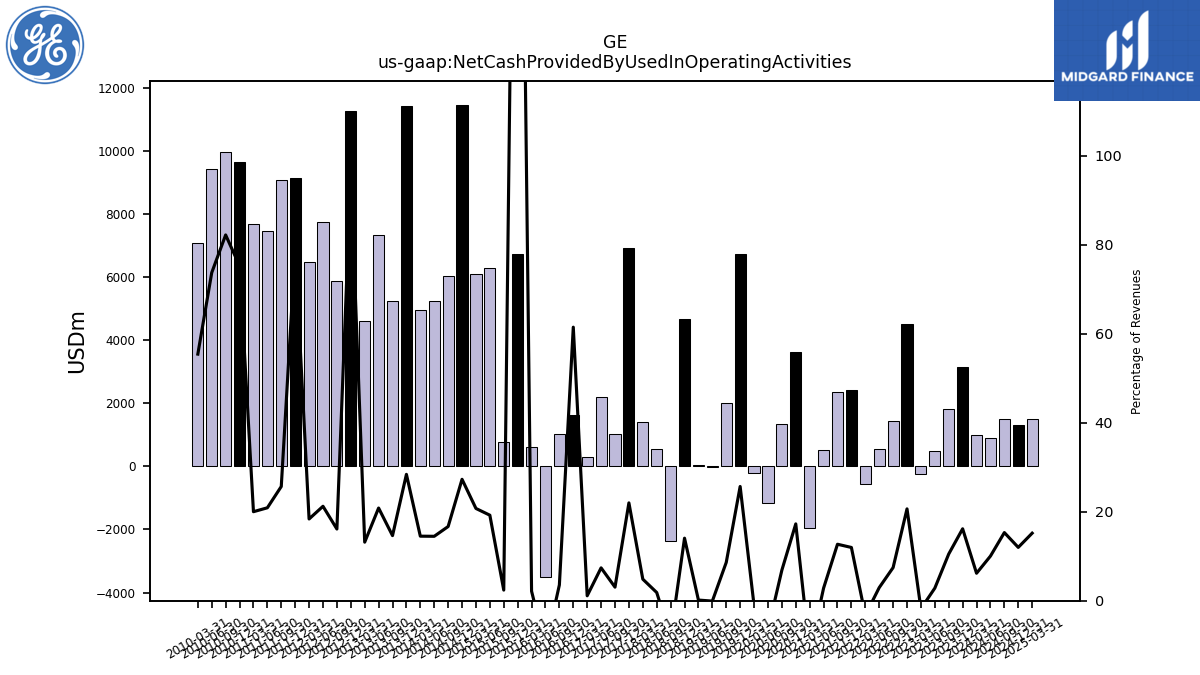 |
GE | 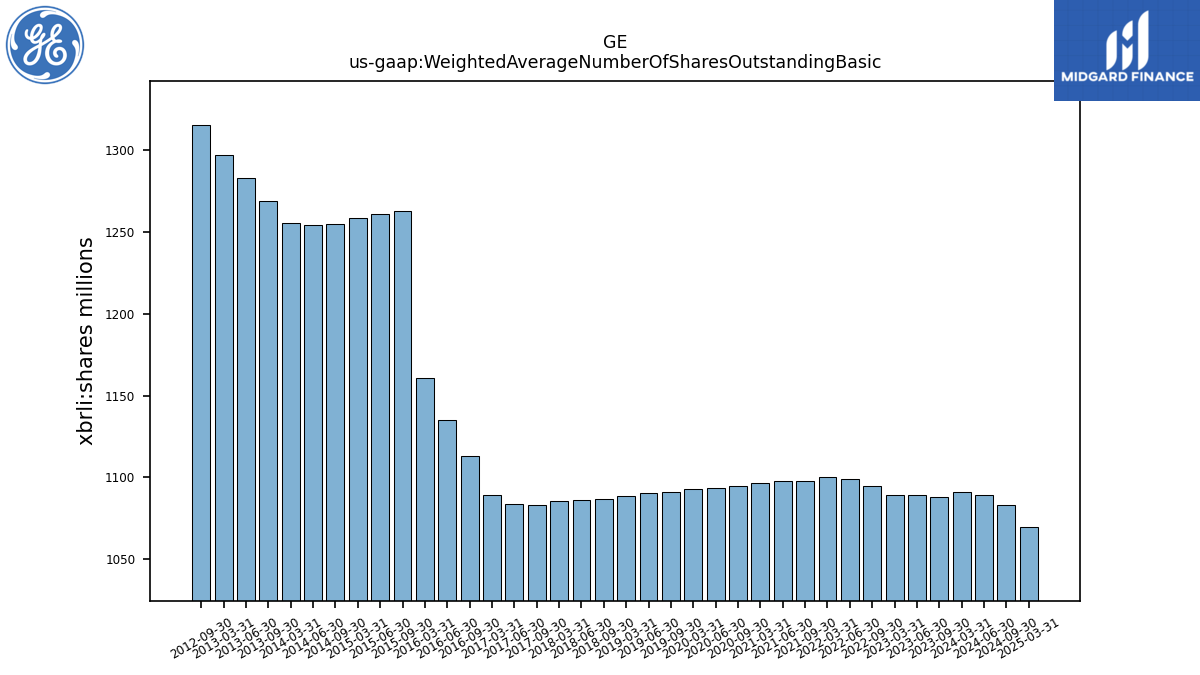 |
GE | ||||||||
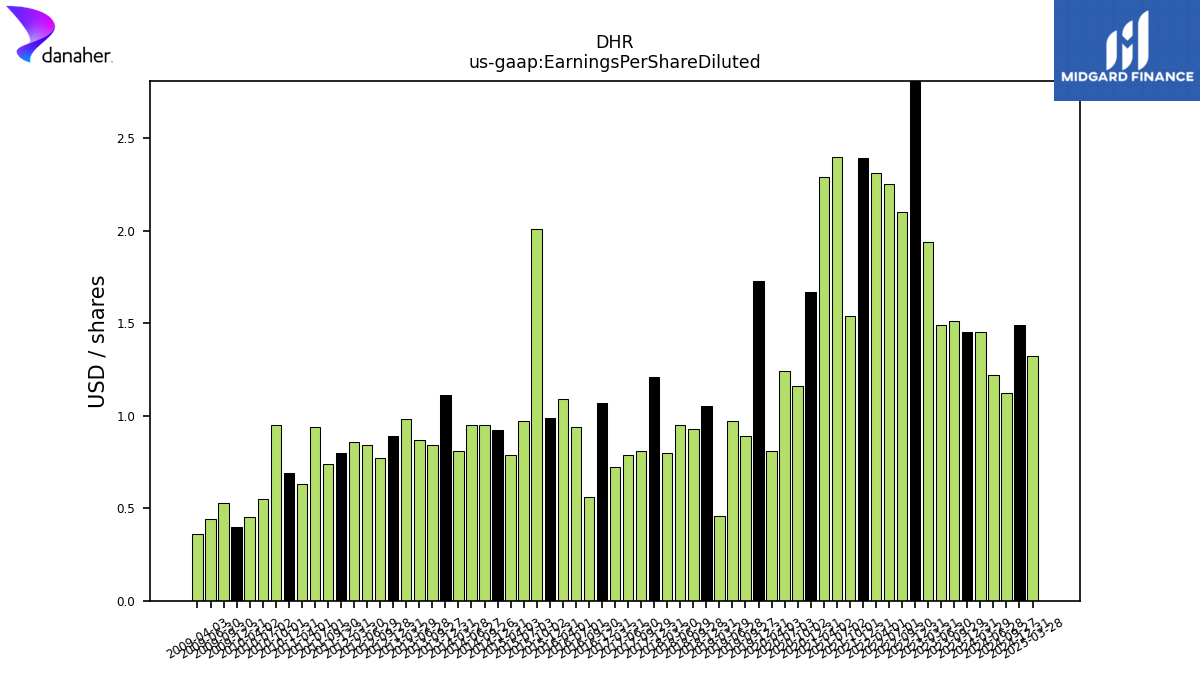
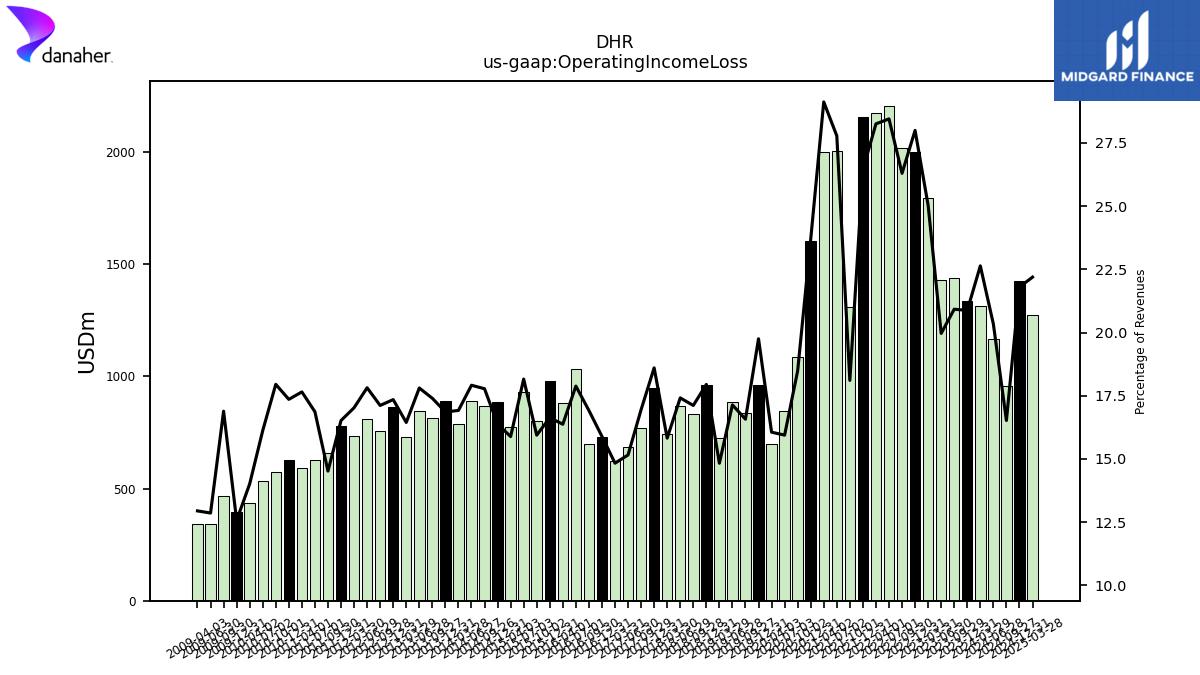
| $DHR$ | 2025-02-20 | 2025-04-22 | 2025-04-22 | NA | NA | DHR | 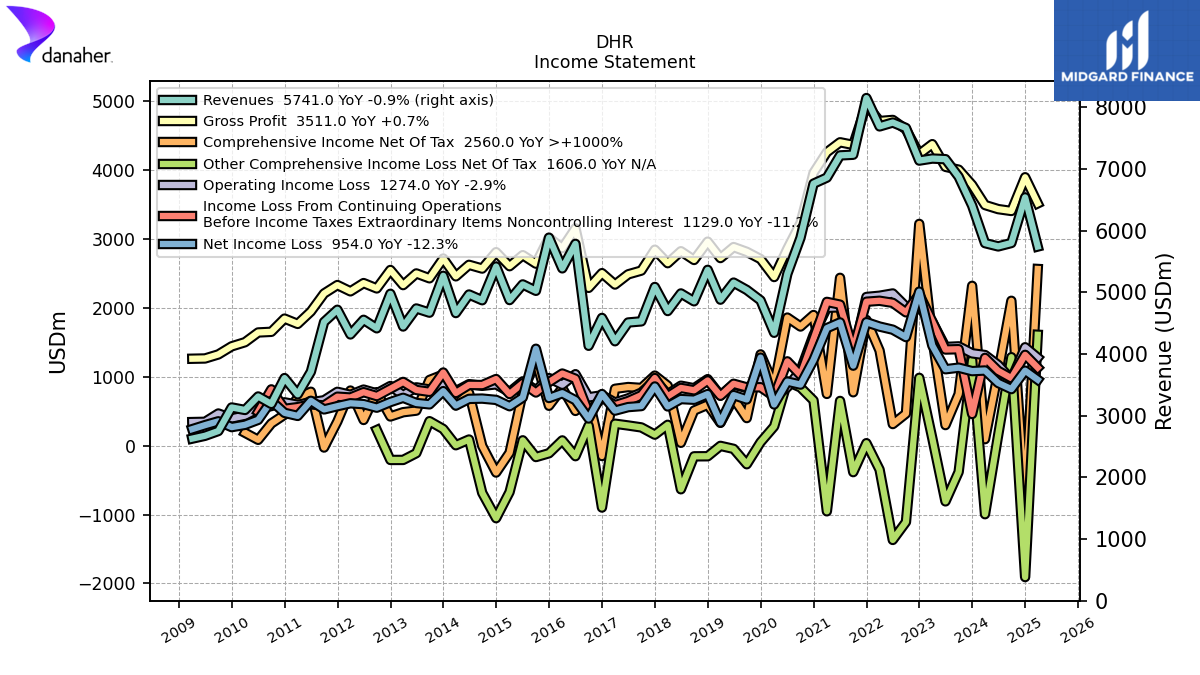 |
 |
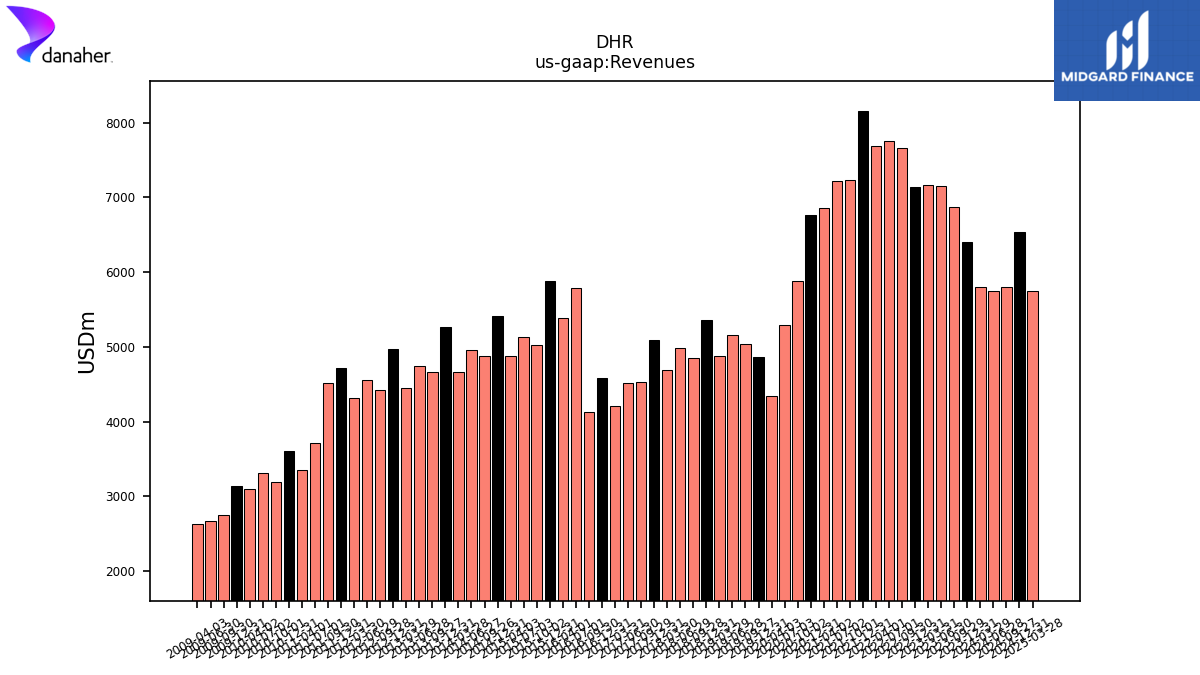 |
DHR | 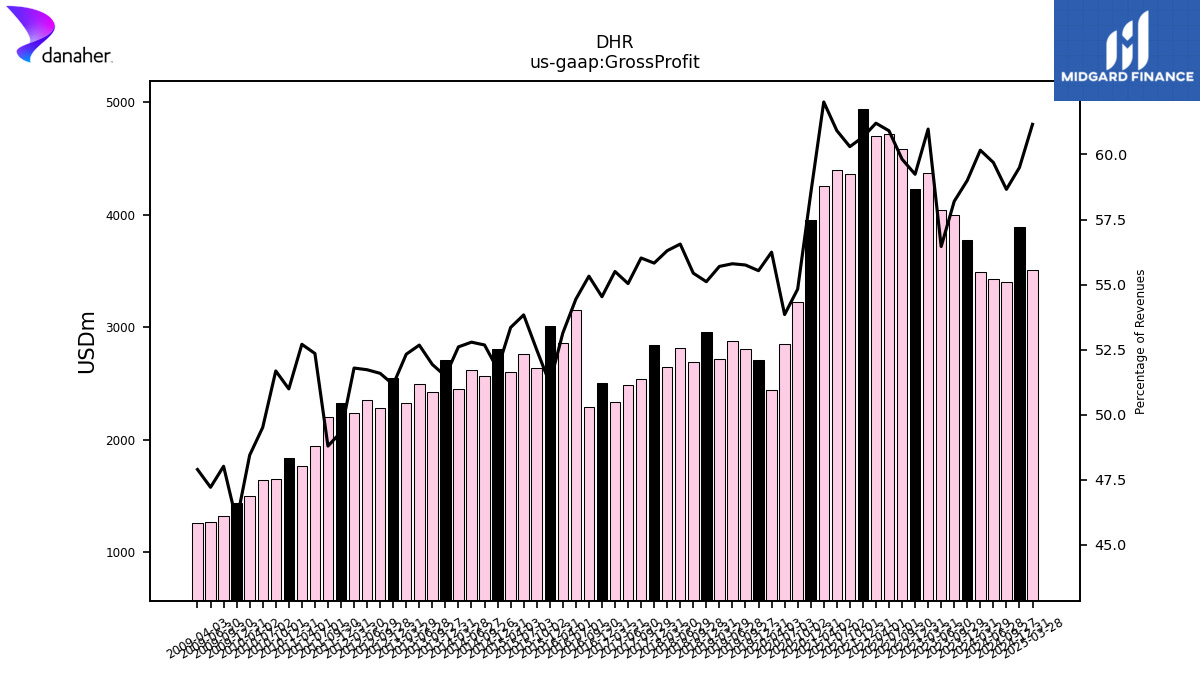 |
 |
 |
DHR |  |
 |
 |
DHR | 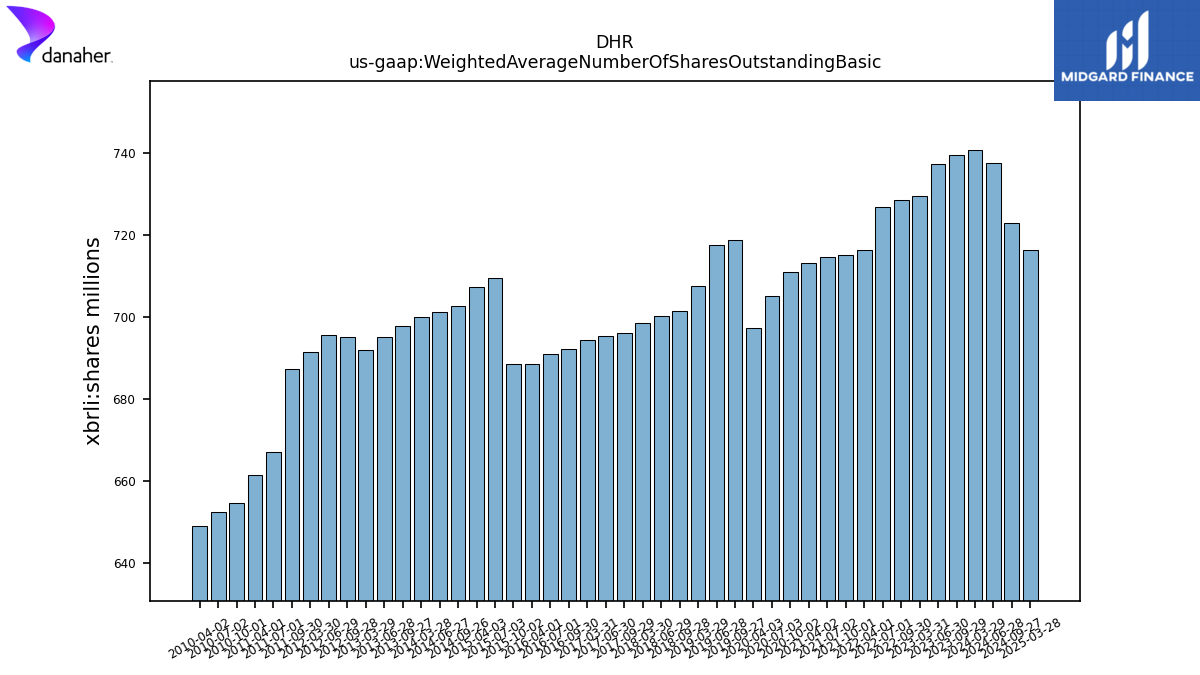 |
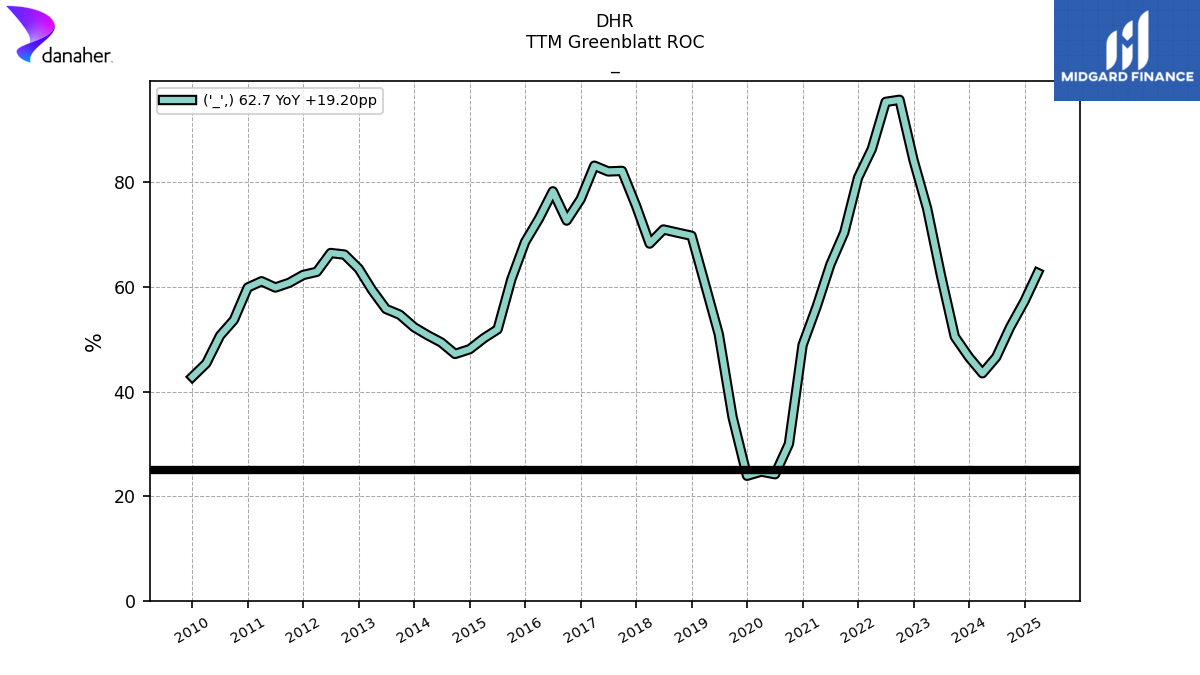 |
DHR | ||||
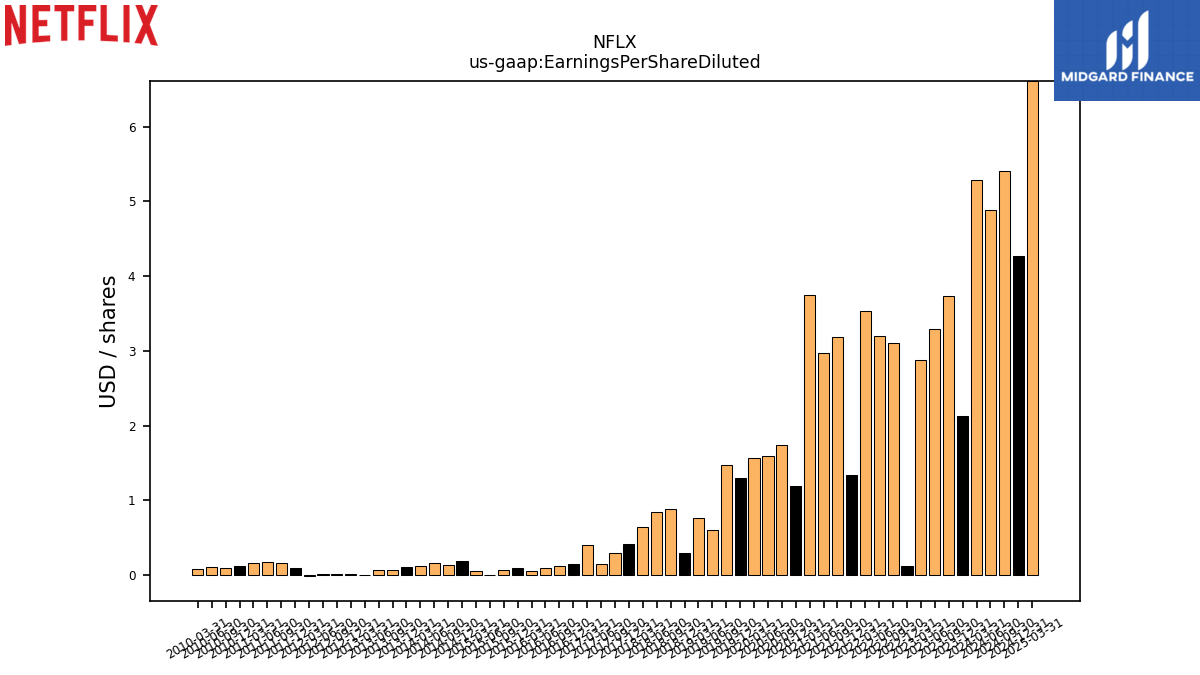
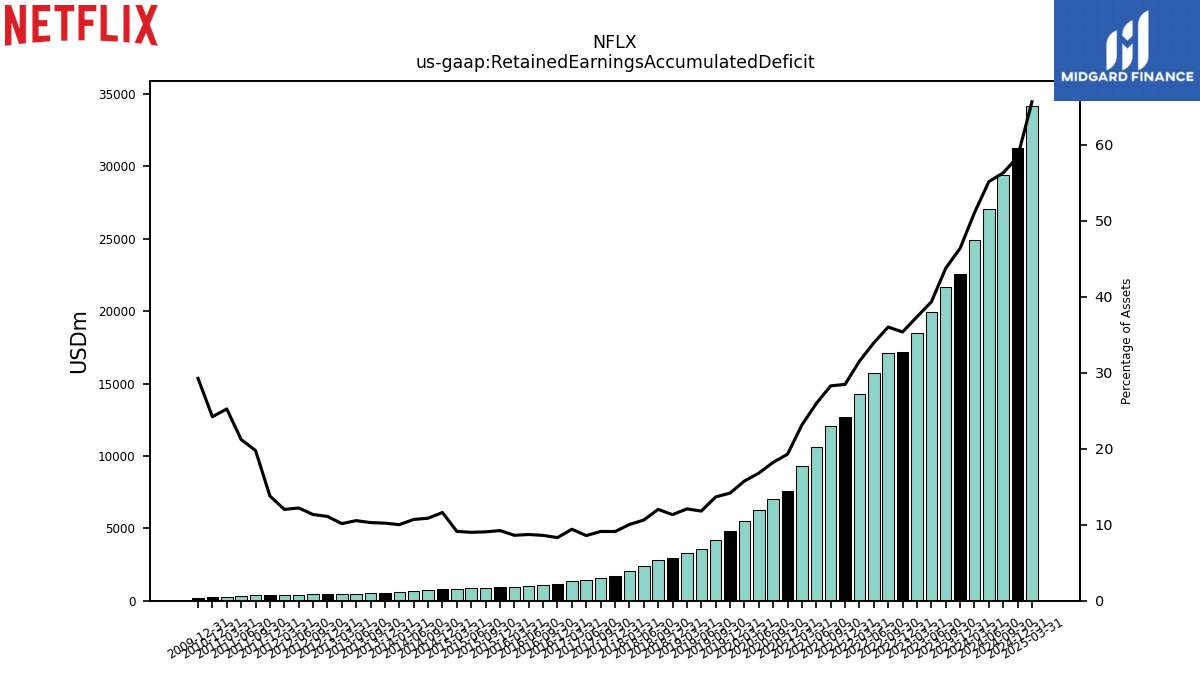
| $NFLX$ | 2025-01-27 | 2025-04-18 | 2025-04-17 | NA | NA | NFLX | 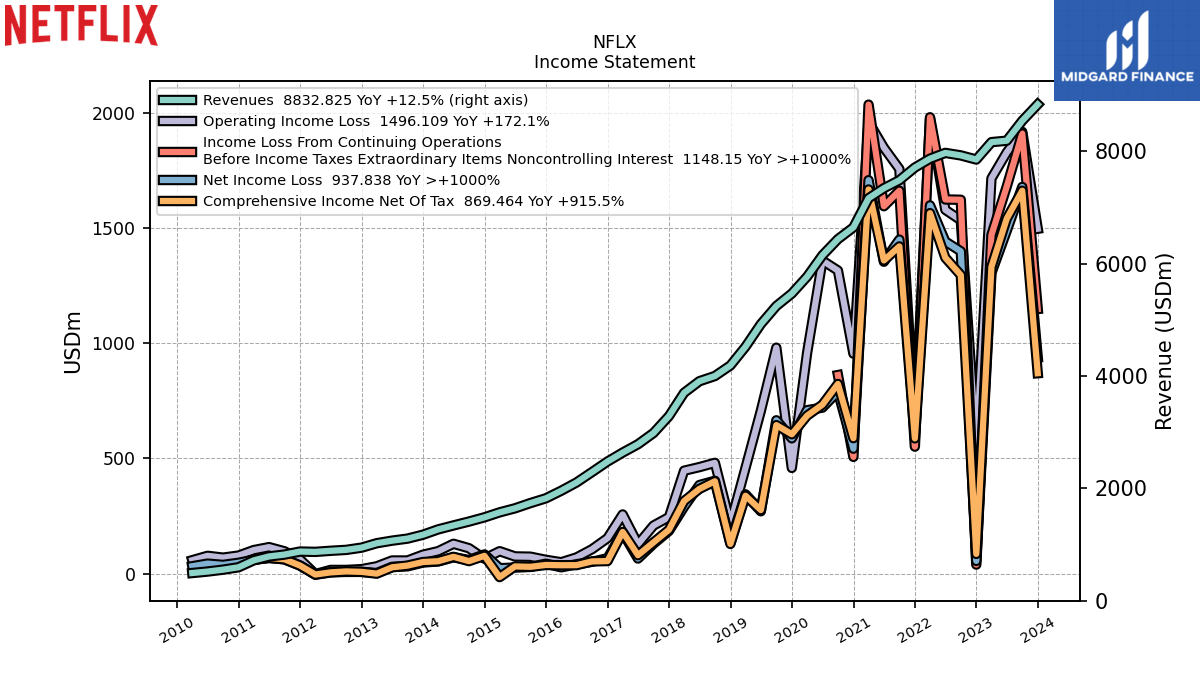 |
 |
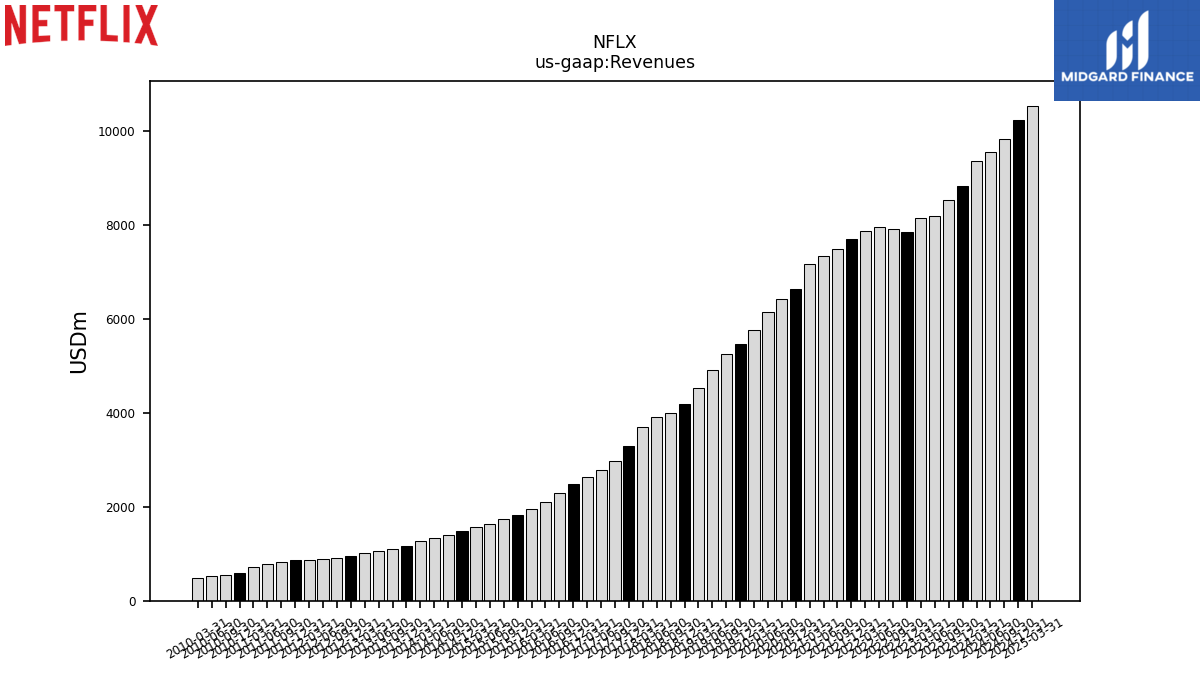 |
NFLX | 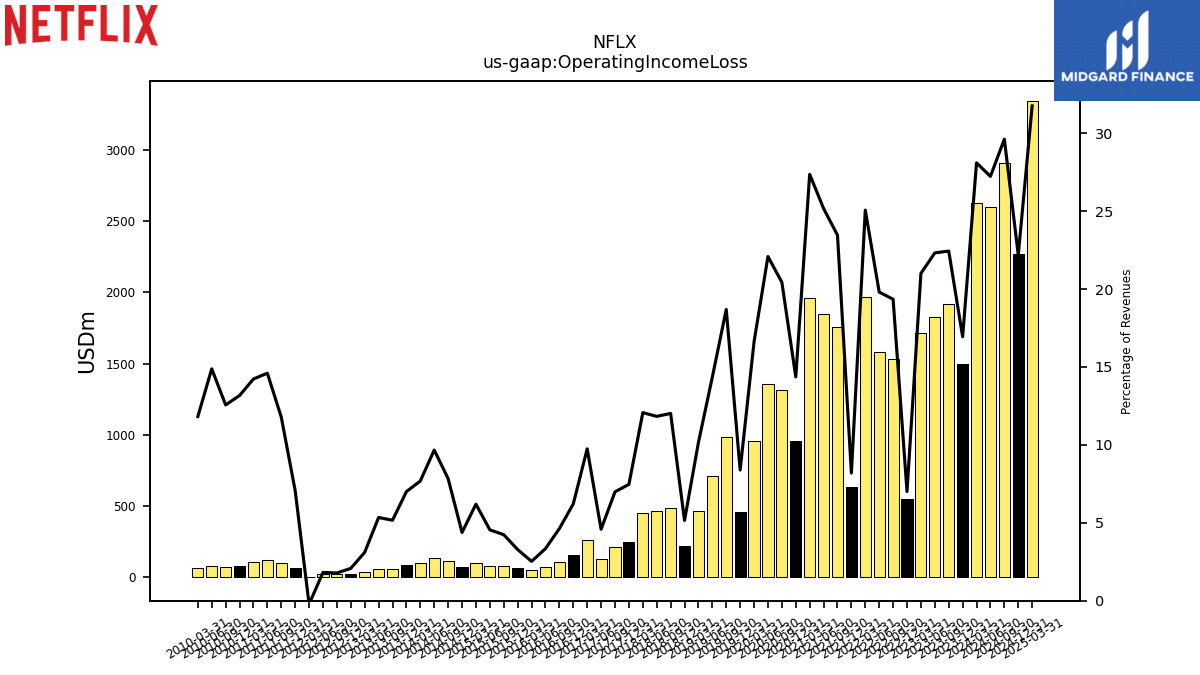 |
 |
NFLX | 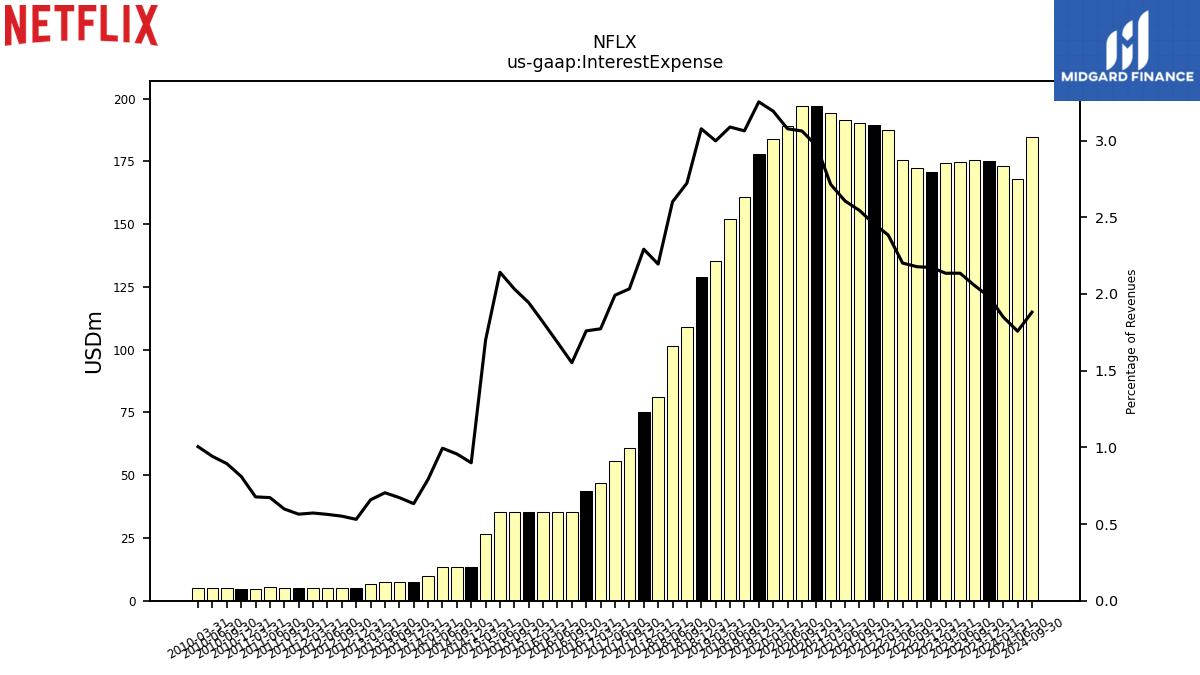 |
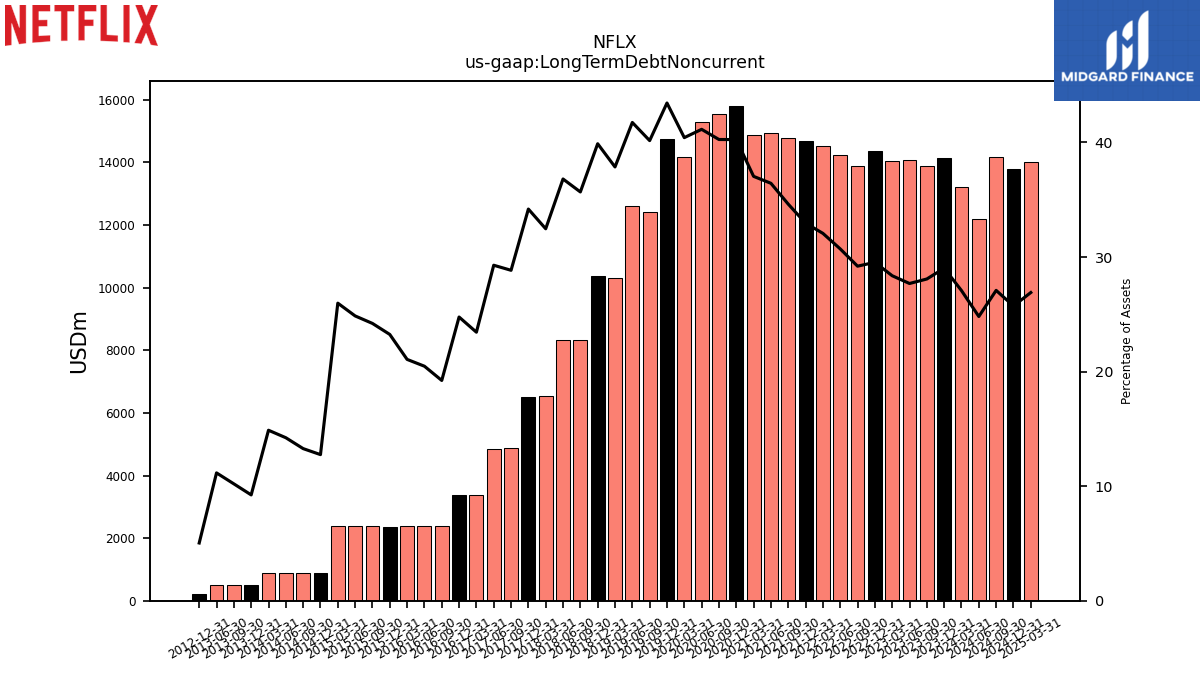
 |
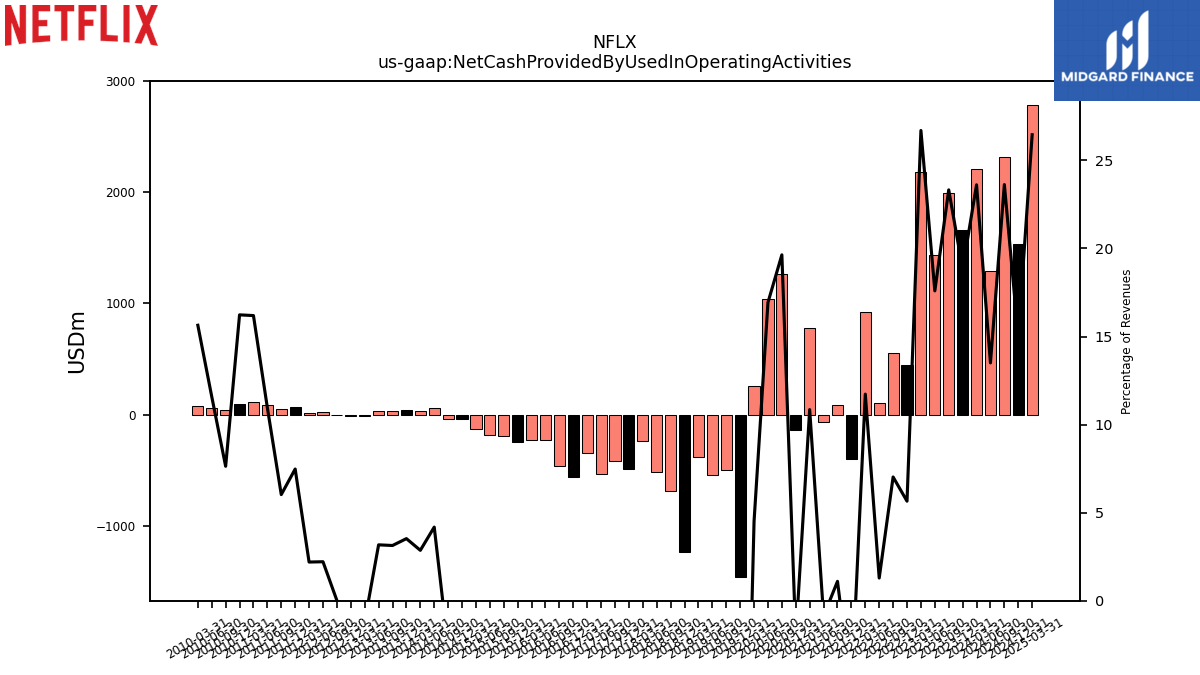 |
NFLX | 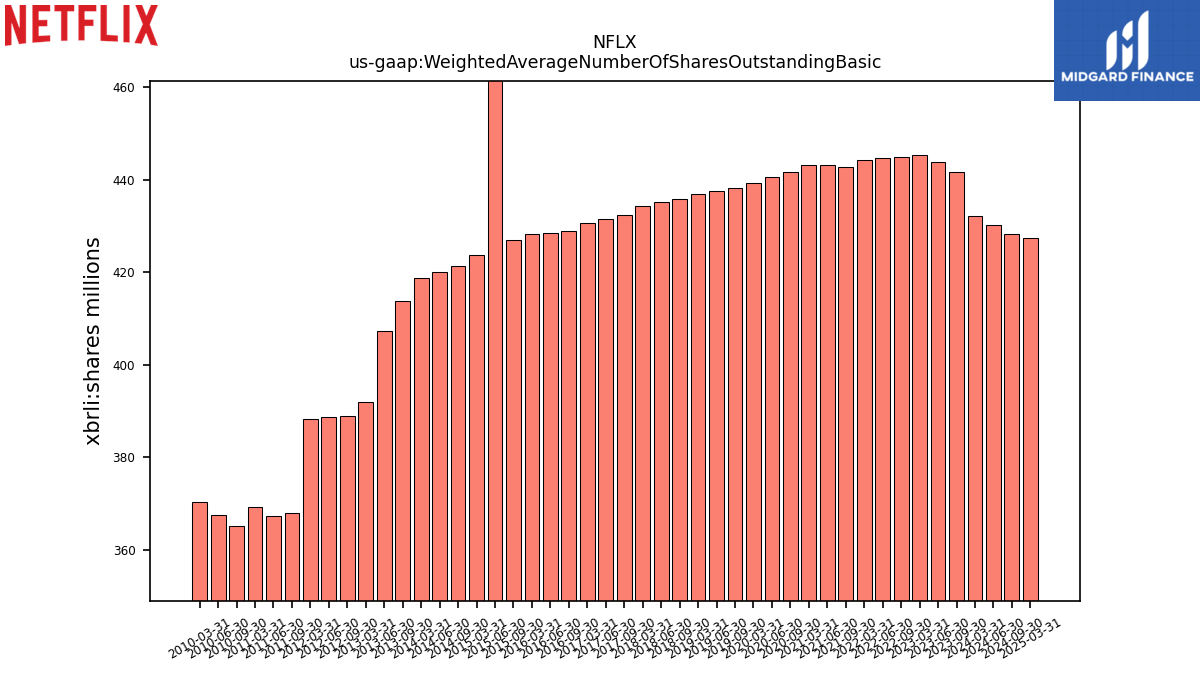 |
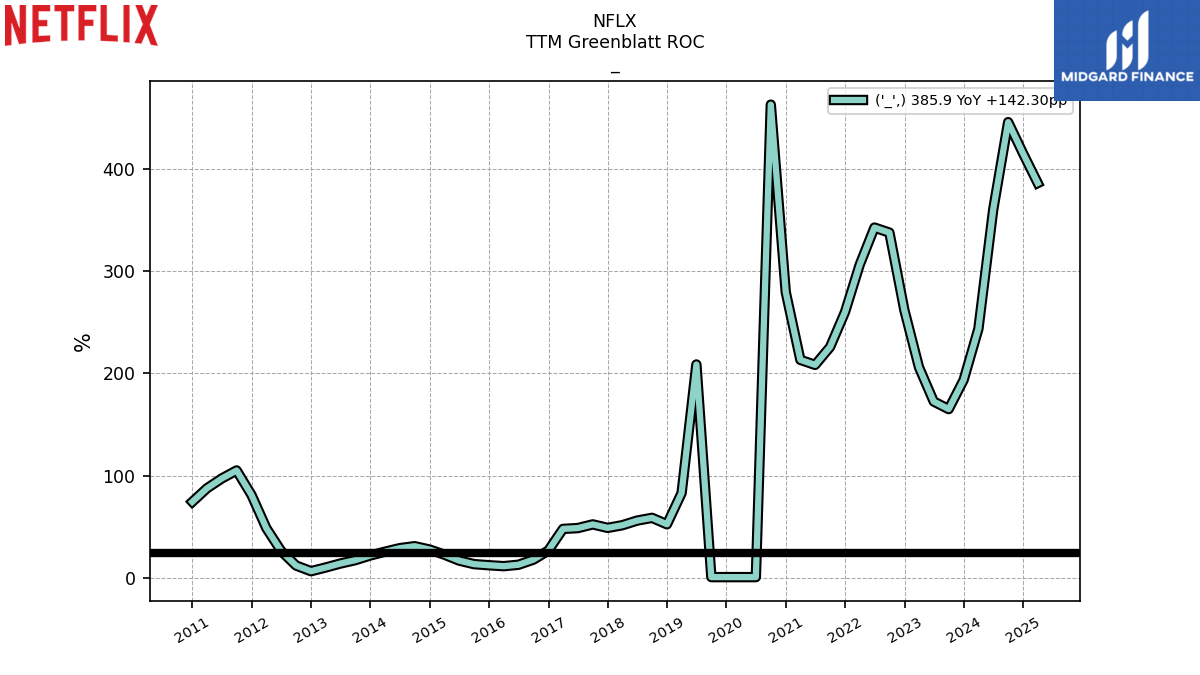 |
NFLX | |||||
| Ticker | 10K | 10Q | 8K | Sector | Industry | Logo | Forward P/E | Revenue Growth | Ticker | Income | EPS | Revenues | Ticker | GrossProfit | OperatingIncome | LongTermDebt | Ticker | InterestExpense | RetainedEarnnings | CashFlowOperating | Ticker | Dividends | SharesOutstanding | TTMGreenblattROC | |
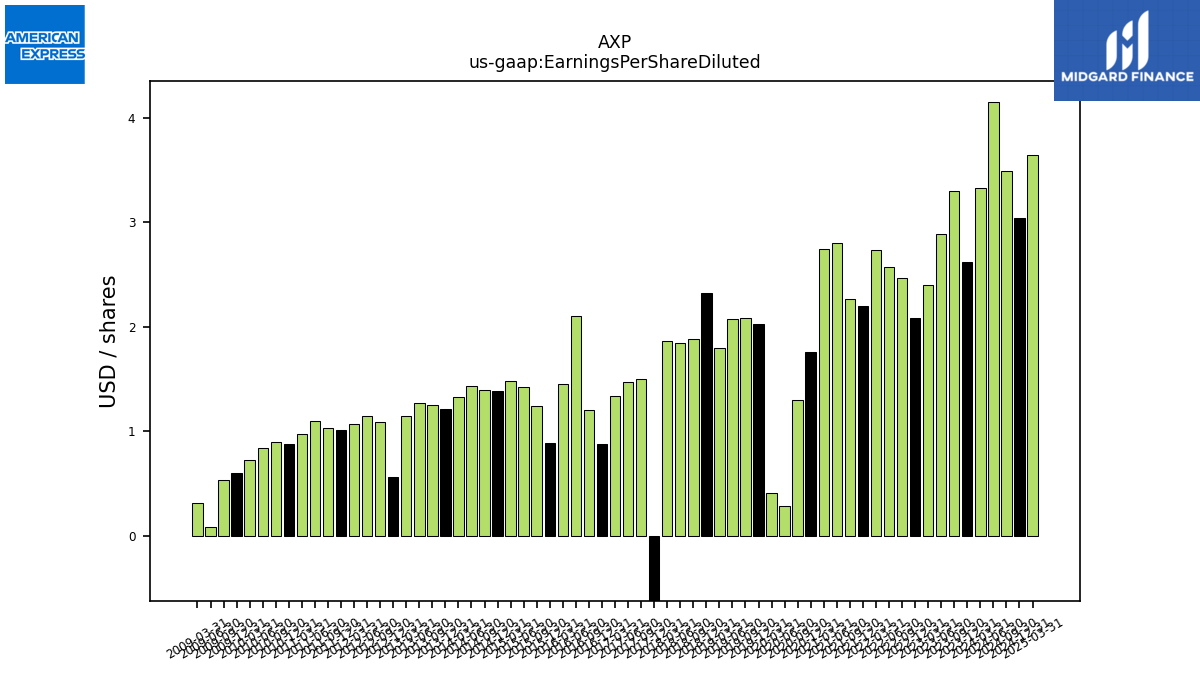
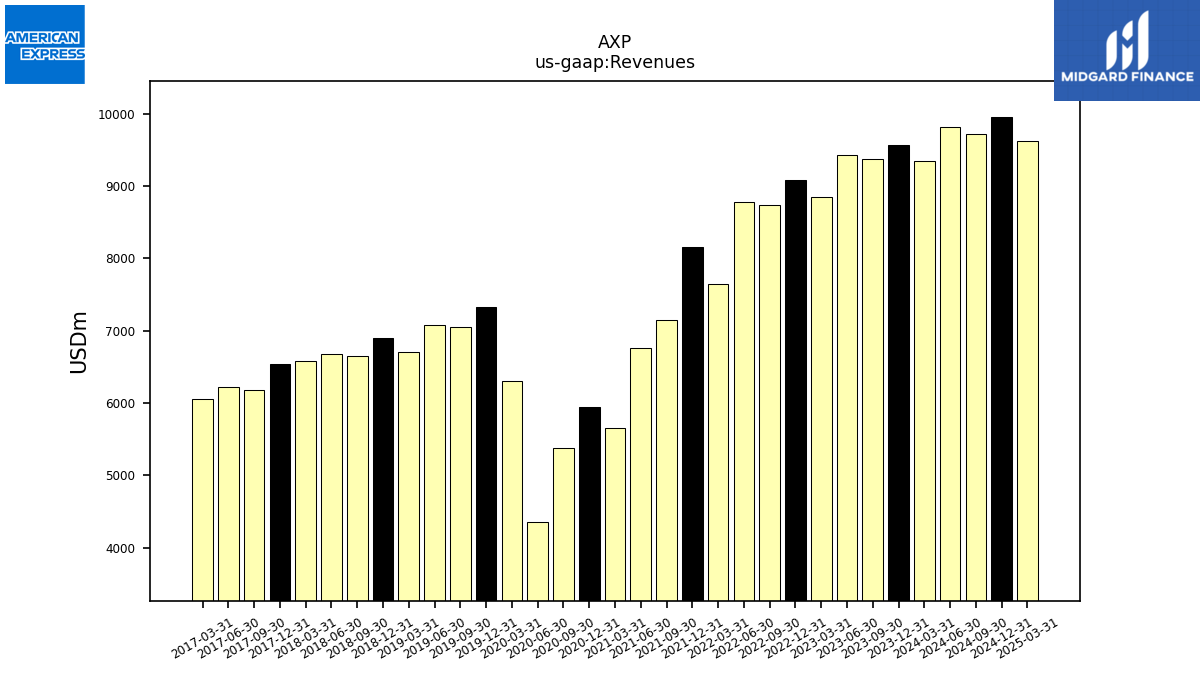
| $AXP$ | 2025-02-07 | 2025-04-18 | 2025-04-17 | NA | NA | AXP | 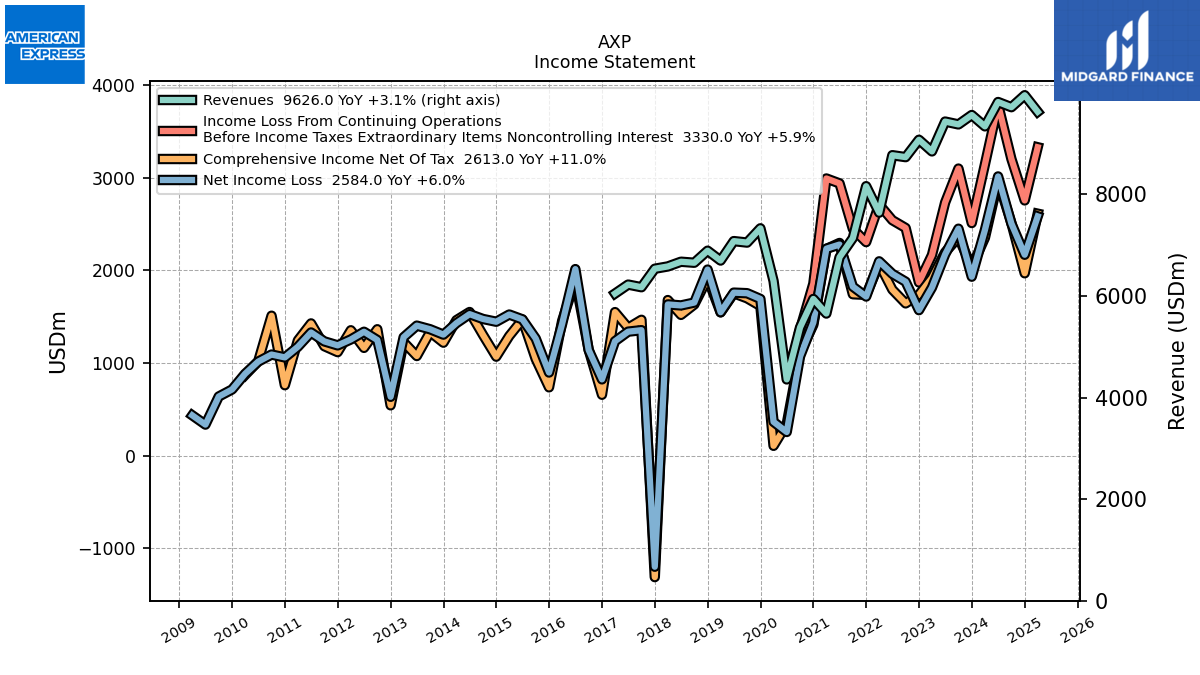 |
 |
 |
AXP | 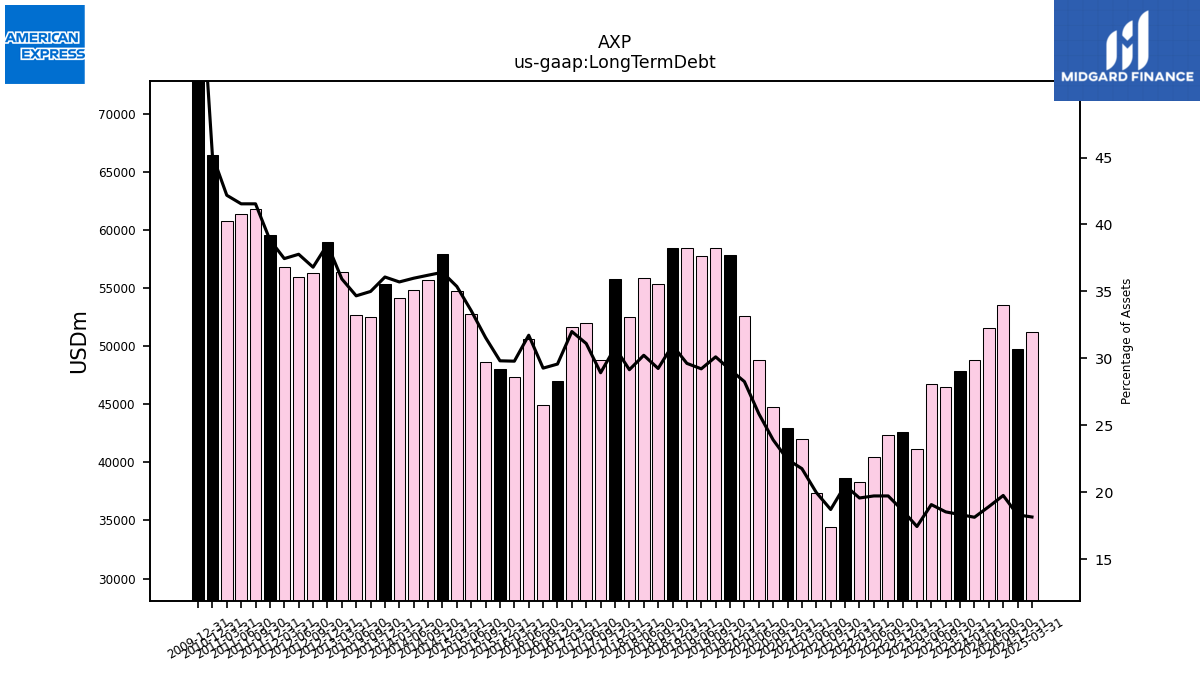 |
AXP |  |
 |
 |
AXP |  |
AXP | |||||||
| $NKE$ | 2024-07-25 | 2025-04-03 | 2025-03-20 | NA | NA | NKE |  |
 |
 |
NKE |  |
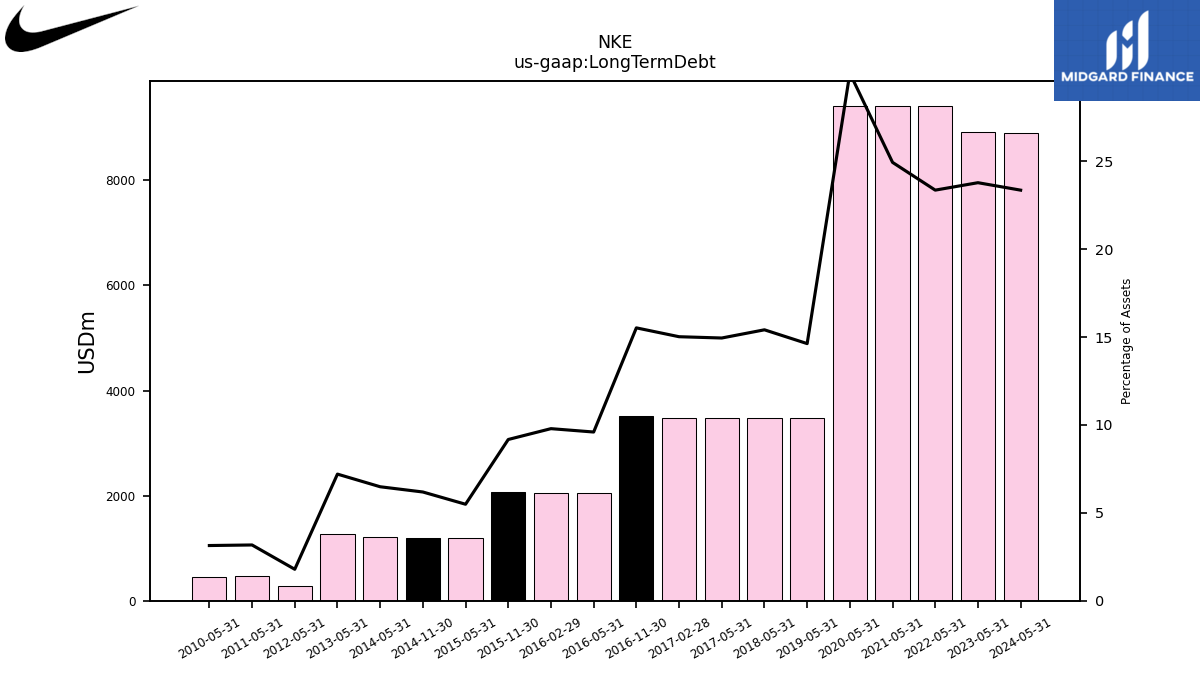 |
NKE |  |
 |
NKE |  |
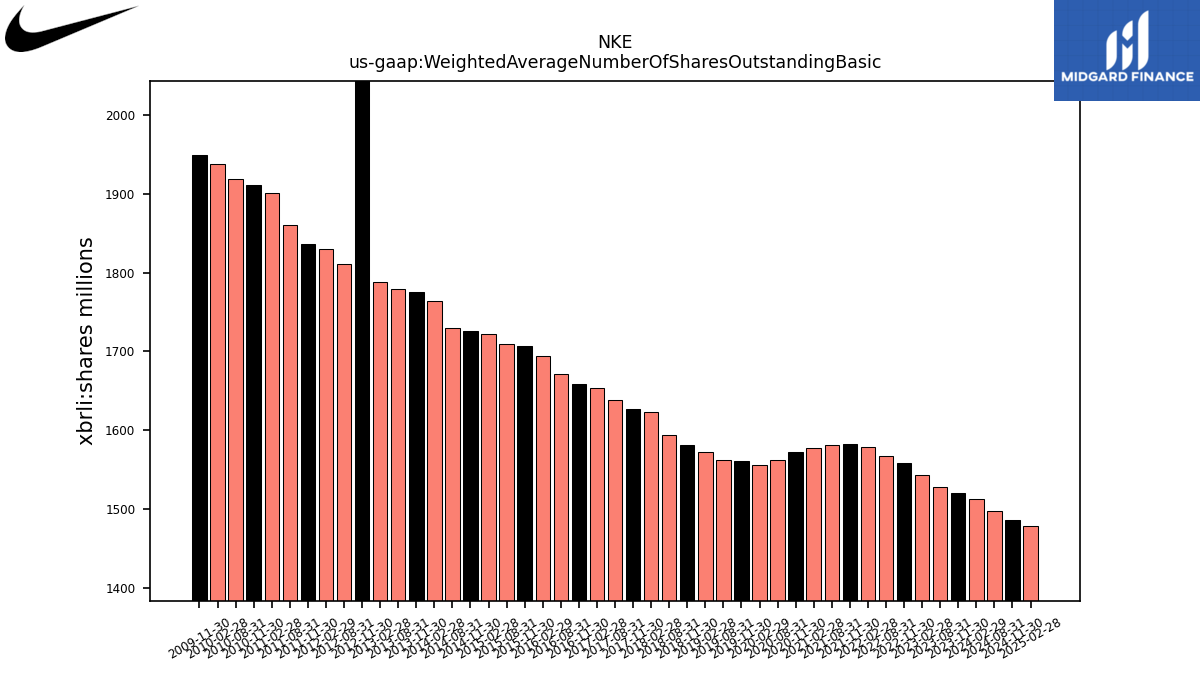 |
NKE | ||||||
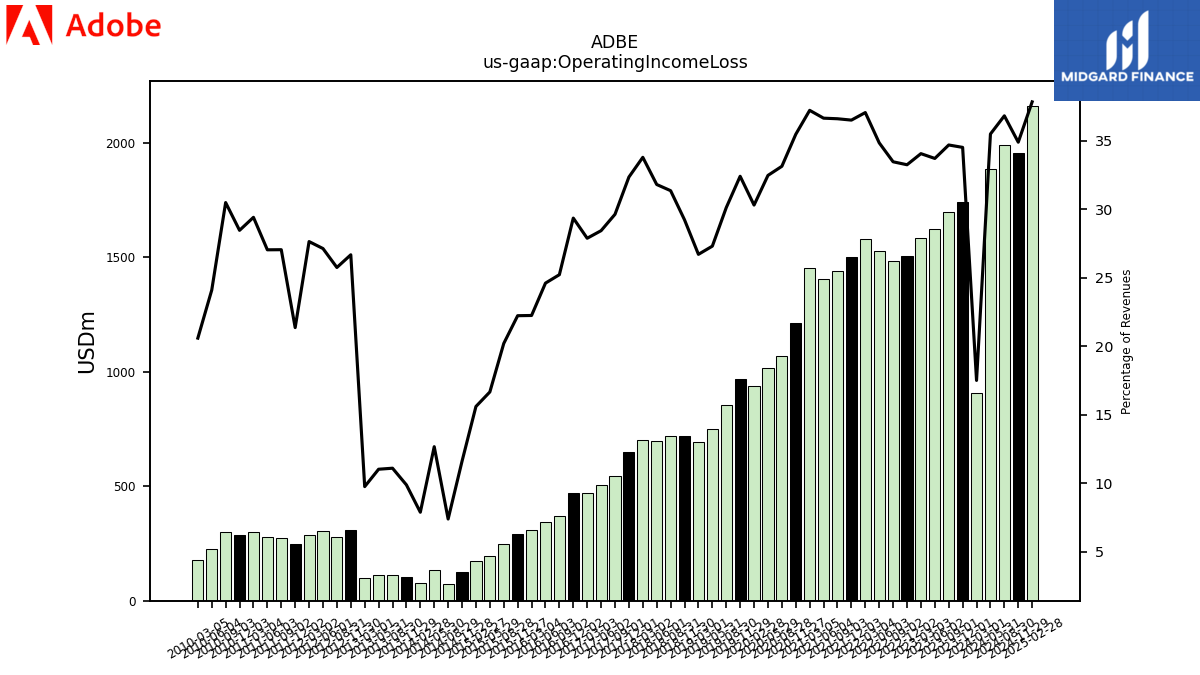
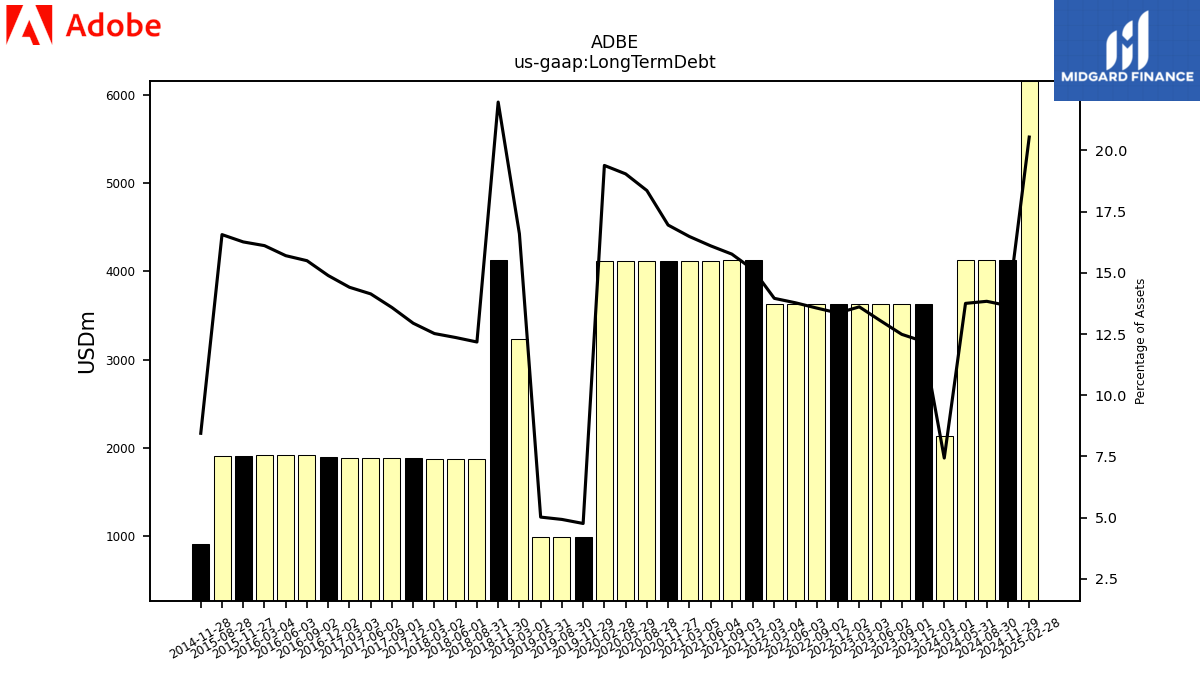
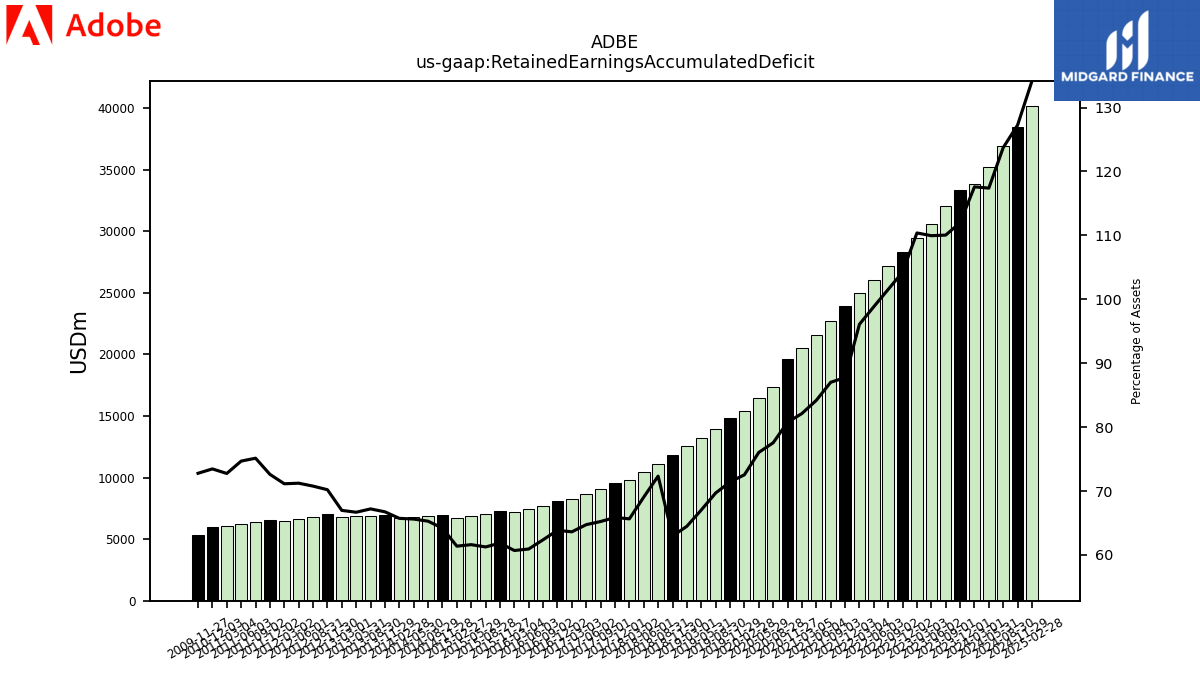
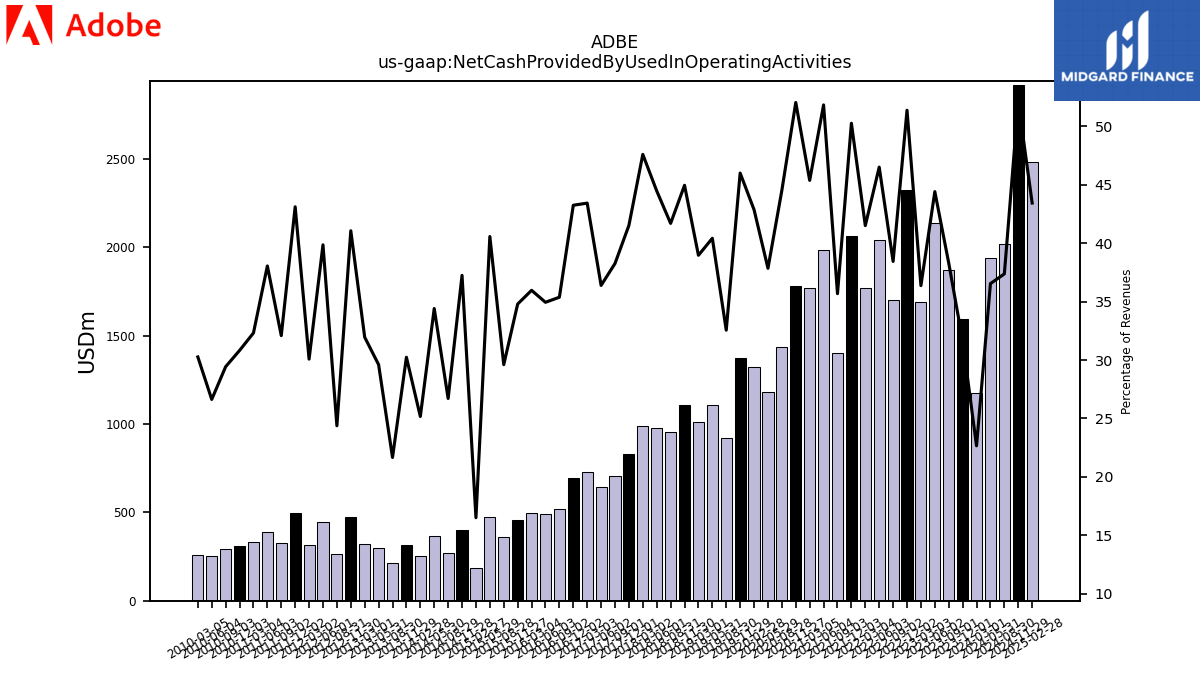
| $ADBE$ | 2025-01-13 | 2025-03-26 | 2025-03-12 | NA | NA | ADBE | 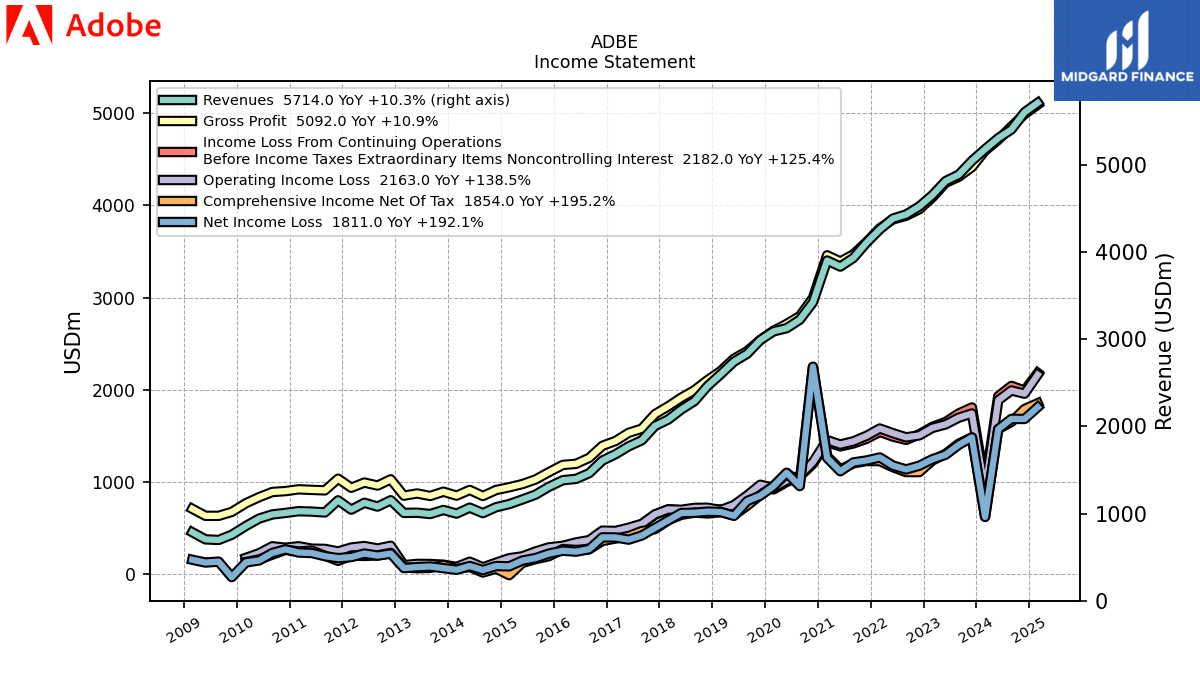 |
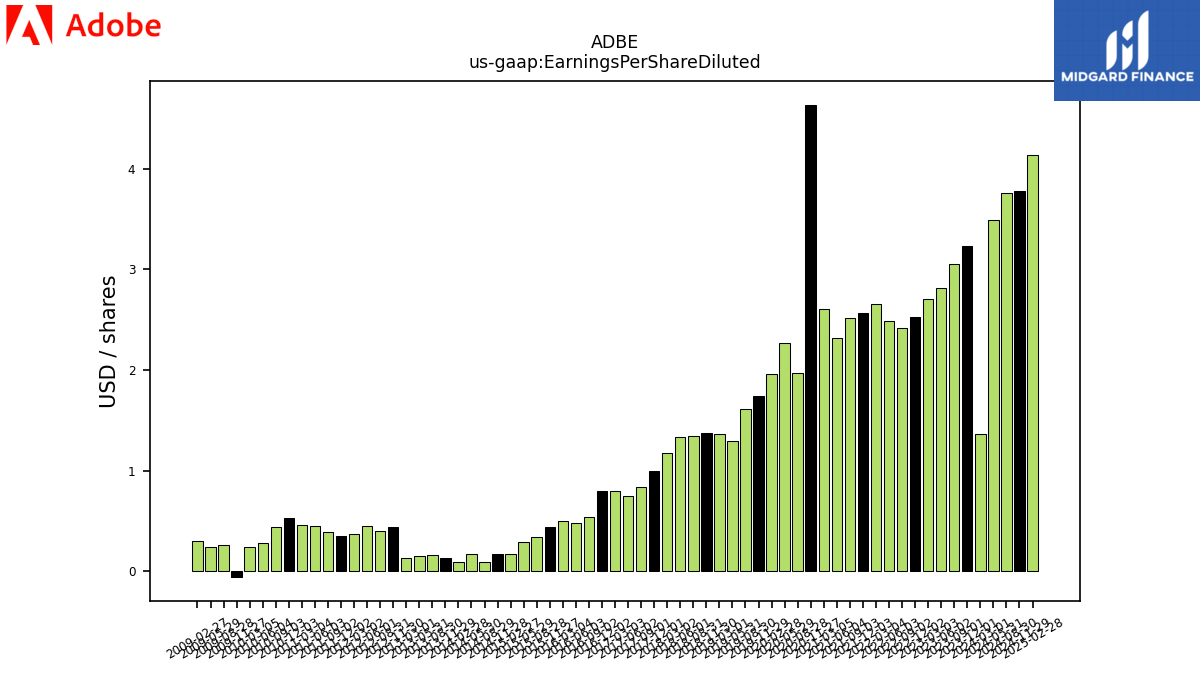 |
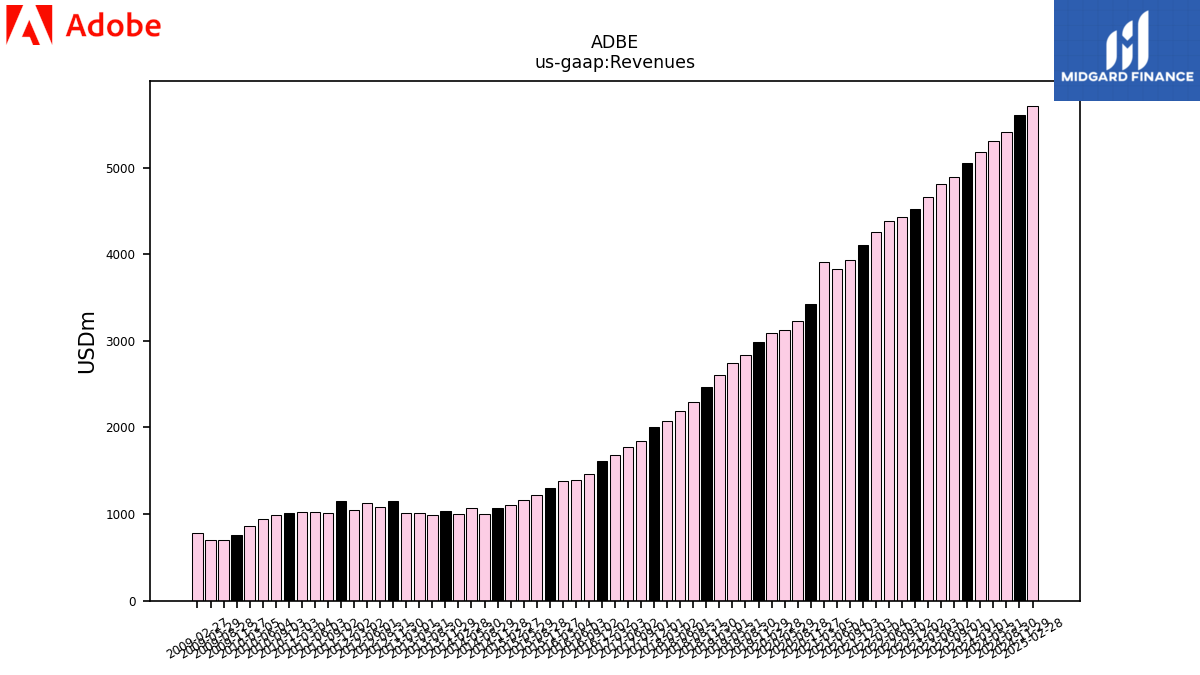 |
ADBE | 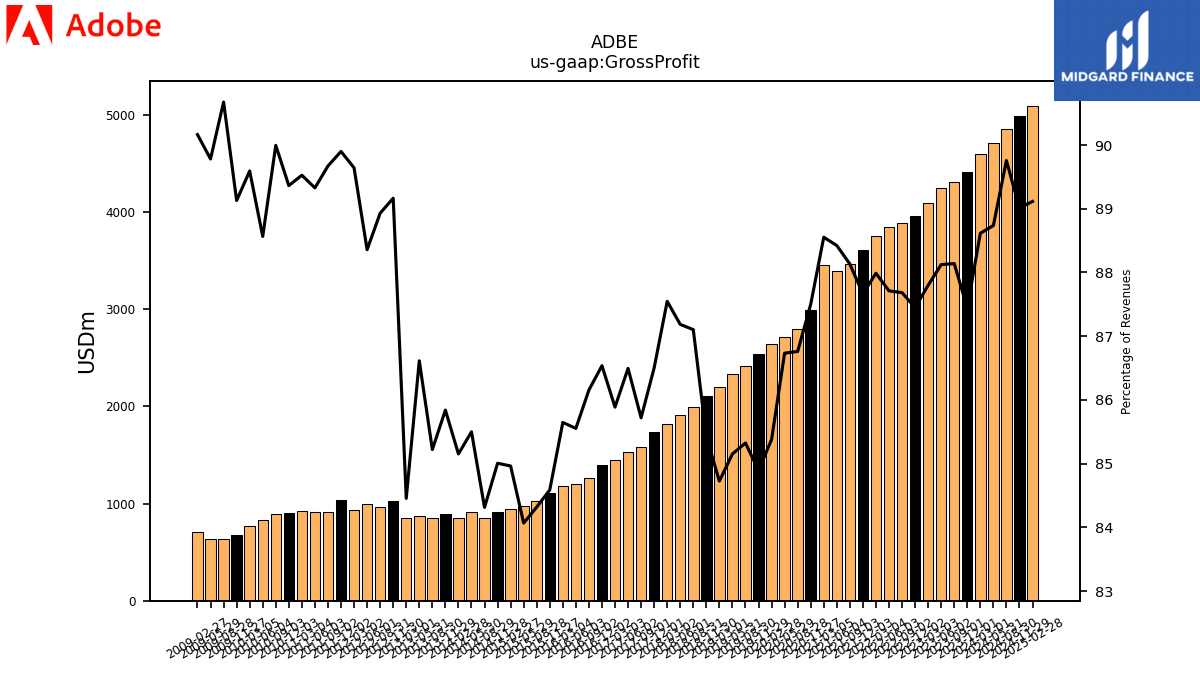 |
 |
 |
ADBE | 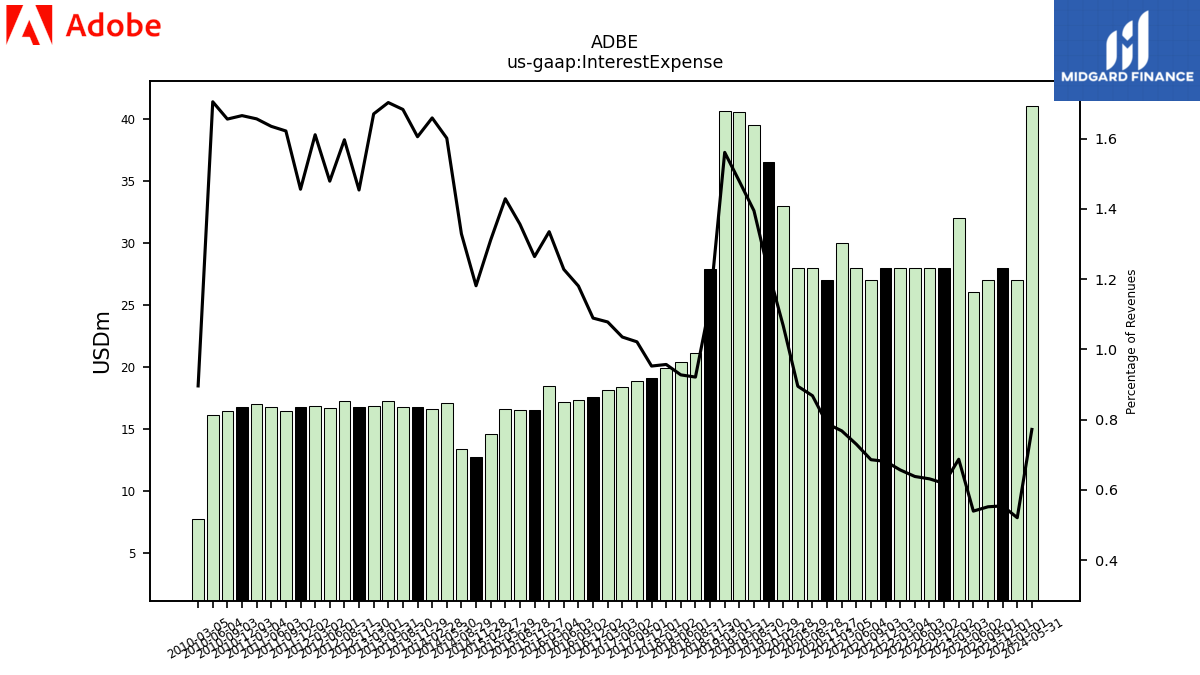 |
 |
 |
ADBE | 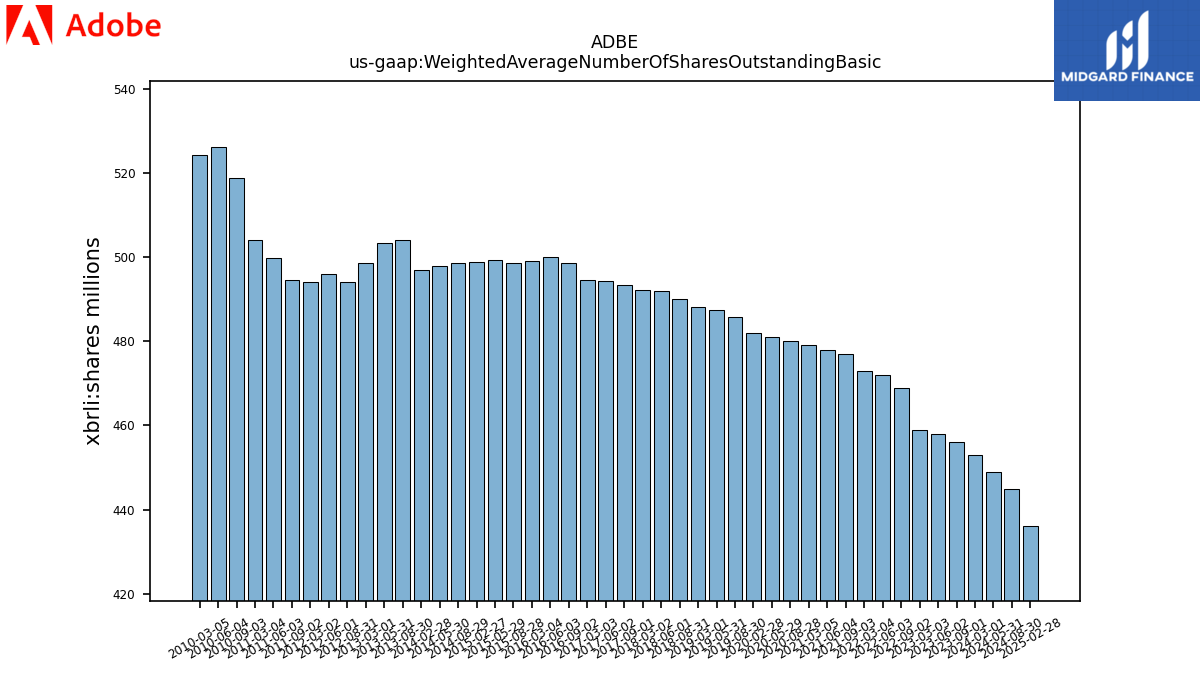 |
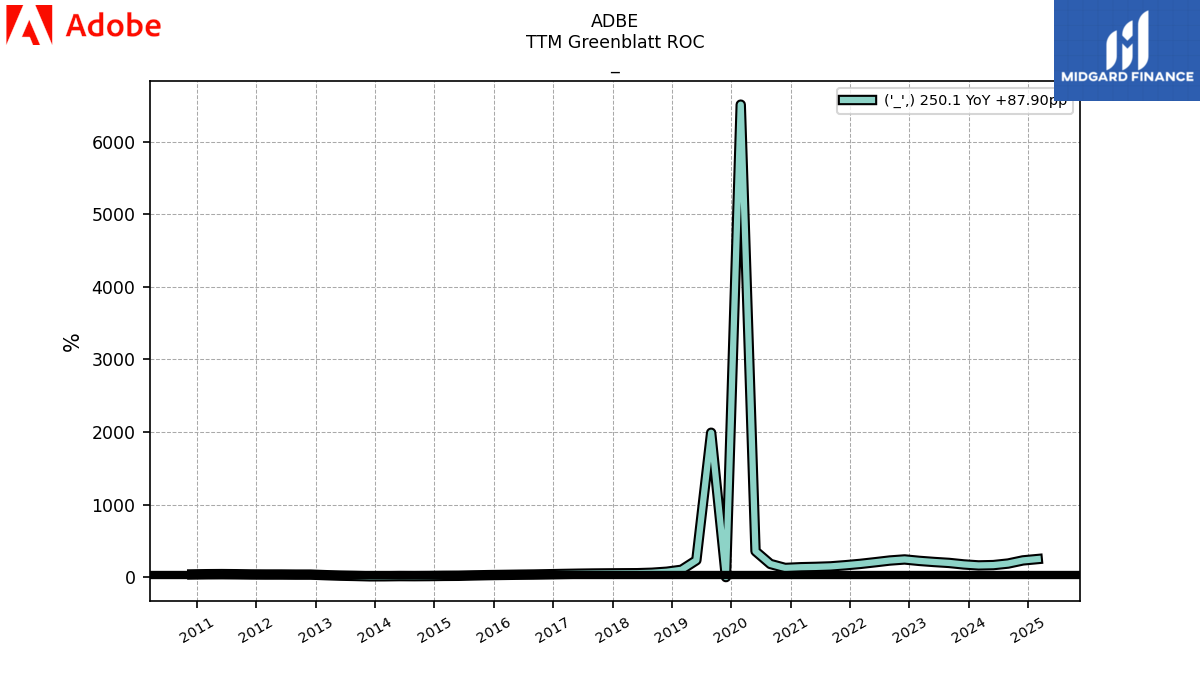 |
ADBE | ||||
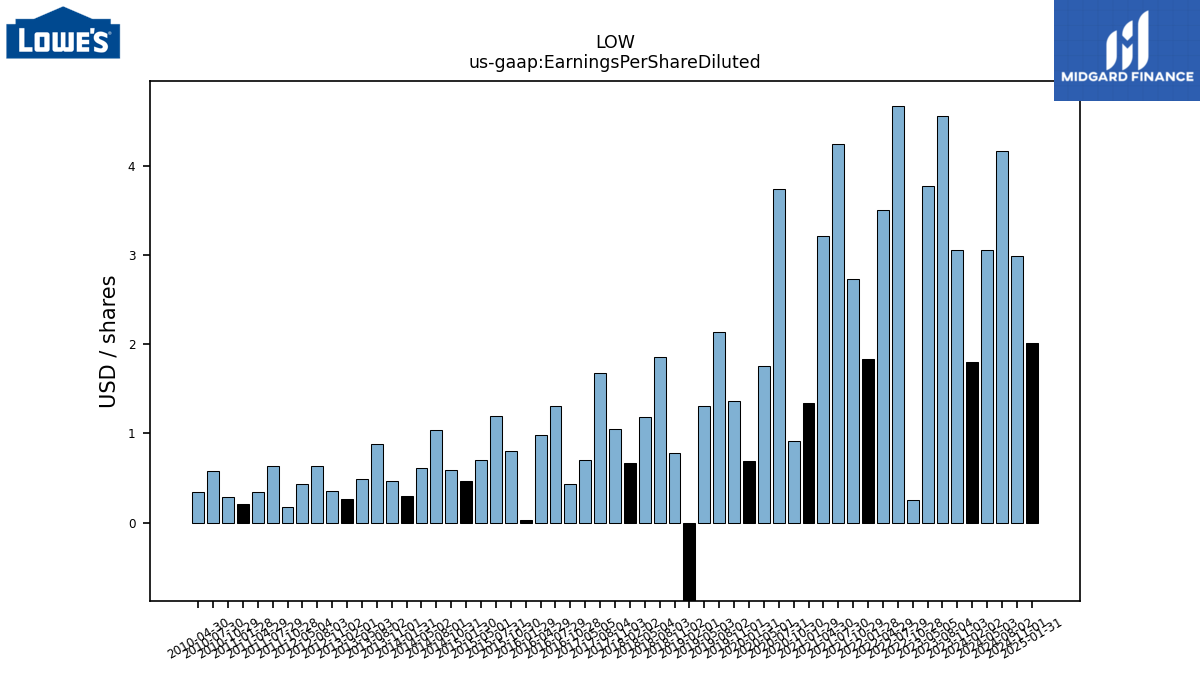
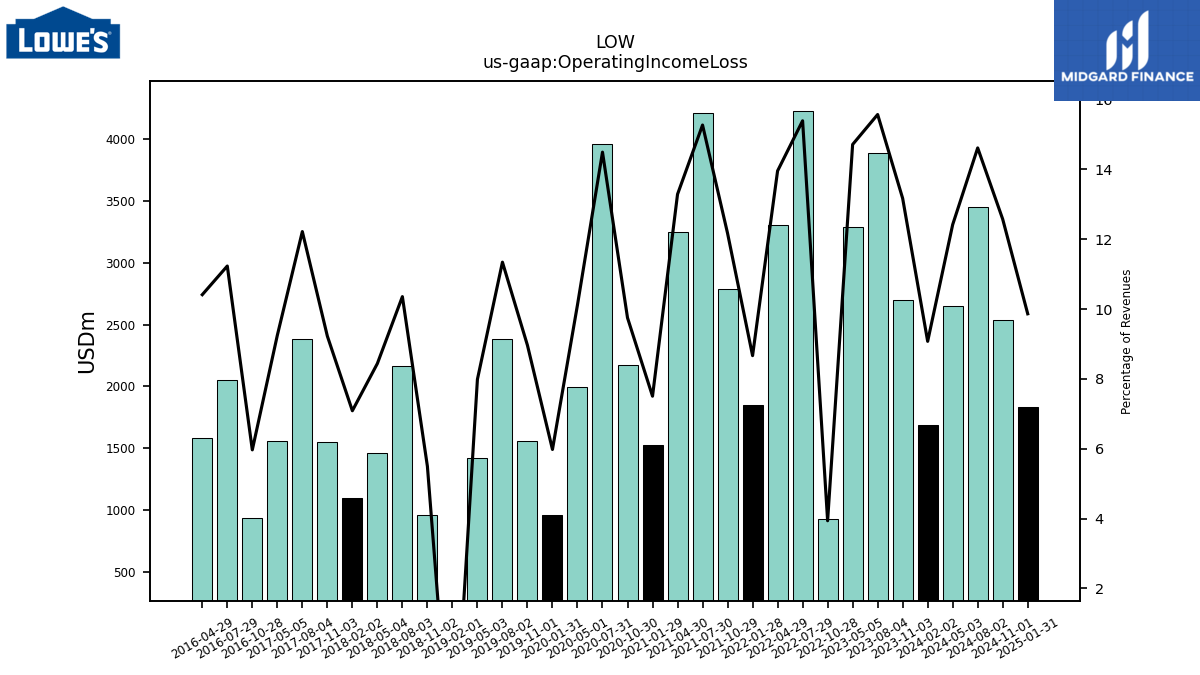
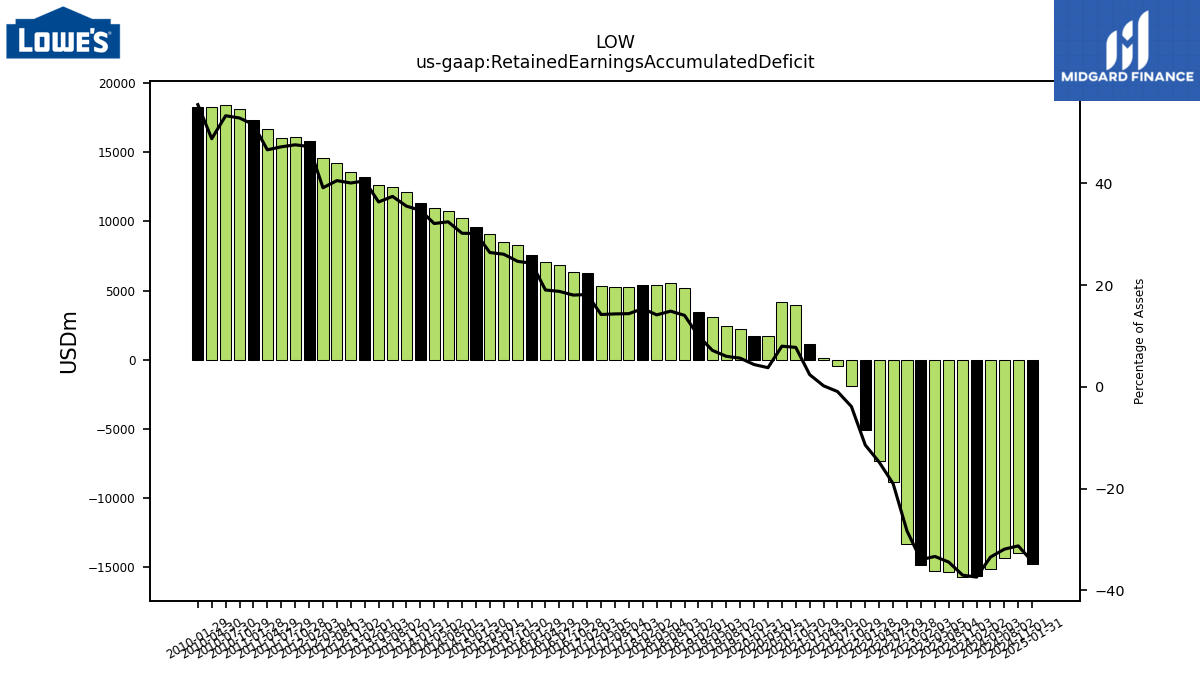
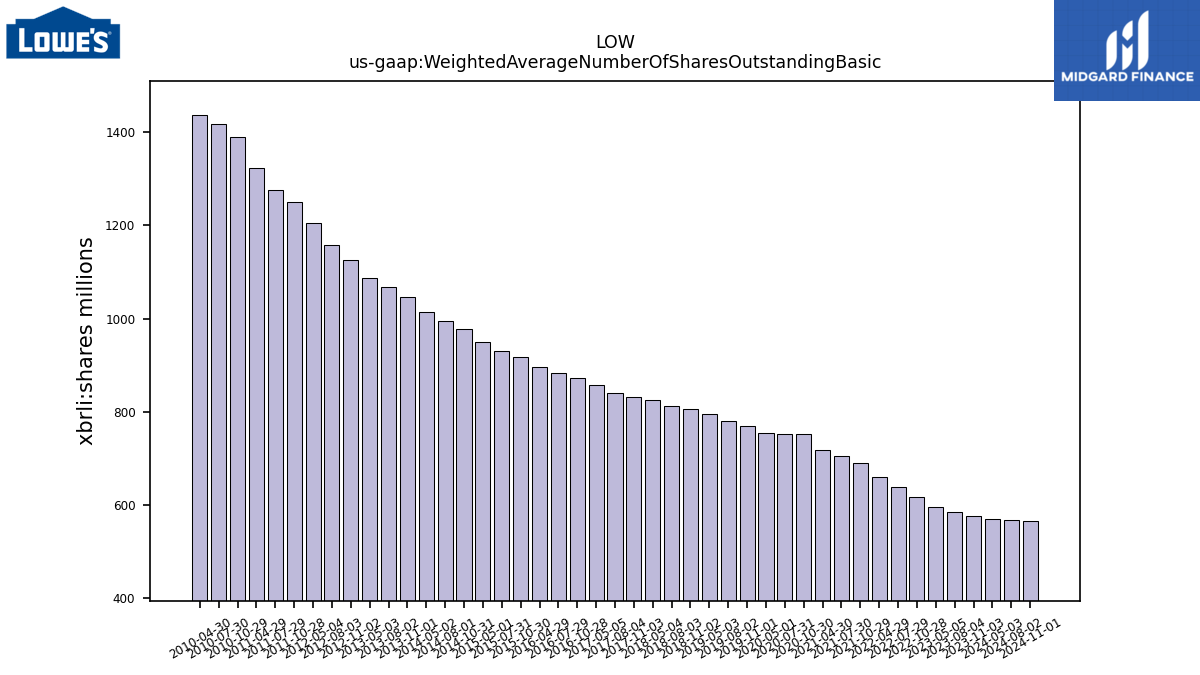
| $LOW$ | 2025-03-24 | 2024-11-27 | 2025-02-26 | NA | NA | LOW | 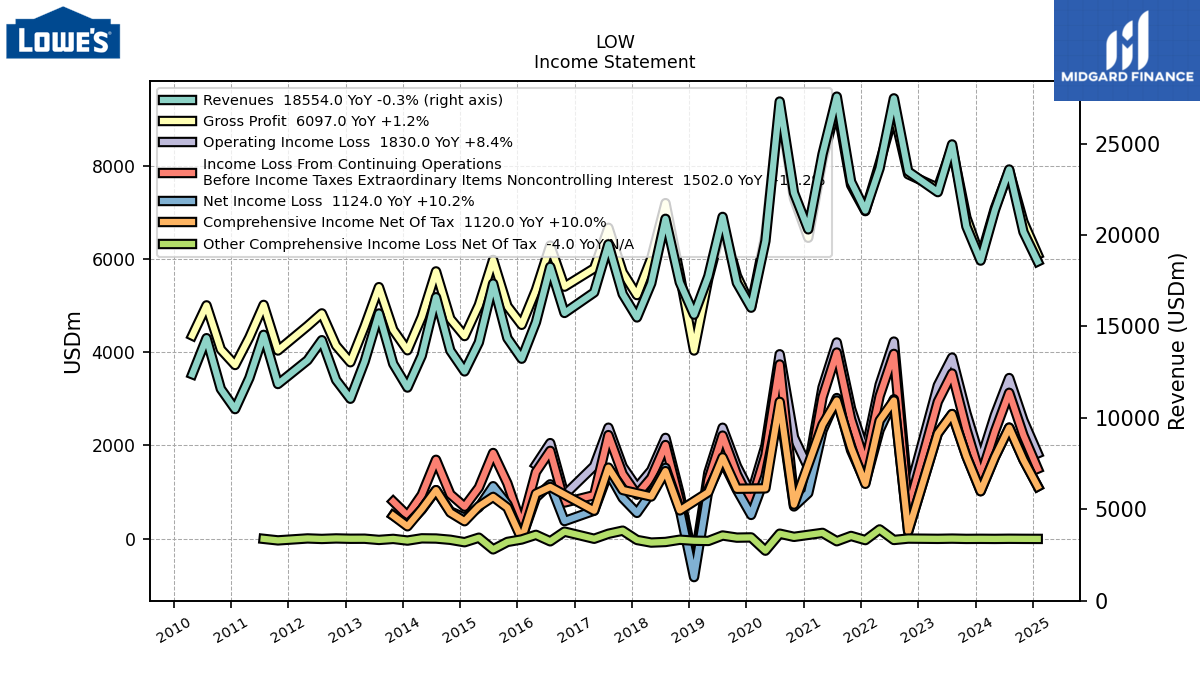 |
 |
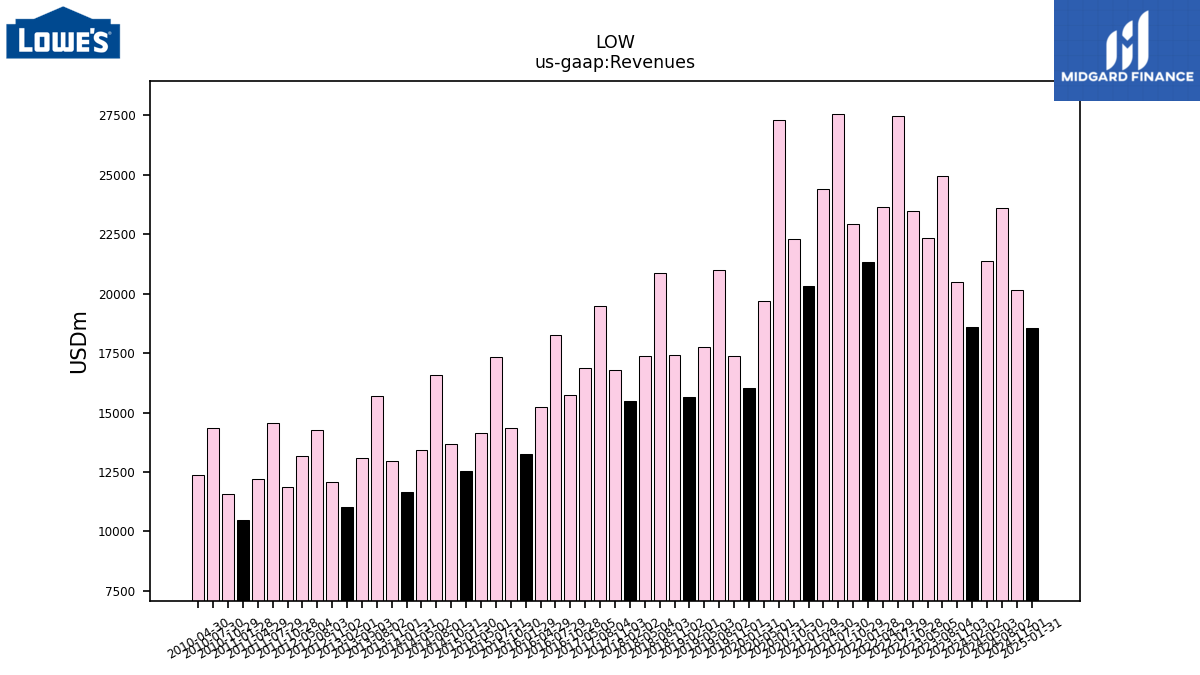 |
LOW | 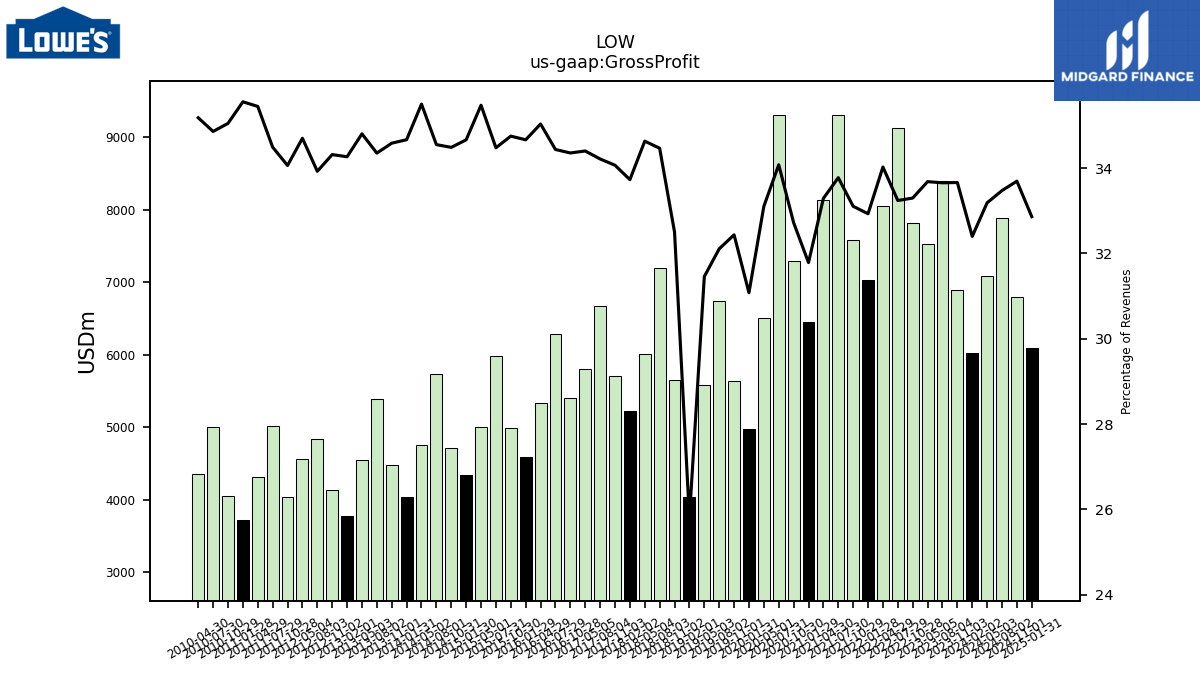 |
 |
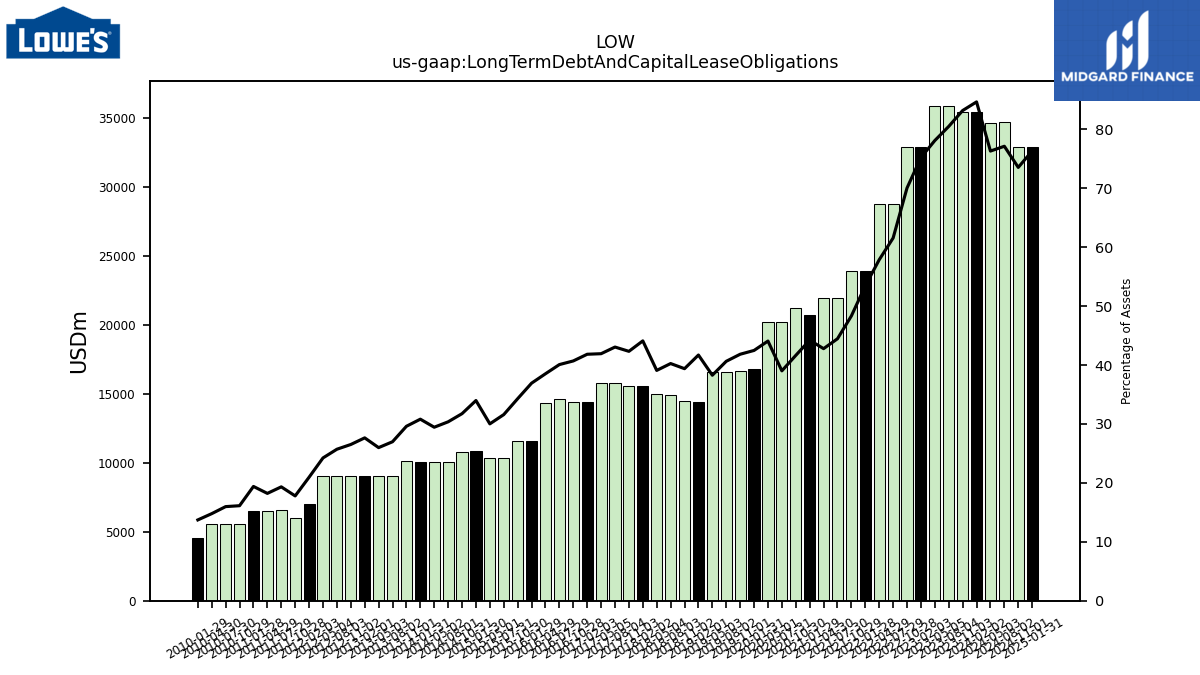 |
LOW | 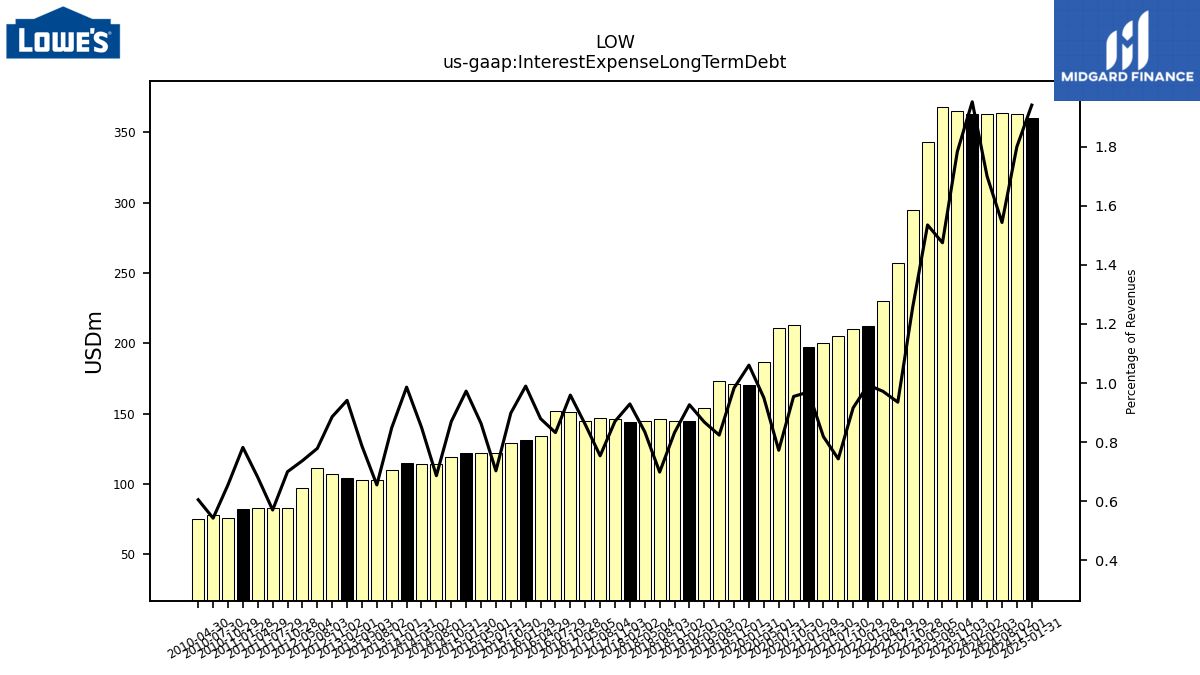 |
 |
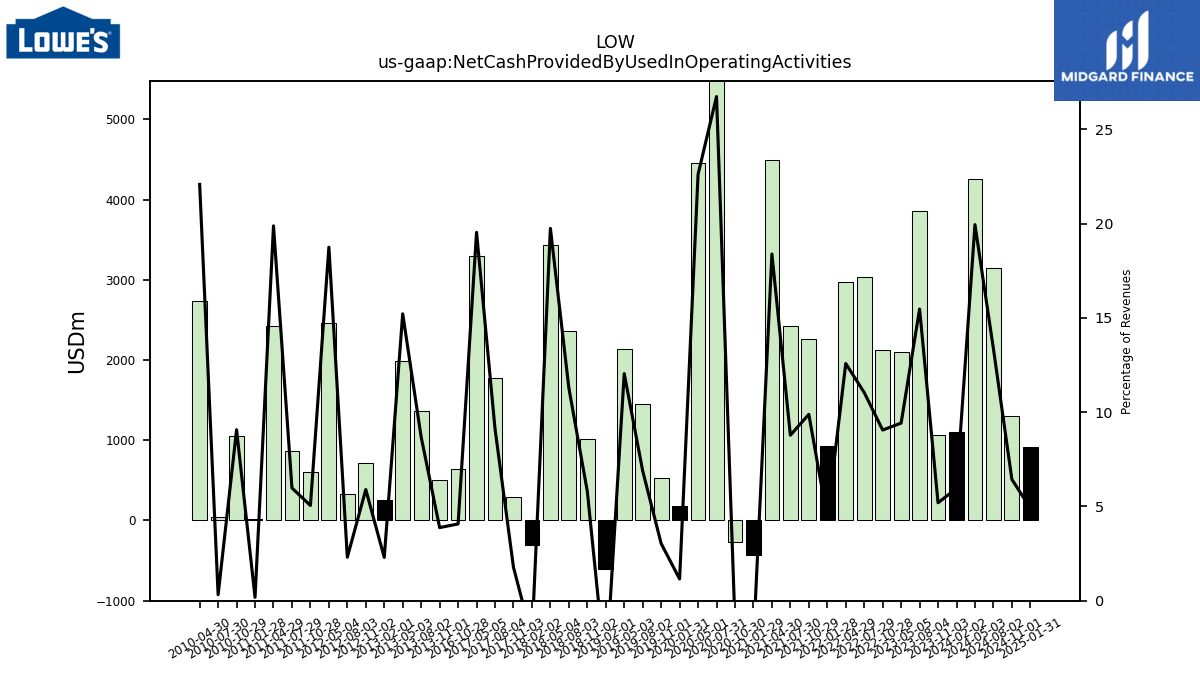 |
LOW | 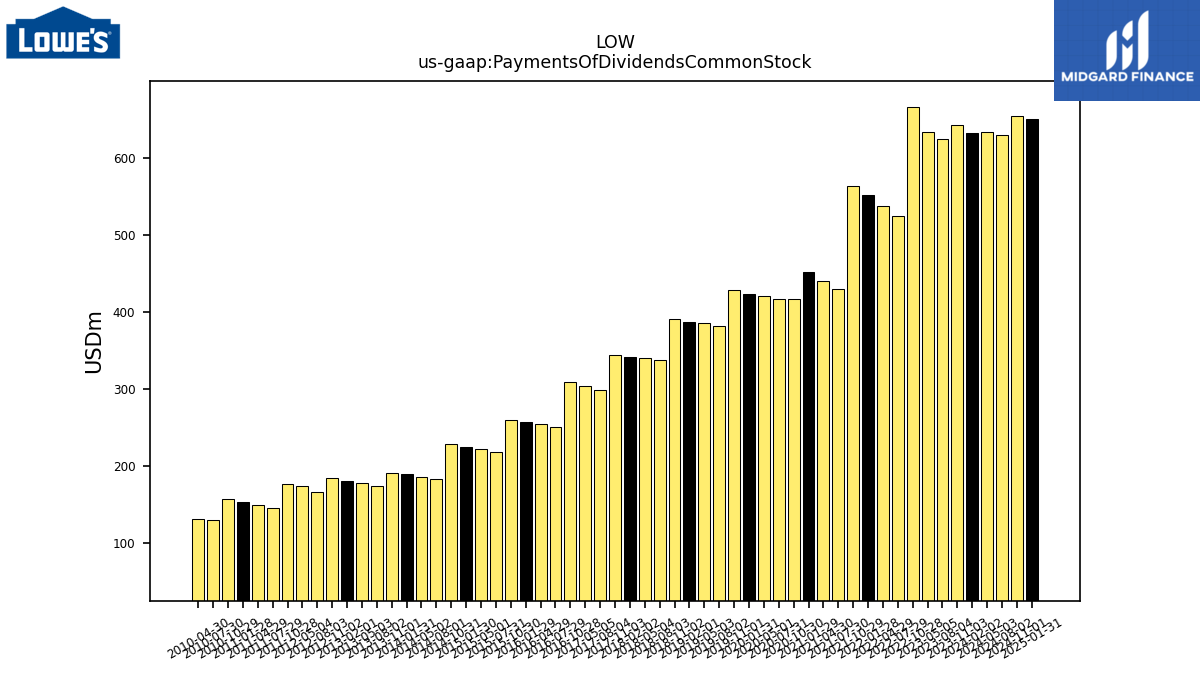 |
 |
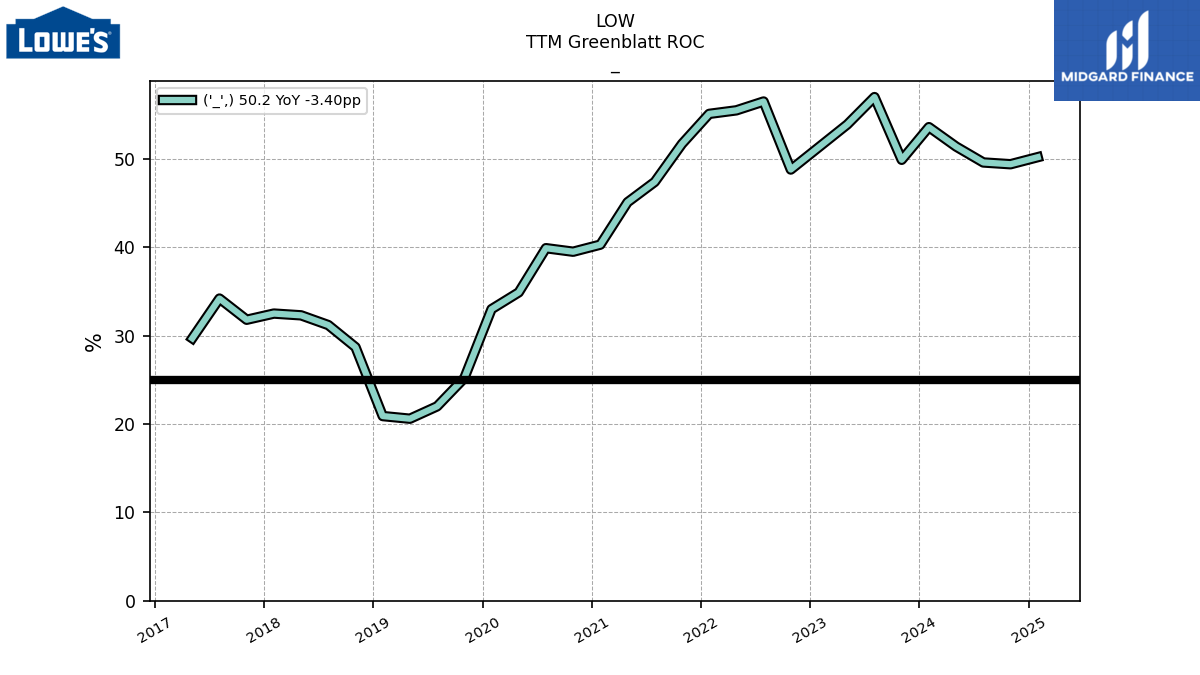 |
LOW | |||
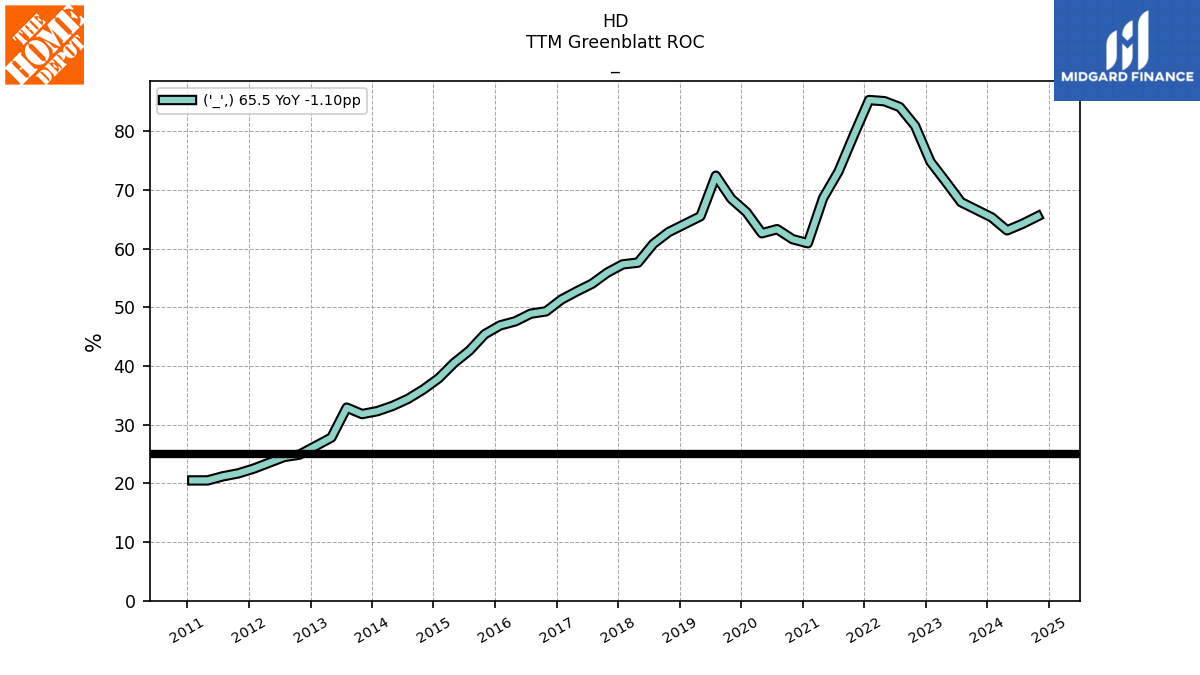
| $HD$ | 2025-03-21 | 2024-11-19 | 2025-02-25 |  |
NA | NA | HD |  |
 |
 |
HD |  |
 |
 |
HD |  |
 |
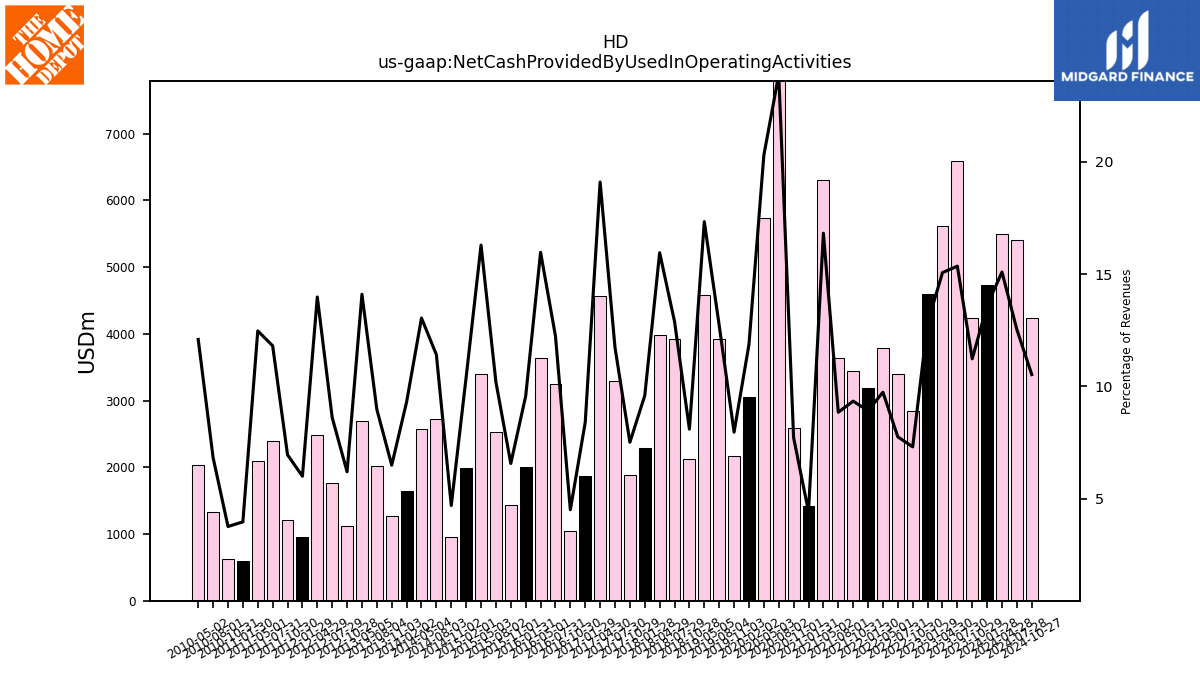 |
HD | 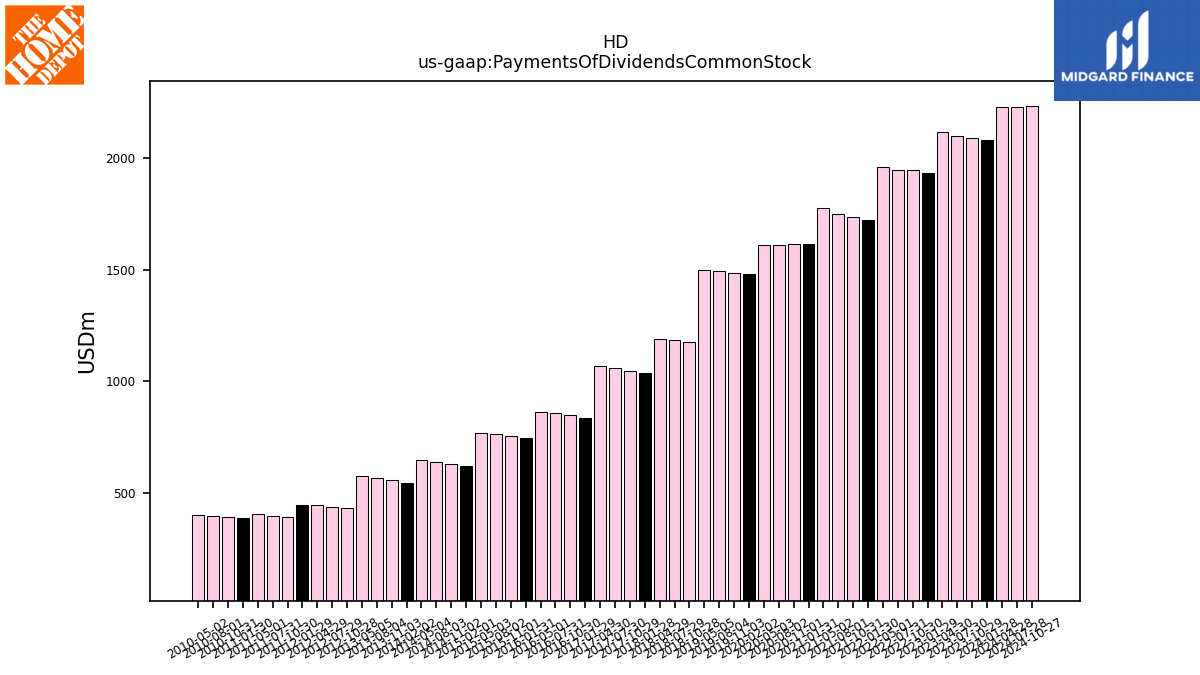 |
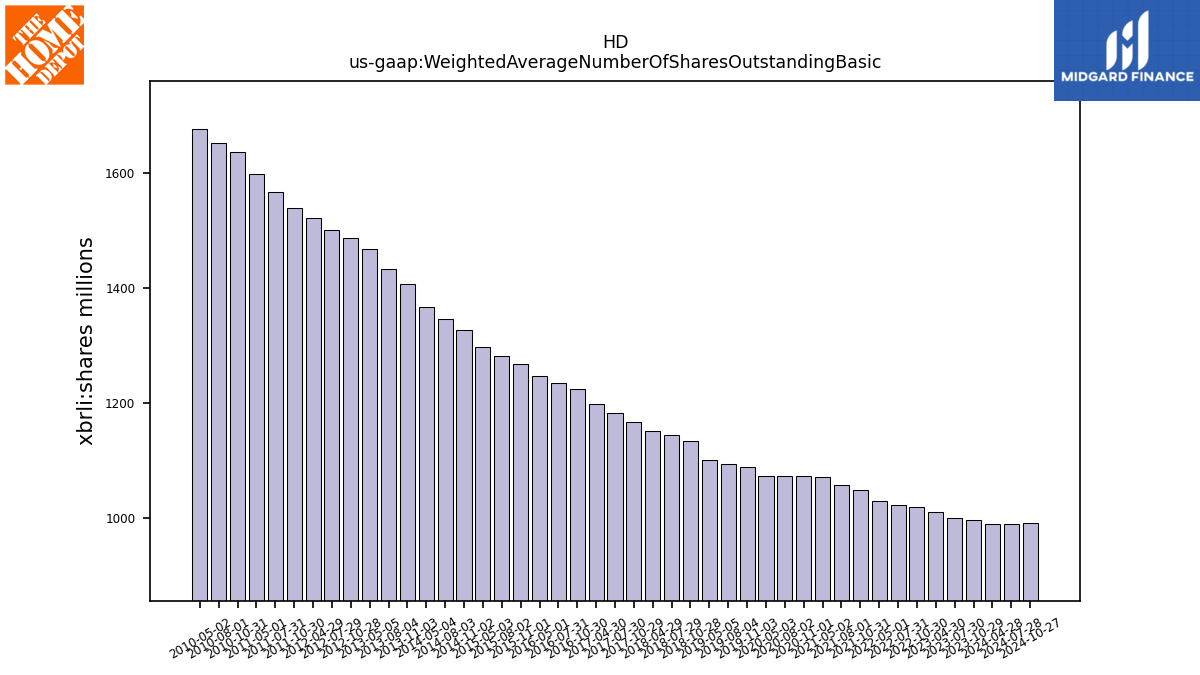 |
 |
HD | ||
| Ticker | 10K | 10Q | 8K | Sector | Industry | Logo | Forward P/E | Revenue Growth | Ticker | Income | EPS | Revenues | Ticker | GrossProfit | OperatingIncome | LongTermDebt | Ticker | InterestExpense | RetainedEarnnings | CashFlowOperating | Ticker | Dividends | SharesOutstanding | TTMGreenblattROC | |
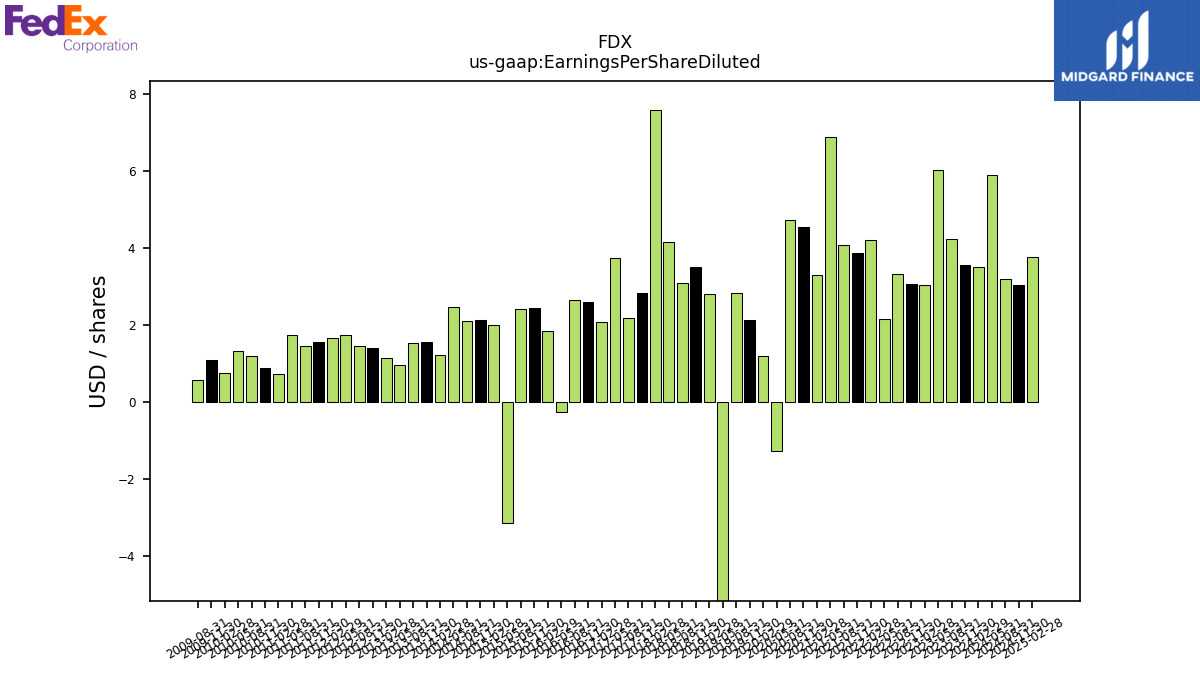
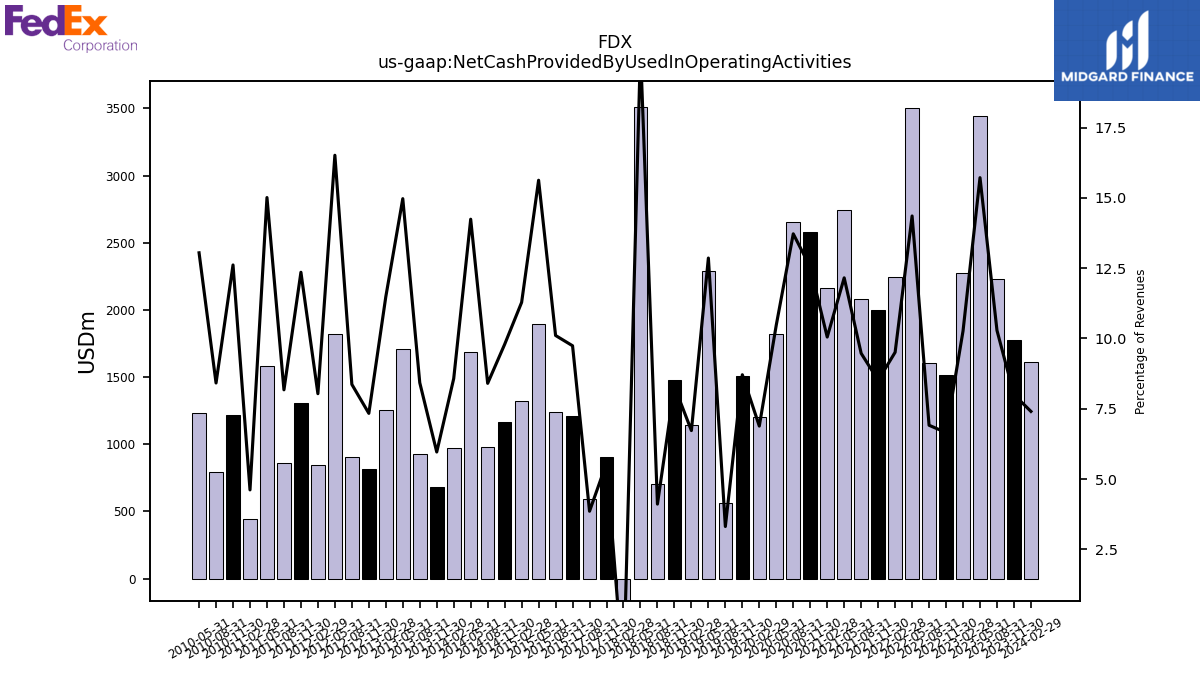
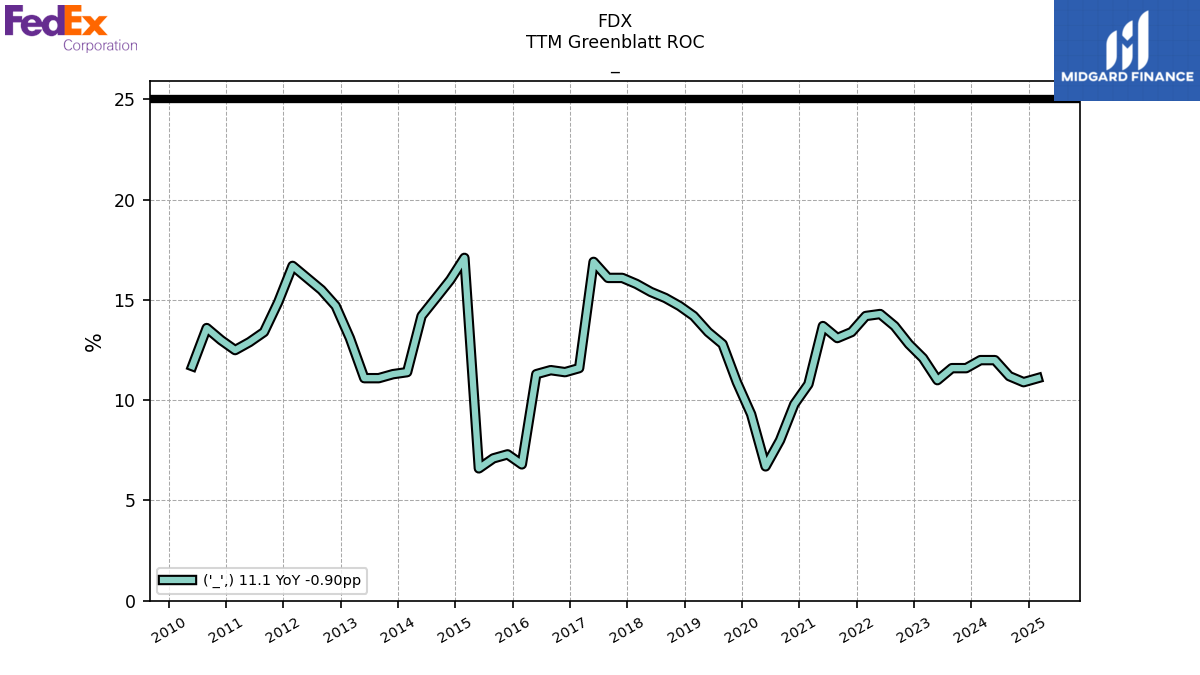
| $FDX$ | 2024-07-15 | 2025-03-20 | 2025-03-20 | NA | NA | FDX | 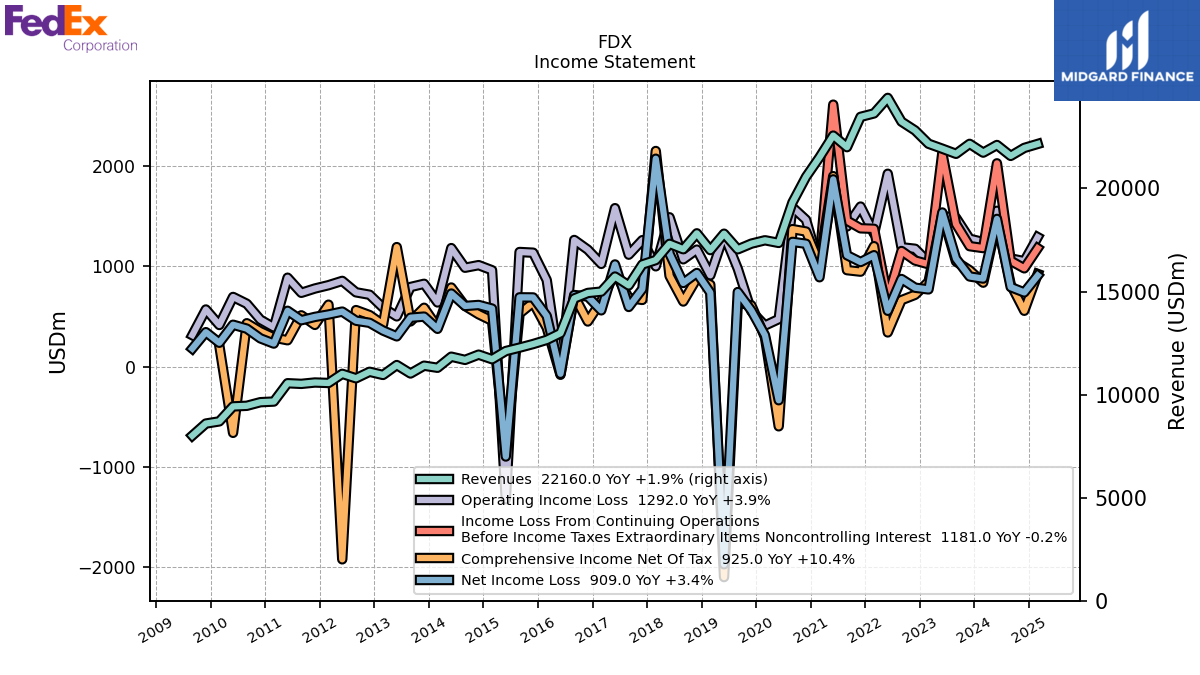 |
 |
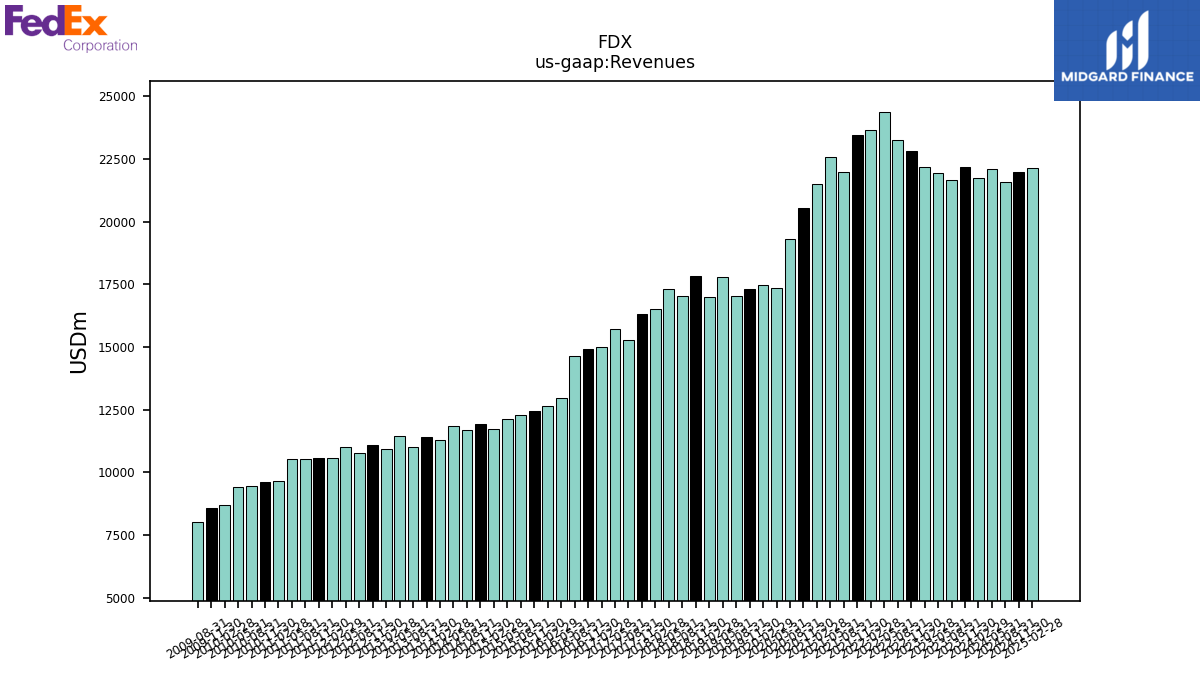 |
FDX | 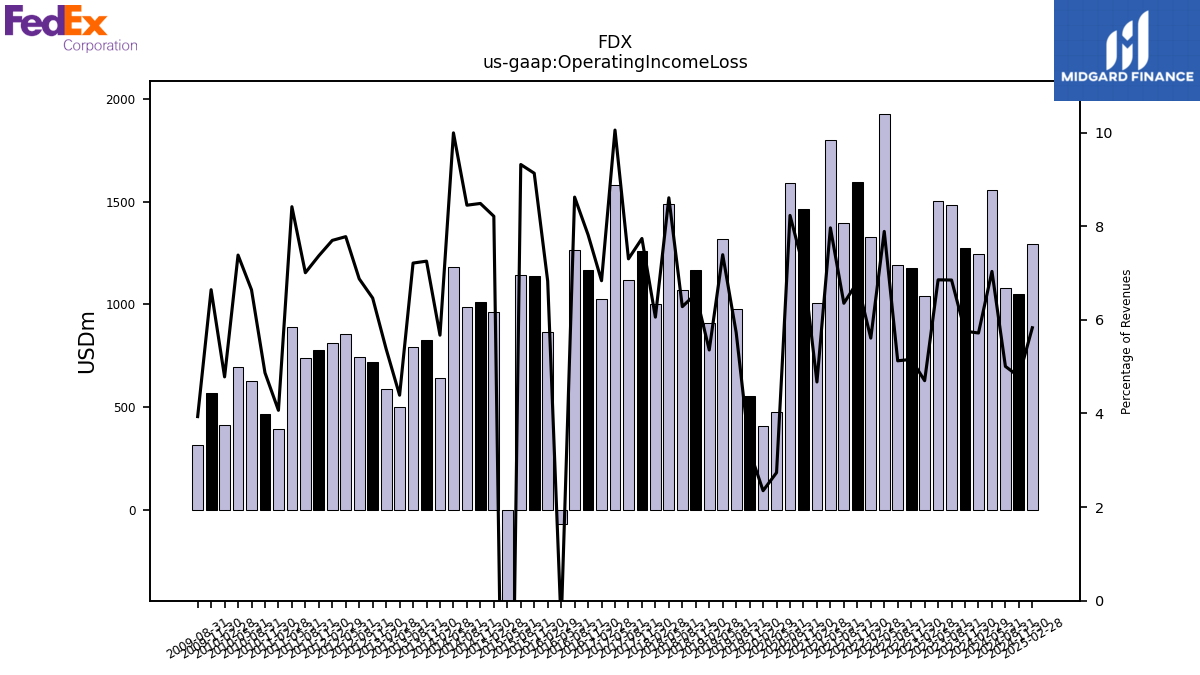 |
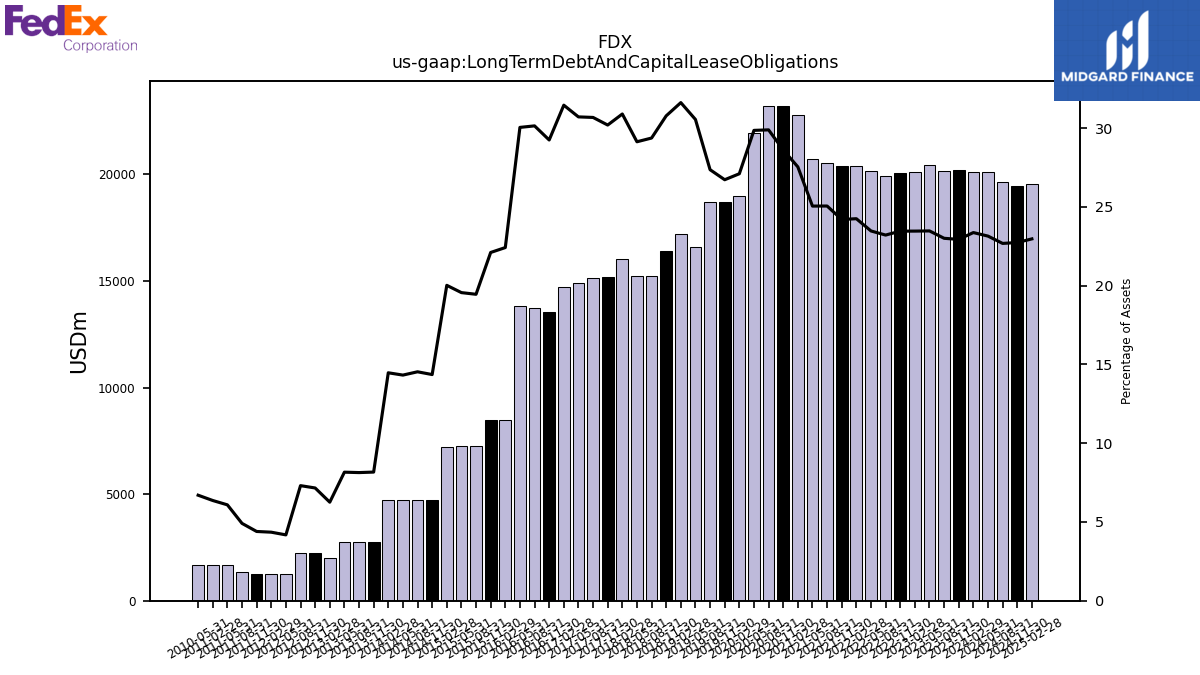 |
FDX | 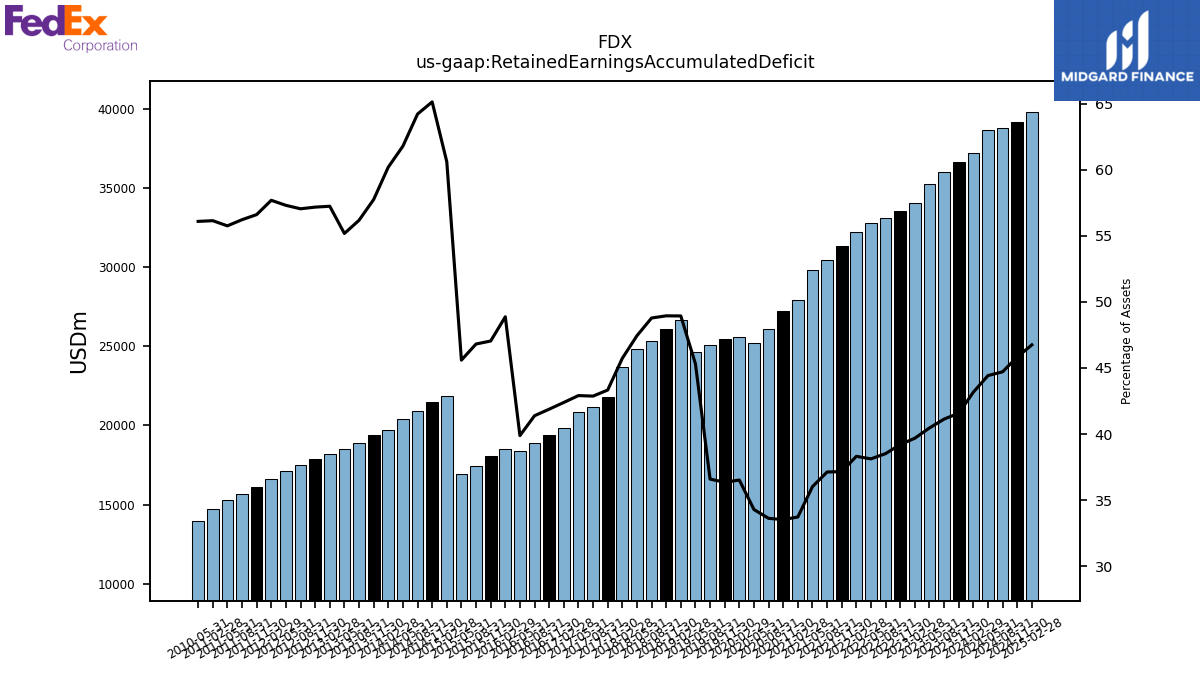 |
 |
FDX | 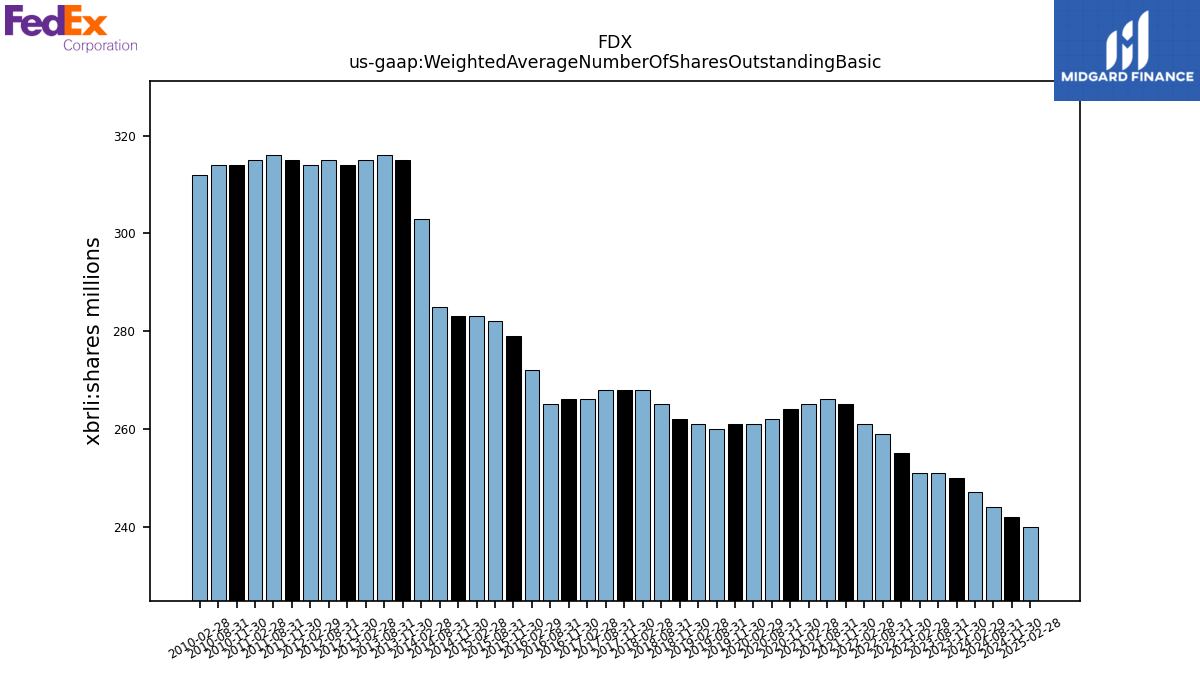 |
 |
FDX | ||||||
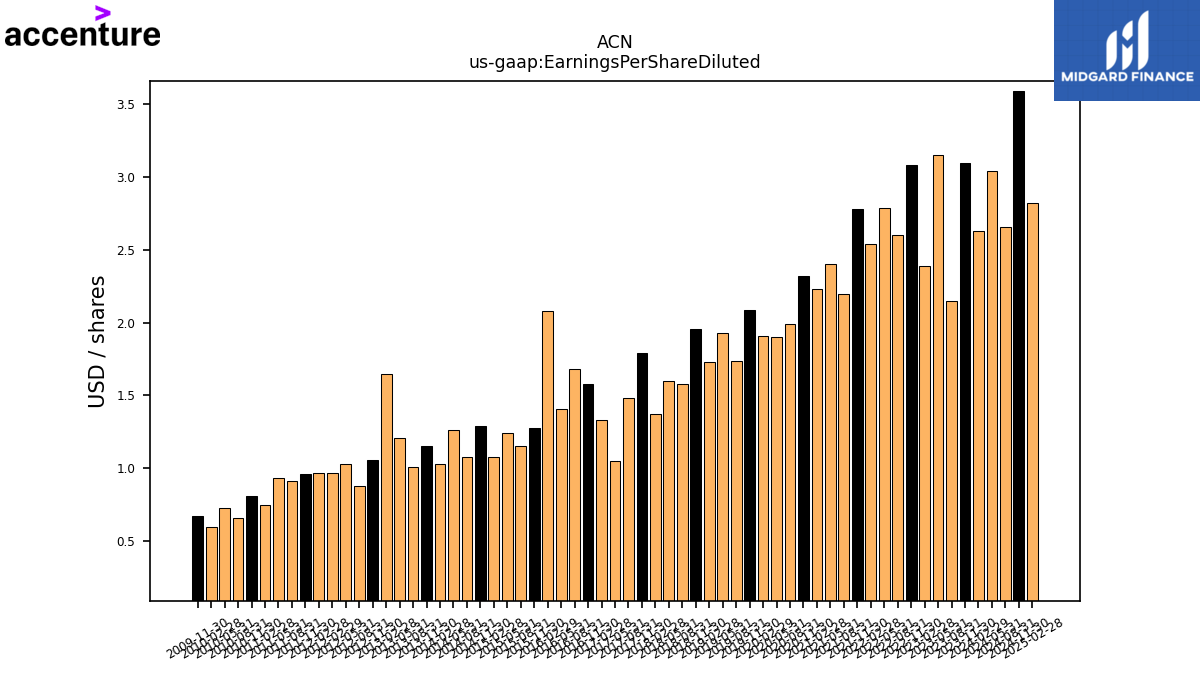
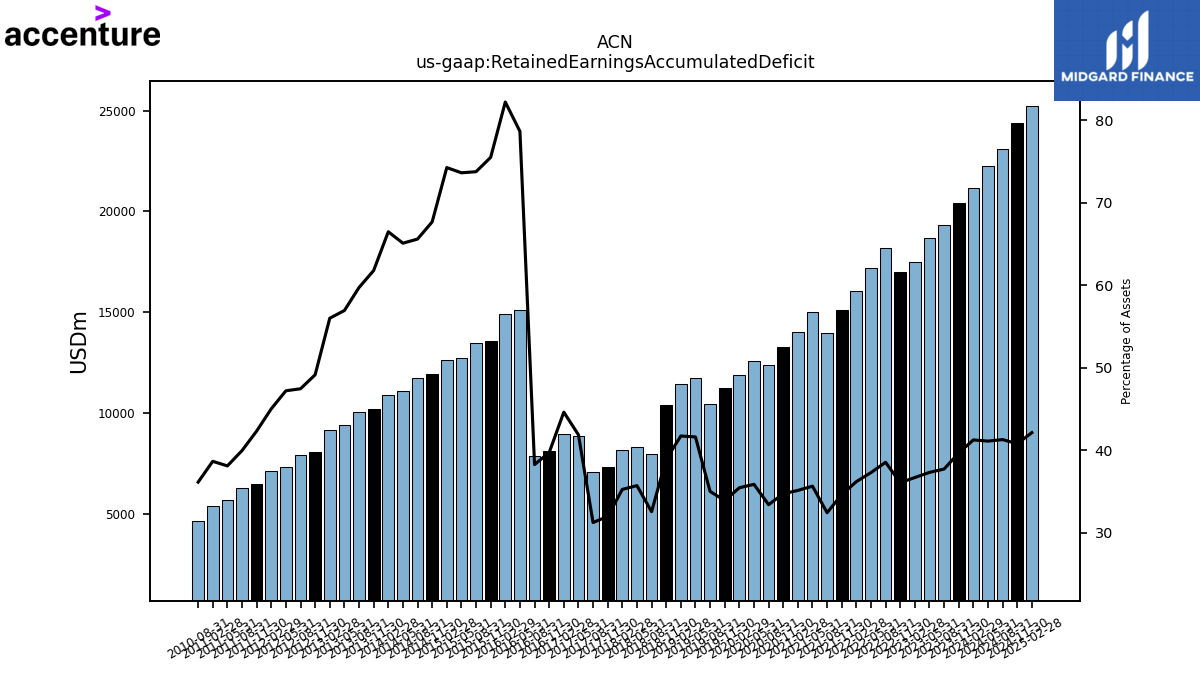
| $ACN$ | 2024-10-10 | 2025-03-20 | 2025-03-20 |  |
NA | NA | ACN | 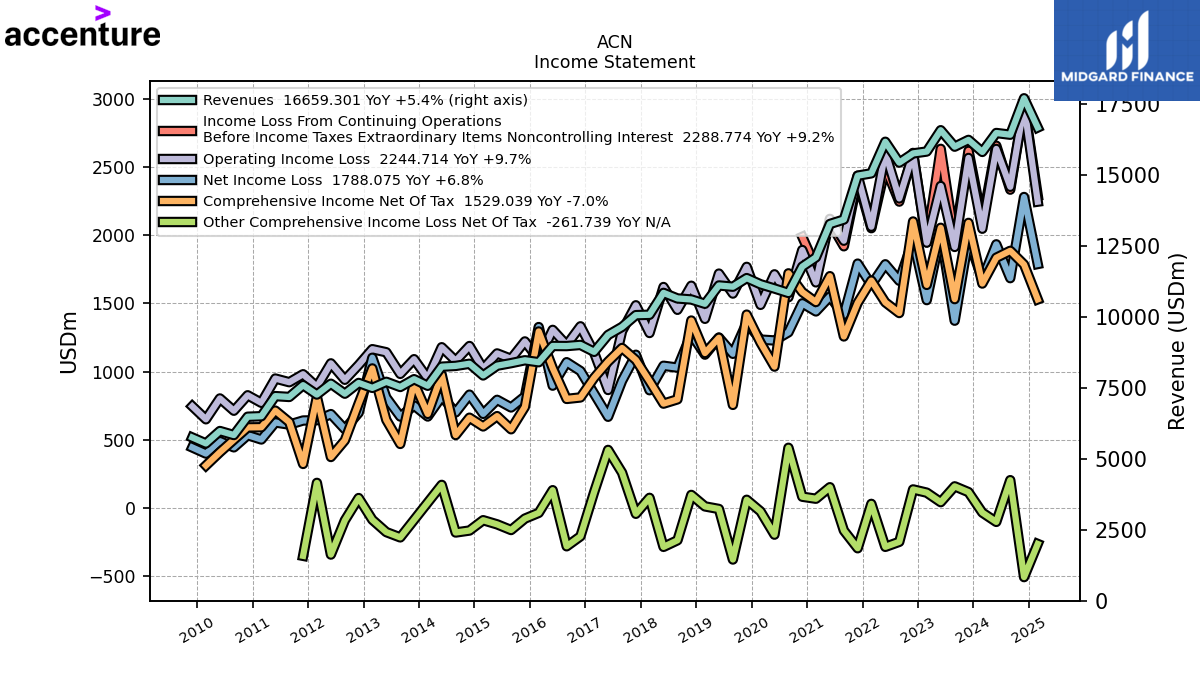 |
 |
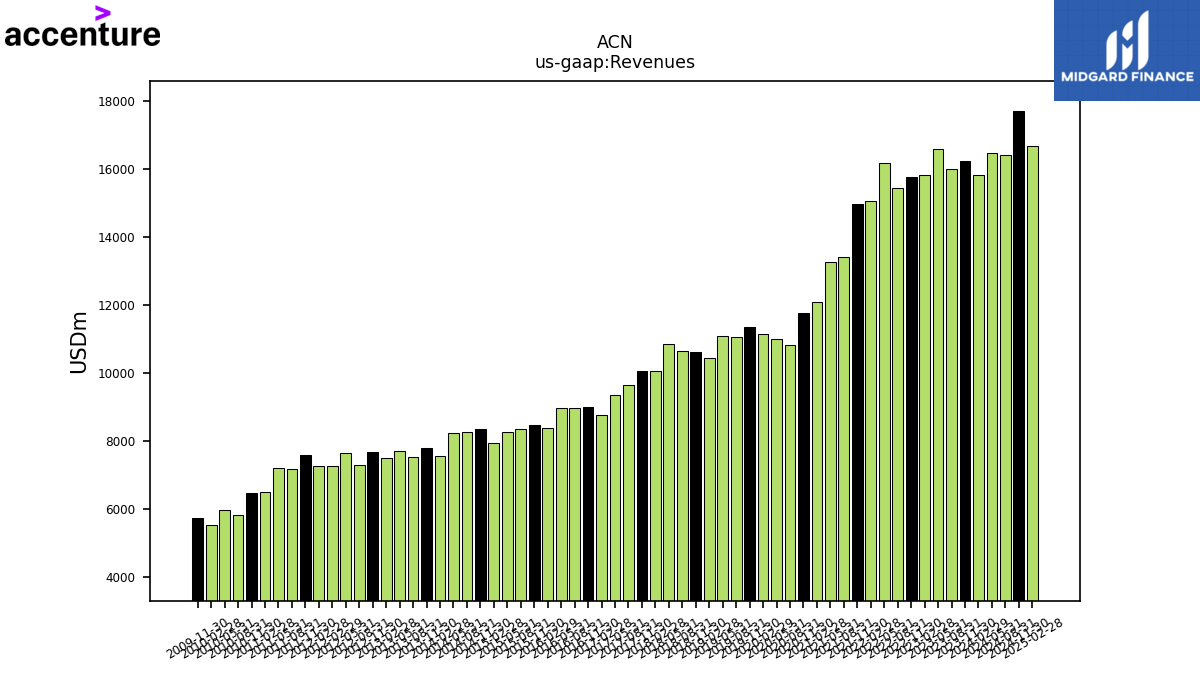 |
ACN | 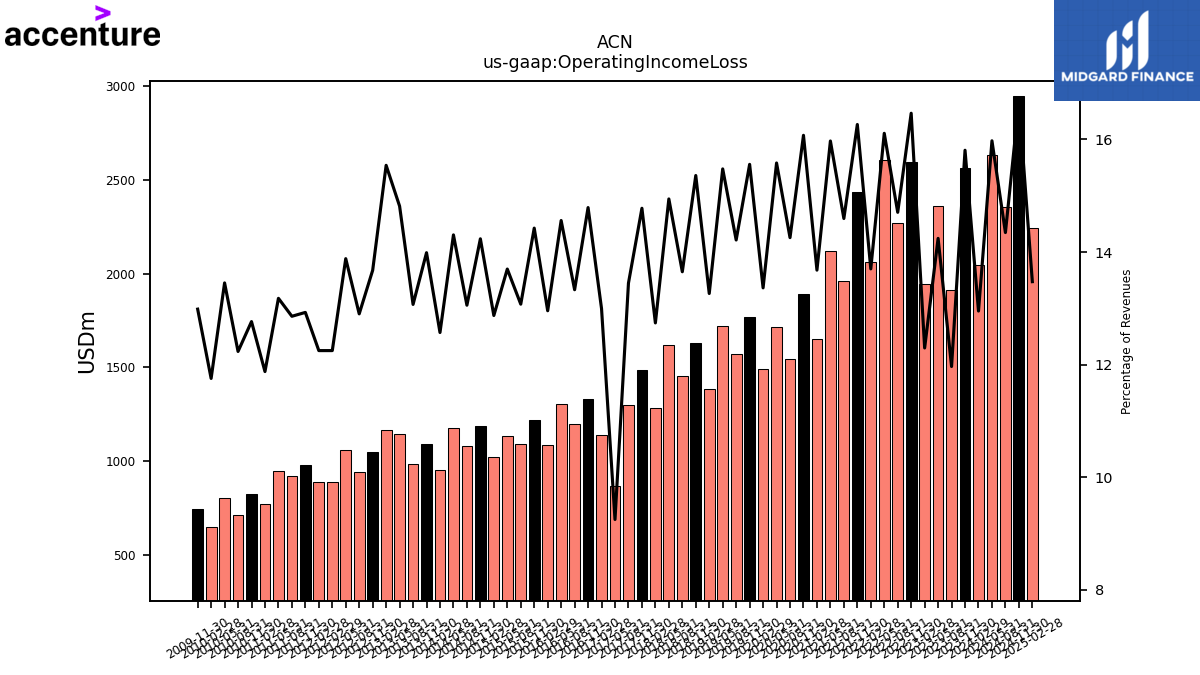 |
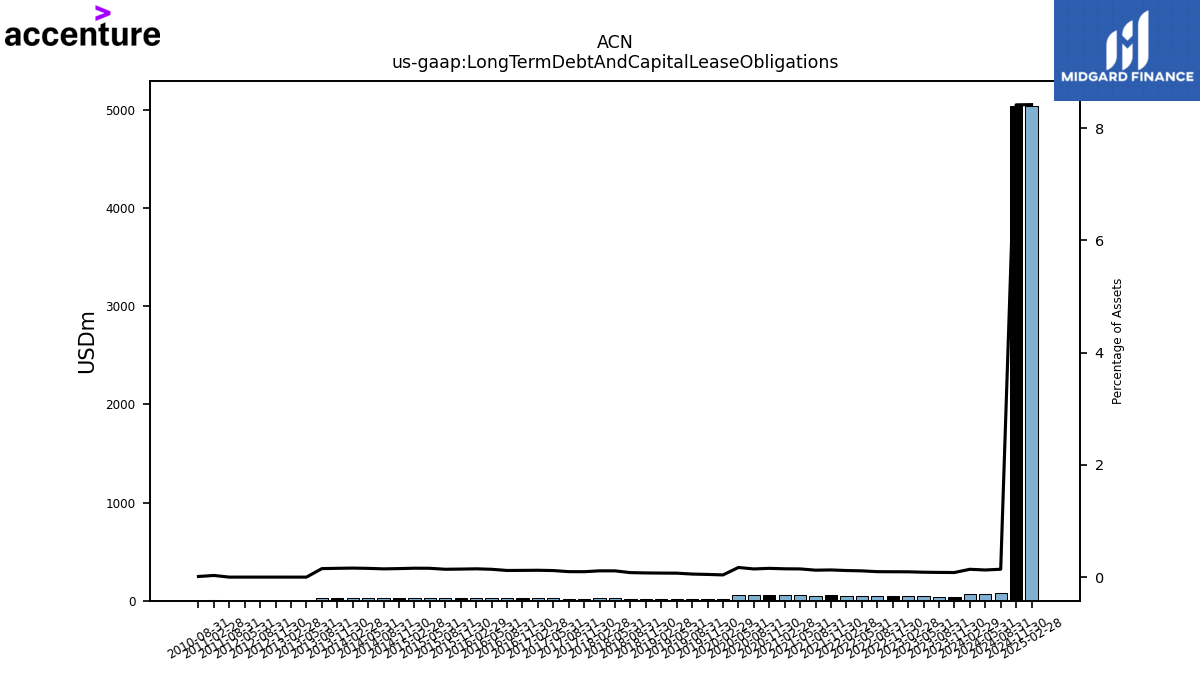 |
ACN | 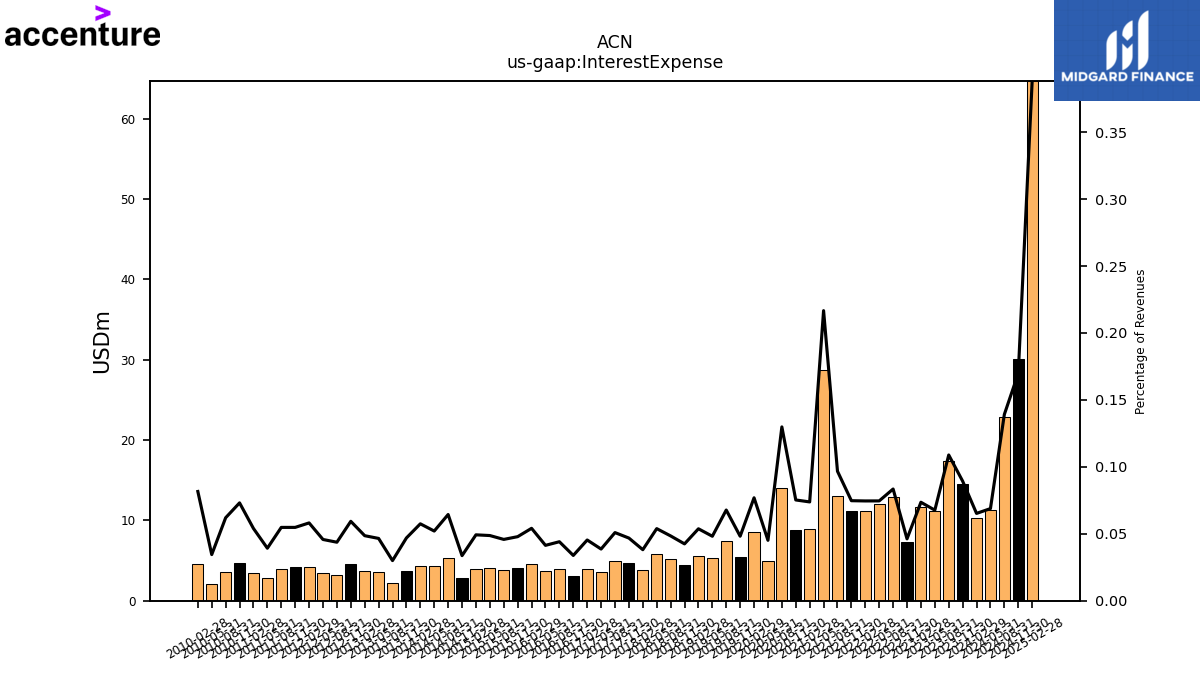 |
 |
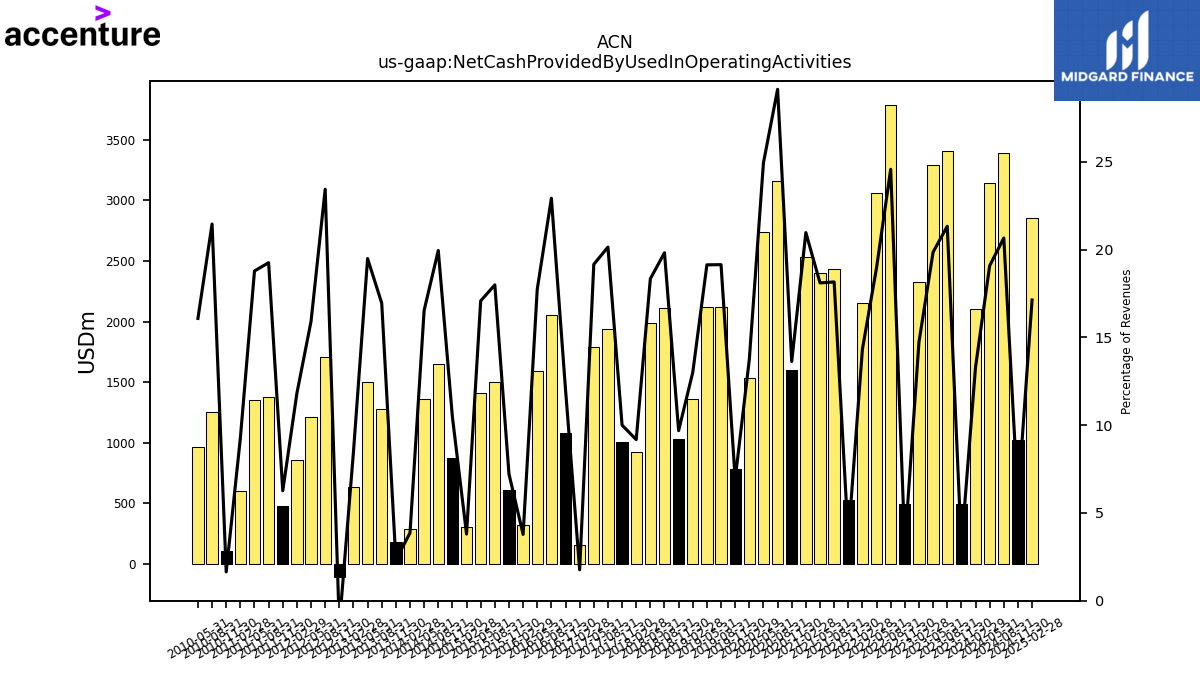 |
ACN | 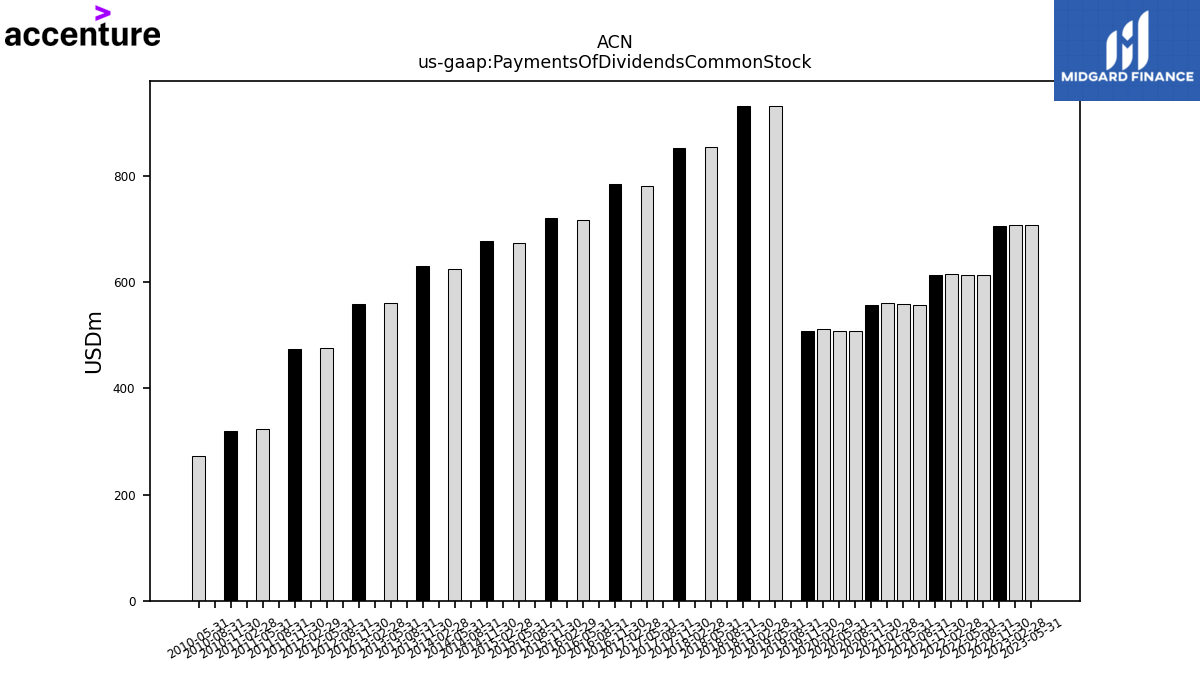 |
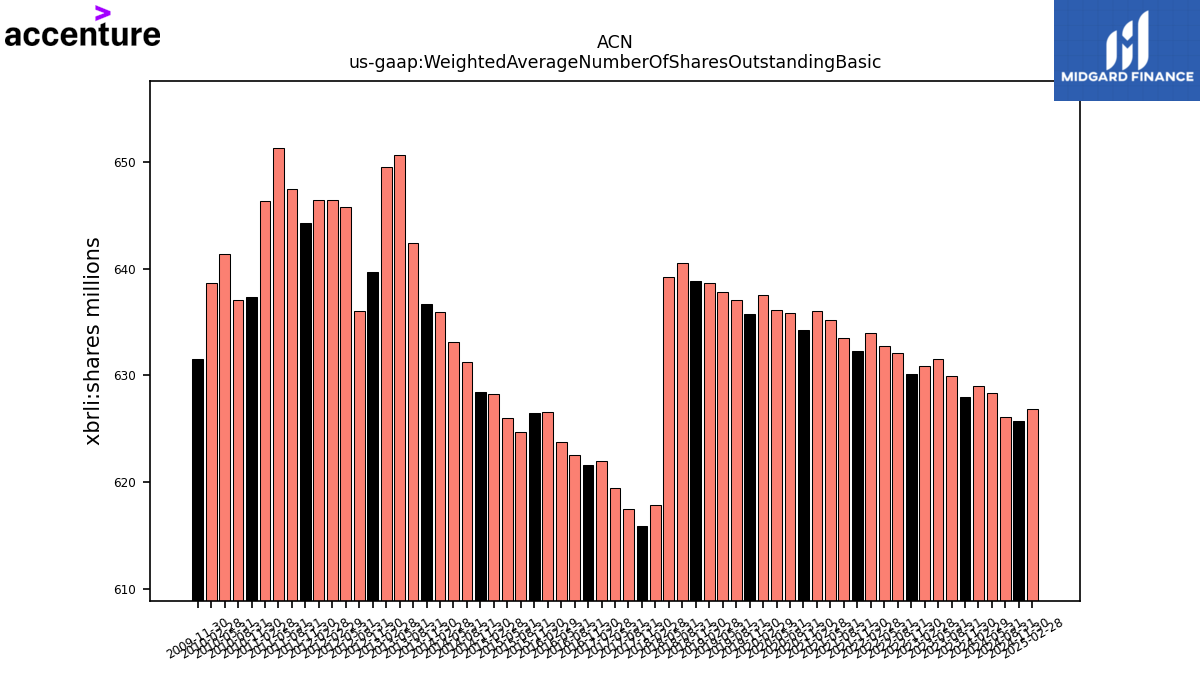 |
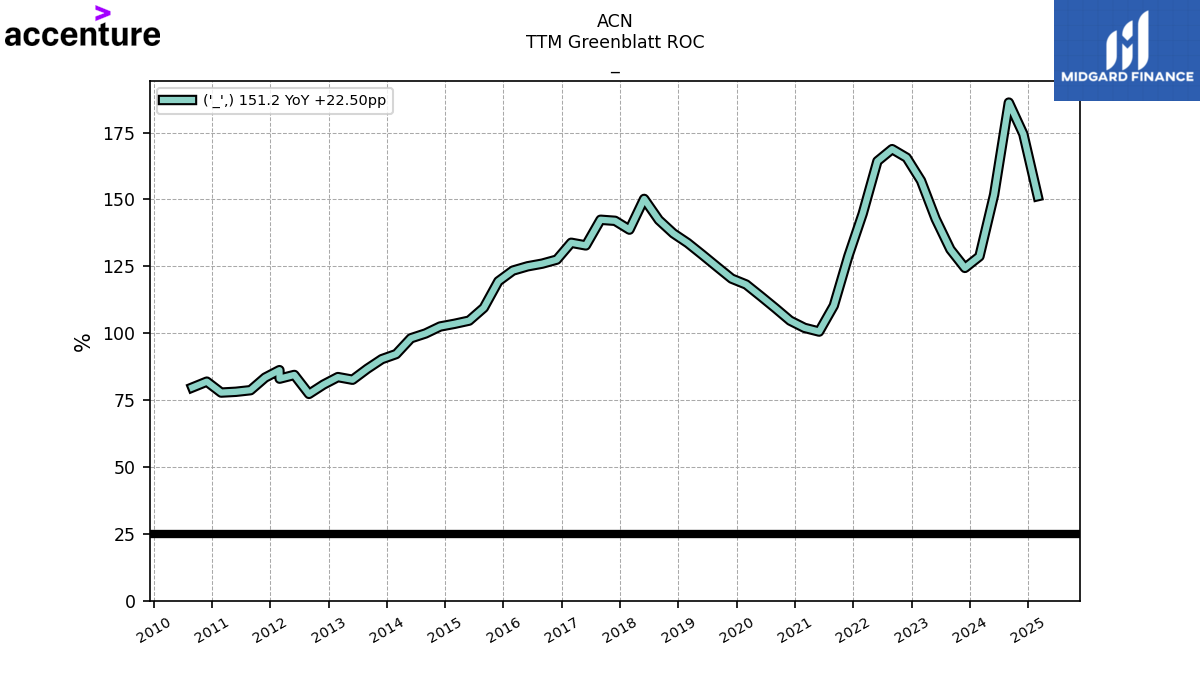 |
ACN | |||
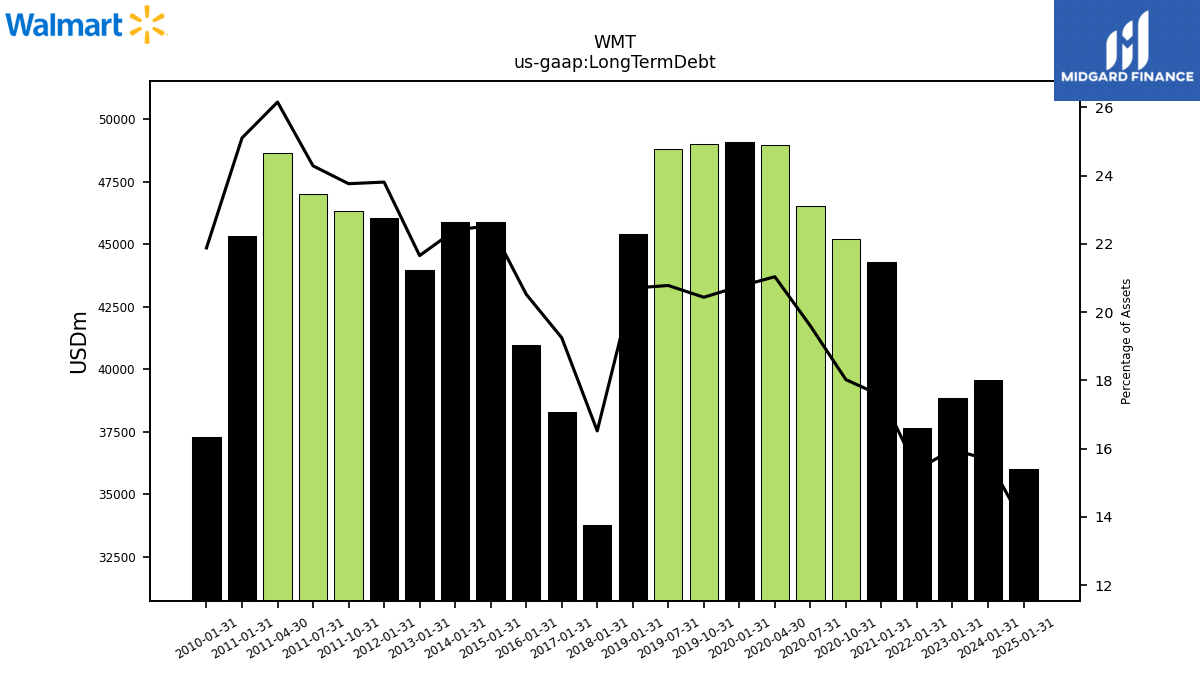
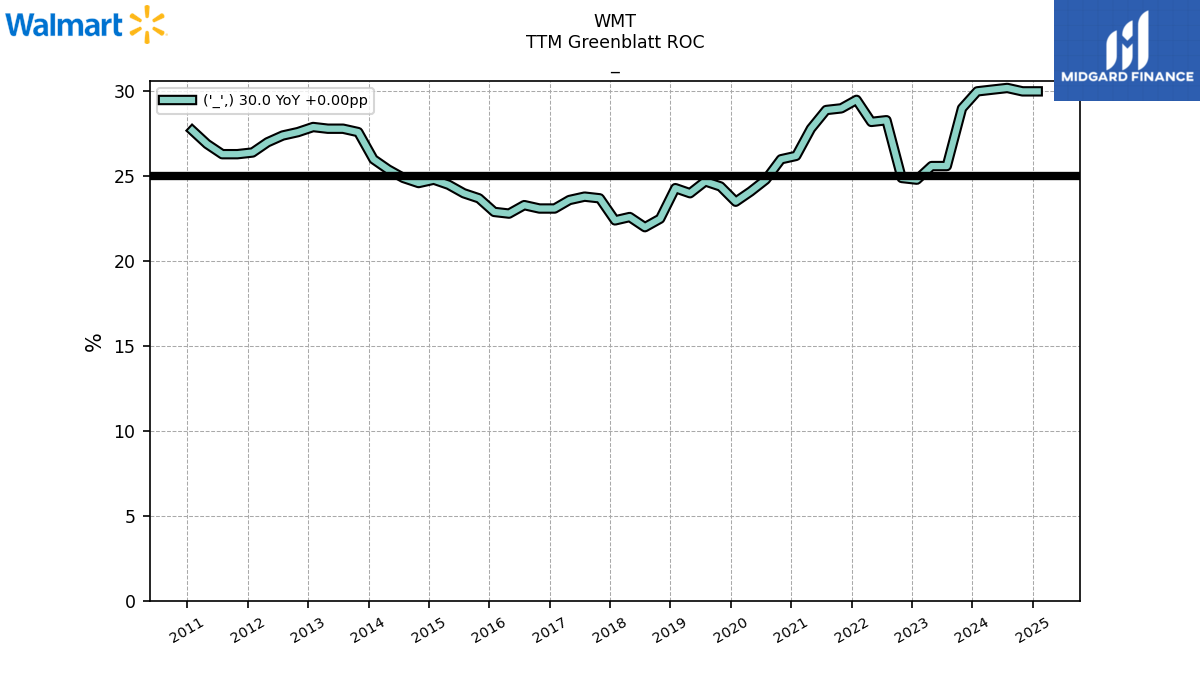
| $WMT$ | 2025-03-14 | 2024-12-06 | 2025-02-20 | NA | NA | WMT | 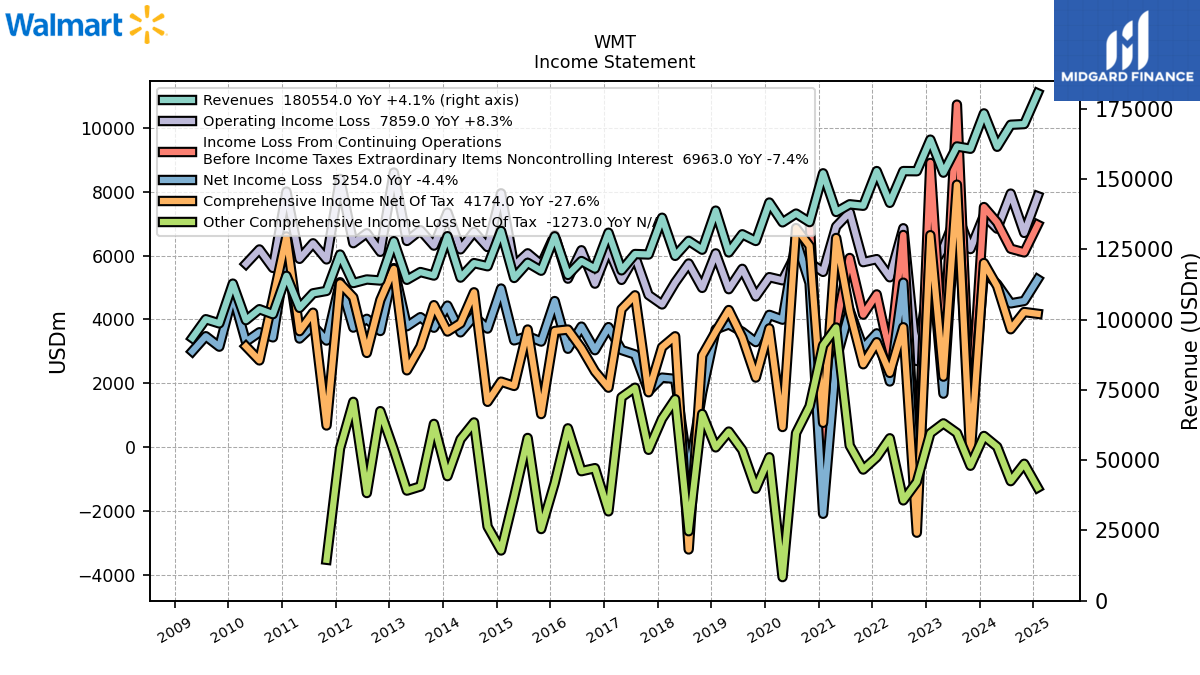 |
 |
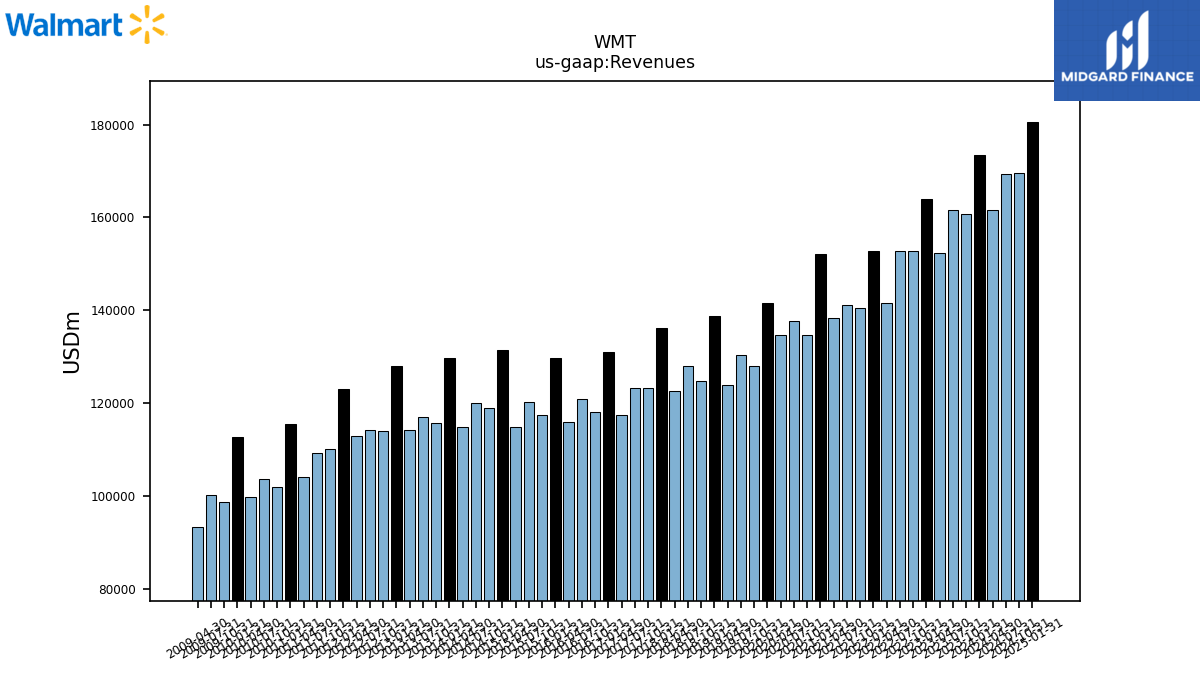 |
WMT | 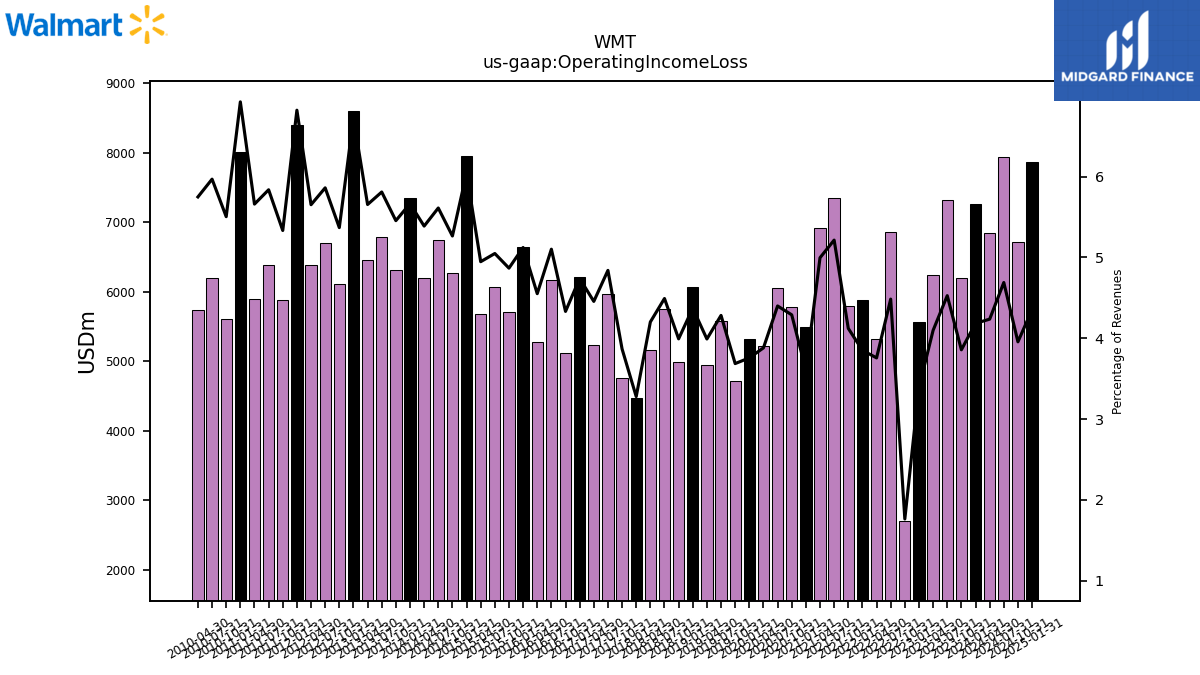 |
 |
WMT |  |
 |
WMT |  |
 |
 |
WMT | |||||
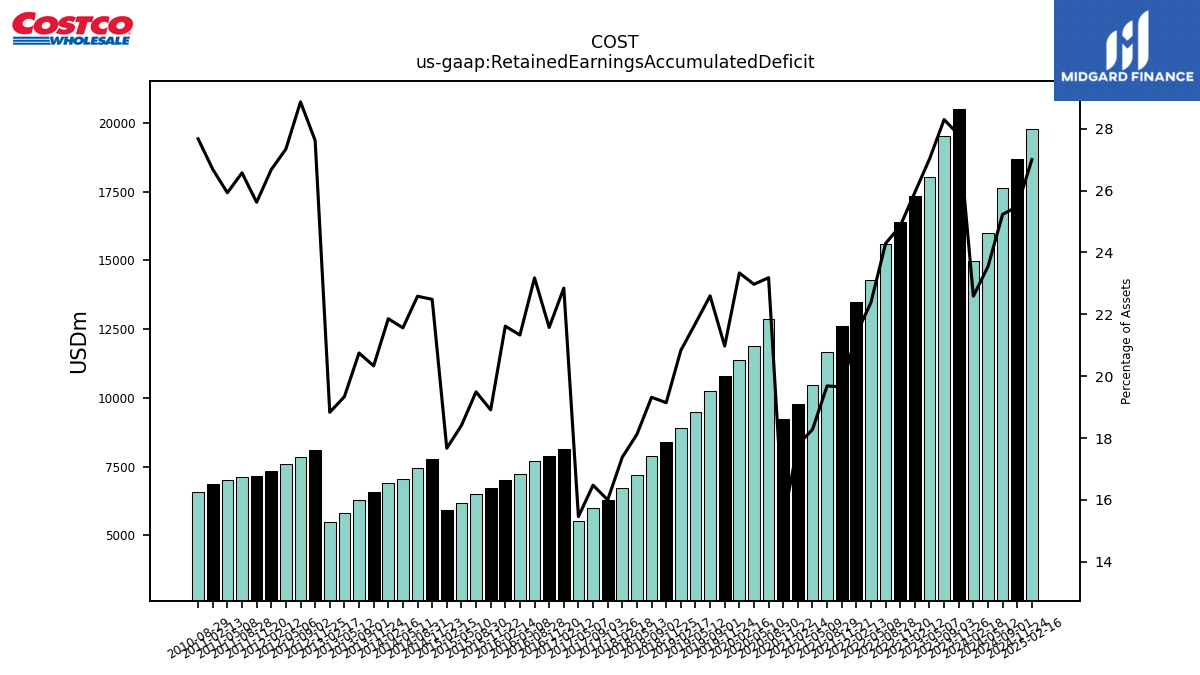
| $COST$ | 2024-10-09 | 2025-03-13 | 2025-03-06 | NA | NA | COST | 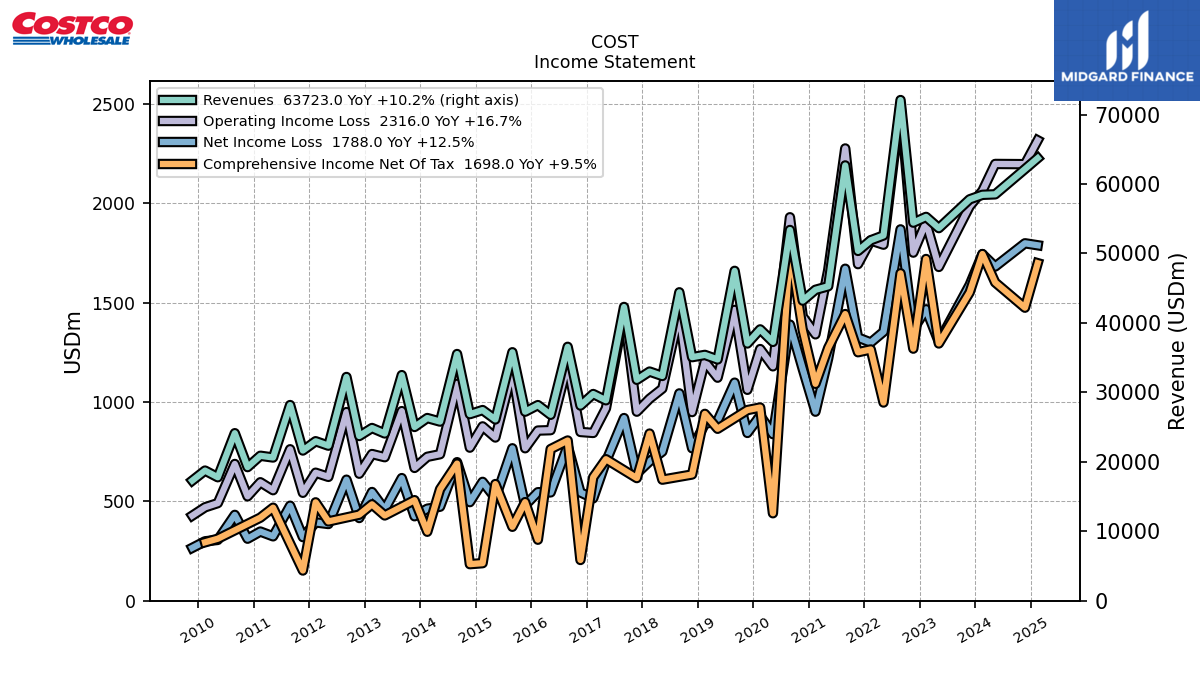 |
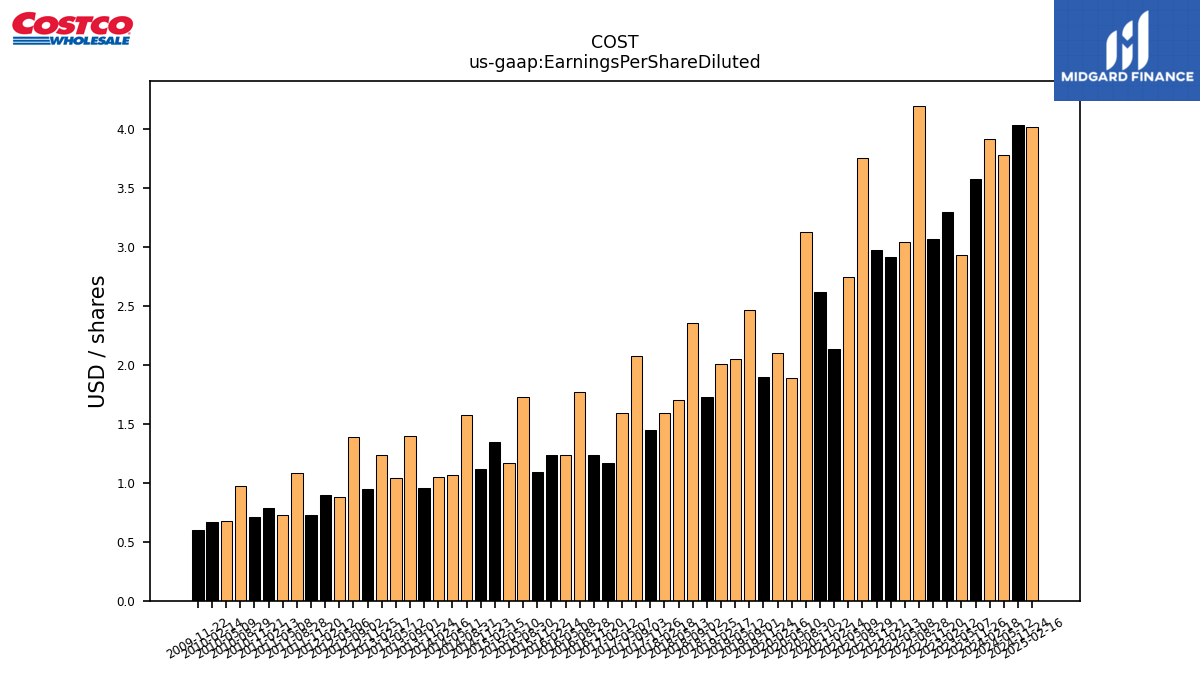 |
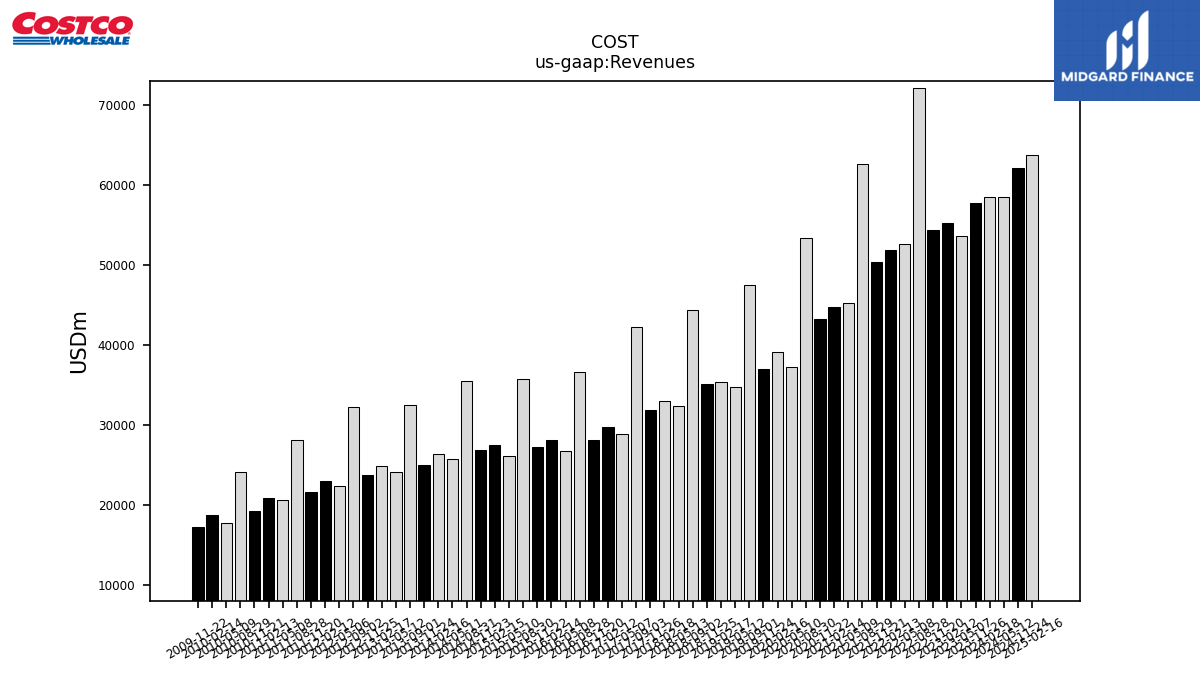 |
COST | 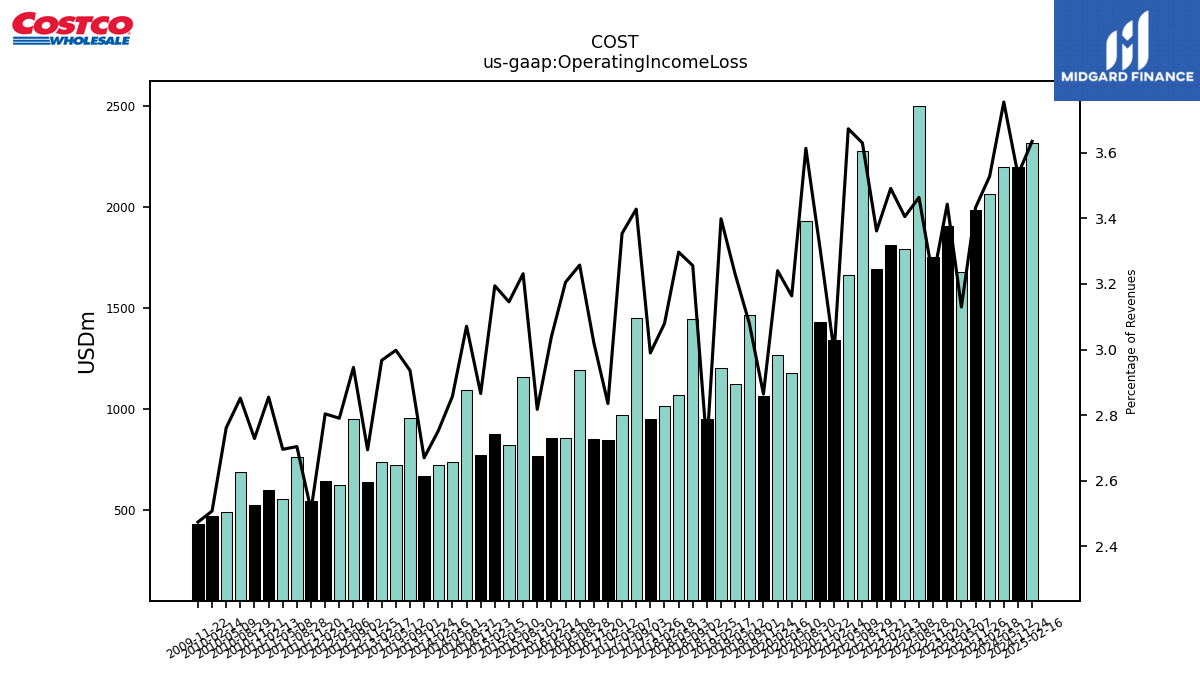 |
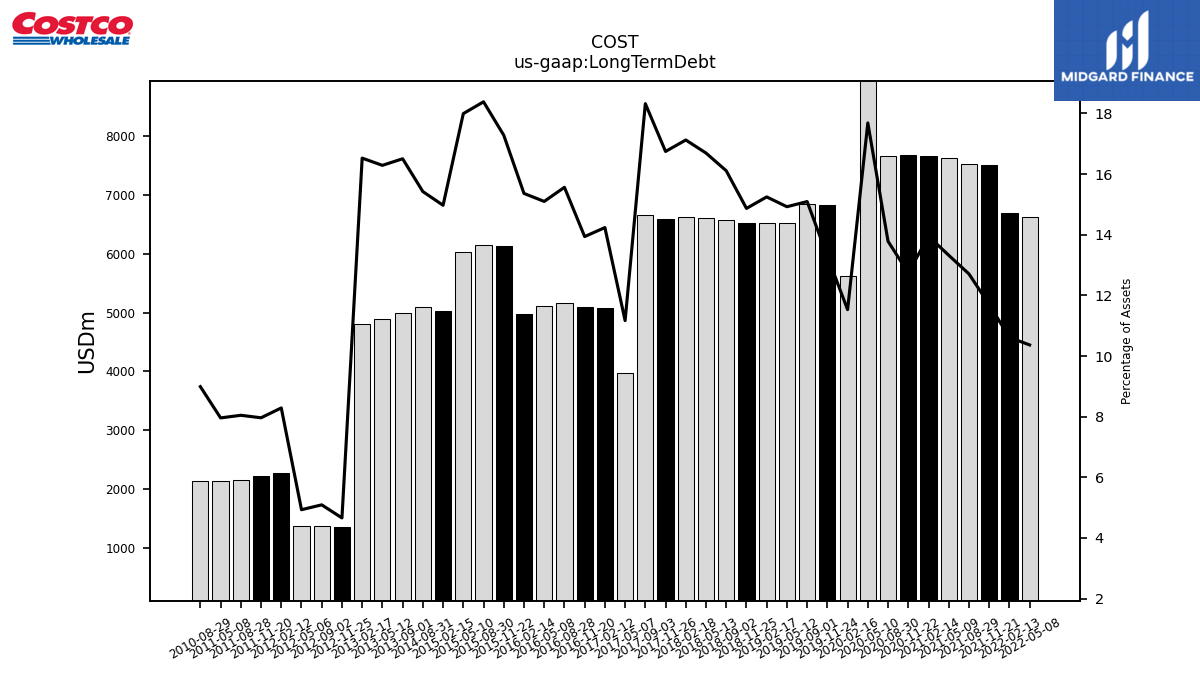 |
COST | 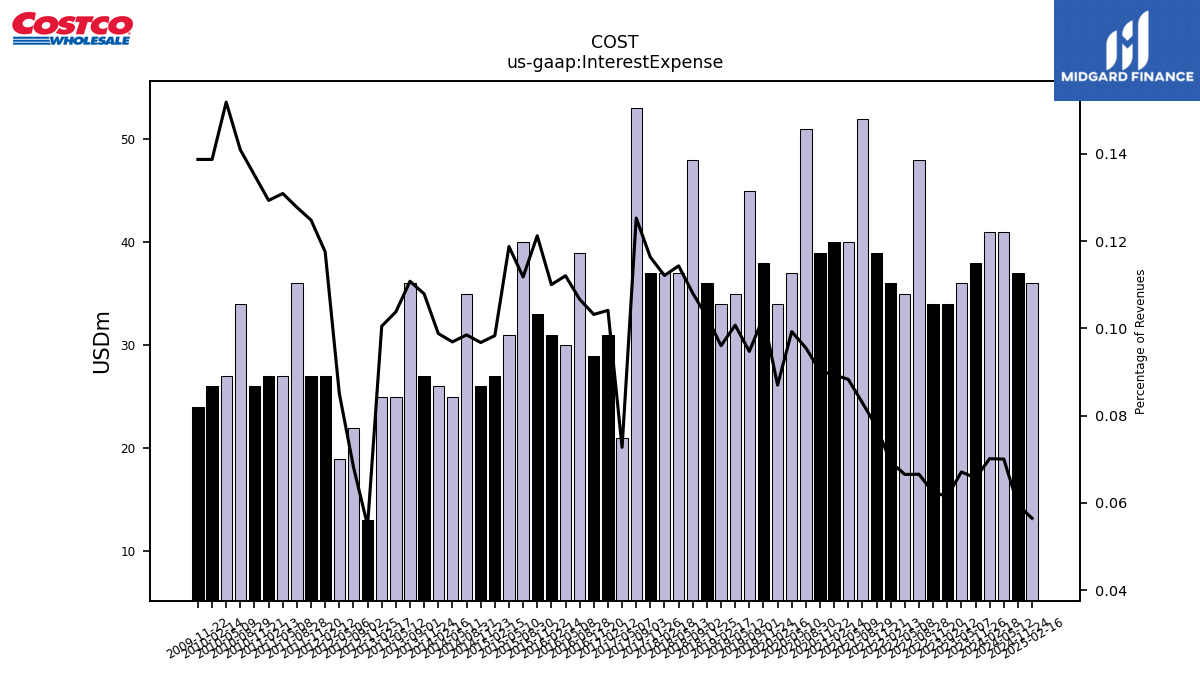 |
 |
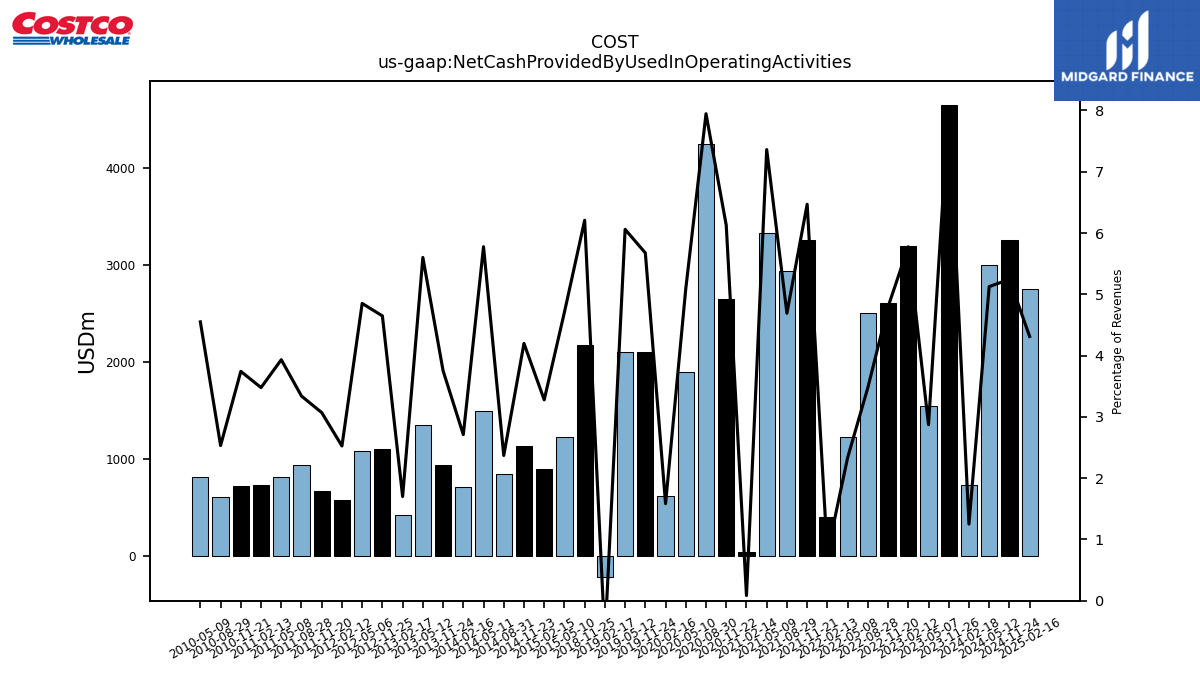 |
COST | 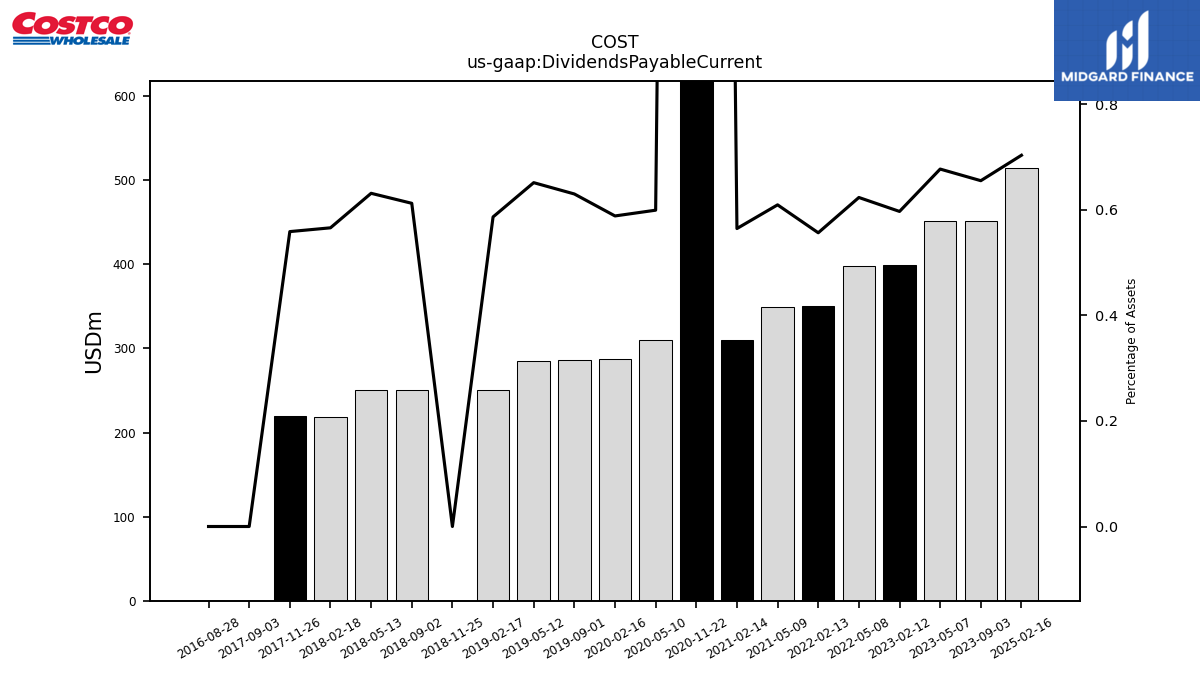 |
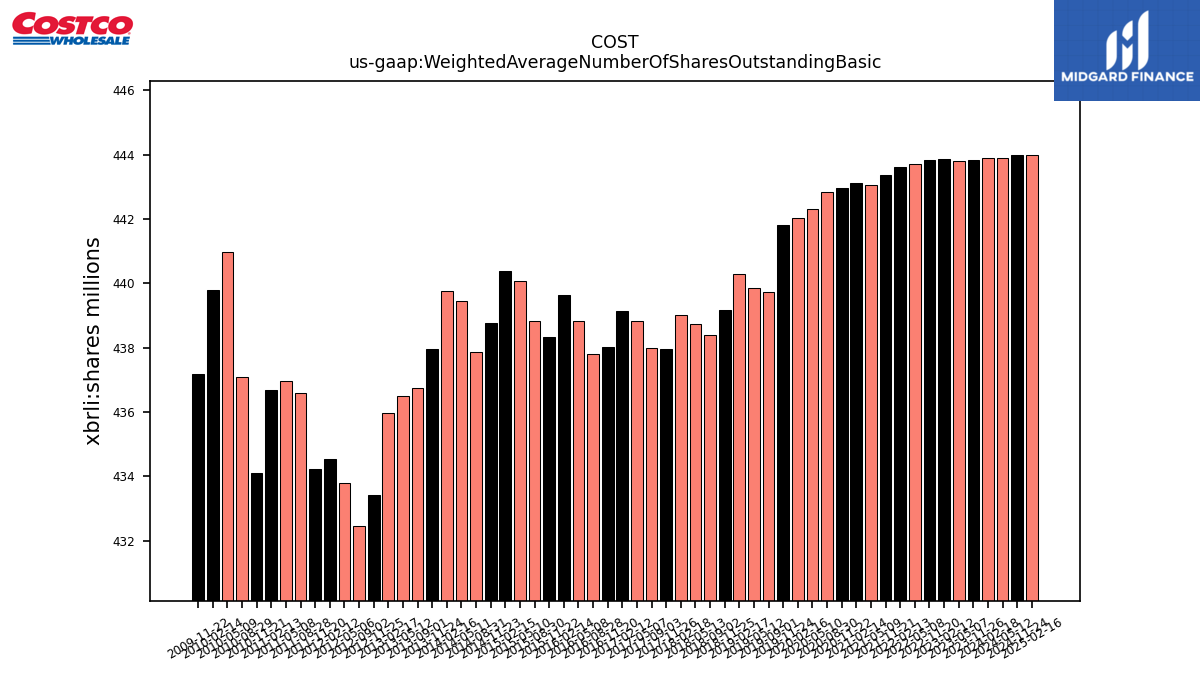 |
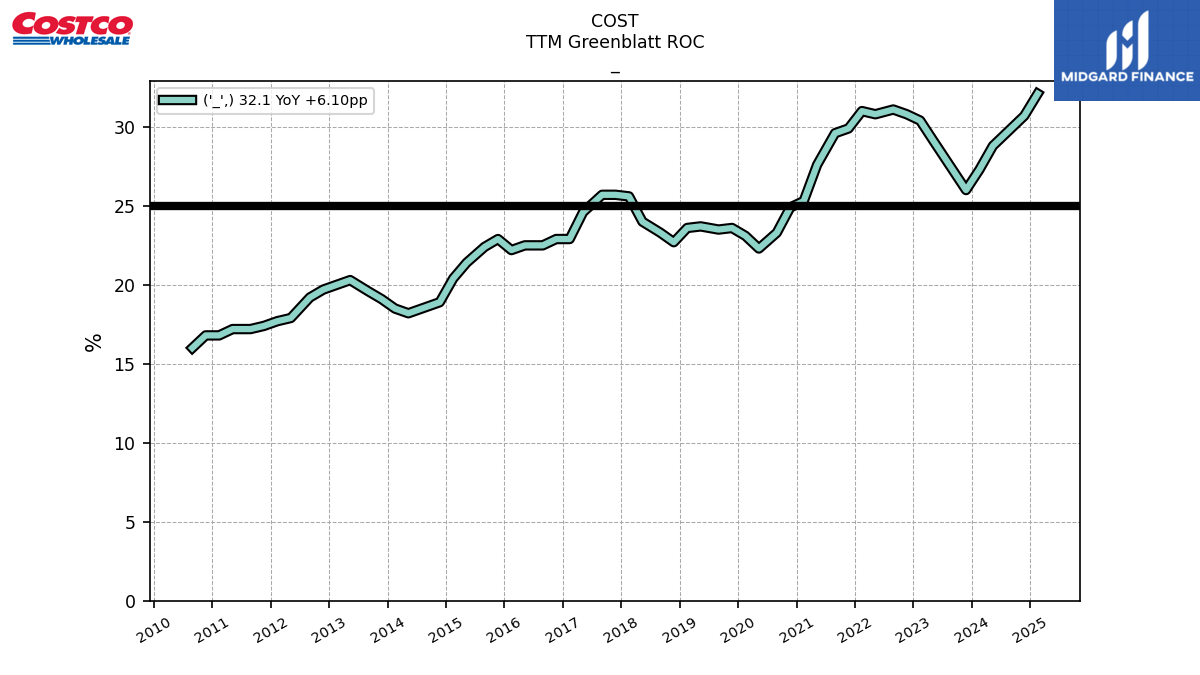 |
COST | ||||
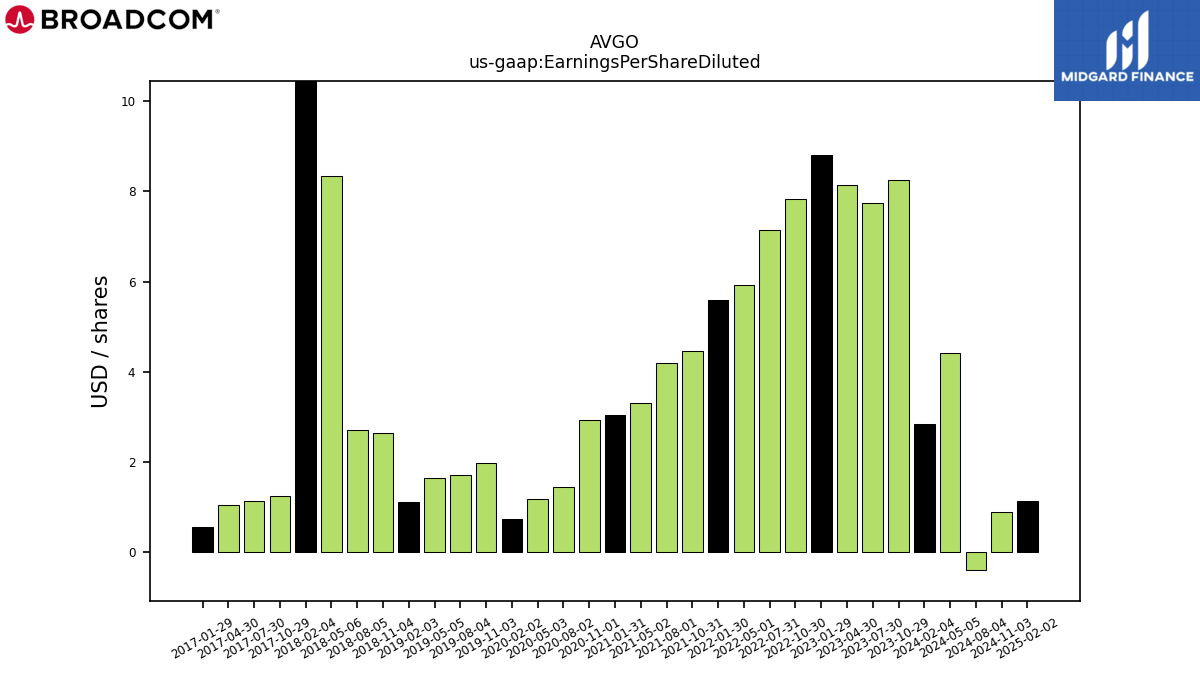
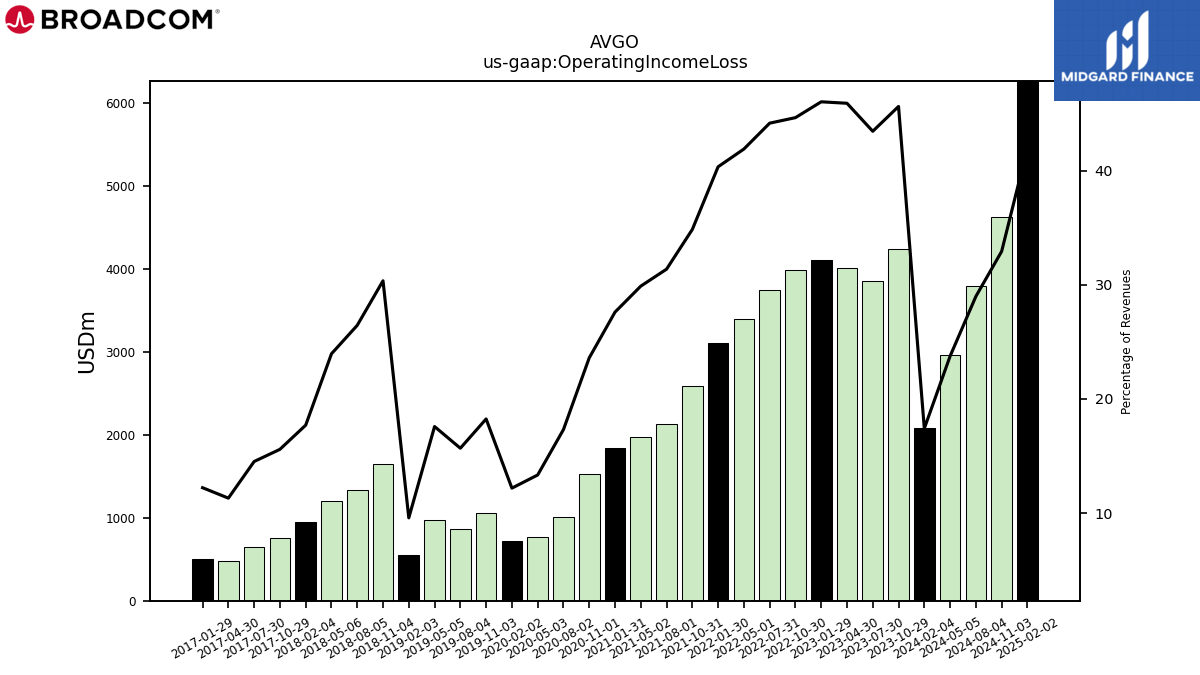
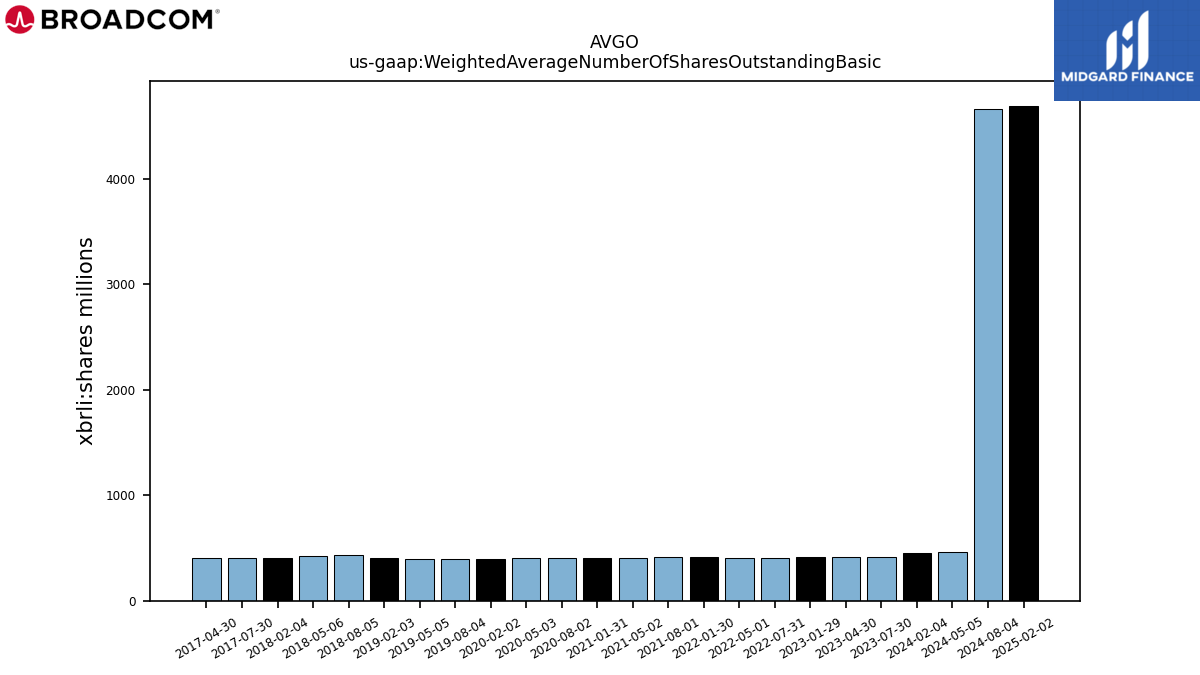
| $AVGO$ | 2024-12-20 | 2025-03-12 | 2025-03-06 | NA | NA | AVGO | 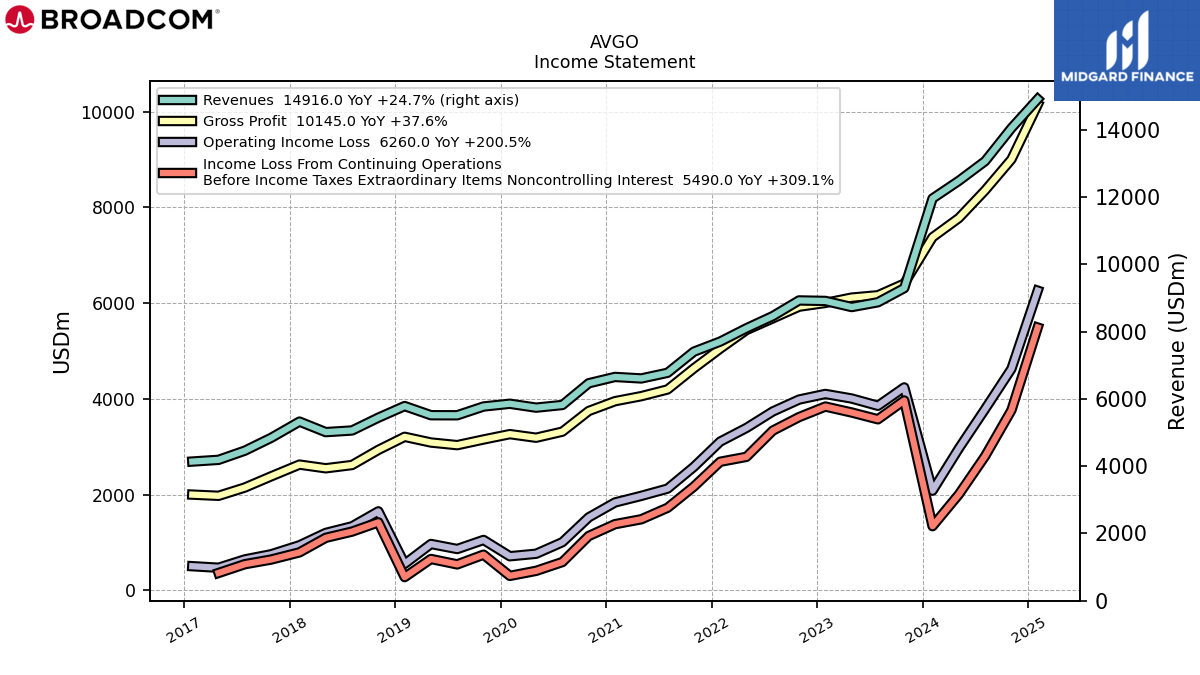 |
 |
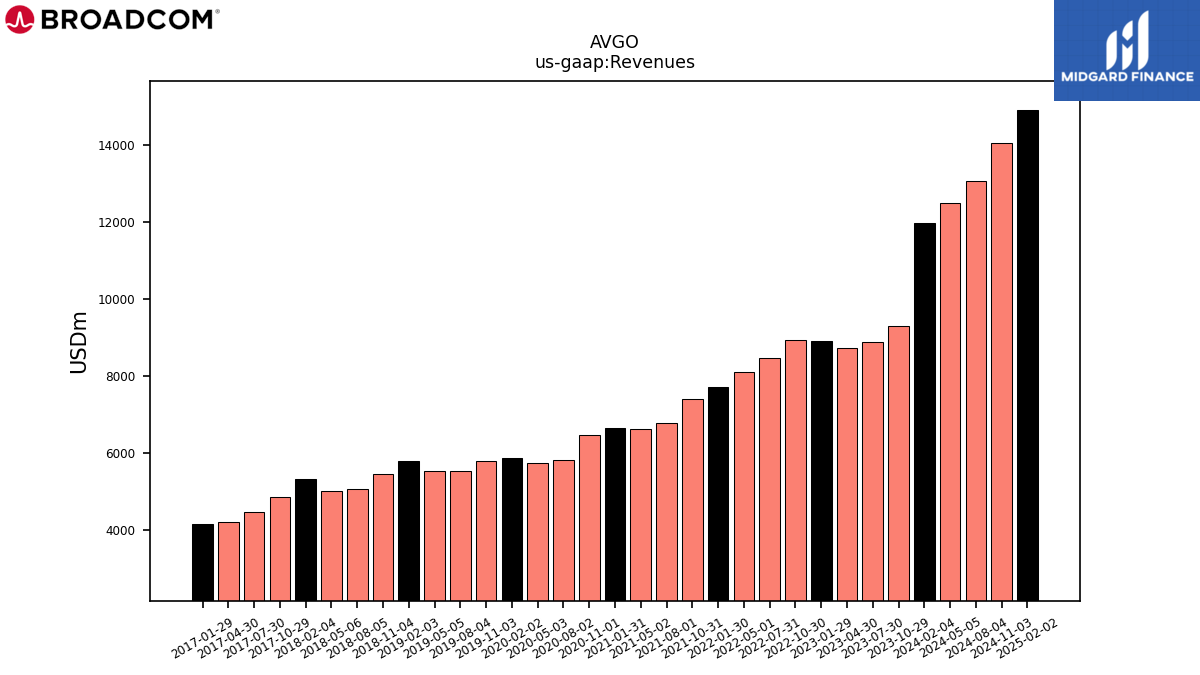 |
AVGO | 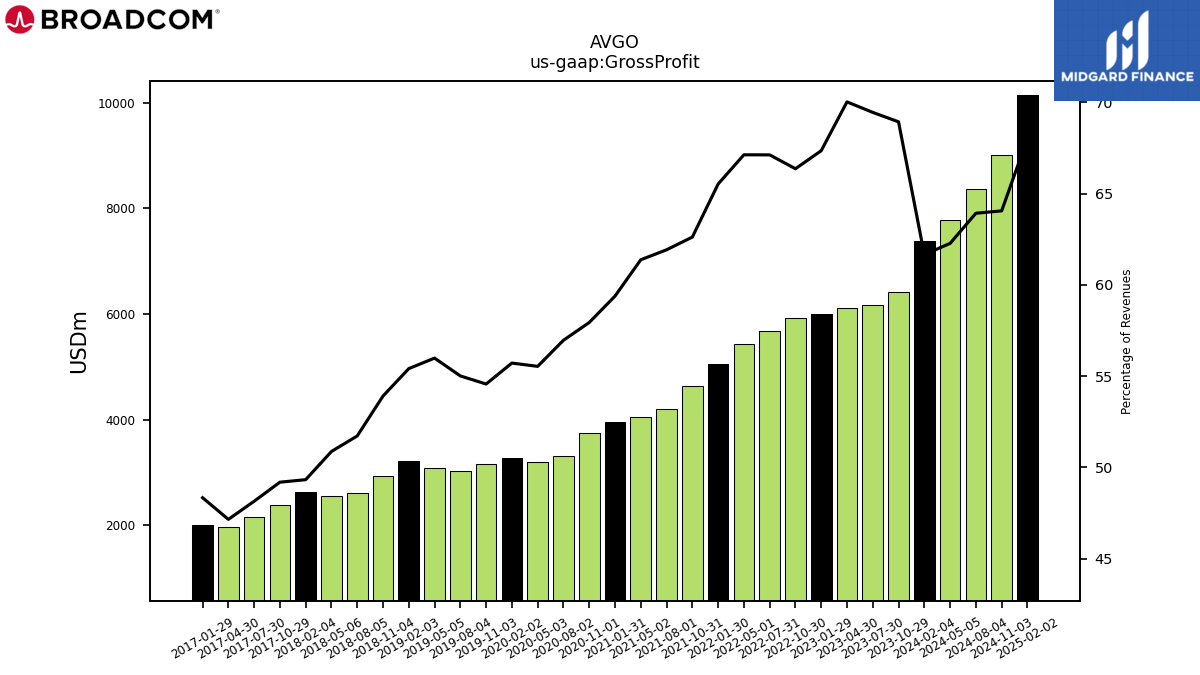 |
 |
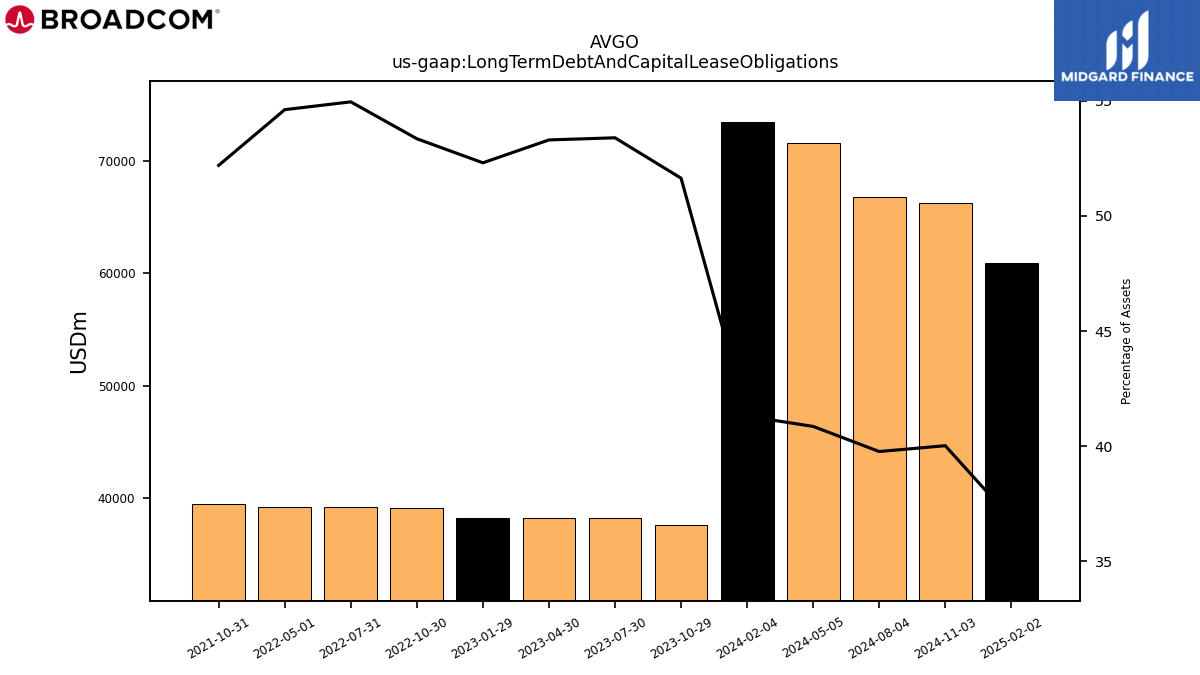 |
AVGO | 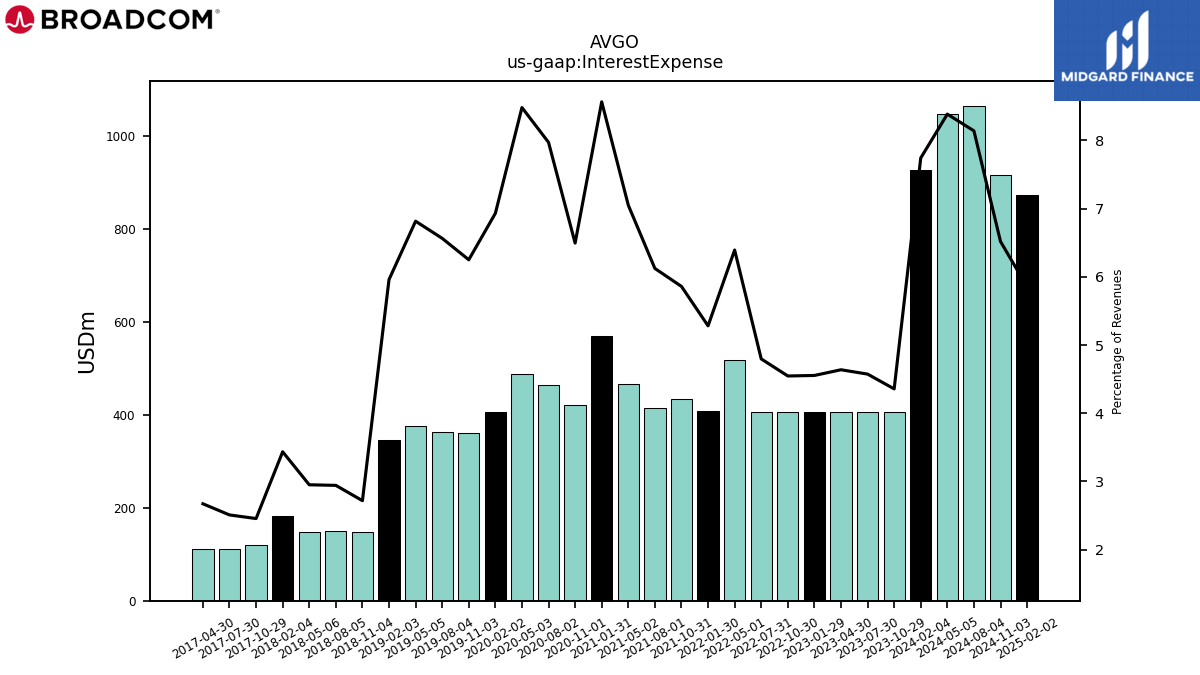 |
 |
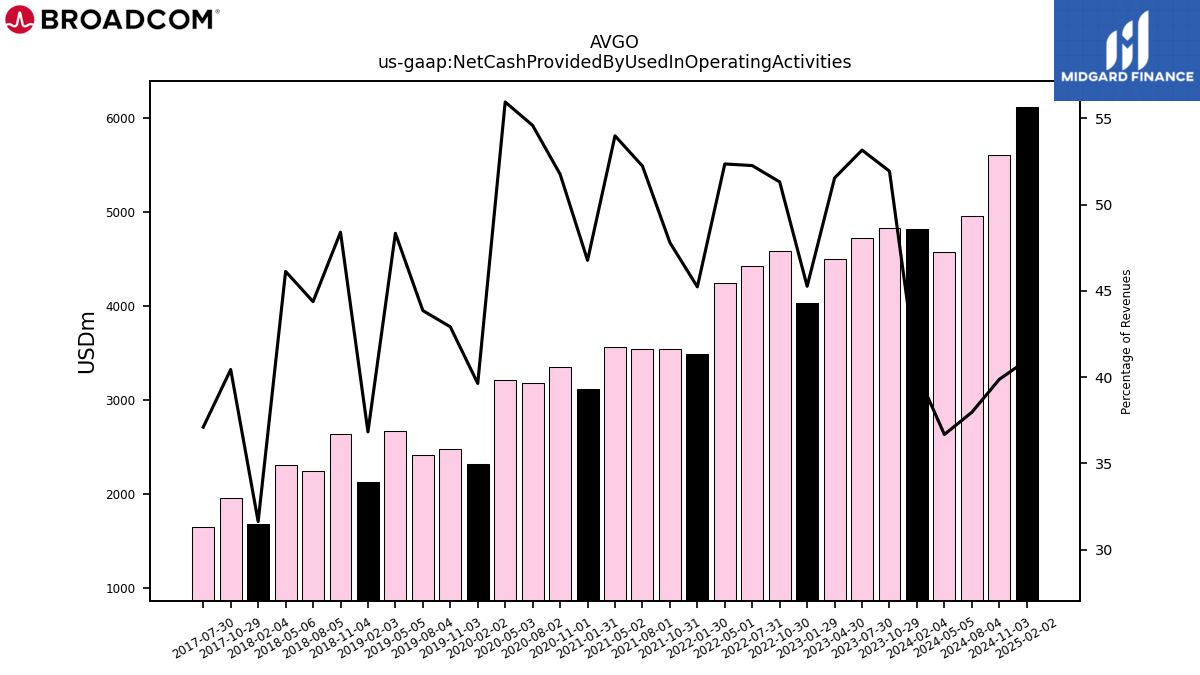 |
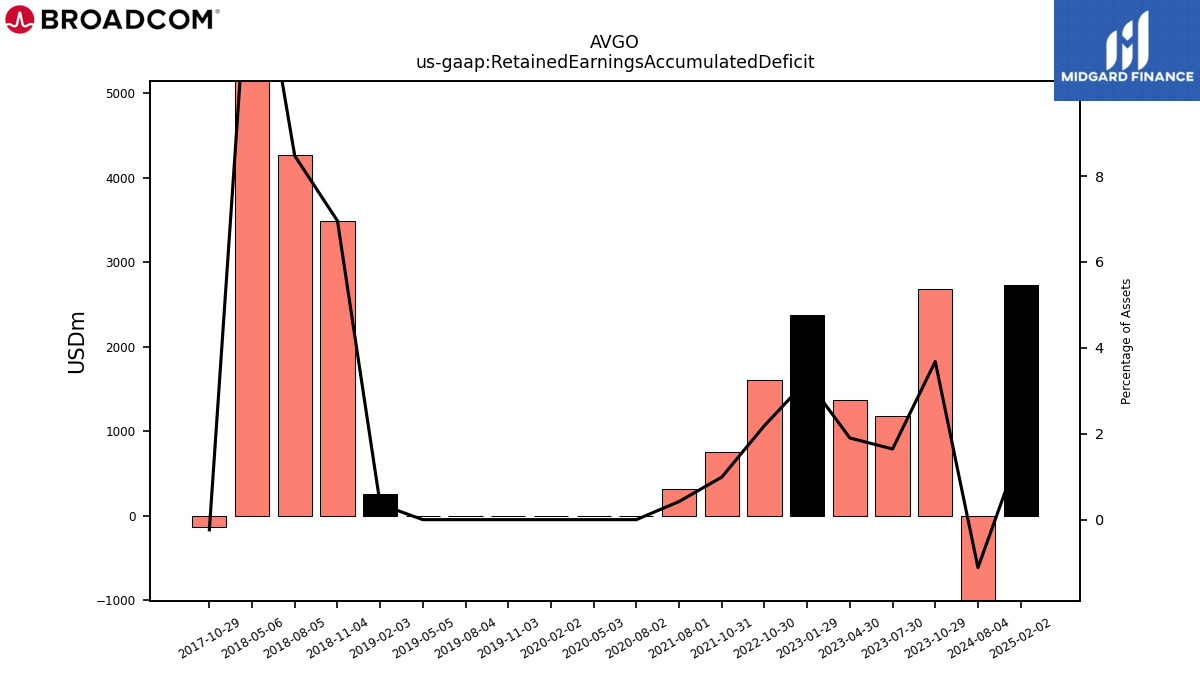
AVGO | 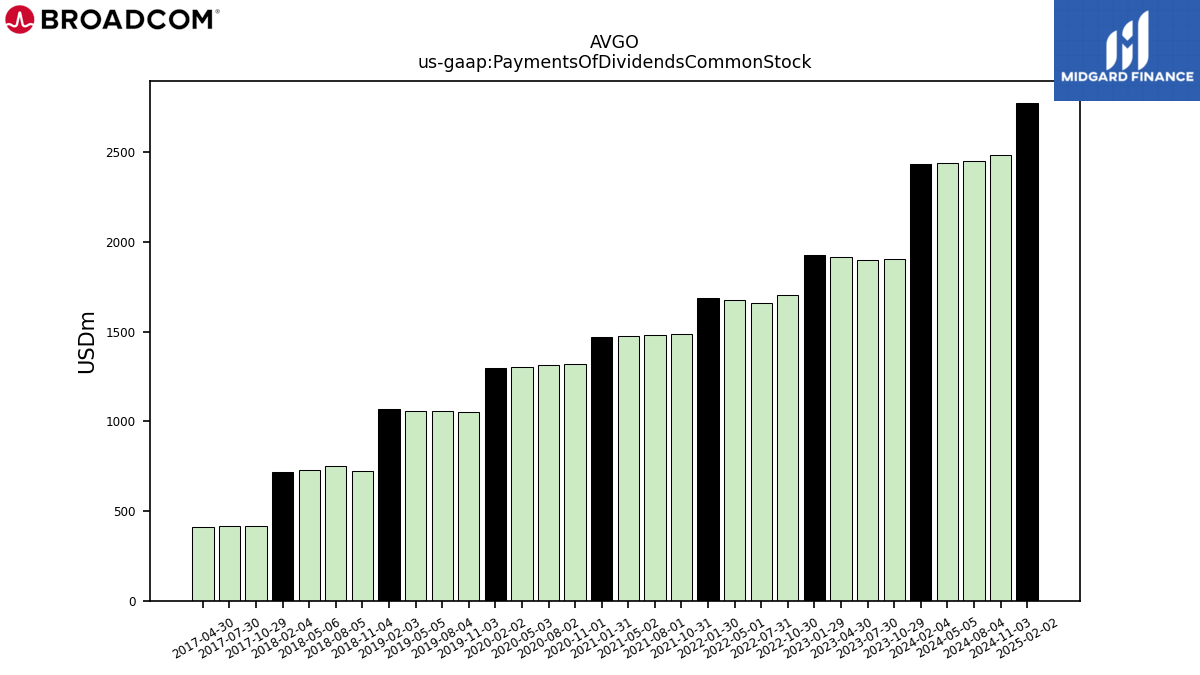 |
 |
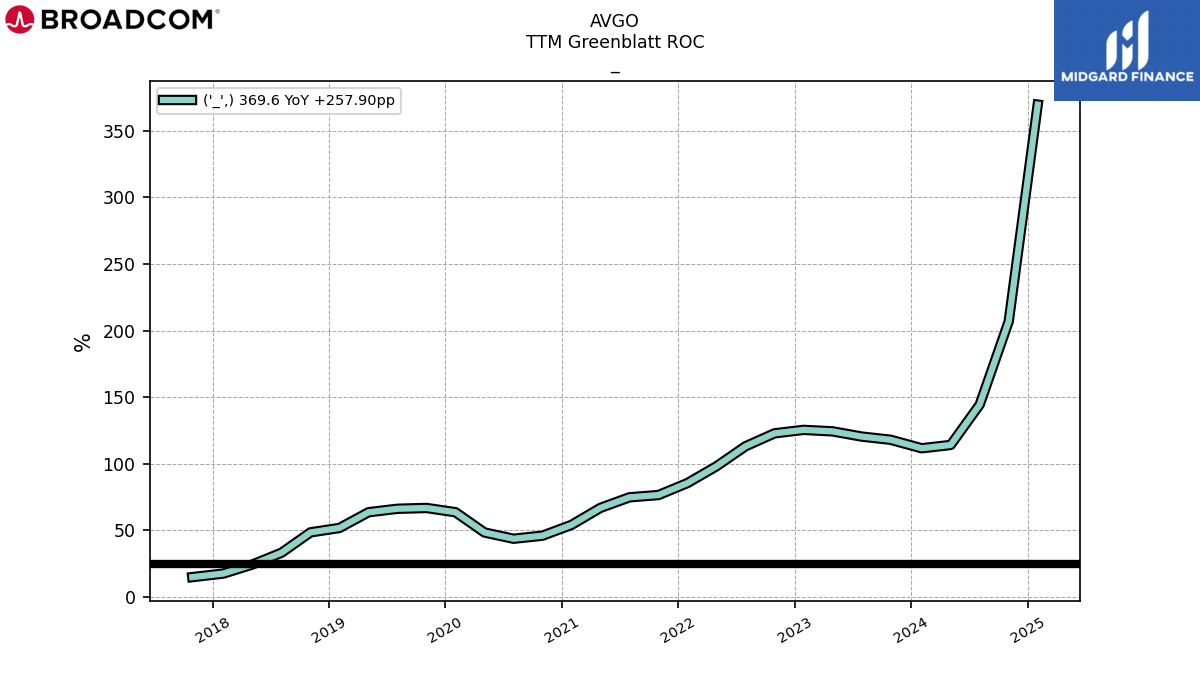 |
AVGO | |||
| Ticker | 10K | 10Q | 8K | Sector | Industry | Logo | Forward P/E | Revenue Growth | Ticker | Income | EPS | Revenues | Ticker | GrossProfit | OperatingIncome | LongTermDebt | Ticker | InterestExpense | RetainedEarnnings | CashFlowOperating | Ticker | Dividends | SharesOutstanding | TTMGreenblattROC | |
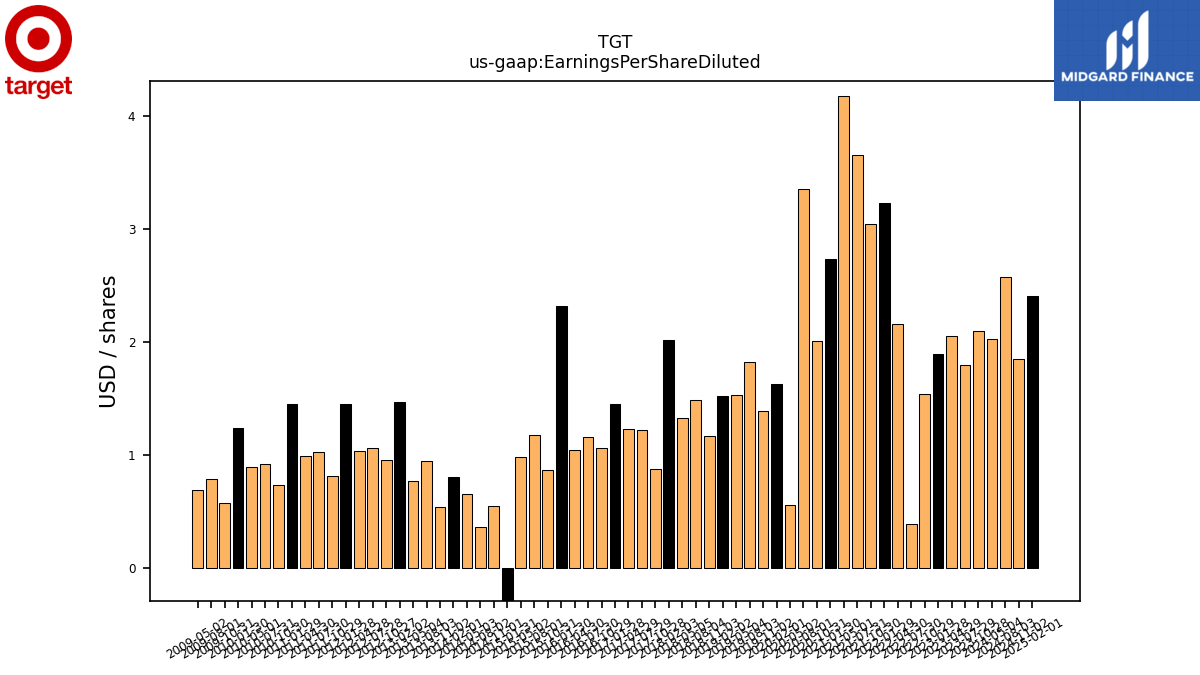
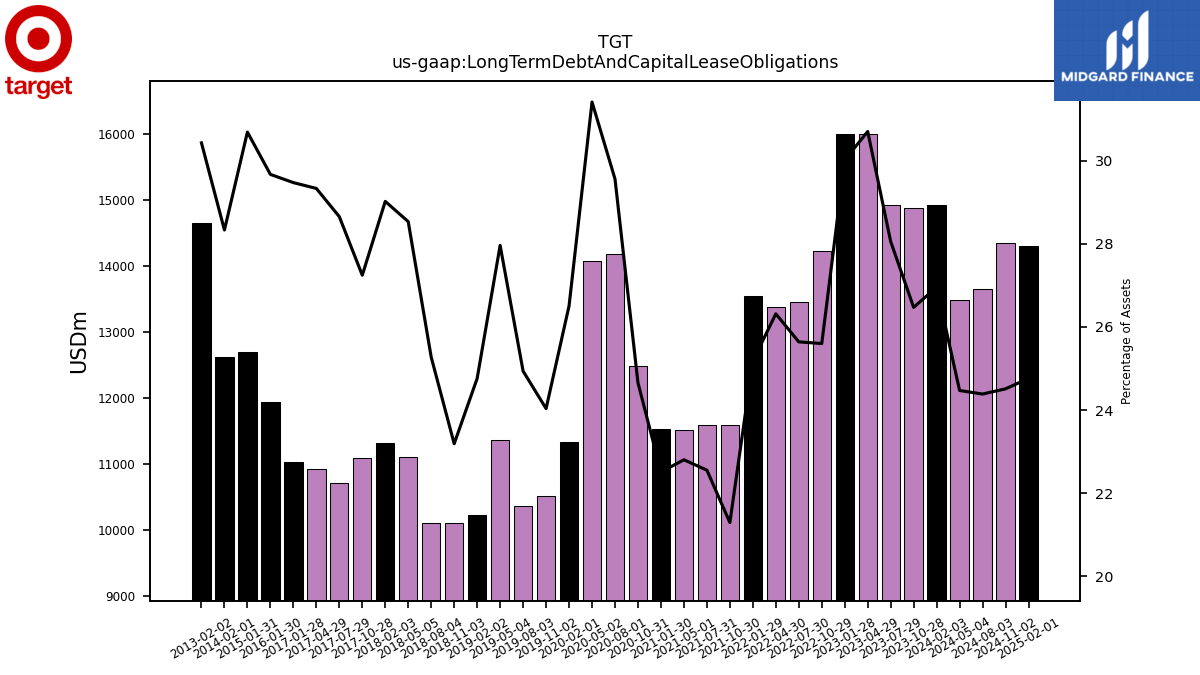
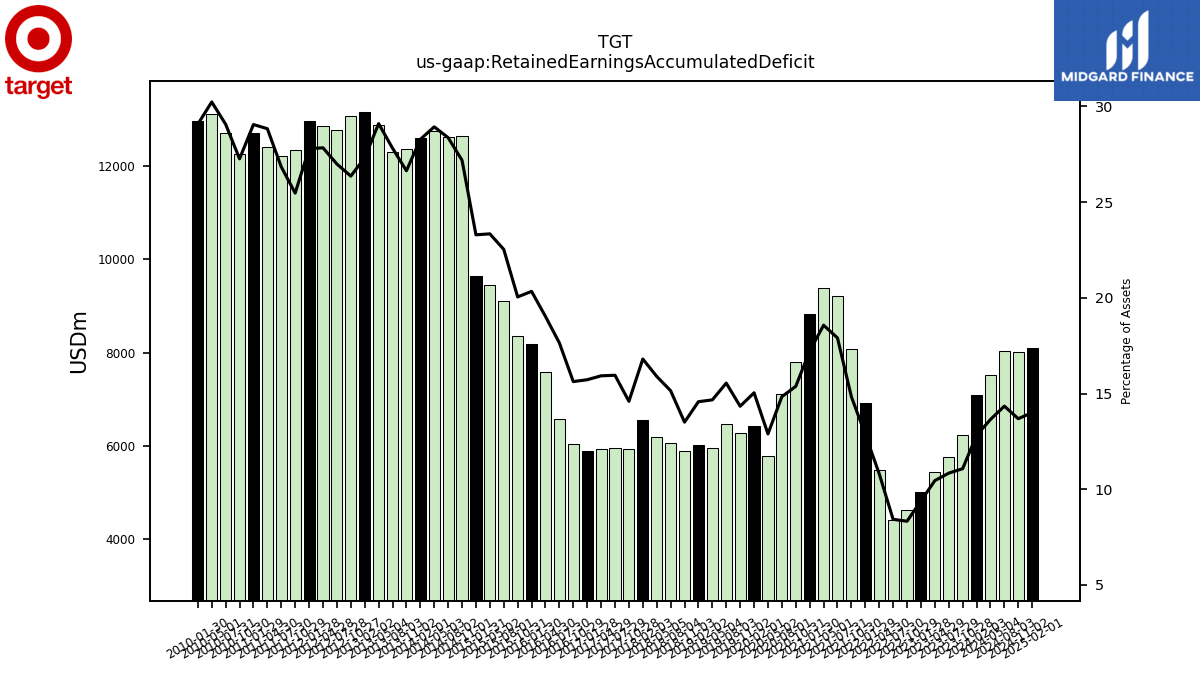
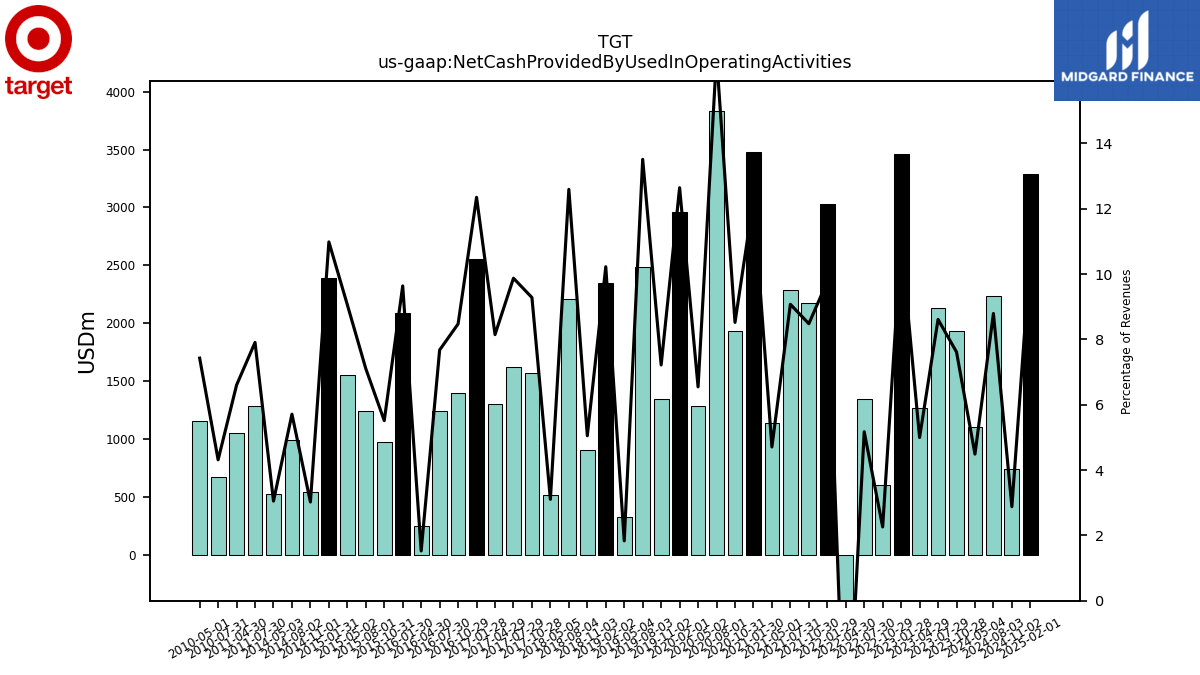
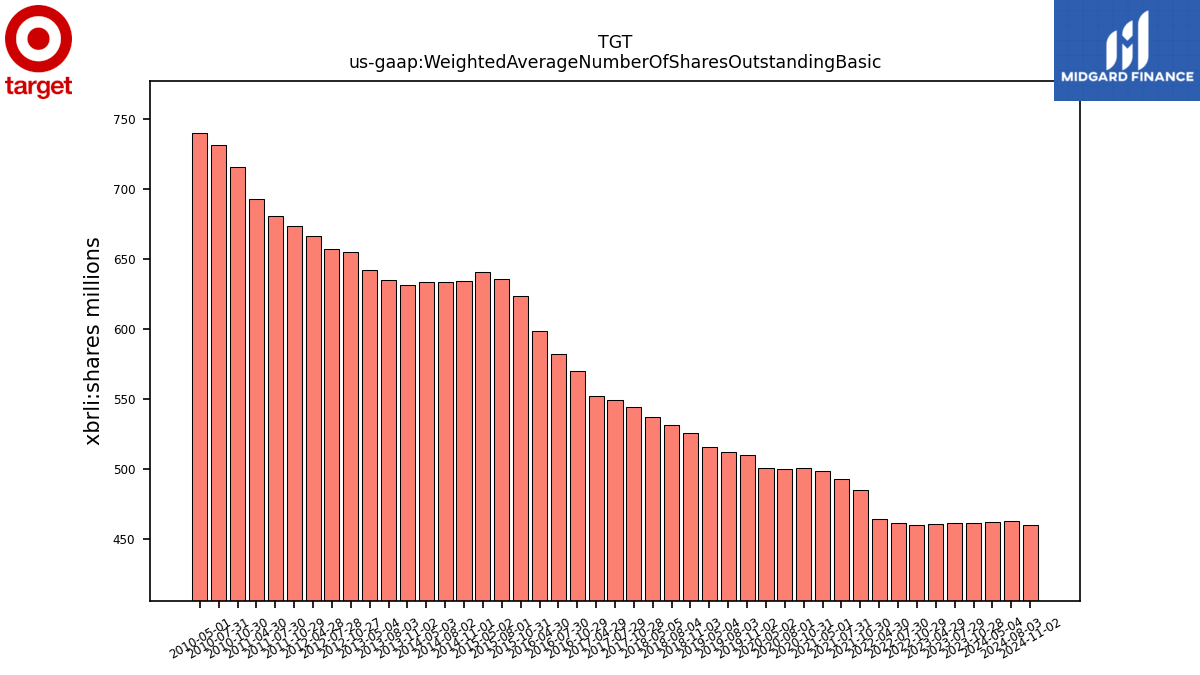
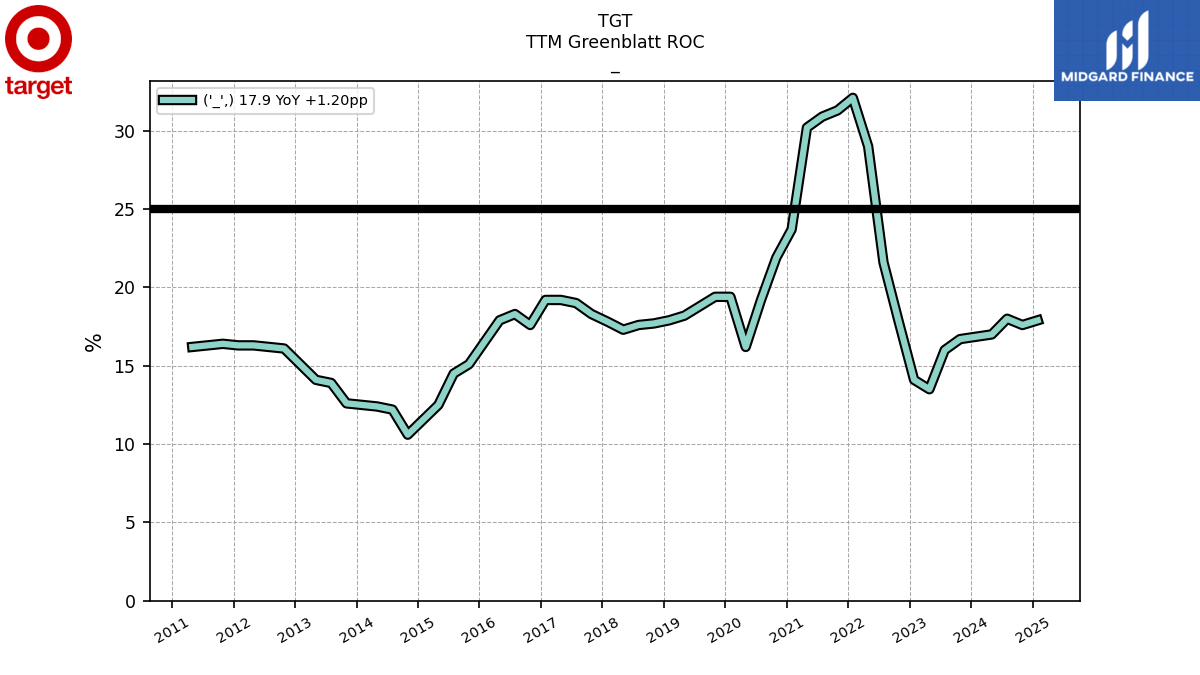
| $TGT$ | 2025-03-12 | 2024-11-27 | 2025-03-04 |  |
NA | NA | TGT | 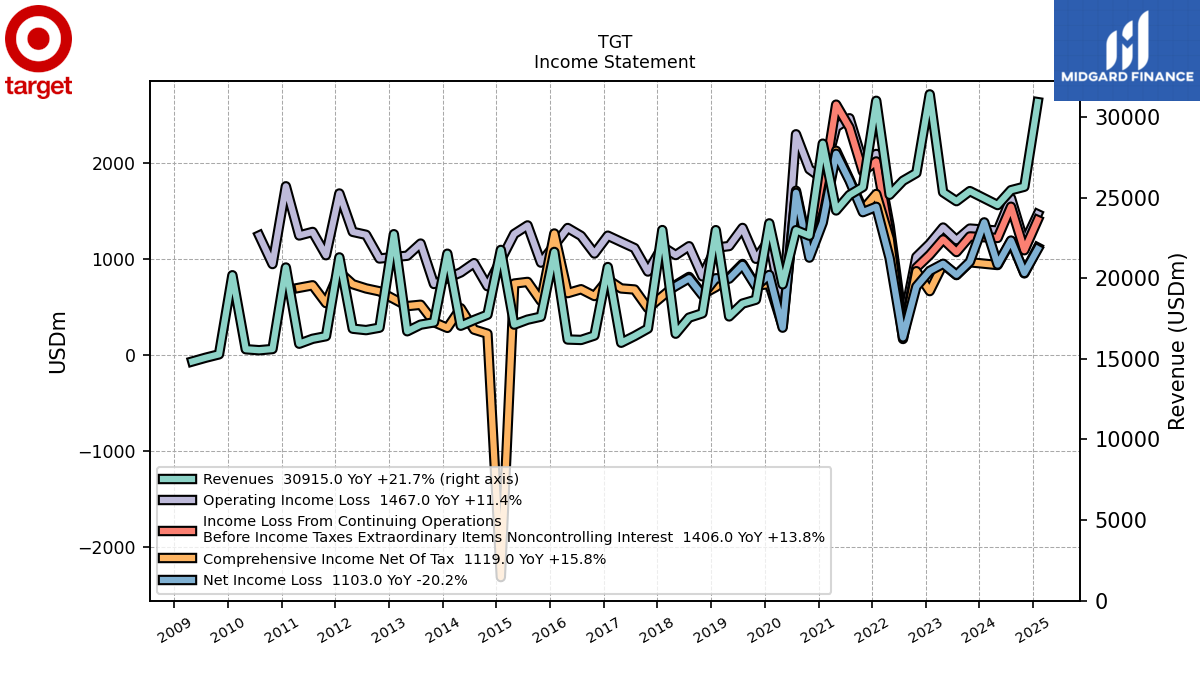 |
 |
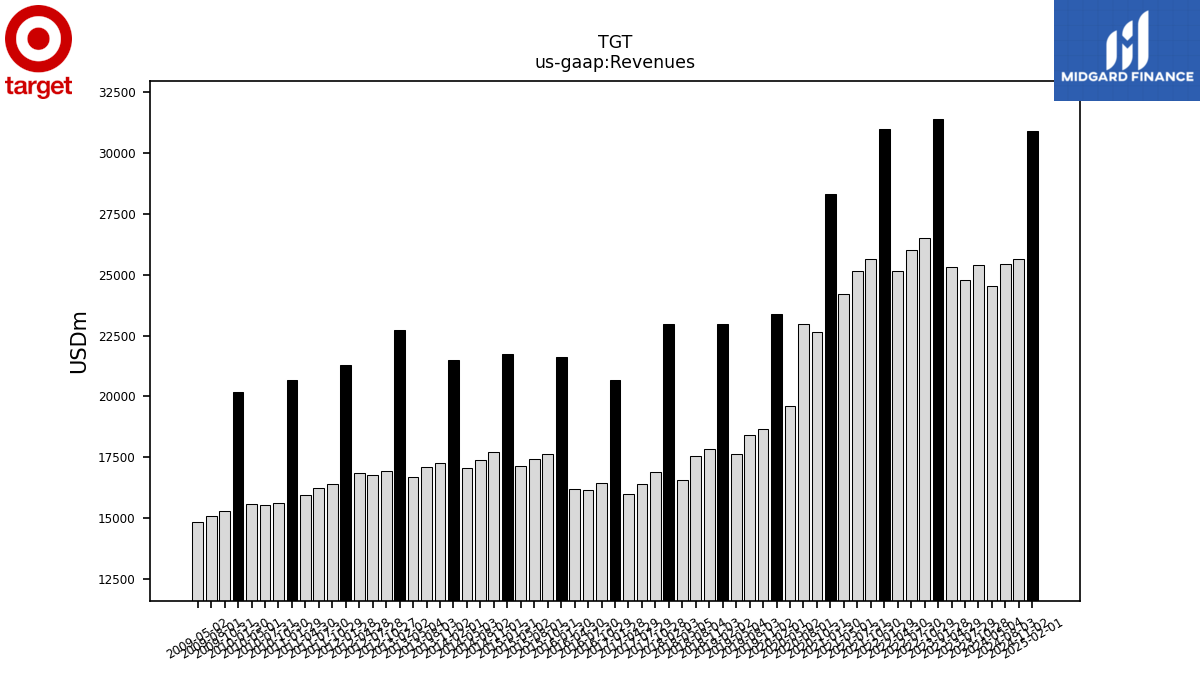 |
TGT | 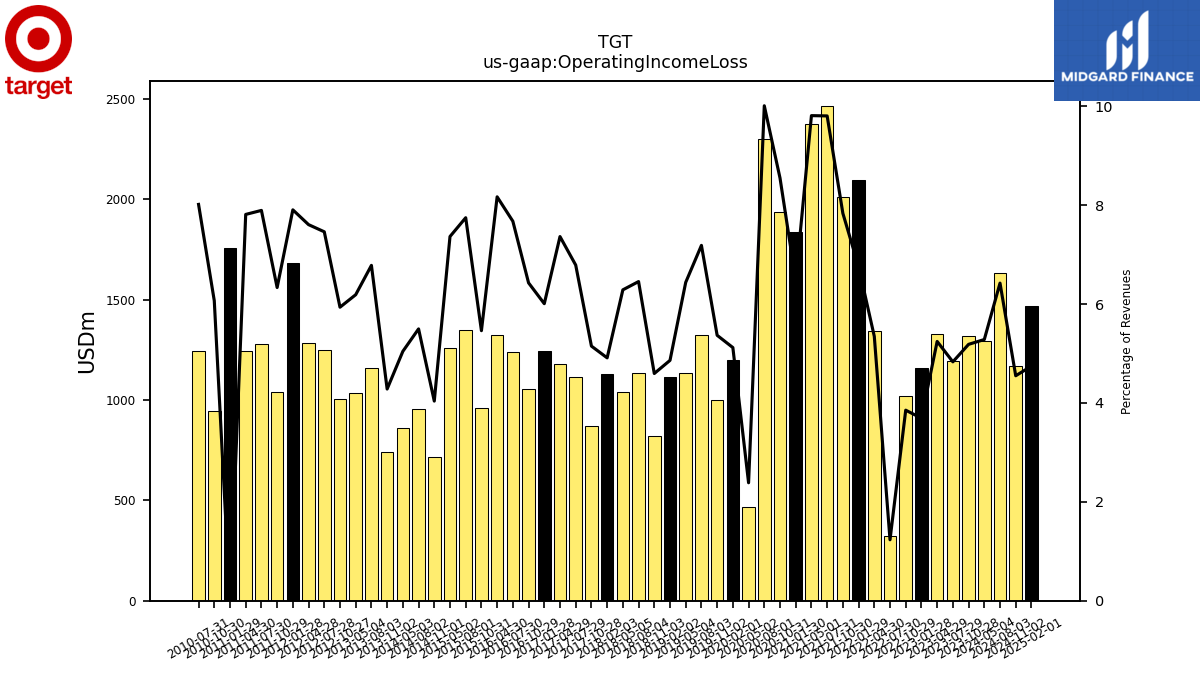 |
 |
TGT | 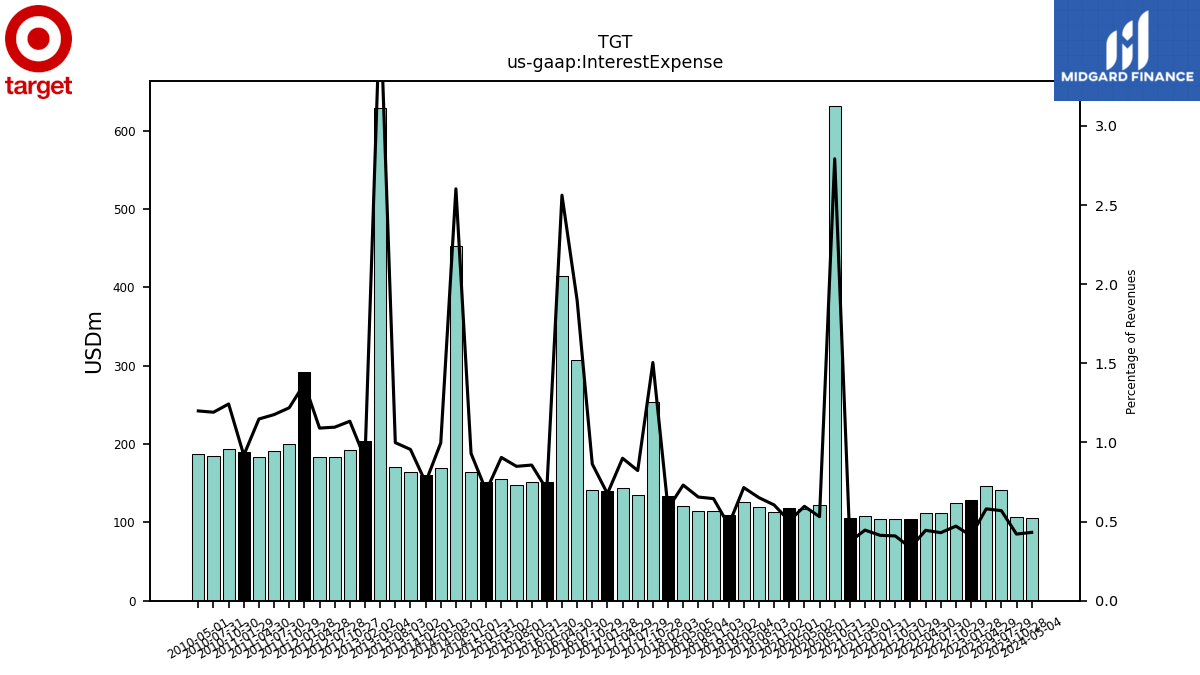 |
 |
 |
TGT | 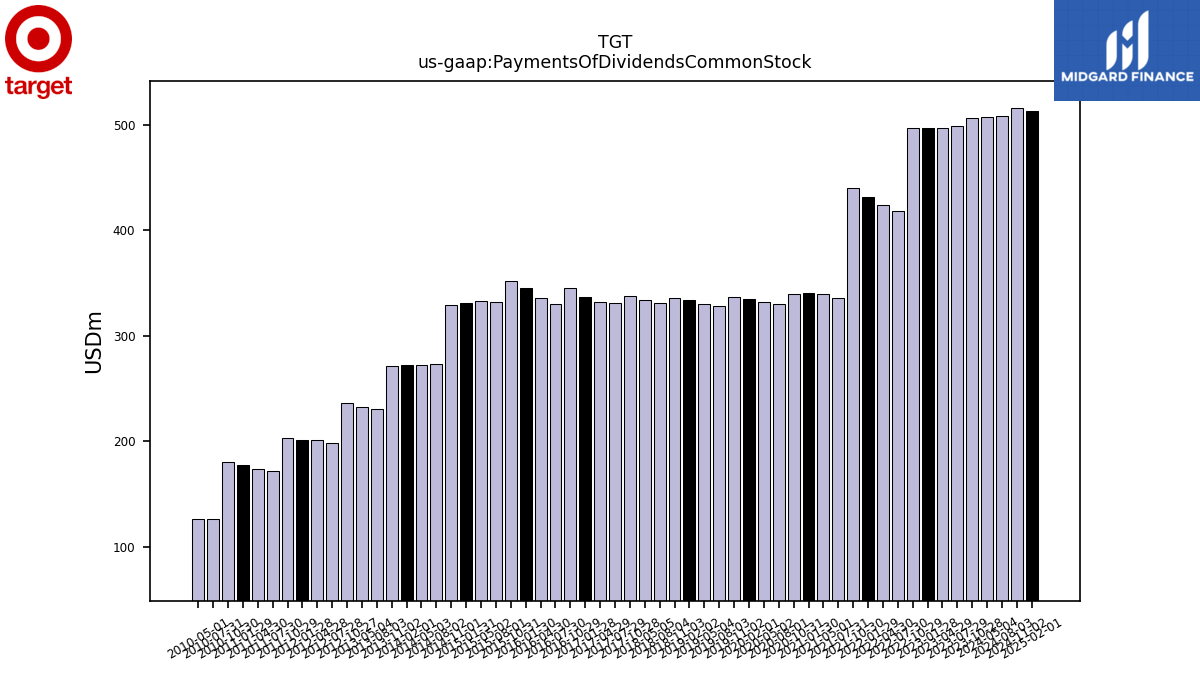 |
 |
 |
TGT | |||
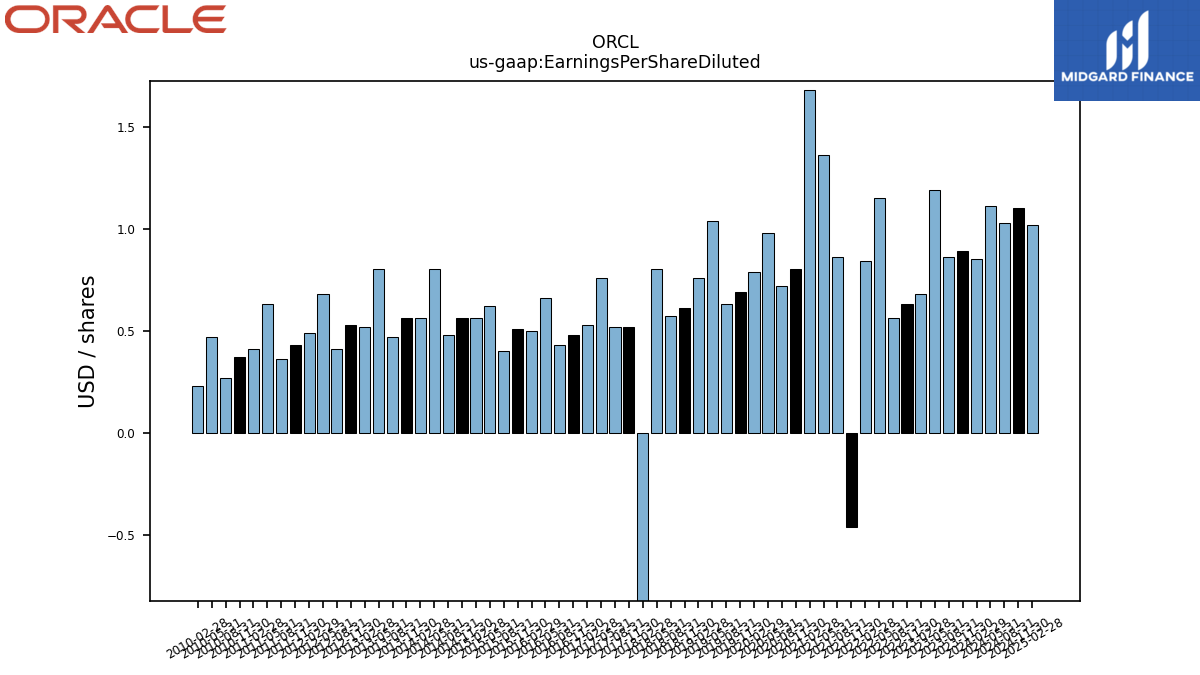
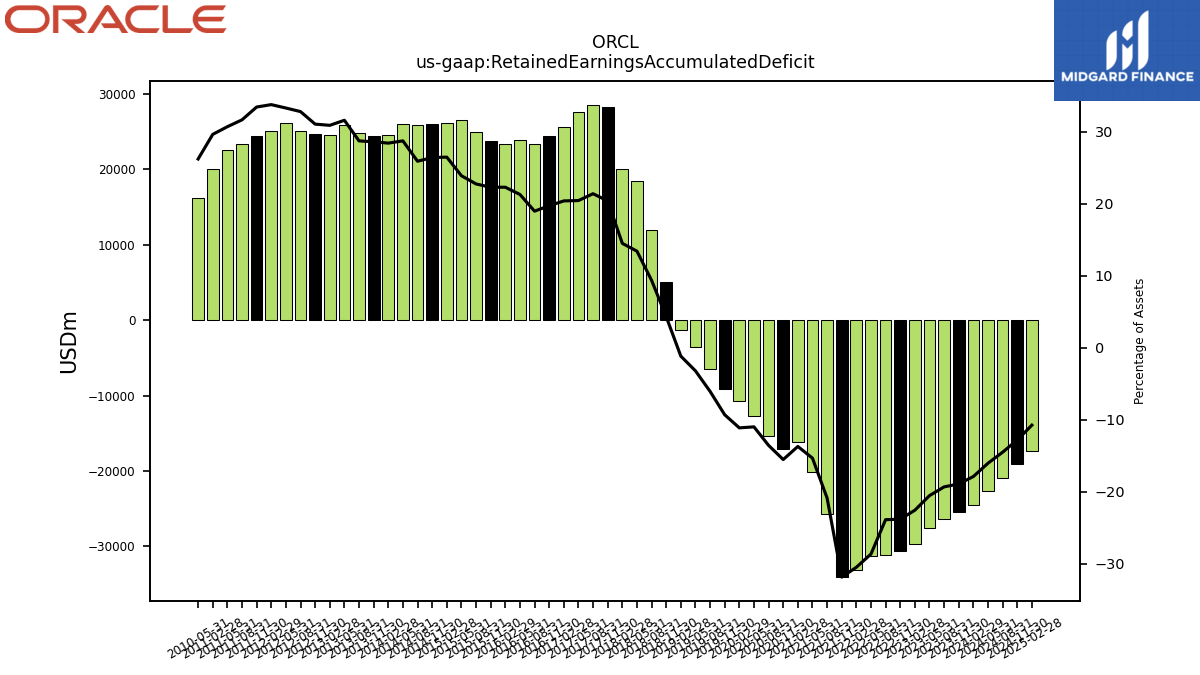
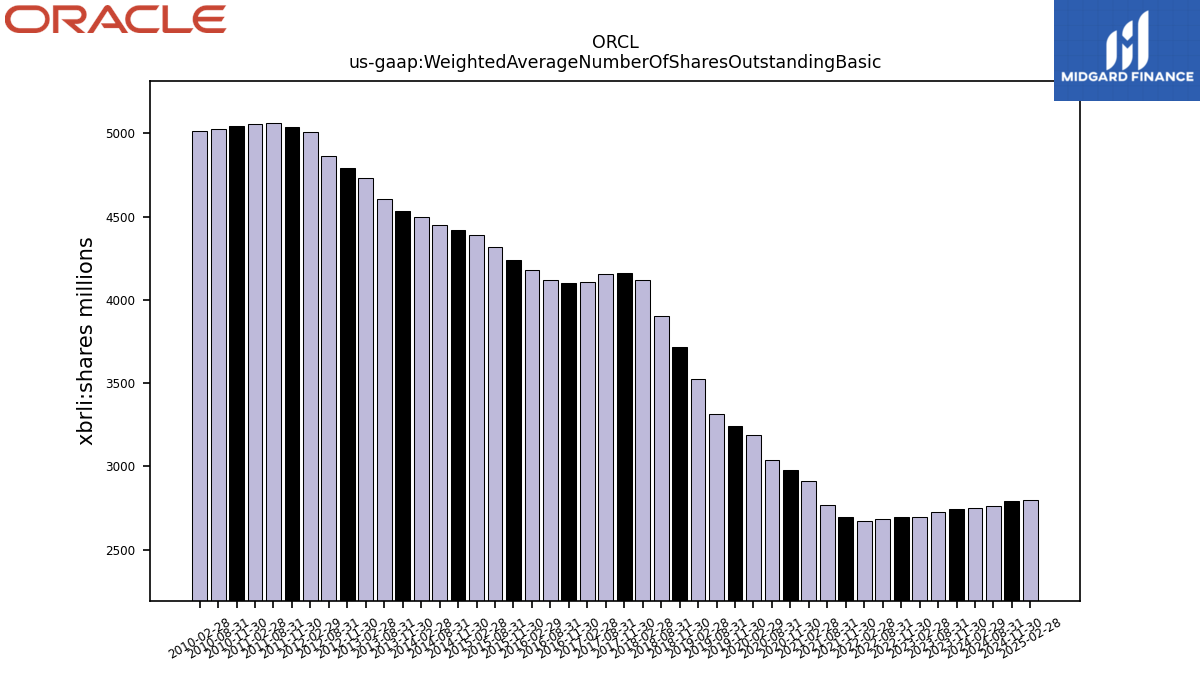
| $ORCL$ | 2024-06-20 | 2025-03-11 | 2025-03-10 | NA | NA | ORCL | 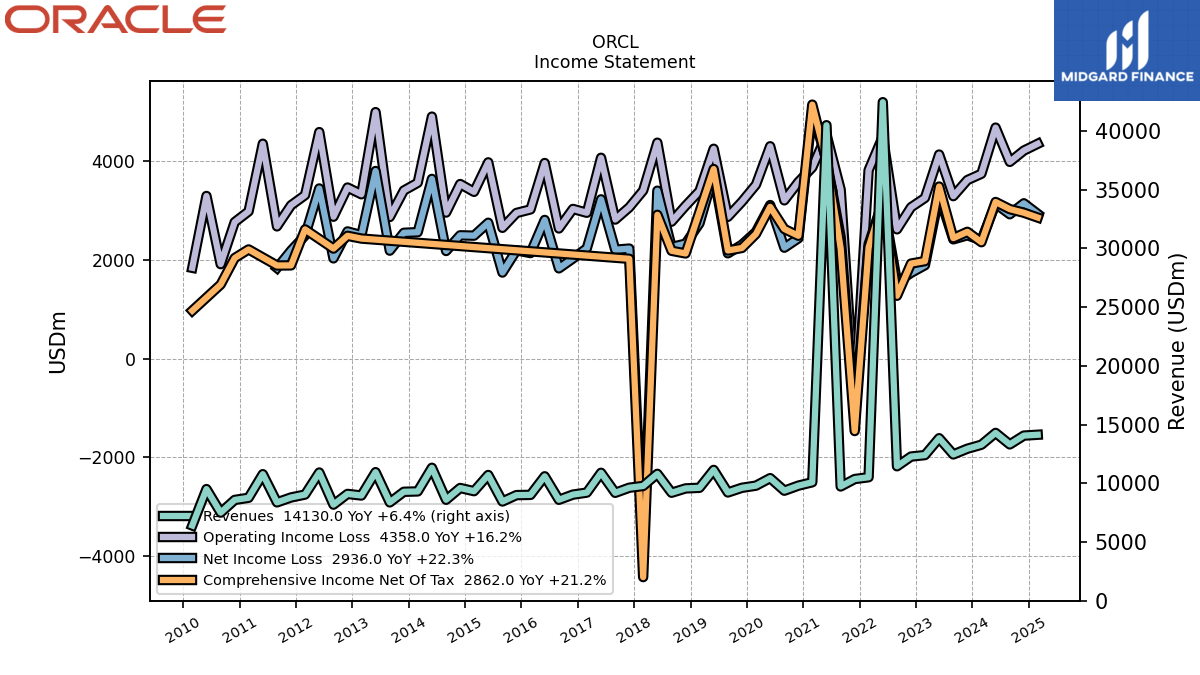 |
 |
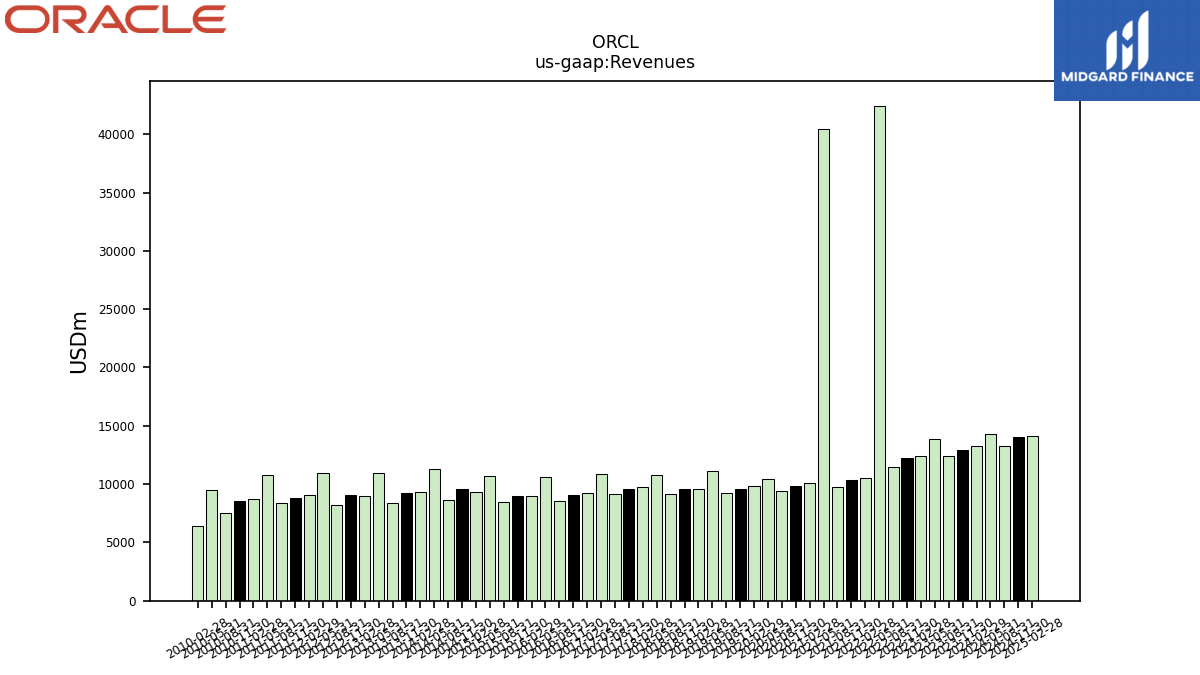 |
ORCL | 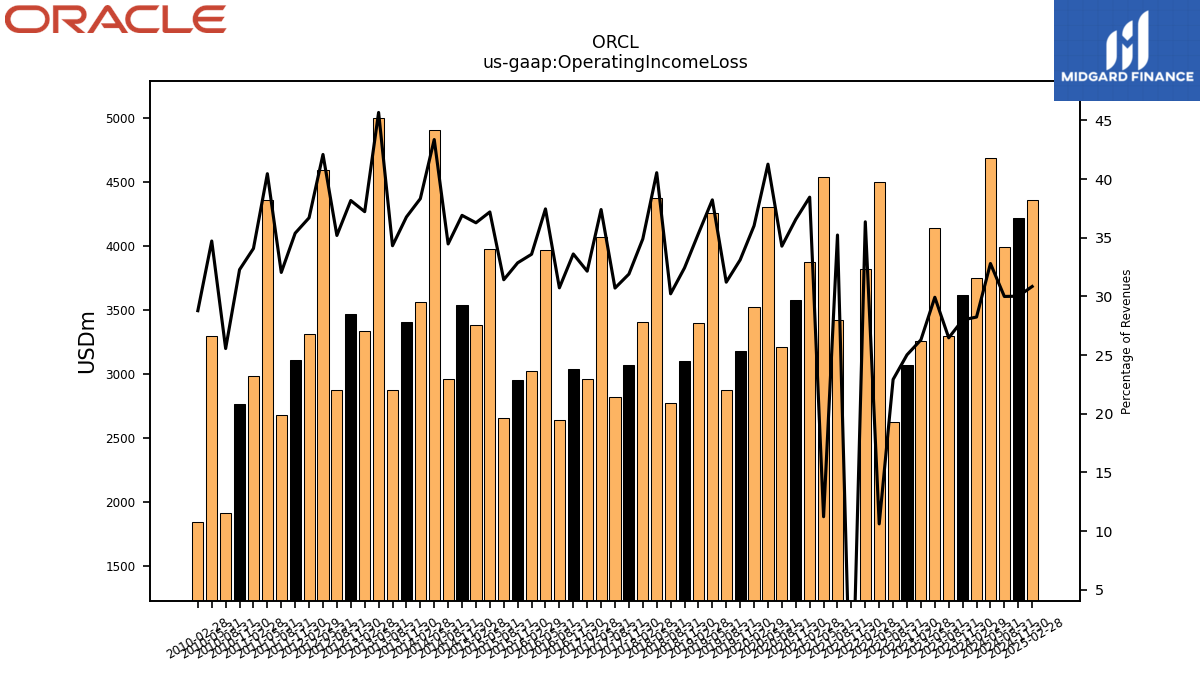 |
ORCL | 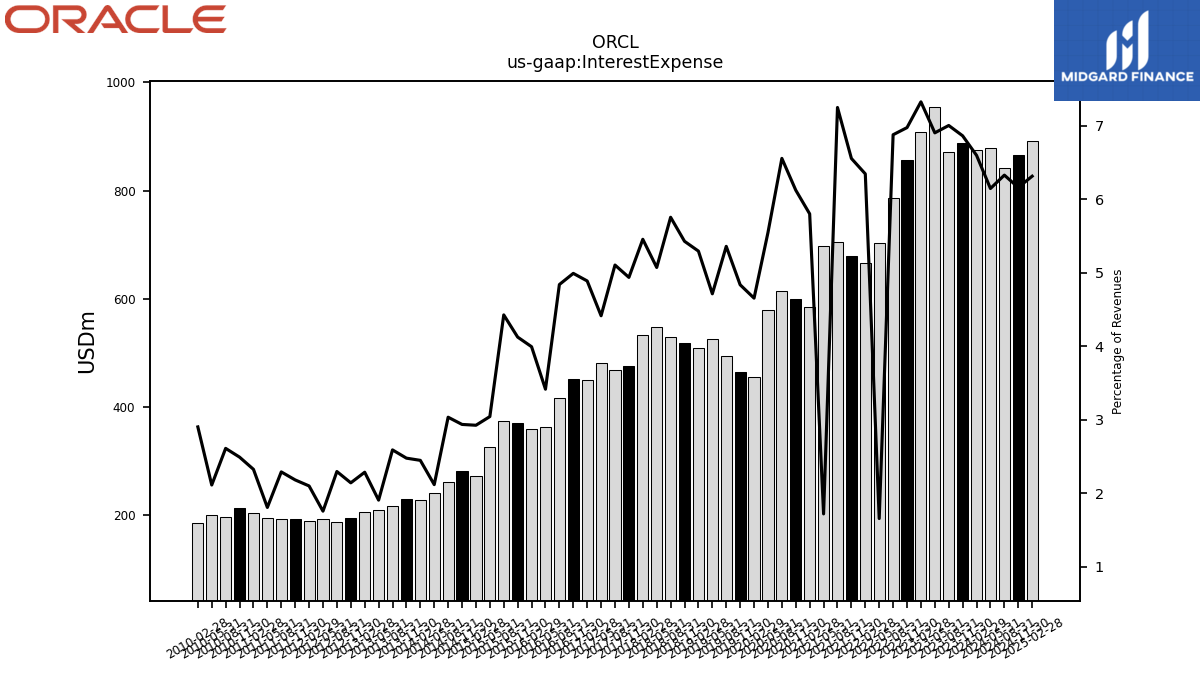 |
 |
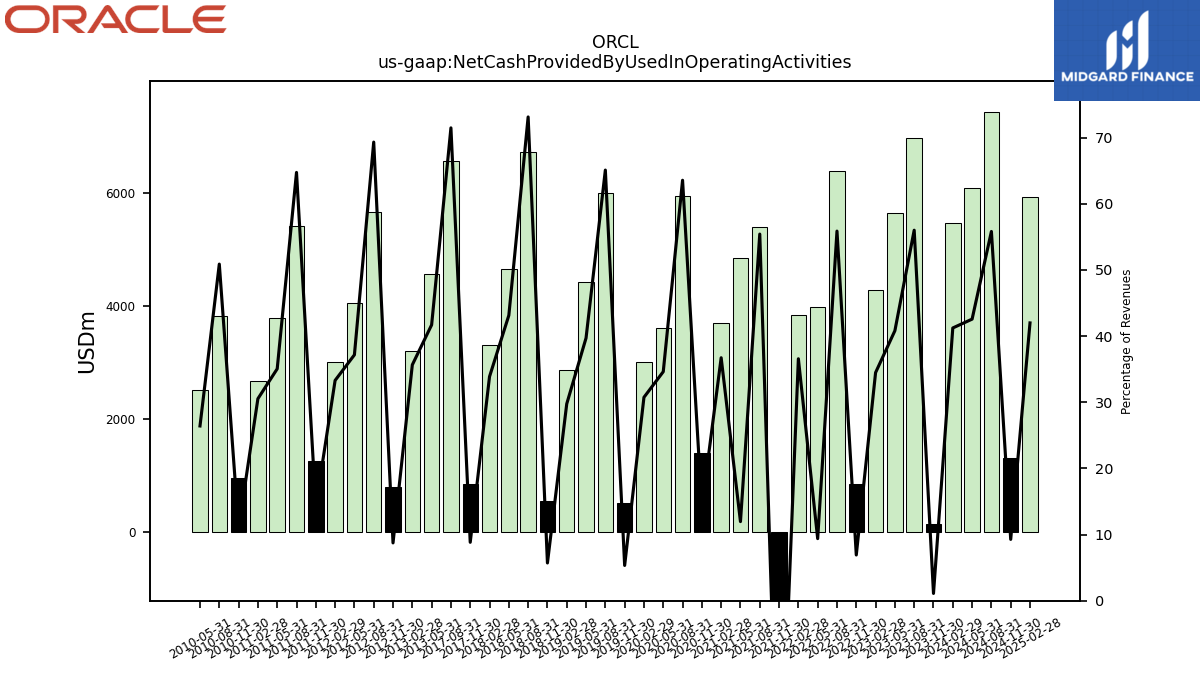 |
ORCL | 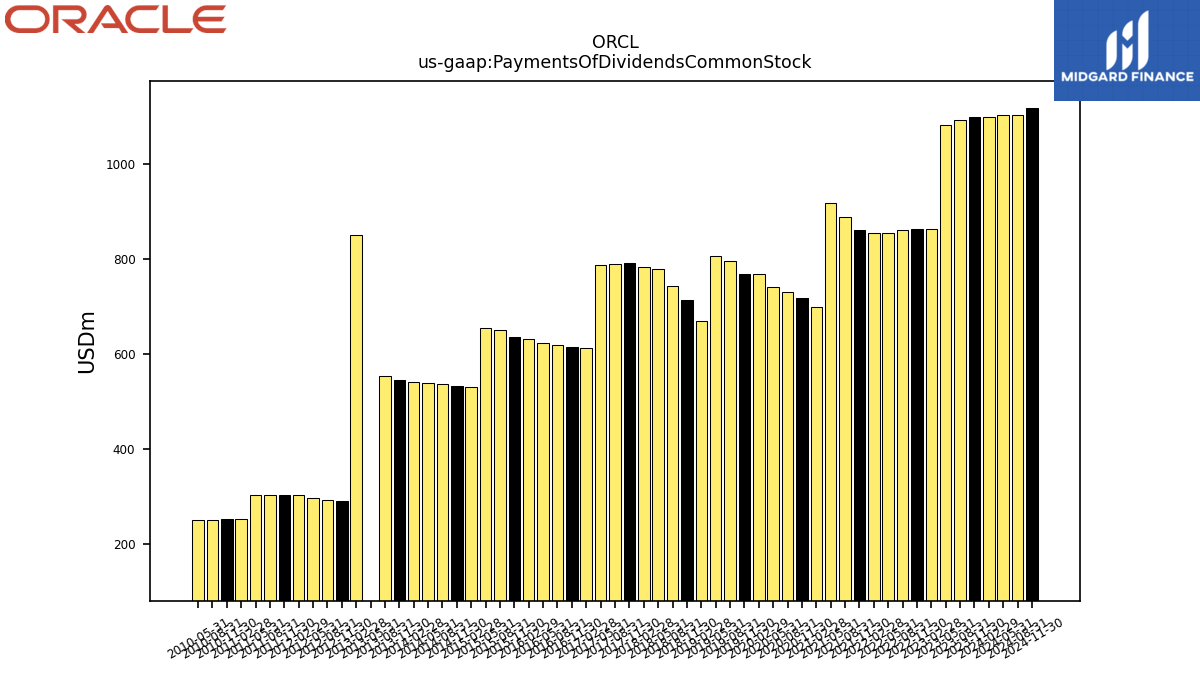 |
 |
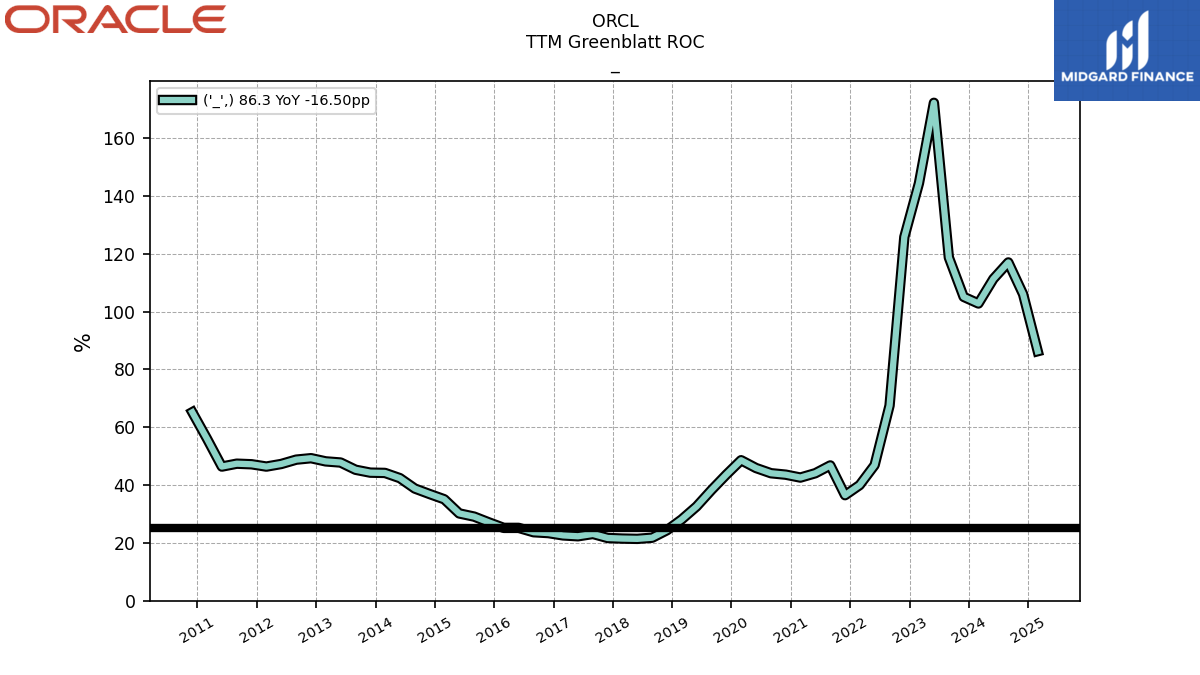 |
ORCL | |||||
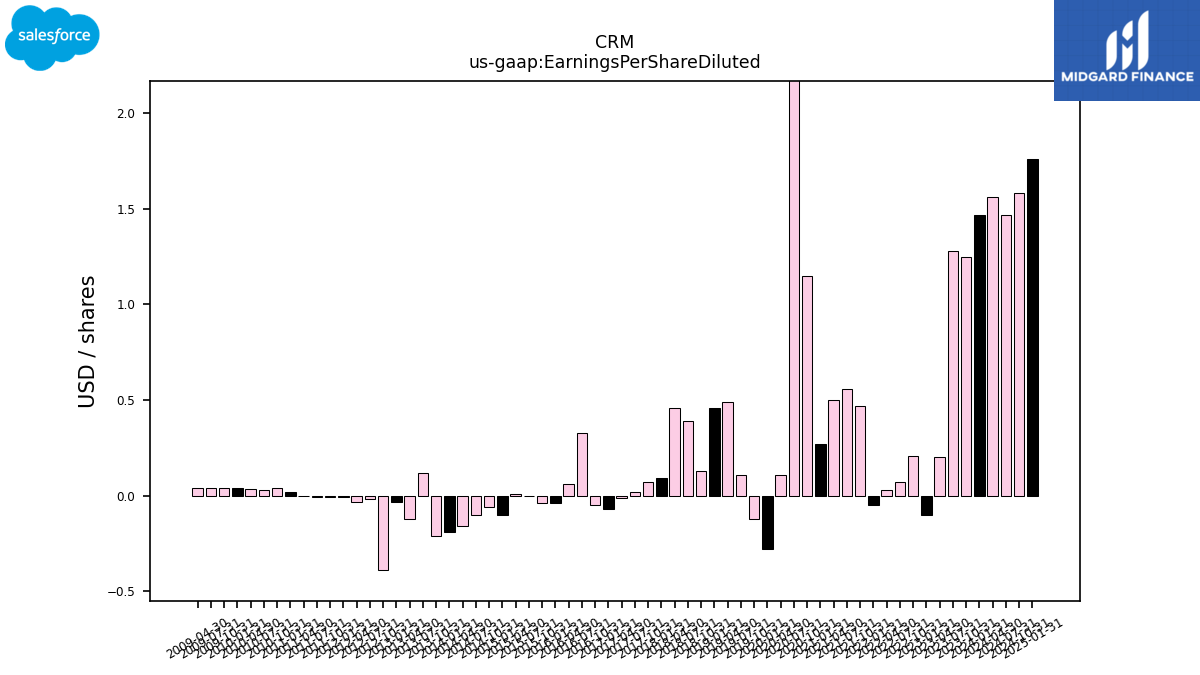
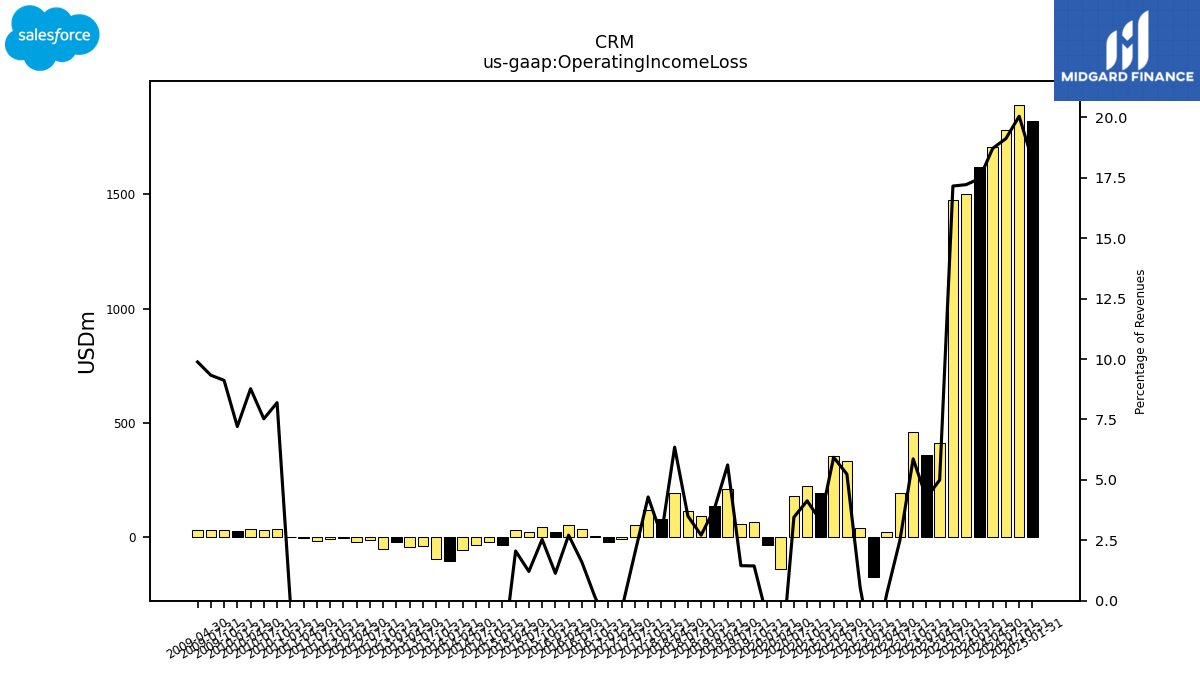
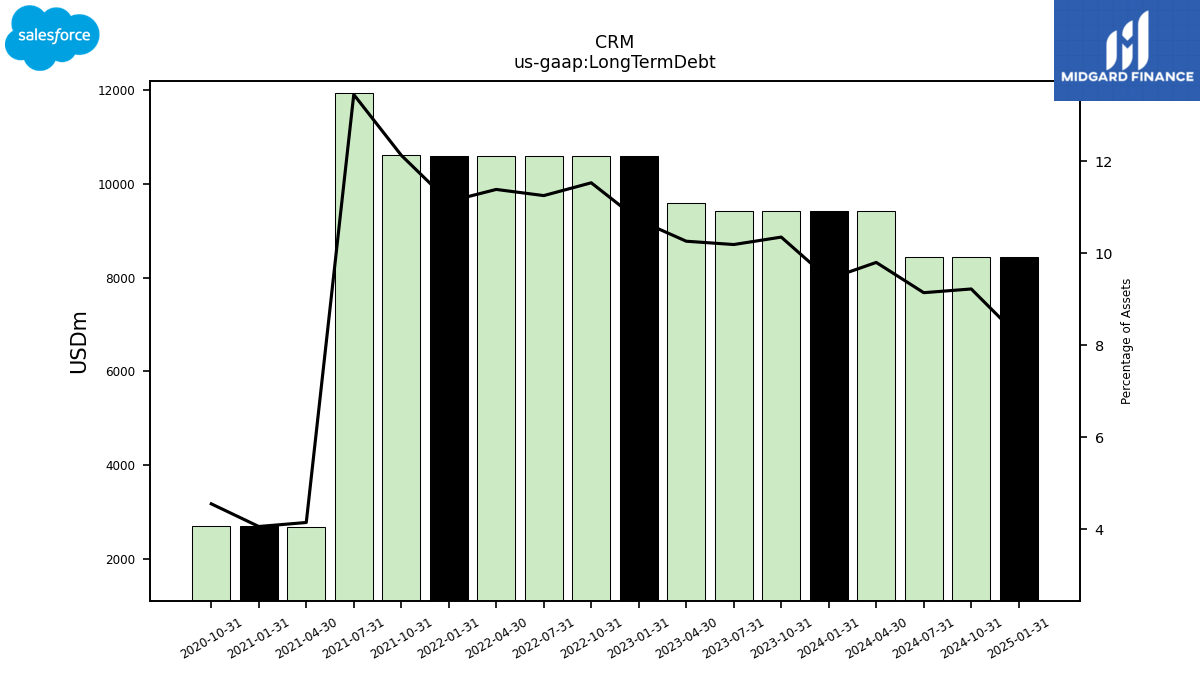
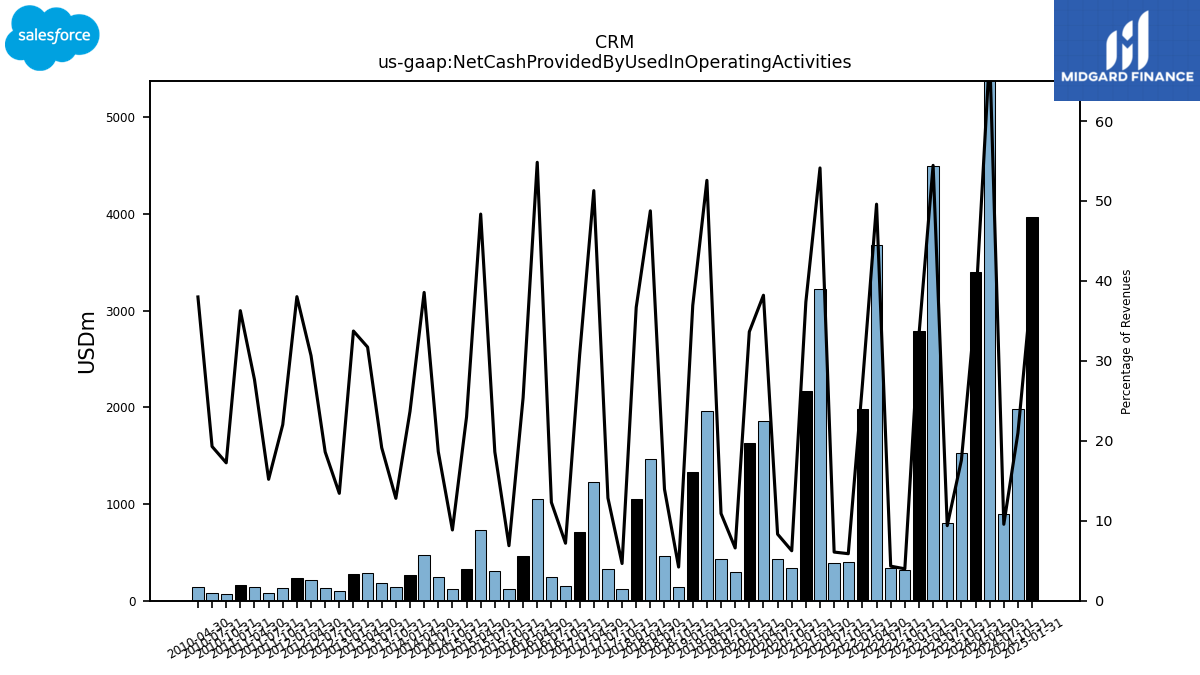
| $CRM$ | 2025-03-05 | 2024-12-04 | 2025-02-26 | Technology | Software—Application | NA | NA | CRM | 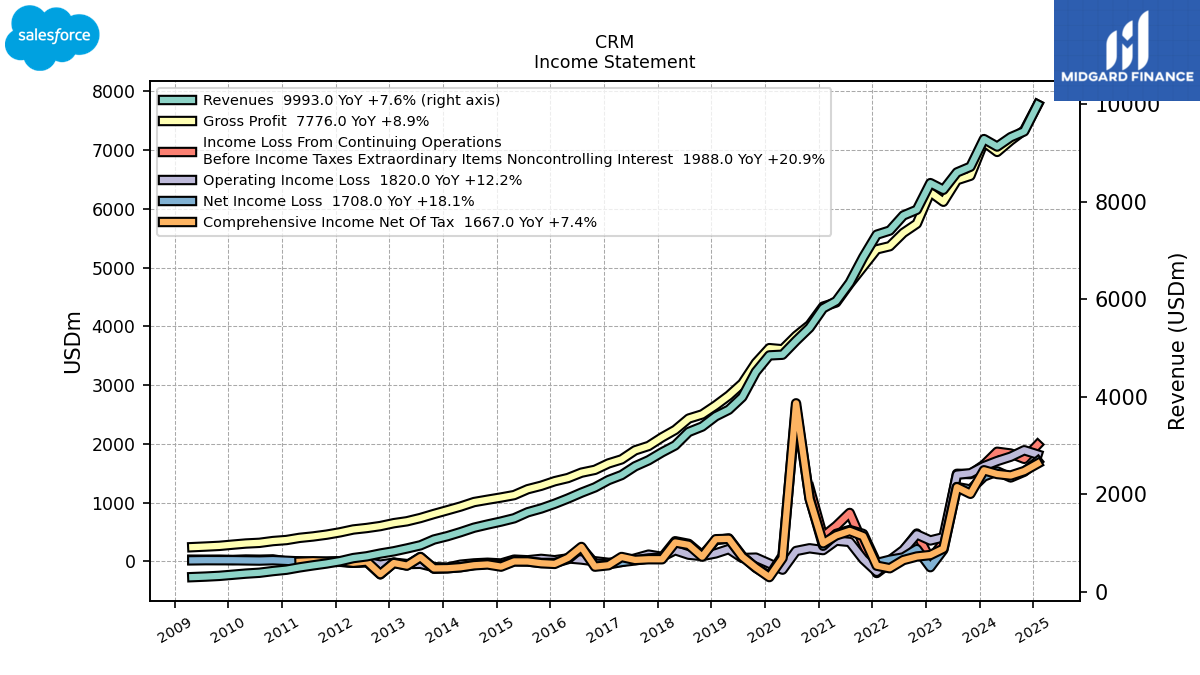 |
 |
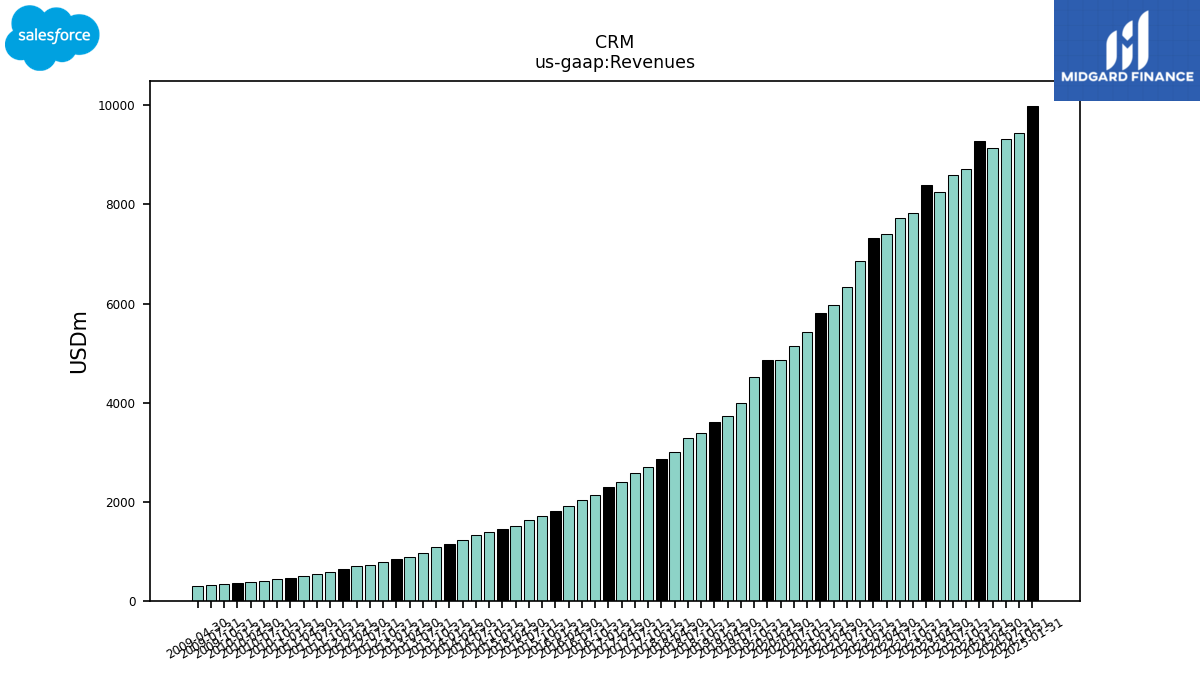 |
CRM | 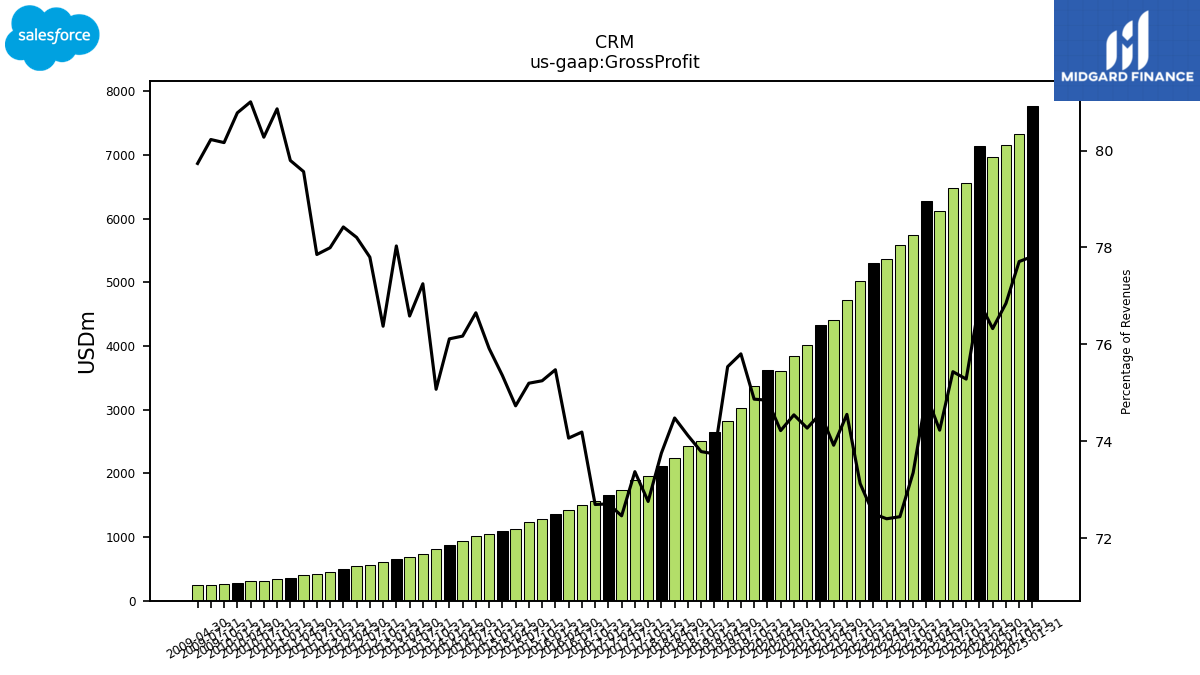 |
 |
 |
CRM | 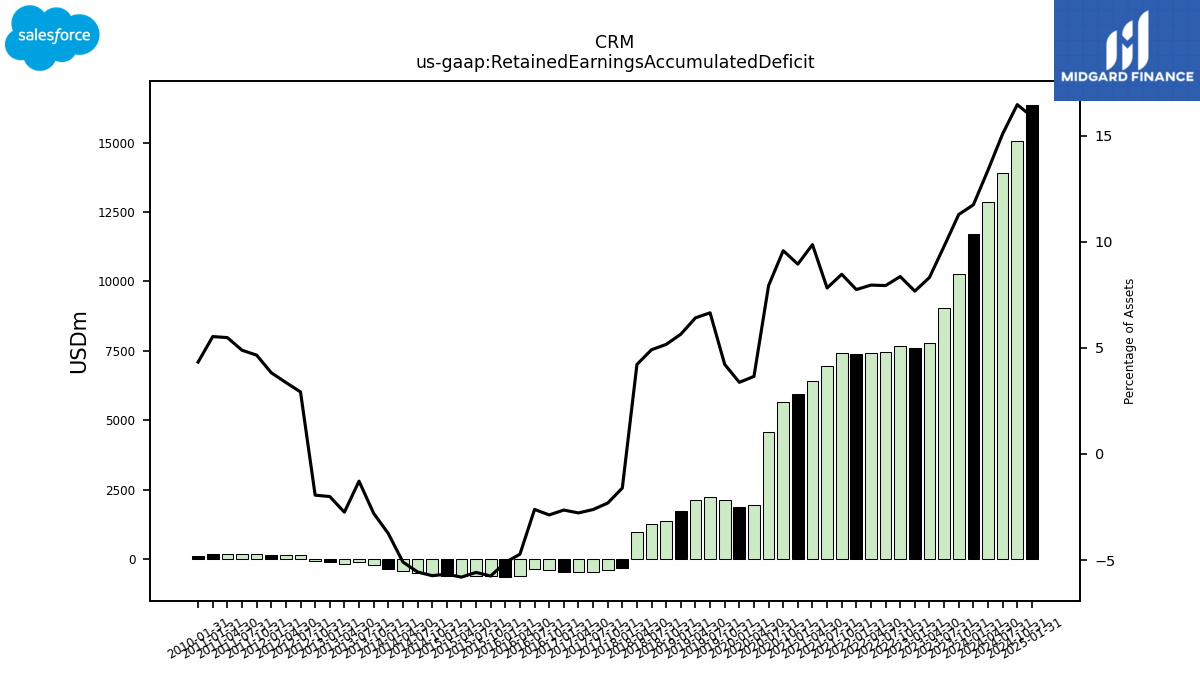 |
 |
CRM | 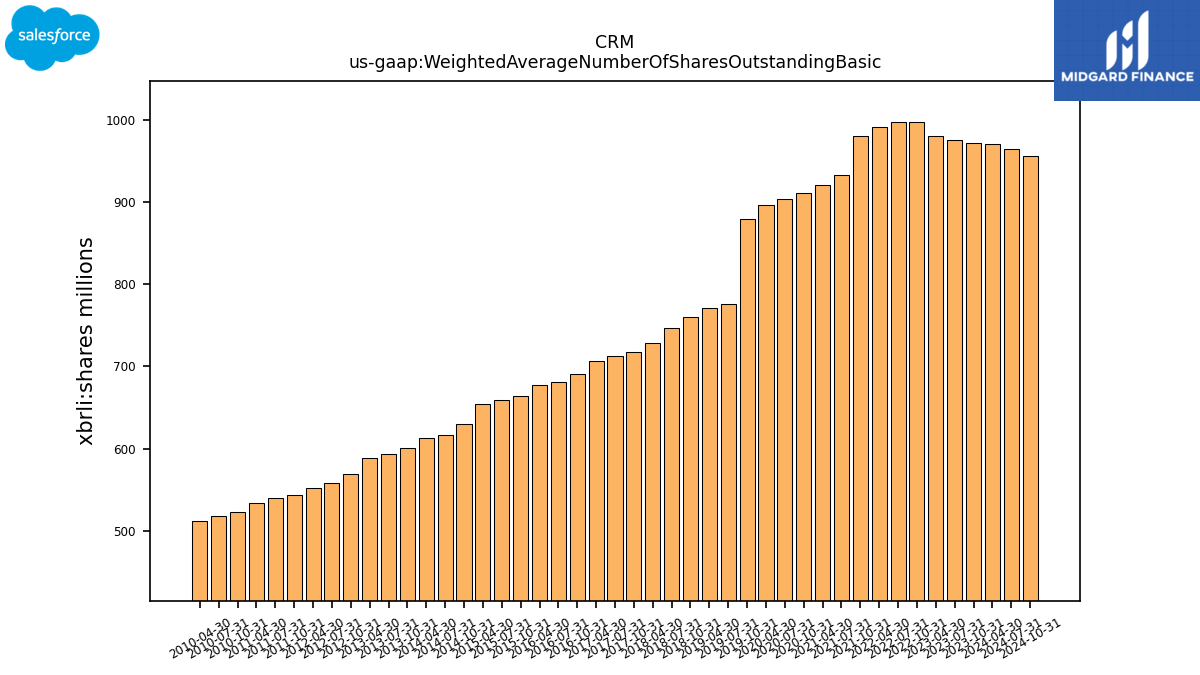 |
CRM | ||||
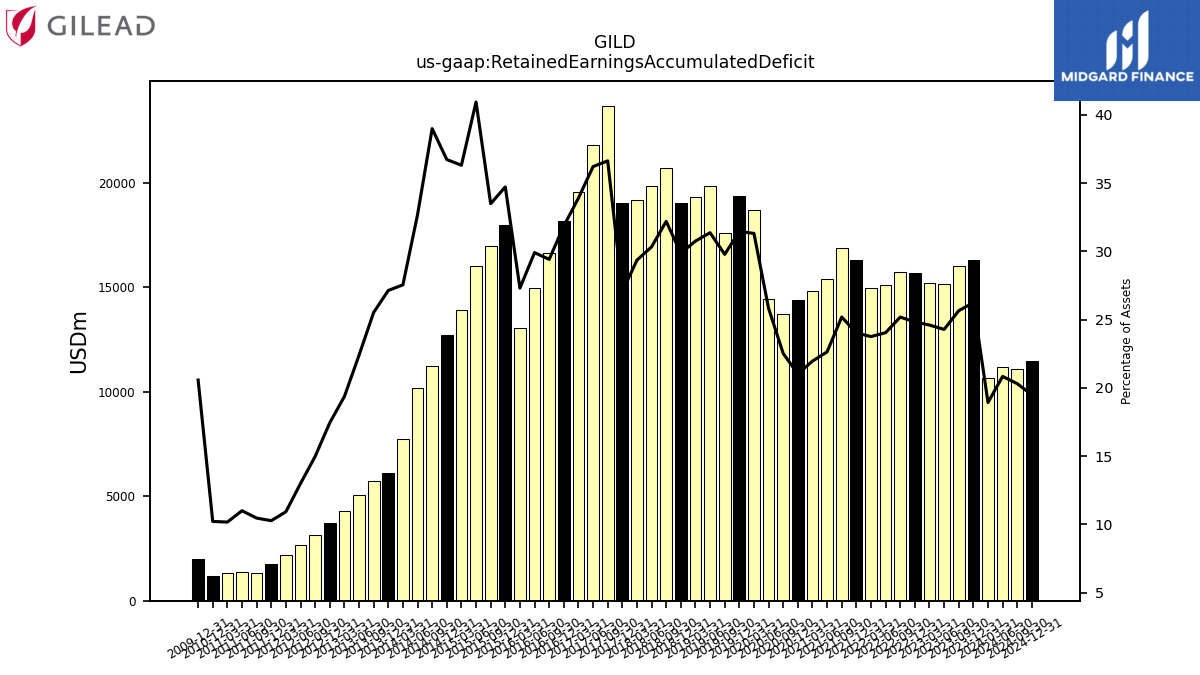
| $GILD$ | 2025-02-28 | 2024-11-12 | 2025-04-24 | NA | NA | GILD | 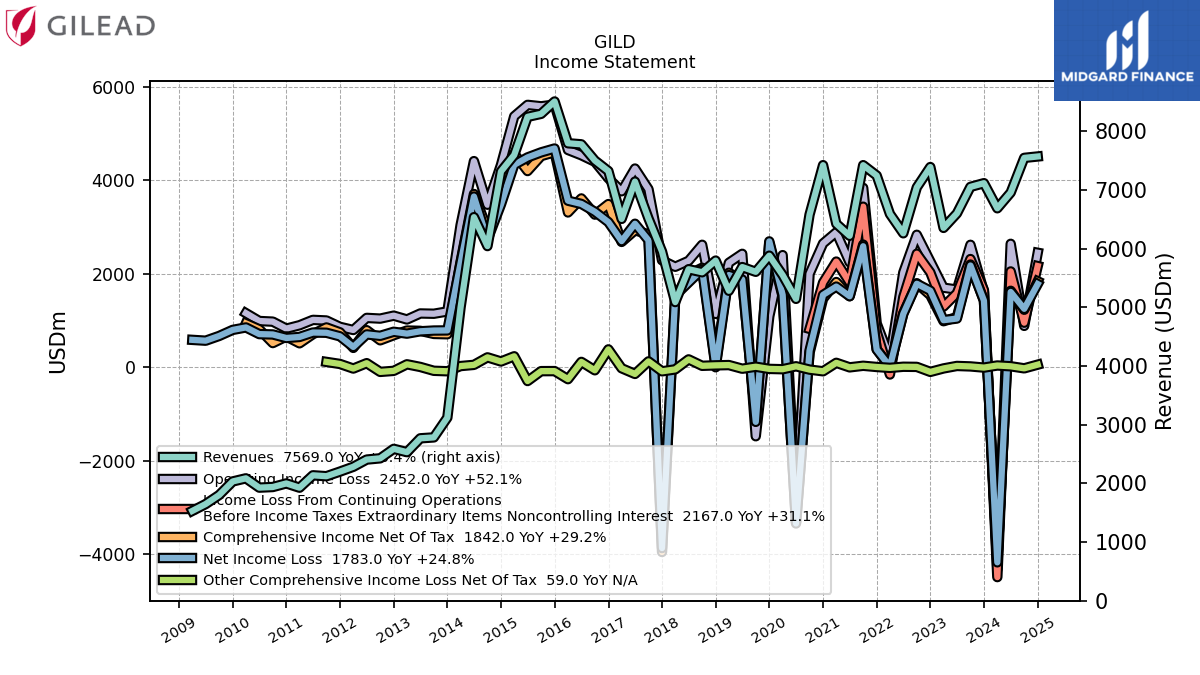 |
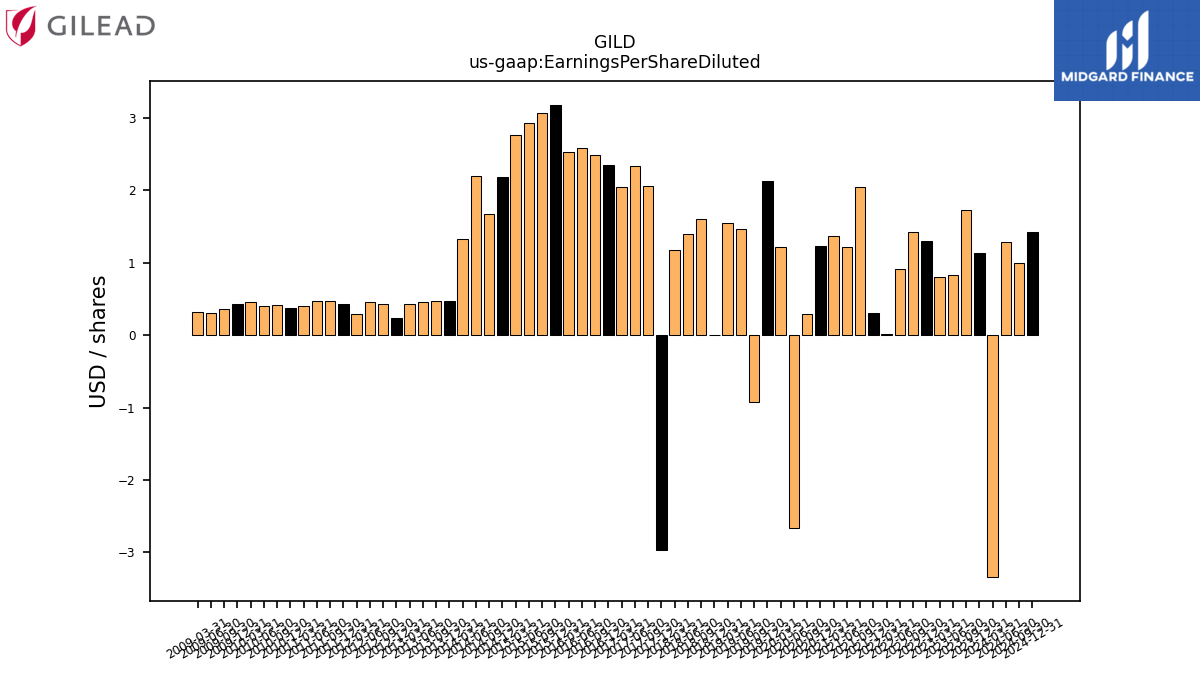 |
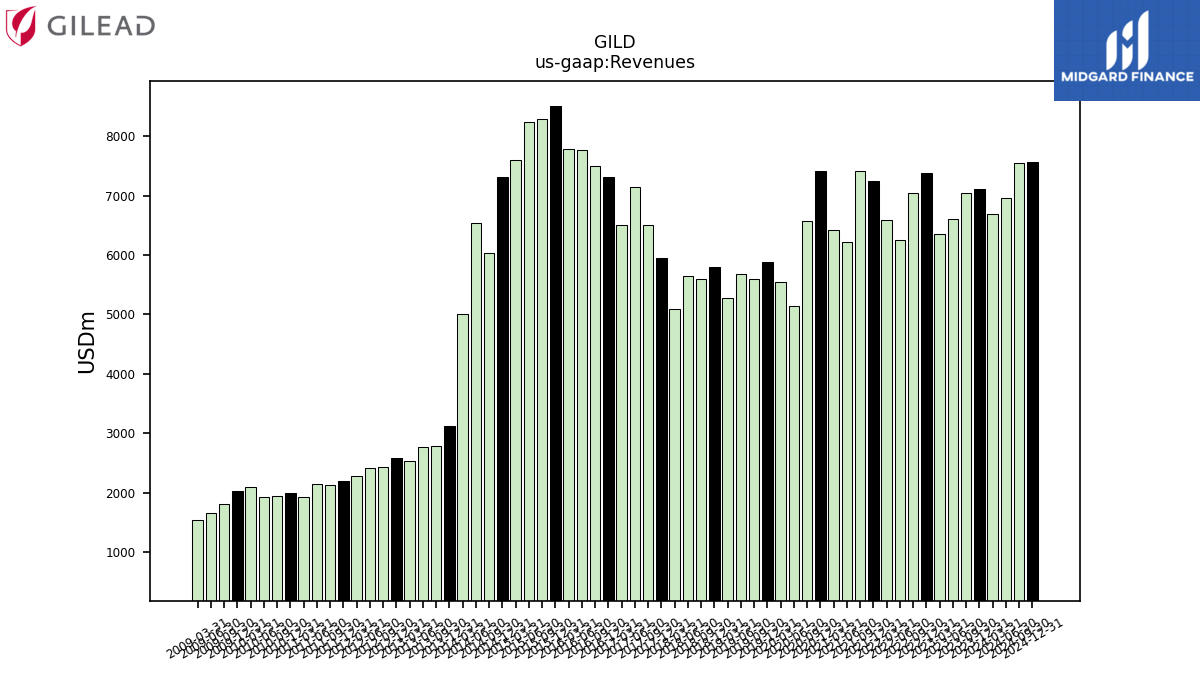 |
GILD | 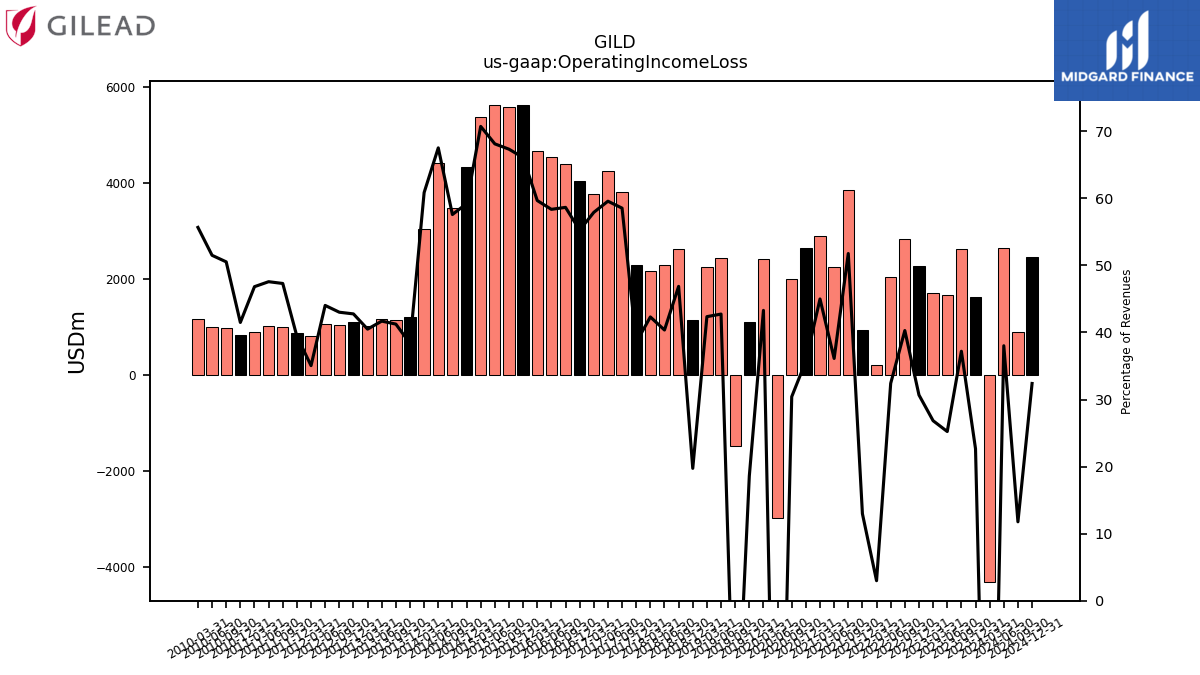 |
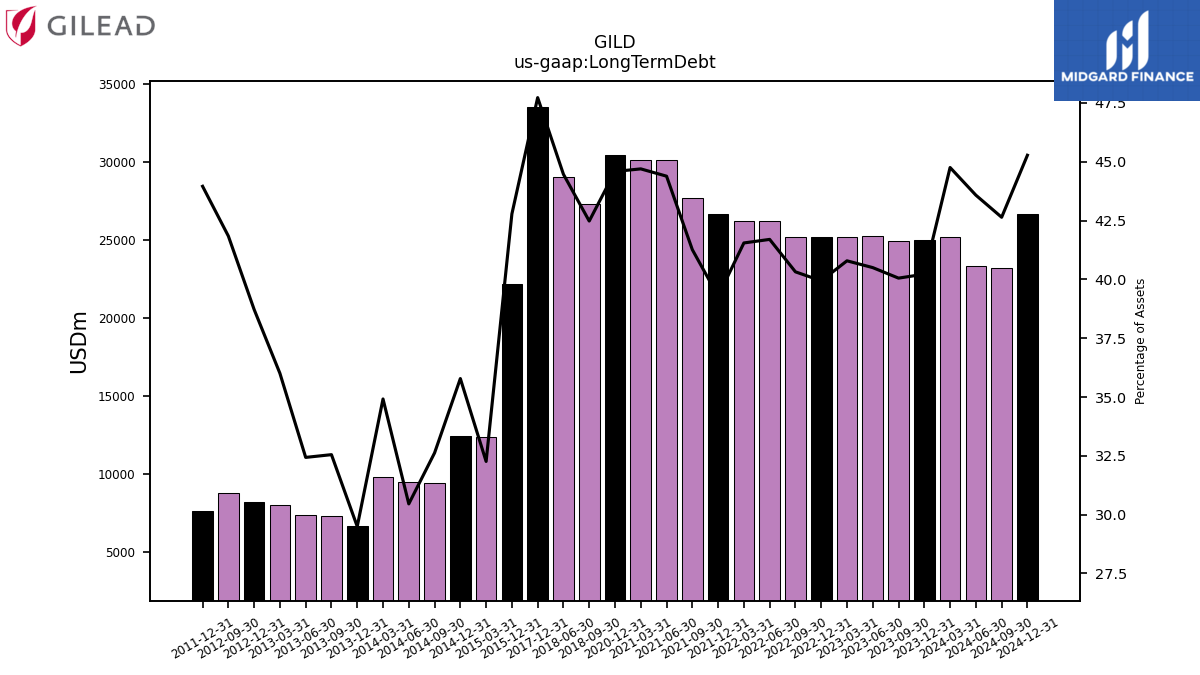 |
GILD | 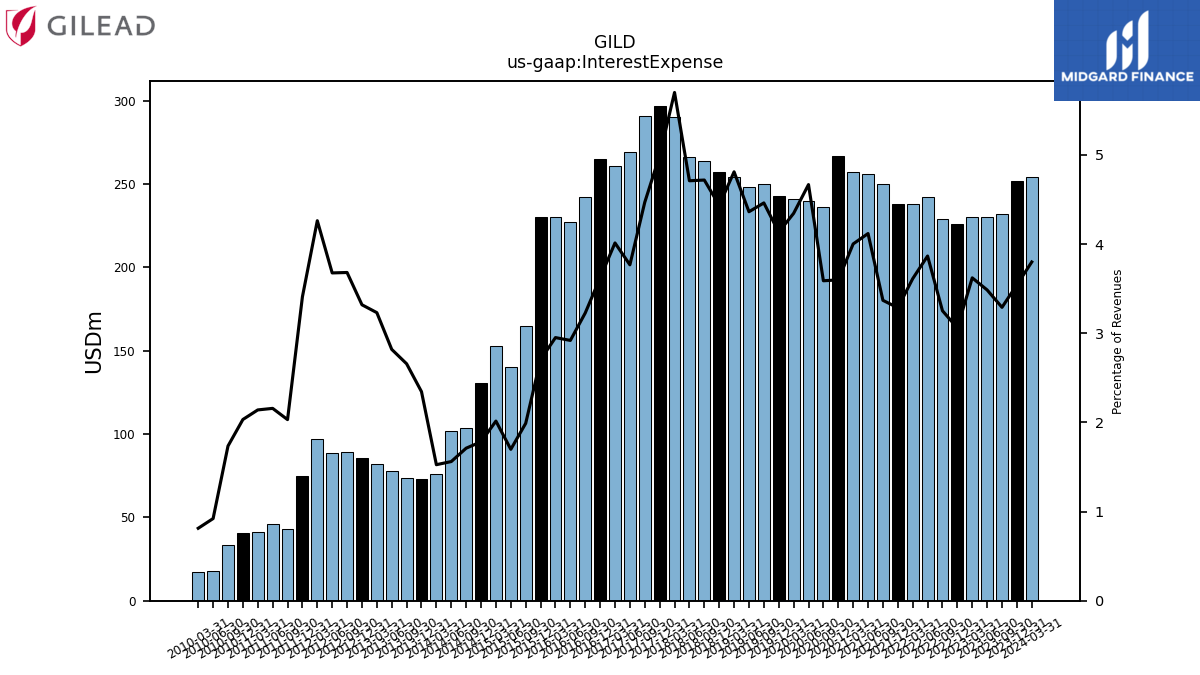 |
 |
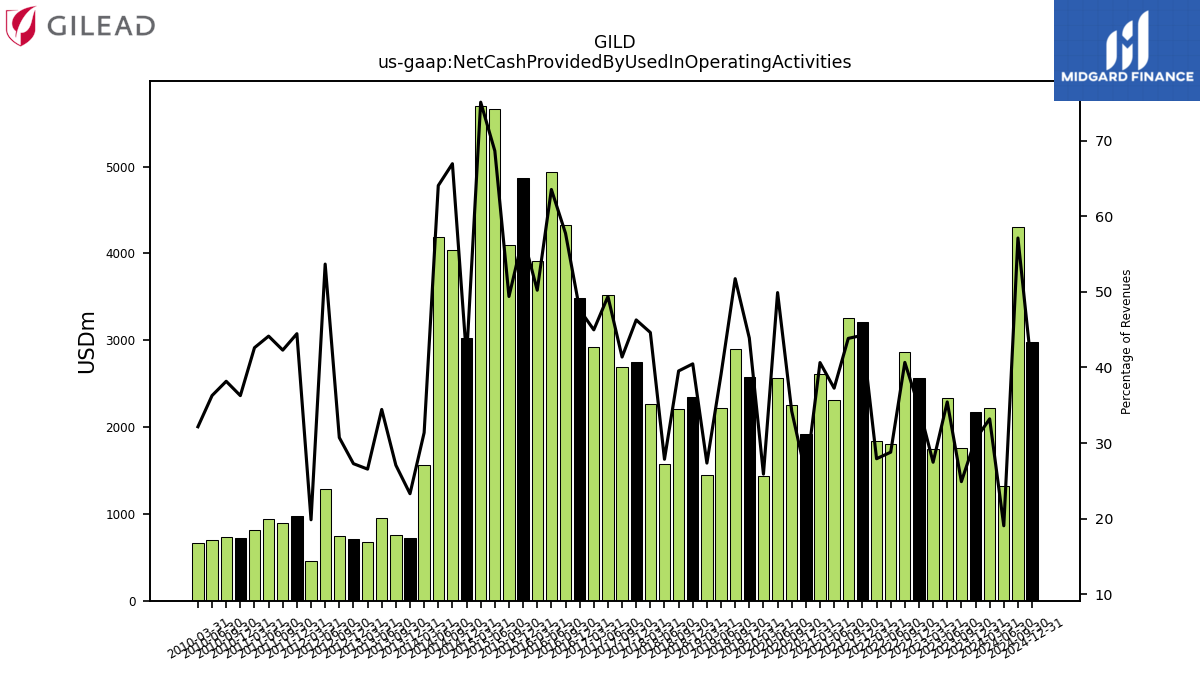 |
GILD | 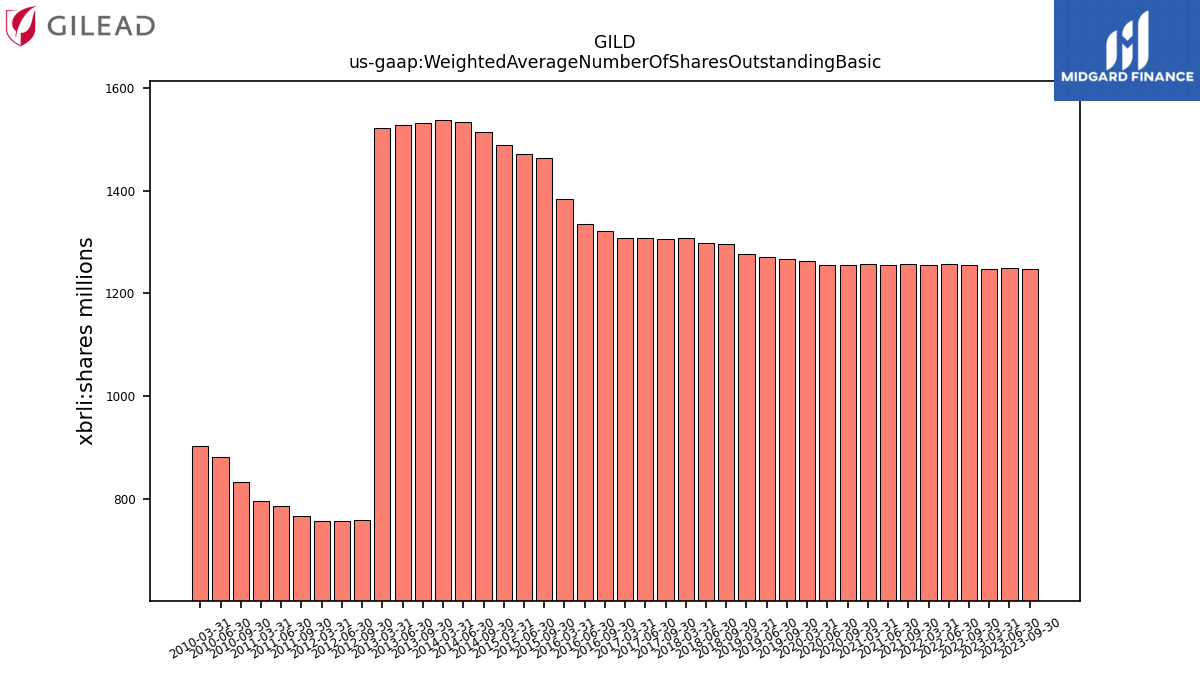 |
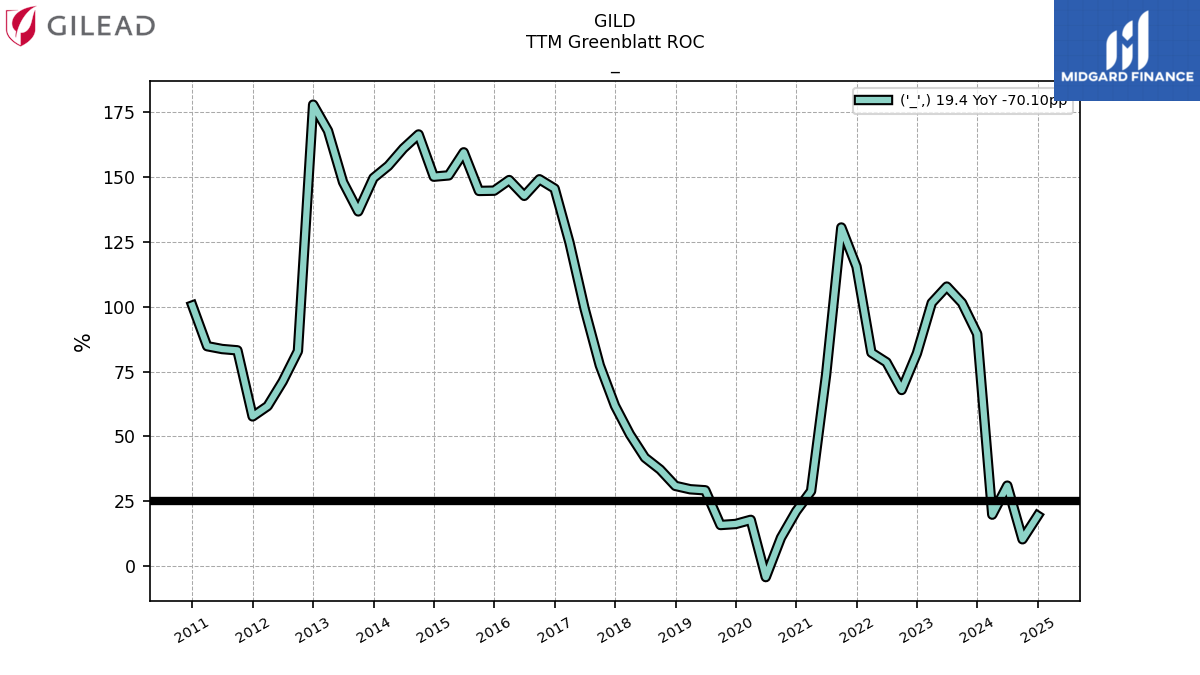 |
GILD | |||||
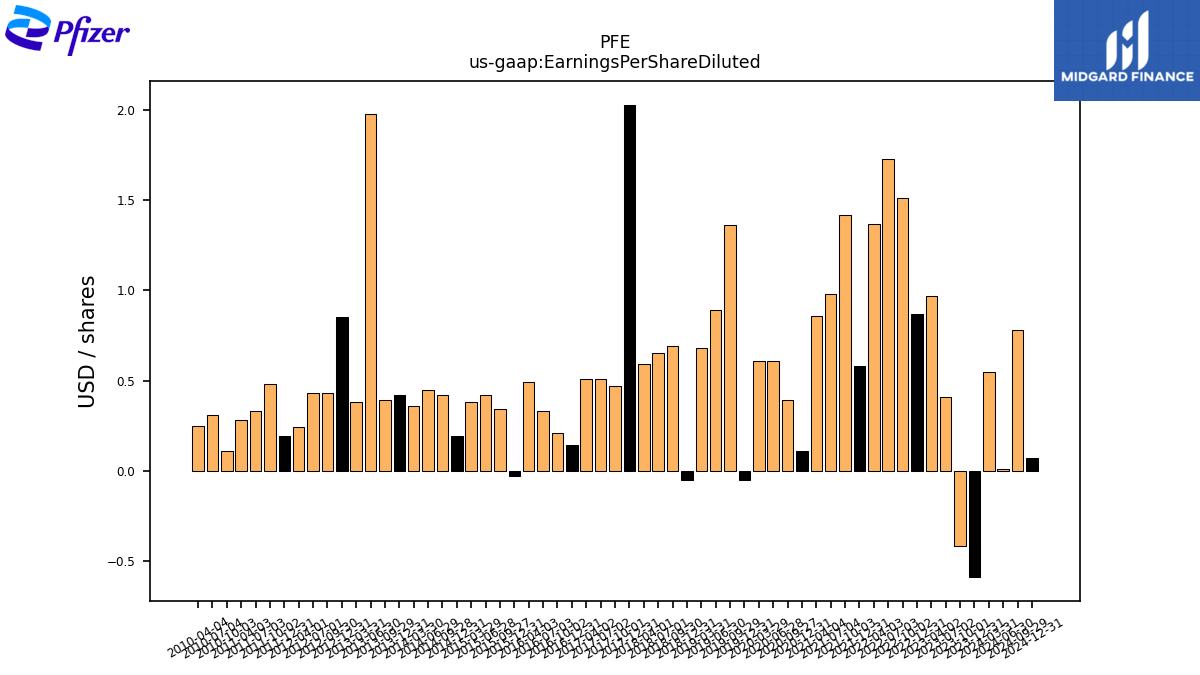
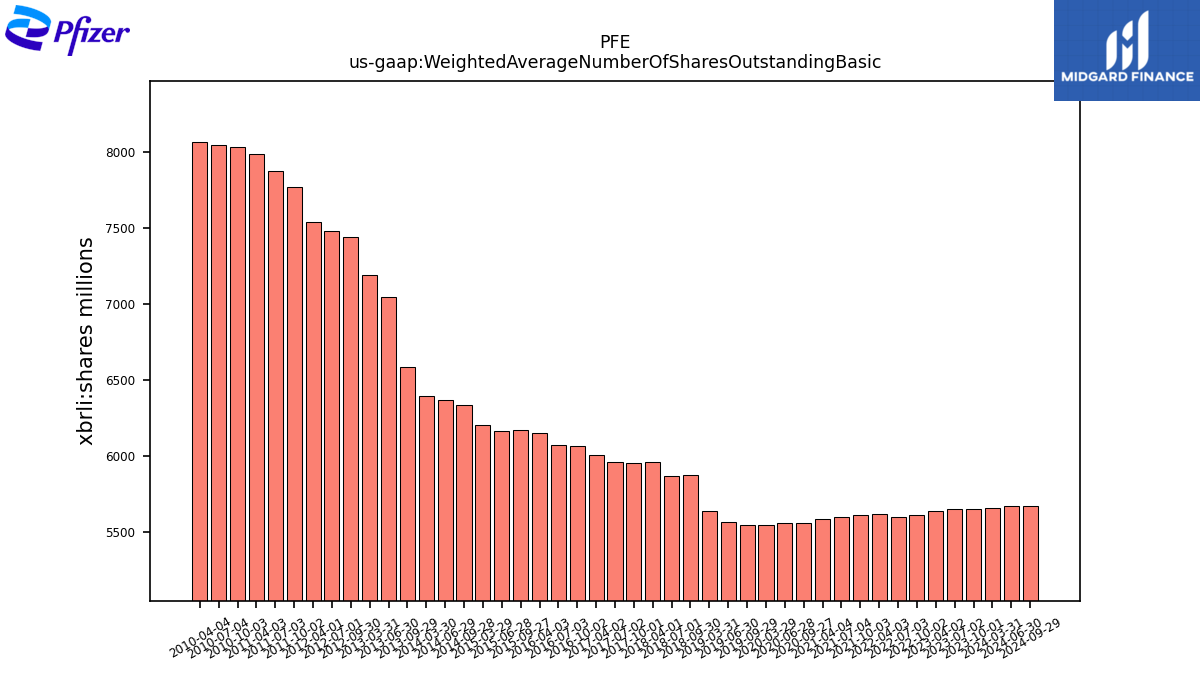
| $PFE$ | 2025-02-27 | 2024-11-04 | 2025-04-29 |  |
NA | NA | PFE | 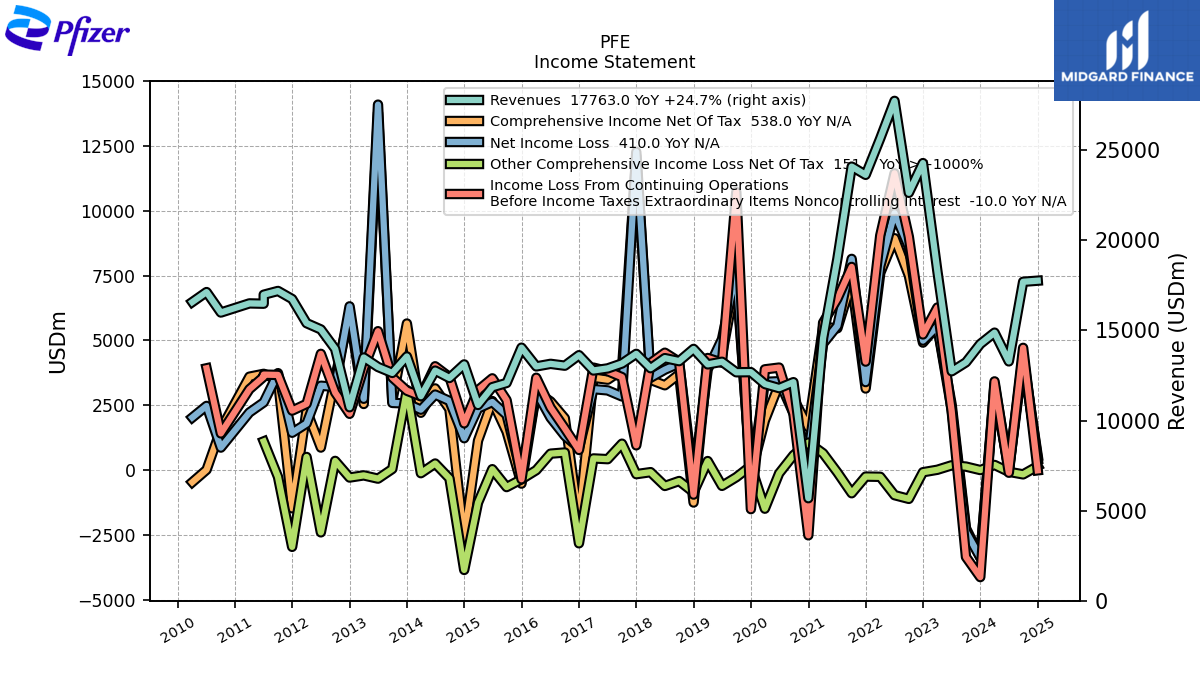 |
 |
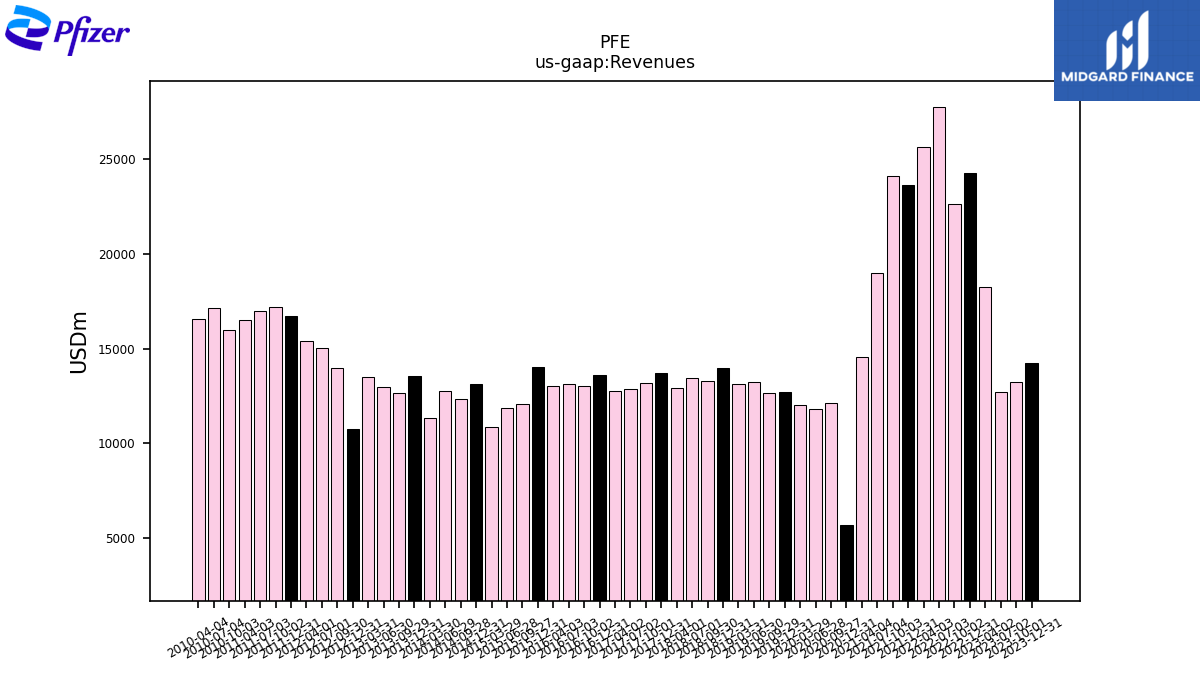 |
PFE | 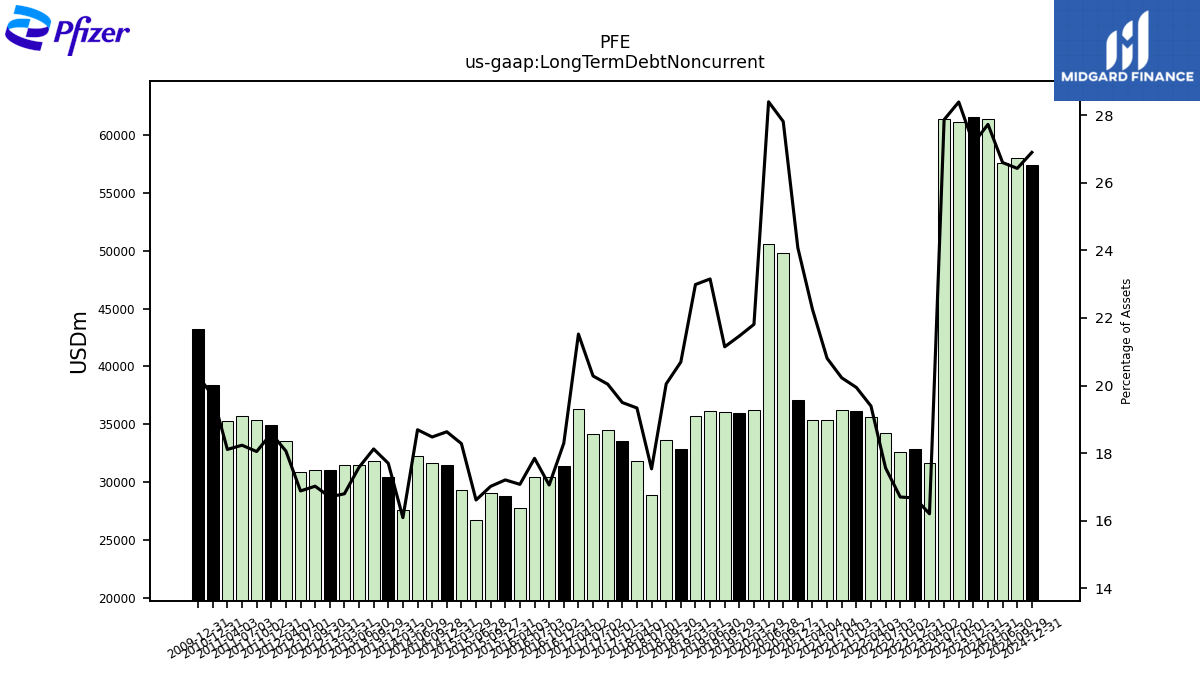 |
PFE | 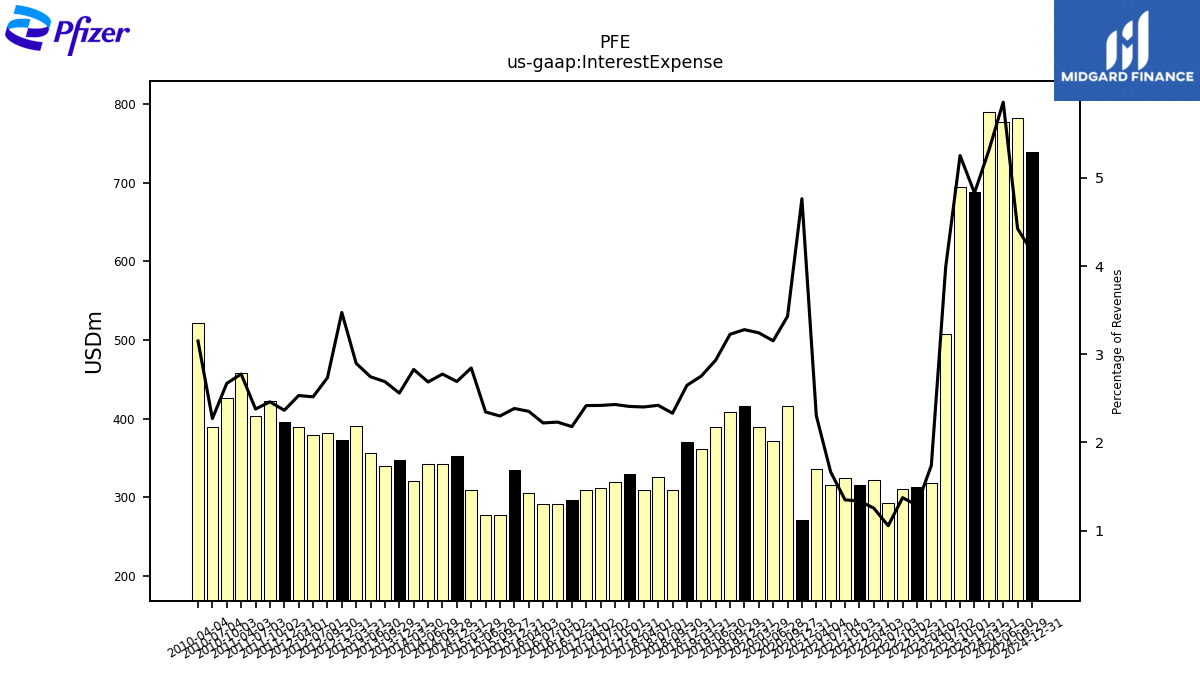 |
 |
 |
PFE |  |
 |
PFE | |||||
| Ticker | 10K | 10Q | 8K | Sector | Industry | Logo | Forward P/E | Revenue Growth | Ticker | Income | EPS | Revenues | Ticker | GrossProfit | OperatingIncome | LongTermDebt | Ticker | InterestExpense | RetainedEarnnings | CashFlowOperating | Ticker | Dividends | SharesOutstanding | TTMGreenblattROC | |
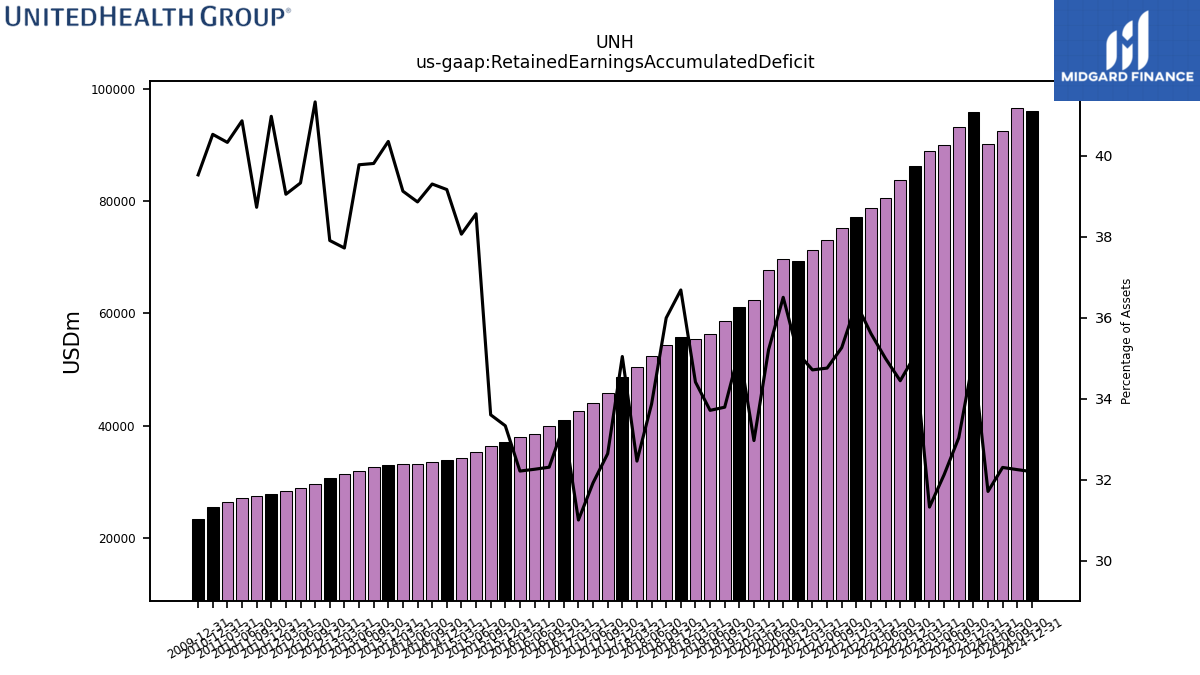
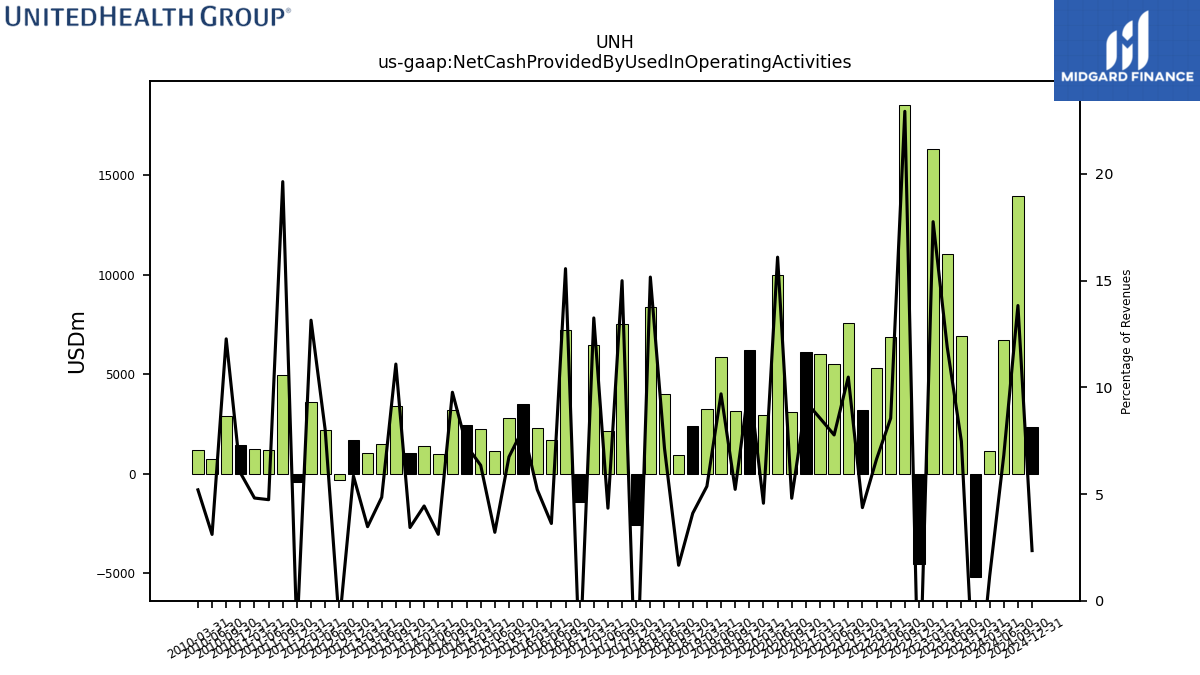
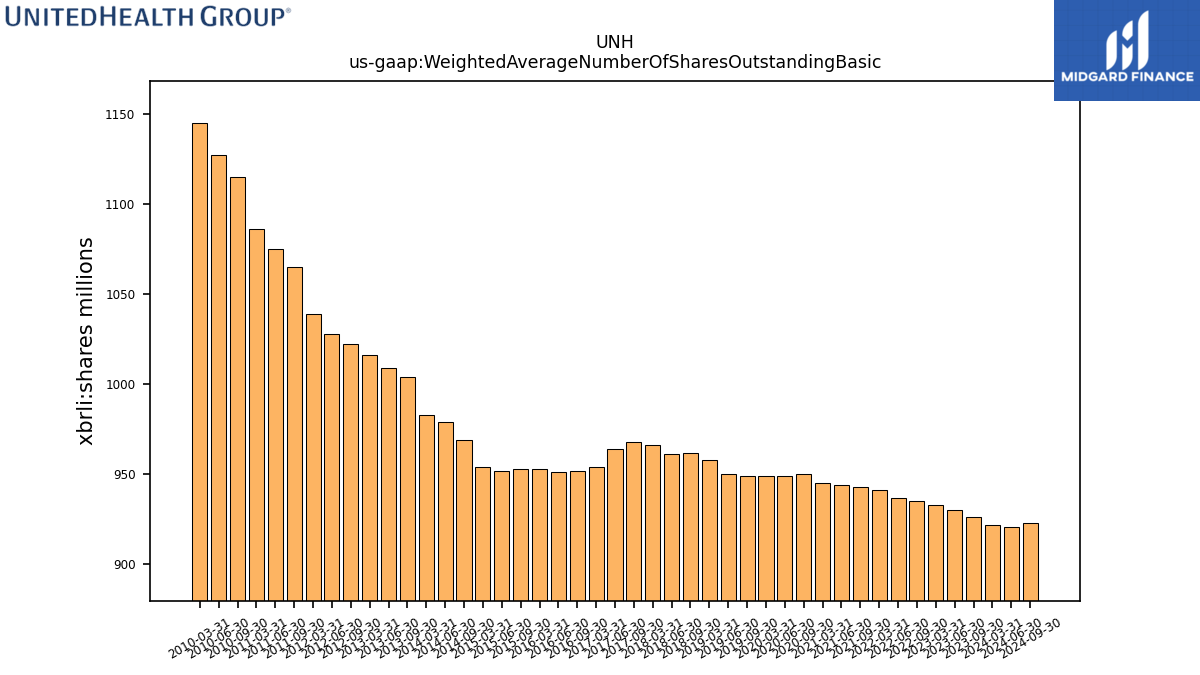
| $UNH$ | 2025-02-27 | 2024-11-04 | 2025-04-17 | NA | NA | UNH | 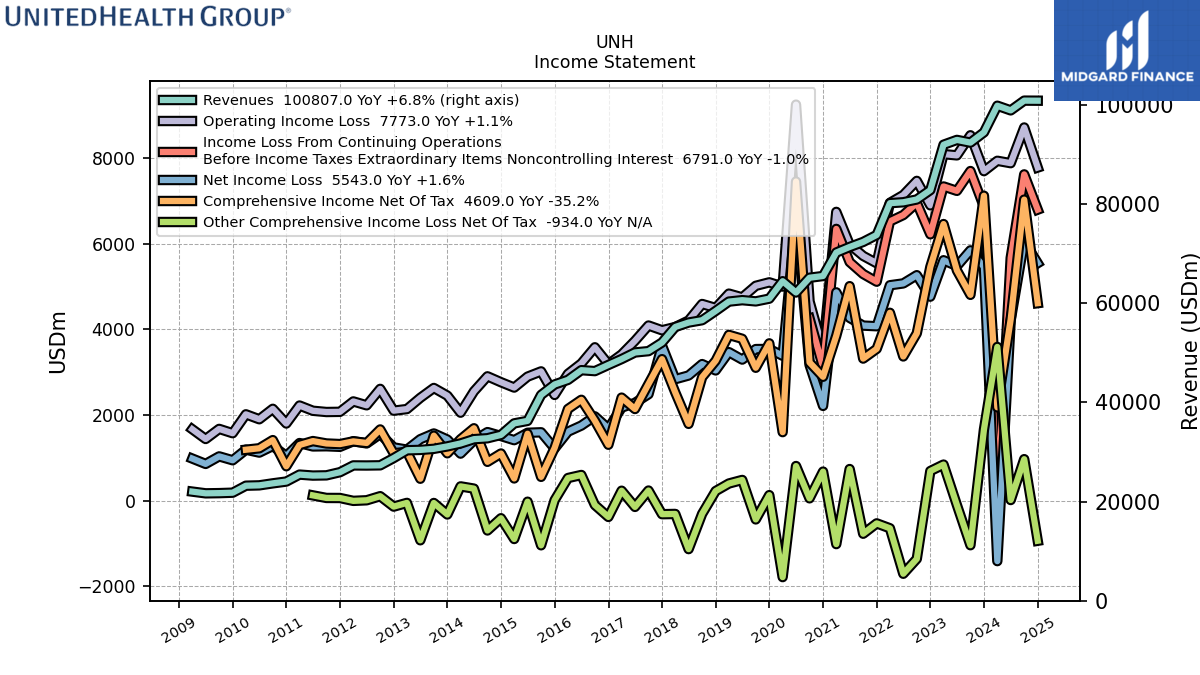 |
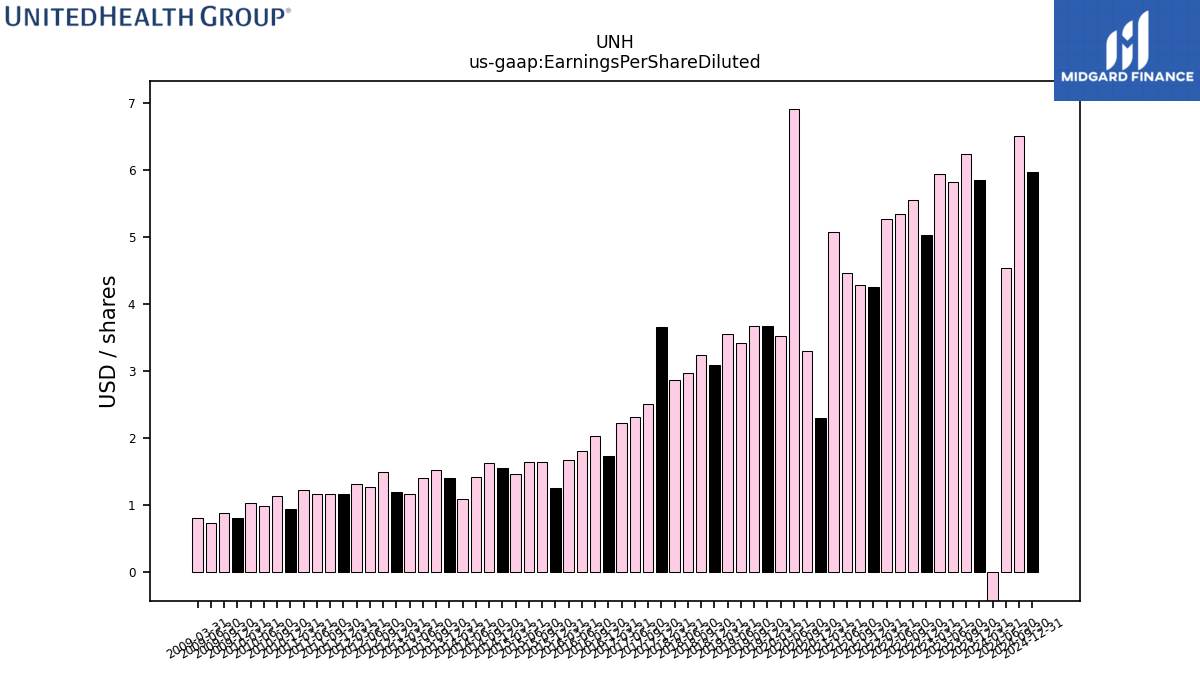 |
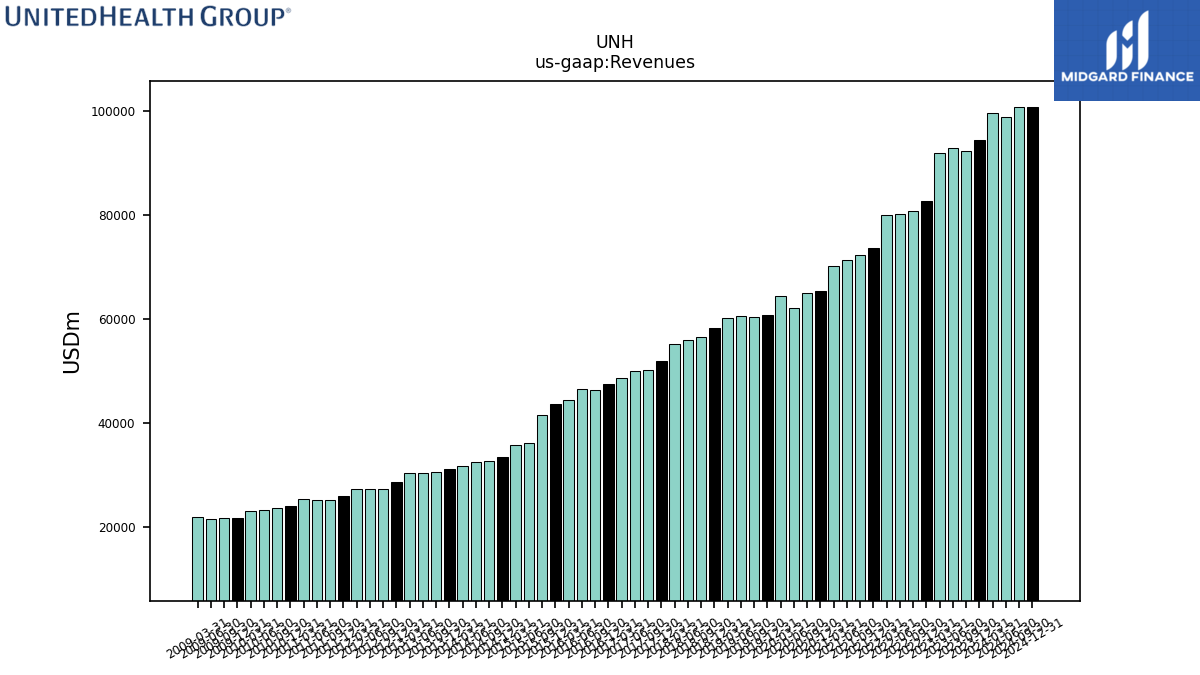 |
UNH | 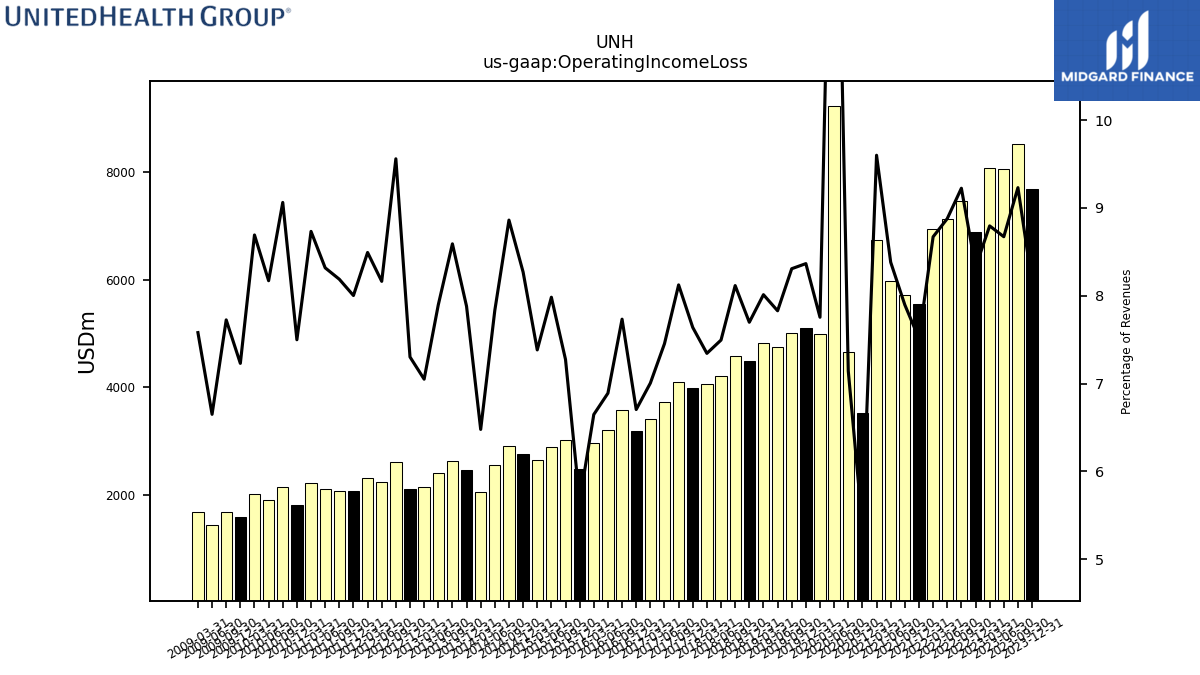 |
 |
UNH | 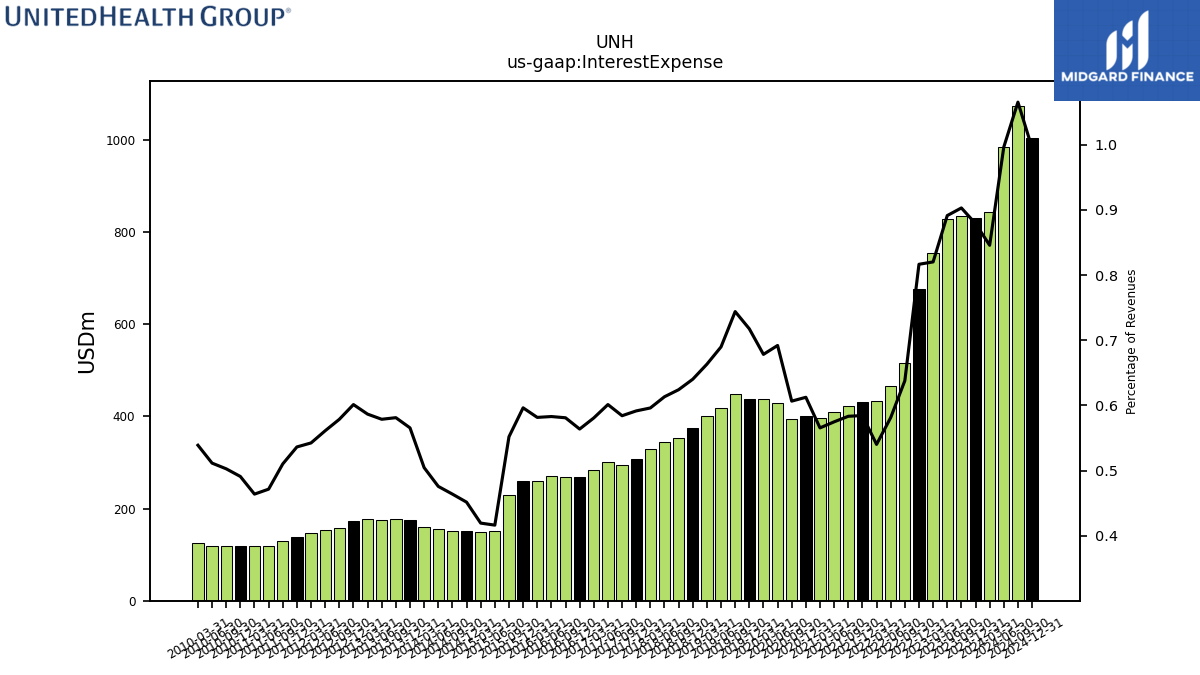 |
 |
 |
UNH | 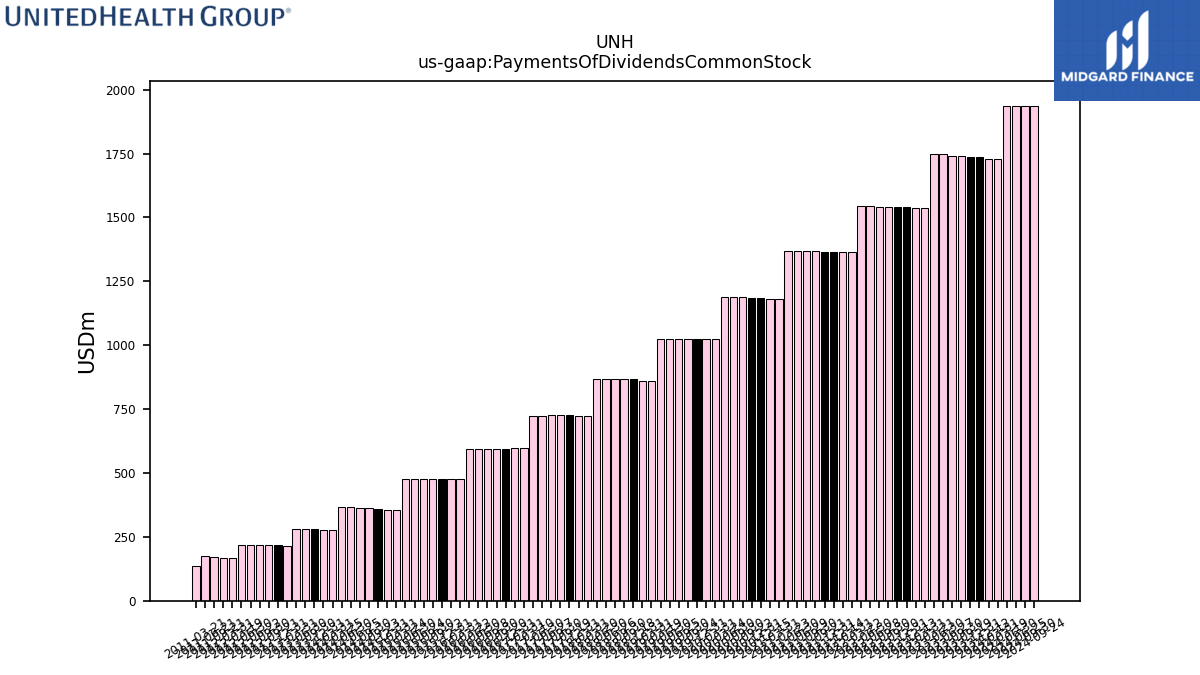 |
 |
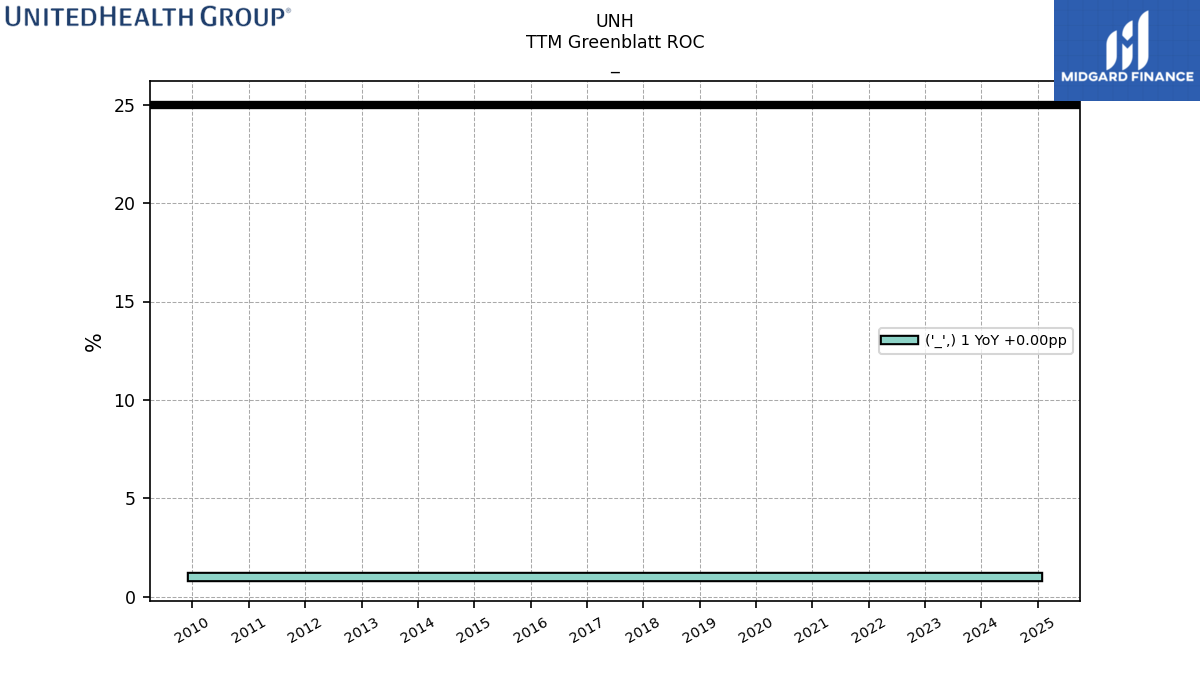 |
UNH | ||||
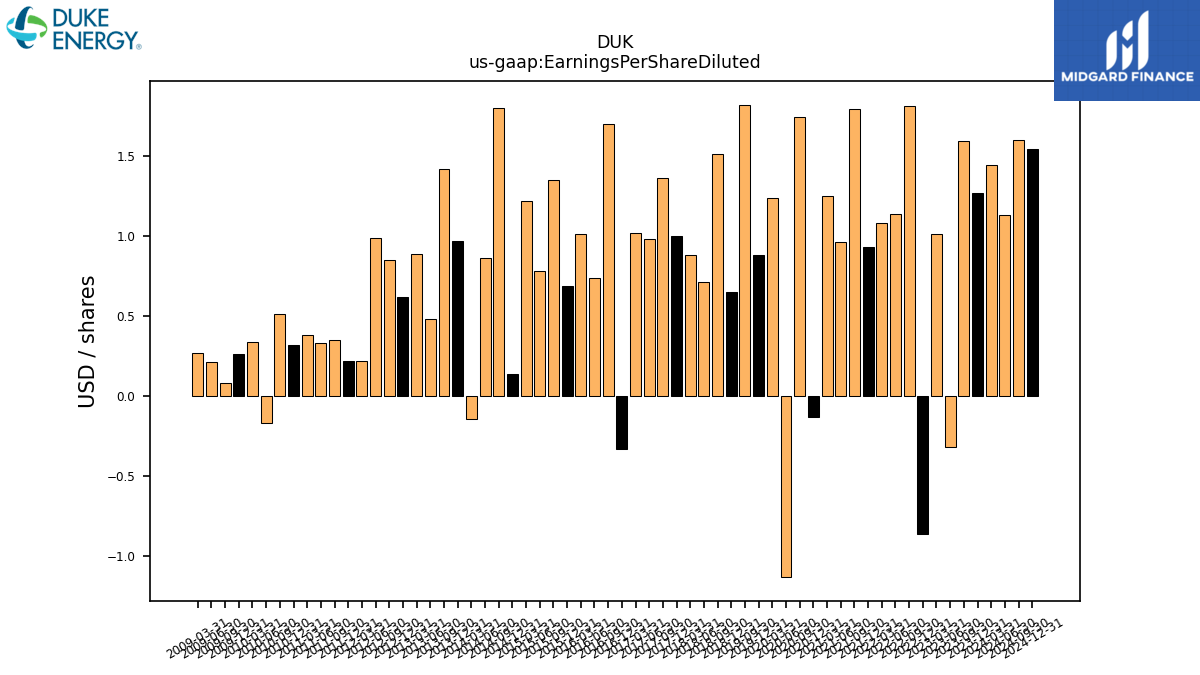
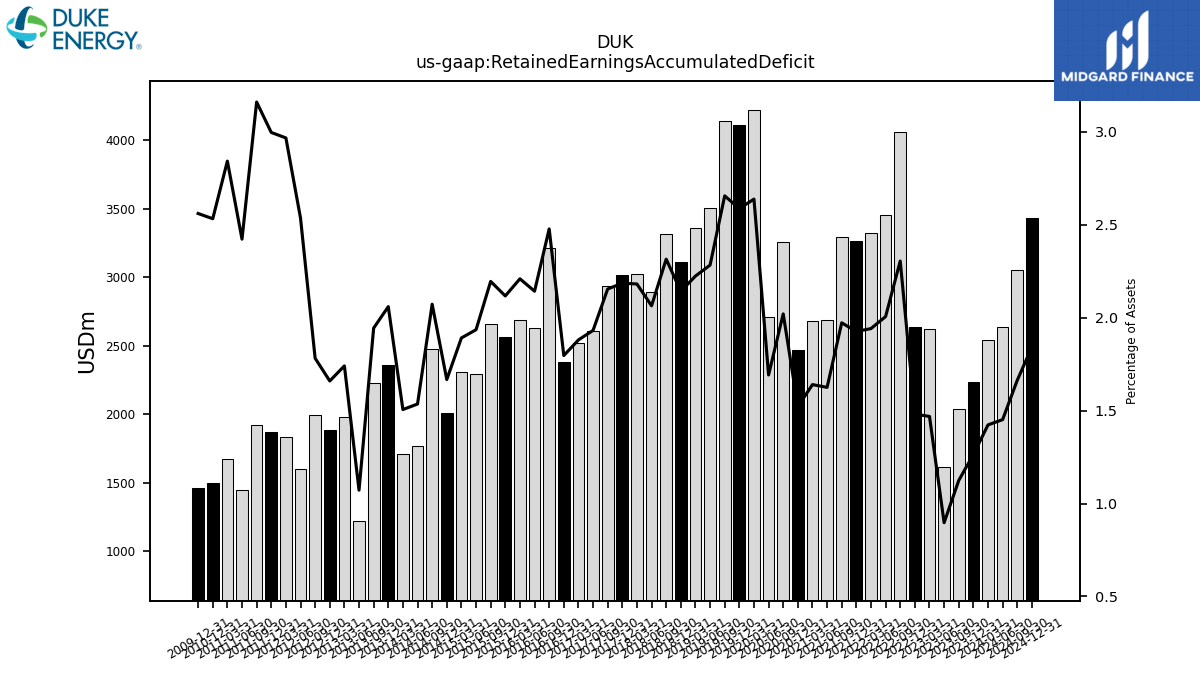
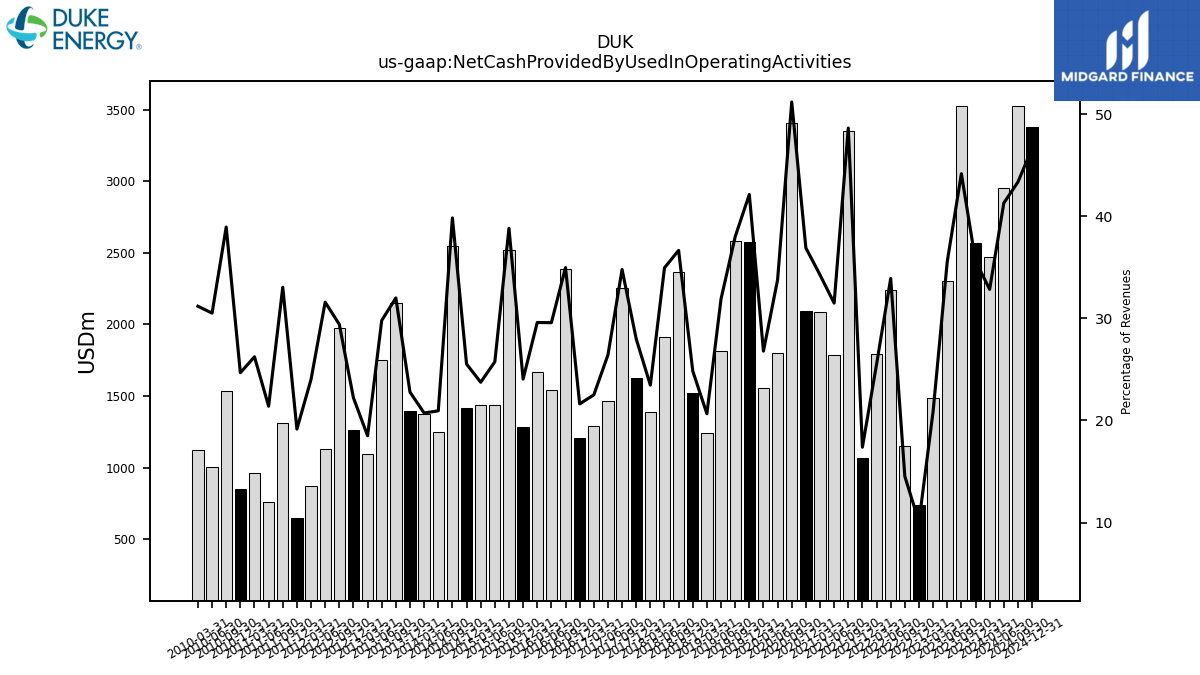
| $DUK$ | 2025-02-27 | 2024-11-07 | 2025-02-13 | NA | NA | DUK | 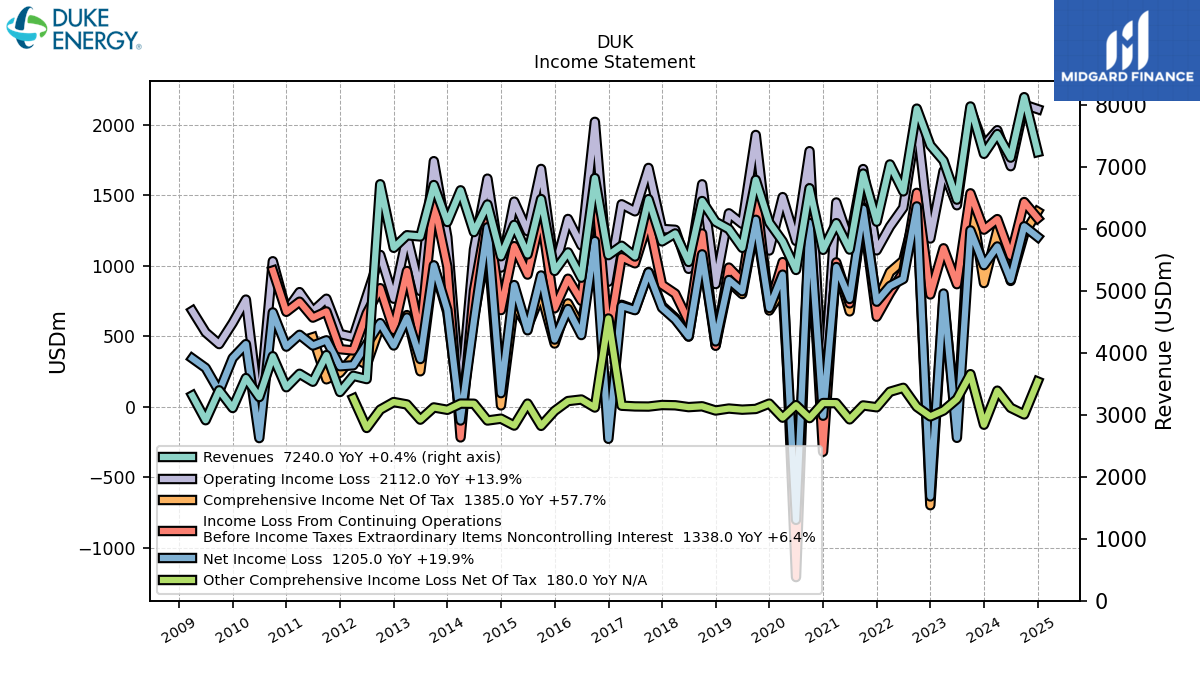 |
 |
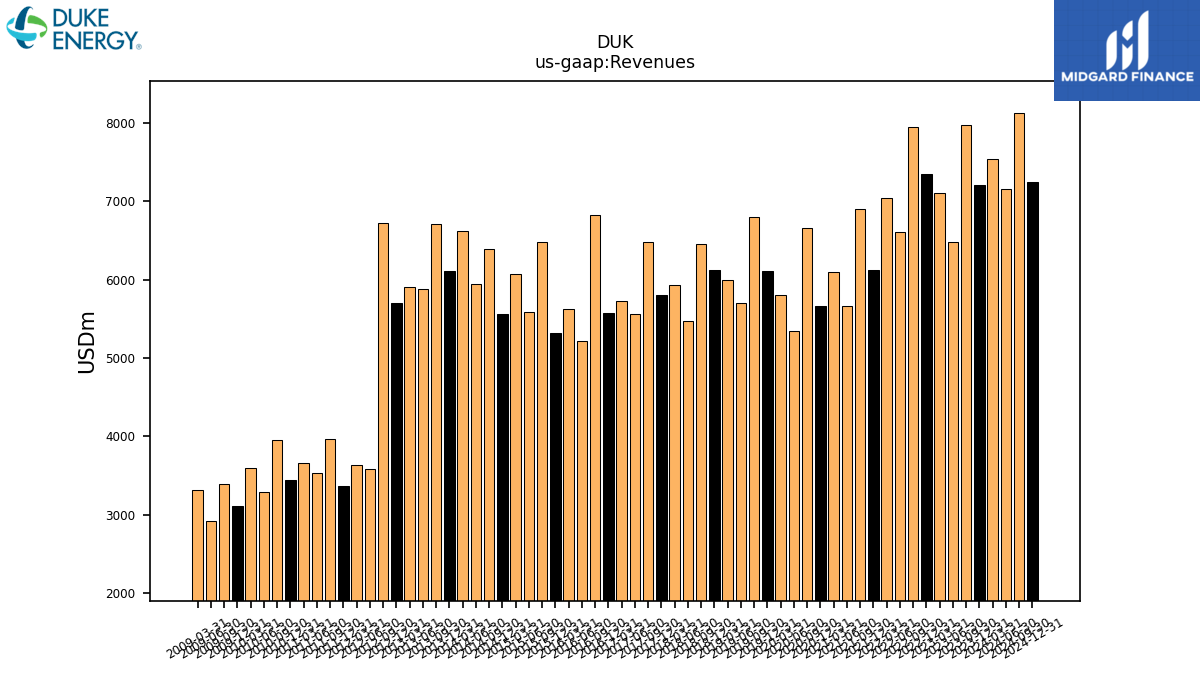 |
DUK | 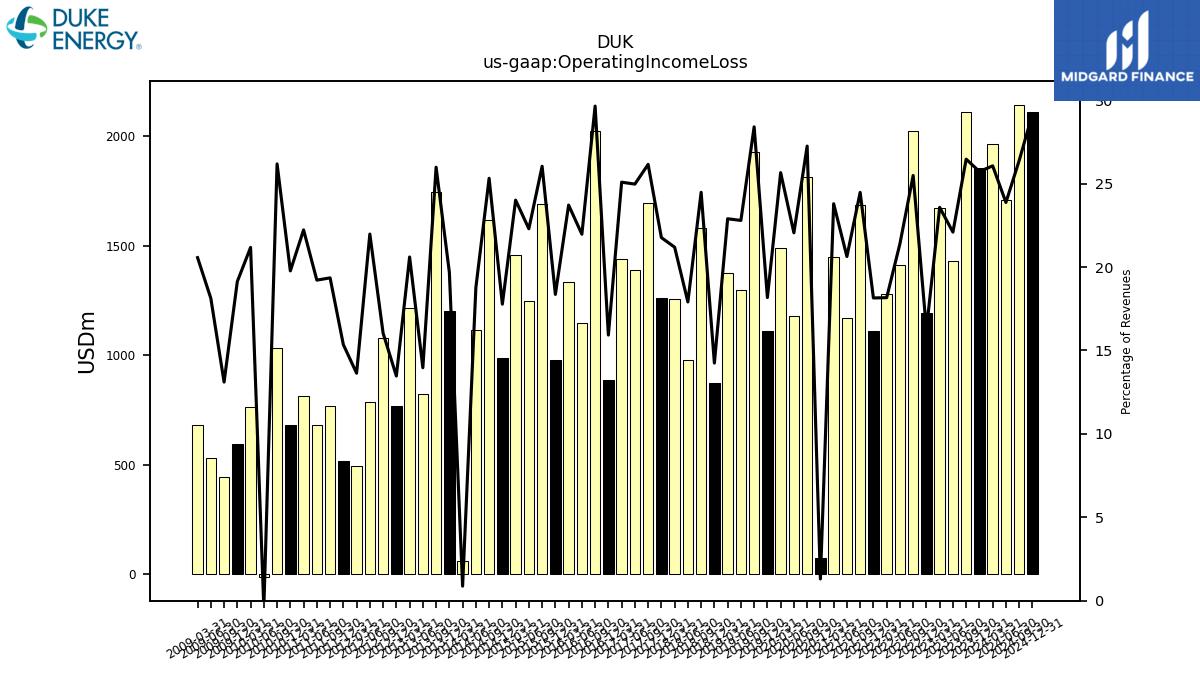 |
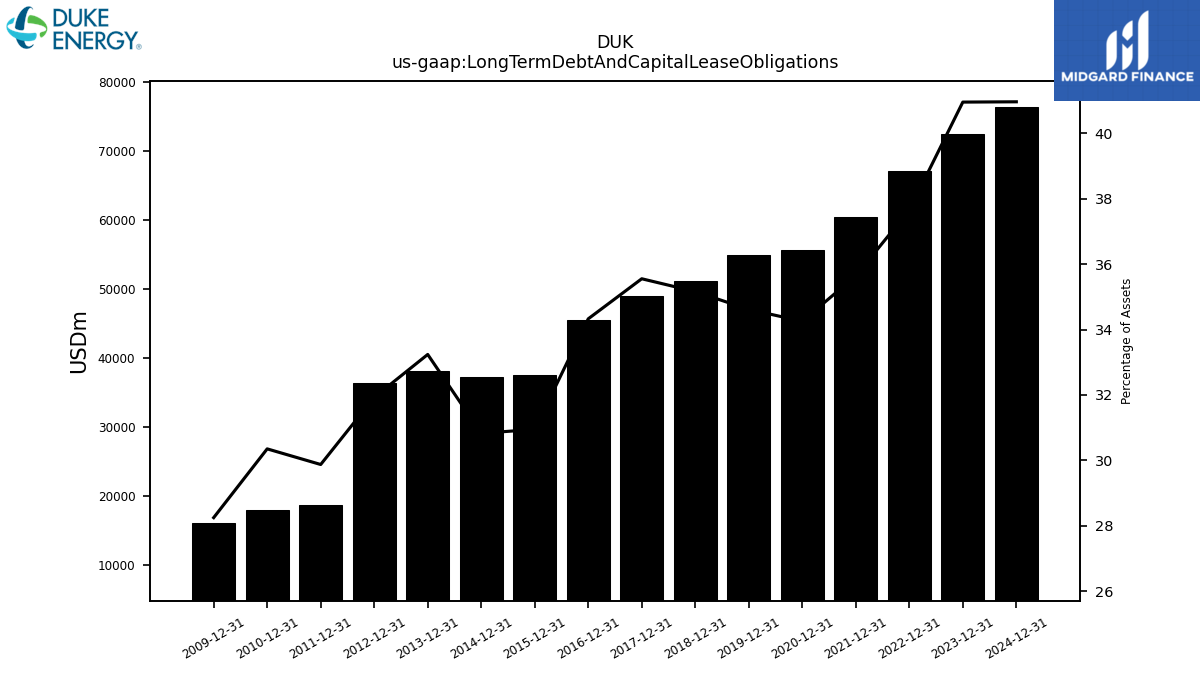 |
DUK | 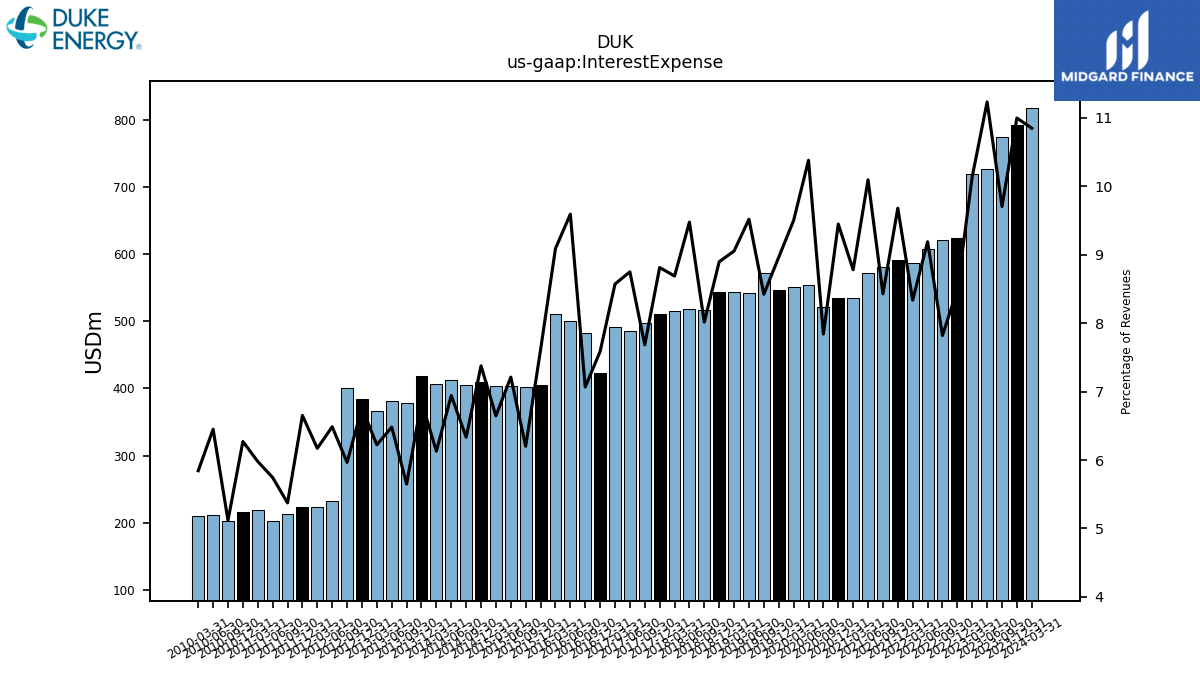 |
 |
 |
DUK | 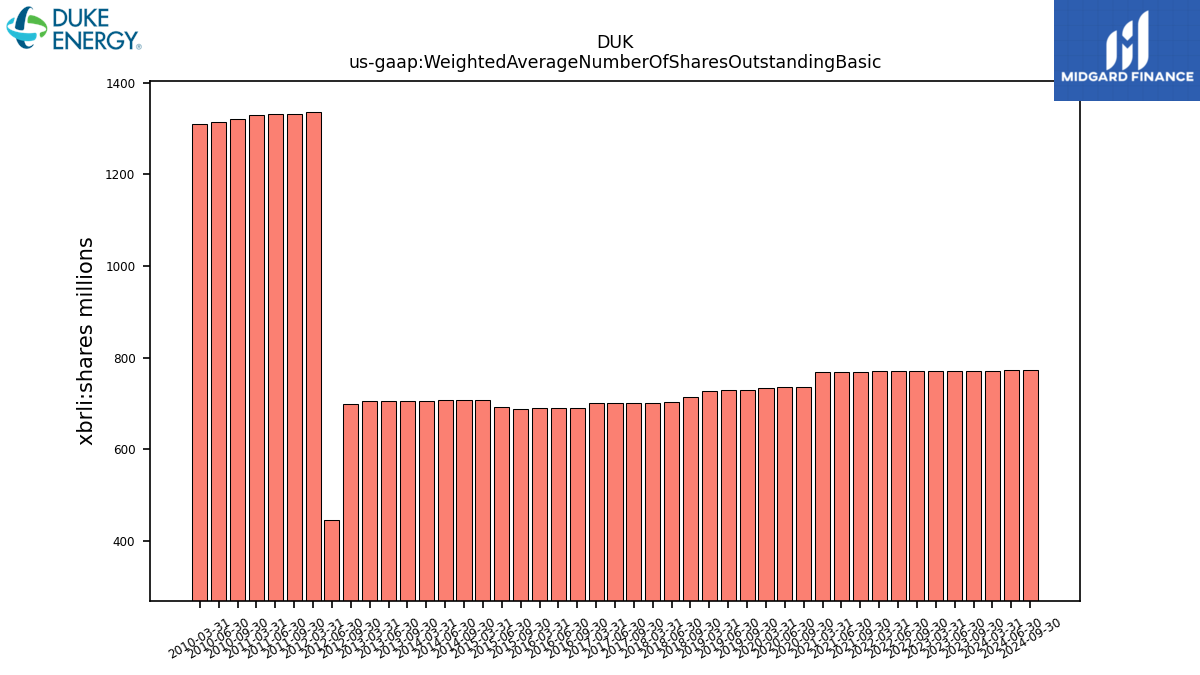 |
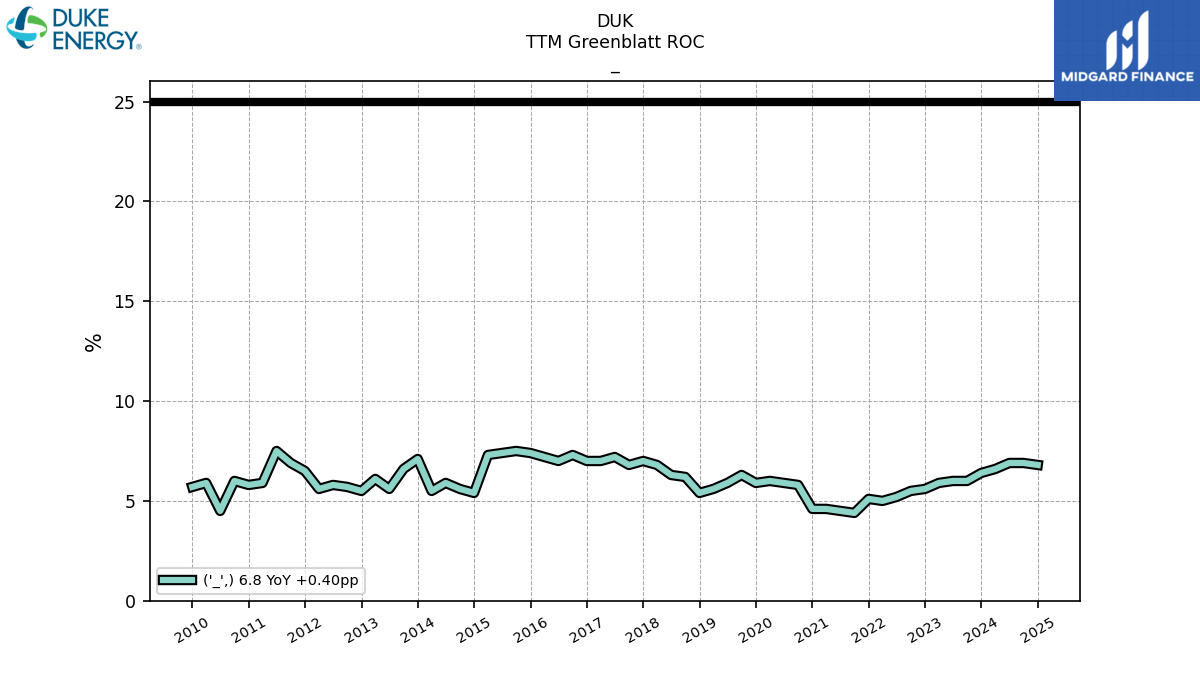 |
DUK | |||||
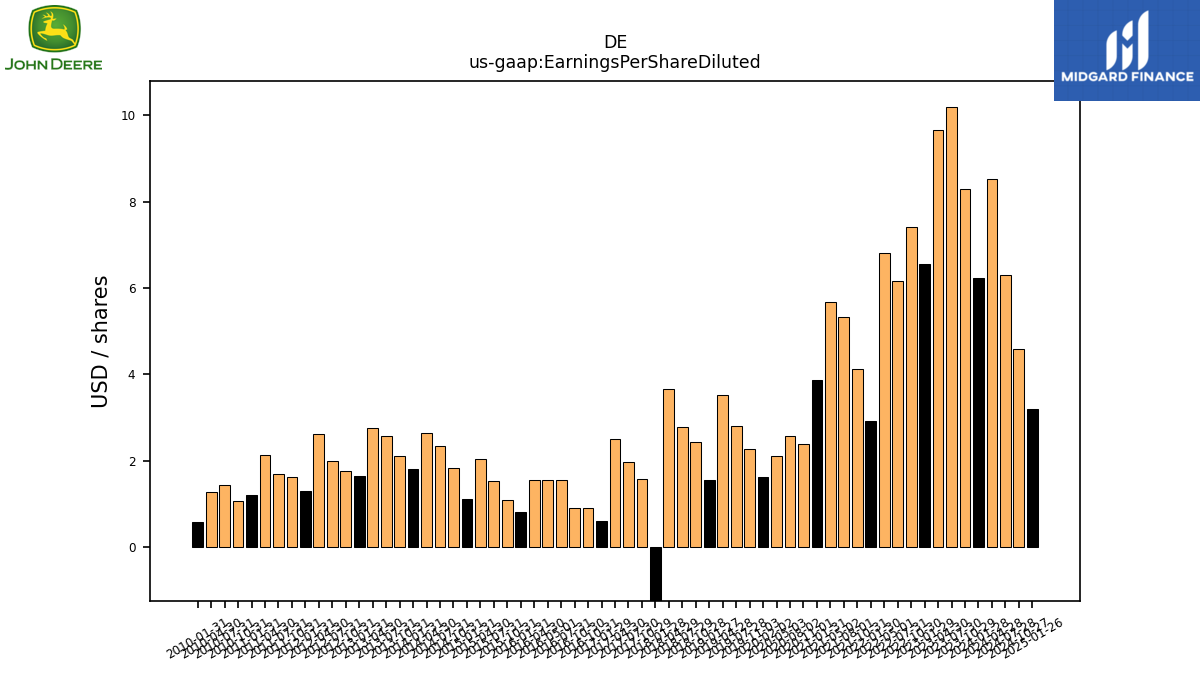
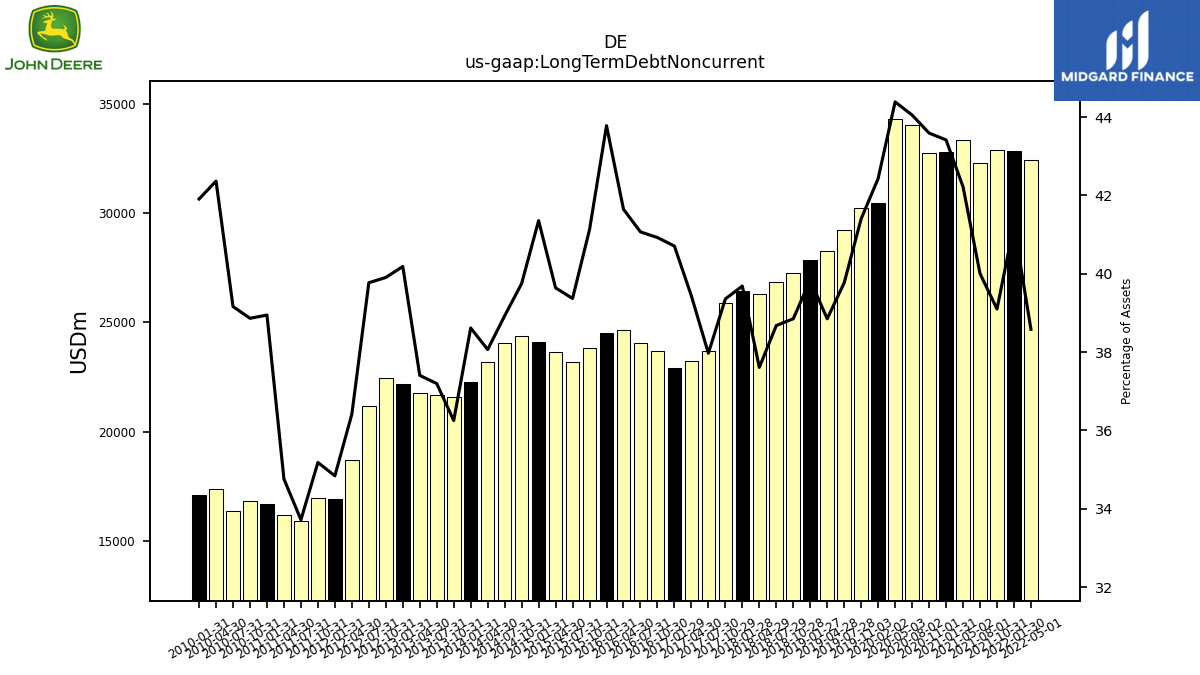
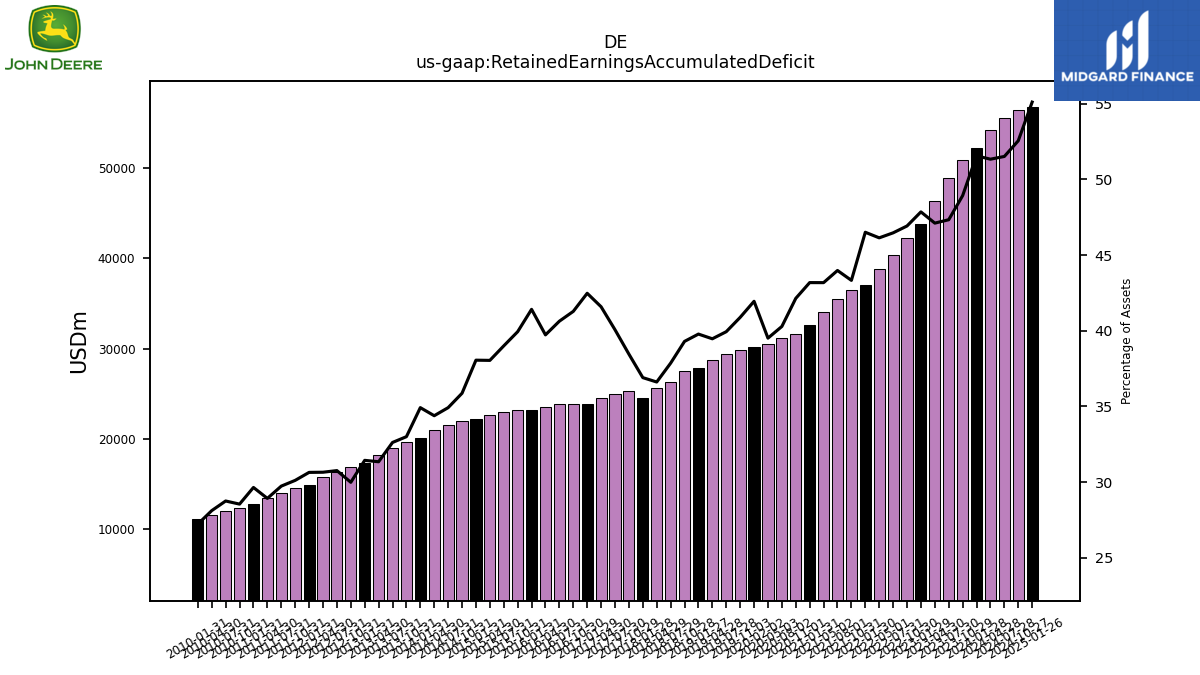
| $DE$ | 2024-12-12 | 2025-02-27 | 2025-02-13 | NA | NA | DE | 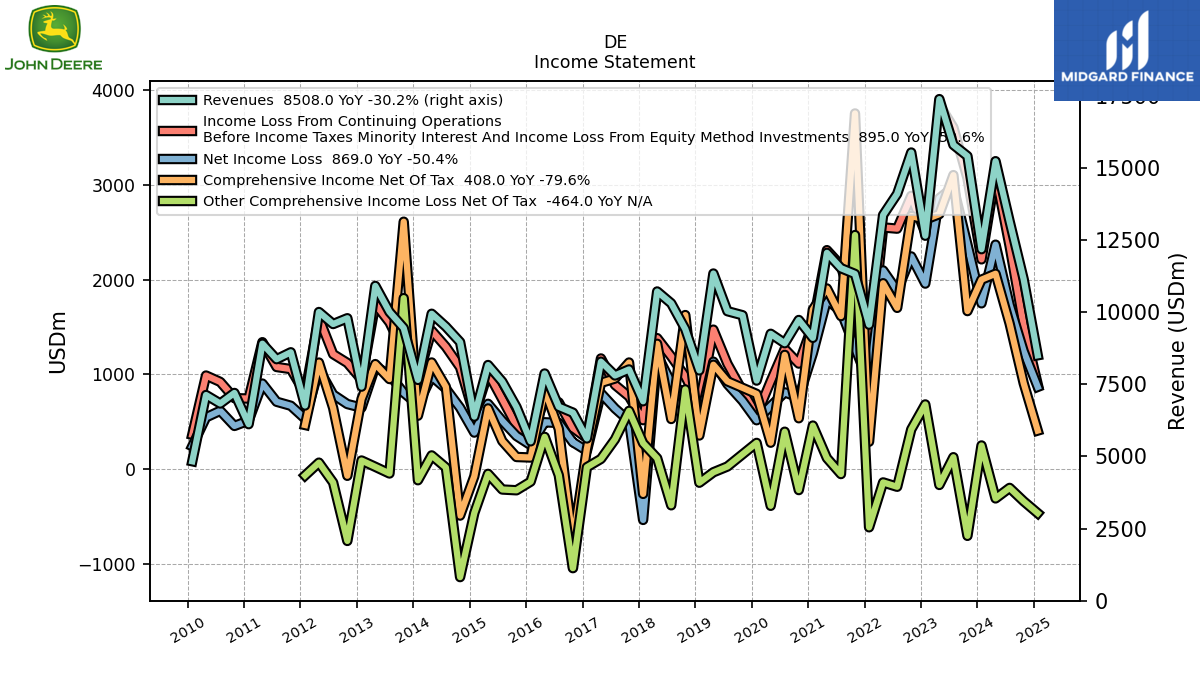 |
 |
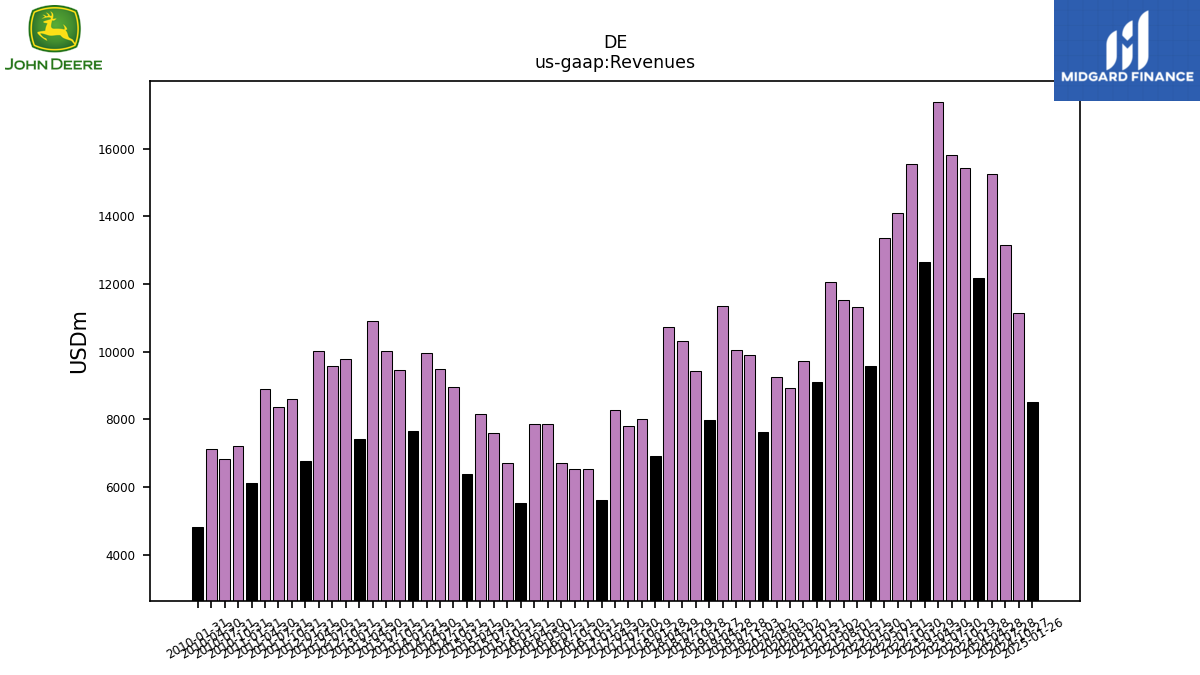 |
DE | 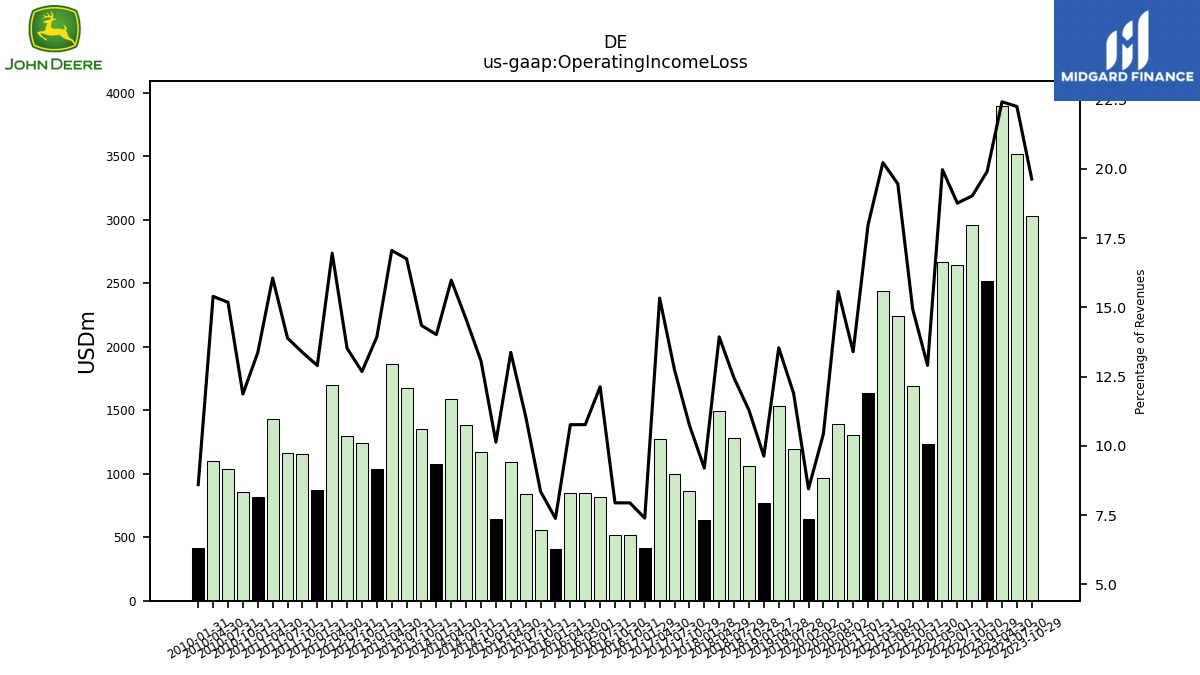 |
 |
DE | 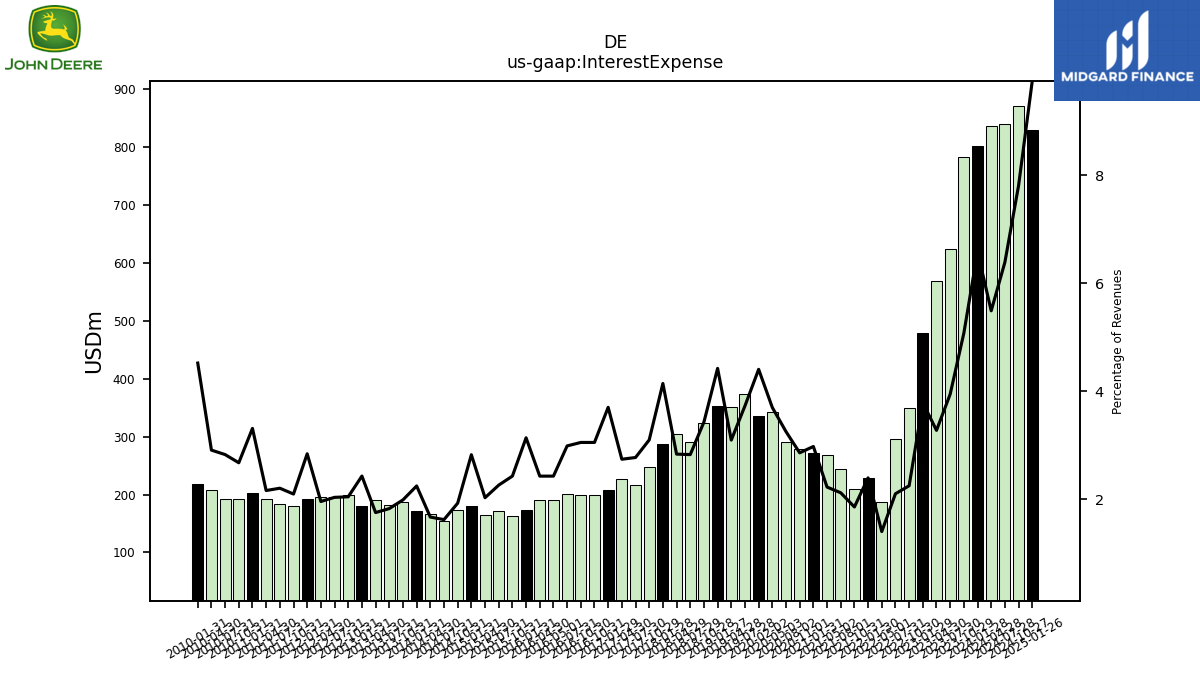 |
 |
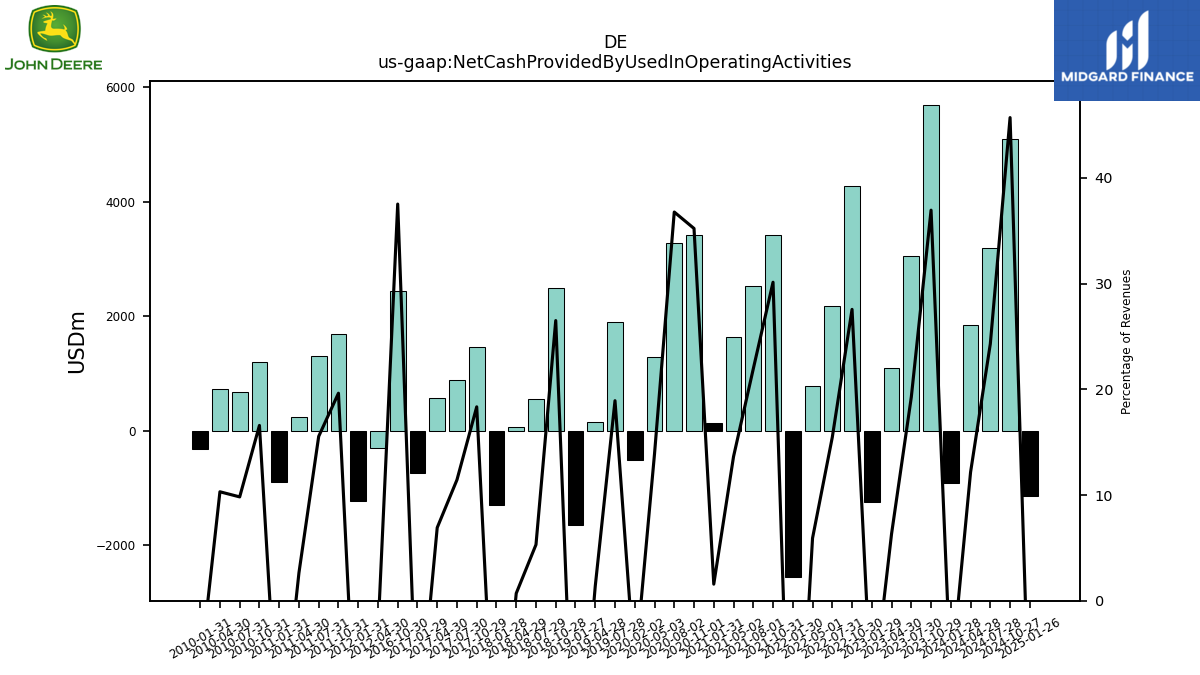 |
DE | 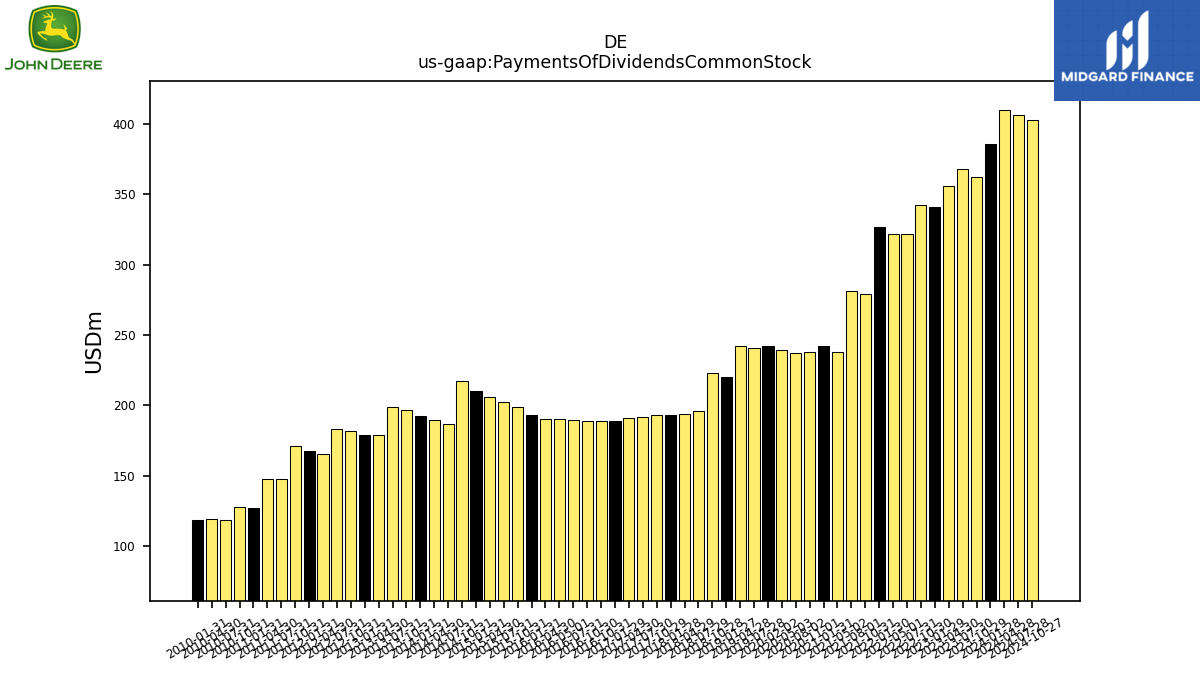 |
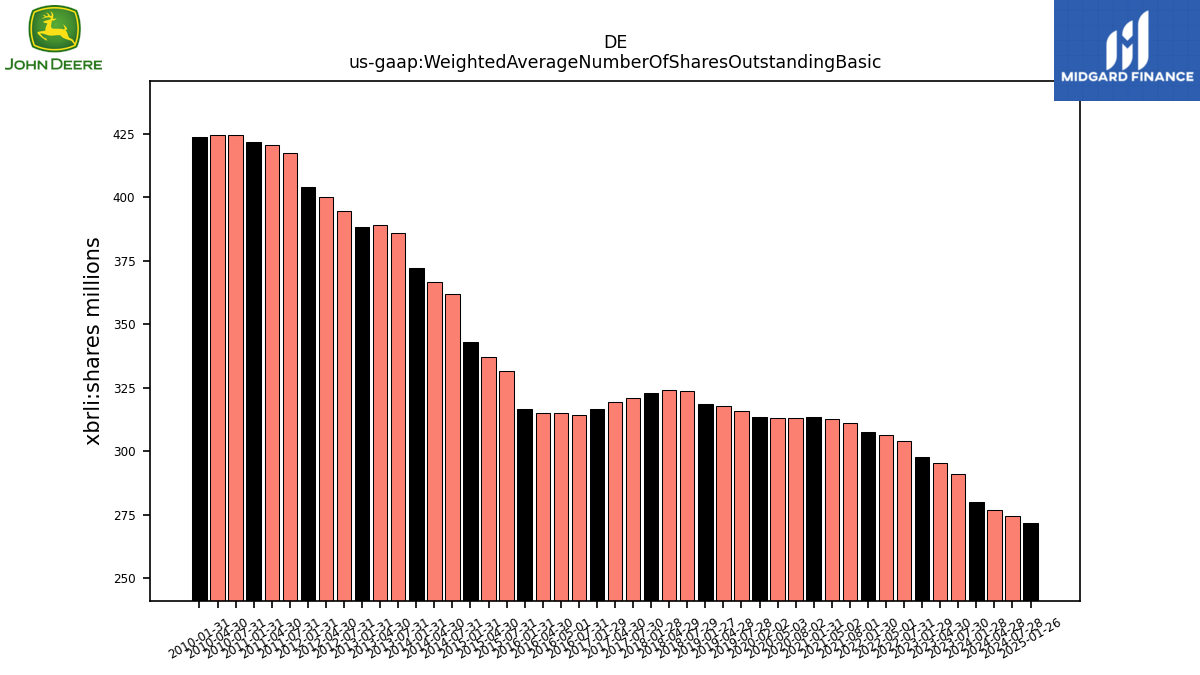 |
DE | |||||
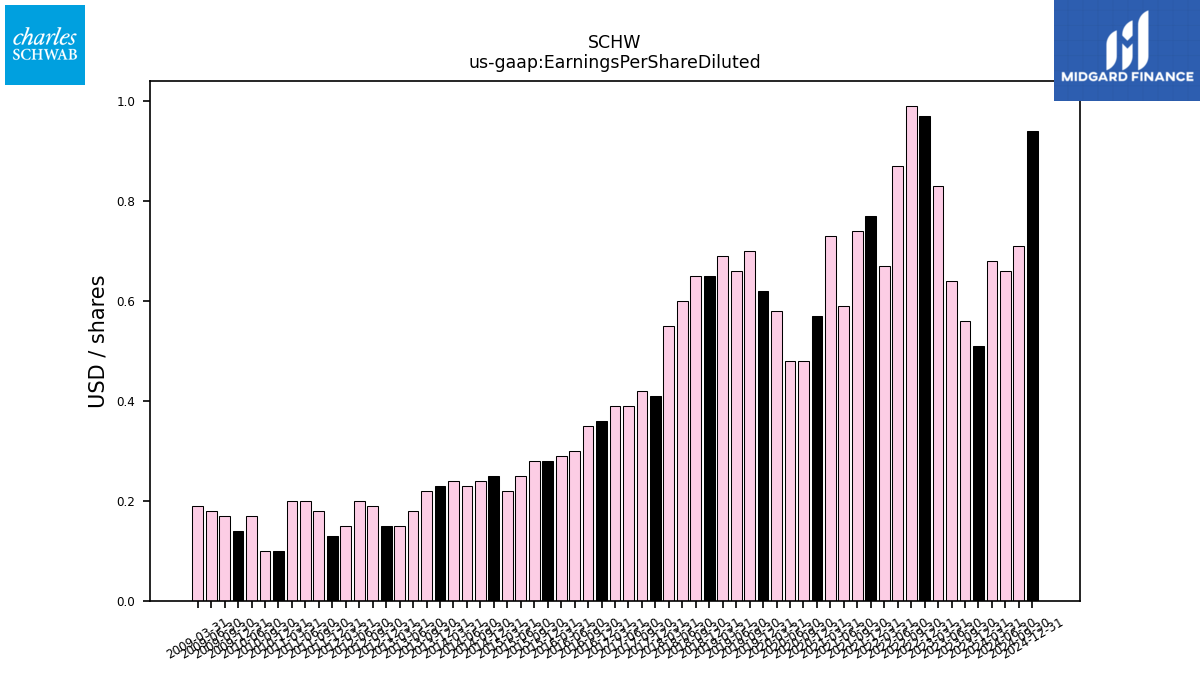
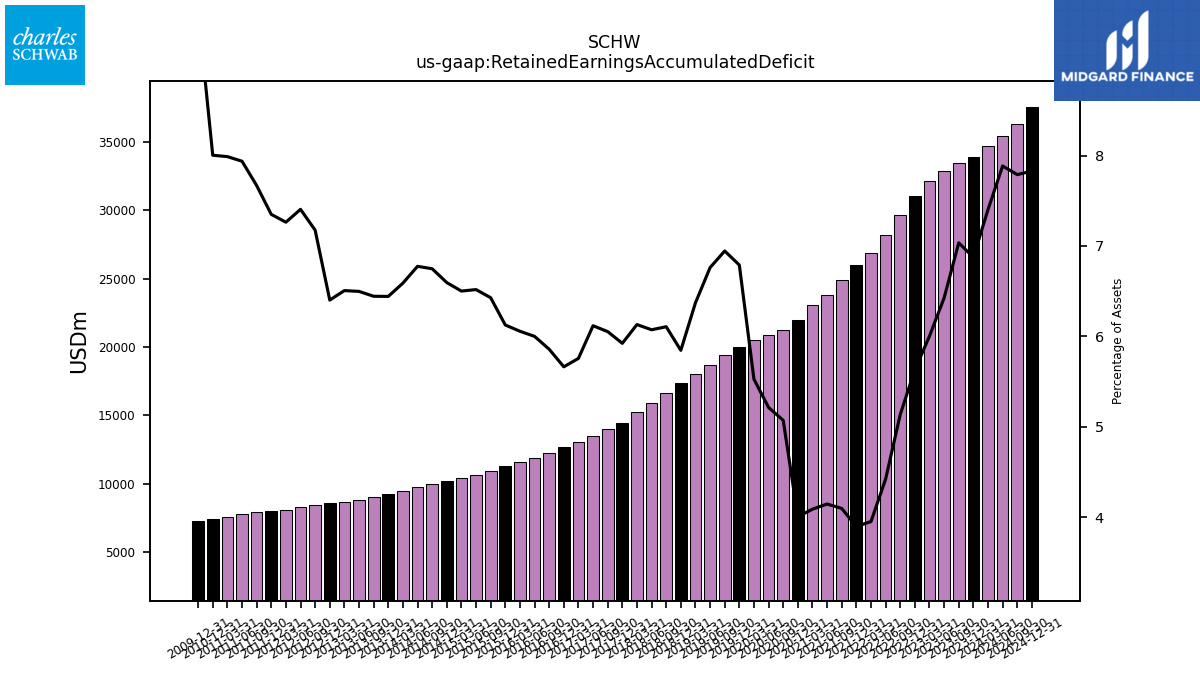
| $SCHW$ | 2025-02-26 | 2024-11-08 | 2025-04-17 | NA | NA | SCHW | 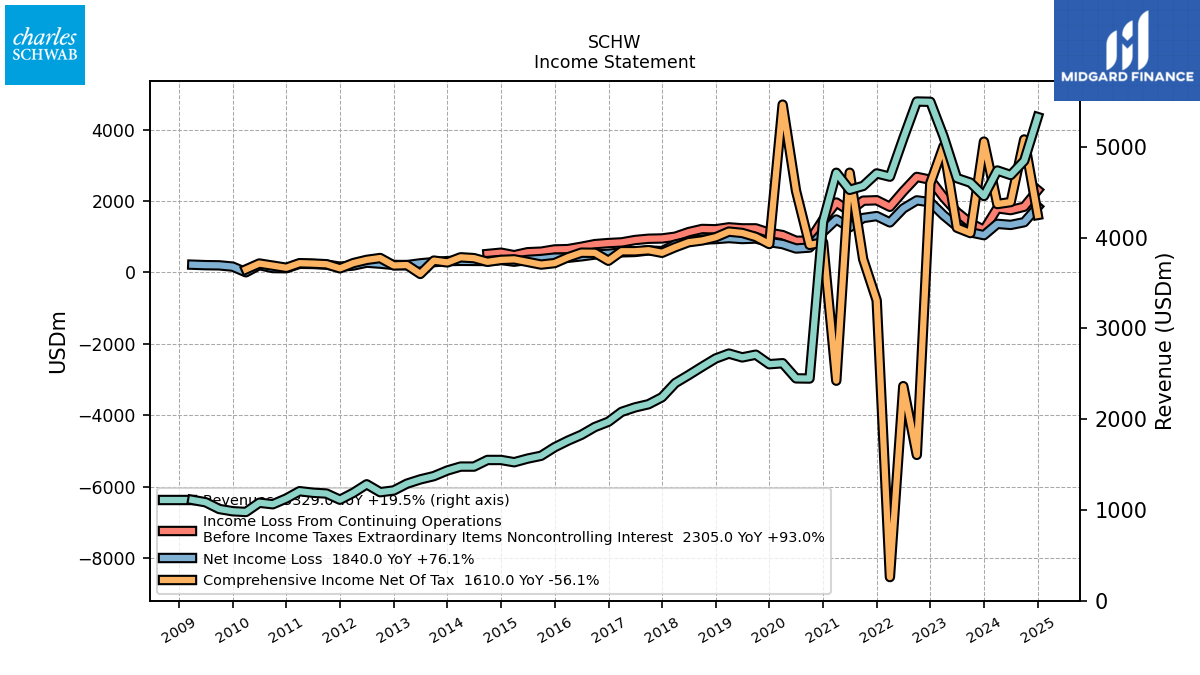 |
 |
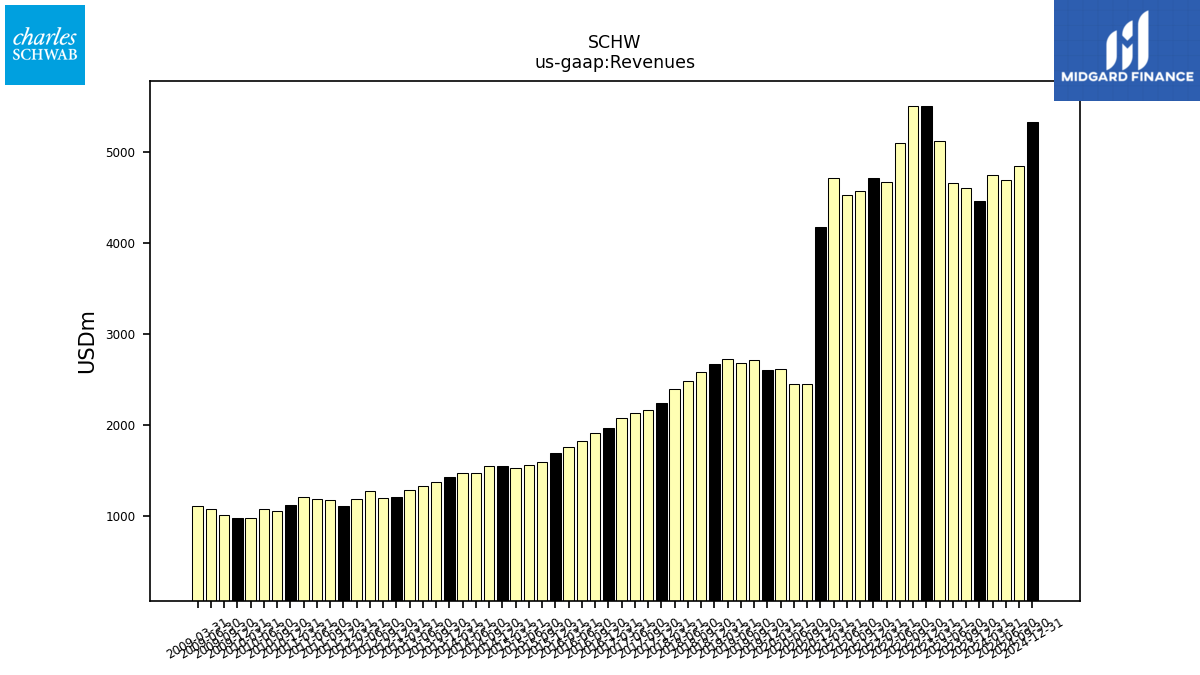 |
SCHW | 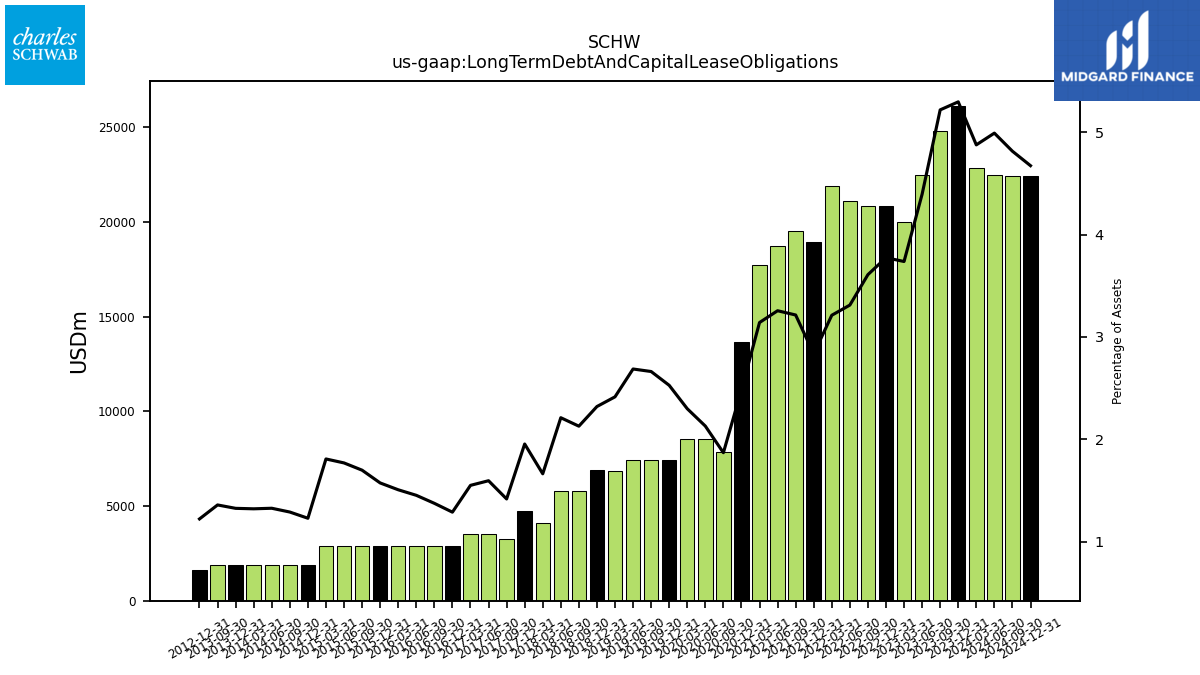 |
SCHW | 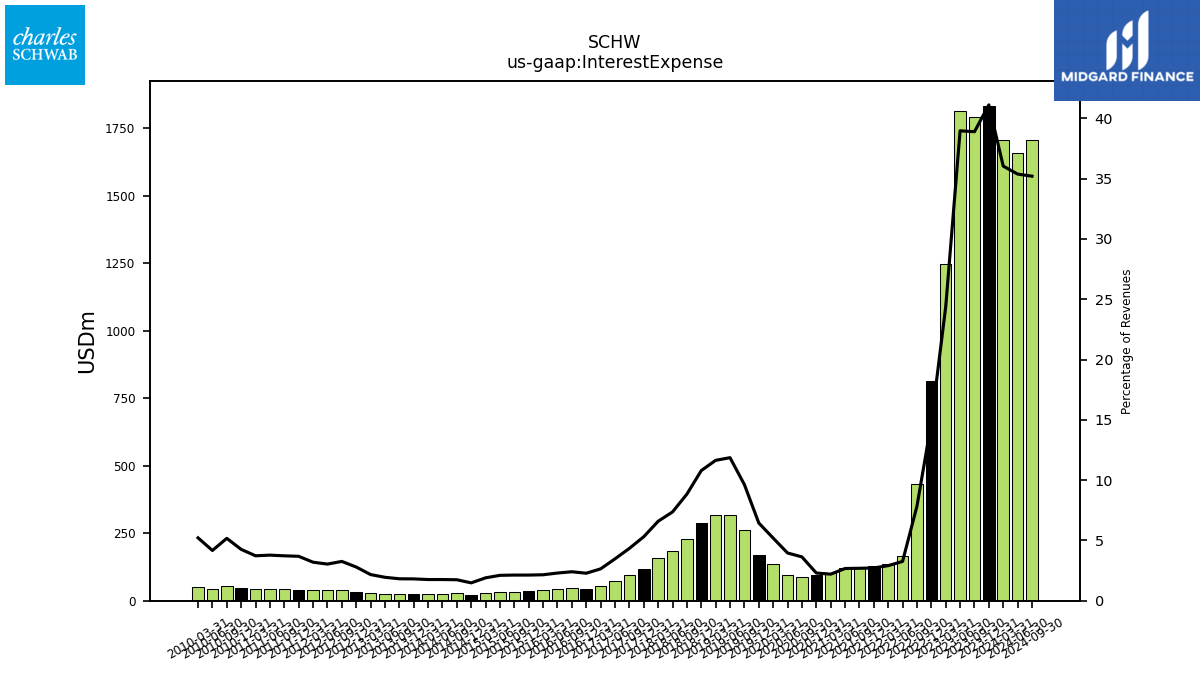 |
 |
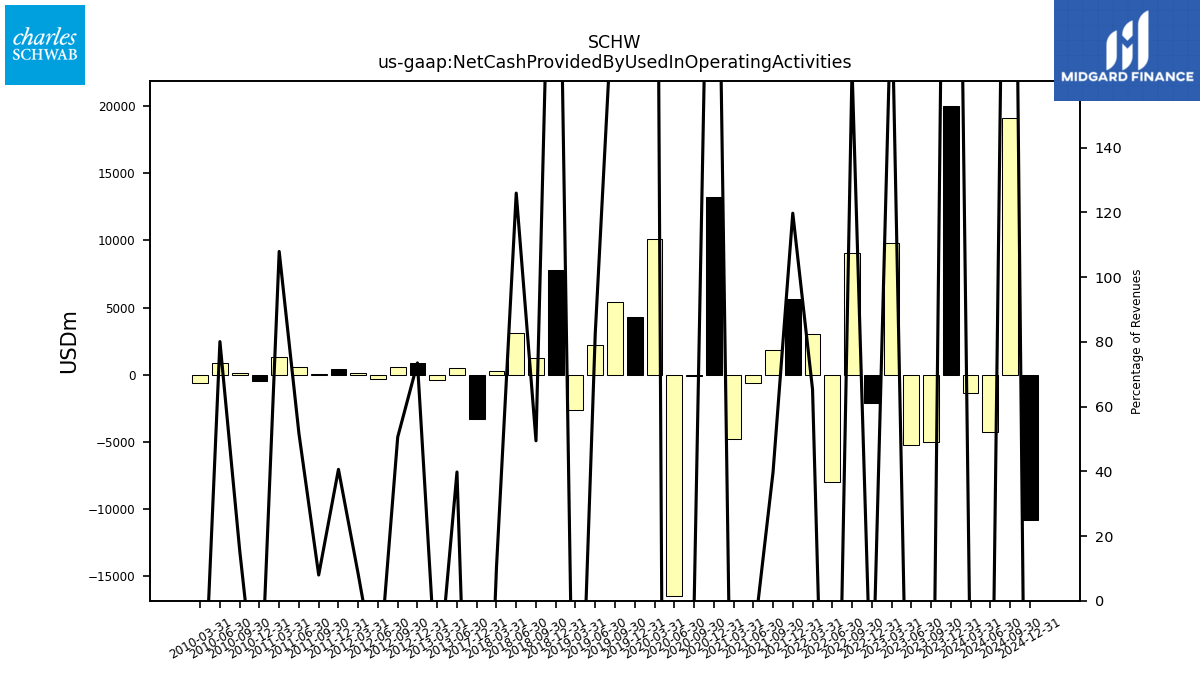 |
SCHW | 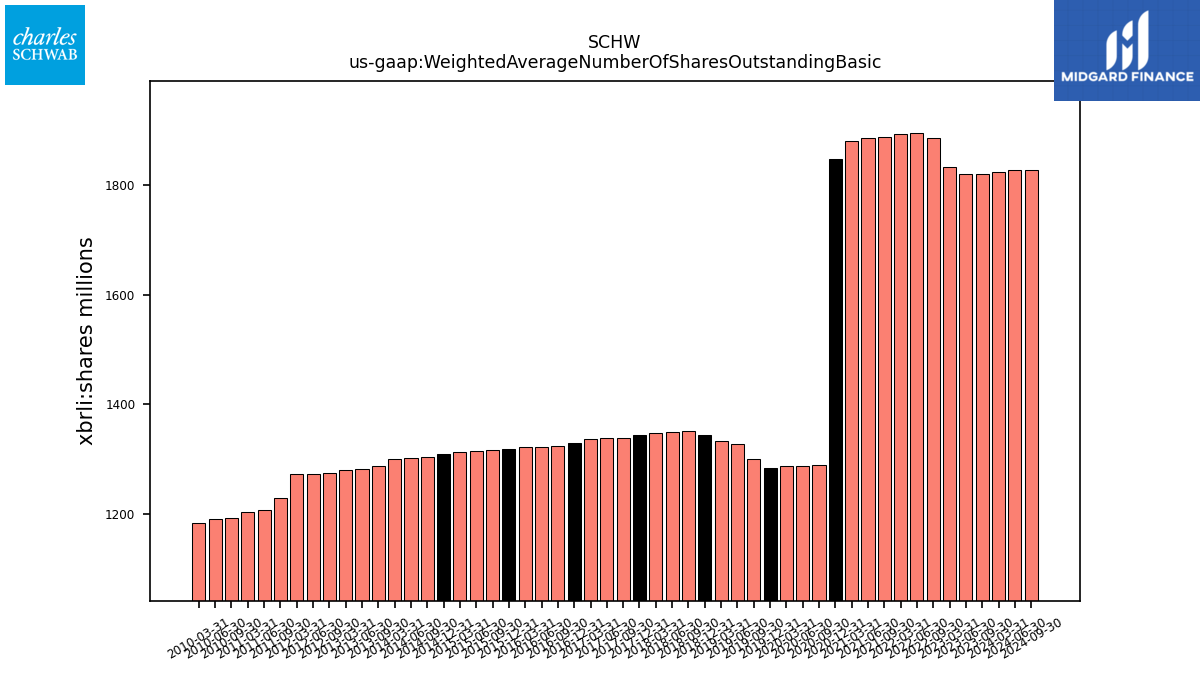 |
SCHW | |||||||
| $NVDA$ | 2025-02-26 | 2024-11-20 | 2025-02-26 | NA | NA | NVDA | 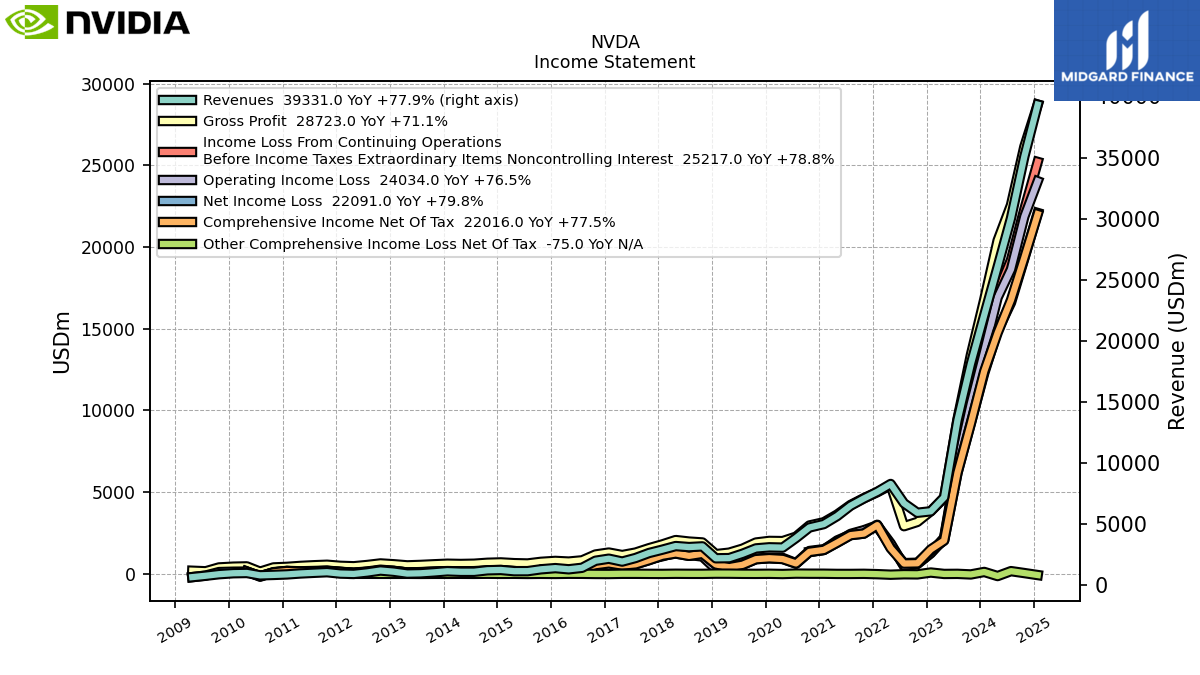 |
 |
 |
NVDA |  |
 |
 |
NVDA |  |
 |
 |
NVDA | 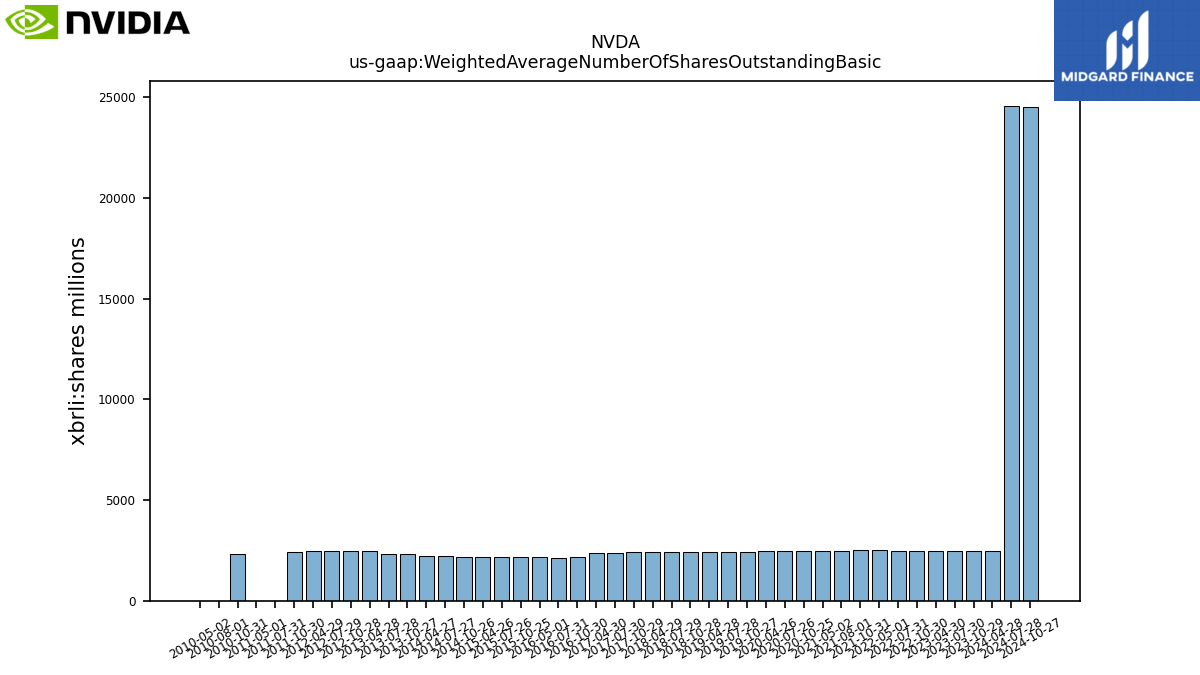 |
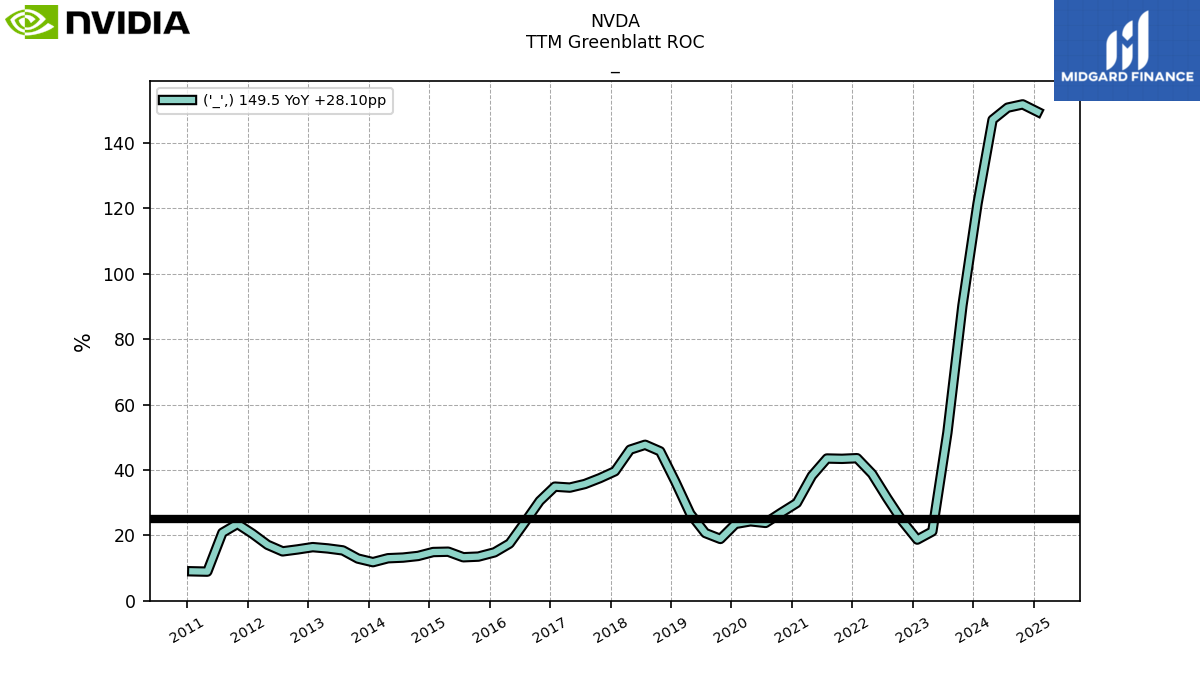 |
NVDA | ||||
| Ticker | 10K | 10Q | 8K | Sector | Industry | Logo | Forward P/E | Revenue Growth | Ticker | Income | EPS | Revenues | Ticker | GrossProfit | OperatingIncome | LongTermDebt | Ticker | InterestExpense | RetainedEarnnings | CashFlowOperating | Ticker | Dividends | SharesOutstanding | TTMGreenblattROC | |
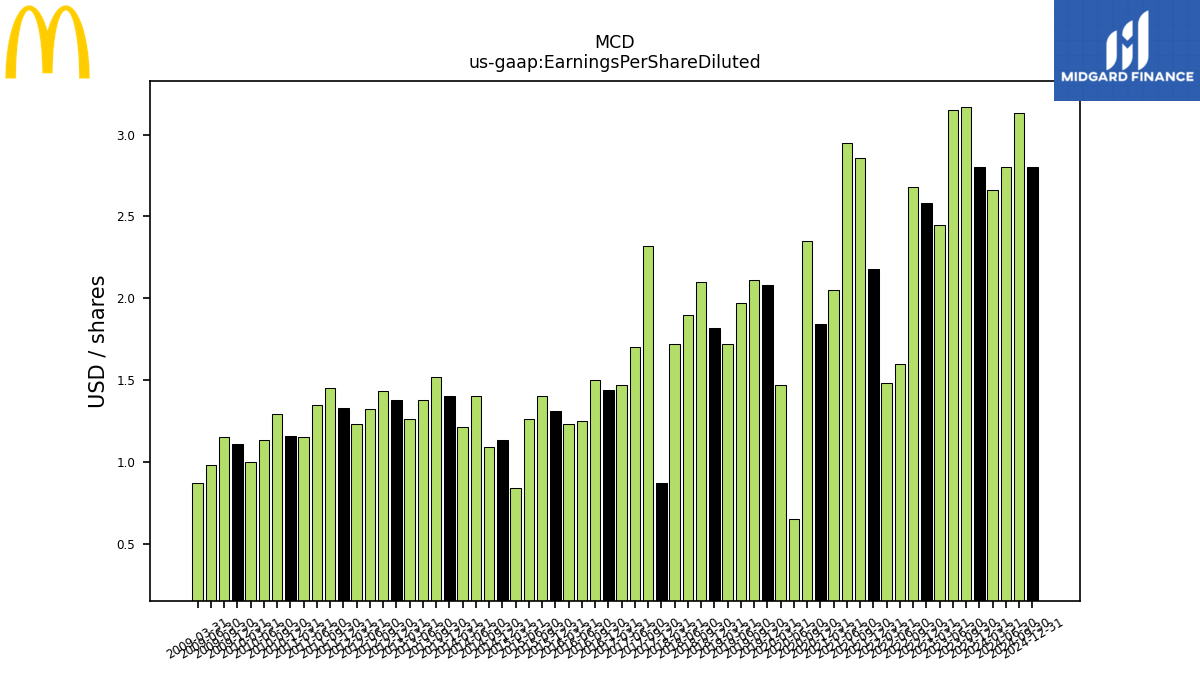
| $MCD$ | 2025-02-25 | 2024-11-07 | 2025-05-01 |  |
NA | NA | MCD | 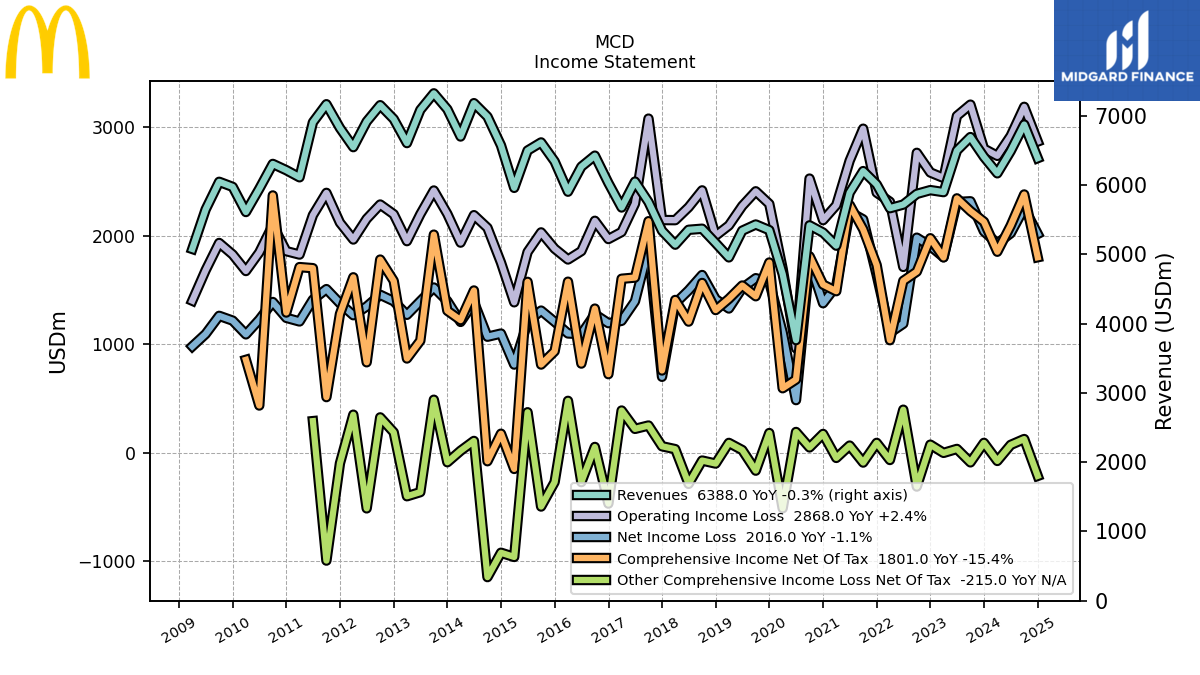 |
 |
 |
MCD |  |
 |
MCD |  |
 |
 |
MCD |  |
 |
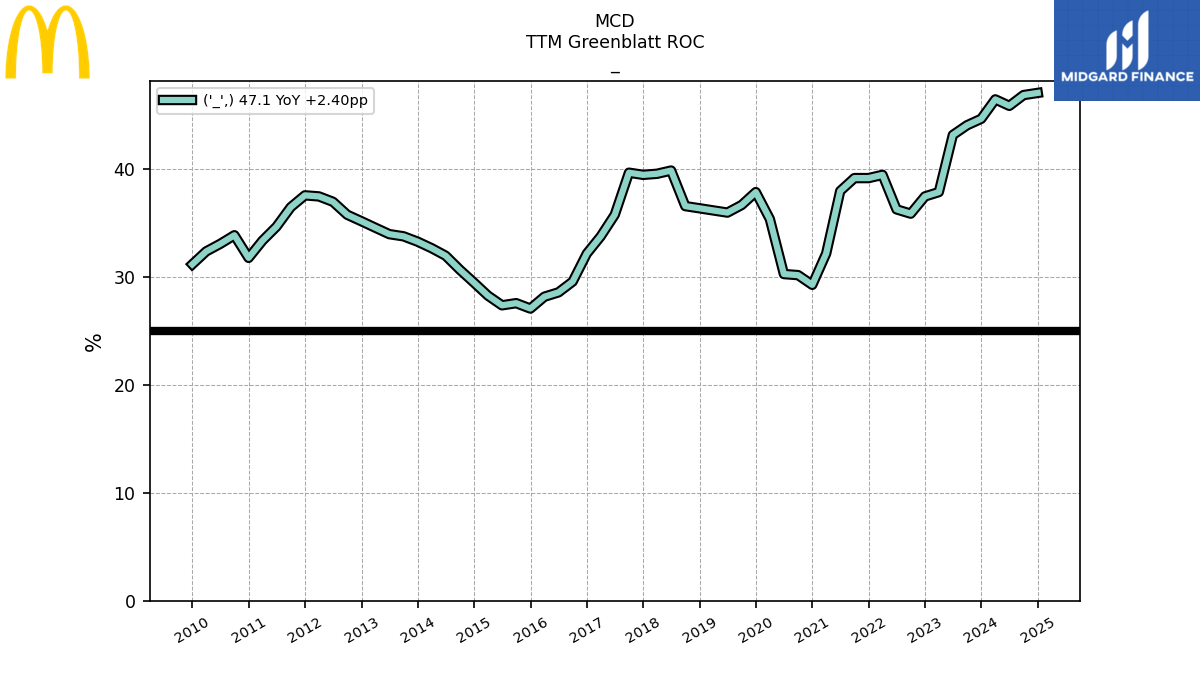 |
MCD | |||
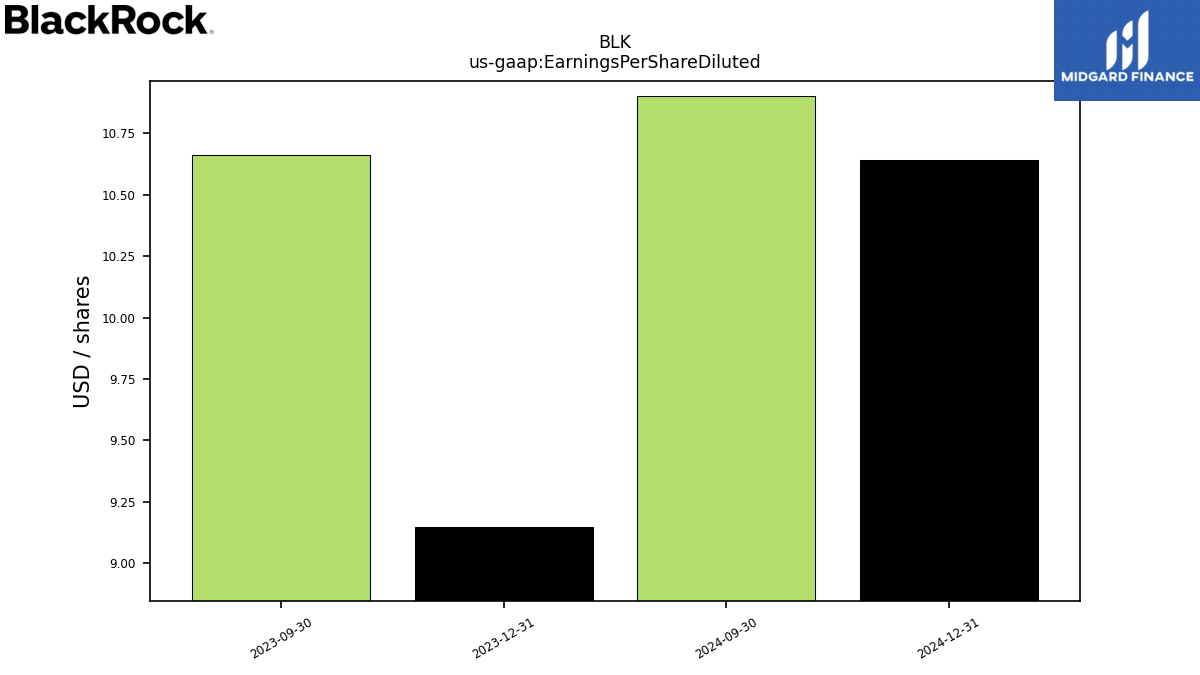
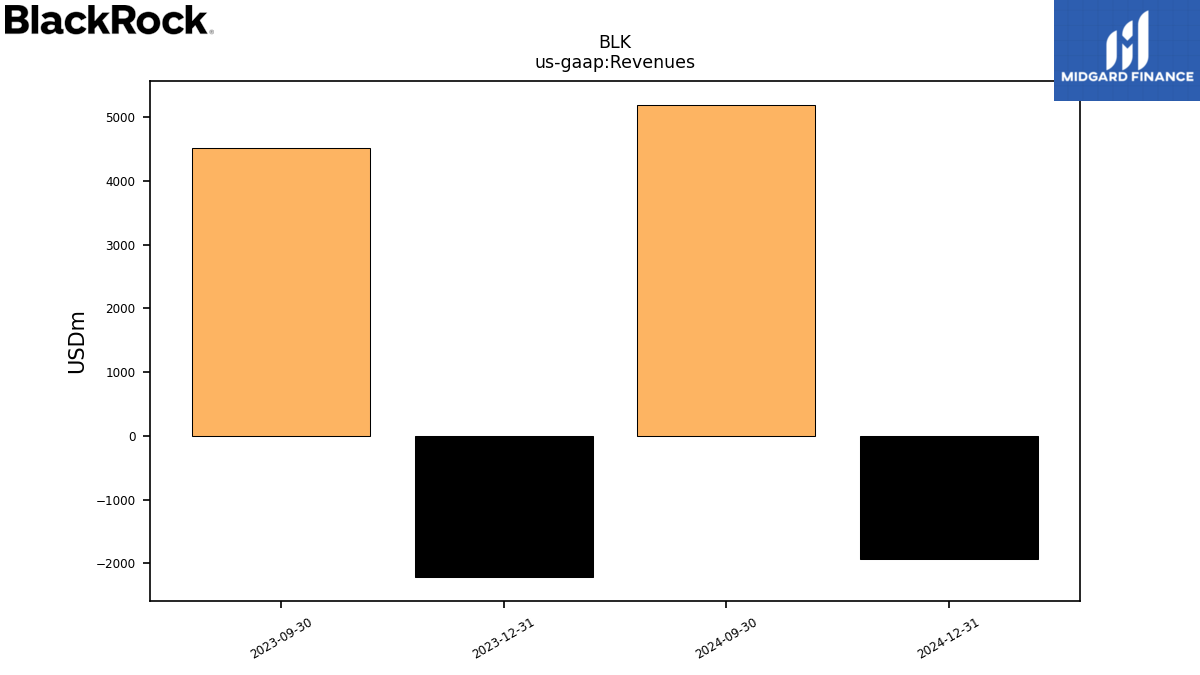
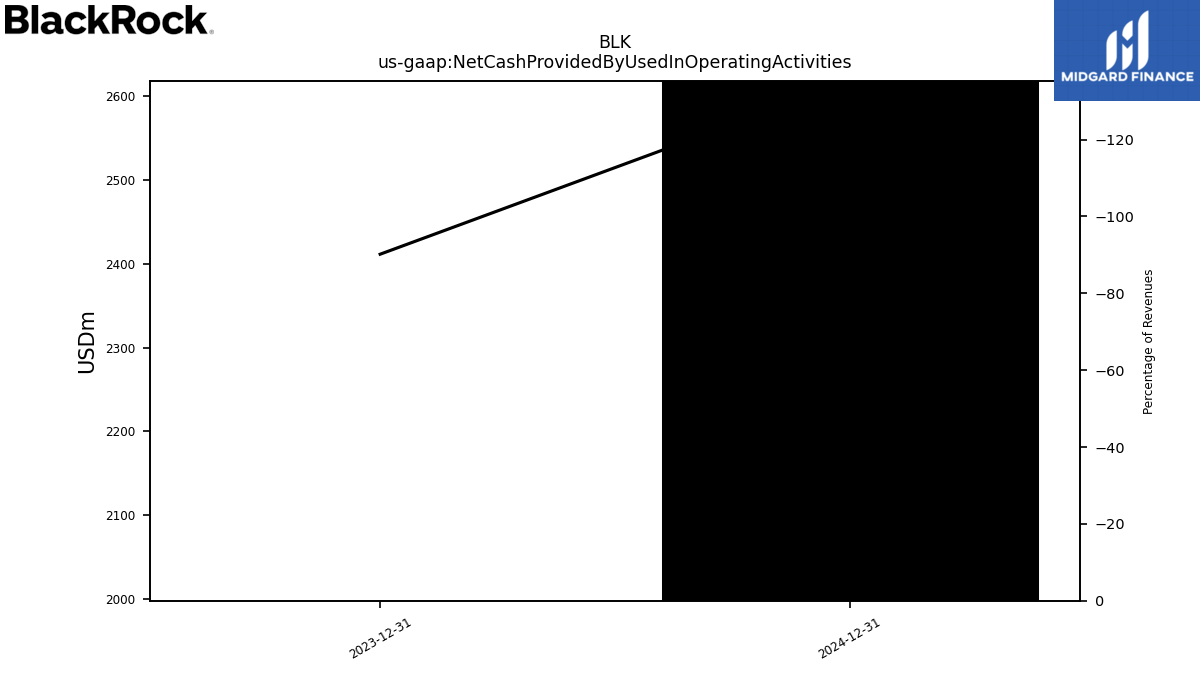
| $BLK$ | 2025-02-25 | 2024-11-06 | 2025-04-11 |  |
NA | NA | BLK | 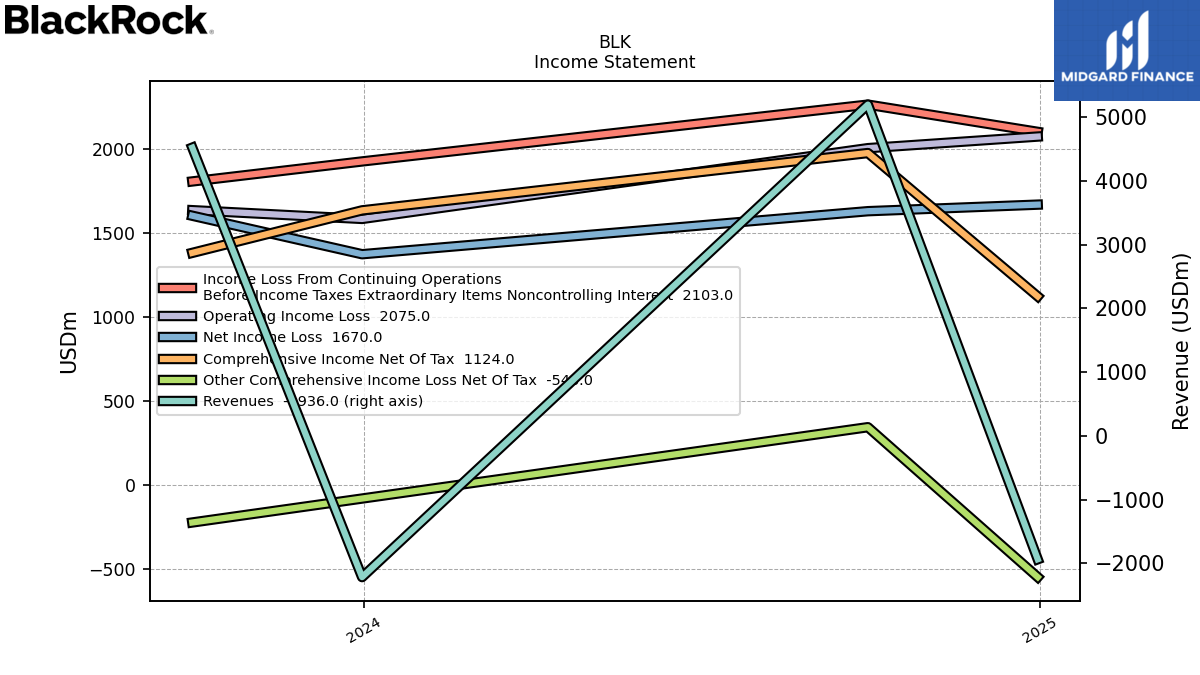 |
 |
 |
BLK | 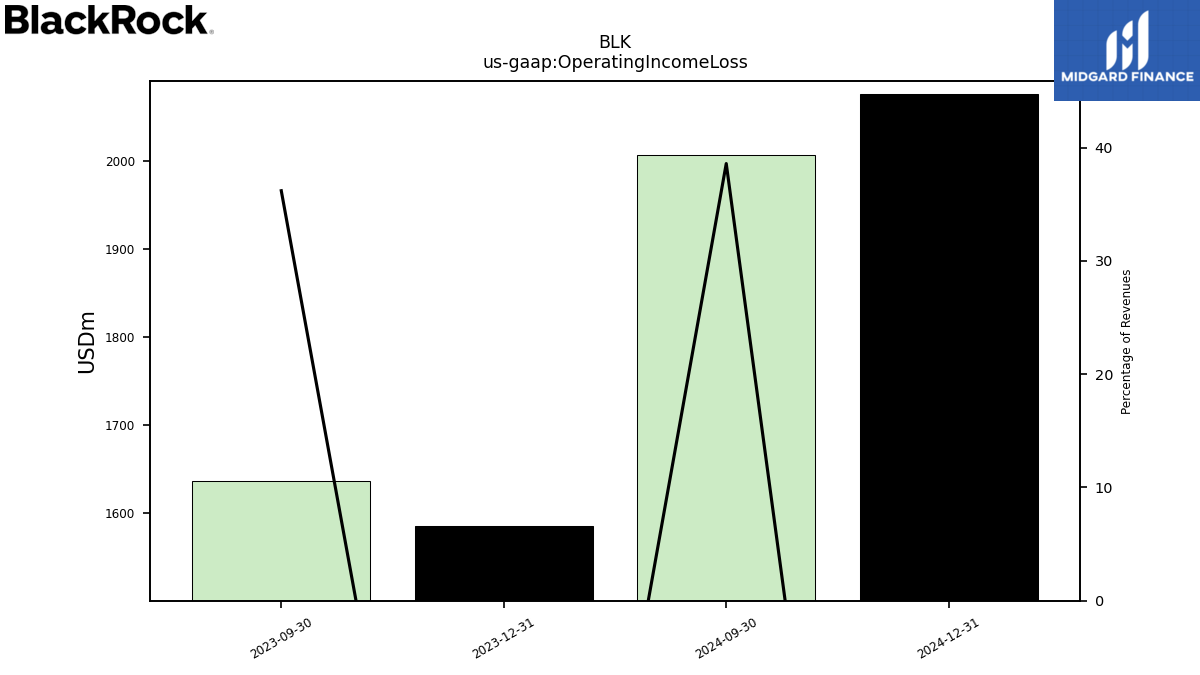 |
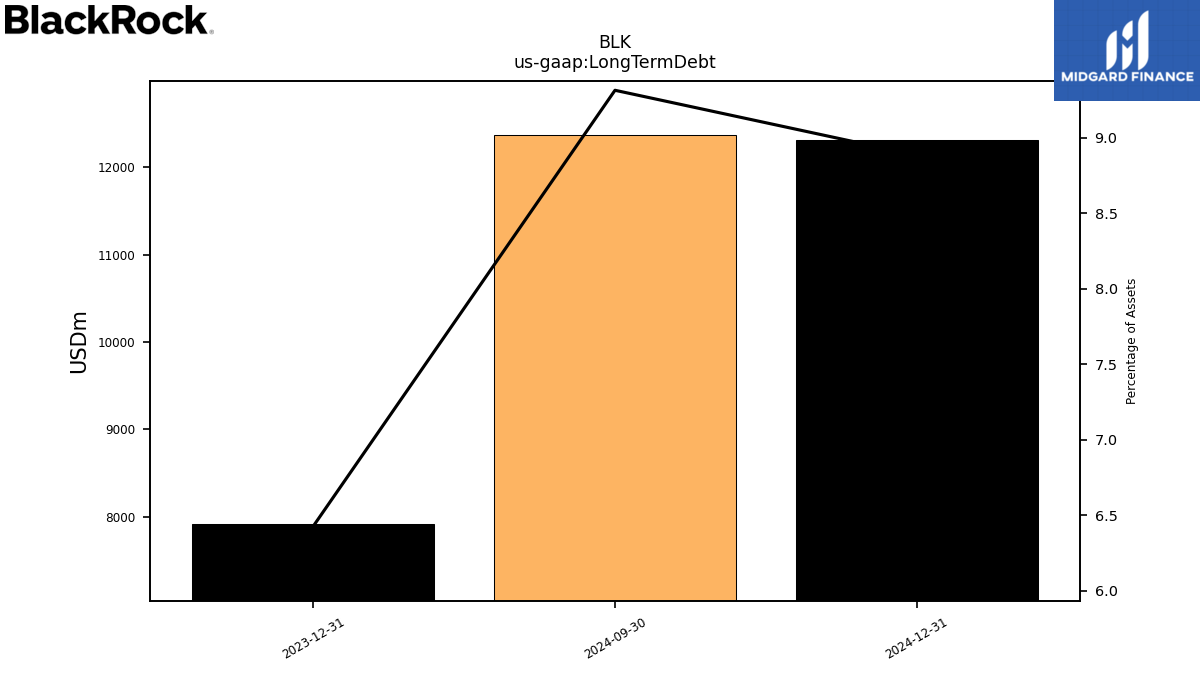 |
BLK | 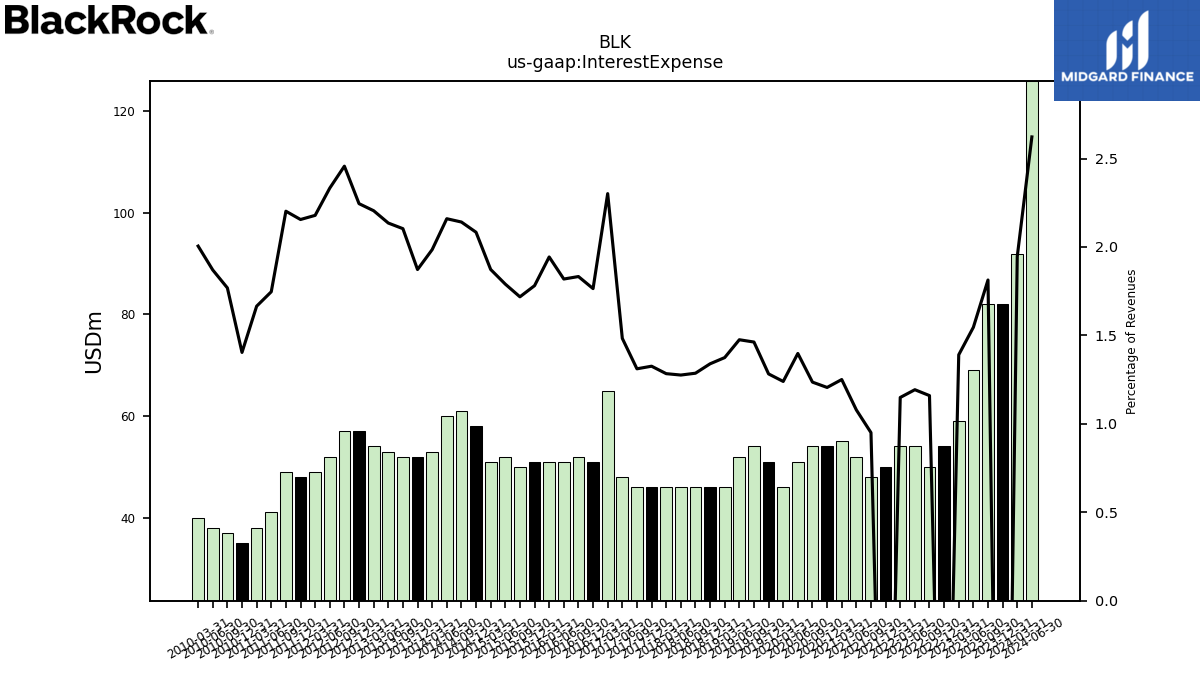 |
 |
BLK | 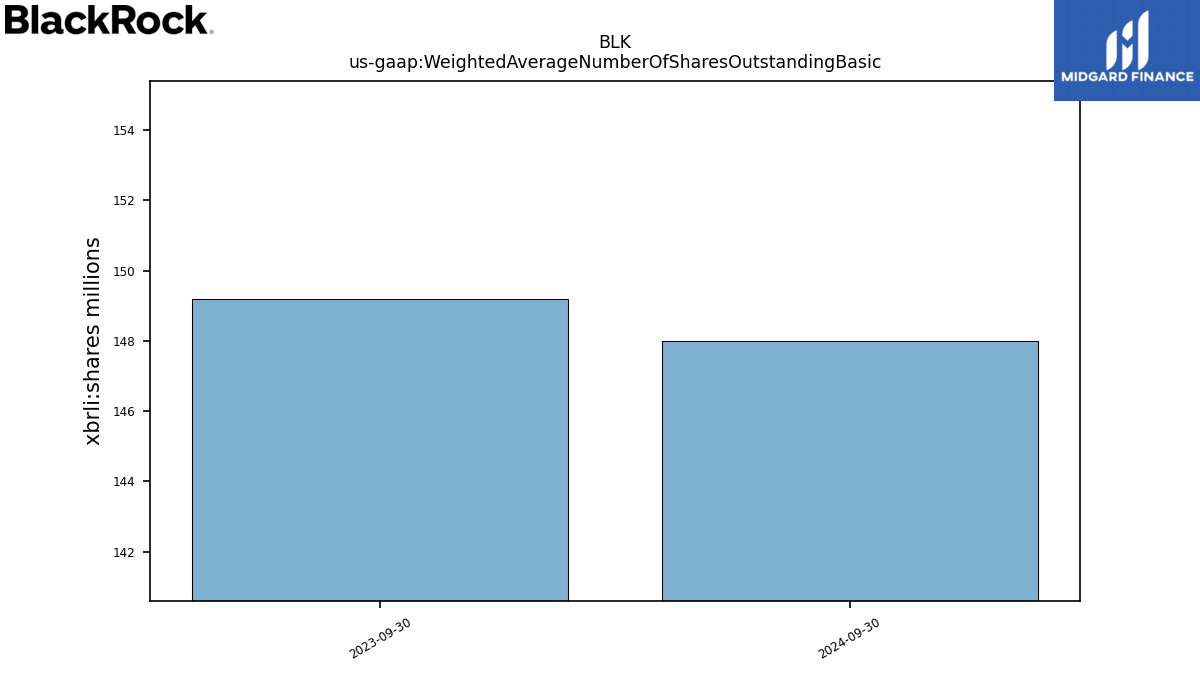 |
BLK | ||||||
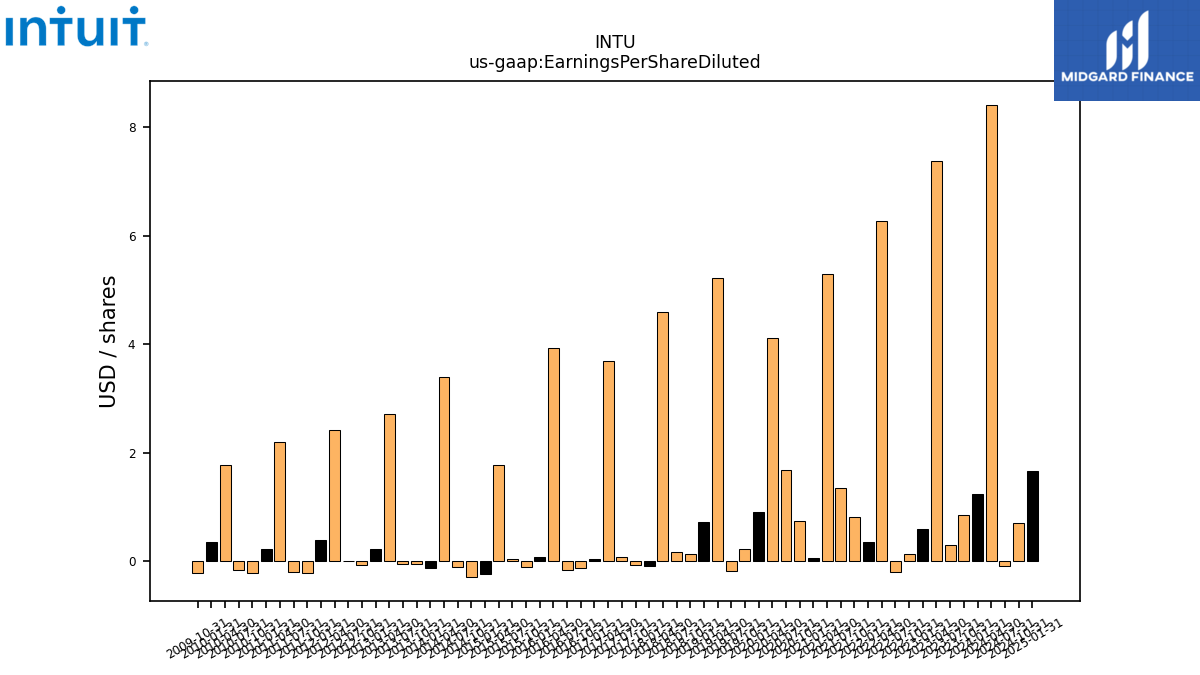
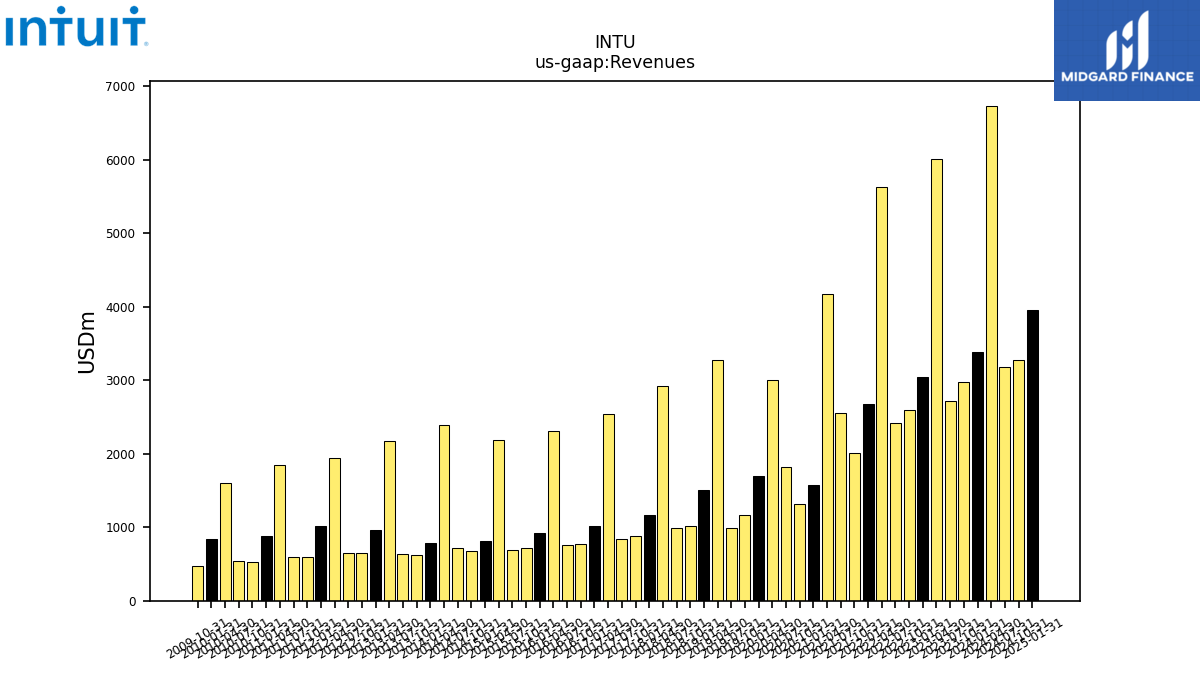
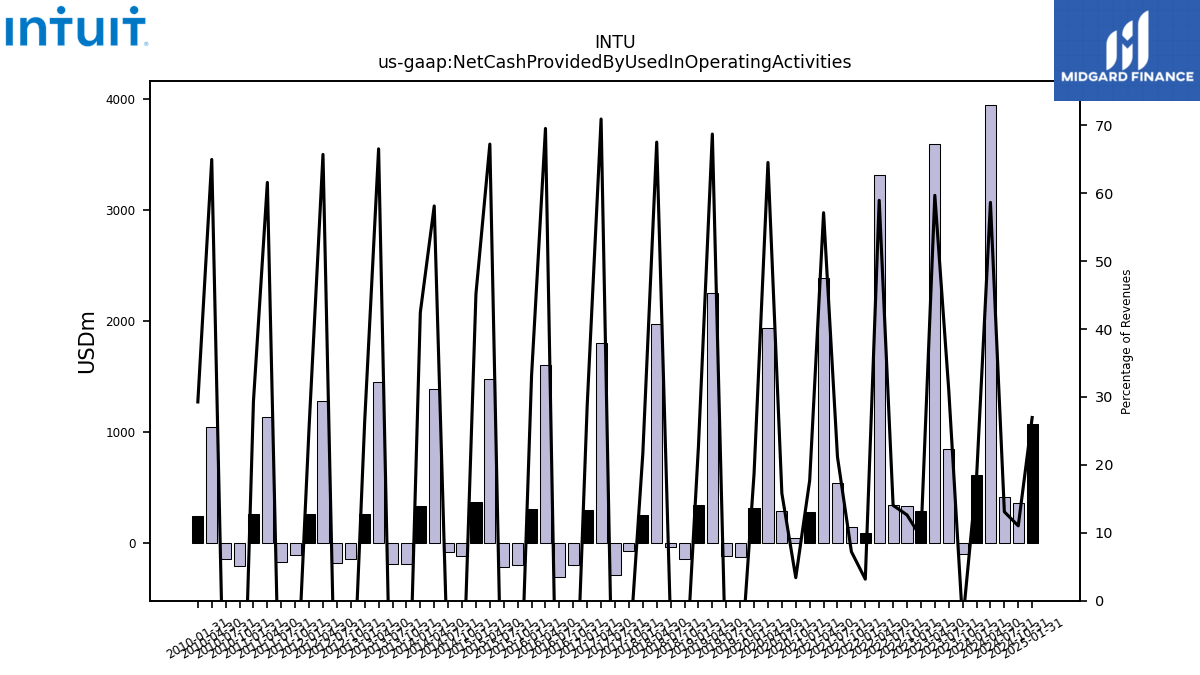
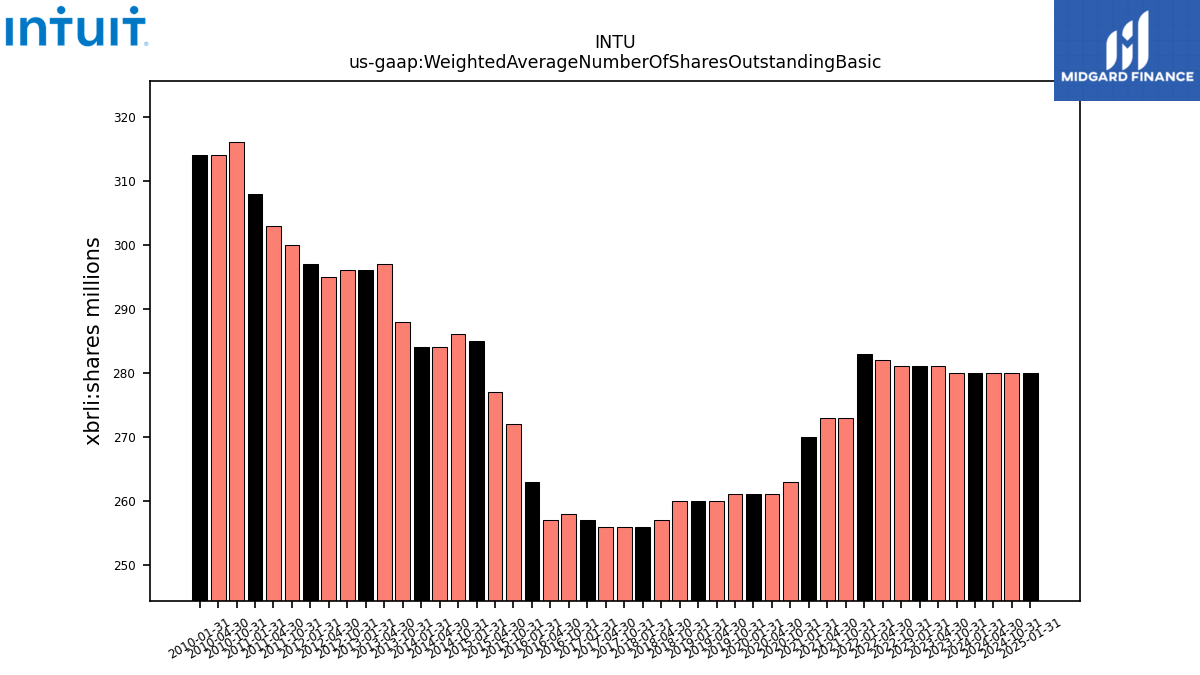
| $INTU$ | 2024-09-04 | 2025-02-25 | 2025-02-25 | NA | NA | INTU | 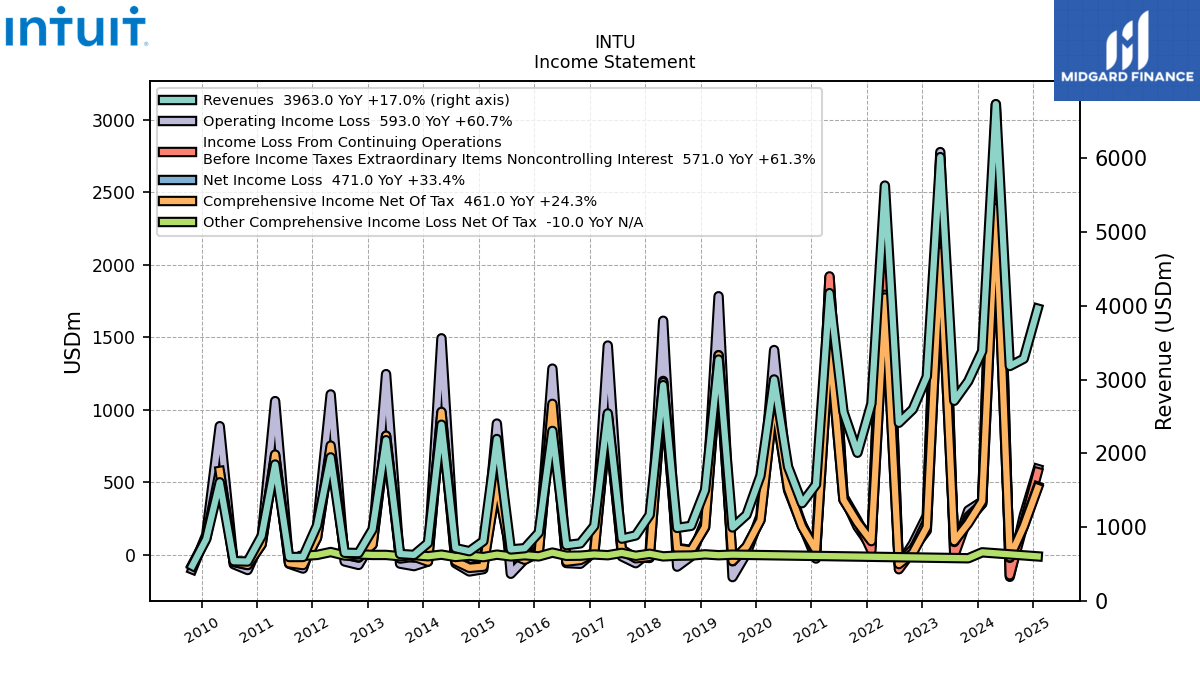 |
 |
 |
INTU | 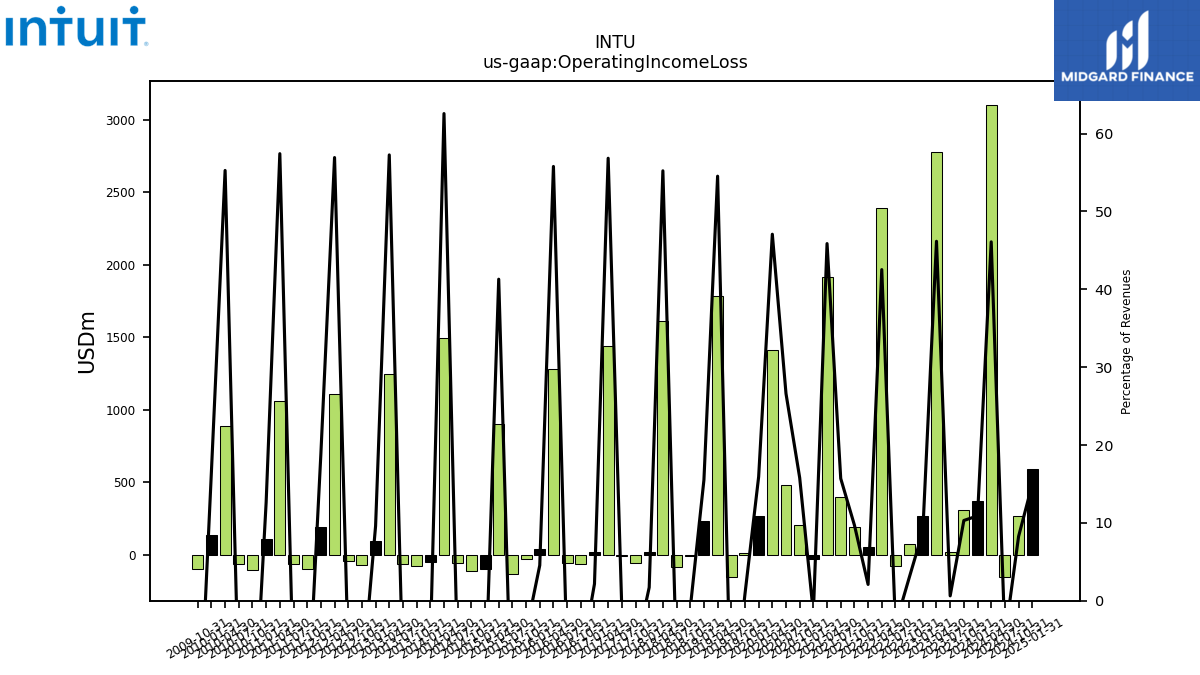 |
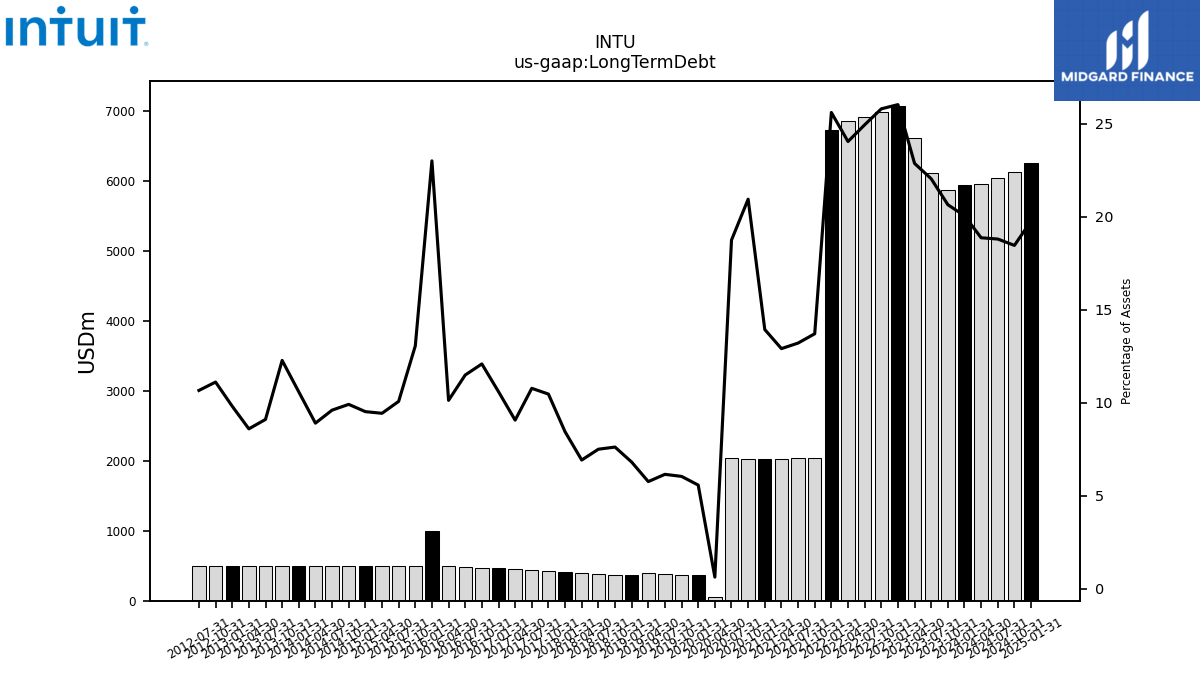 |
INTU | 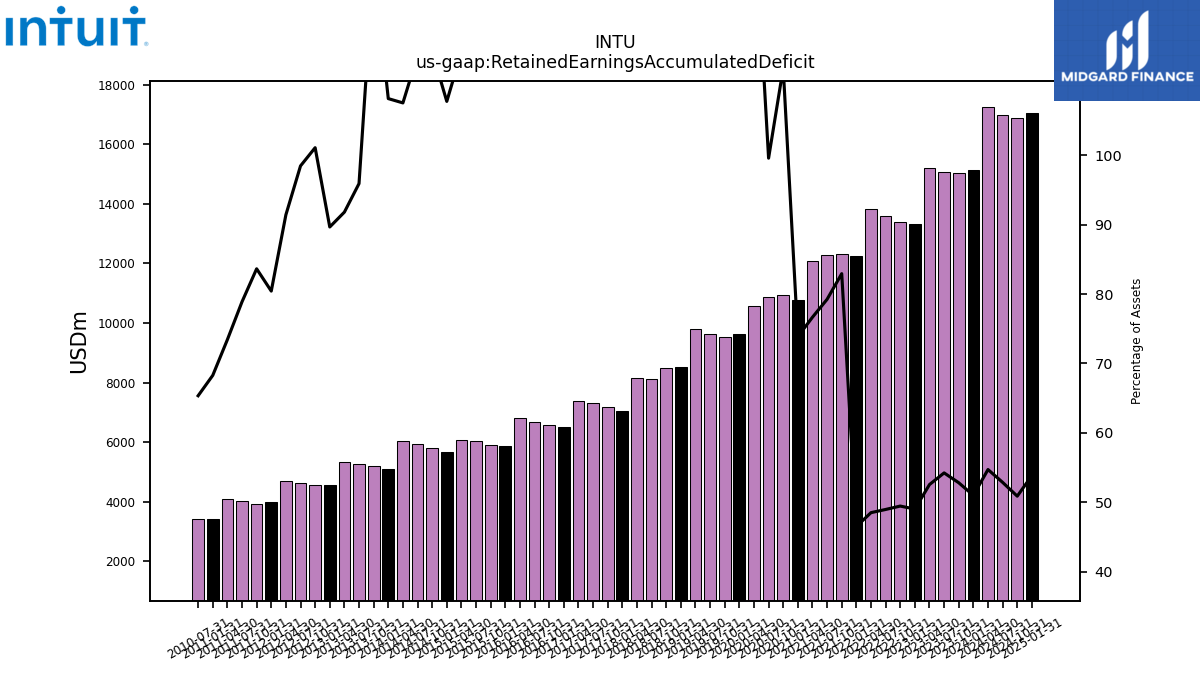 |
 |
INTU | 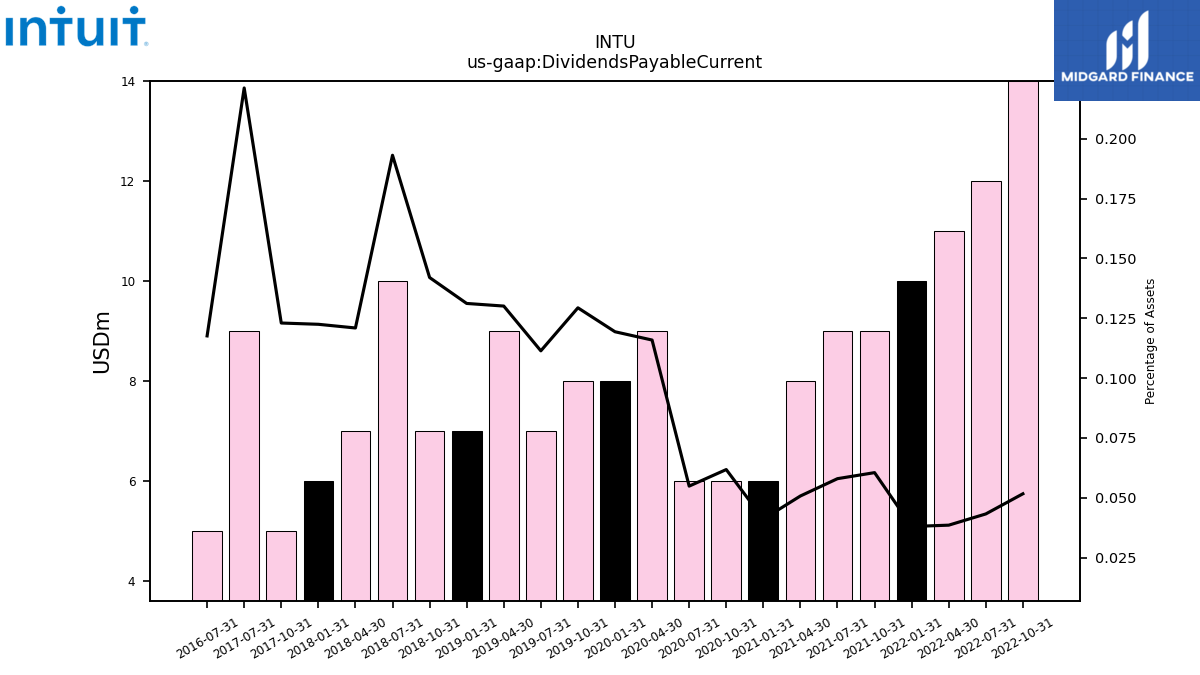 |
 |
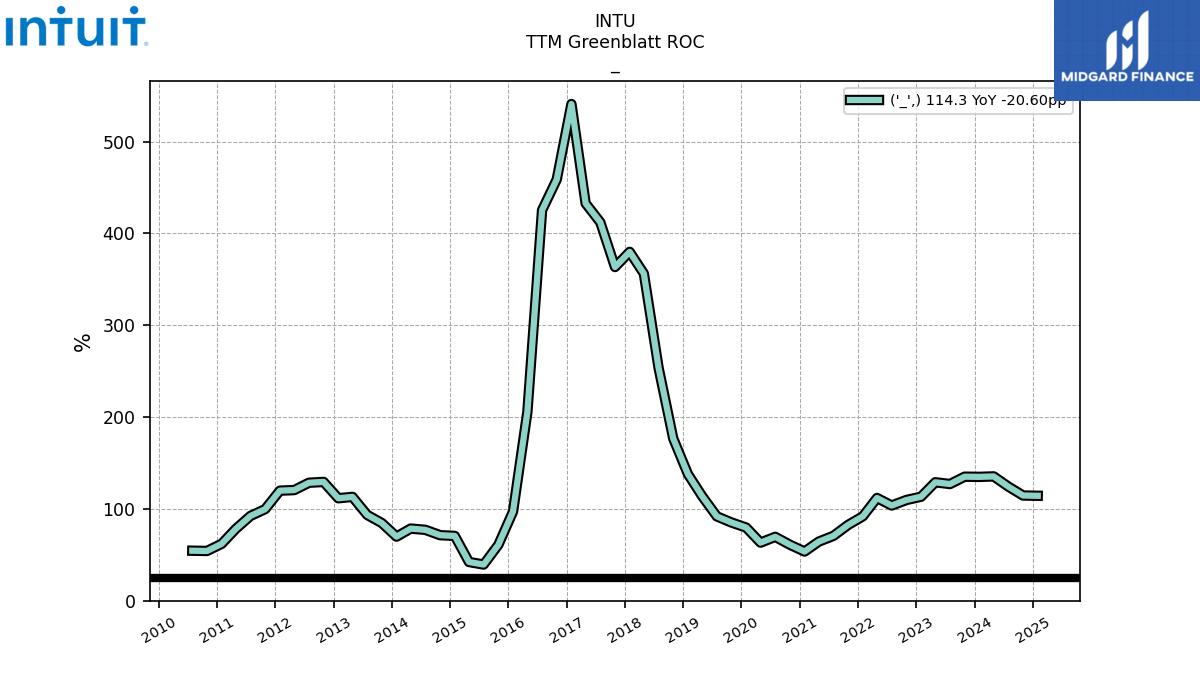 |
INTU | |||||
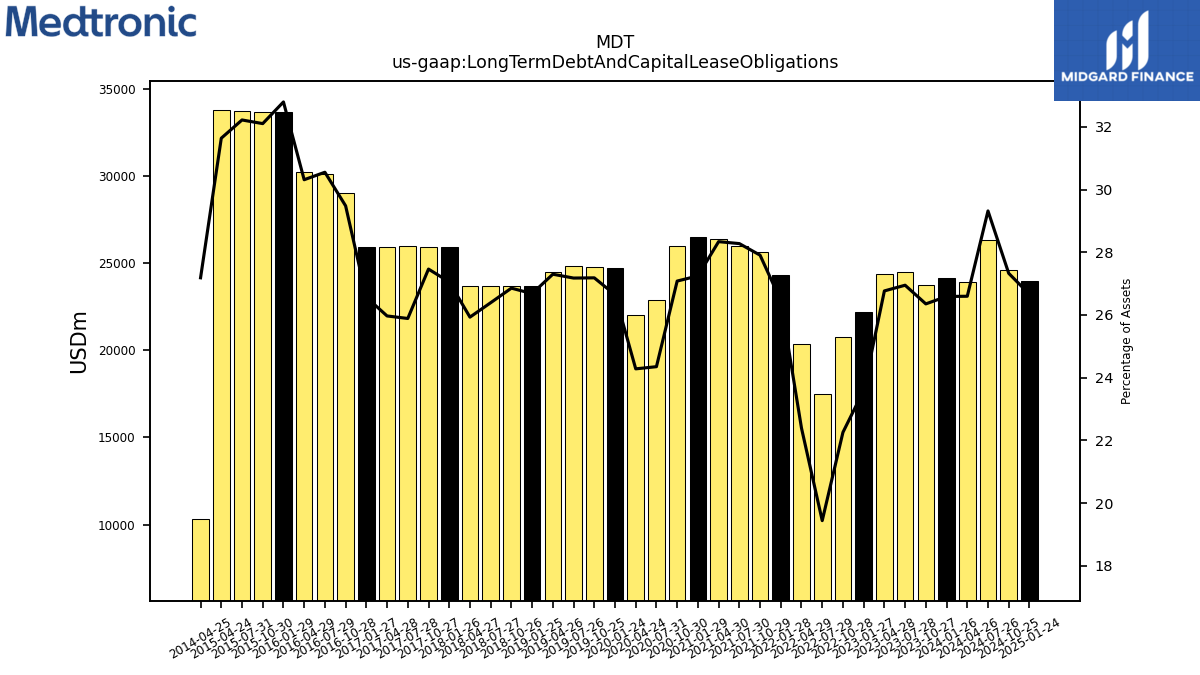
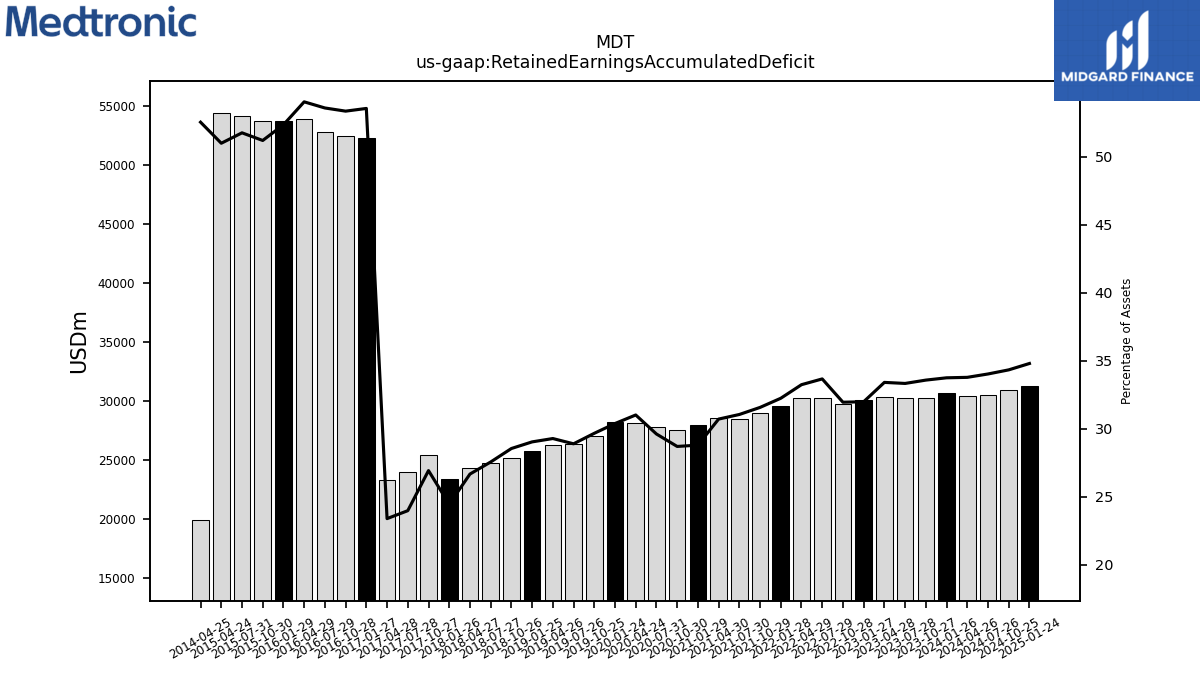
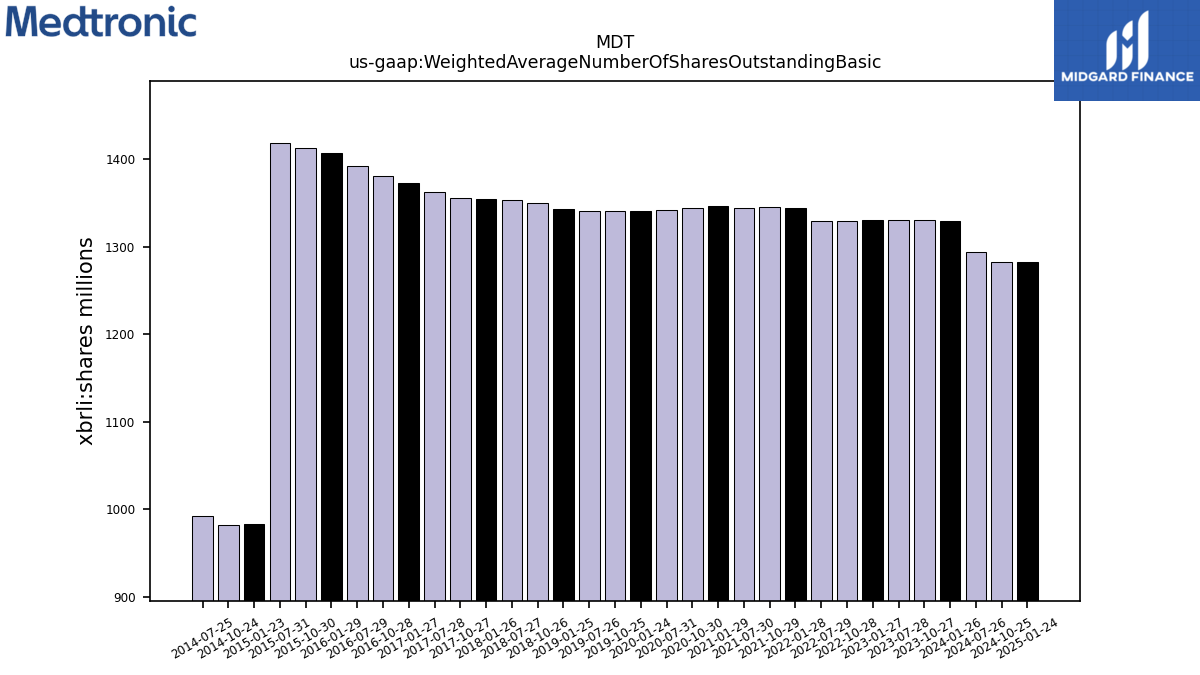
| $MDT$ | 2024-06-20 | 2025-02-25 | 2025-02-18 | NA | NA | MDT | 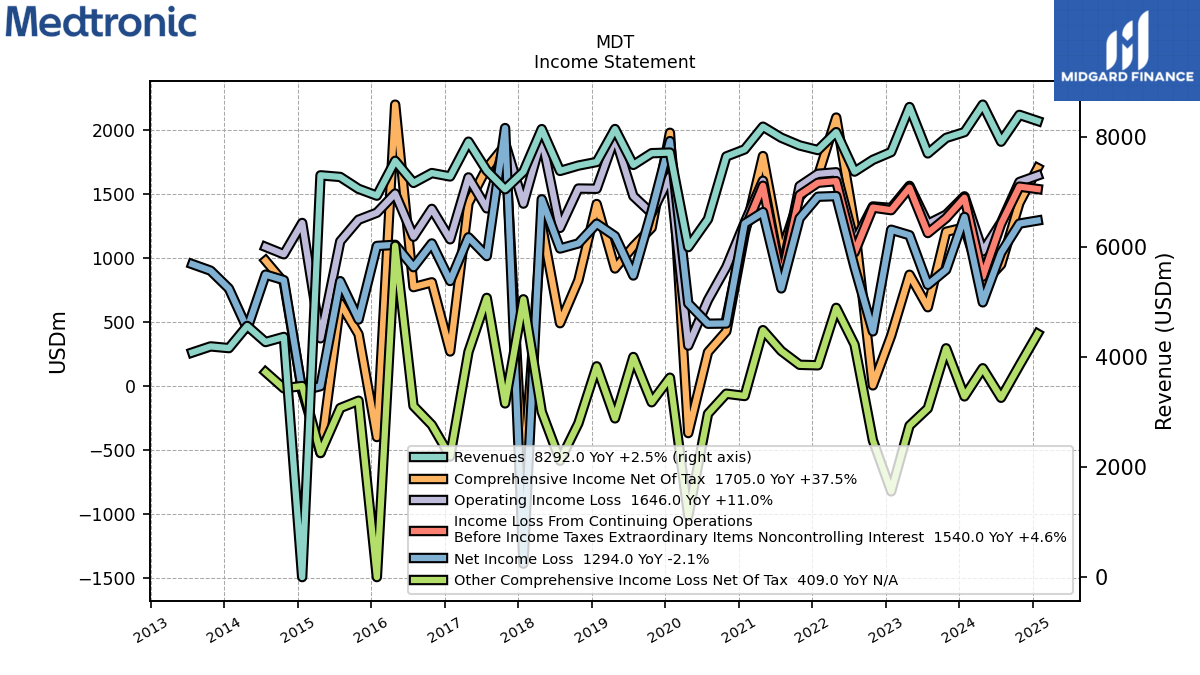 |
 |
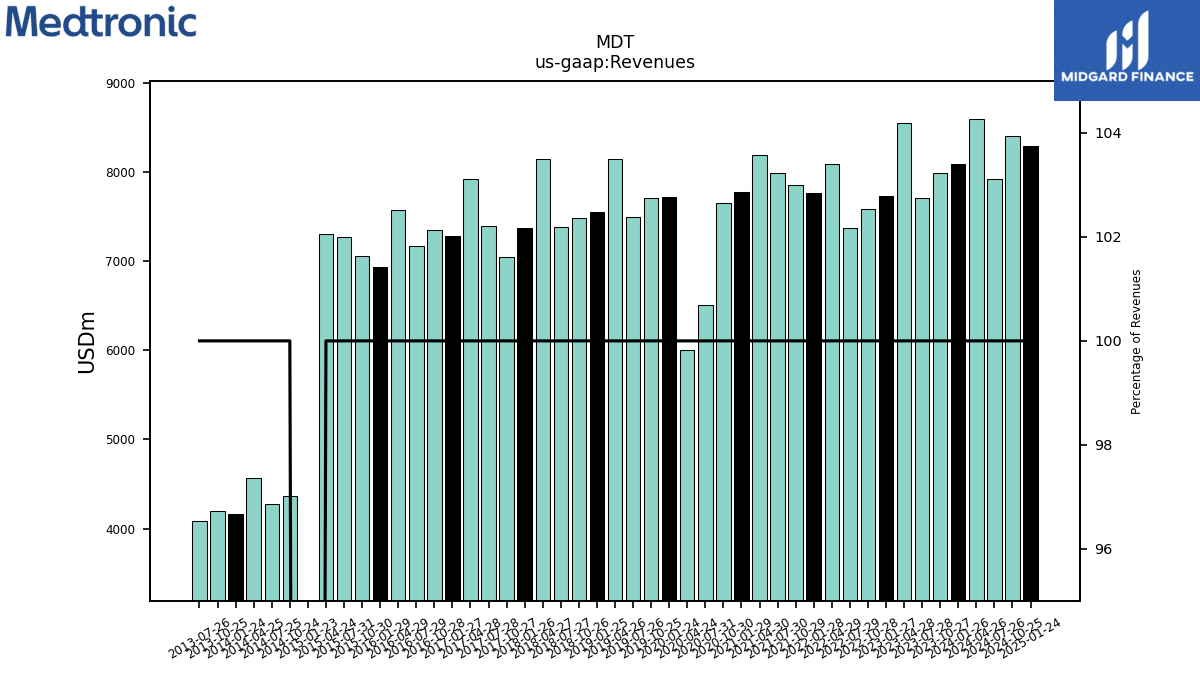 |
MDT | 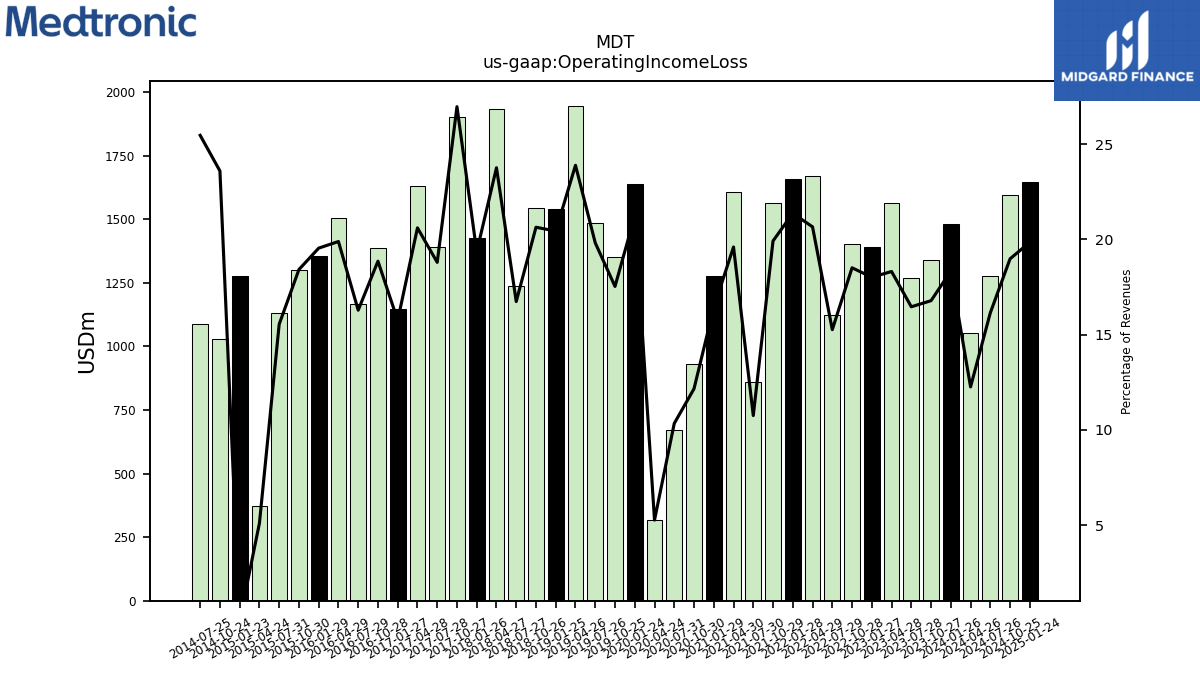 |
 |
MDT | 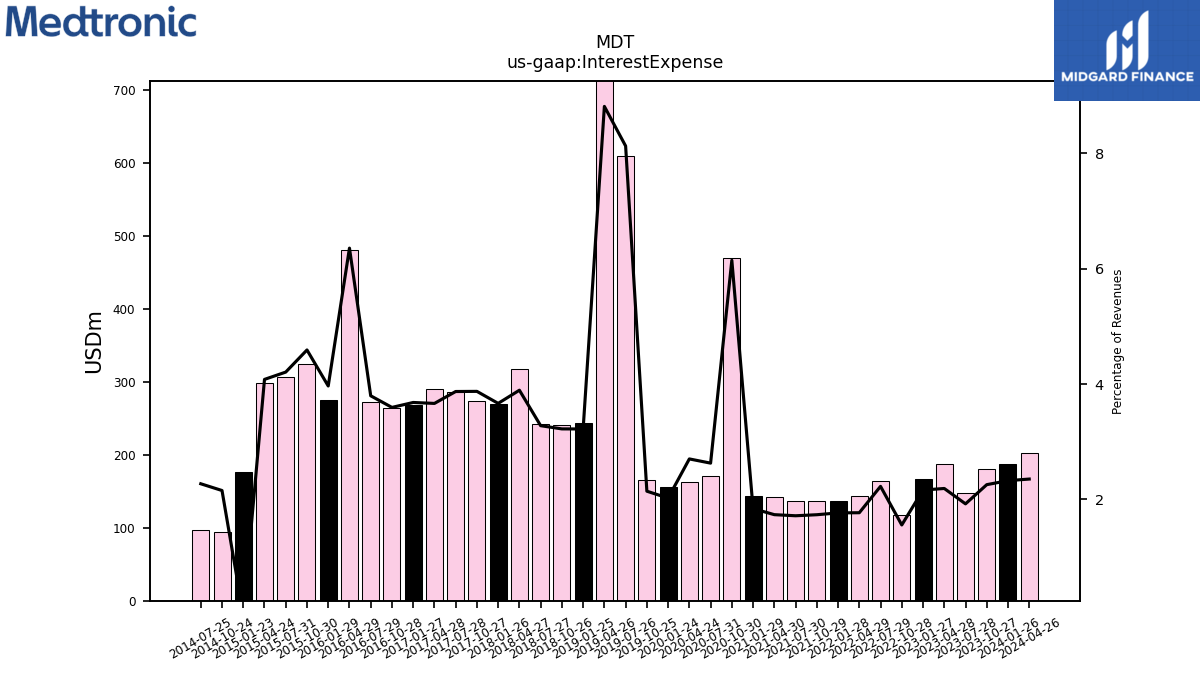 |
 |
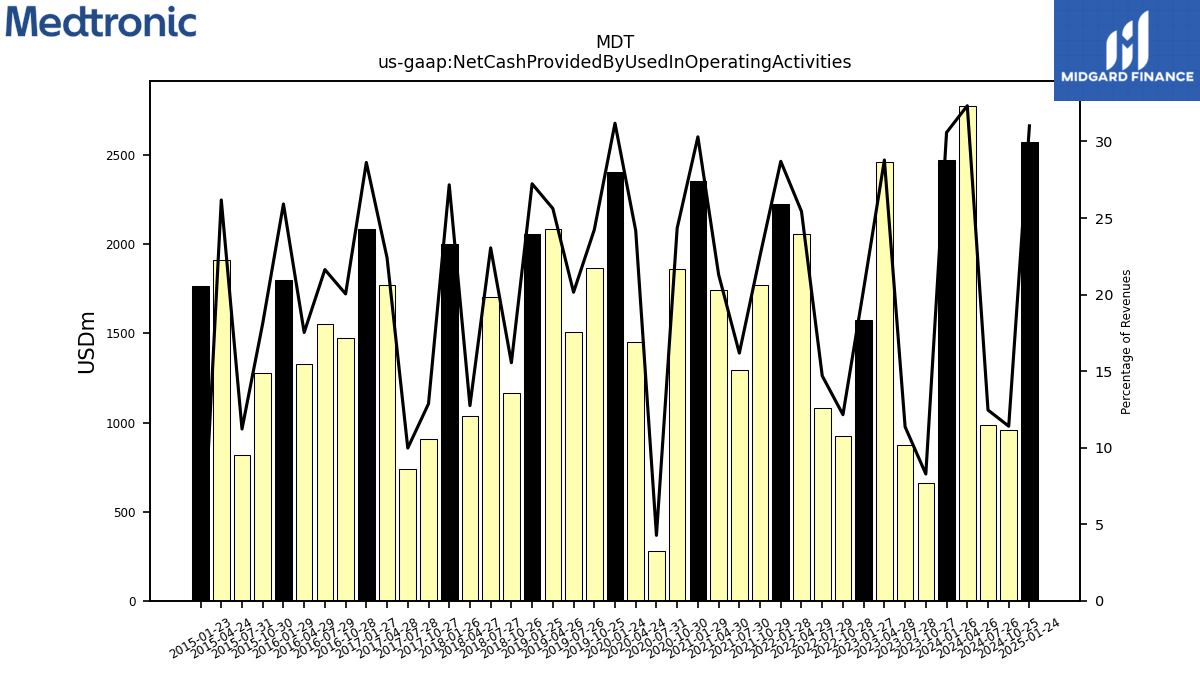 |
MDT | 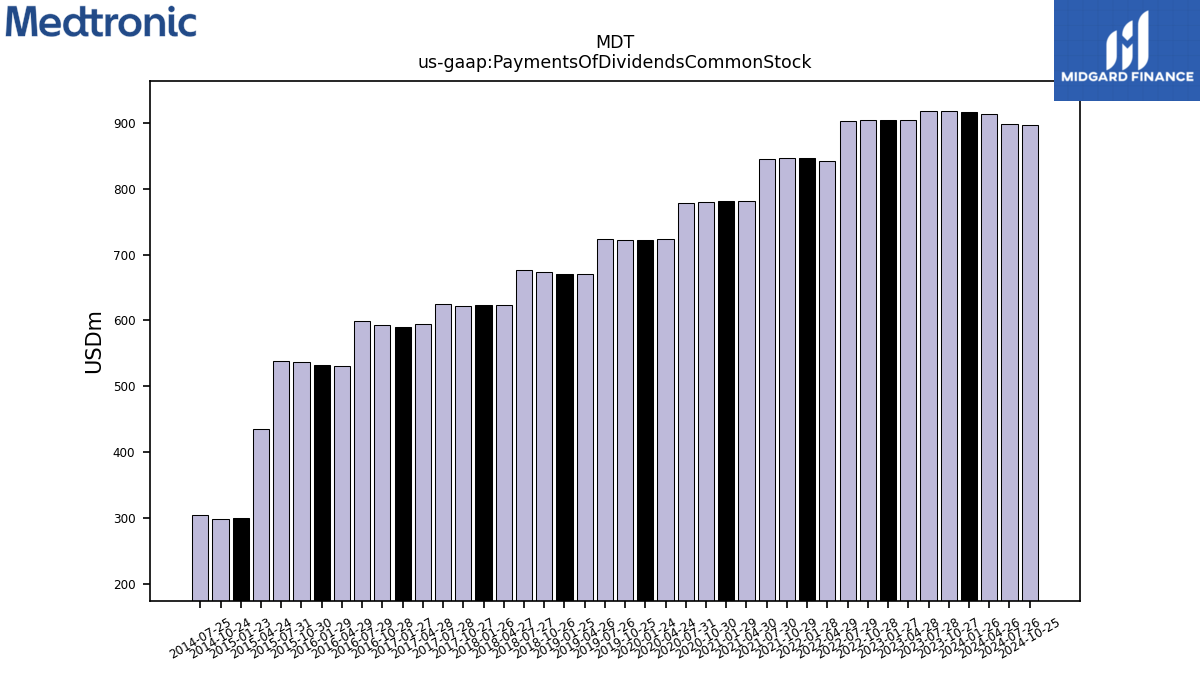 |
 |
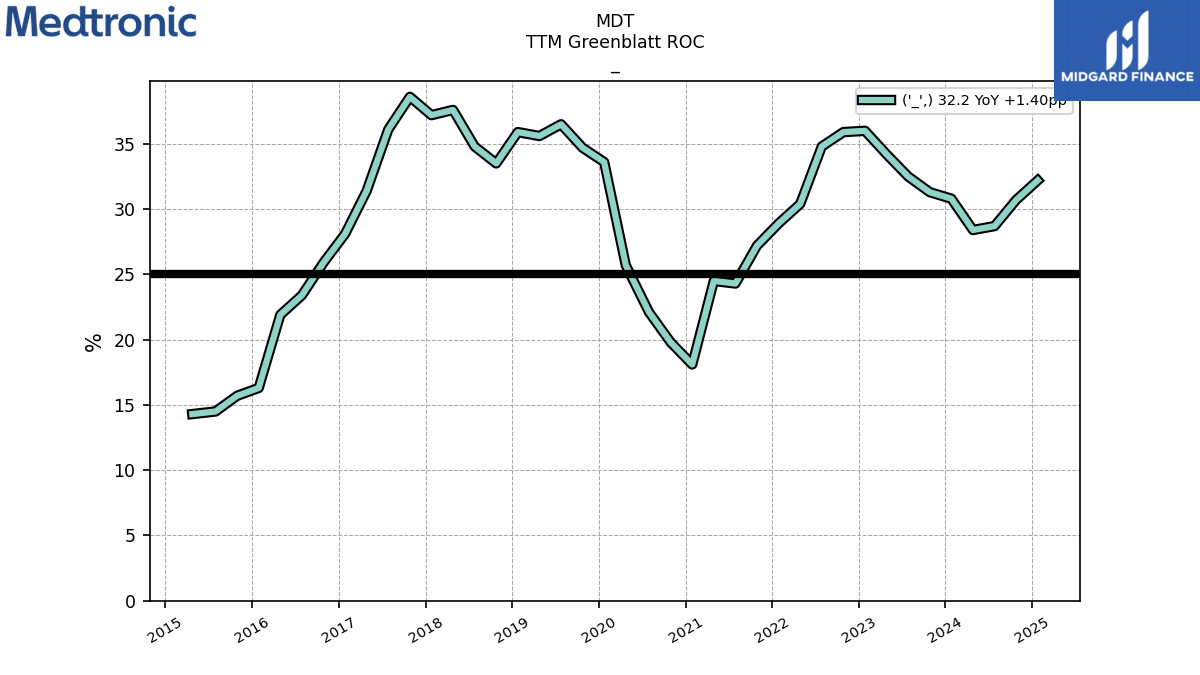 |
MDT | ||||
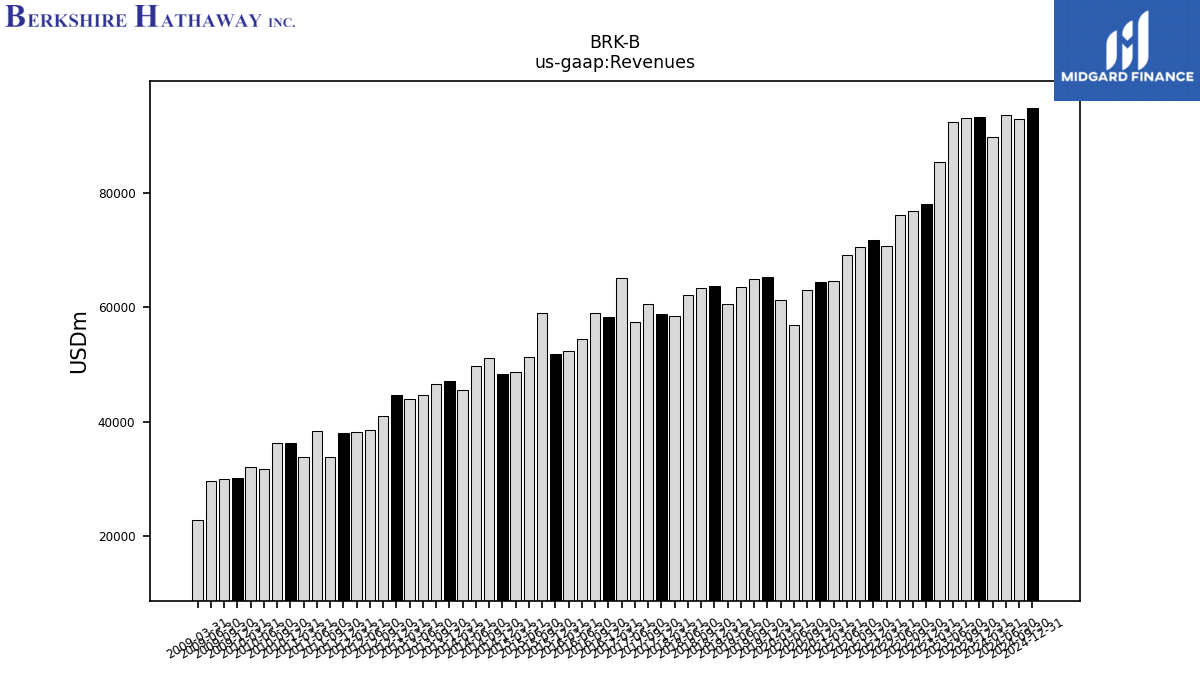
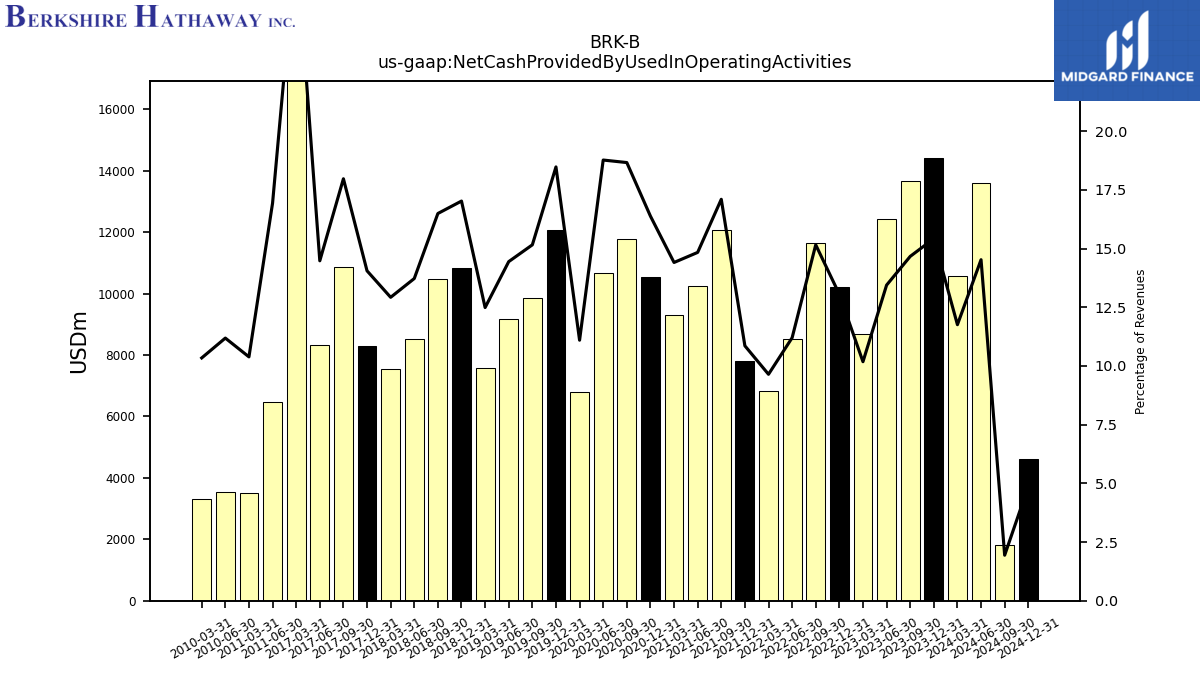
| $BRK-B$ | 2025-02-24 | 2024-11-04 | 2025-02-24 |  |
NA | NA | BRK-B | 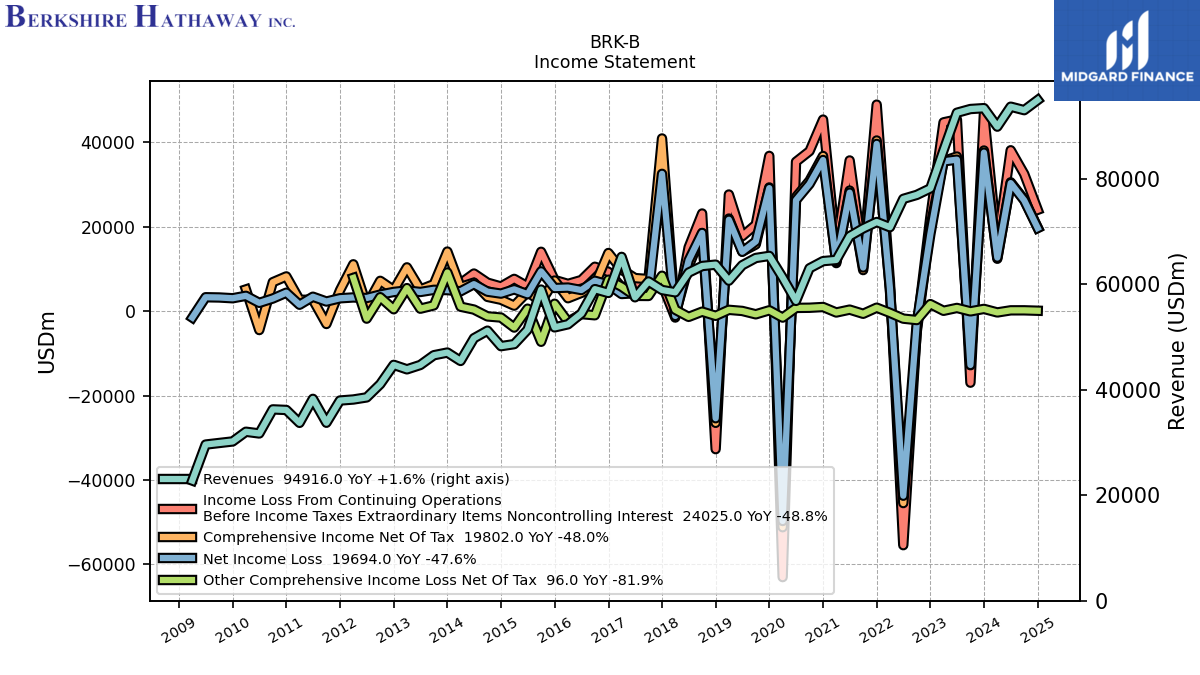 |
 |
BRK-B | BRK-B | 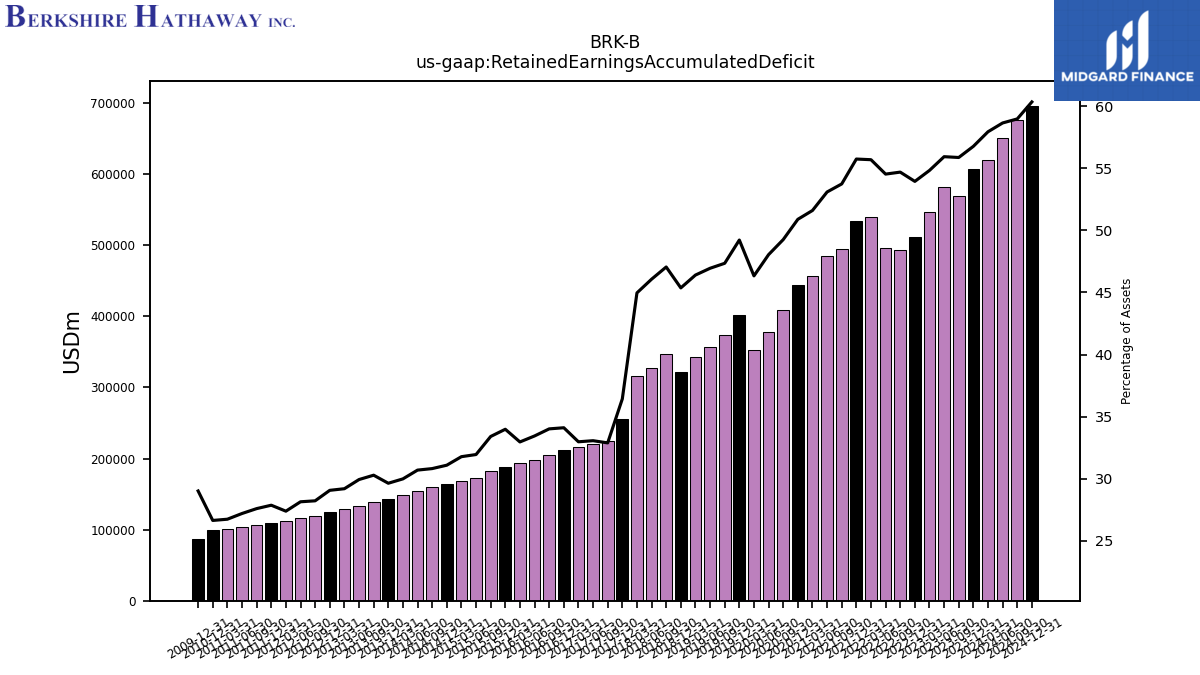 |
 |
BRK-B | BRK-B | ||||||||||
| Ticker | 10K | 10Q | 8K | Sector | Industry | Logo | Forward P/E | Revenue Growth | Ticker | Income | EPS | Revenues | Ticker | GrossProfit | OperatingIncome | LongTermDebt | Ticker | InterestExpense | RetainedEarnnings | CashFlowOperating | Ticker | Dividends | SharesOutstanding | TTMGreenblattROC | |
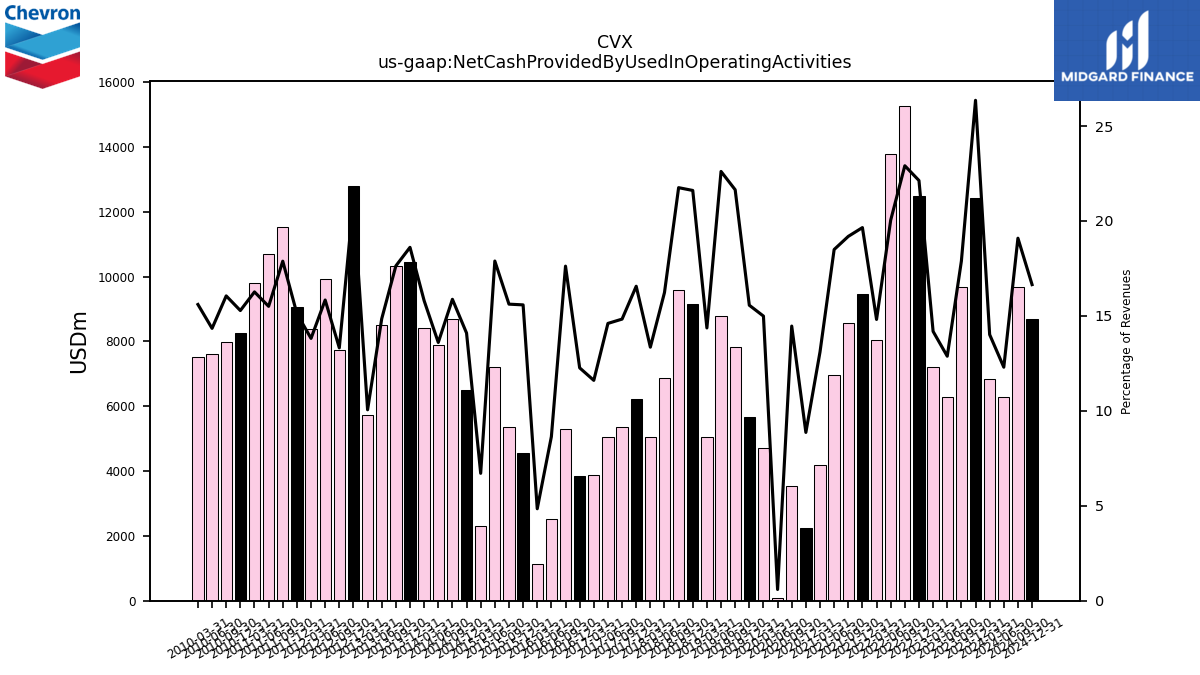
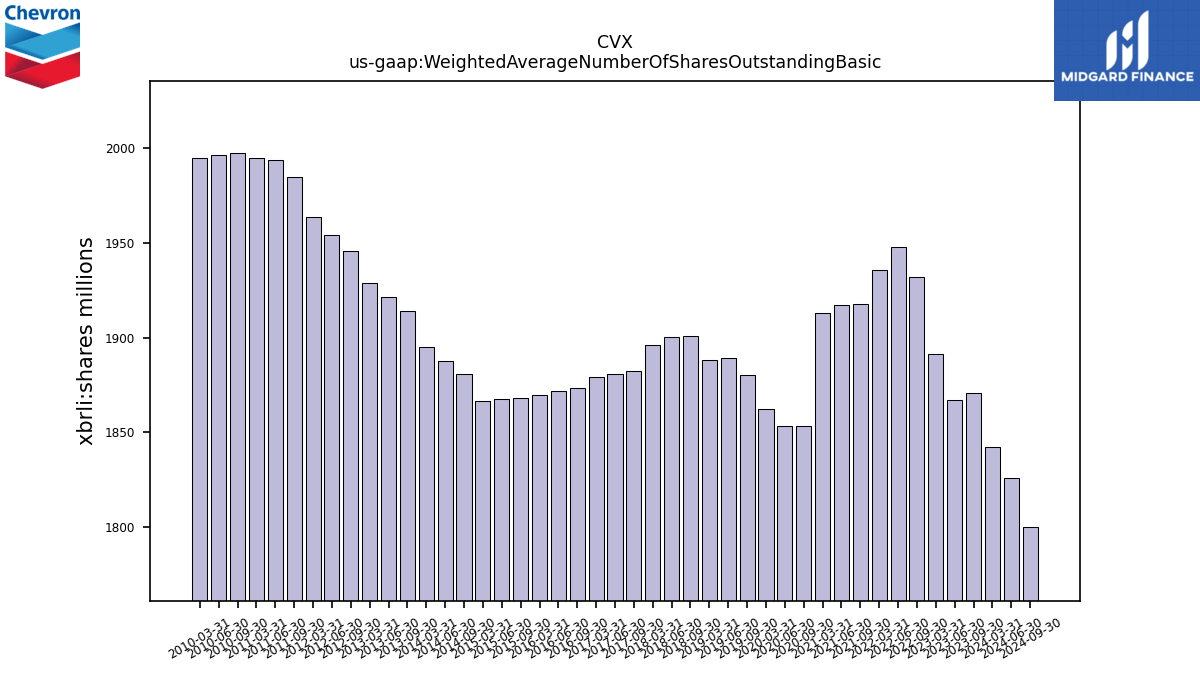
| $CVX$ | 2025-02-21 | 2024-11-07 | 2025-05-02 | NA | NA | CVX | 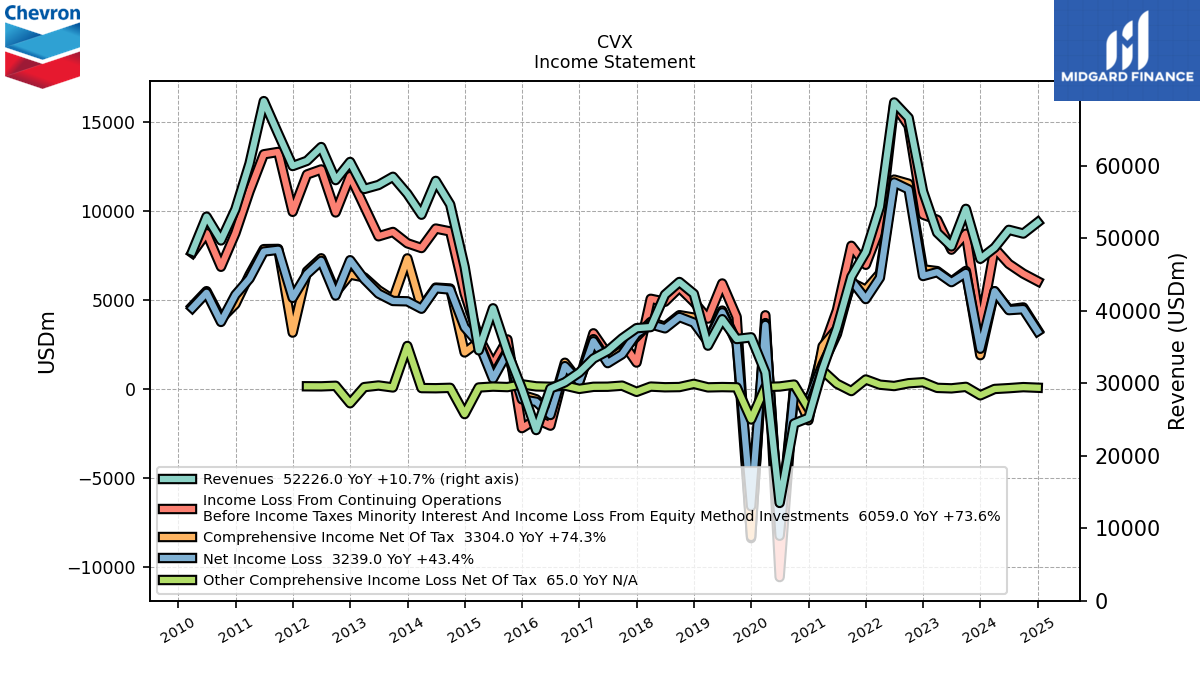 |
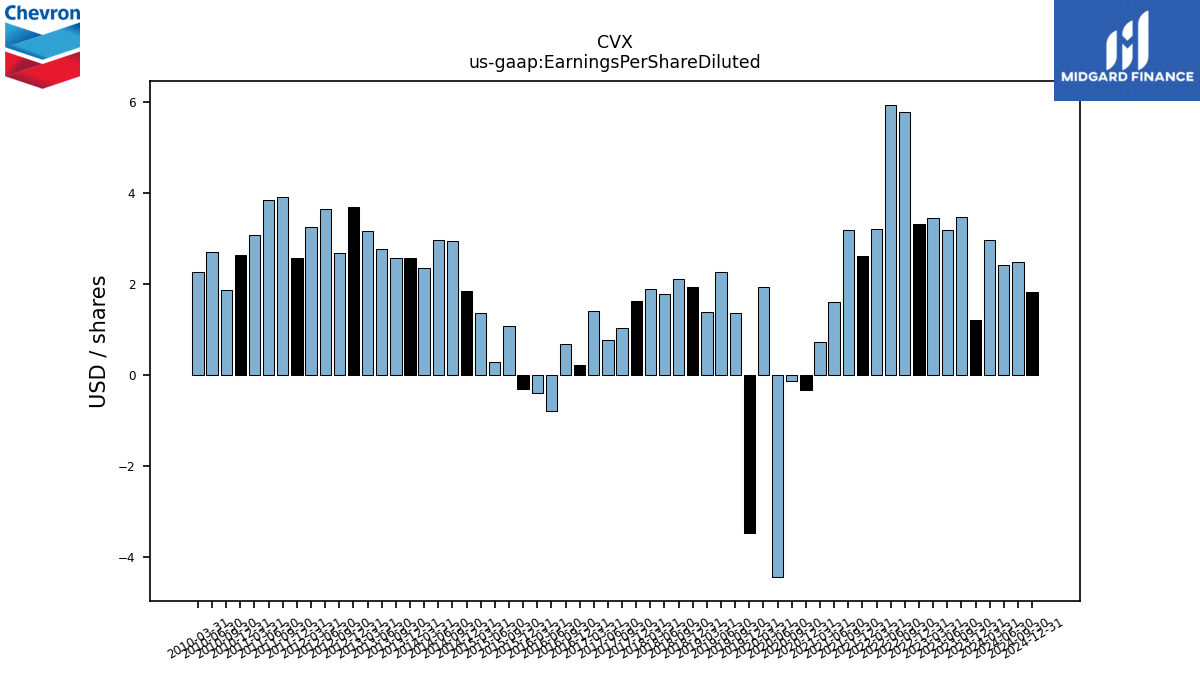 |
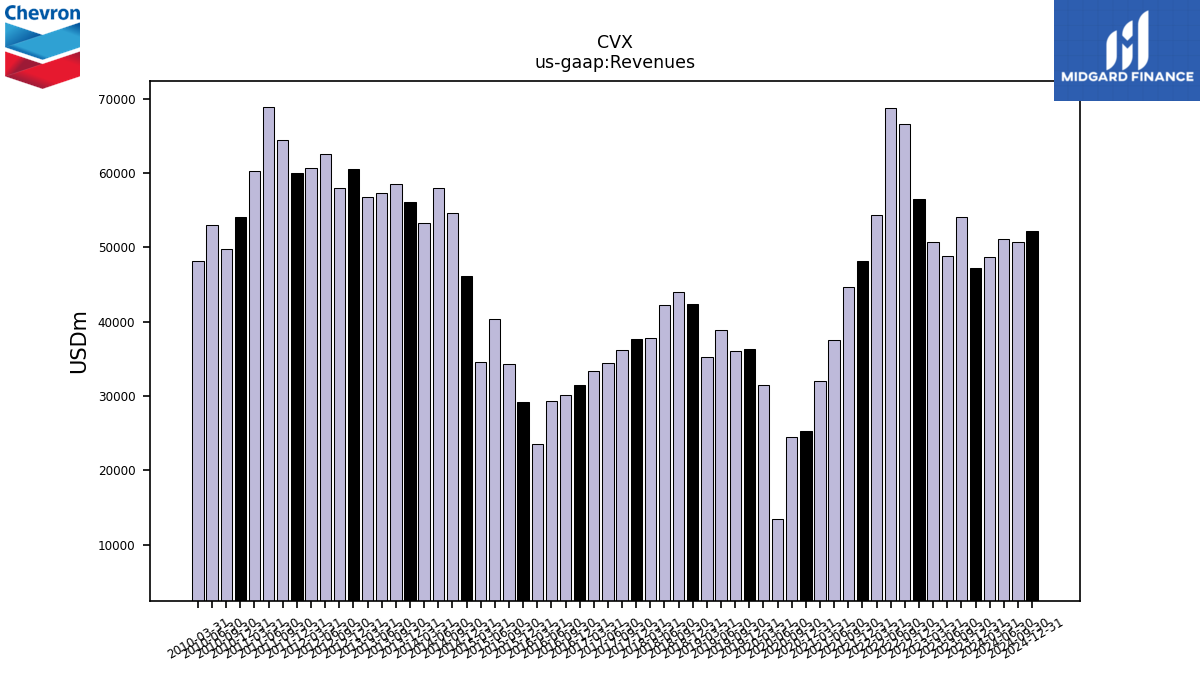 |
CVX | 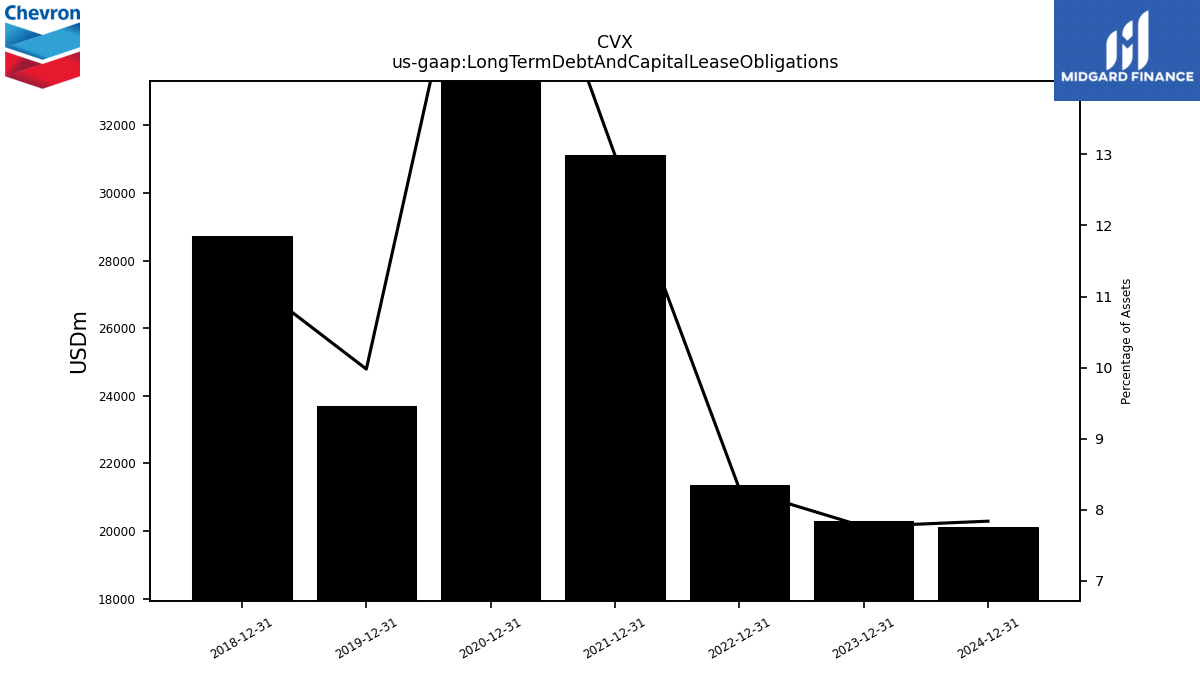 |
CVX | 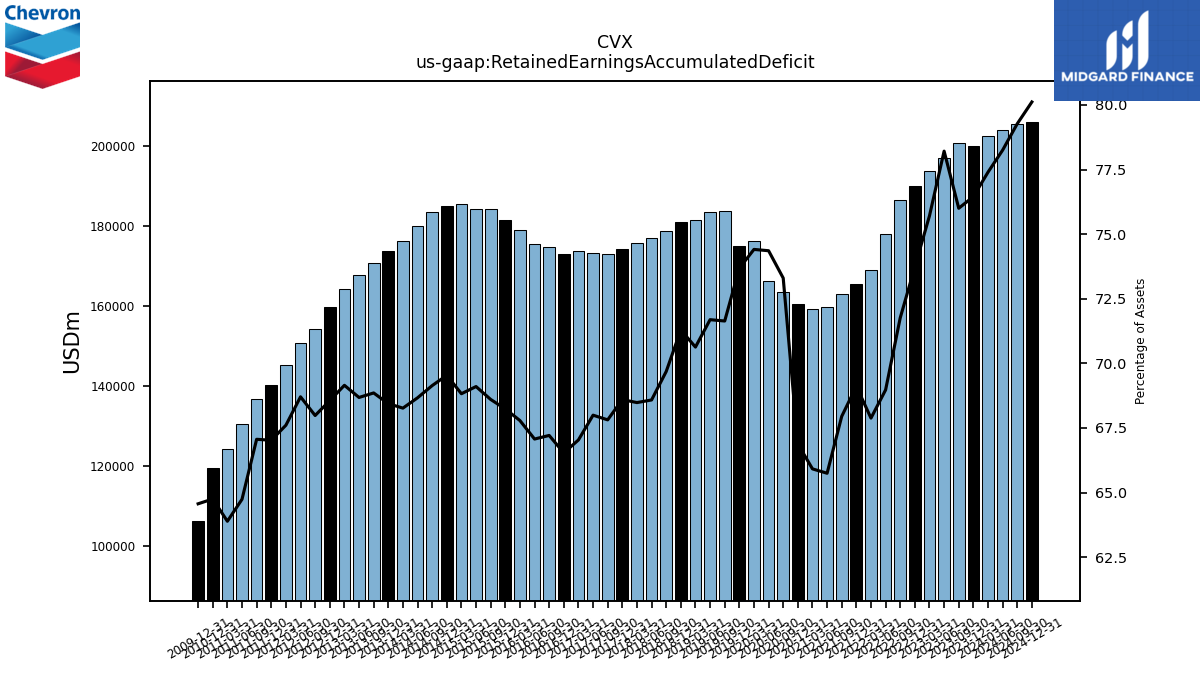 |
 |
CVX | 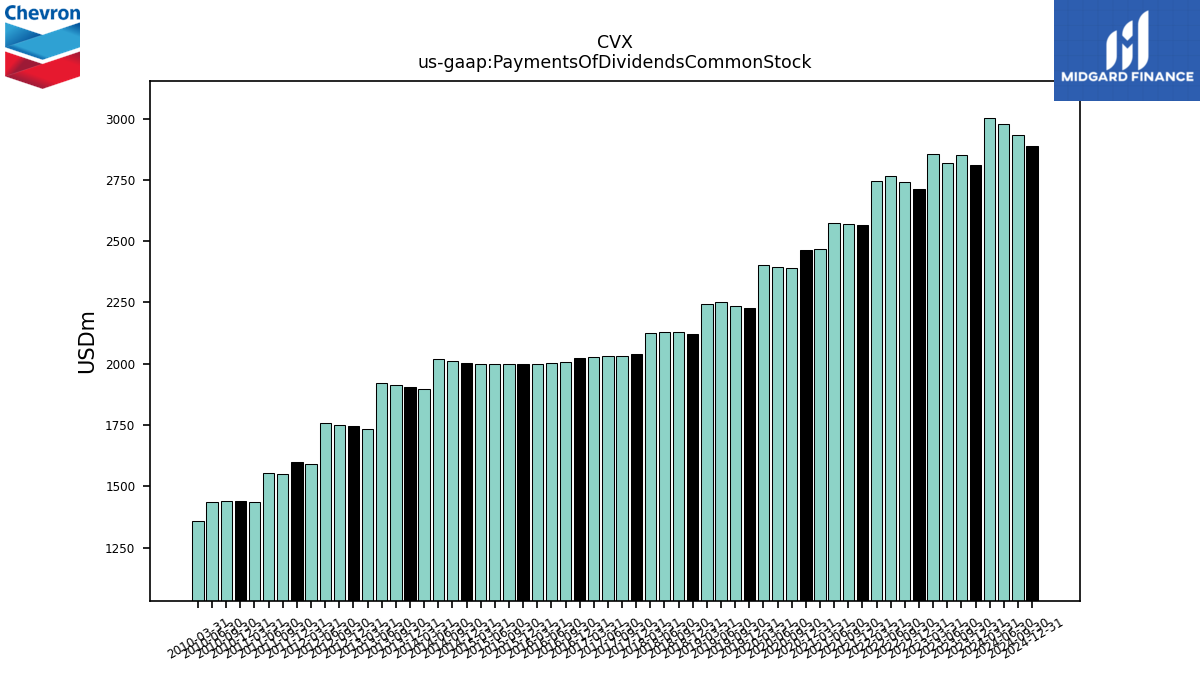 |
 |
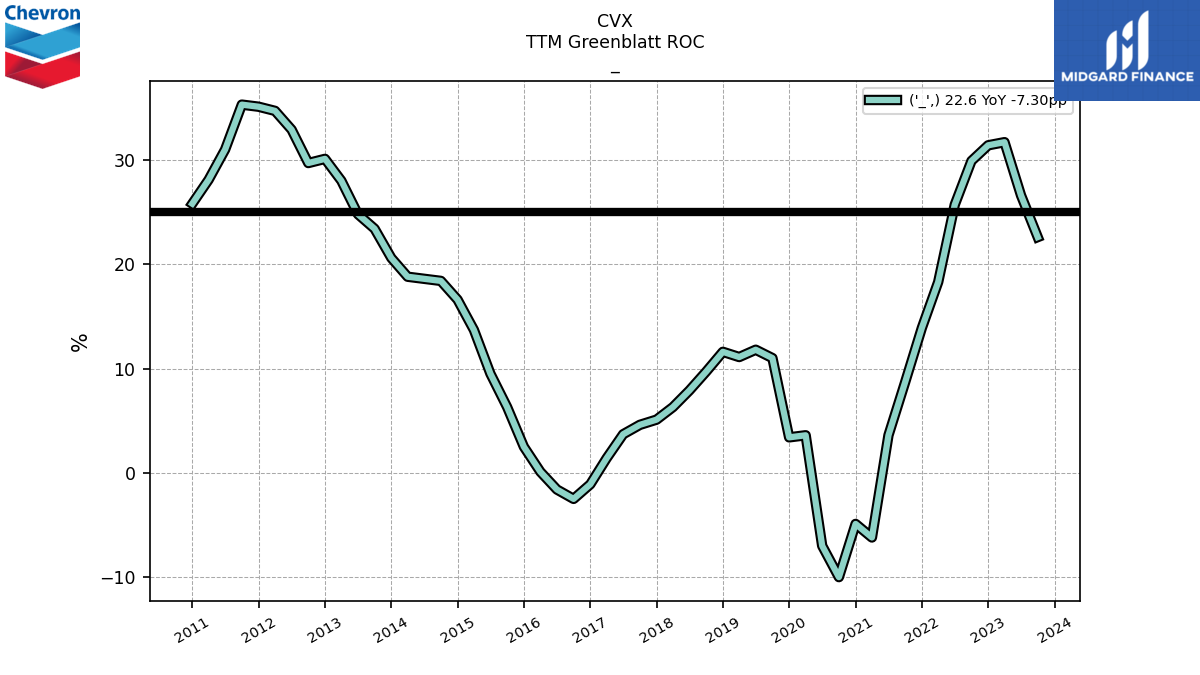 |
CVX | ||||||
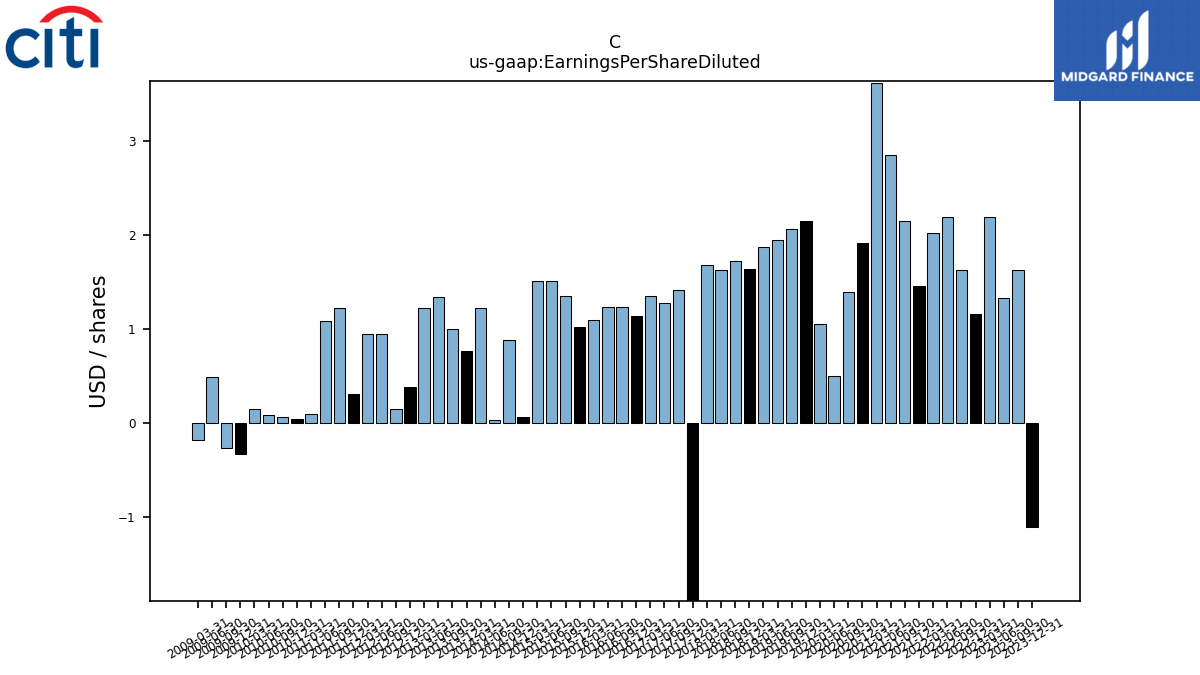
| $C$ | 2025-02-21 | 2024-11-07 | 2025-04-29 |  |
NA | NA | C | 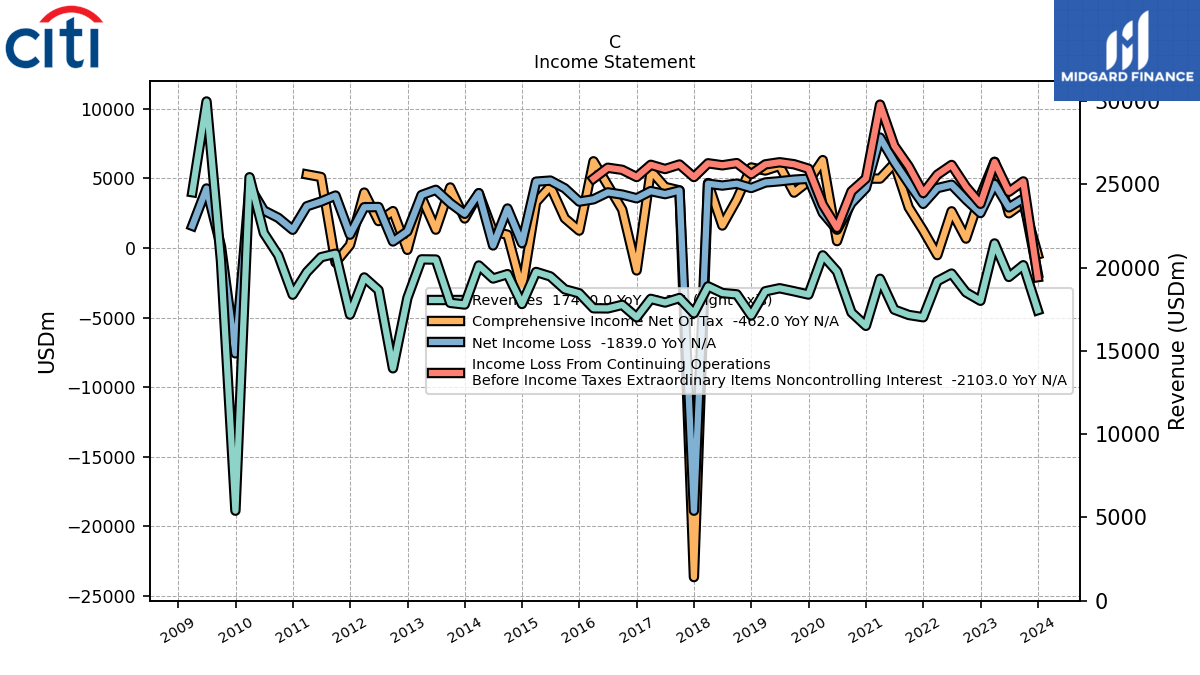 |
 |
 |
C |  |
C |  |
 |
 |
C | 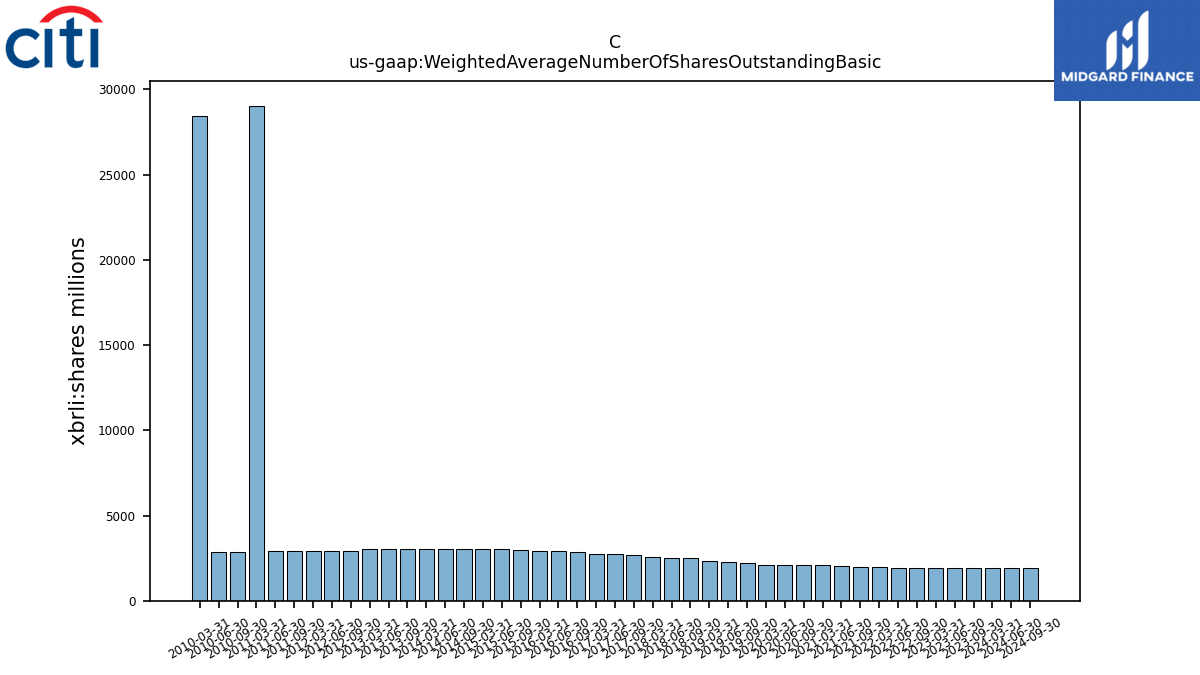 |
C | ||||||
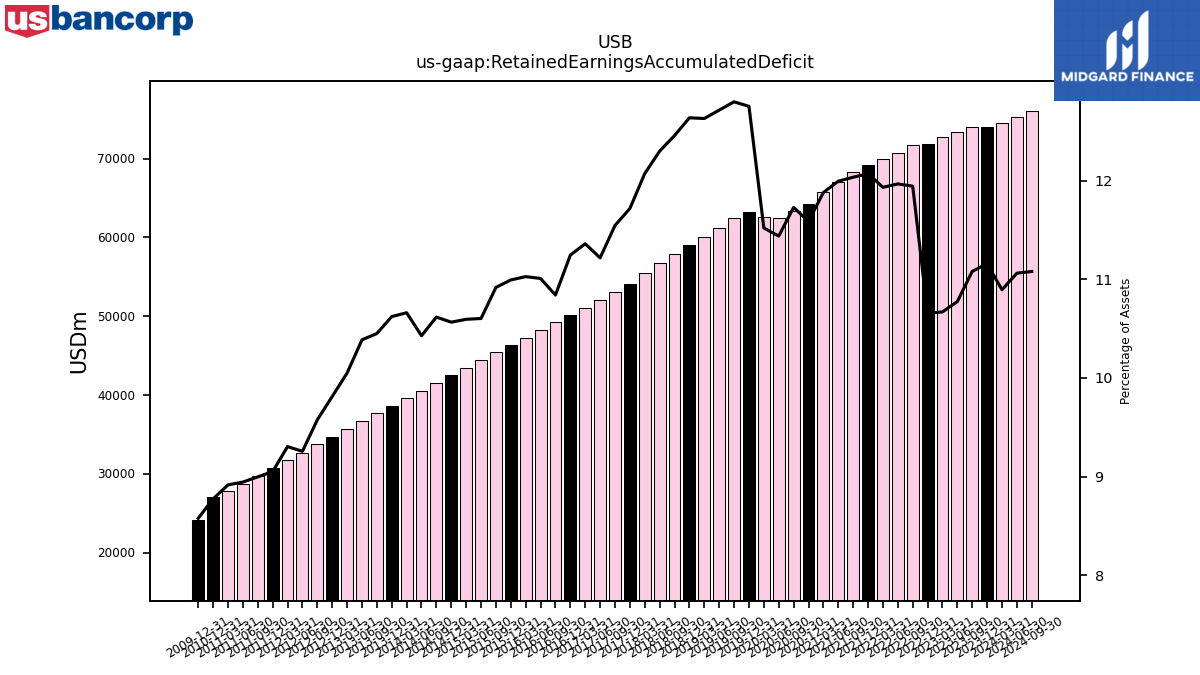
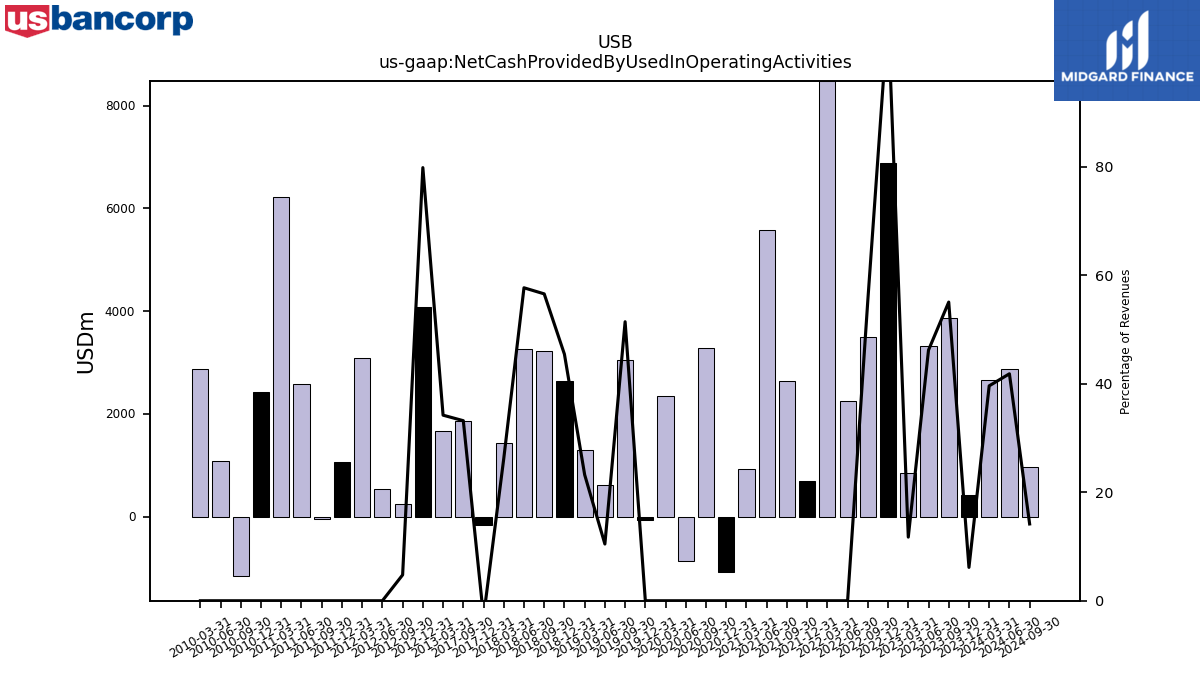
| $USB$ | 2025-02-21 | 2024-11-05 | 2025-04-17 | NA | NA | USB | 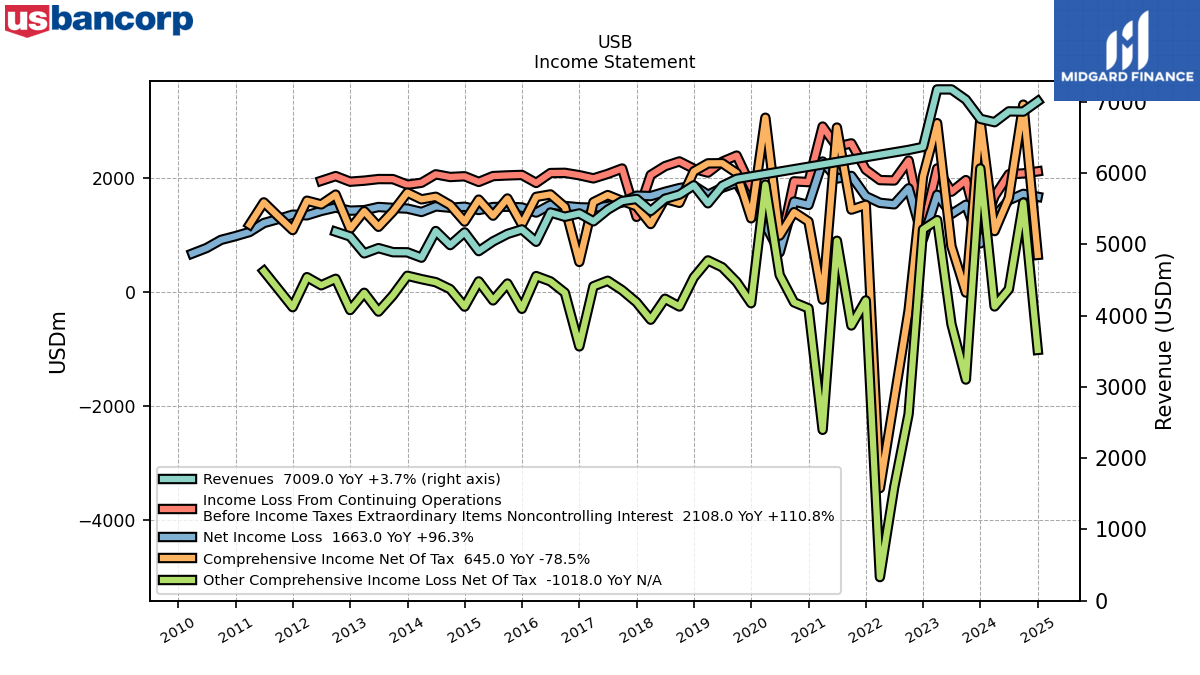 |
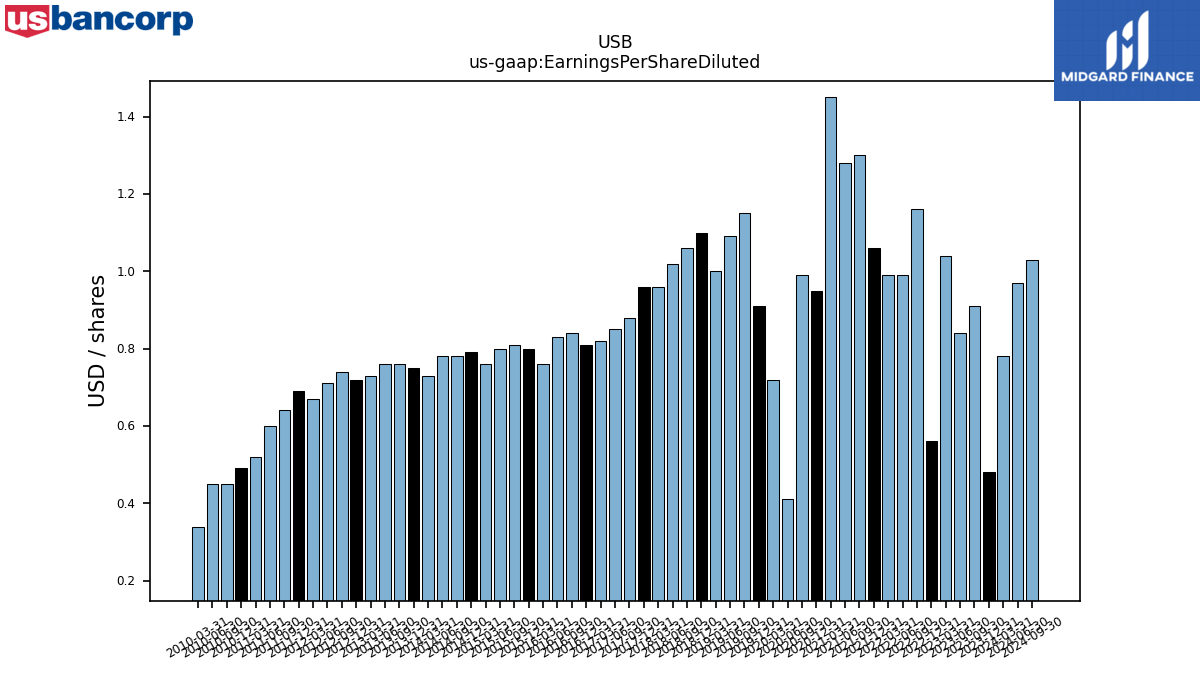 |
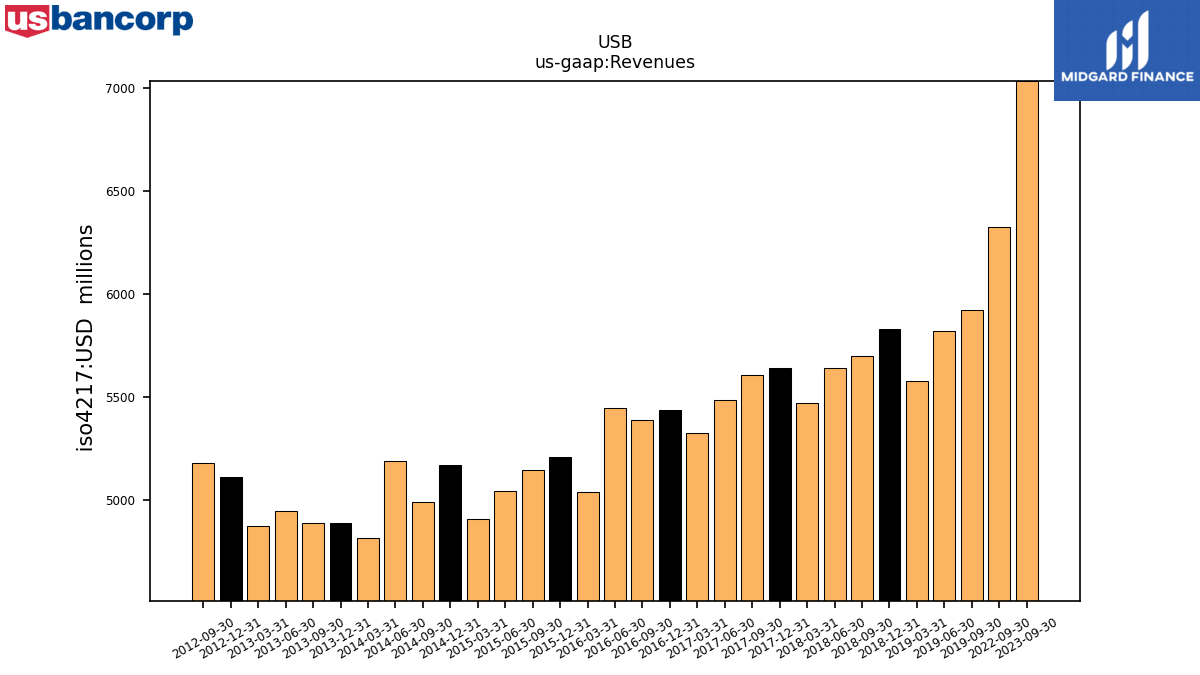 |
USB | 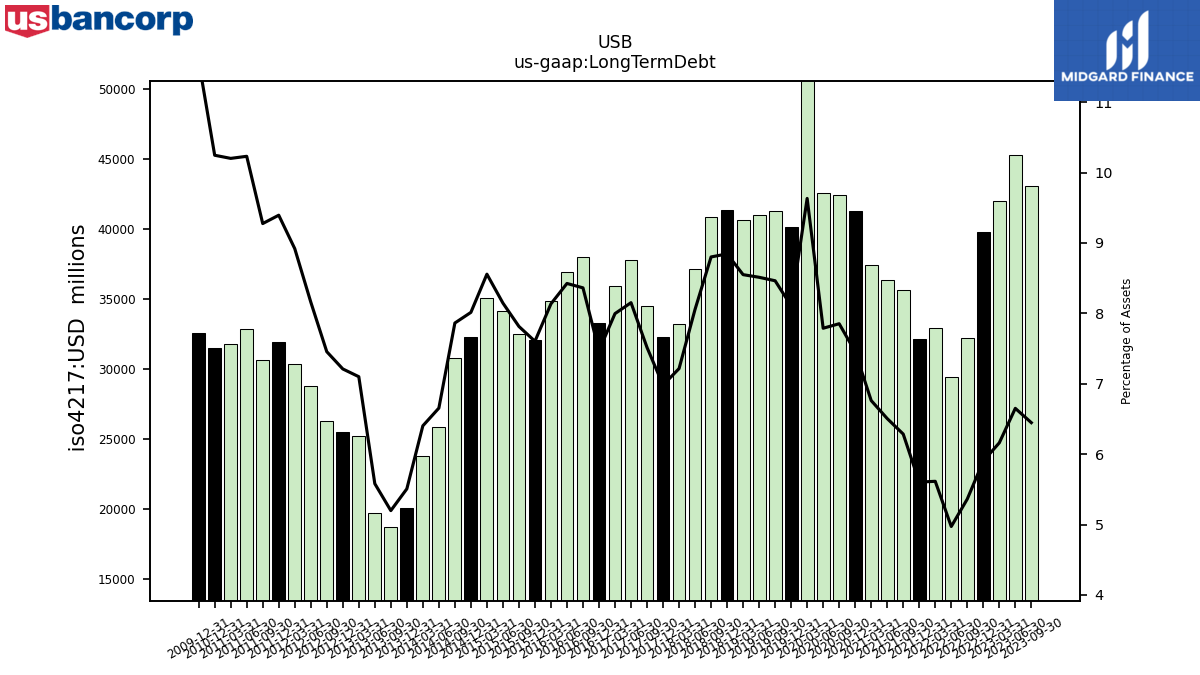 |
USB | 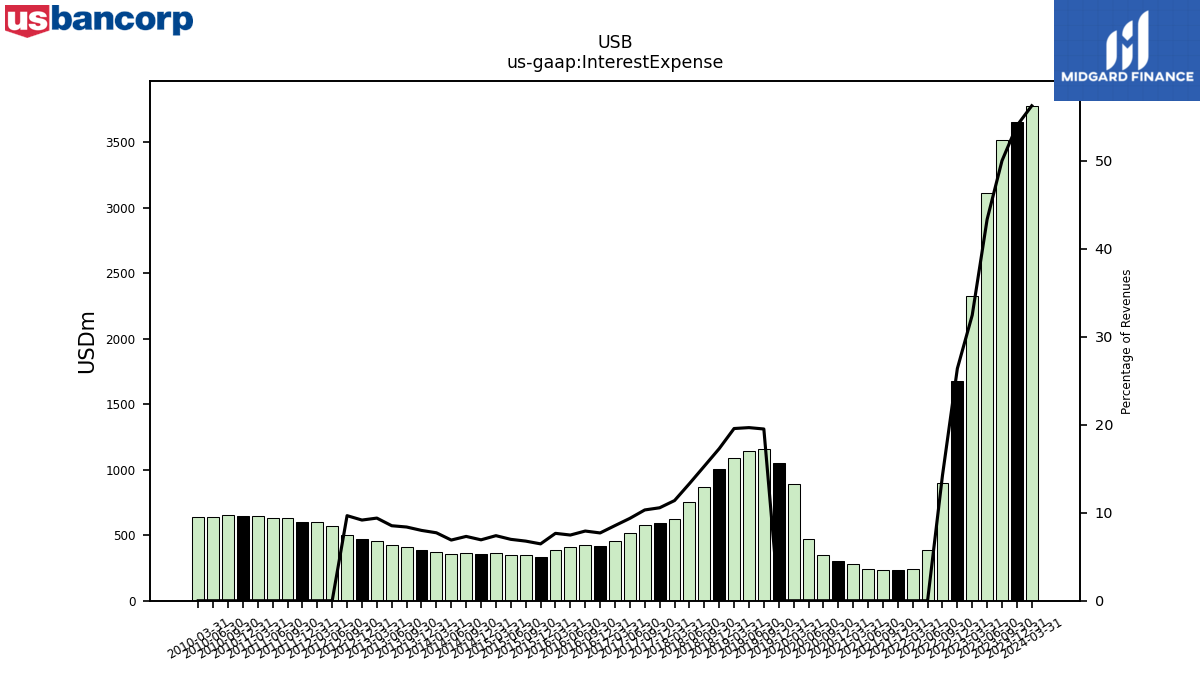 |
 |
 |
USB | 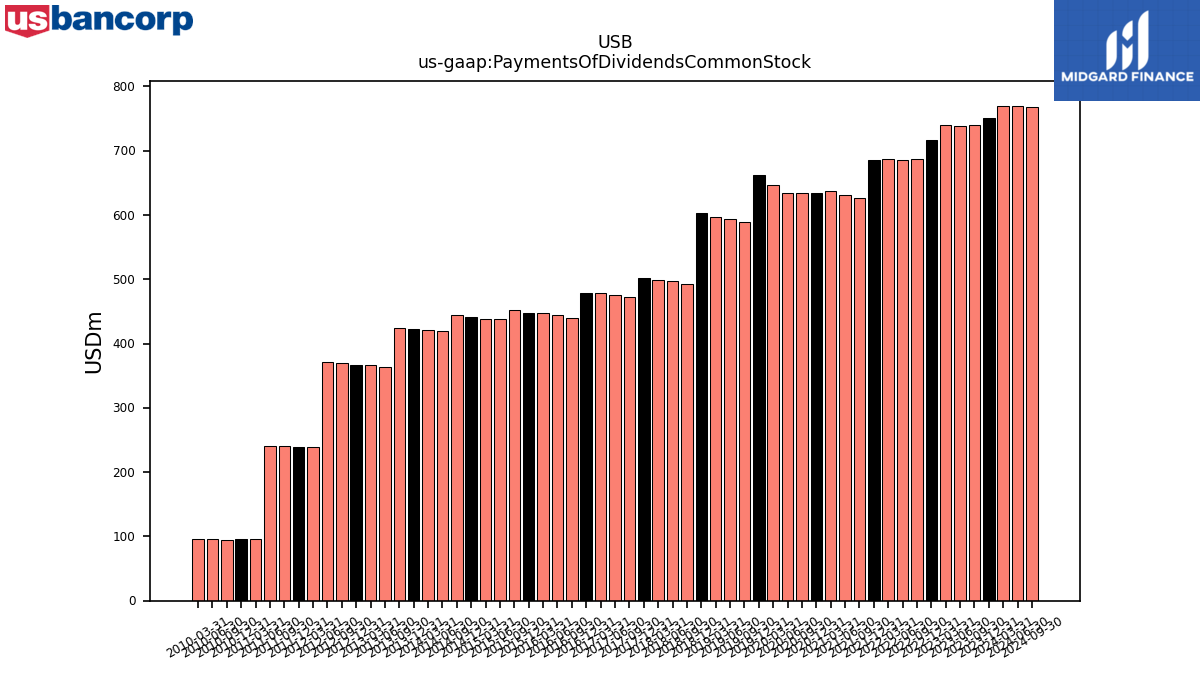 |
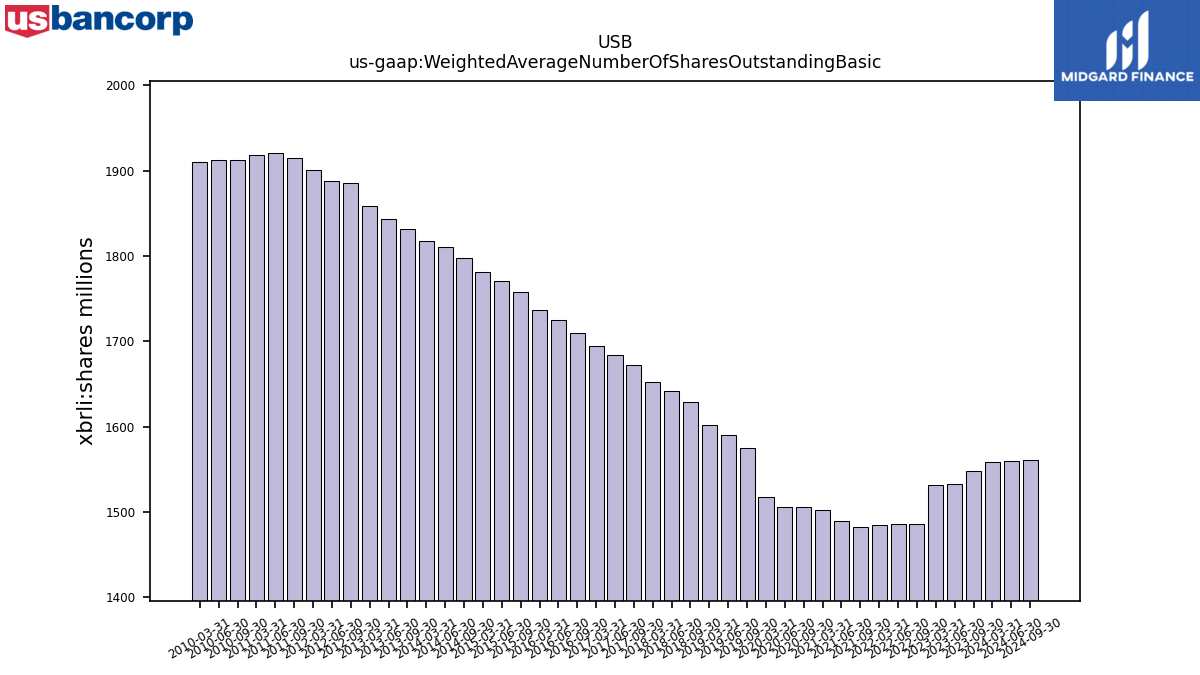 |
USB | ||||||
| $MS$ | 2025-02-21 | 2024-11-04 | 2025-04-11 | NA | NA | MS | 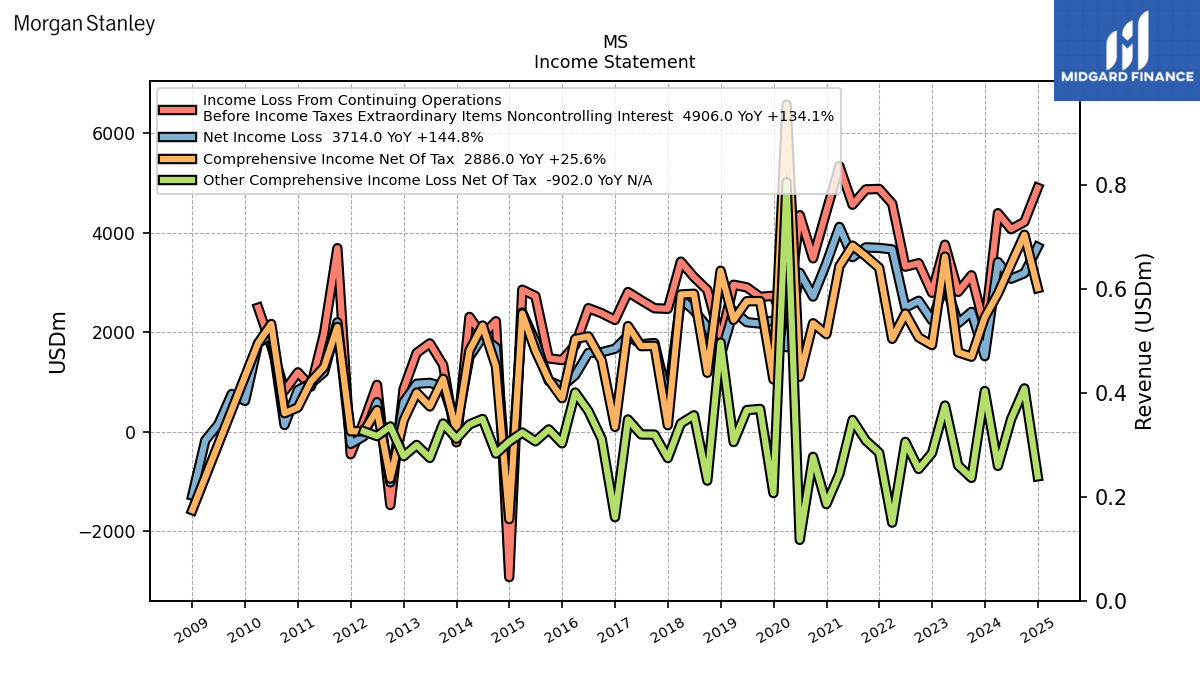 |
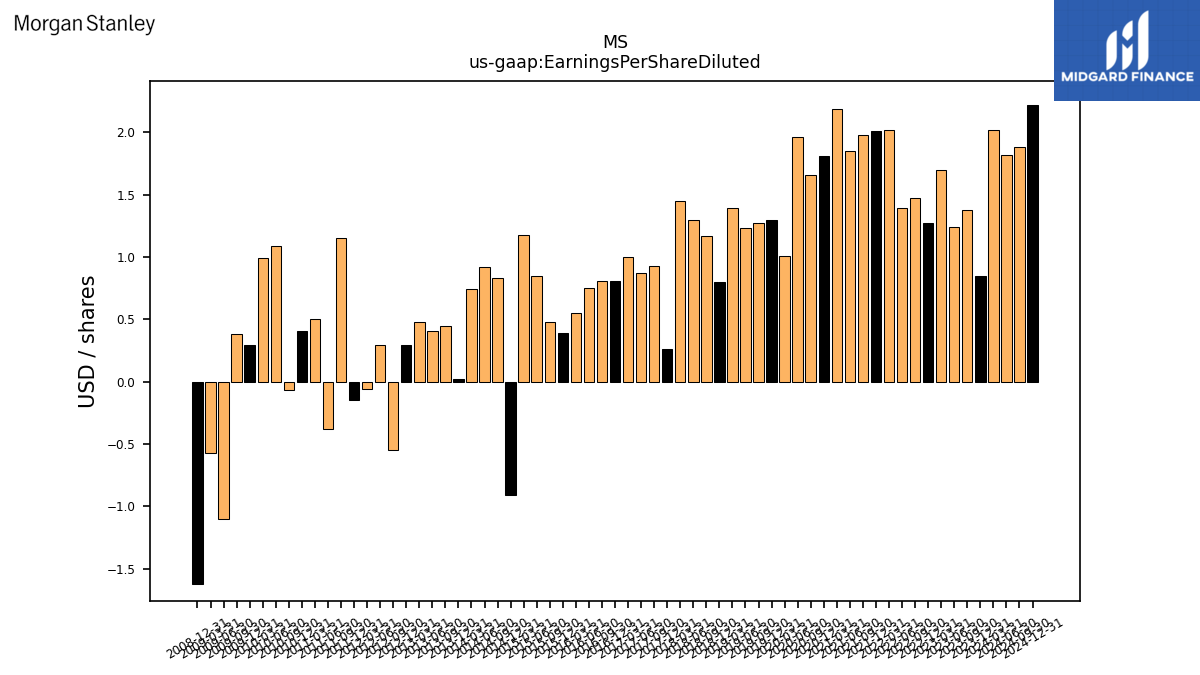 |
MS |  |
MS |  |
 |
 |
MS | 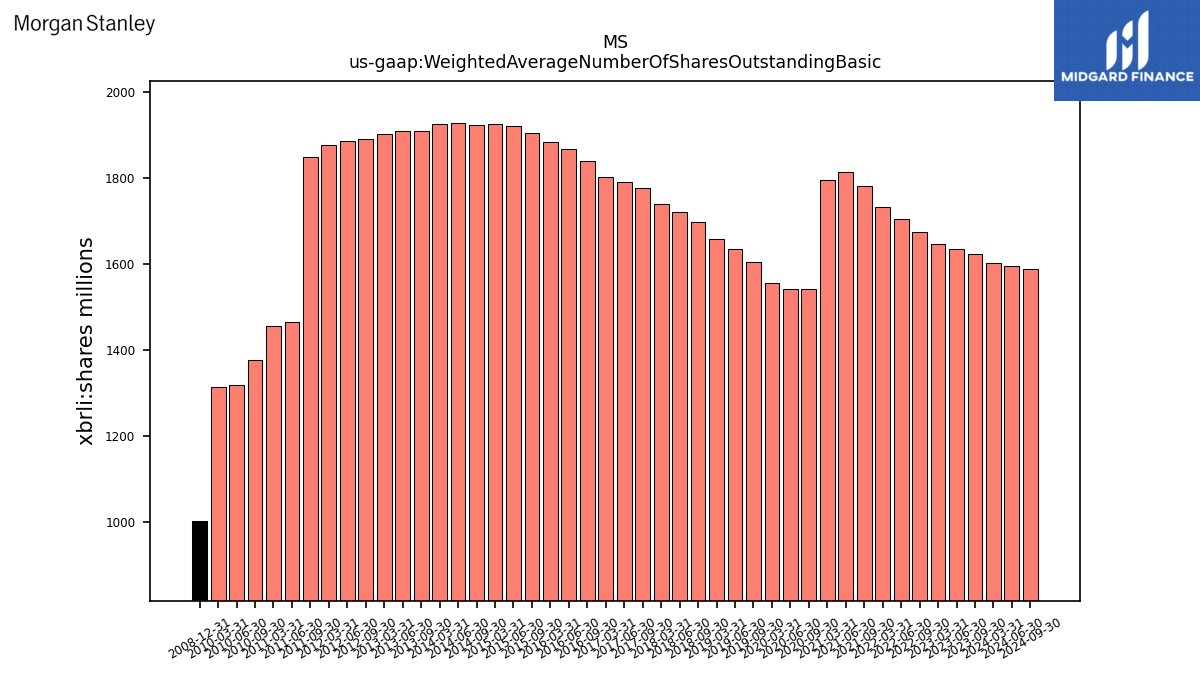 |
MS | ||||||||
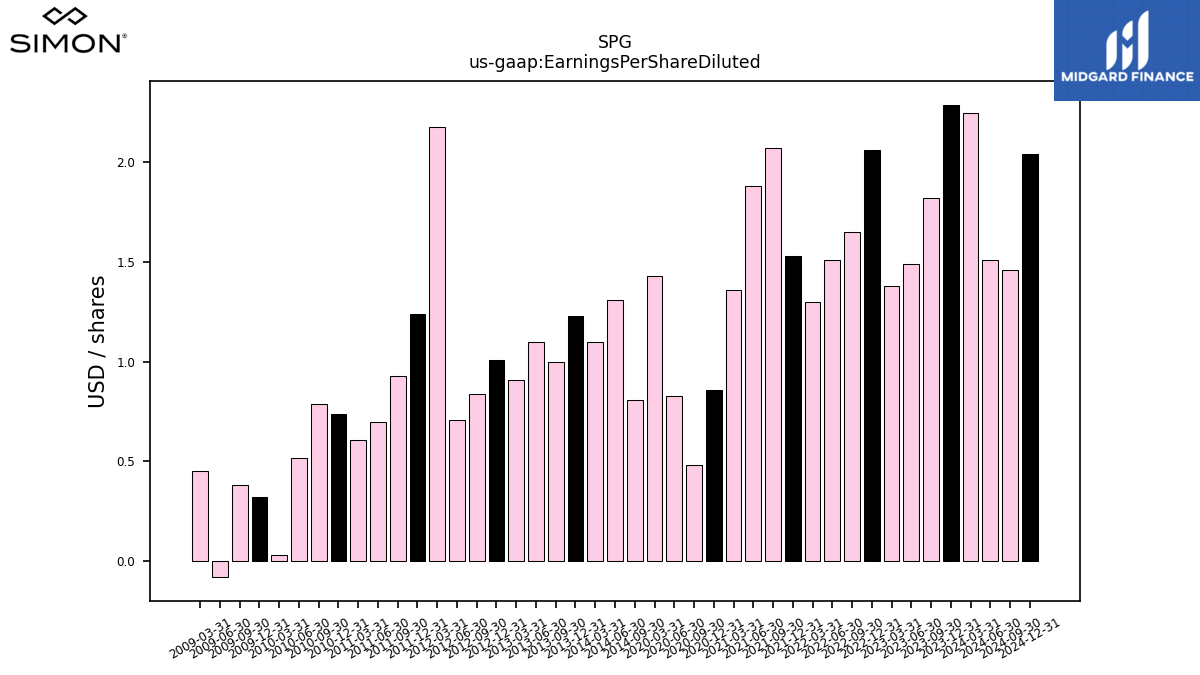
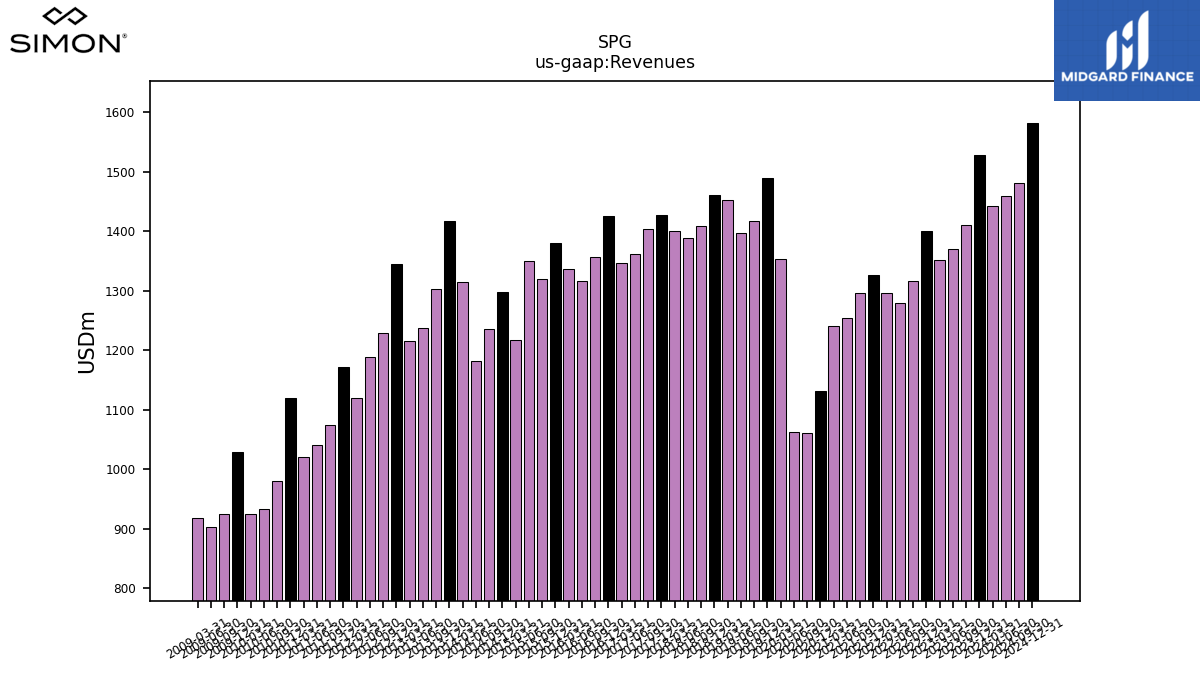
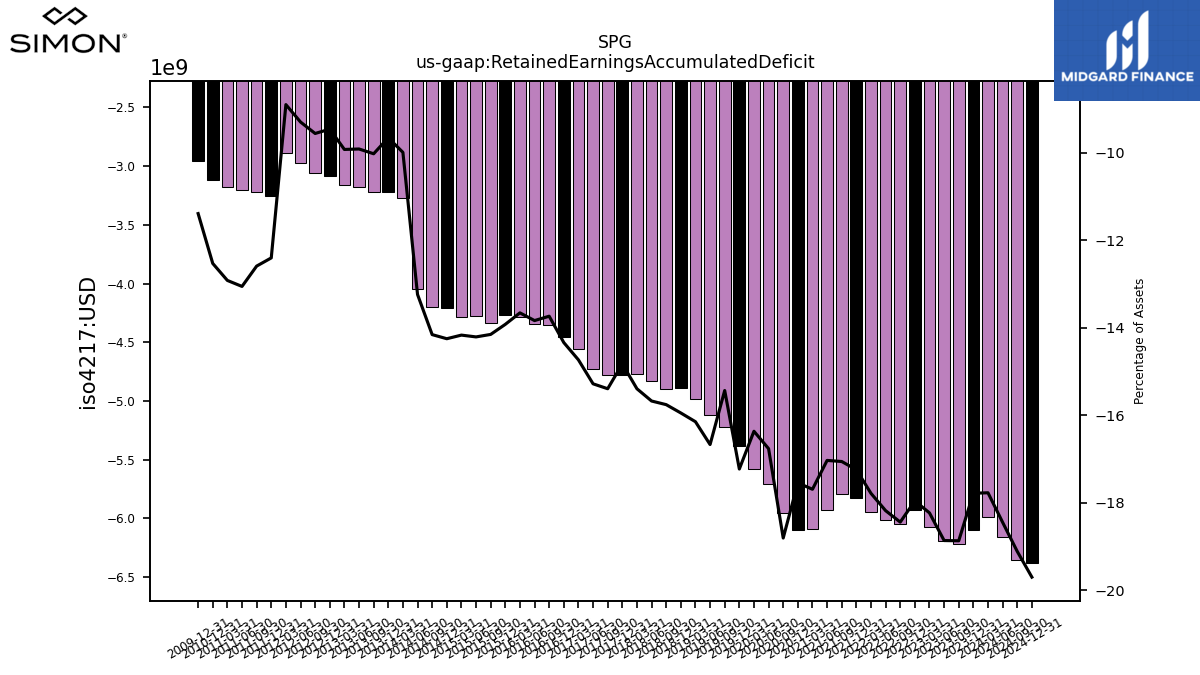
| $SPG$ | 2025-02-21 | 2024-11-08 | 2025-02-04 | NA | NA | SPG | 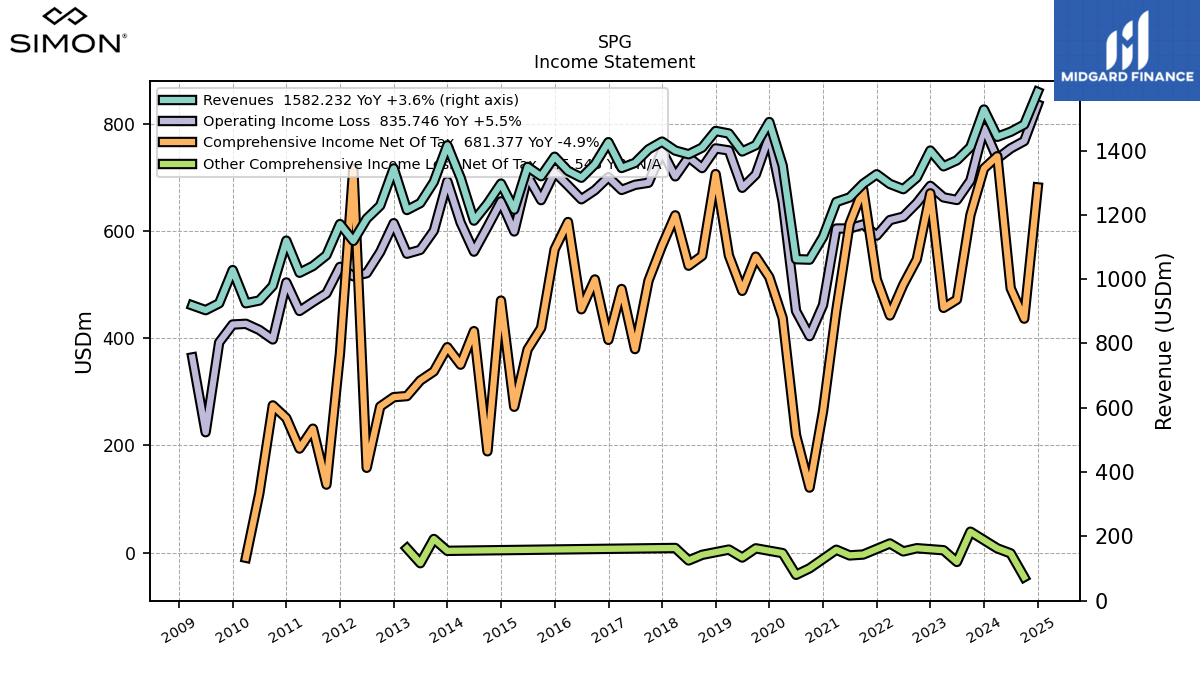 |
 |
 |
SPG | 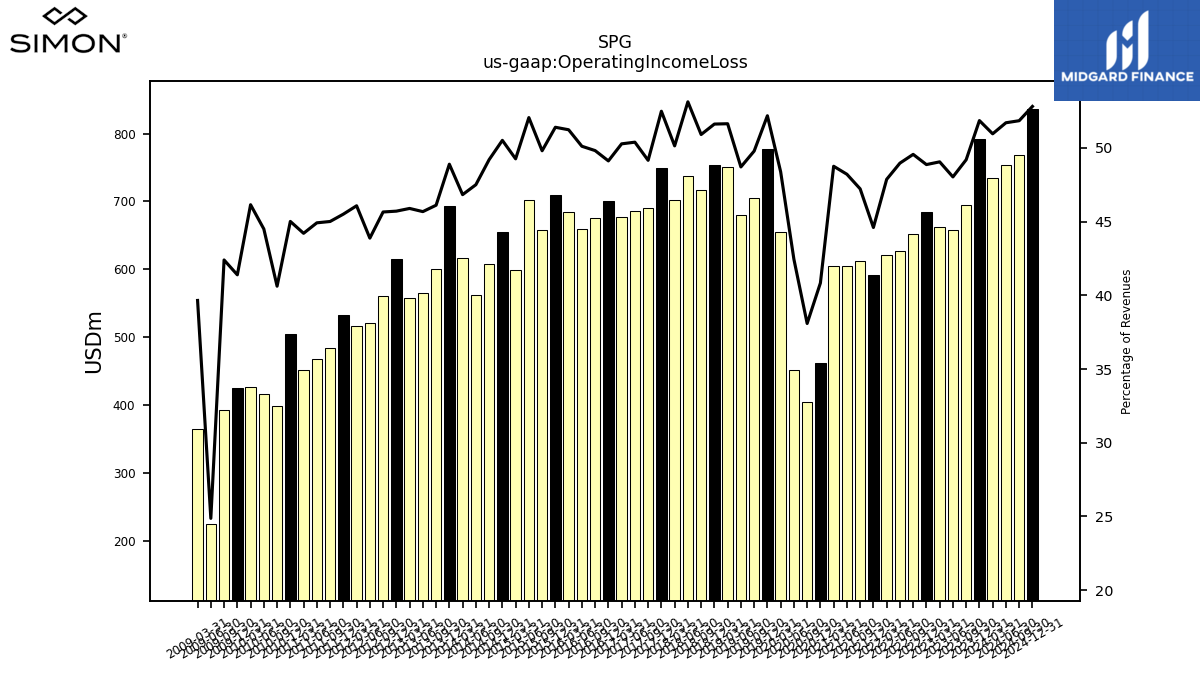 |
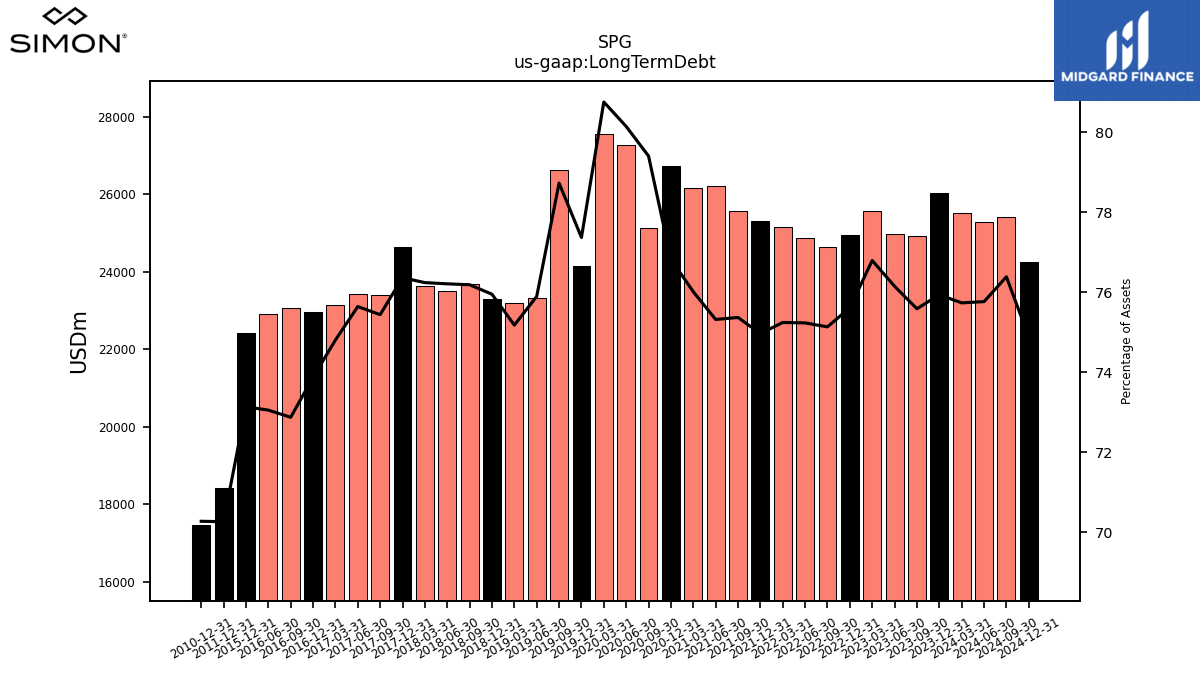 |
SPG | 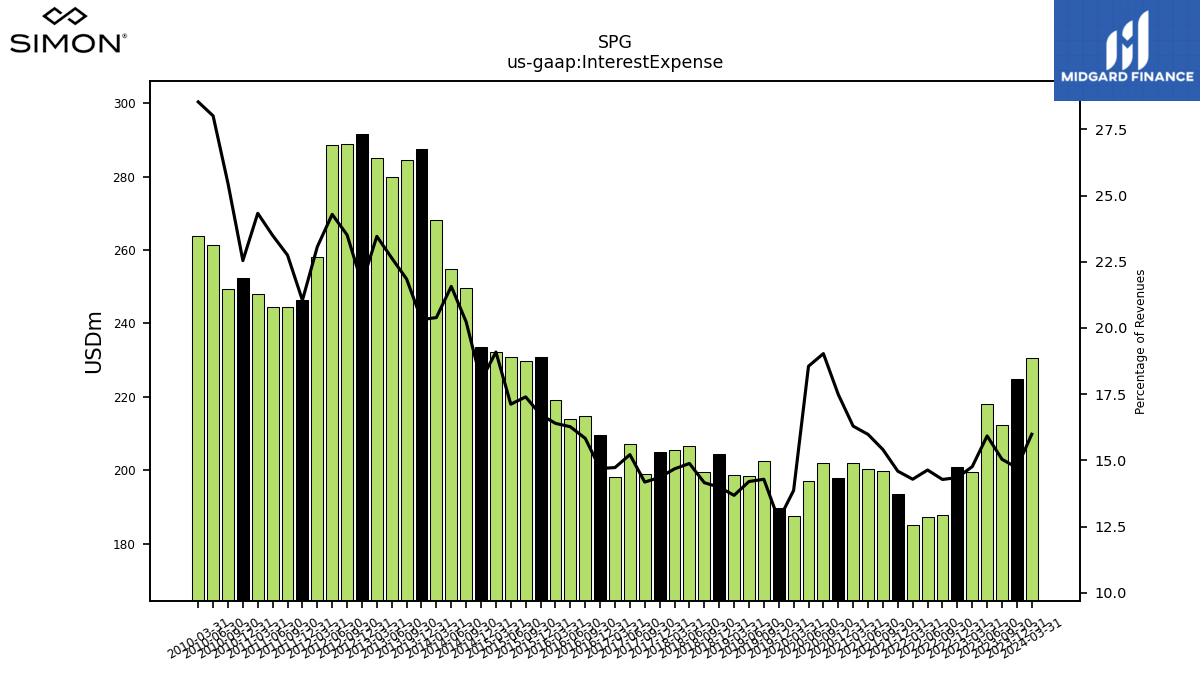 |
 |
 |
SPG |  |
SPG | ||||||
| Ticker | 10K | 10Q | 8K | Sector | Industry | Logo | Forward P/E | Revenue Growth | Ticker | Income | EPS | Revenues | Ticker | GrossProfit | OperatingIncome | LongTermDebt | Ticker | InterestExpense | RetainedEarnnings | CashFlowOperating | Ticker | Dividends | SharesOutstanding | TTMGreenblattROC | |
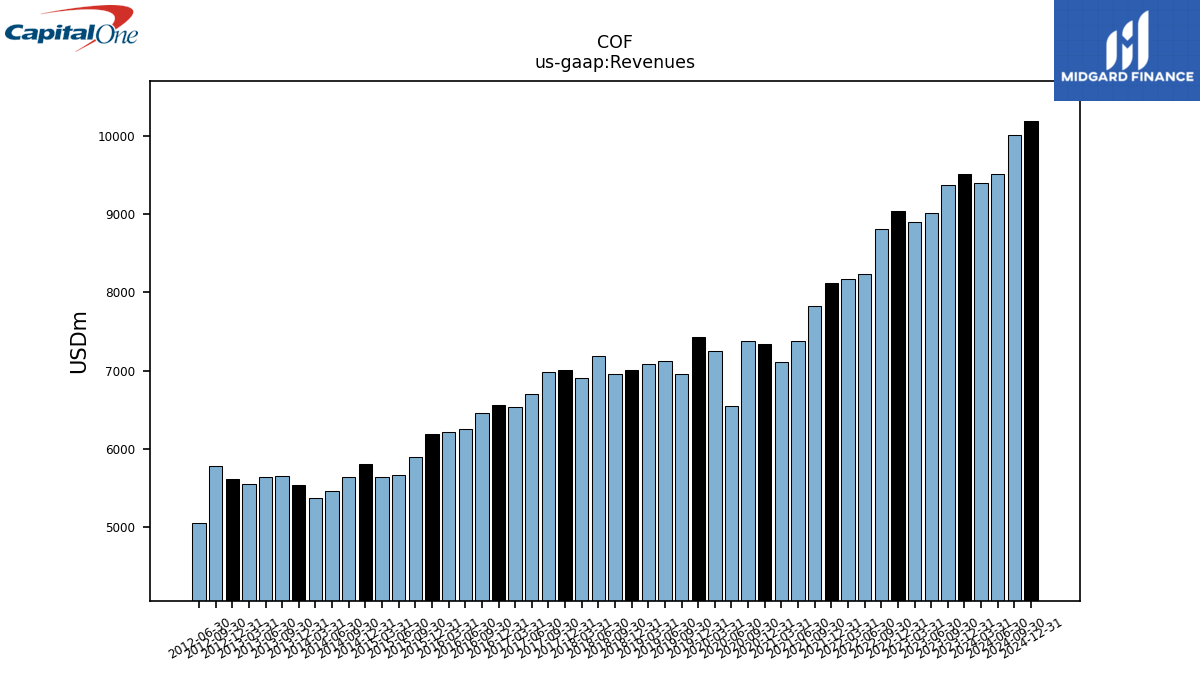
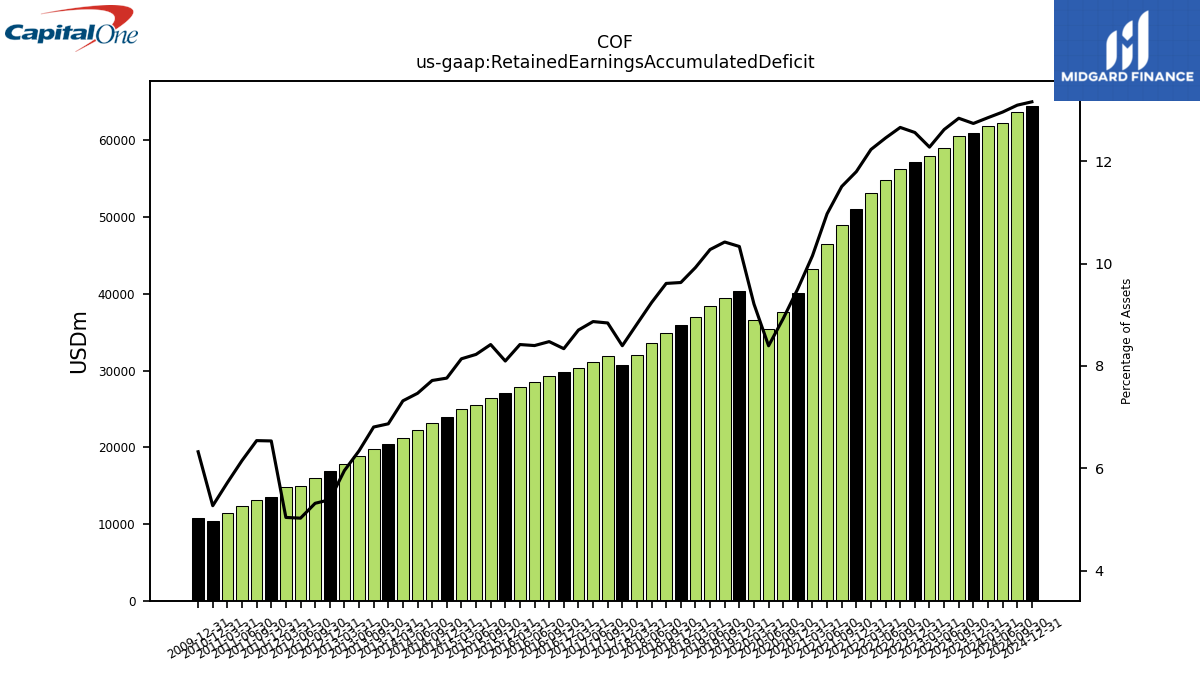
| $COF$ | 2025-02-20 | 2024-10-31 | 2025-04-22 | NA | NA | COF |  |
 |
 |
COF | 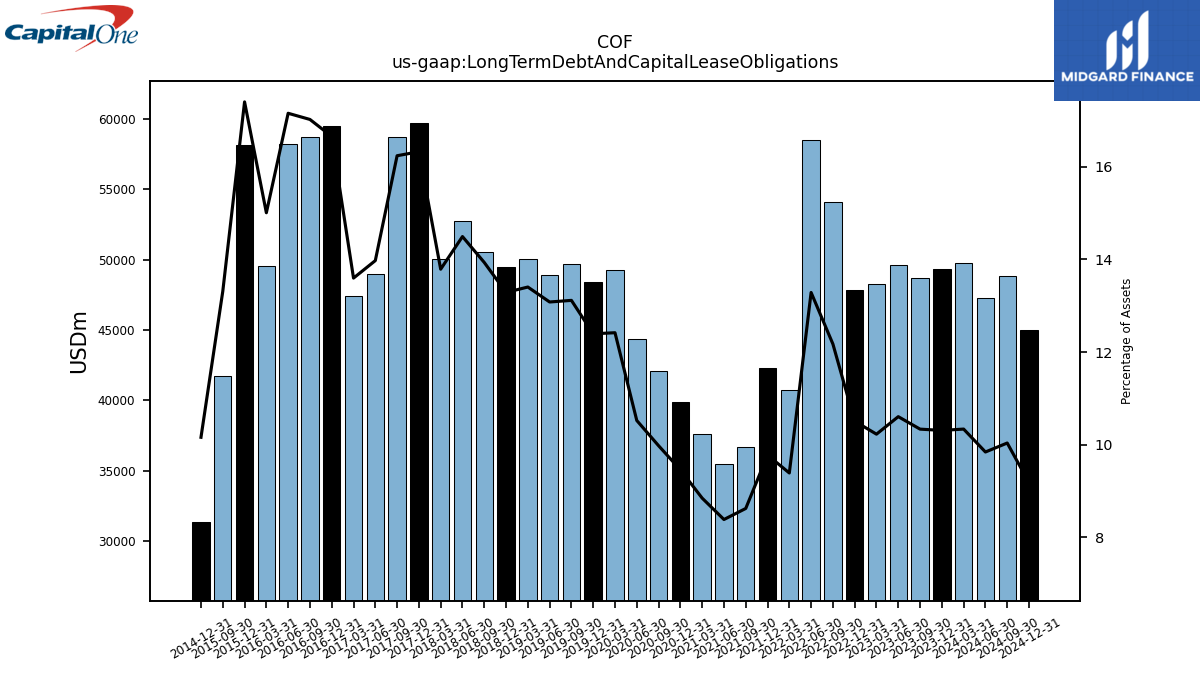 |
COF | 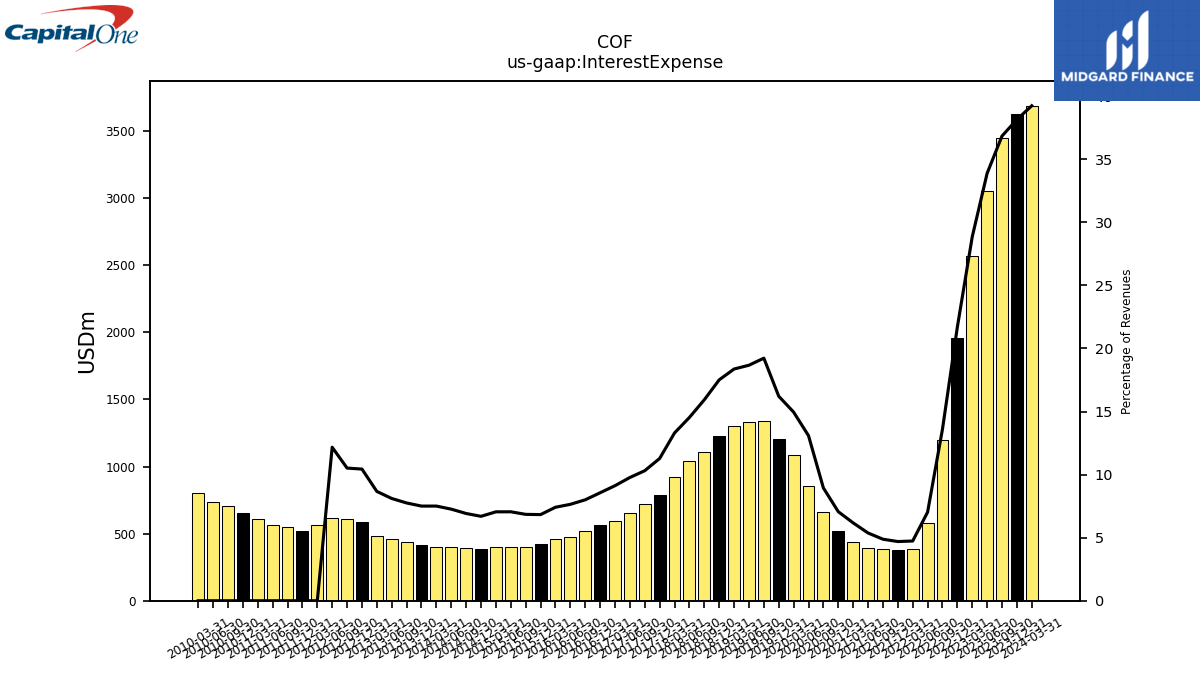 |
 |
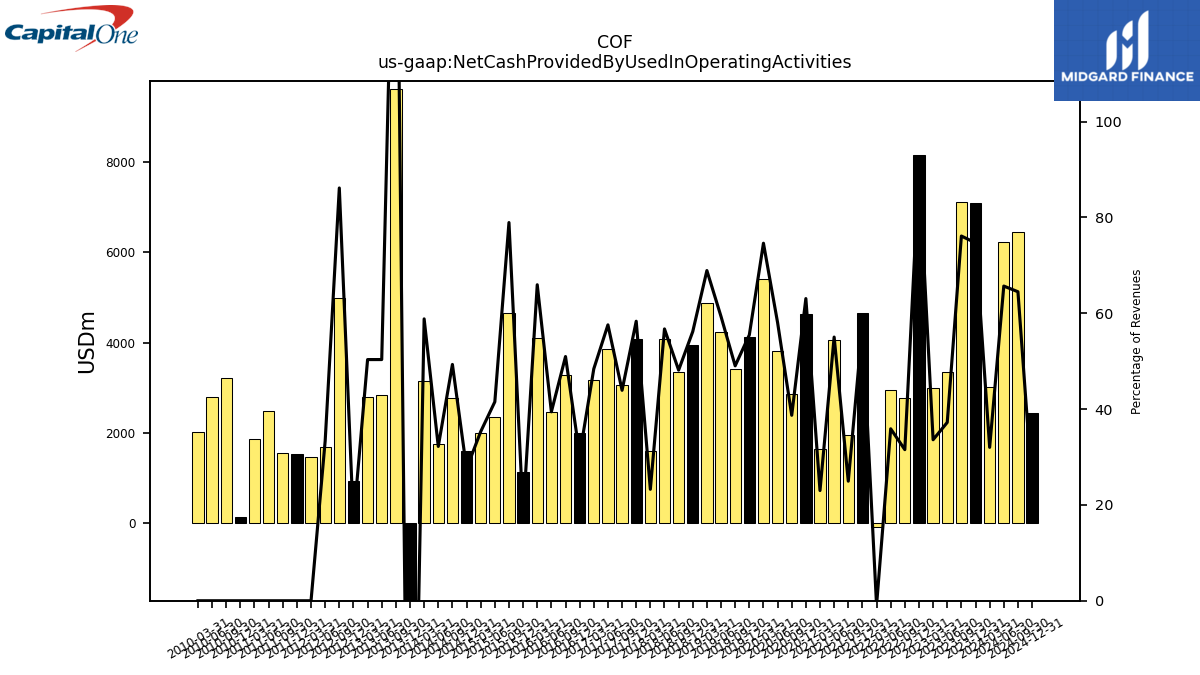 |
COF | 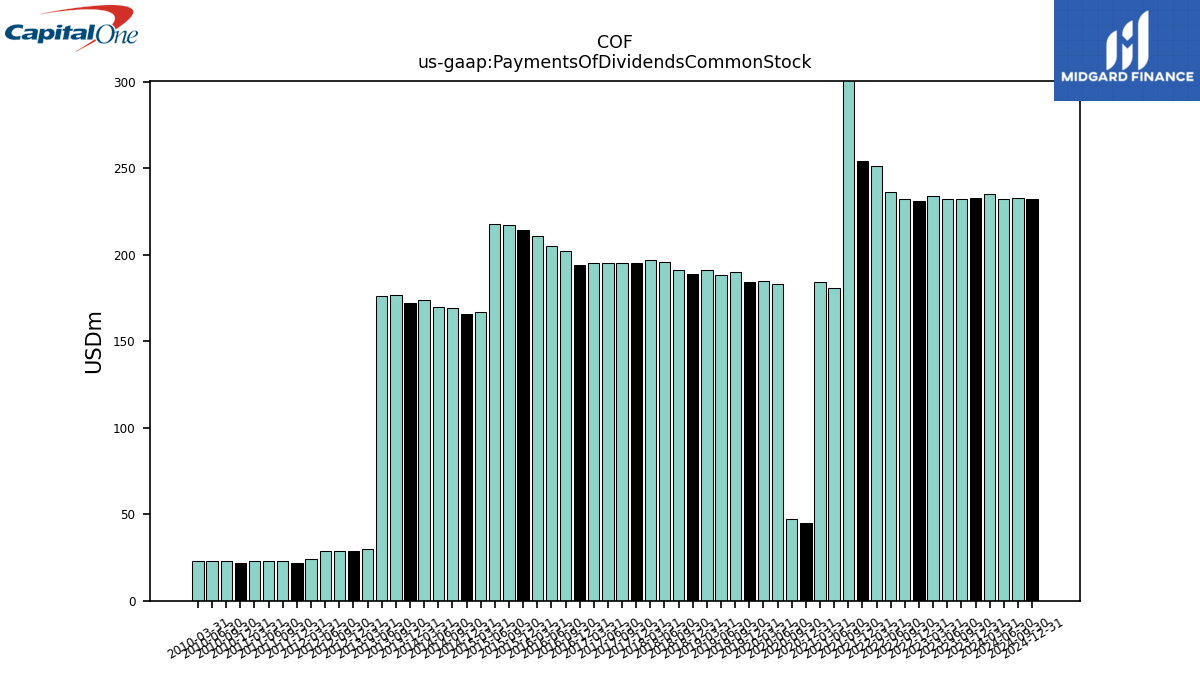 |
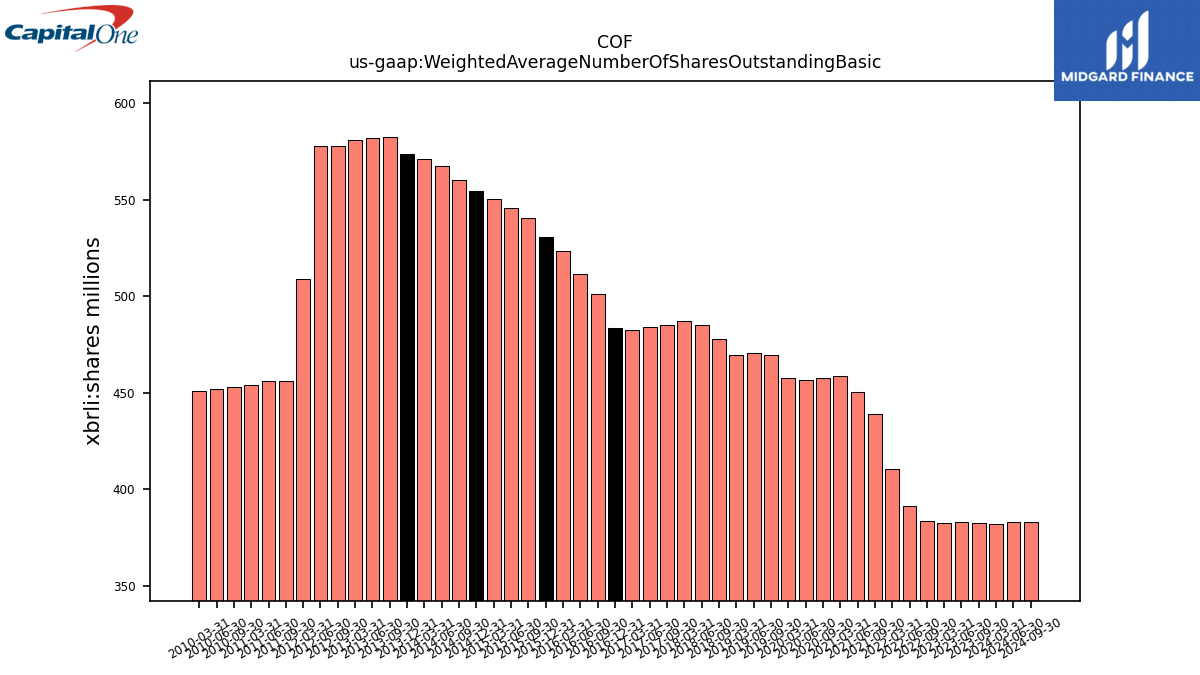 |
COF | ||||||
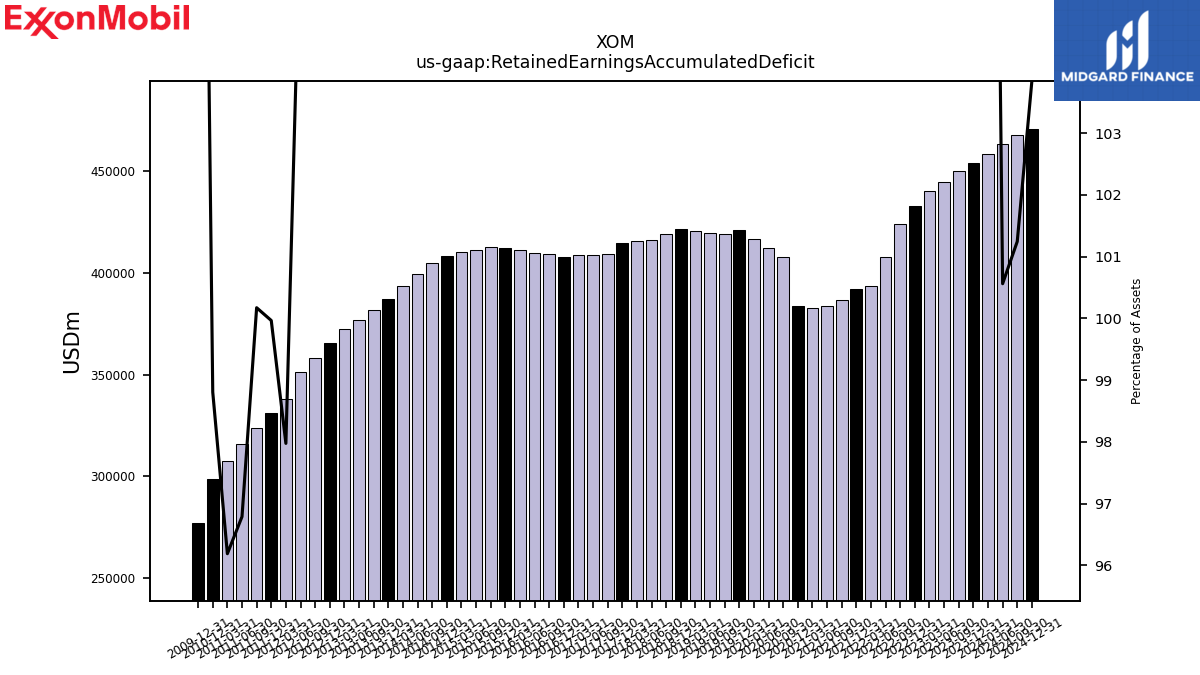
| $XOM$ | 2025-02-19 | 2024-11-04 | 2025-05-02 | NA | NA | XOM | 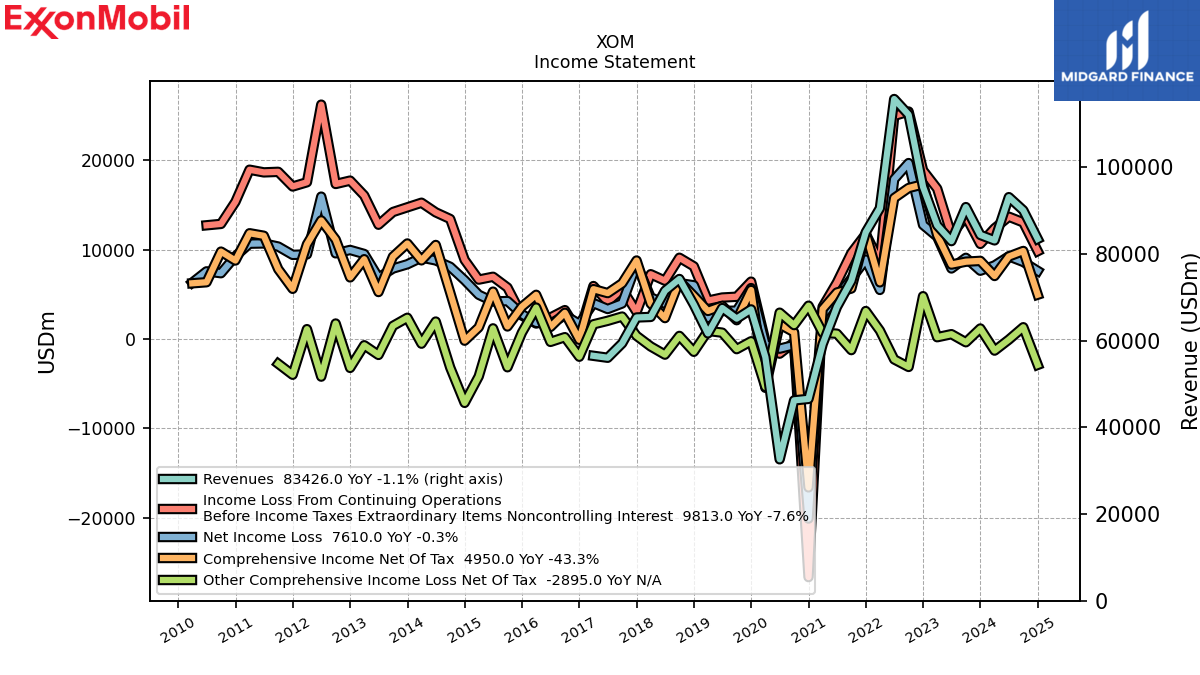 |
 |
 |
XOM |  |
XOM |  |
 |
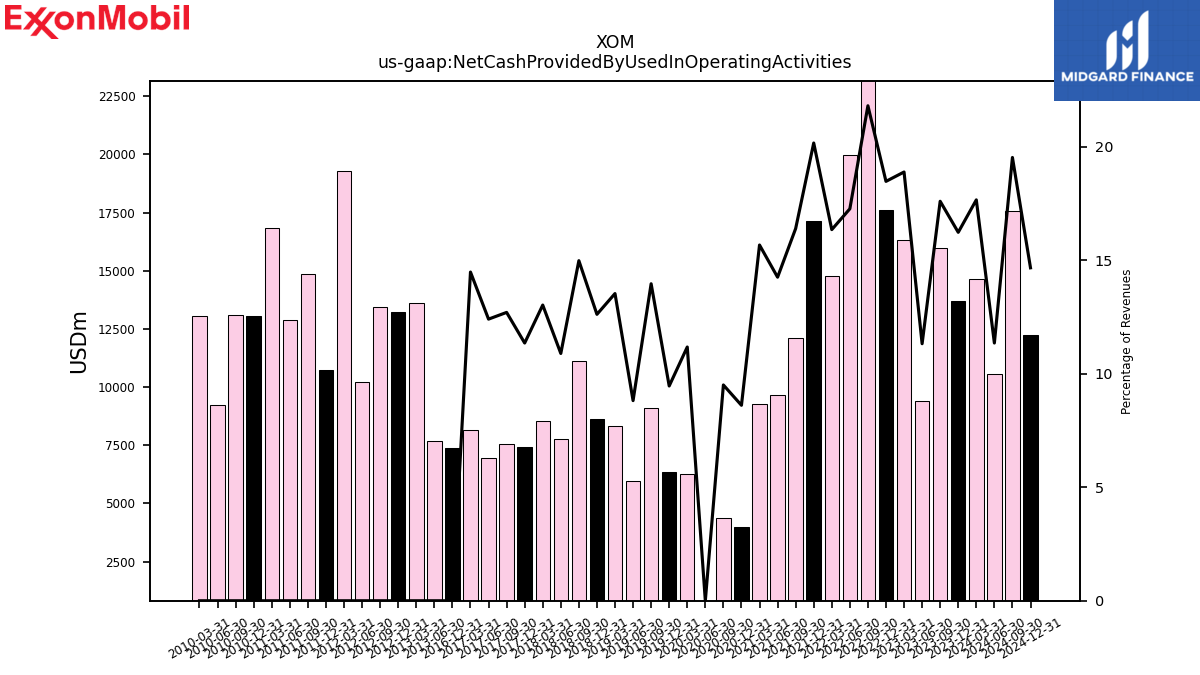 |
XOM | 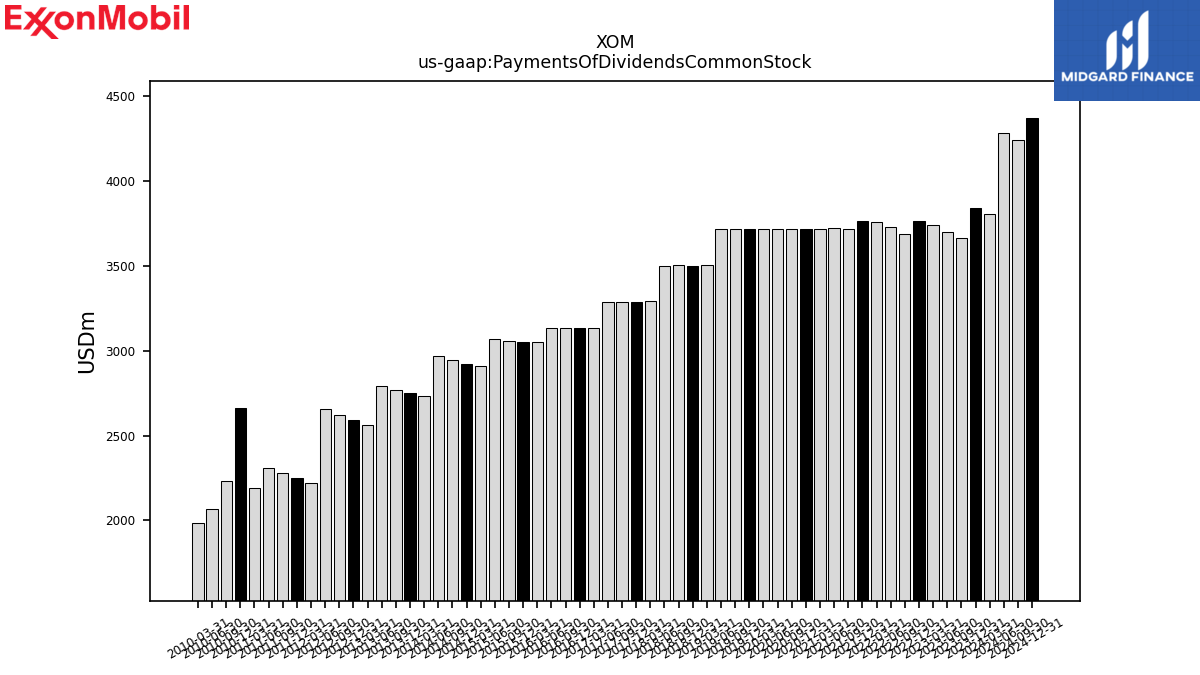 |
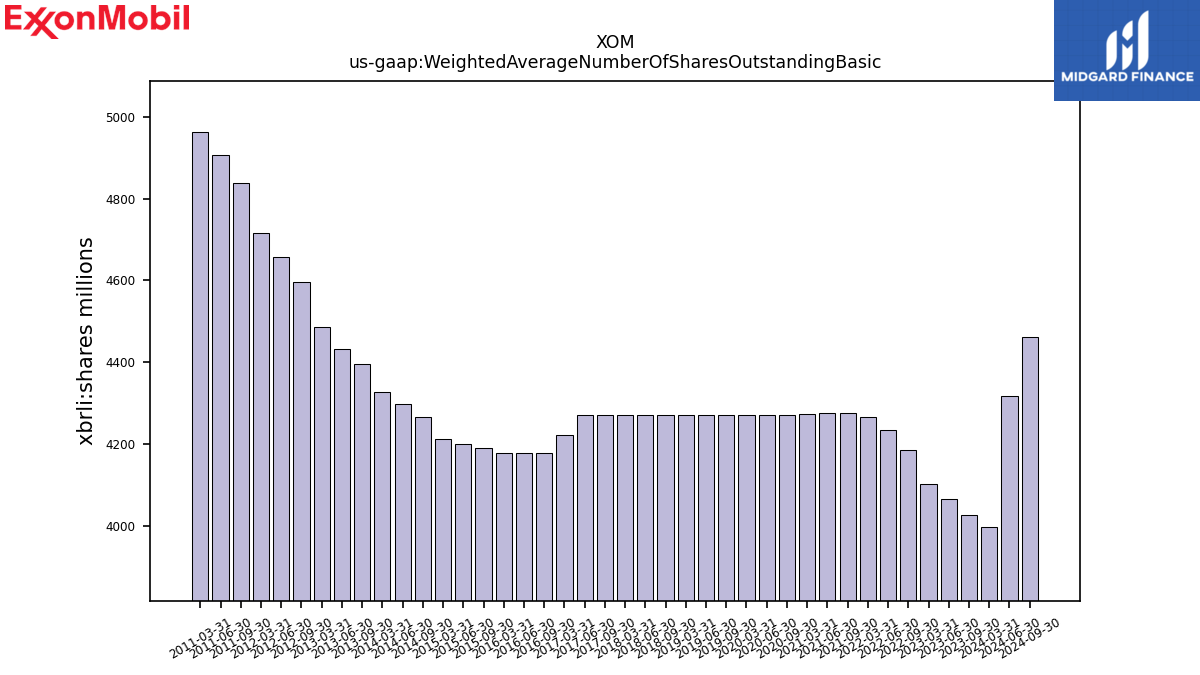 |
XOM | ||||||
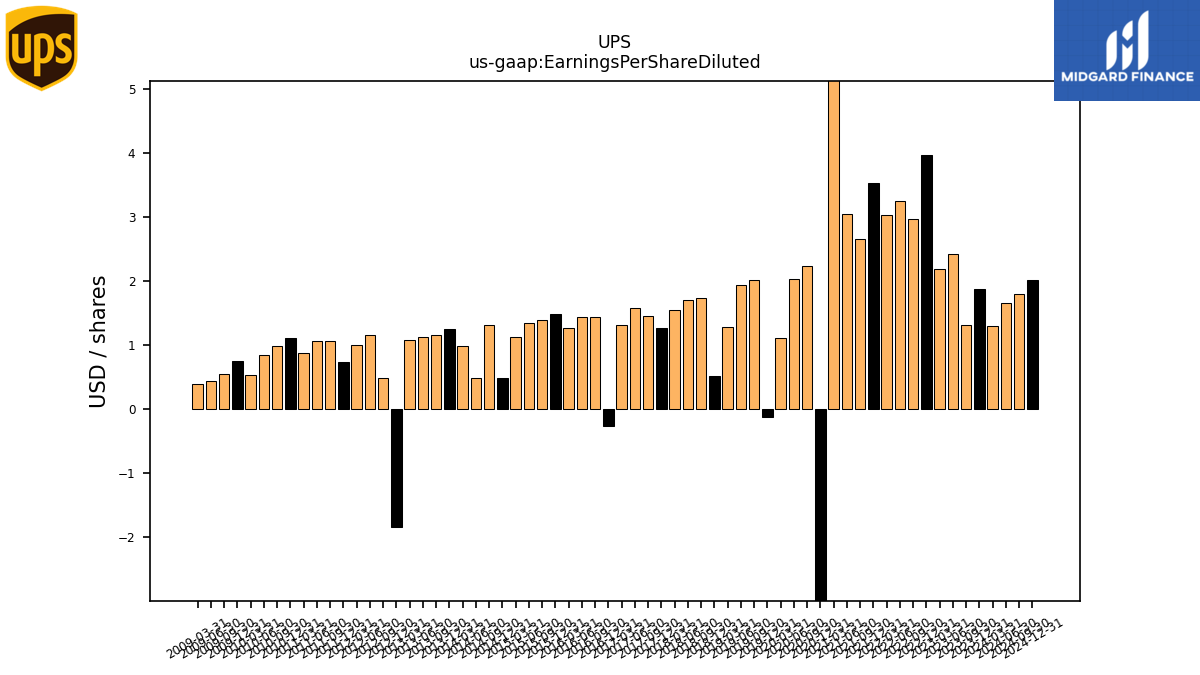
| $UPS$ | 2025-02-18 | 2024-11-06 | 2025-04-29 | NA | NA | UPS | 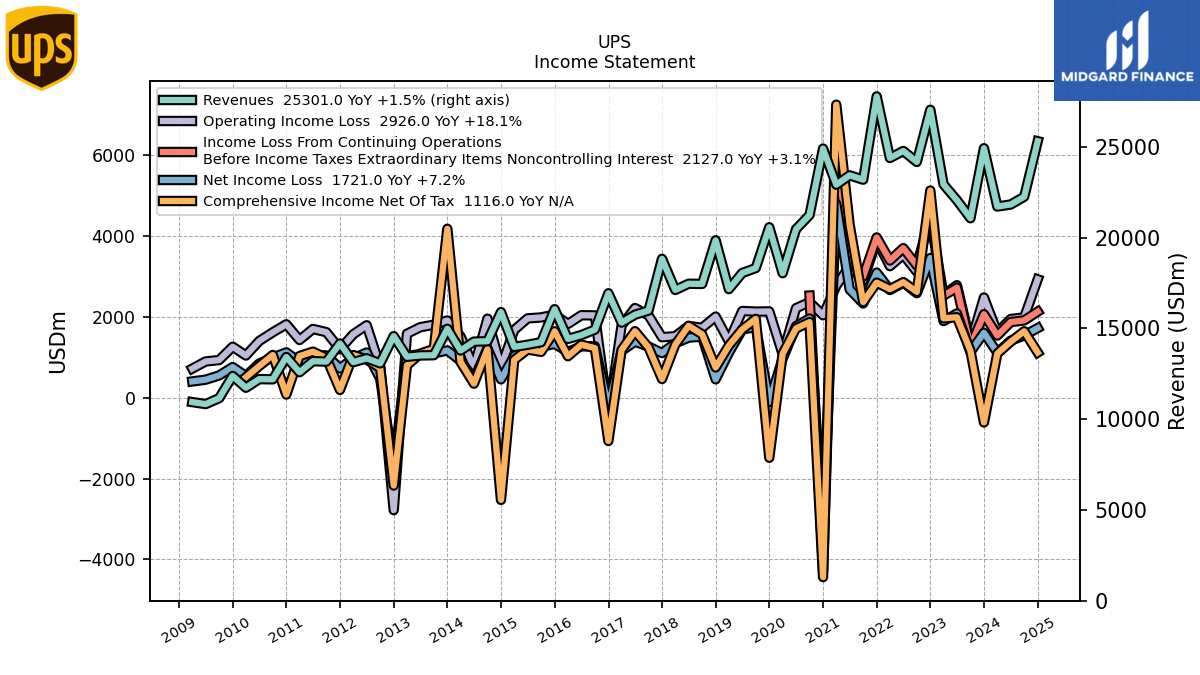 |
 |
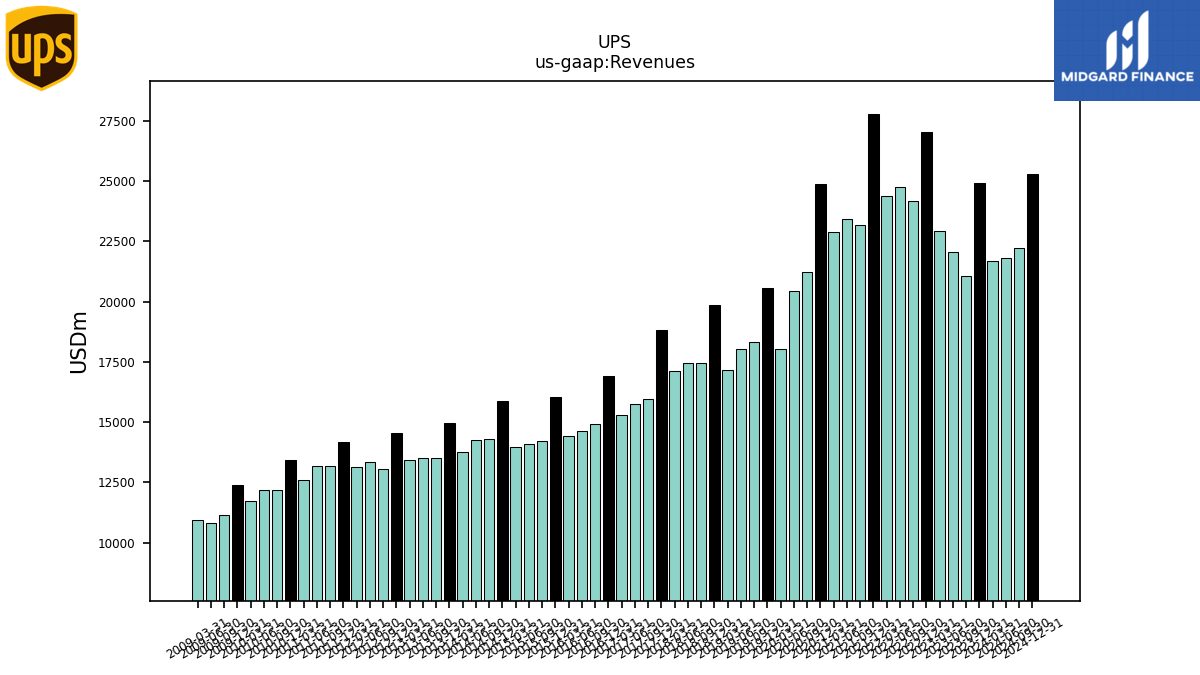 |
UPS | 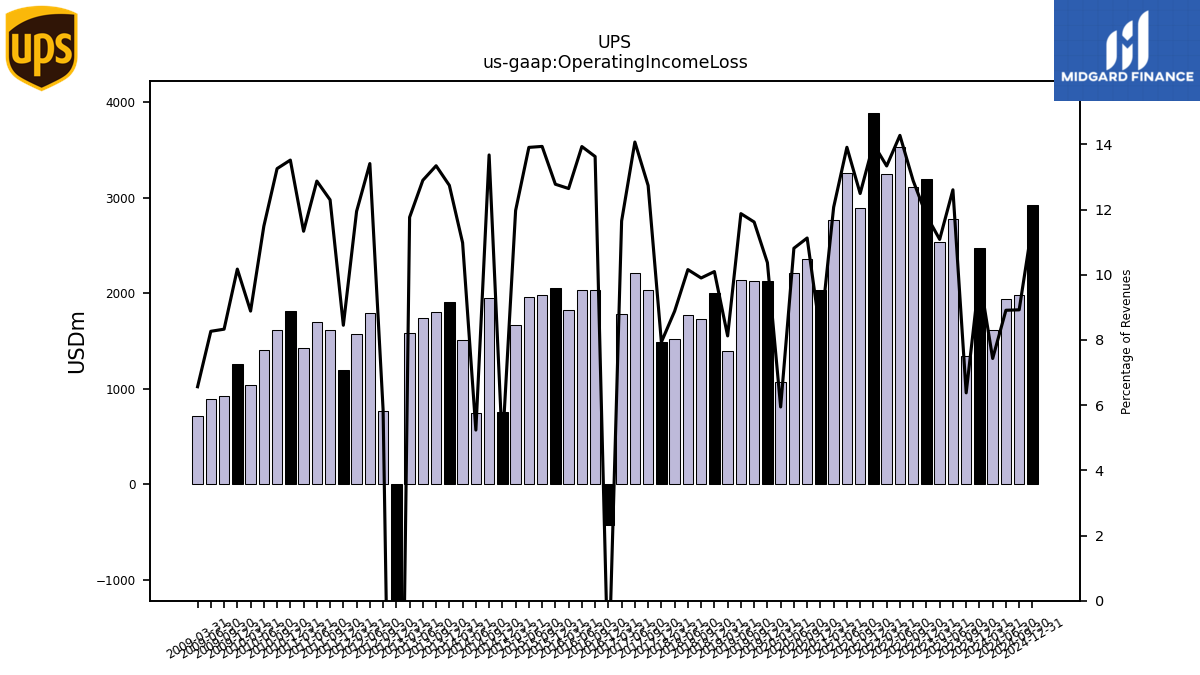 |
 |
UPS |  |
 |
 |
UPS | 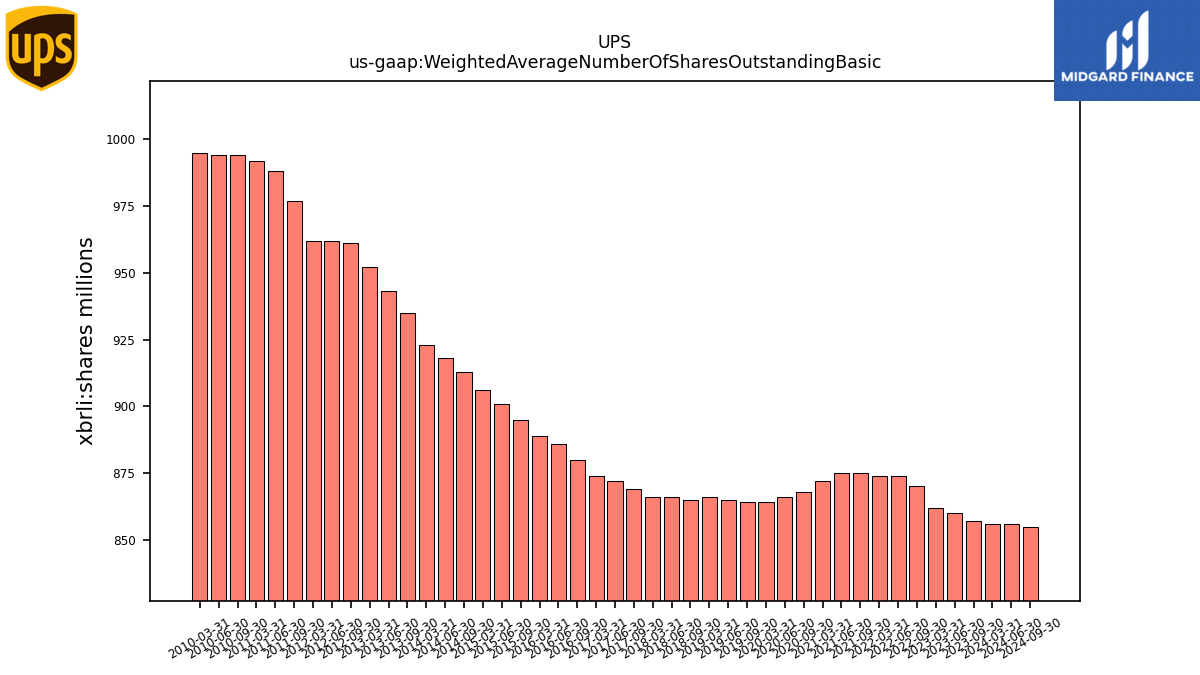 |
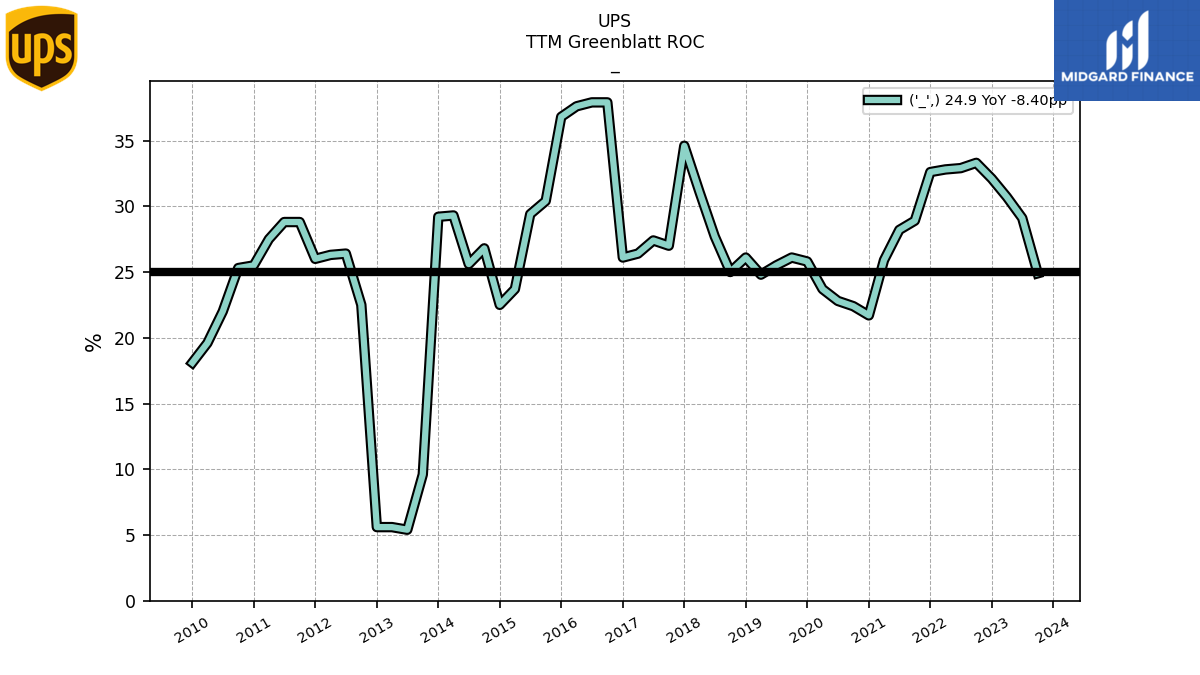 |
UPS | |||||
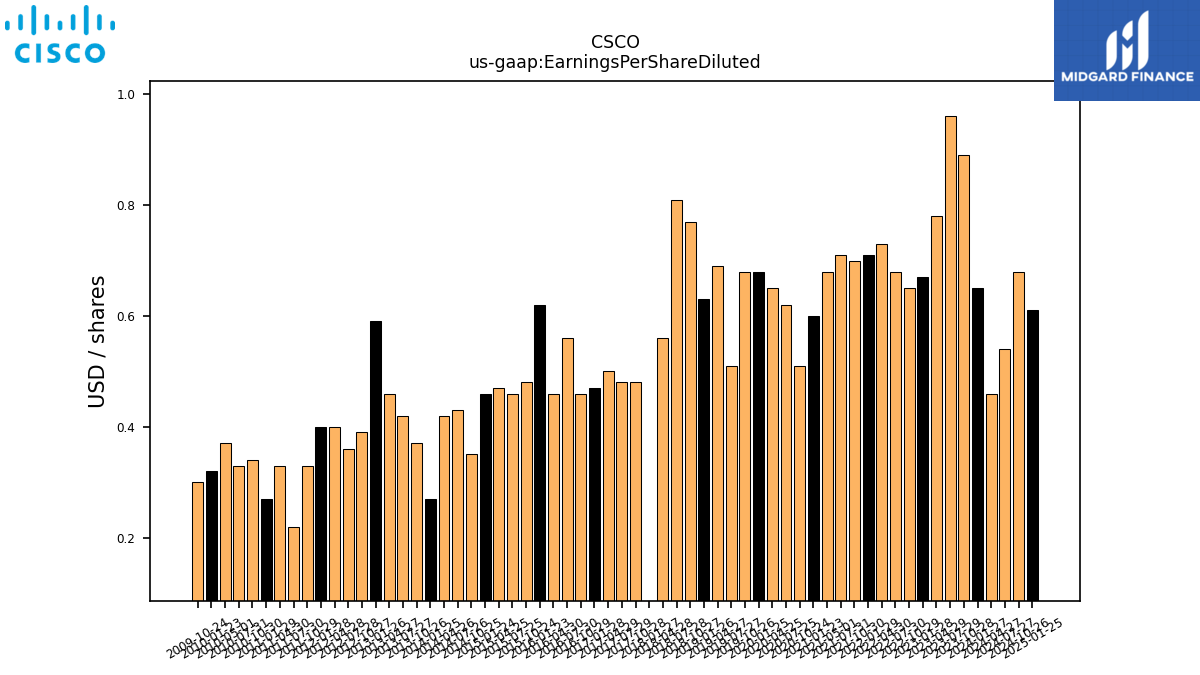
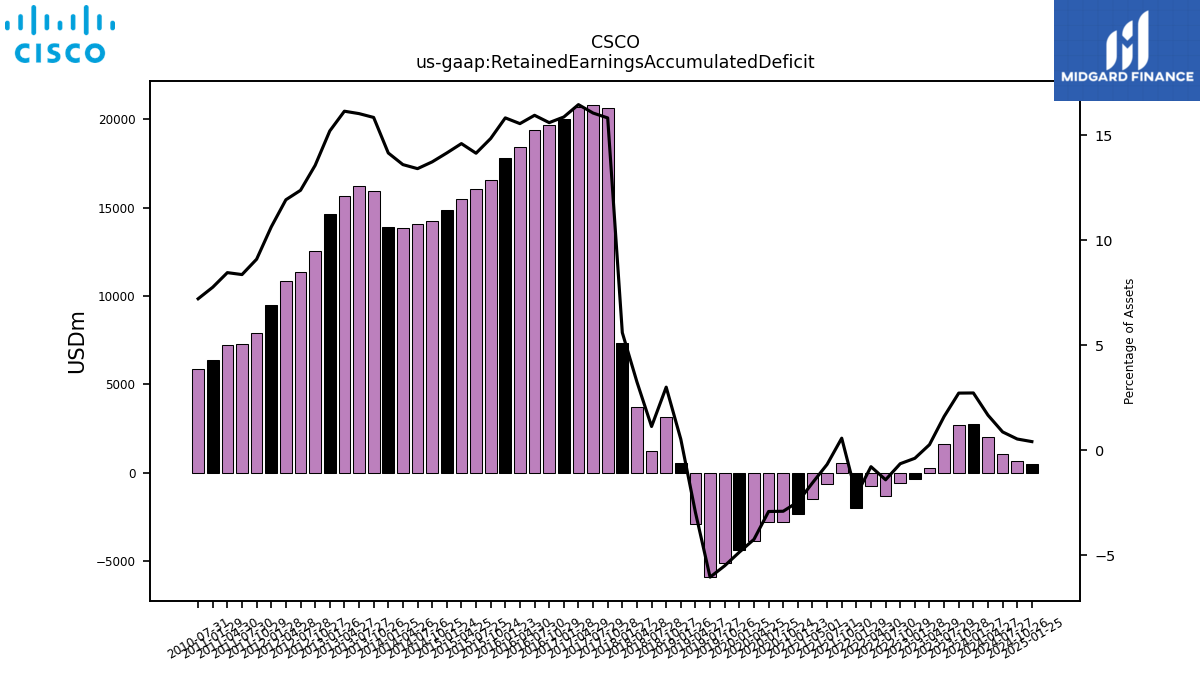
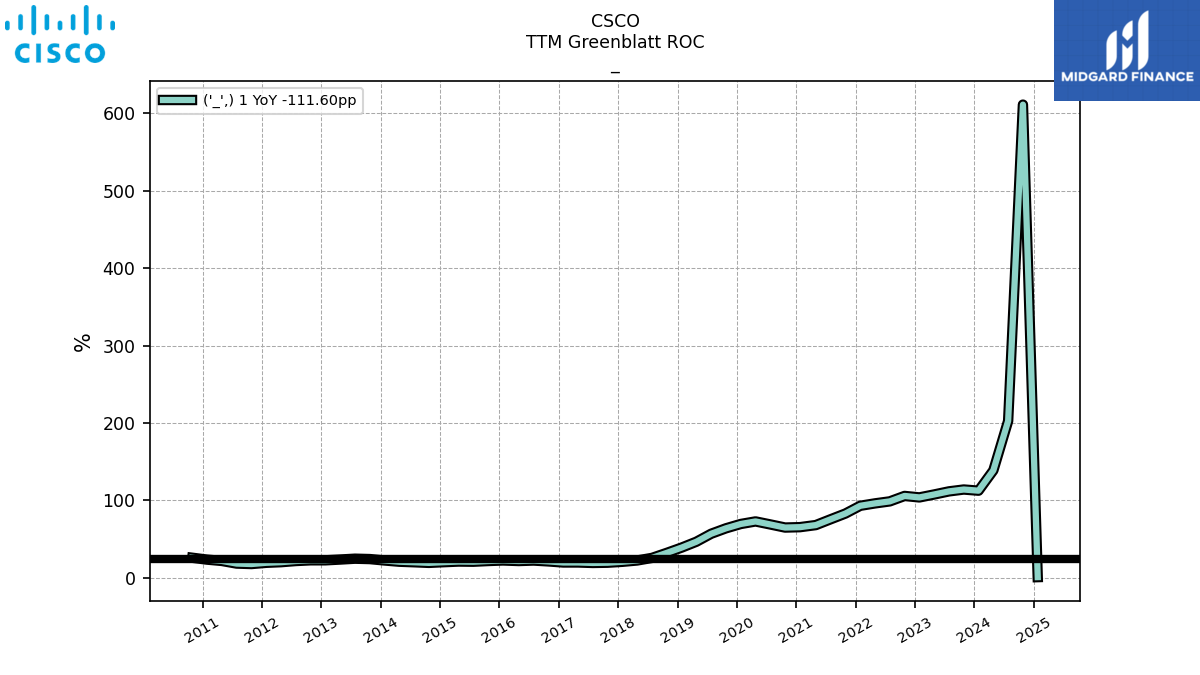
| $CSCO$ | 2024-09-05 | 2025-02-18 | 2025-02-12 | NA | NA | CSCO | 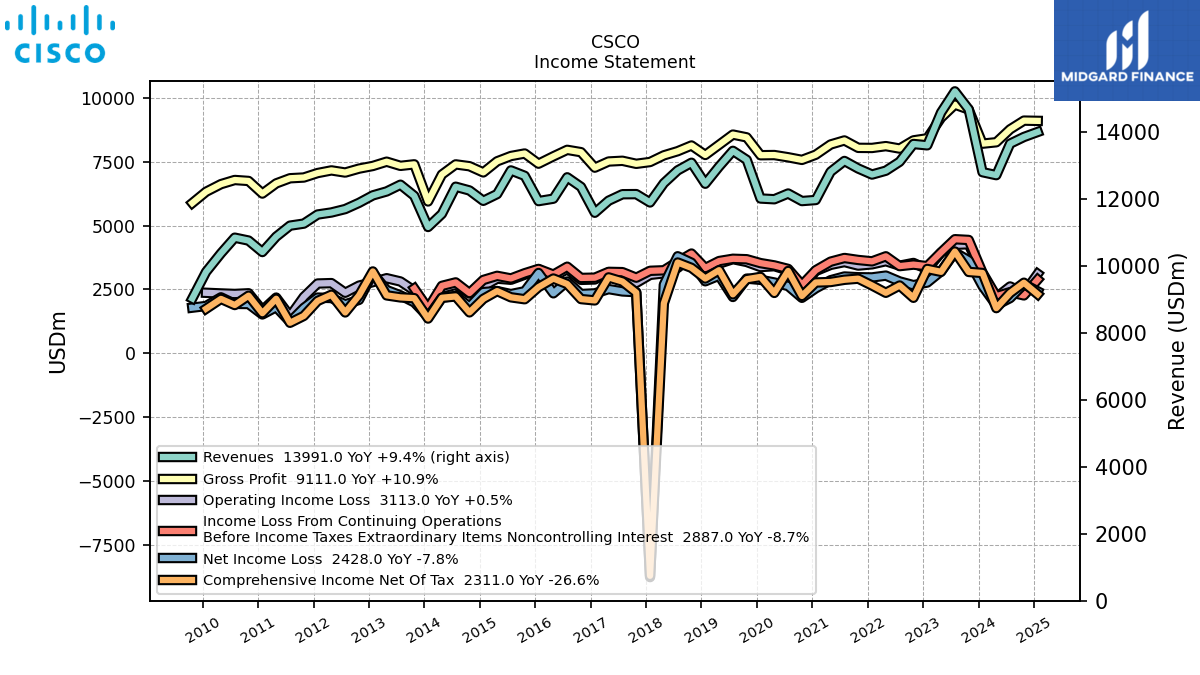 |
 |
 |
CSCO |  |
 |
 |
CSCO | 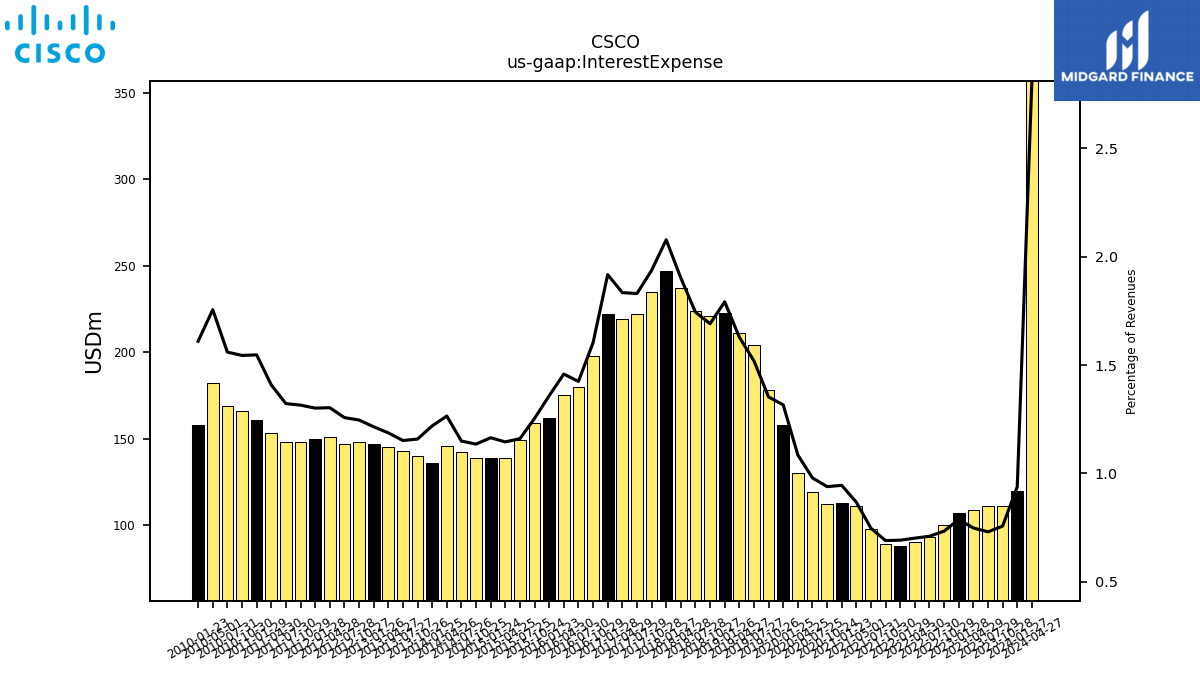 |
 |
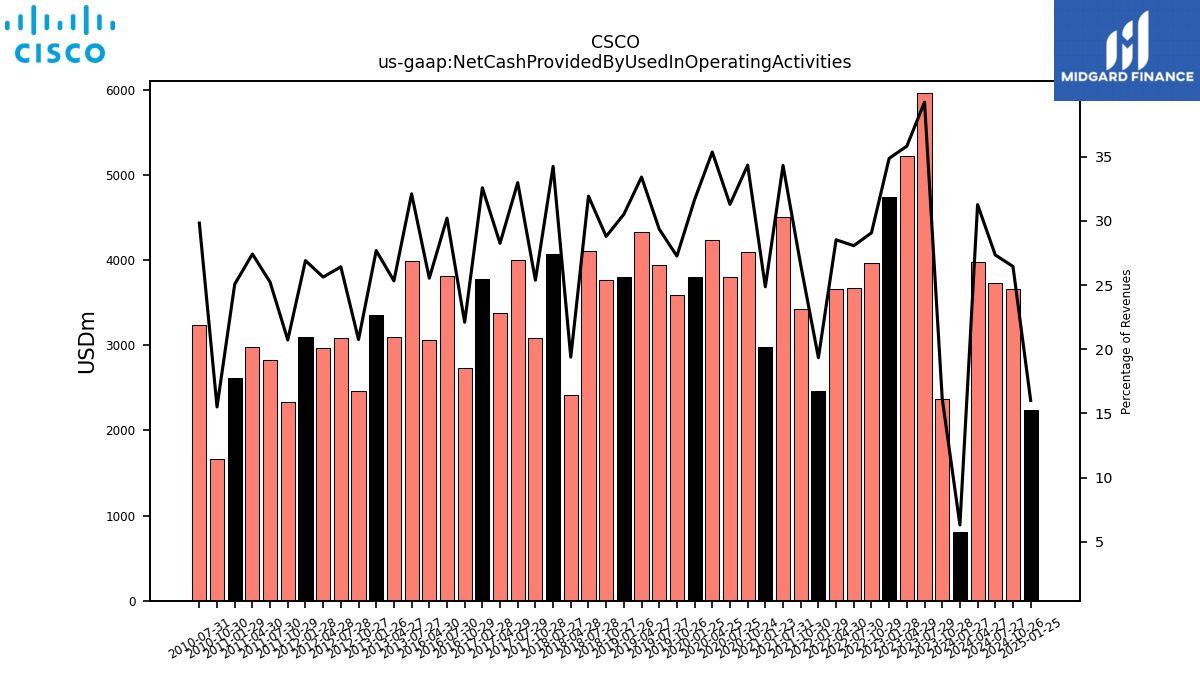 |
CSCO | 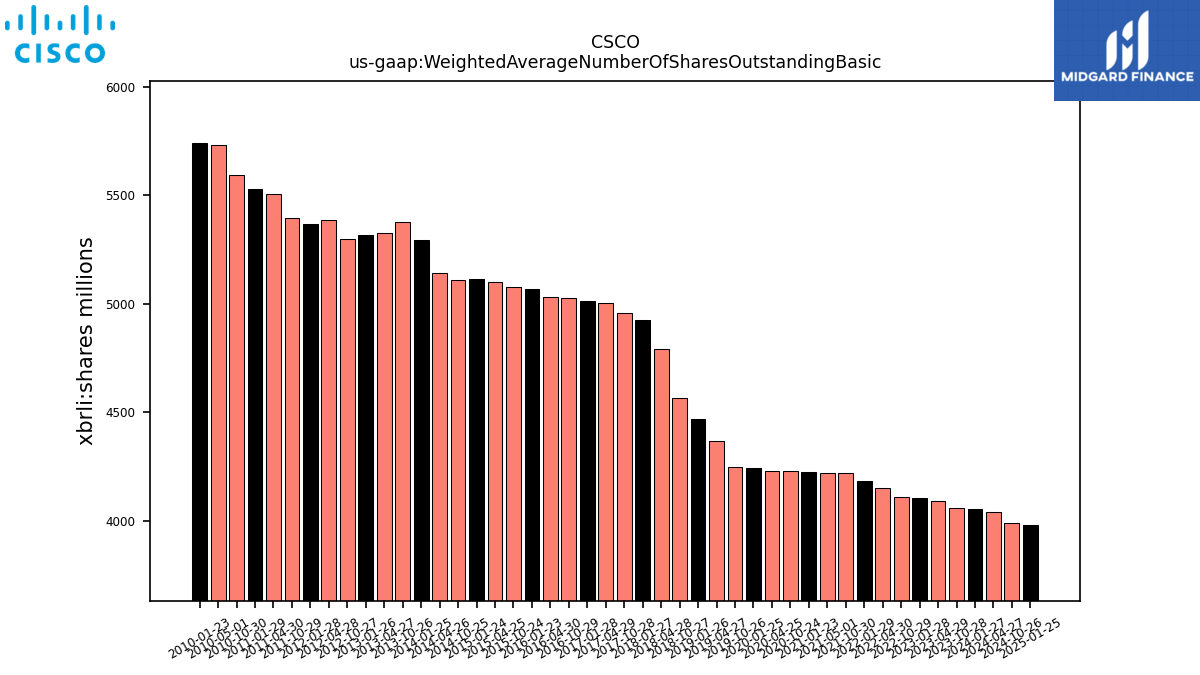 |
 |
CSCO | ||||
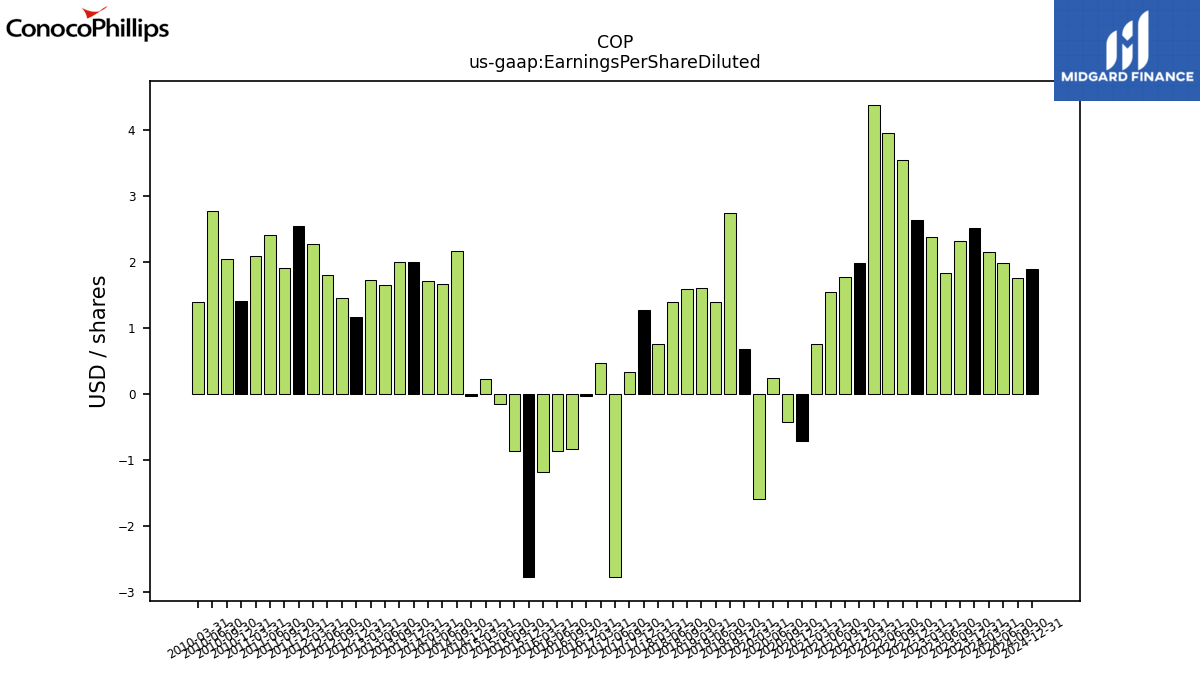
| $COP$ | 2025-02-18 | 2024-10-31 | 2025-02-06 | NA | NA | COP | 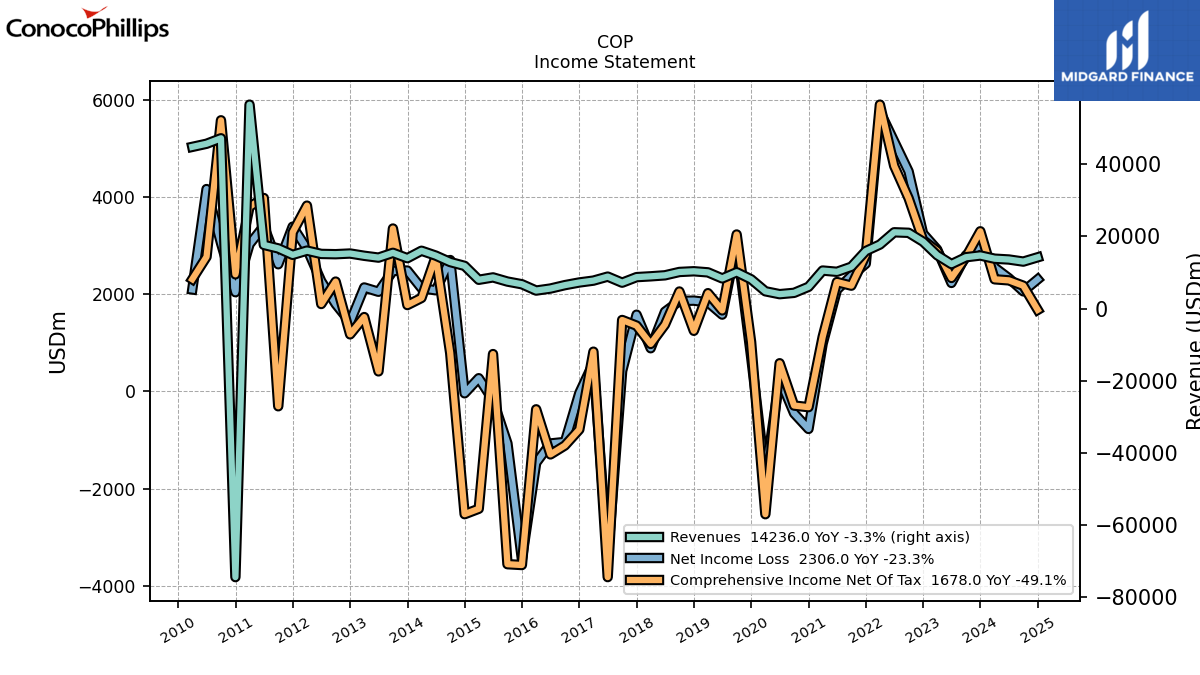 |
 |
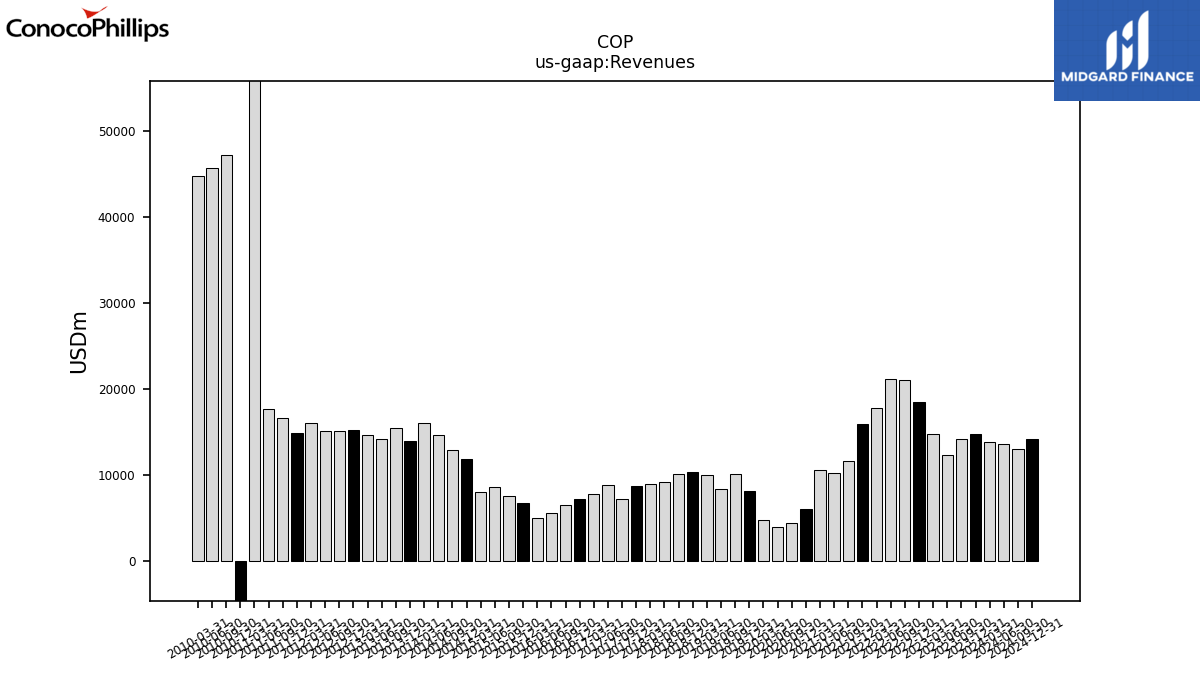 |
COP | 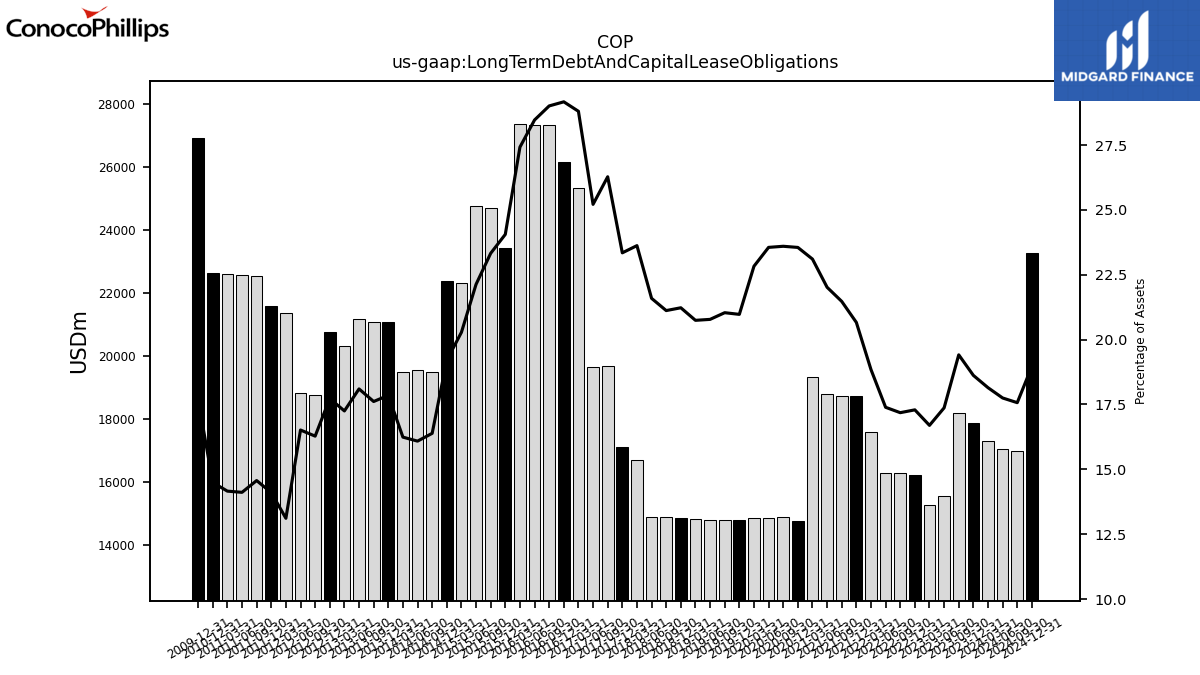 |
COP | 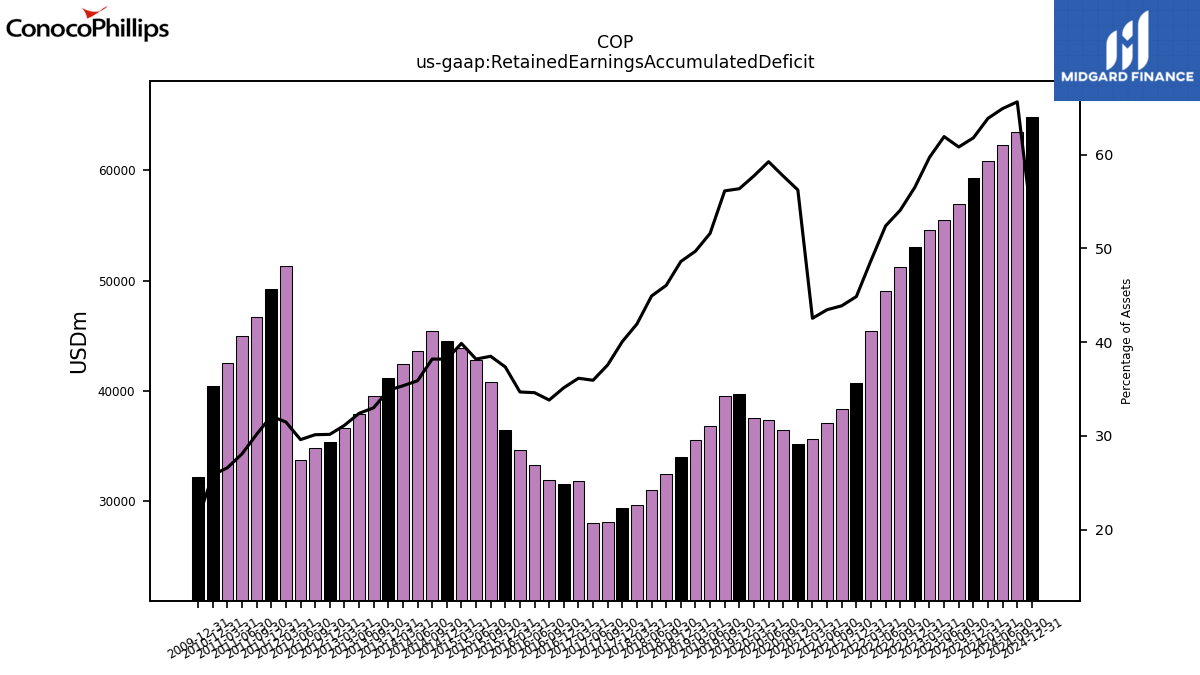 |
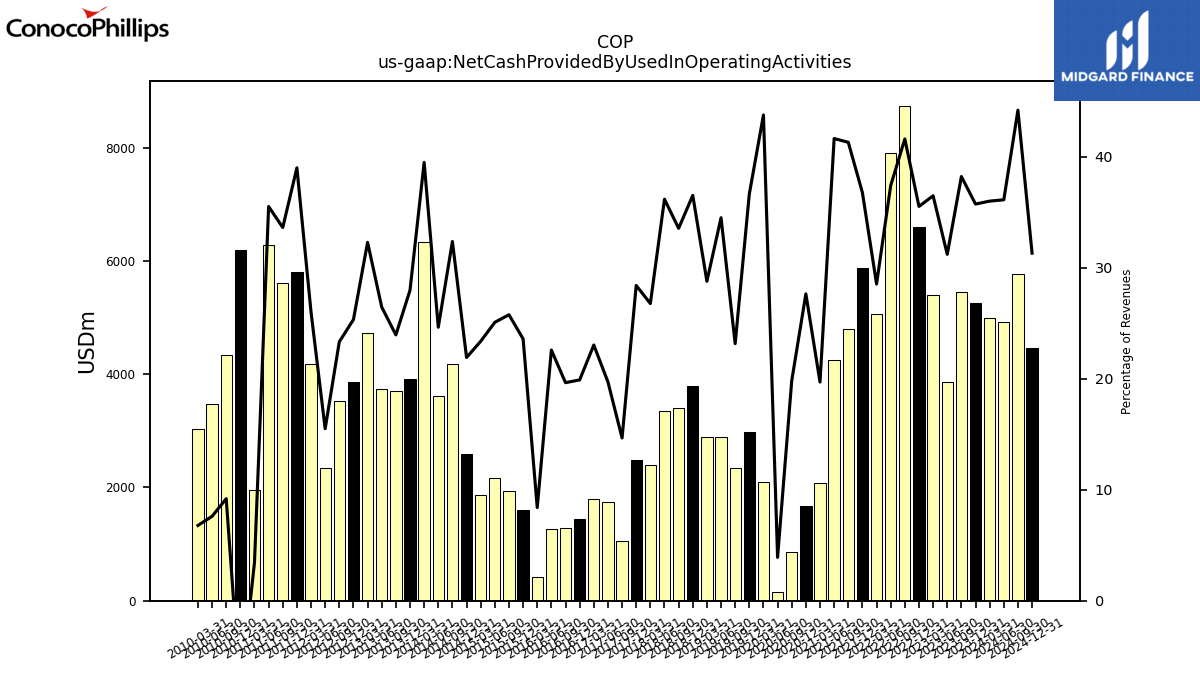 |
COP | 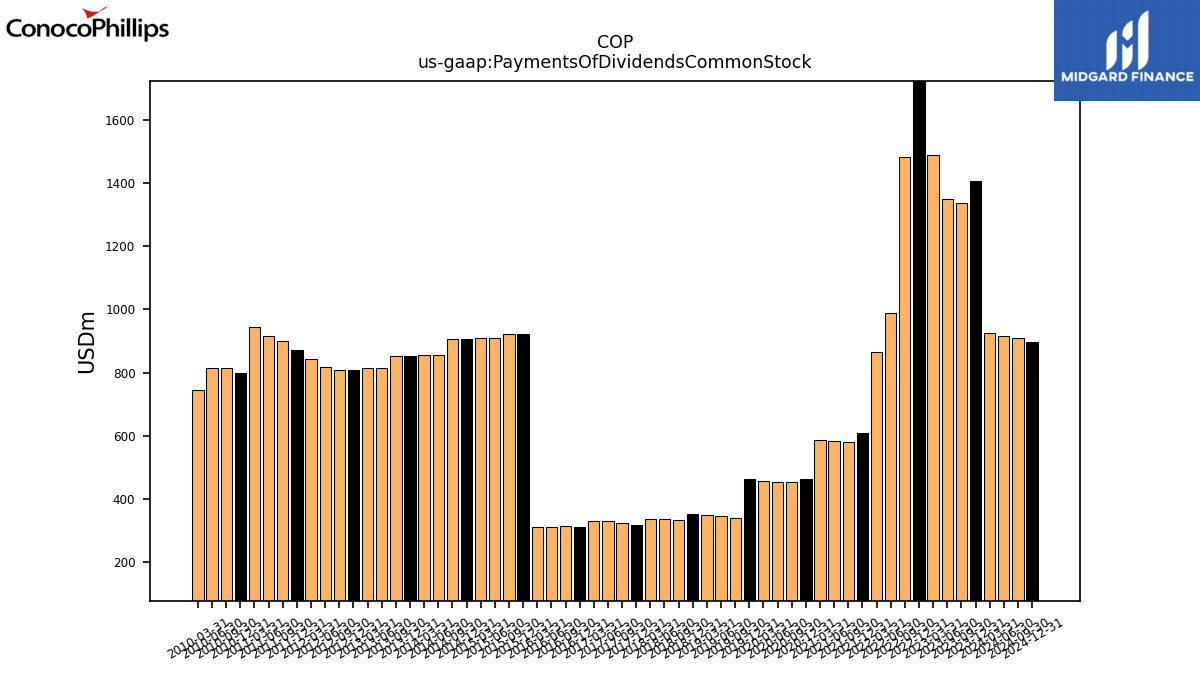 |
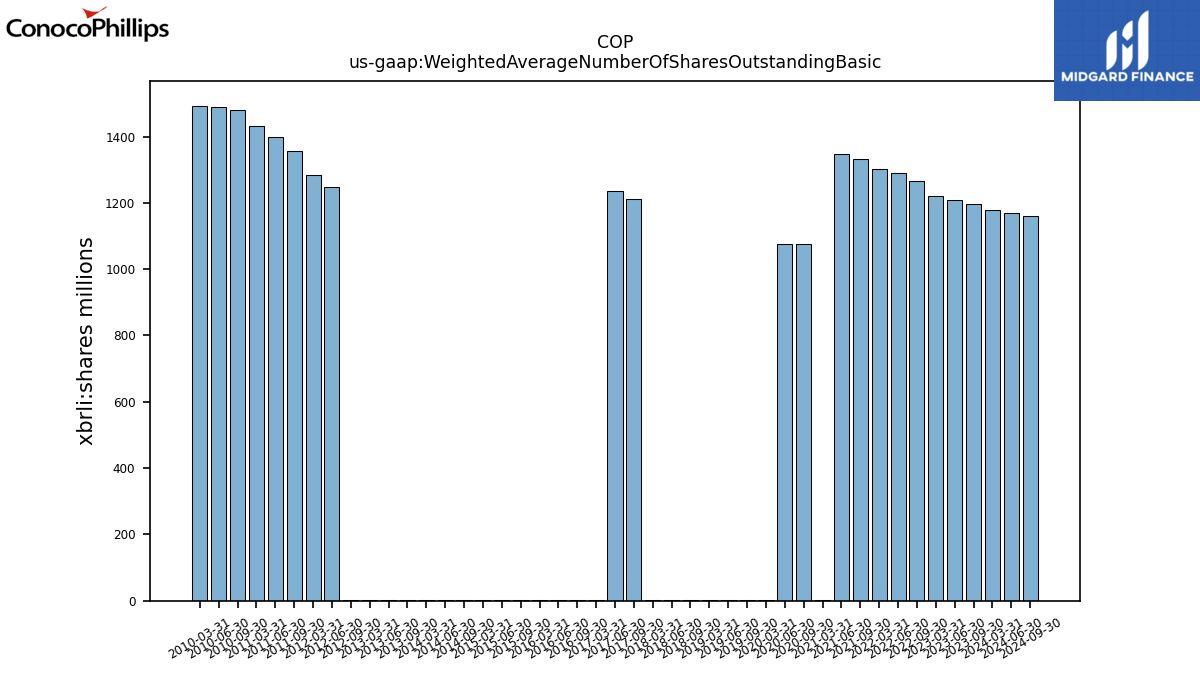 |
COP | |||||||
| Ticker | 10K | 10Q | 8K | Sector | Industry | Logo | Forward P/E | Revenue Growth | Ticker | Income | EPS | Revenues | Ticker | GrossProfit | OperatingIncome | LongTermDebt | Ticker | InterestExpense | RetainedEarnnings | CashFlowOperating | Ticker | Dividends | SharesOutstanding | TTMGreenblattROC | |
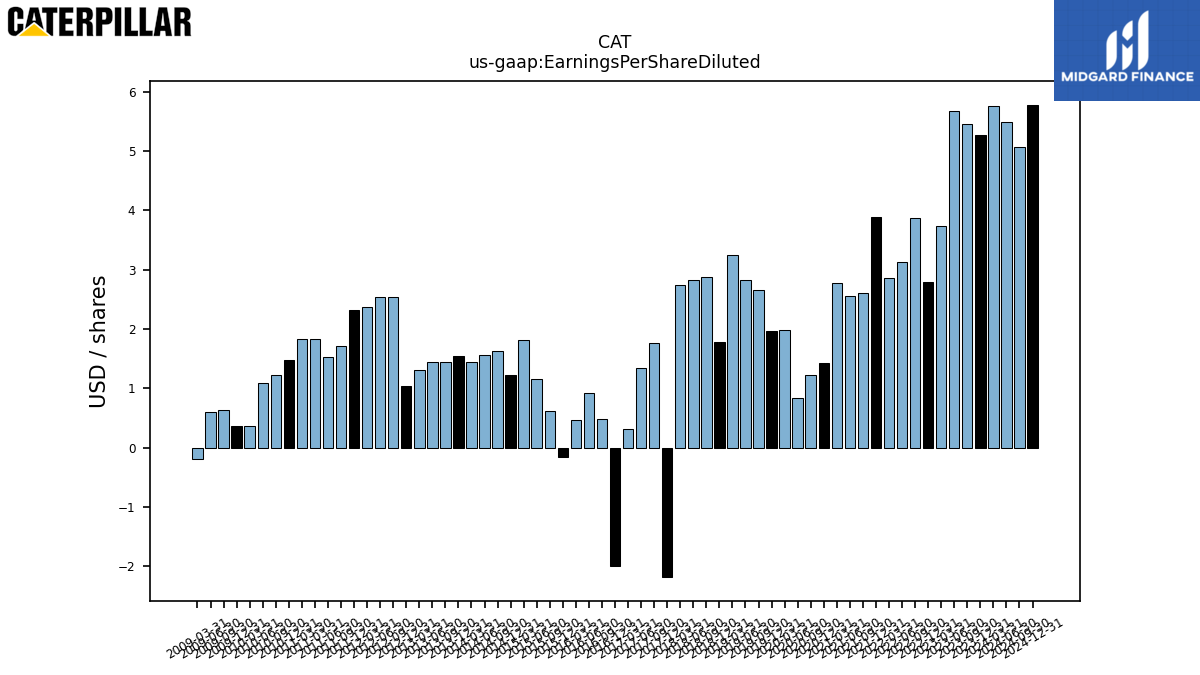
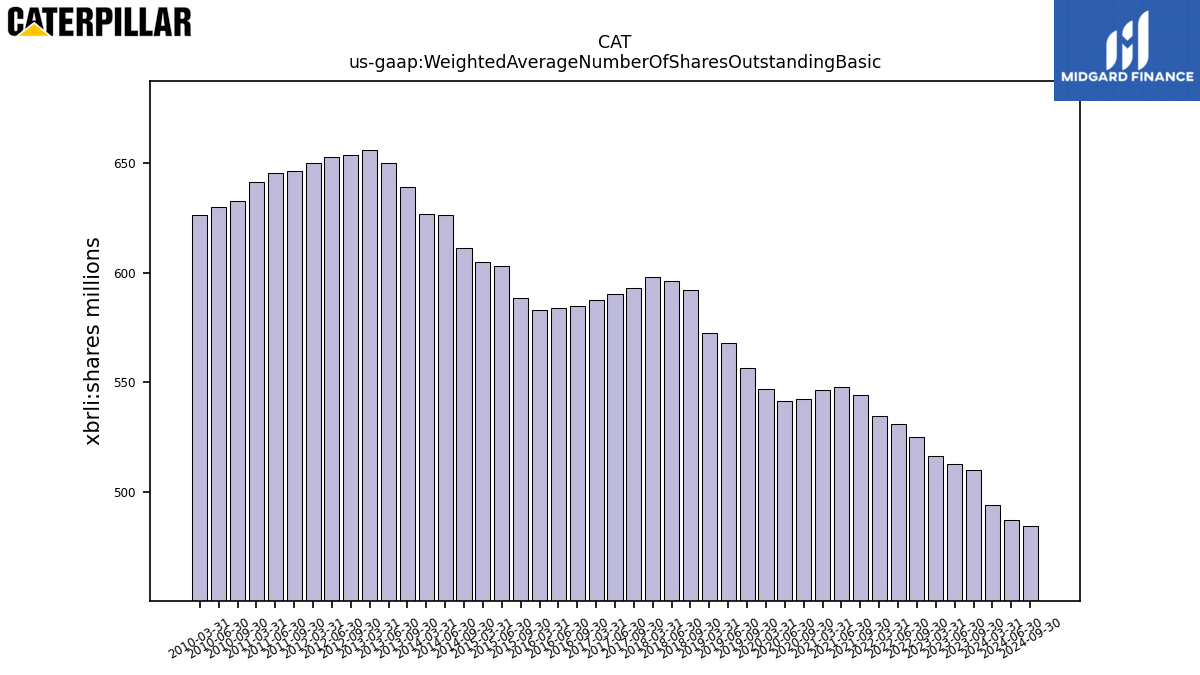
| $CAT$ | 2025-02-14 | 2024-11-06 | 2025-04-30 | NA | NA | CAT | 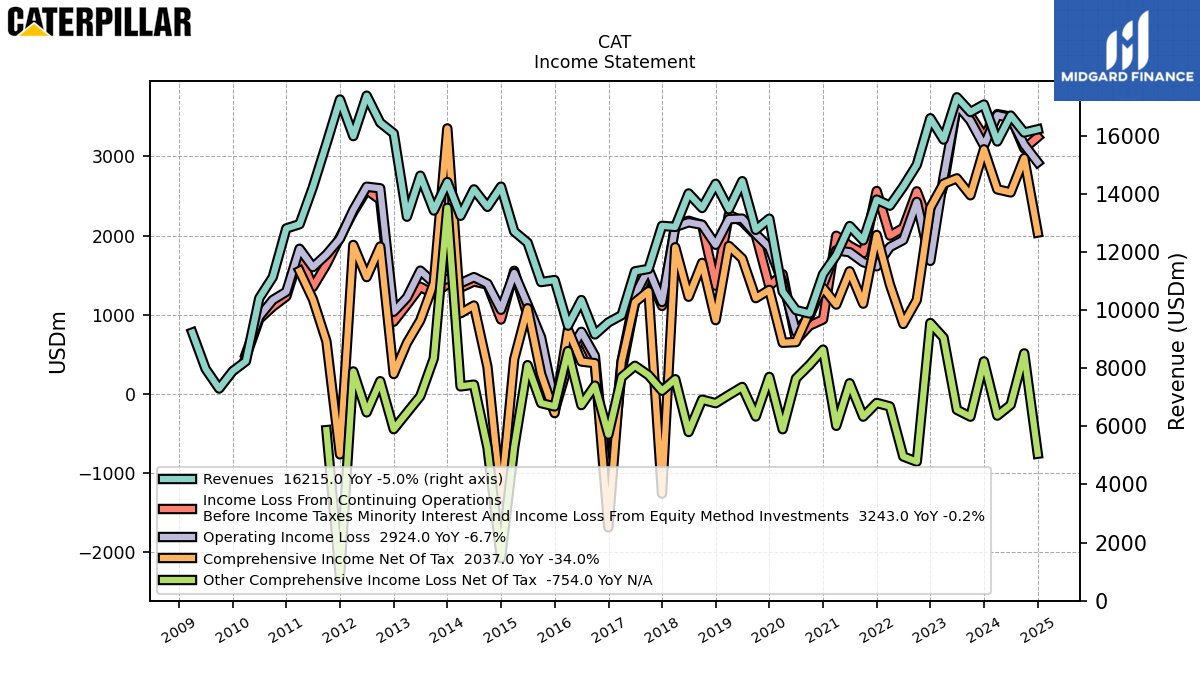 |
 |
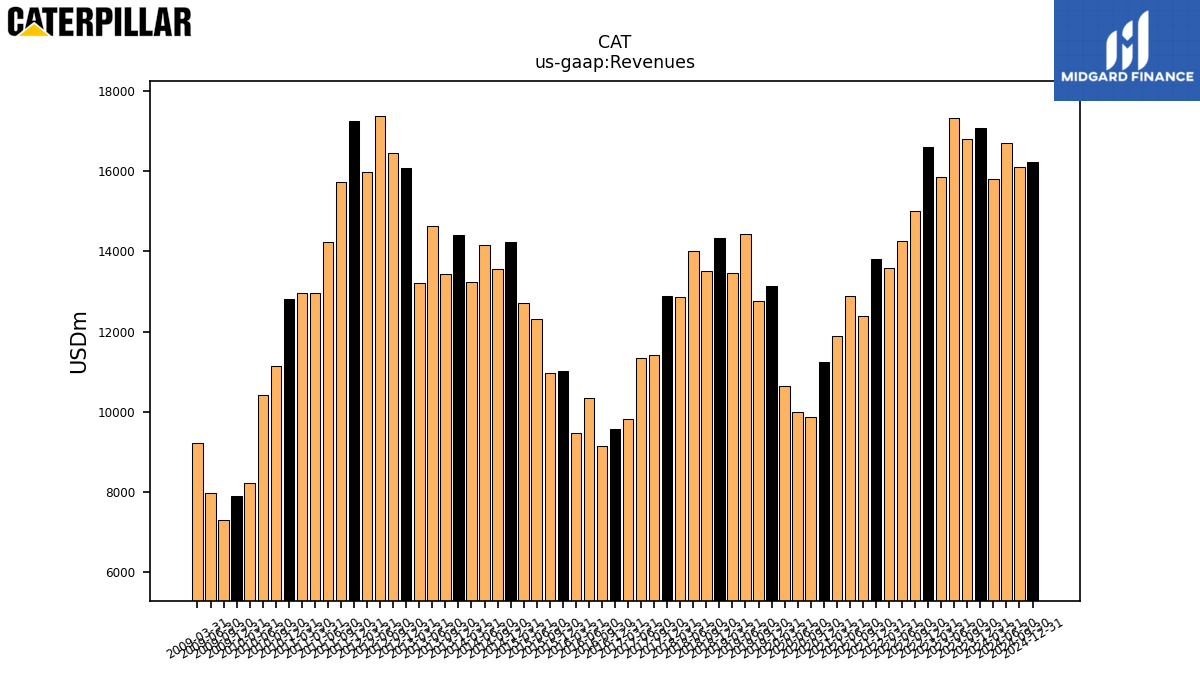 |
CAT | 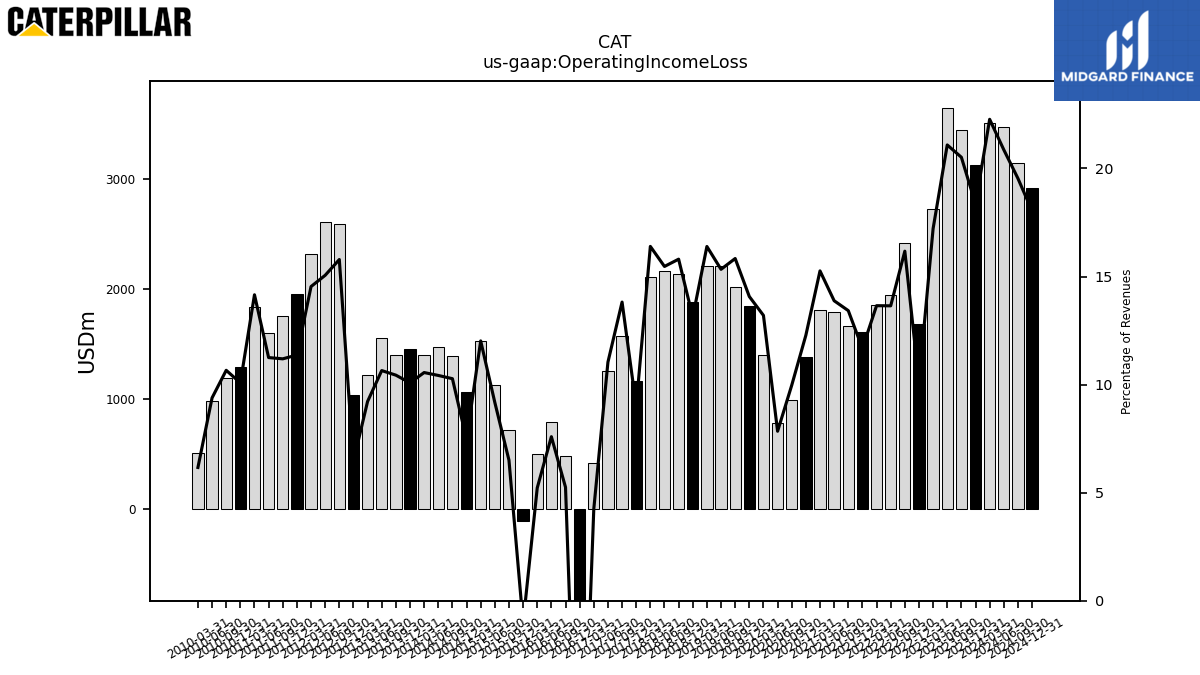 |
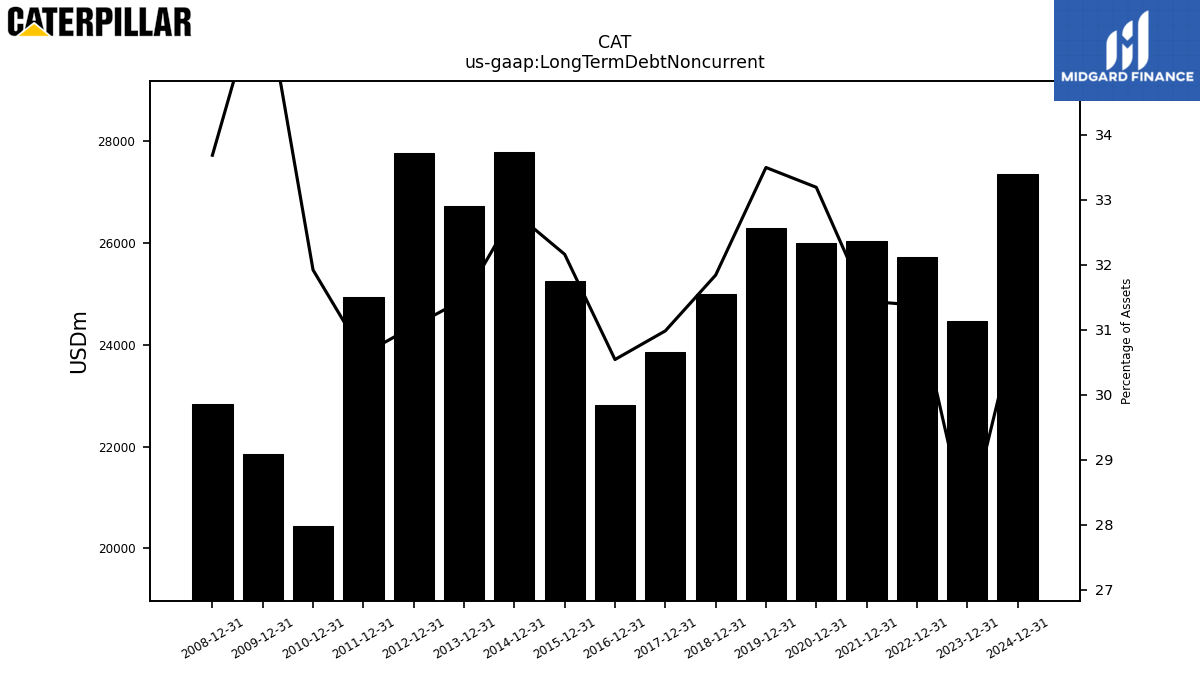 |
CAT | 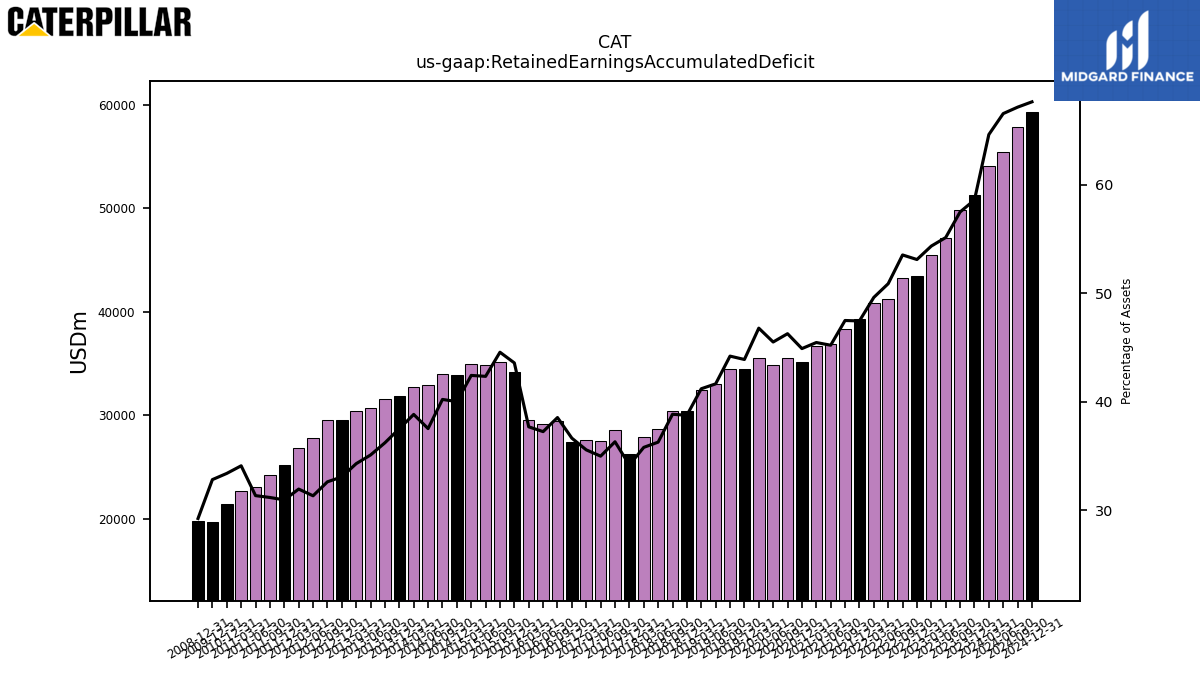 |
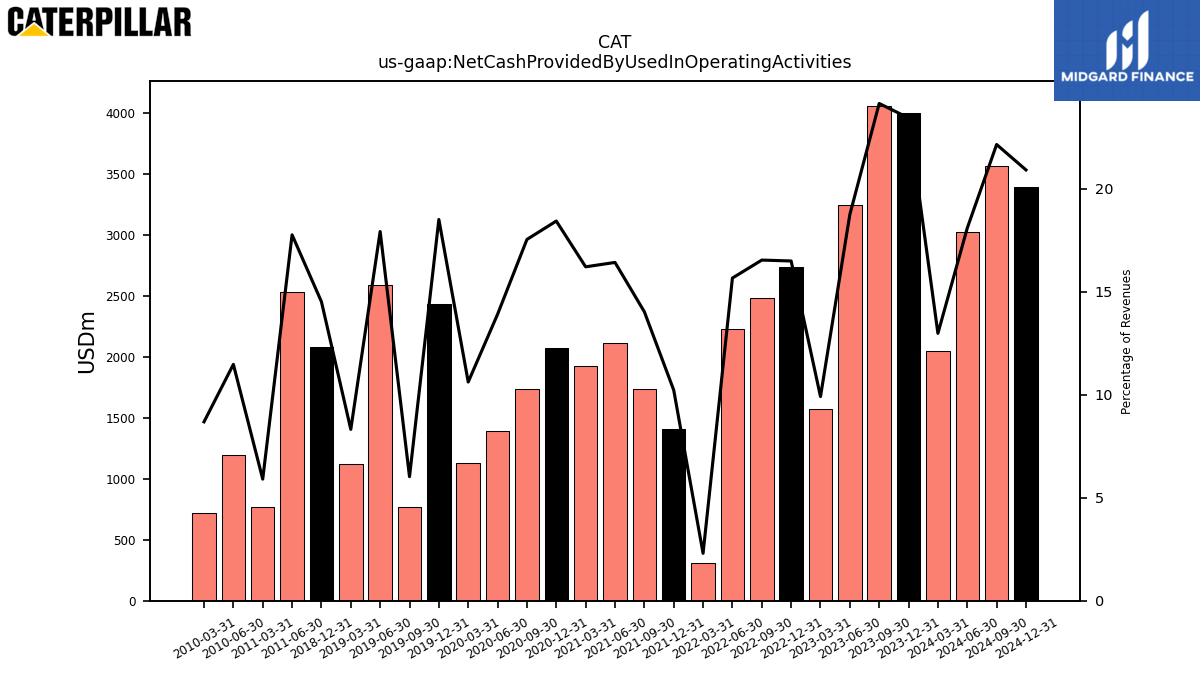 |
CAT | 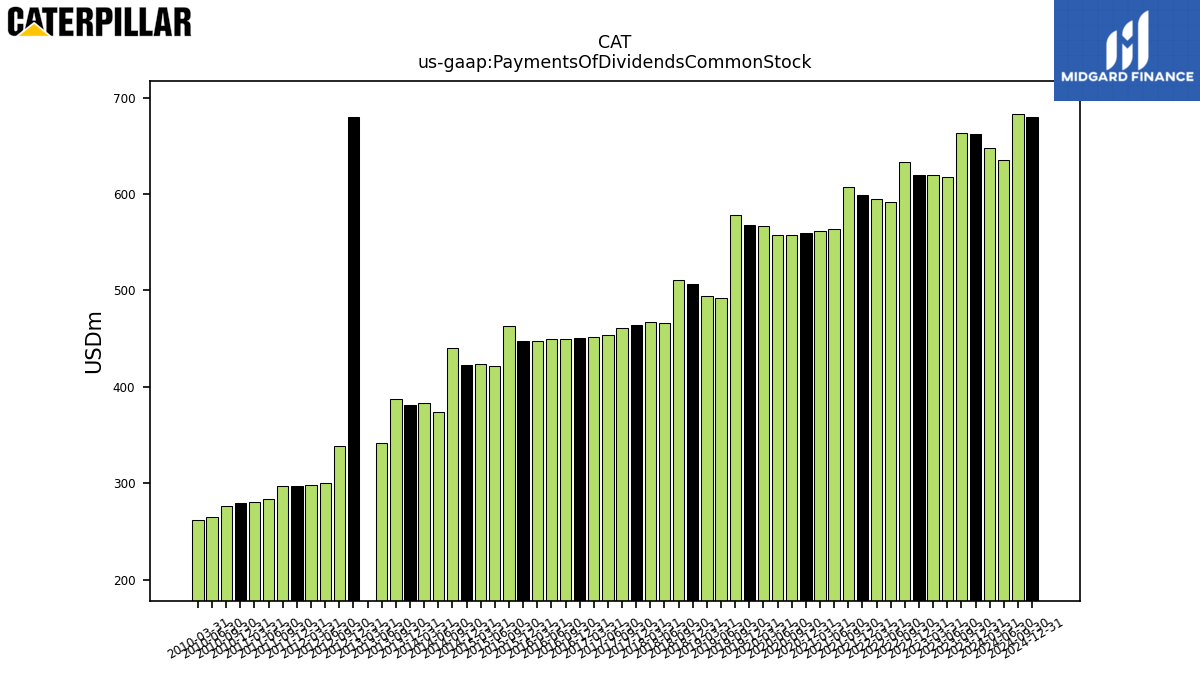 |
 |
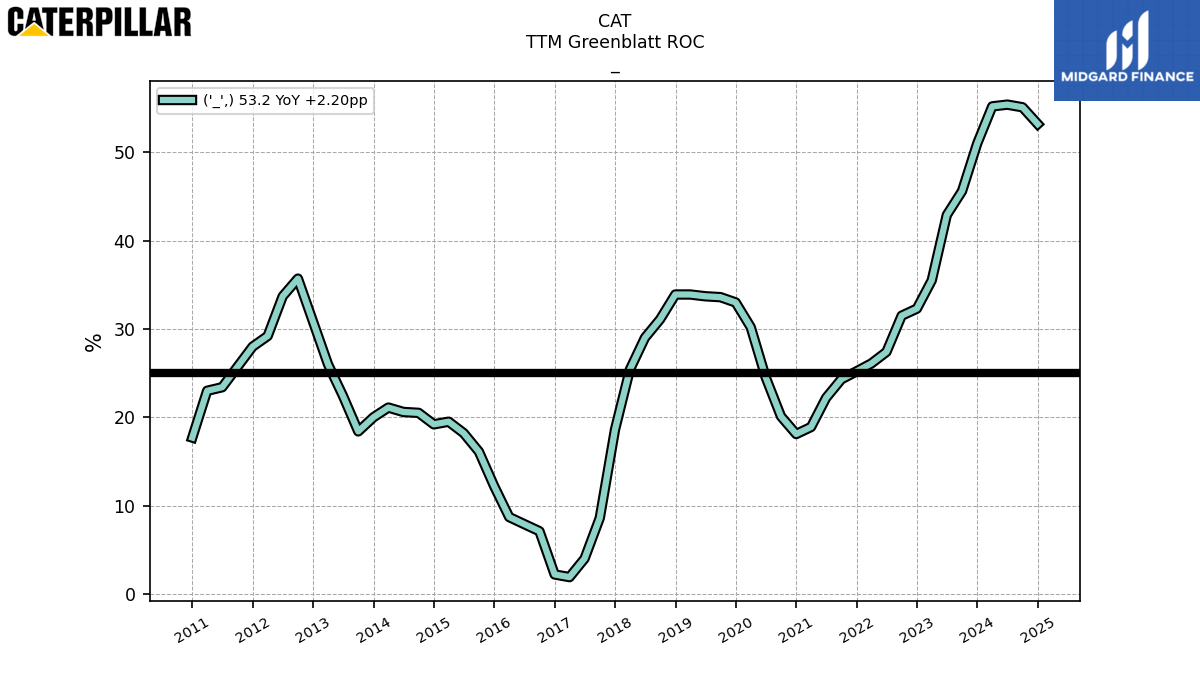 |
CAT | |||||
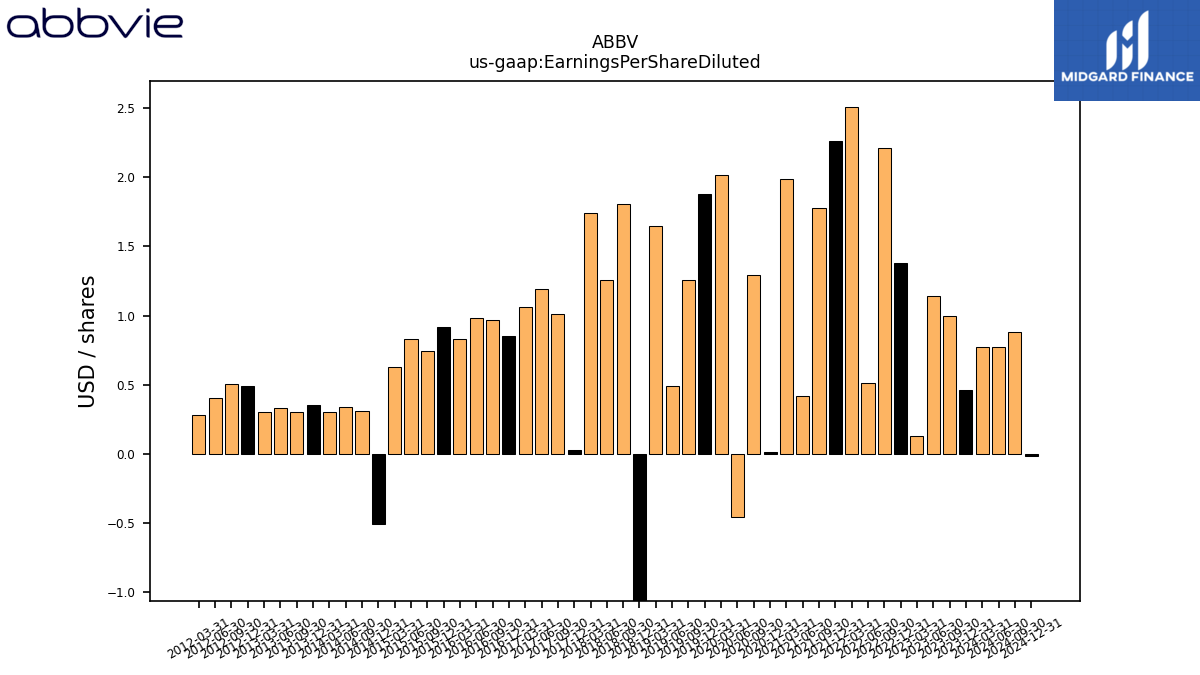
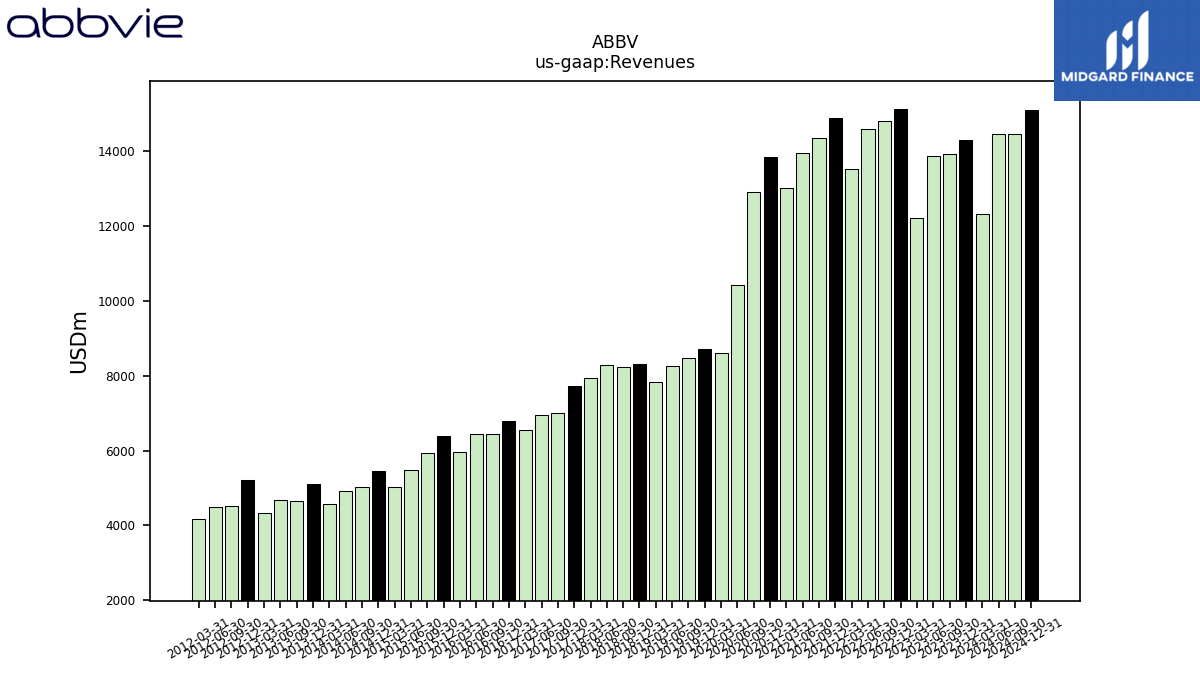
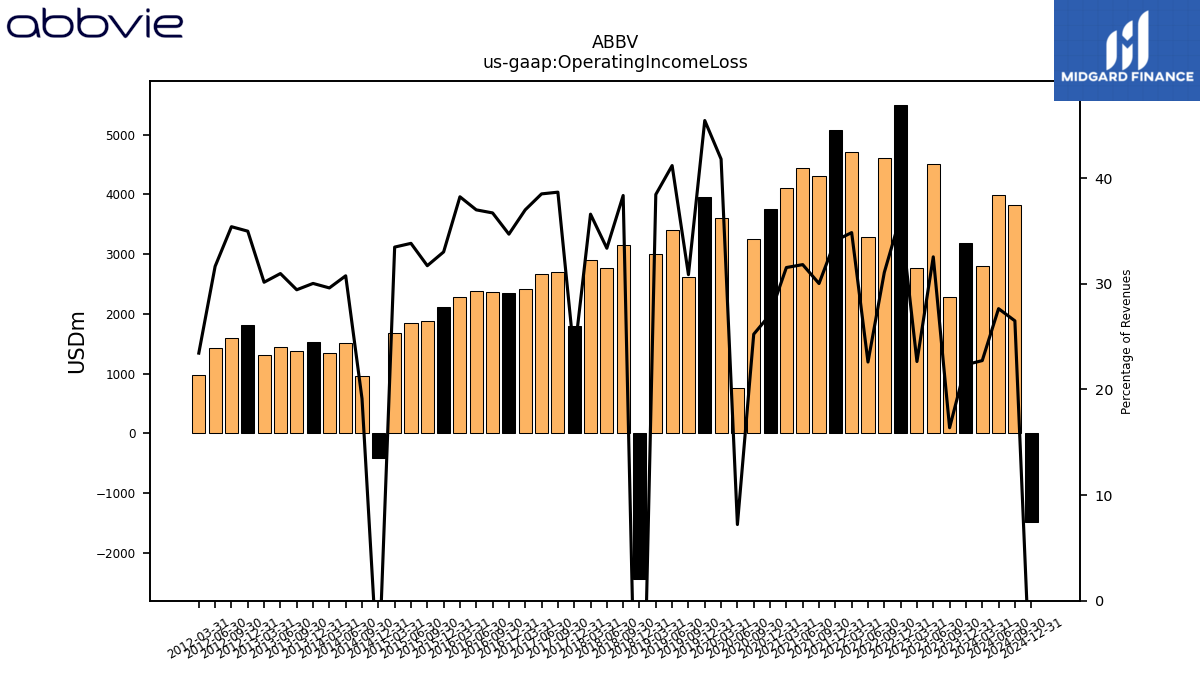
| $ABBV$ | 2025-02-14 | 2024-11-04 | 2025-04-25 | NA | NA | ABBV | 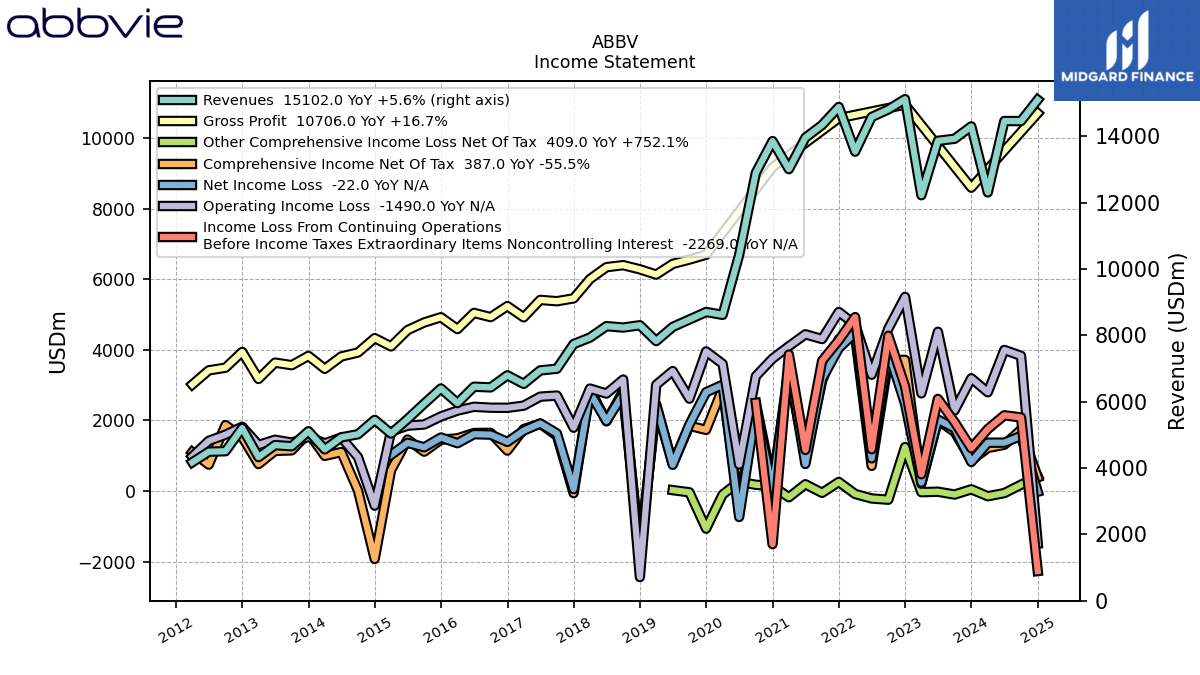 |
 |
 |
ABBV | 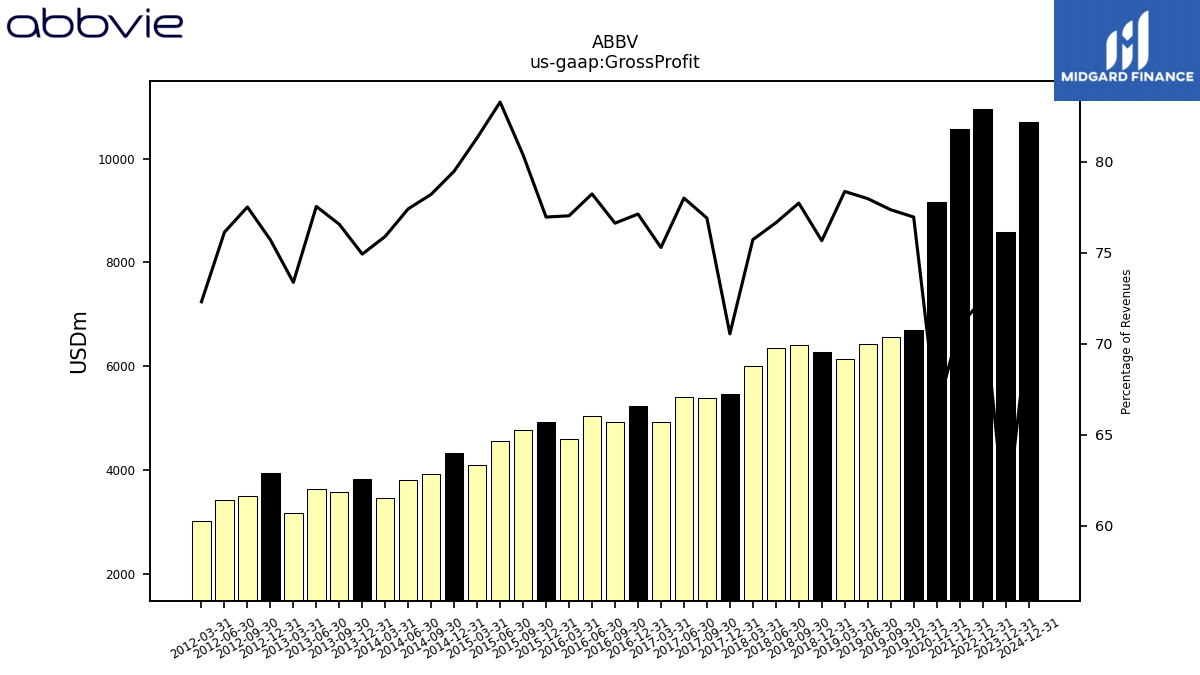 |
 |
 |
ABBV |  |
 |
 |
ABBV | 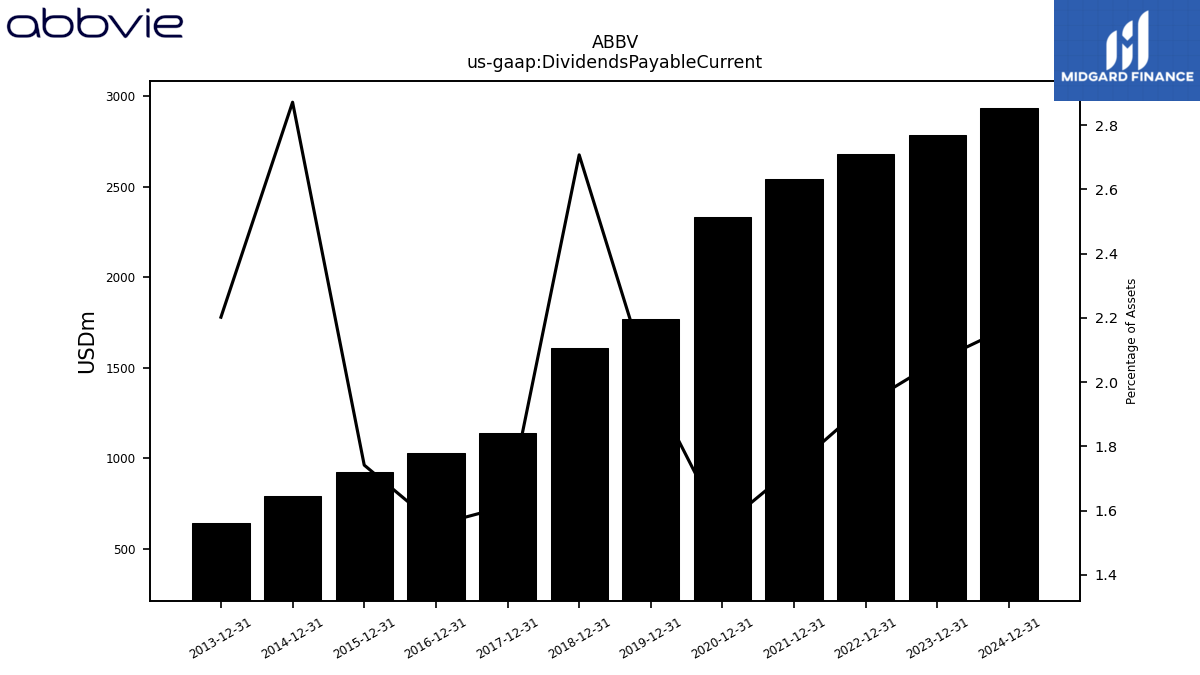 |
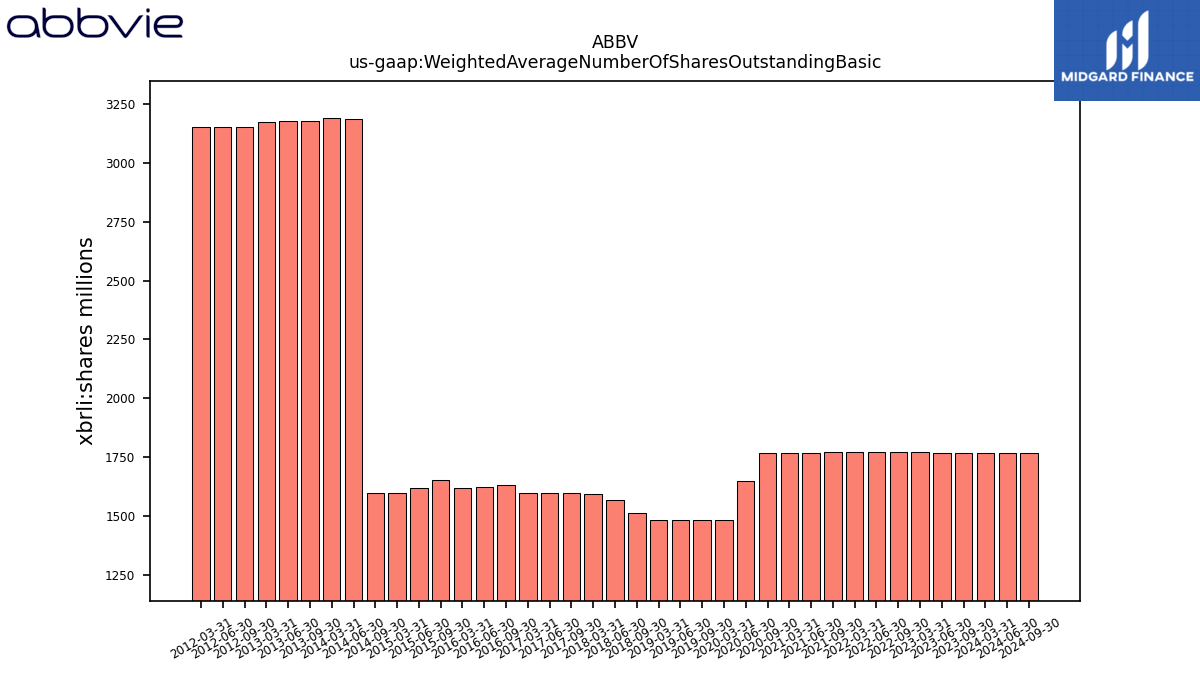 |
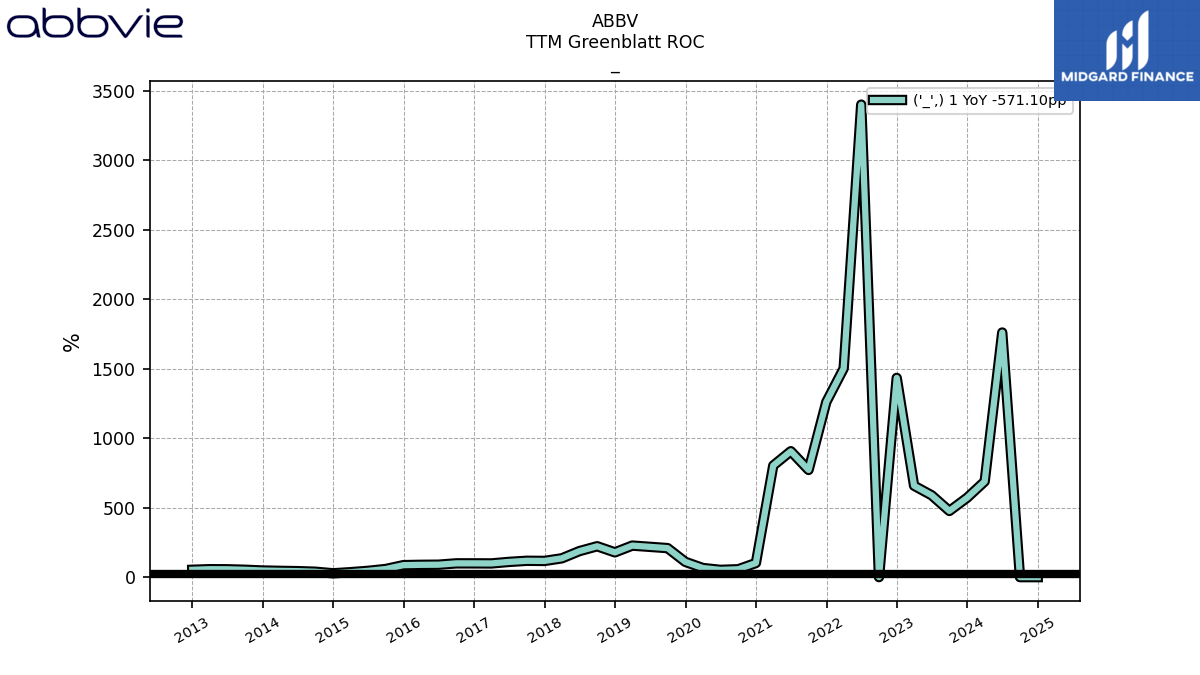 |
ABBV | |||
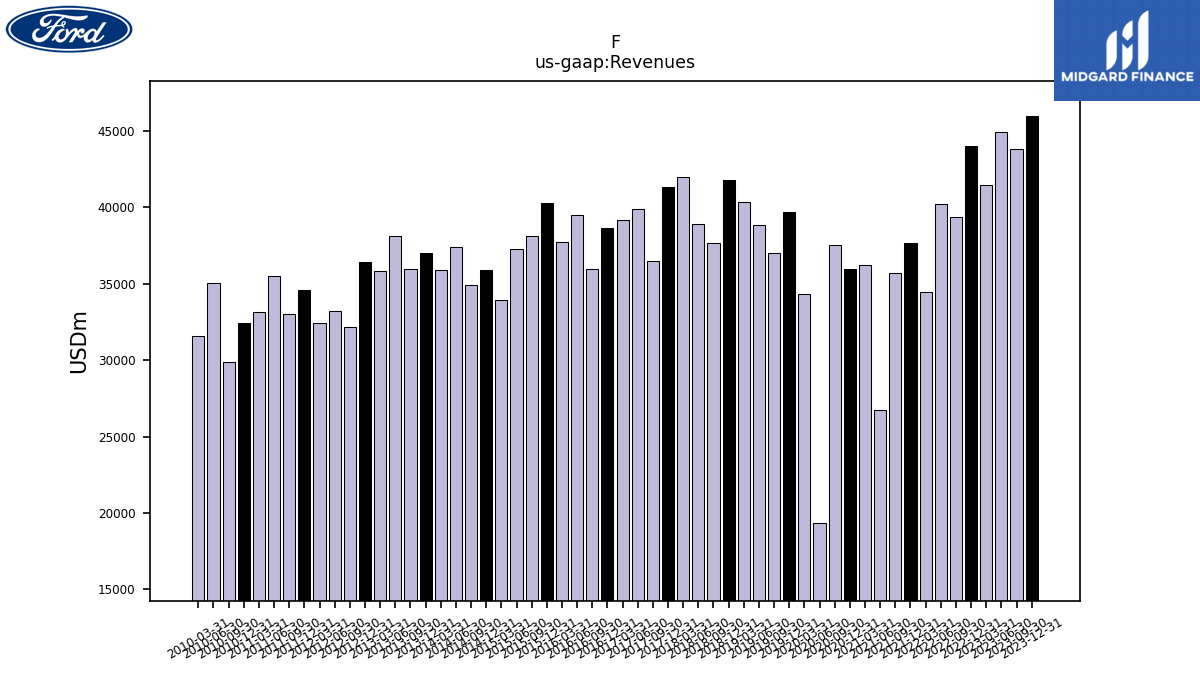
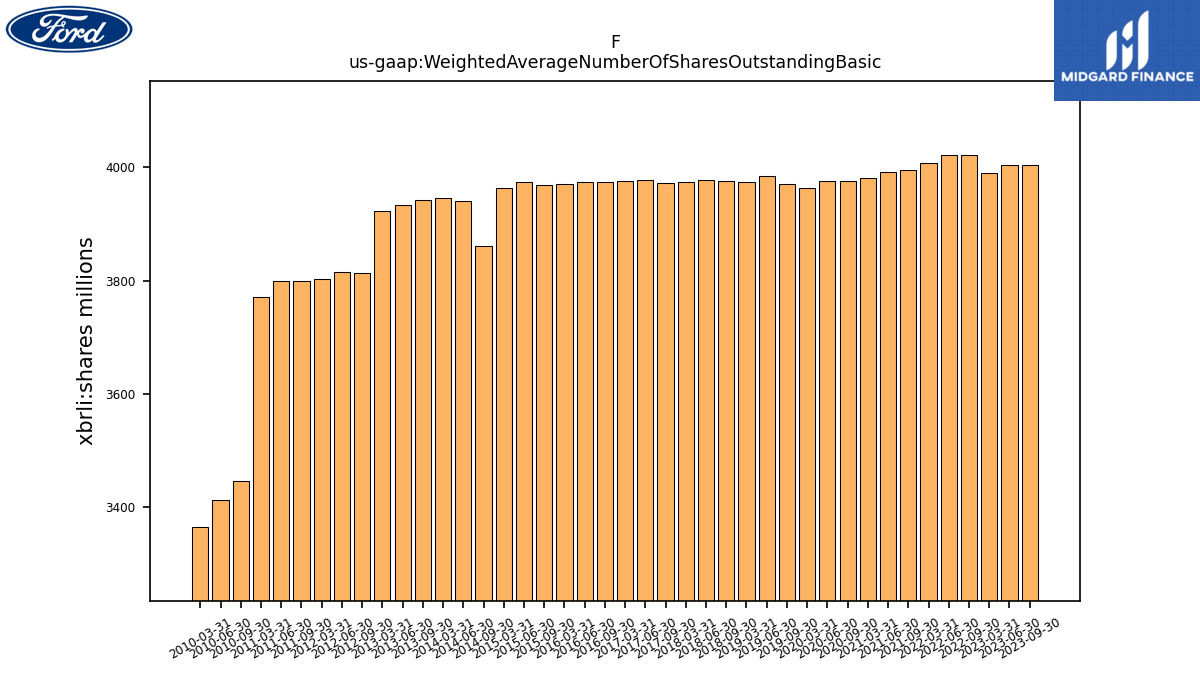
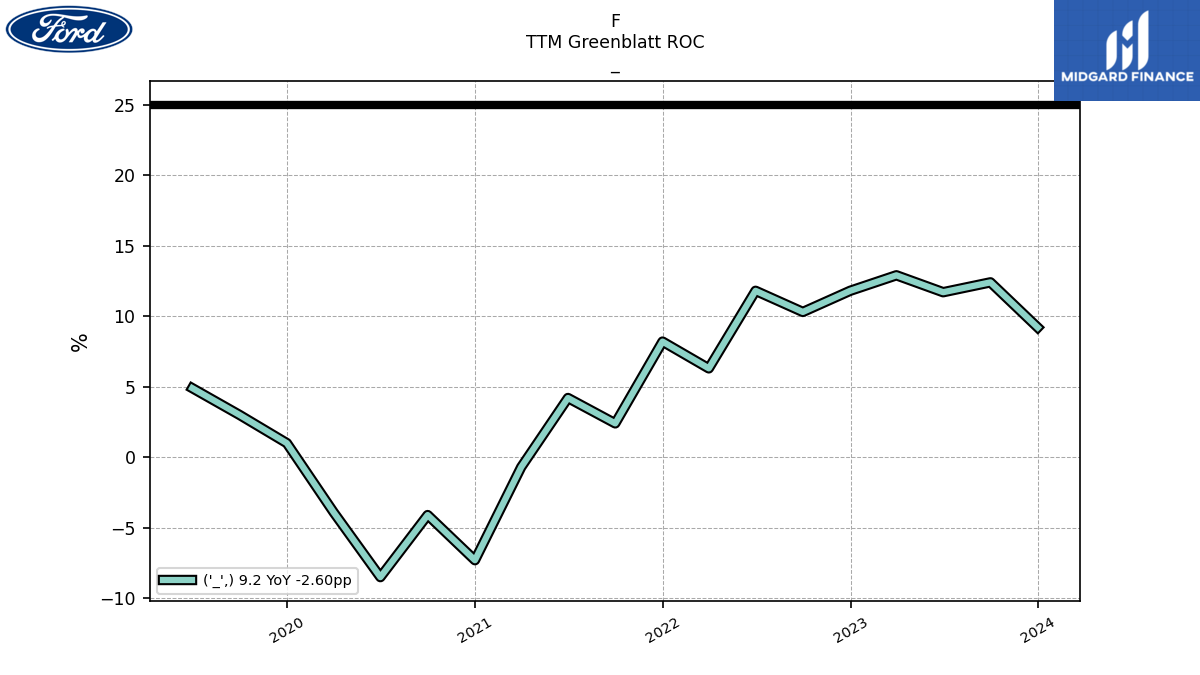
| $F$ | 2025-02-06 | 2024-10-29 | 2025-02-05 | NA | NA | F | 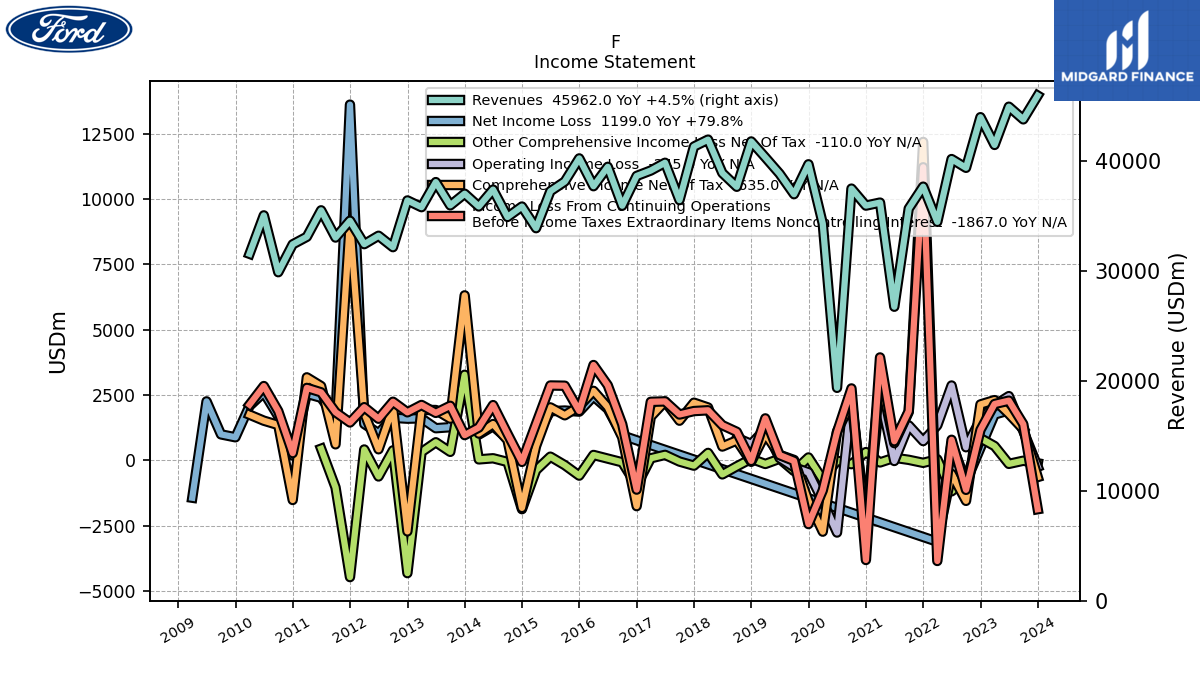 |
 |
 |
F | 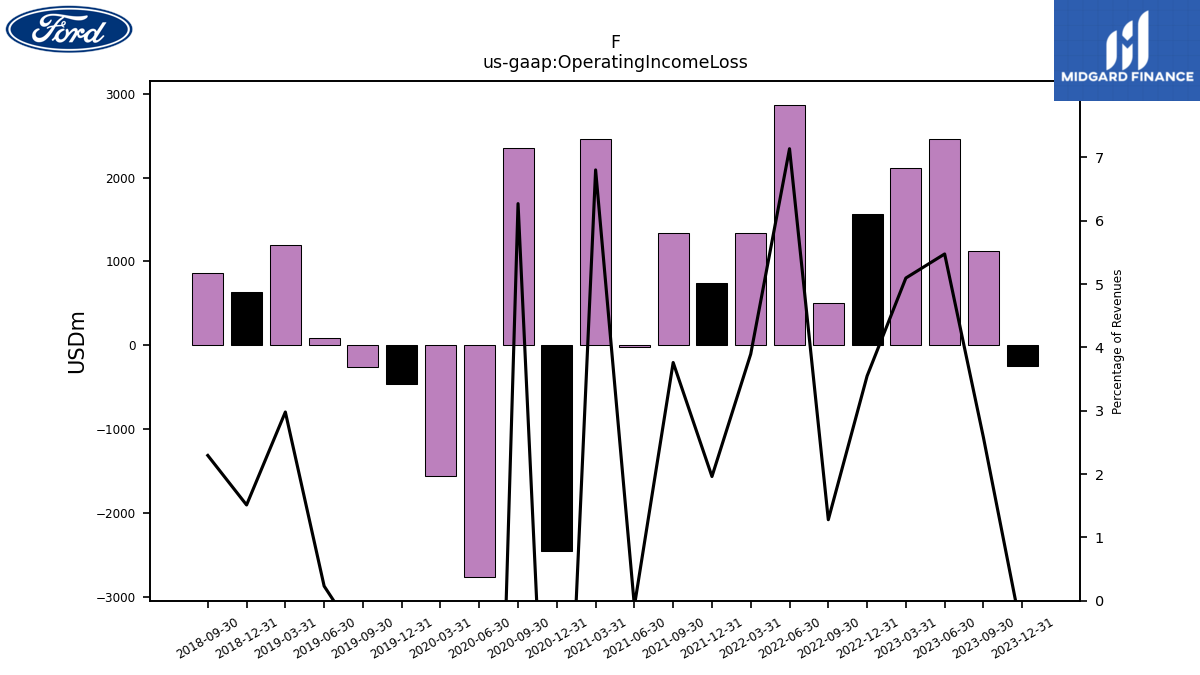 |
F |  |
 |
F | 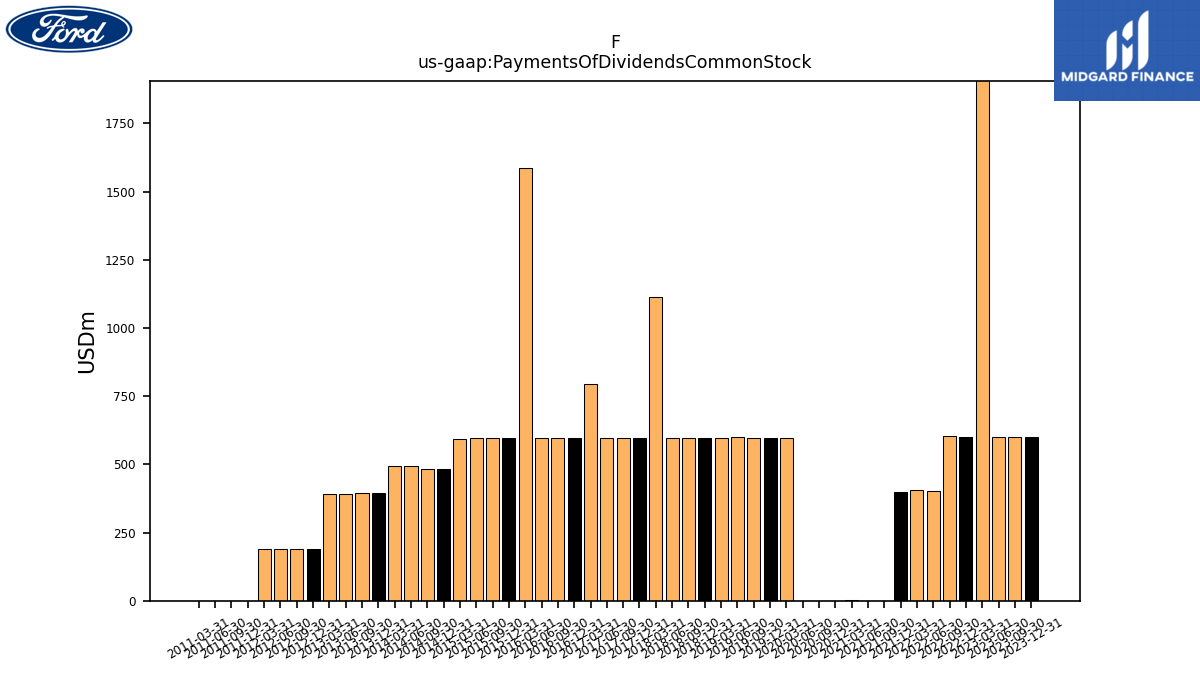 |
 |
 |
F | ||||||
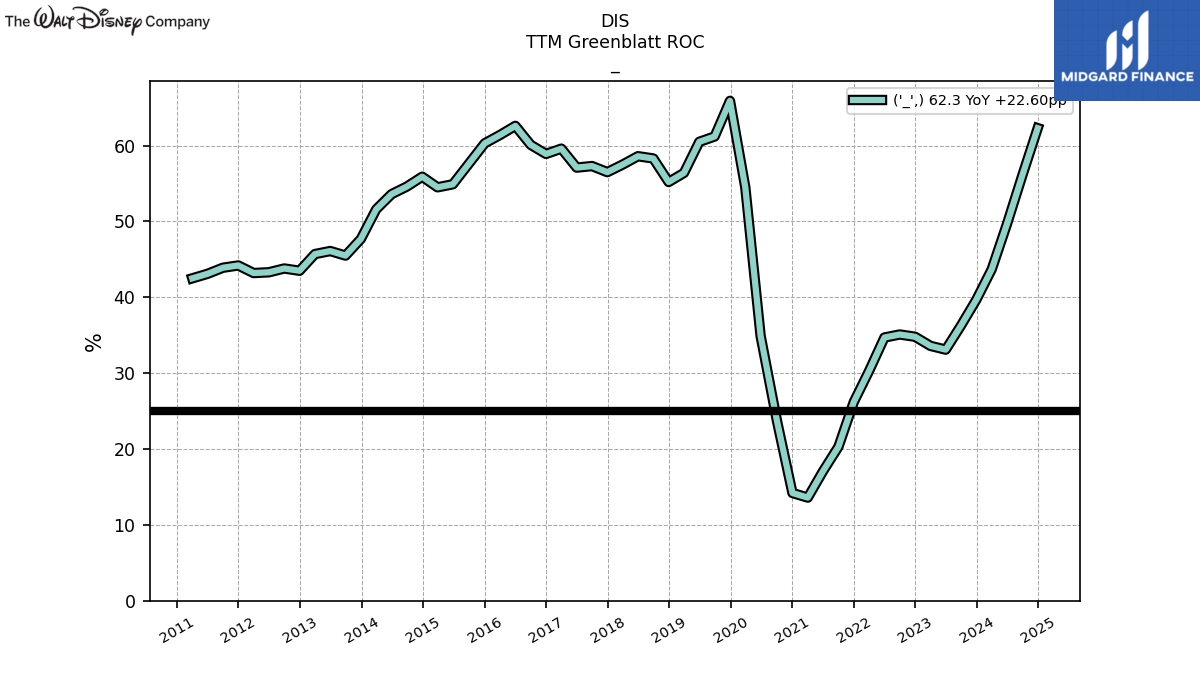
| $DIS$ | 2024-11-14 | 2025-02-05 | 2025-03-24 | NA | NA | DIS | 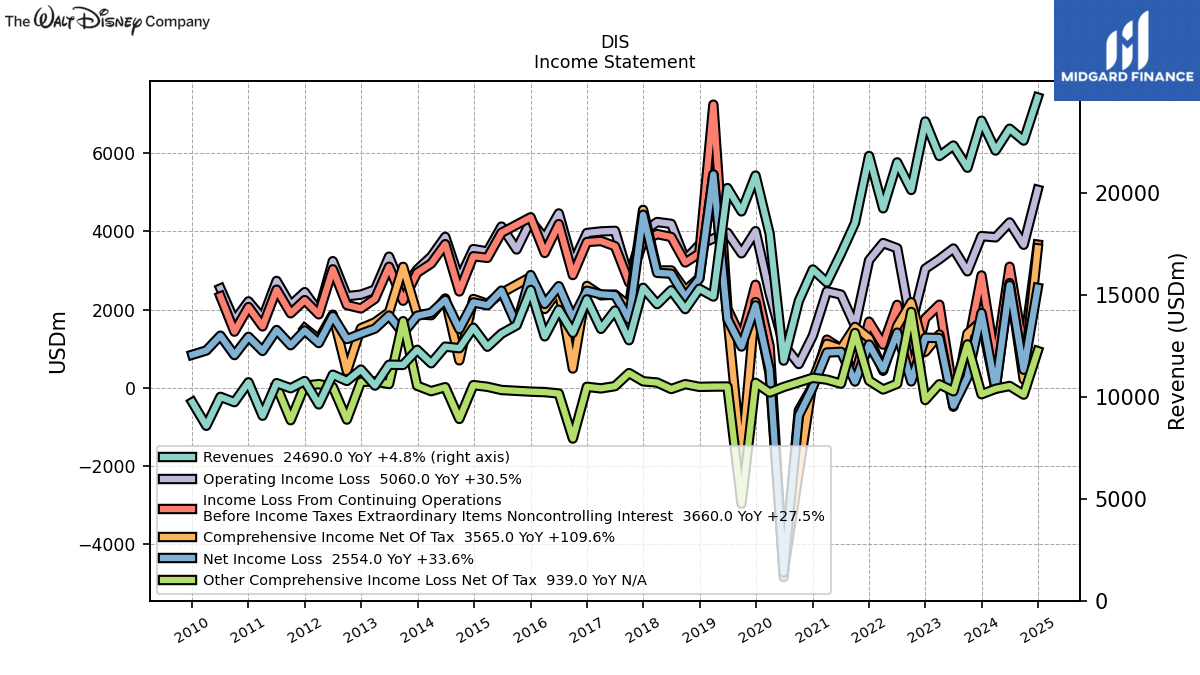 |
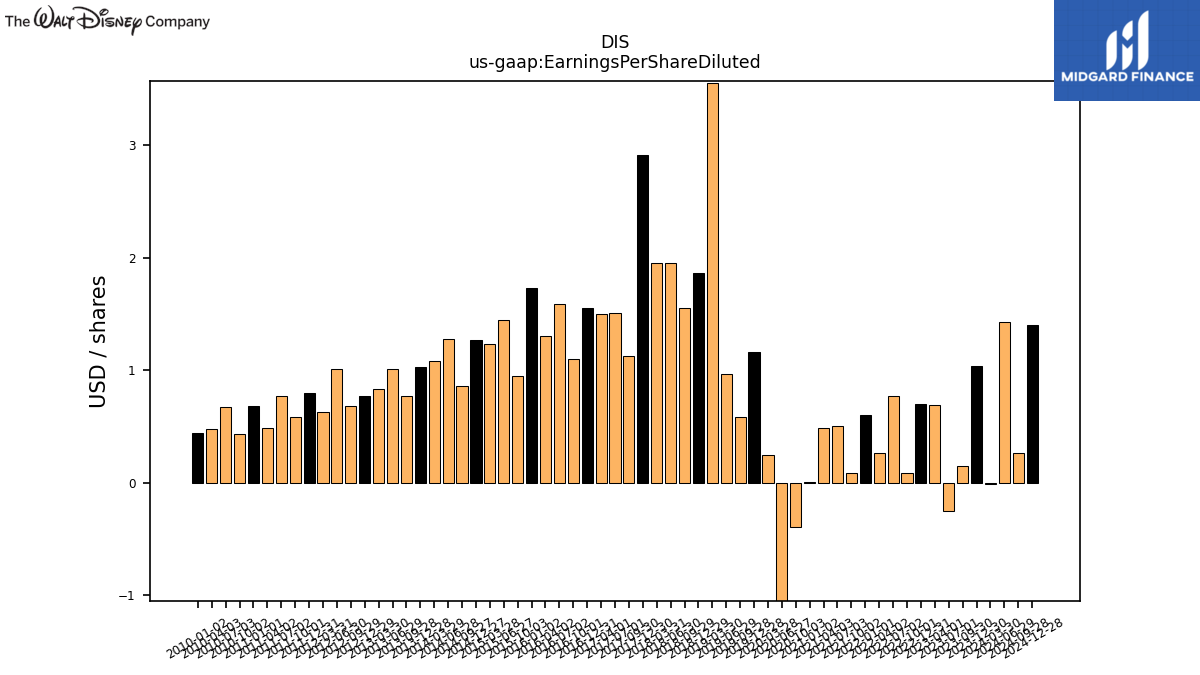 |
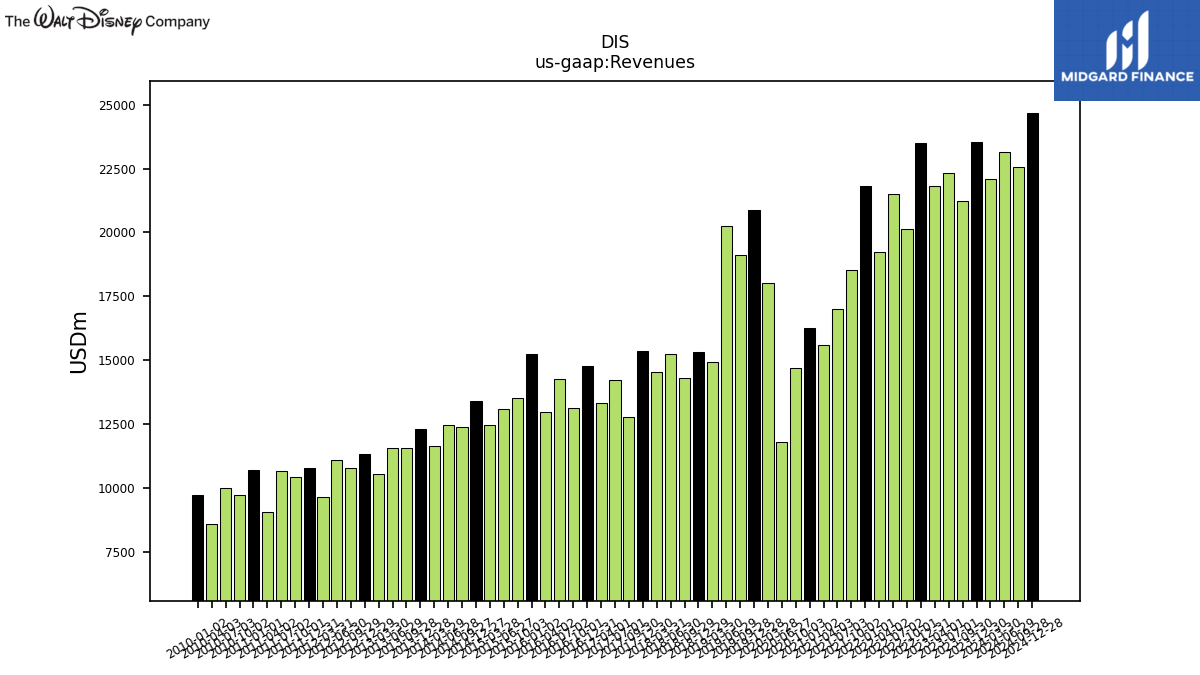 |
DIS |  |
 |
DIS |  |
 |
DIS |  |
 |
DIS | ||||||
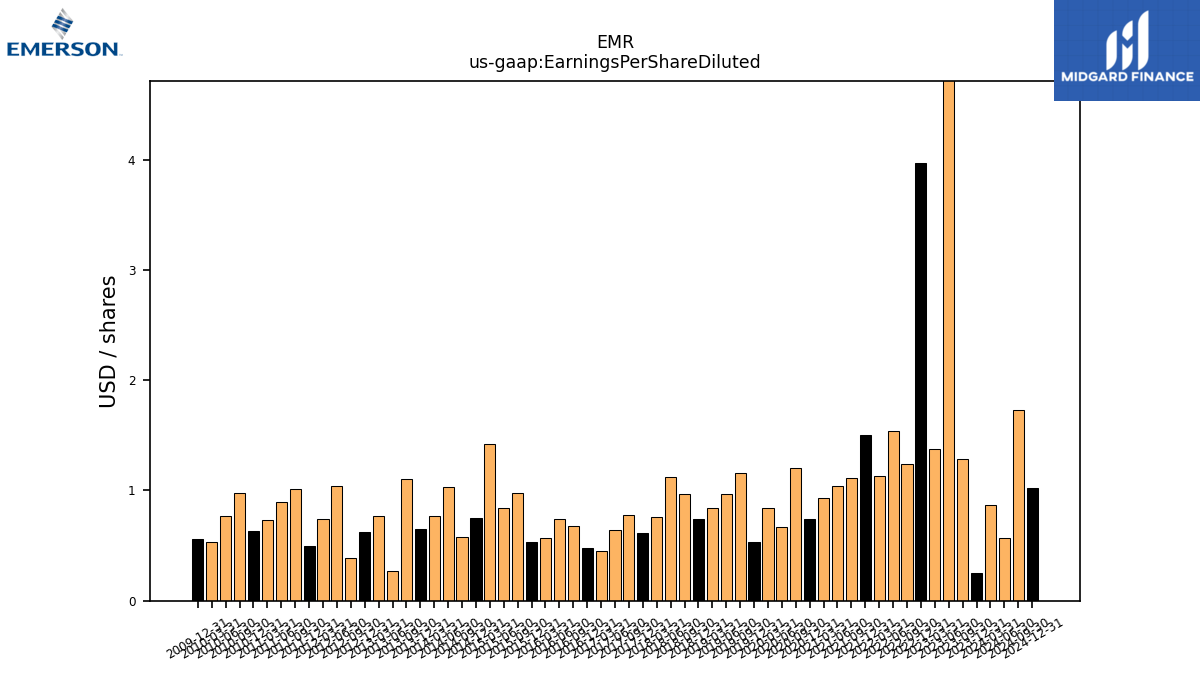
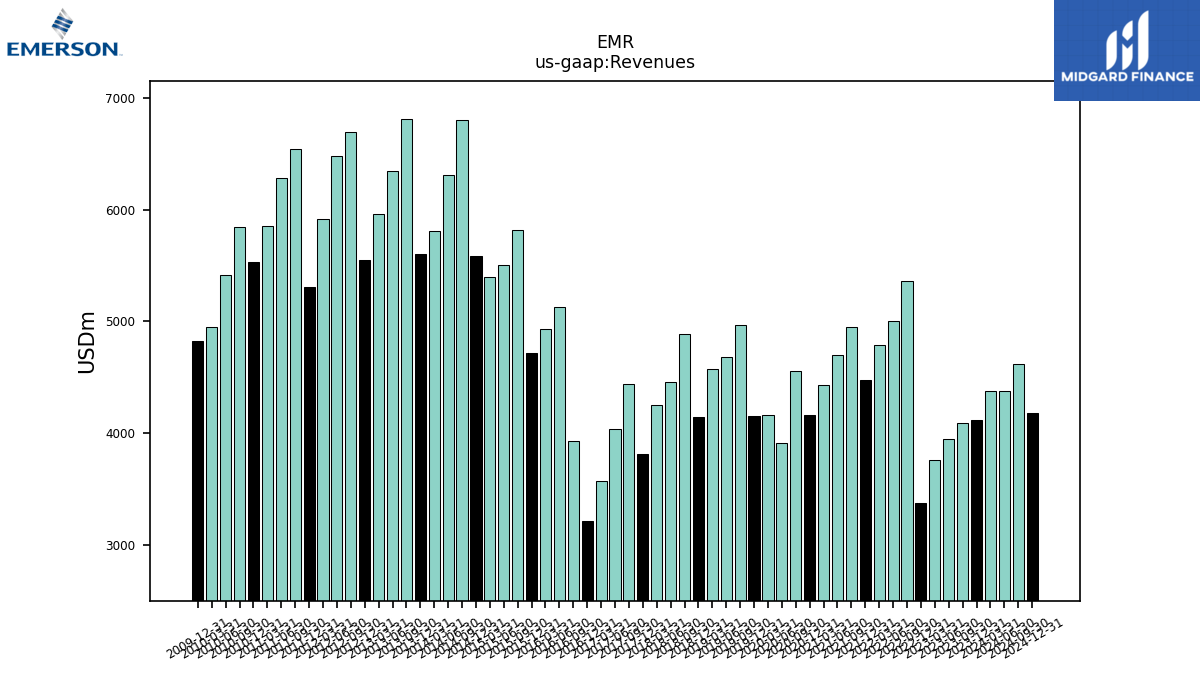
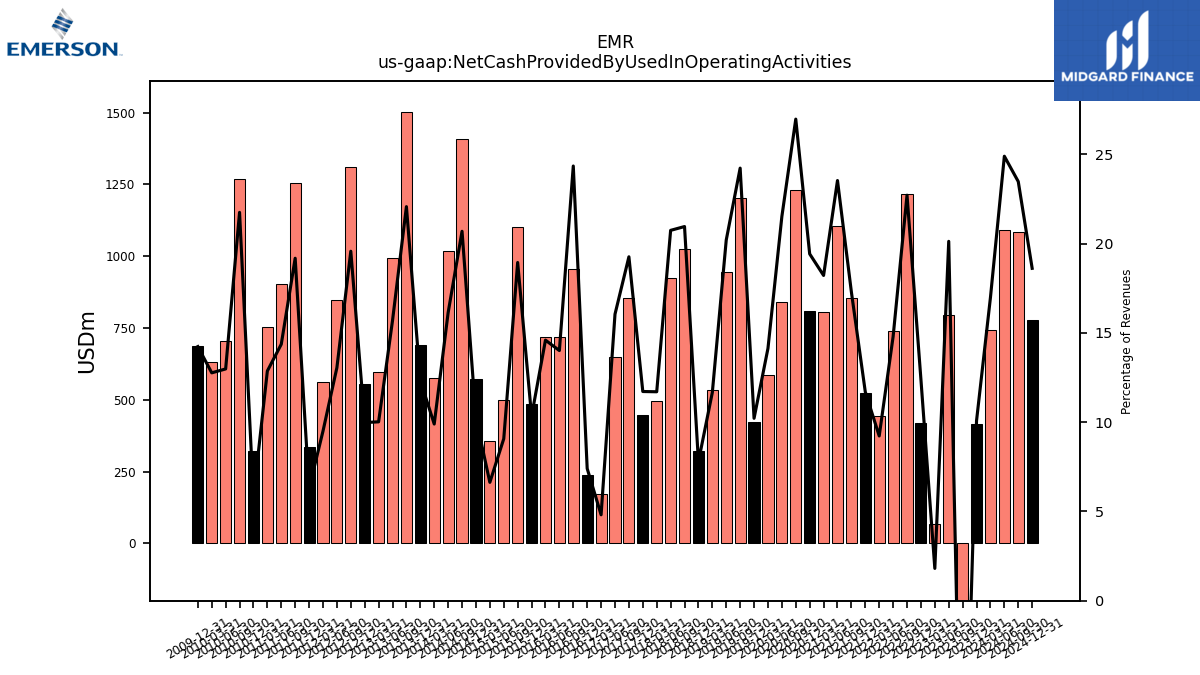
| $EMR$ | 2024-11-12 | 2025-02-05 | 2025-02-07 |  |
NA | NA | EMR | 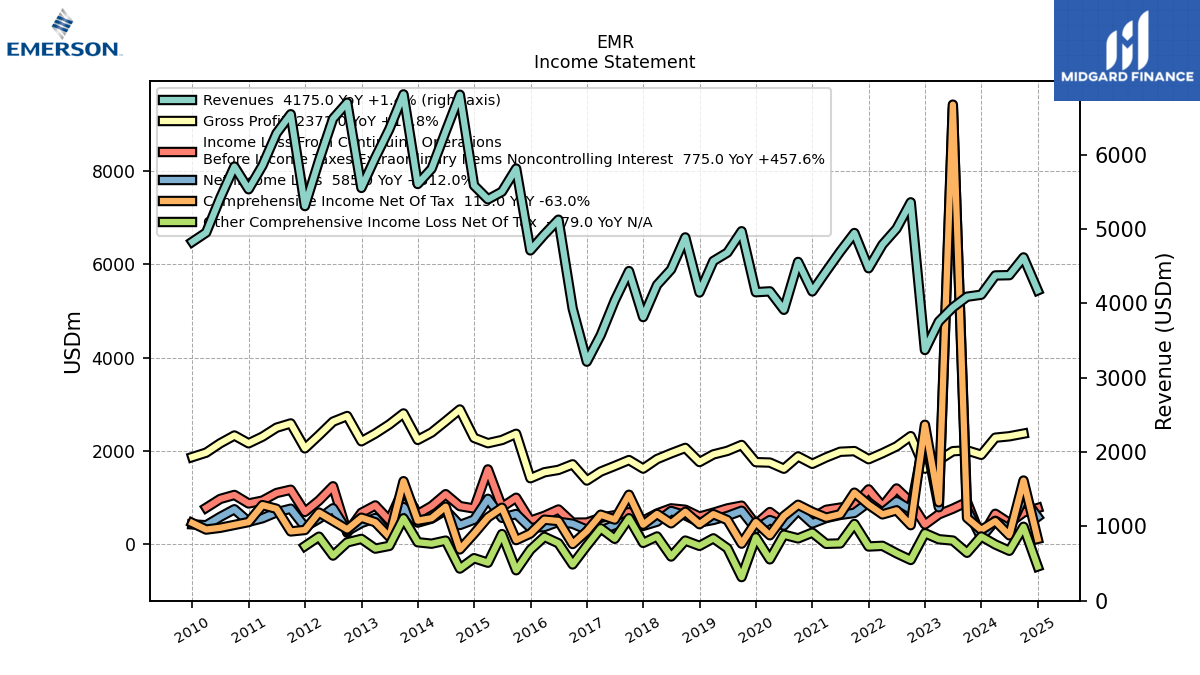 |
 |
 |
EMR | 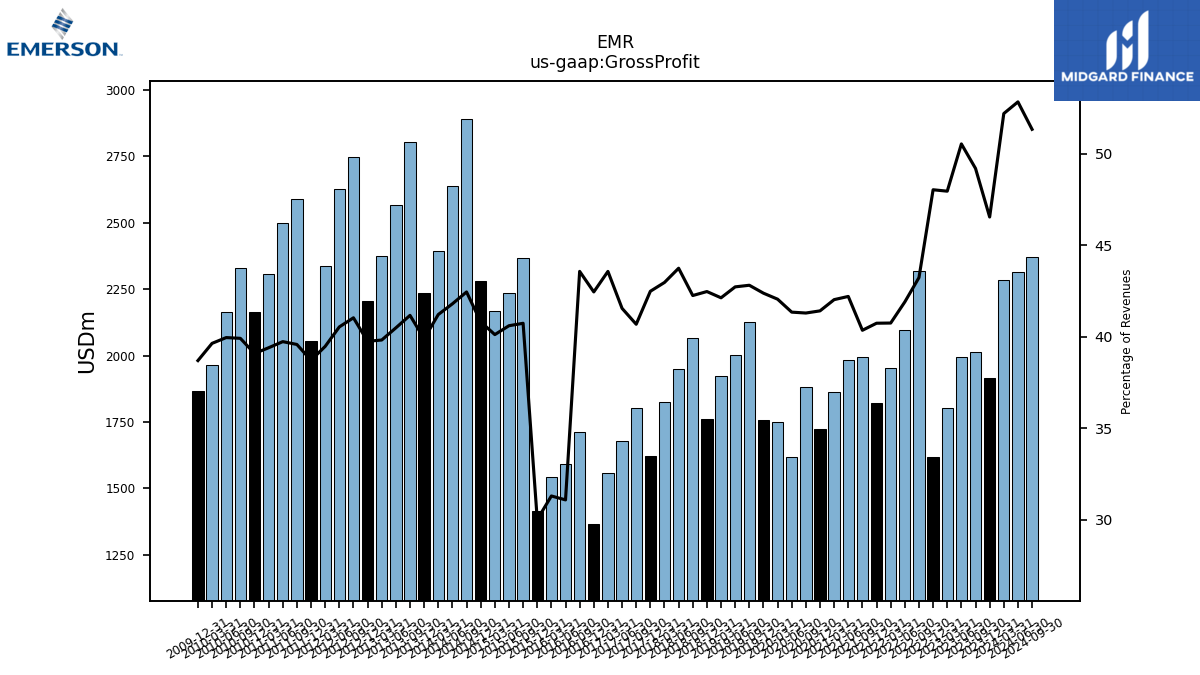 |
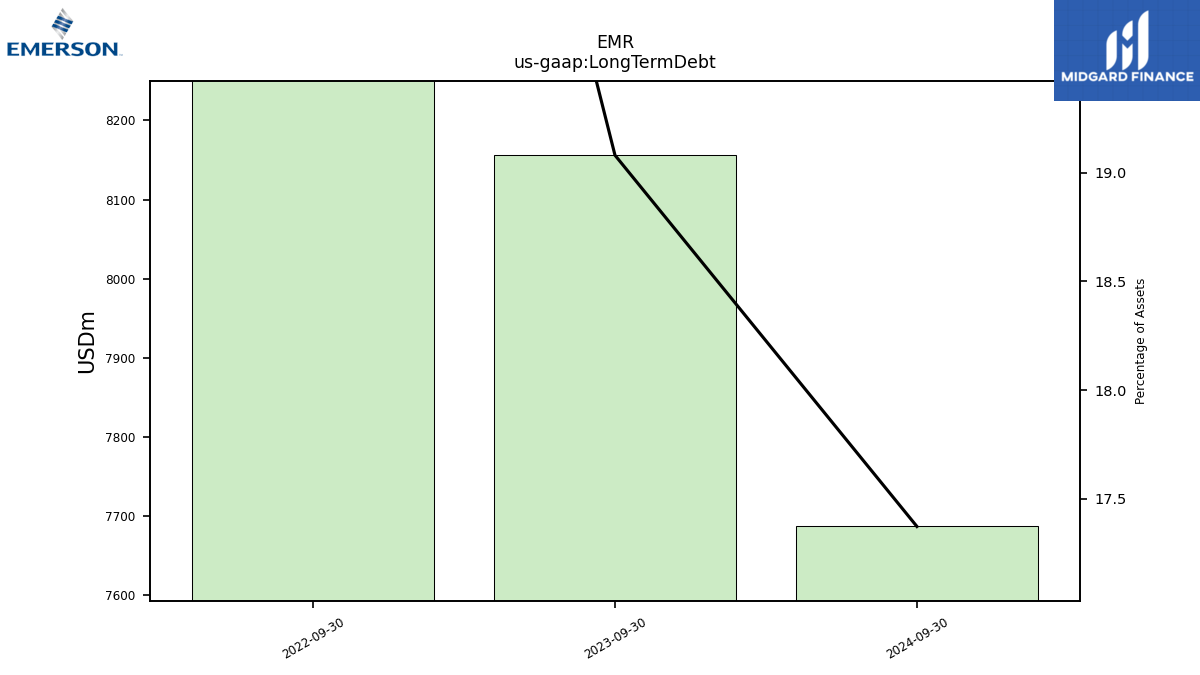 |
EMR | 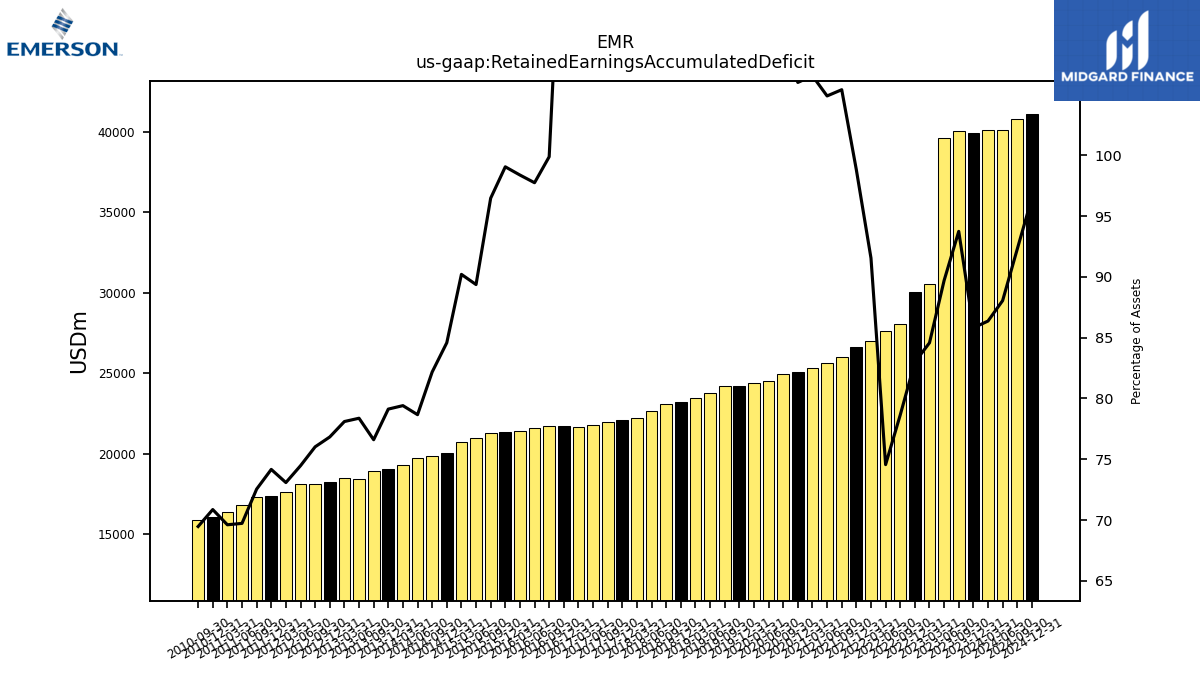 |
 |
EMR | 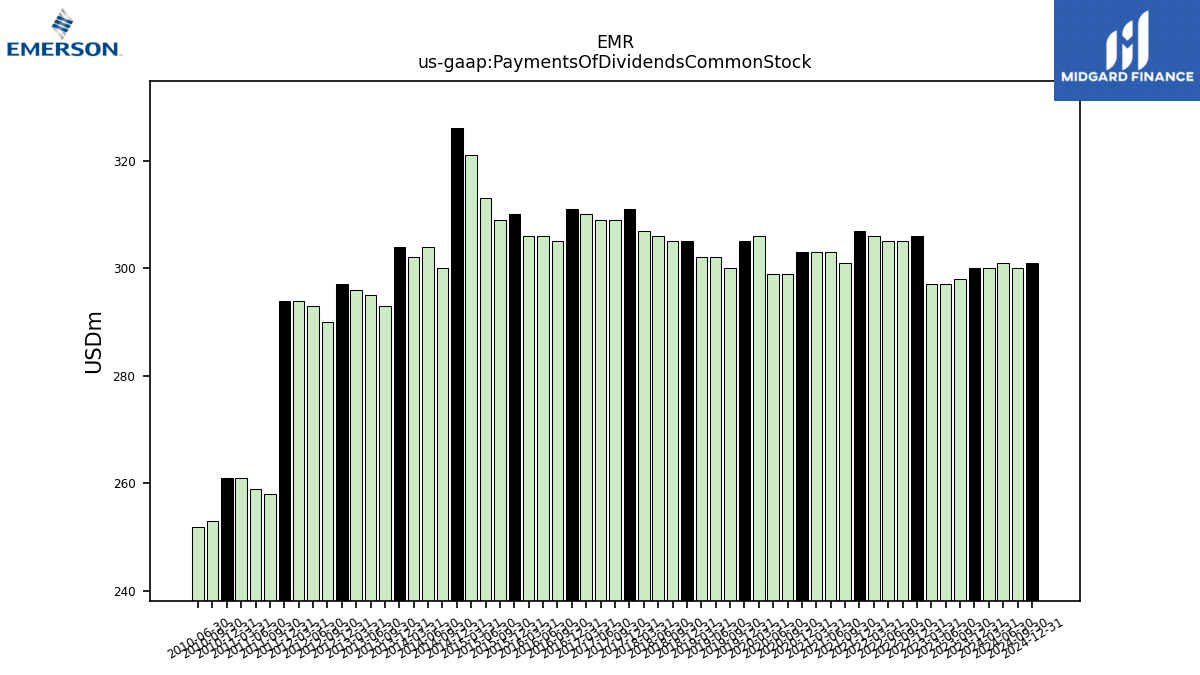 |
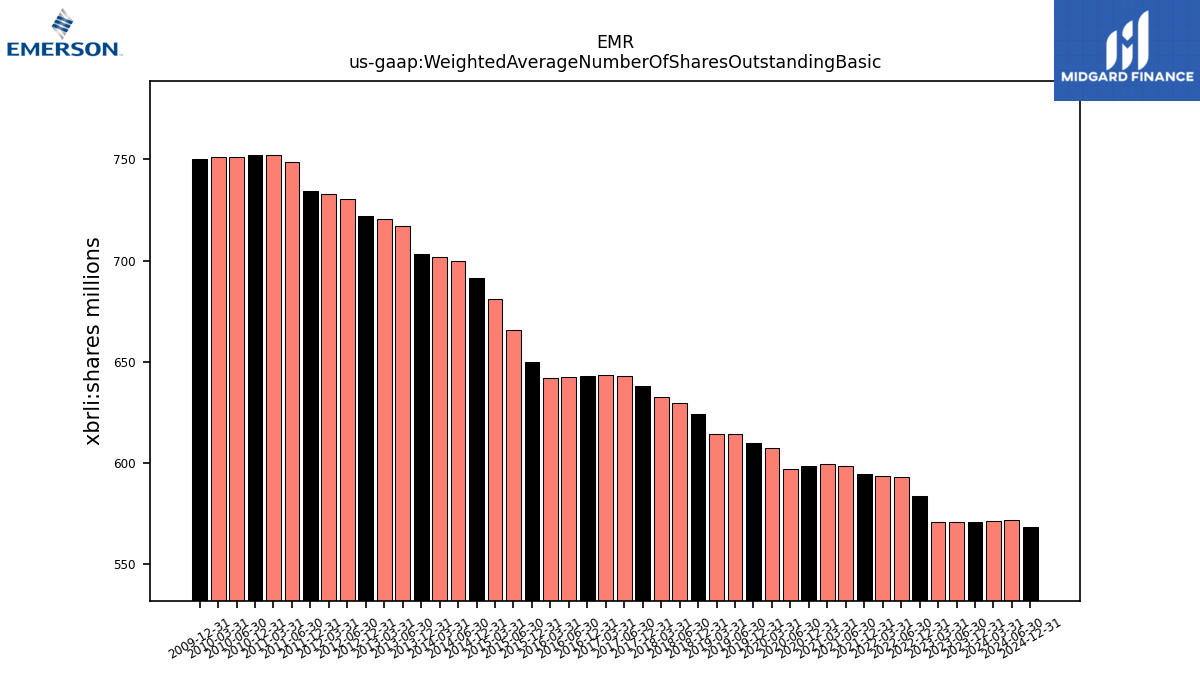 |
EMR | |||||
| Ticker | 10K | 10Q | 8K | Sector | Industry | Logo | Forward P/E | Revenue Growth | Ticker | Income | EPS | Revenues | Ticker | GrossProfit | OperatingIncome | LongTermDebt | Ticker | InterestExpense | RetainedEarnnings | CashFlowOperating | Ticker | Dividends | SharesOutstanding | TTMGreenblattROC | |
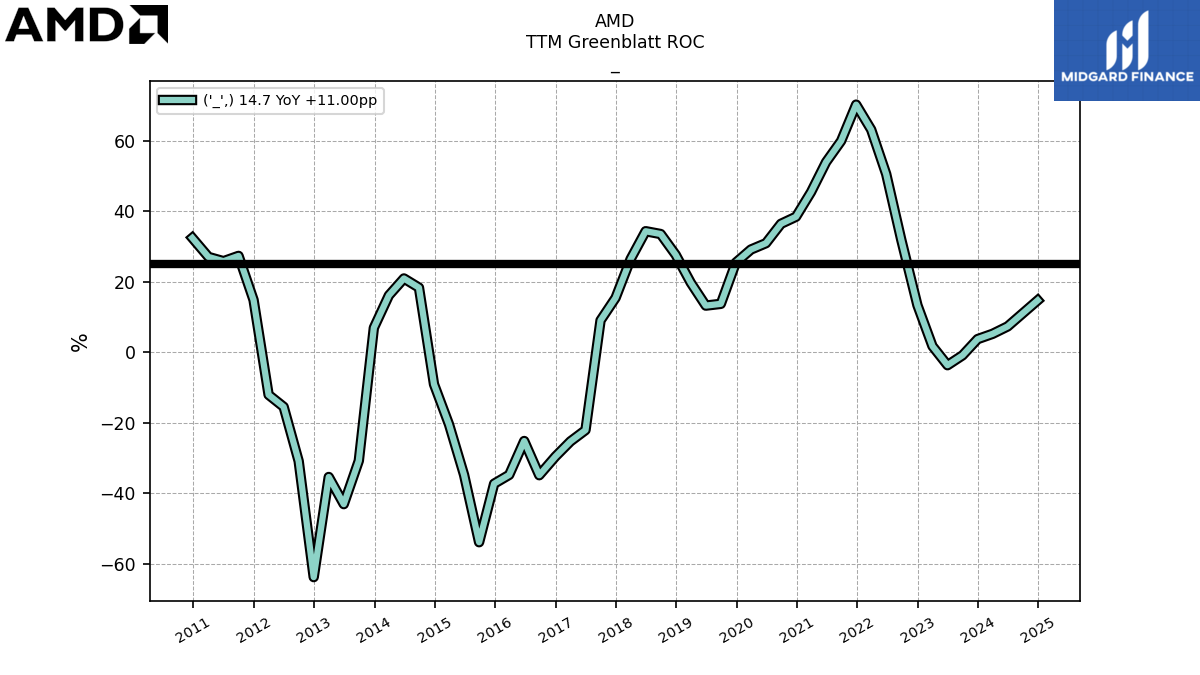
| $AMD$ | 2025-02-05 | 2024-10-30 | 2025-02-04 | NA | NA | AMD | 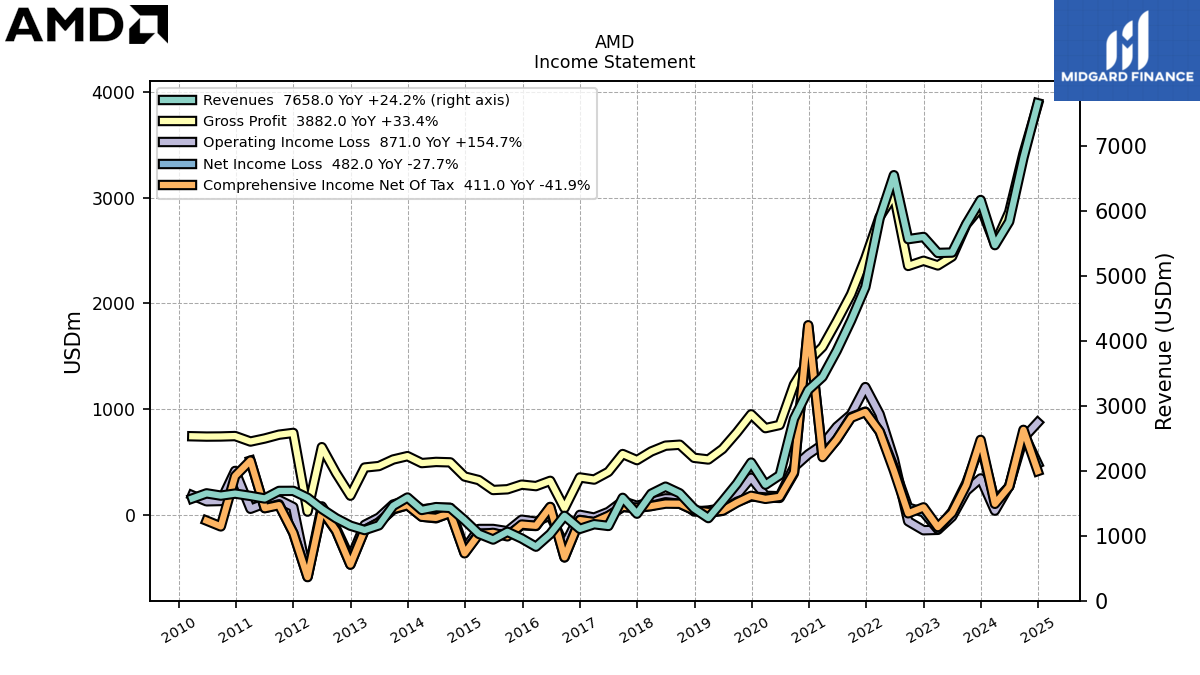 |
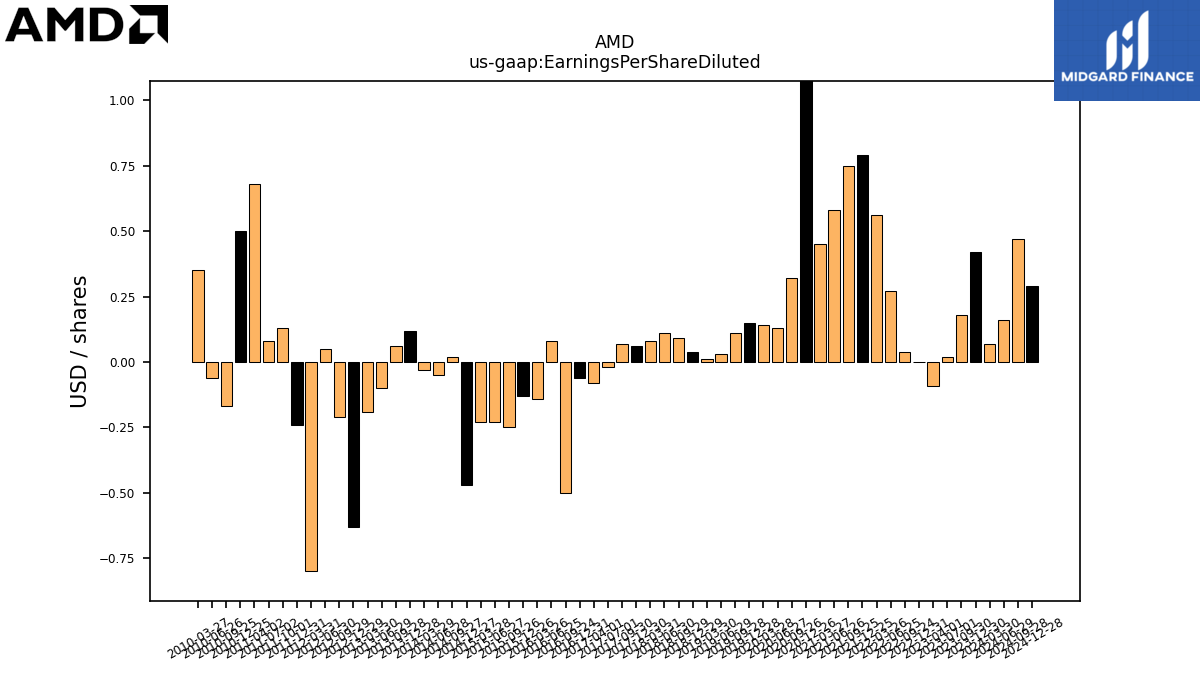 |
 |
AMD |  |
 |
 |
AMD |  |
 |
 |
AMD |  |
 |
AMD |